Consumer Research Secondary Research Assignment …€¦ · · 2014-04-16Consumer Research...
15
1 Consumer Research Secondary Research Assignment The following research report will be discussing the Canadian milk industry, focusing on five main areas: an industry overview, competitive environment, consumer behaviour, industry marketing tactics and environmental factors. The report will also include recommendations regarding key opportunities and success factors of the milk industry. Industry Overview Market Size Fluid Milk Sales (‘000 litres) – Dairy Year 1 Year Total Sales* 2012/2013 (AU-JL) 2,698,478 2011/2012 2,685,092 2010/2011 2,715,574 2009/2010 2,696,186 2008/2009 2,737,326 2007/2008 2,748,789 *Includes 3.25%, 2%, 1%, Skim, Buttermilk, Chocolate Milk & Eggnog. Does not include Newfoundland & Labrador. Total & Retail Milk Consumption (Litres/capita) 2 2007 2008 2009 2010 2011 Total Retail Total Retail Total Retail Total Retail Total Retail 83.1 53.6 81.6 54.4 81.1 55.4 77.7 56.2 78.4 56.7 Fluid milk sales in Canada has remained constant from 2007-2013, with only a slight decrease. Milk consumption (per capita) has steadily declined from 2007 – 2011. 1 ("Sales of fluid," 2013) 2 ("Consumption of dairy," 2013) Figure 1: Fluid Milk Sales in Canada from 2003-2012: compares sales of 3.25%, 2%, 1% & skim milk
Transcript of Consumer Research Secondary Research Assignment …€¦ · · 2014-04-16Consumer Research...

1
Consumer Research Secondary Research Assignment
The following research report will be discussing the Canadian milk industry, focusing on five main areas:
an industry overview, competitive environment, consumer behaviour, industry marketing tactics and
environmental factors. The report will also include recommendations regarding key opportunities and
success factors of the milk industry.
Industry Overview
Market Size
Fluid Milk Sales (‘000 litres) – Dairy Year1
Year Total Sales*
2012/2013 (AU-JL) 2,698,478
2011/2012 2,685,092
2010/2011 2,715,574
2009/2010 2,696,186
2008/2009 2,737,326
2007/2008 2,748,789 *Includes 3.25%, 2%, 1%, Skim, Buttermilk, Chocolate Milk & Eggnog. Does not include Newfoundland & Labrador.
Total & Retail Milk Consumption (Litres/capita)2
2007 2008 2009 2010 2011
Total Retail Total Retail Total Retail Total Retail Total Retail
83.1 53.6 81.6 54.4 81.1 55.4 77.7 56.2 78.4 56.7
Fluid milk sales in Canada has remained constant from 2007-2013, with only a slight decrease. Milk consumption (per capita) has steadily declined from 2007 – 2011.
1 ("Sales of fluid," 2013) 2 ("Consumption of dairy," 2013)
Figure 1: Fluid Milk Sales in Canada from 2003-2012: compares sales of 3.25%, 2%, 1% & skim milk

2
BC 8.4%
AB 8.4%
SK 2.9%
MB 4.1%
ON 32.5%
QC 37.9%
NB 1.7%
NS 2.2%
PE 1.3% NL
0.6%
Markets
There are two markets for milk in Canada. The fluid market (table milk and fresh cream) accounts for 38% of milk production or 117.95 million kg of butterfat. The industrial market (manufactured products such as butter, cheese, yogurt and ice cream) accounts for the remaining 62% of production or 186.87 million kg of butterfat.3
Market Share Quota The Market Sharing Quota (MSQ) is the national milk production target for industrial milk in Canada. The target is constantly monitored and is adjusted when necessary to reflect changes in demand, as measured in terms of butterfat, during the course of the year.4
MSQ growth has also been slow; current levels of MSQ are about 180 million kg of butterfat, up from about 161 million kg in the late 1990’s.5
Distribution of the Industrial & Fluid Milk Quota by Province6
Price Trends
Consumer prices for fresh milk in Canada have shown an overall increase from 2007 – 2012. Industrial prices for fluid milk products have shown an overall increase from 2007-2011.7 Sales Trends - See Figure 1 in ‘Market Size’
3 ("The industry: quick facts," 2012) 4 ("National market sharing," 2013) 5 ("National market sharing," 2013) 6 ("National market sharing," 2013) 7 ("Prices and expenditures," 2013)

3
Consumer Price Indexes For Canada8
2008 2009 2010 2011 2012
Product Index % ± Index % ± Index % ± Index % ± Index % ± Fresh Milk 116.9 4.4% 123.0 5.2% 127.8 3.9% 129.1 1.0% 138.4 2.5%
Average Retail Prices, $9
Unit Aug 2009 Aug 2010 Aug 2011 Aug 2012 Aug 2013
Homo Milk 1 L 2.18 2.25 2.33 2.40 2.44
Skimmed Milk 1 L 2.11 2.18 2.27 2.30 2.28
Industrial Product Price Indexes for Canada10
2007 2008 2009 2010 2011
Product Index % ± Index % ± Index % ± Index % ± Index % ±
Fluid Milk 111.7 2.5% 115.0 2.9% 117.2 1.9% 118.7 1.3% 120.8 1.8%
Whole Fluid 106.9 1.6% 109.2 2.2% 110.7 1.4% 111.4 0.6% 113.4 1.8%
Skim Fluid 116.5 3.9% 122.0 4.7% 125.6 3.0% 128.2 2.0% 131.3 2.4%
Product Trends In 2012, retail sales of drinking milk products are set to record 4% current value growth, reaching
C$4.0 billion; up from C$3.8 billion in 2011. Although per capita consumption of milk in Canada remains generally in decline, retail sales of drinking milk products saw gradual recovery over the last few years. For example, the ongoing media buzz surrounding the nutritional benefits of chocolate milk continued to play a role in consumer demand for flavoured milk. In addition, ongoing product development, including goat milk as well as soy and rice/nut-based milk, placed upwards pressure on value sales during the review period.11
Flavored milk, the second most widely consumed liquid dairy product after white milk, is forecast to increase globally by a compound annual rate of 4.1% between 2012 and 2015, rising from 17.0 billion litres to 19.2 billion litres.12
Overall demand for milk is expected to slow down over the next five years, as per capita consumption of milk continues to fall across the country. Canada’s ageing population, coupled with the growing immigrant population from regionals like Asia Pacific, which is largely not accustomed to drinking cow’s milk, is likely to reduce the overall level of per capita consumption of cow’s milk. Categories in which more product development and marketing are anticipated are those which still account for a small share of sales, such as flavoured milk drinks and soy or rice/nut/grain-based milk, and thus are considered niche categories.13
8 ("Prices and expenditures," 2013) 9 ("Food and other," 2013) 10 ("Prices and expenditures," 2013) 11 (Euromonitor International, 2012) 12 ("Consumer trends: flavored milk," 2013) 13 ("Drinking milk products," 2012)

4
Distribution Channels Distribution to consumers occurs through a network of just over 30,000 retail food stores and more than 114,000 food service industry outlets. These food service industry outlets include the activities of licensed and unlicensed restaurants, accommodation, leisure industry and institutional food service operations, as well as distribution channels provided by vending, department store, and other retail food service industry outlets.14 Employees
Number of Employees in the Canadian Dairy Product Manufacturing Sector15
Year Total*
2012 24,487
2011 23,966
2010 23.490
2009 23,615
*BC, ON, QC, NS
Competitive Environment
Nature of Competition
The Canadian Dairy industry is regulated which makes it difficult for non-domestic companies to enter
the market. There are a select number of brands that dominate the milk production market; the market
is in an oligopoly. Many milk distributing brands share the same parent company. Parmalat Canada owns
Beatrice, Lactantia and milk products under the Parmalat name16. Neilson, Dairyland and Nutrilait are
owned by Saputo Inc.17 Sealtest, Quebon and Natrel are owned by Agropur18.
Comparison of Current Brands
Parent Company Sub Brands
Parmalat Canada Beatrice, Lactantia, Parmalat
Saputo Inc. Neilson, Dairyland, Nutrilait
Agropur Cooperative Sealtest, Quebon, Natrel
14 ("The Canadian dairy," 2005) 15 ("Employment of dairy," 2013) 16 (Parmalat Canada, 2012) 17 (Saputo Inc., 2013) 18 (Agropur, 2013)

5
Canadian Males and Females Ages 12+
Milk Brands Total Market Penetration19 (%)
Beatrice 21.5
Dairyland 25.3
Lactantia 13.4
Natrel 11.6
Neilson 18.8
Nutrilait 1.6
Parmalat 6.2
Quebon 11.9
Sealtest 12.1
Other 17.4
Not Stated 61.6
Market Penetration for Brands in the Milk Sector20
Full Analysis of key competitors:
In the Canadian dairy market, there are currently three main competitors; Parmalat Canada, Saputo Inc.
and Agropur.
Parmalat21
Parmalat’s 2013 value market share for milk is 17.2%, a decrease from the 19.1% in 2012. Remained at a third place ranking in the milk market. In the first half of 2013, the advertising and promotions costs were $60.45 million, compared to the
19 (Print Measurement Bureau, 2013) 20 (Print Measurement Bureau, 2013) 21 (Parmalat Canada, 2013, p.17)
6
$54.08 million costs of the first half of 2012.
Brands Primary Demographics (%)22 Notes
Beatrice Empty Nesters: 11% likely to purchase
Adult with children living at home: 6% more likely to purchase
Mission statement stresses its use of Canadian farm milk
Emphasizes wholesome appeal to Canadian families
Strategy is to present itself as a brand that is custom-made to fit the needs of families
Lactantia Adults living at home: 13% more likely to purchase
Adult sharing accommodation: 7% more likely to purchase
Empty Nesters: 6% more likely to purchase
Households without children more likely to purchase brand
Targets its consumers by portraying itself as an experienced and traditional brand
Parmalat Adult with children living at home: 22% more likely to purchase
Saputo, Inc. 23
Focus on building brand awareness through the use of social media, in-store promotions and public relations campaigns.
Saputo, Inc. is the largest dairy processor in Canada. The lead in drinking milk sales, with a 41% value share24 In the CEA Sector (Canada, Europe and Argentina) – 56% of total revenues As of March 31, 2013:
o Net debt is %1,687.0 million o Shareholders’ equity is $2,305.7 million
Brands Primary Demographics (%)25 Notes
Neilson Couple with children living at home: 18% more likely to purchase
Brand has a strong family focus
Uses emotional elements in advertising to appeal to target market
Dairyland Adult with children living at home: 11% more likely to purchase
Couple with children living at
Targeted towards household with children
22 (Print Measurement Bureau, 2013) 23 (Saputo Inc., 2012, p.26) 24 (Euromonitor International, 2012) 25 (Print Measurement Bureau, 2013)

7
home: 7% more likely to purchase
Nutrilait Adult with children living at home: 70% more likely to purchase
Adult sharing accommodation:31% more likely to purchase
Markets itself as a high quality brand – serves fresh and nutritious milk
Available on the market for more than 100 years
Website only available in French – appeals to consumers from Quebec
Agropur26
o Generates $3.8 million sales across Canada o Net earnings of $39.3 million o Second position regarding value shares, with a 26 % share27
Brands Primary Demographics (%)28 Notes
Sealtest Adult with children living at home: 21% more likely to purchase
Empty Nesters: 9% more likely to purchase
Been on the market for over 60 years
Quebon Adult sharing accommodation: 19% more likely to purchase
Adult with children living at home: 16% more likely to purchase
Only available in Quebec Attractive to Quebecois
consumers as it is an exclusive brand only available to them
Natrel Couple with no children living at home: 10% more likely to purchase
Adult living at home: 2% more likely to purchase
Households without children are more likely to purchase milk from this brand
Describes itself as a brand that produces milk to fit the different lifestyles of its consumers
Sales are up $45.2 million29
Relevant Partnerships/Alliances/Distributors
Brands Donation Organization(s)
Parmalat30 As of 2011: Clean Water Program
26 (Agropur, 2012) 27 (Euromonitor International, 2012) 28 (Print Measurement Bureau, 2013) 29 (Agropur, 2012, p.38)

8
Donated a total of $280,000 Helped fund 100 ‘landowner
water quality projects’
Saputo Inc.31
Promotes good eating habits (partnered with Breakfast Clubs of Canada)
Elementary Schools
Monetary and Product Donations
Food Banks across Canada, America and Argentina
Agropur32 Food Club des petits déjeuners du Québec
Breakfast Clubs of Canada
Foundation OLO Other food groups
across Canada
Funding Scholarships Educational Institutions
Programs
LOVE Foundation with Québon
Through Natrel, financial donations
Literacy Foundation
Recent News
Saputo Inc. will join competitors that include Parmalat in dominating Australia’s dairy industry with
a bid of $378 million for Warrnambool Cheese and Butter Factory Company Holdings Ltd.33
Saputo Inc. also purchased Morningstar Foods, LLC. in the United States.34
Environmental Factors
Consumer Behaviour
Most popular brands purchased:
- Dairyland
- Neilson
- Beatrice
Dairy milk consumption has been declining in recent years with people switching from higher fat milks
to skim milks and milk with lower fat content. Milk products like cream, ice cream and yogurt
meanwhile appear to be on the rise35 30 (South Nation Conservation Authority, 2011) 31 (Saputo Inc., 2010, p.16) 32 (Agropur, 2012, P. 22) 33 (Bertrand, The Globe and Mail, 2013) 34 (Saputo Inc., 2013, p.12)

9
This suggests that consumers are looking to alternatives for their milk rather than fluid.
Since 2007 there has been a clear decline in milk consumption in North America as detailed by the
Government of Canada. In Canada in 2007 total milk consumption in litres per capita was 83.1 and in
2011 it was 78.4. In the US in 2007 total milk consumption per capita was 80.3 and in 2011 it was 75.8.36
Consumers have demonstrated a degree of brand loyalty with most consumers choosing to purchase
milk from big name brands knowing that they are dependable and will be the same quality each time.
With recent shifts in dietary trends we have seen the introduction of new products and a rise in
adoption of these products. These included flavoured milks, soy milks, lactose free milks and fine
filtered milks. There has also been a shift to milk with lower fat content as people as more mindful of
fat intake.37
Ideal Consumer
Males and females are equally likely to purchase milk and there is an even distribution amongst age
(each age is equally likely to consumer milk) although people under the age of 25 seem to be slightly
more likely to purchase and consumer milk. People are using milk not only to drink but for other
purposes as well.
73.9% of consumers are using milk in cereal 52.3% use it for cooking/baking 67% use it for drinking 56.4% use it in tea or coffee
35 ("Consumption of dairy," 2013) 36
("Consumption of dairy," 2013) 37 (Print Measurement Bureau, 2013)
Figure 2: Global milk consumption - North America is among the world leaders for milk consumption.

10
Marketing Tactics
Products
Milk types
Currently there are various types of milk on the market, but the most common form of milk is that
produced from cows. The different variants of cow’s milk including the following38:
Skim milk 1%, 2%, 3.25% milk Homogenized milk Chocolate & Strawberry Milk
But for individuals who are lactose and intolerant and miss the wholesome goodness of milk,
alternatives have been made available including the following39:
Lactose free milk Soy milk Almond milk Rice milk
Milk packaging
Dairy milk products come in a variety of different packages; the two most common in North America are
plastic bags, and paper cartons. The sizes of products are standardized across the market, and are as
follows:
125ml (carton children sized) 500ml (carton) 1 litre (carton & plastic bag) 2 litre (carton) 3 litre (plastic jug) 4 litre (plastic jug)
Promotional Tactics
Milk advertisements have been around for years but the most Iconic and recognizable milk
advertisement would be the ‘Got Milk?’ campaign; which has been running successfully for the past 20
years.
The very basis of this campaign is to stress the importance of milk consumption, these advertisements
made use of celebrity endorsements to appeal to a younger demographic. These advertisements also
educated the audience of the benefits of milk, while highlighting some of the following40: 38 (Got Milk? Campaign, 2012) 39 (Got Milk? Campaign, 2012)

11
High source of calcium Vitamin A Vitamin D Magnesium Potassium
Milk advertisements today are still making use of the same tactics; they aren’t primarily relying on
celebrity endorsements but instead are aimed at educating its consumers about the benefits of milk.
Seeing as our society has become obsessed with fitness and healthy living, the recharge with milk
campaign has had much success with creating awareness for its consumers. These advertisements like
its predecessors are aimed at educating consumers about the benefits of milk, and how after a workout
it’s the perfect drink for the body because of its high nutritional contents.
The graph below (figure 4) is outlining individuals talking about the recharge with milk campaign, in one
way or another on a social media platform41. It is clear to see that the second wave of advertisements
launched right before back to school was successful as it generated a lot of conversation.
Figure 4: Recharge with Milk campaign social media stats, September 15 – present
The graph below (figure 5) has outlined the amount of Facebook fans of the recharge with milk
campaign42, and it is clear to see how many individuals believe in the benefits of milk after some sort of
physical activity.
40 (Nutrition facts, 2013) 41 (Recharge with milk, 2013) 42 (Recharge with milk, 2013)

12
Figure 5: Recharge with Milk campaign social media stats September 15 – present
Competing in the market
Any individuals competing for market share within the milk industry must reinvent the need for milk in a
consumer’s day. They must provide some sort of desire for an individual to start drinking milk again.
Before it was appealing to success, by having celebrities give testimonials of how it fits into their day.
Currently it is the appealing to the active members of society by providing all of the nutritional benefits
of milk.
For a company to effectively market a milk product in today’s market they must make use of various
tactics, this would include: strategic partnerships, social media presences, events and some mascot or
spokesperson to put the brand on top.
The strategic partnerships and social media presence will create awareness, where the event will likely
stimulate trial for its consumers and finally the mascot or spokesperson will build and maintain the
reputation of the brand.
Environmental Factors
Environmental Factors
Factors Affecting Milk Consumption
Economic Conditions The milk industry is very sustainable but there are
several economic shifts that may affect the
industry:
- Changes in feed prices If there is a drastic
increase in feed prices we may see that farmers
cut back their herds.
- Changes in milk prices Milk is more expensive

13
than juice and water so depending on the
economy people may not be inclined to buy it
- Problems in the farming community (such as
drought and disease) As with any industry
relating to farming, environmental factors such as
these can have an impact on product quality and
availability.
Political/Legal Factors - Raw milk
Social Trends - Social trends play a significant role in milk
consumption, especially in terms of health trends.
As a result we have seen the current social trends
reflecting on milk consumption. Some social
trends that affect milk consumption include:
- Vegan diets. Vegans do not eat food that came
from an animal they are unlikely to purchase dairy
milk and will more likely opt for organic milk
alternatives.
- An increase in milk allergies.
- A preference for raw milk as opposed to
pasteurized milk sold in grocery stores. Raw milk
sales are more difficult to track and as a result will
impact sales and consumer trends.
- More alternatives available (flavoured, almond,
soy, rice, coconut etc.). Most of these alternative
milks have a lower fat content than regular milk
and are now widely available. “Low-fat flavored
milk showed an increase of 14 percent in 2007 and
accounts for almost 42 percent of all flavored milk
sales through supermarkets.”43
- Developing widespread belief that milk is not
43 (Milk Sales and Consumption Summary, 2012)

14
healthy for humans to consume - little to no
benefit for bones, increase risk of high cholesterol
and cancer and presence of contaminants.44
Recommendations
Key Opportunities According to the three major milk producing companies (Parmalat Canada, Saputo Inc. and Agropur),
milk consumption has decreased in Canada. However with innovative marketing strategies and media
attention, consumer demand for milk may increase which would increase growth.
To continually grow within this market, companies must reinvent the need for consumers to consume
milk on a daily basis. Currently, the focus is on the nutritional benefits of milk, and more specifically
what milk offers, versus other beverages the do not have such nutritional values.
The next wave of campaigns should continue on the trend, but dive in deeper by focusing in on how it
benefits consumers. One campaign may focus on for calcium, and how it helps teeth and bones. Another
can be for vitamin A, and how it benefits eyes and immune systems. Another can focus on the benefits
of vitamin D and how it helps your skin.
Market Penetration: To really focus in and penetrate the market, the advertisements must be
specifically targeted towards a particular demographic. For instance, if a company were to implement
the ideas above, it could be done in stages. For example, the first step would present a parent giving
their children milk to support their teeth and bones, eyes etc. The next step would show the same
children grown up, this time giving it to their children and parents as part of a healthy diet, explaining
the key benefits of milk.
Gaps: The current market advertisements haven’t been targeted as much as they could be, as it simply
focuses on one aspect opposed to the full spectrum.
Success Factors
Milk has been successful with strategic partnerships with the companies like 100% Canadian milk. If a
company meets its standards, they are branded with the logo and are considered a part of the family.
44 (Health Concerns, 2013)
15
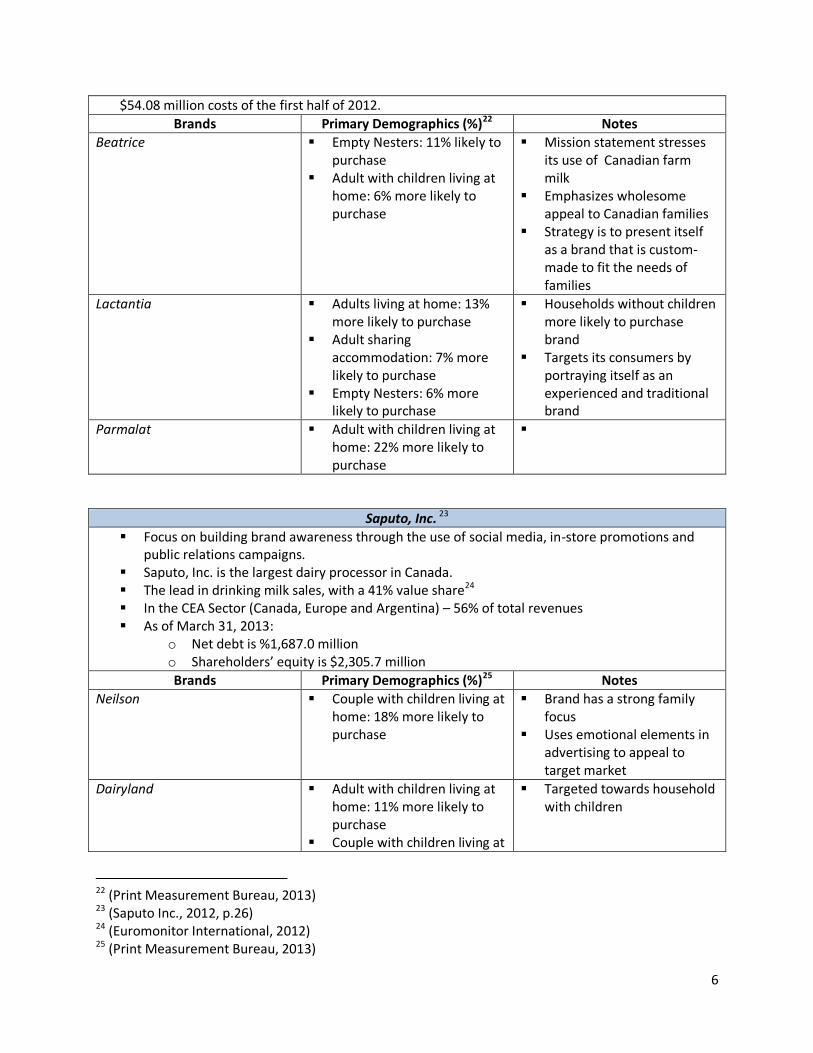
Within this portfolio of companies, the companies that stand out most are Gay Lea, Nestle Canada,
Farmers and Carnation just to name a few45.
The three major companies in the consumer sector of milk are successful for specific reasons:
1. Parmalat: The increase of consumer debt decreases milk consumption. Therefore Parmalat used the
yoghurt and cheese segments of the dairy market to maintain its third-place ranking amongst
competitors. 46
2. Saputo: Have looked to develop new markets through acquisitions. Such acquisitions allows the
company to expand is presence among the global dairy markets.
3. Agropur: Agropur has a selection of widely-recognized and well-respected branded products. Such
products are presented among the many sections of the Canadian dairy market. Agropur focuses on
maintaining consumer trust rather than earning it as this trust is already established. It has been
publicly rewarded for its quality; in 2012 Agropur received GFSI (Global Food Safety Initiative).47
45 (Dairygoodness, 2013) 46 (Parmalat, 2013, p. 17) 47 (Agropur, 2012, p.6)