Consumer Price Search and Platform Design in Internet …jdlevin/Papers/PriceSearch.pdf ·...
67
Consumer Price Search and Platform Design in Internet Commerce Michael Dinerstein, Liran Einav, Jonathan Levin, and Neel Sundaresan y August 2017 Abstract. Despite low physical search costs, online consumers still face poten- tially large search frictions due to the proliferation and high churn of products and sellers. Consequently, the platform design the process that helps potential buyers navigate toward a product they may purchase plays a critical role in reducing these search frictions and determining market outcomes. In this paper we study a key trade-o/ associated with two important roles of e¢ cient platform design guiding consumers to their most desired product while also strengthen- ing seller incentives to o/er low prices. We begin by illustrating this trade-o/in a simple theoretical framework, and then combine detailed browsing data from eBay and an equilibrium model of consumer search and price competition to quantitatively assess this trade-o/in the particular context of a change in eBays marketplace design. We nd that retail margins are on the order of 10%, and use the model to explore how pricing and purchase rates vary with the platform redesign. Our model explains most of the e/ects of the redesign, and allows us to identify conditions where narrowing consumer choice sets can be pro-competitive. The counterfactual exercises also point to a very di/erent resolution of the plat- form design trade-o/ when products are more heterogeneous, a result that is also qualitatively supported by a subsequent A/B experiment run by eBay. We appreciate support from the Alfred P. Sloan Foundation, the National Science Foundation, the Stanford Institute for Economic Policy Research, and the Toulouse Network on Information Technology. We thank Greg Lewis and many seminar participants for helpful comments. Data access for this study was obtained under a contract between Dinerstein, Einav, and Levin and eBay Research. Neel Sundaresan was an employee of eBay at the time this research began. y Department of Economics, University of Chicago (Dinerstein), Department of Economics, Stanford Uni- versity (Einav and Levin), NBER (Dinerstein, Einav, and Levin), and Microsoft (Sundaresan). Email: [email protected], [email protected], [email protected], and [email protected].
Transcript of Consumer Price Search and Platform Design in Internet …jdlevin/Papers/PriceSearch.pdf ·...

Consumer Price Search and PlatformDesign in Internet Commerce�
Michael Dinerstein, Liran Einav,
Jonathan Levin, and Neel Sundaresany
August 2017
Abstract. Despite low physical search costs, online consumers still face poten-tially large search frictions due to the proliferation and high churn of productsand sellers. Consequently, the platform design �the process that helps potentialbuyers navigate toward a product they may purchase �plays a critical role inreducing these search frictions and determining market outcomes. In this paperwe study a key trade-o¤ associated with two important roles of e¢ cient platformdesign �guiding consumers to their most desired product while also strengthen-ing seller incentives to o¤er low prices. We begin by illustrating this trade-o¤ ina simple theoretical framework, and then combine detailed browsing data fromeBay and an equilibrium model of consumer search and price competition toquantitatively assess this trade-o¤ in the particular context of a change in eBay�smarketplace design. We �nd that retail margins are on the order of 10%, anduse the model to explore how pricing and purchase rates vary with the platformredesign. Our model explains most of the e¤ects of the redesign, and allows us toidentify conditions where narrowing consumer choice sets can be pro-competitive.The counterfactual exercises also point to a very di¤erent resolution of the plat-form design trade-o¤when products are more heterogeneous, a result that is alsoqualitatively supported by a subsequent A/B experiment run by eBay.
�We appreciate support from the Alfred P. Sloan Foundation, the National Science Foundation, theStanford Institute for Economic Policy Research, and the Toulouse Network on Information Technology. Wethank Greg Lewis and many seminar participants for helpful comments. Data access for this study wasobtained under a contract between Dinerstein, Einav, and Levin and eBay Research. Neel Sundaresan wasan employee of eBay at the time this research began.
yDepartment of Economics, University of Chicago (Dinerstein), Department of Economics, Stanford Uni-versity (Einav and Levin), NBER (Dinerstein, Einav, and Levin), and Microsoft (Sundaresan). Email:[email protected], [email protected], [email protected], and [email protected].

1 Introduction
Search frictions play an important role in retail markets. They help explain how retailers
maintain positive markups even when they compete to sell near-identical goods, and why
price dispersion is so ubiquitous. In online commerce, the physical costs of search are much
lower than in traditional o ine settings. Yet, studies of e-commerce routinely have found
substantial price dispersion (Bailey, 1998; Smith and Brynjolfsson, 2001; Baye, Morgan, and
Scholten, 2004; Einav et al., 2015). One explanation for remaining search frictions in online
markets is that the set of competing products is often very large and changes regularly such
that consumers cannot be expected to consider, or even be aware of, all available products.
To deal with this proliferation of options, consumers shopping online can use either
price search engines or (more often) compare prices at e-commerce marketplaces, or internet
platforms, such as eBay or Amazon. For the most part, these platforms want to limit search
frictions and provide consumers with transparent and low prices (Baye and Morgan, 2001).
Sellers on these platforms may have very di¤erent incentives. Many retailers, and certainly
those with no particular cost advantage, would like to di¤erentiate or even �obfuscate�their
o¤erings to limit price competition (Gabaix and Laibson, 2006; Ellison and Ellison, 2009;
Ellison and Wolitzky, 2012). These often con�icting incentives highlight the important role
of the platform design, which structures online search in a way that a¤ects consumer search
and seller incentives at the same time. In markets where the set of potential o¤ers is large,
the platform�s design may have �rst-order implications for price levels and the volume of
trade.
In this paper, we use a model of consumer search and price competition to estimate search
frictions and online retail margins, and to study the e¤ects of search design. We estimate the
model using browsing data from eBay. A nice feature of internet data is that it is possible
to track exactly what each consumer sees. As a practical matter, consumers often evaluate
only a handful of products, even when there are many competing sellers. With standard
transaction data, incorporating this requires the introduction of a new latent variable, the
consumer�s �consideration set�; that is, the set of products the consumer actually chooses
between (e.g., Goeree, 2008; Honka et al., 2014). Here, we adopt the consideration set
1

approach, but use browsing data to recover it.
We use the model to estimate consumer demand and retail margins, and then to analyze
a large-scale redesign of the search process on eBay. Prior to the redesign, consumers enter-
ing a search query were shown individual o¤ers drawn from a larger set of potential matches,
ranked according to a relevance algorithm. The redesign broke consumer search into two
steps: �rst prompting consumers to identify an exact product, then comparing seller listings
of that product head-to-head, ranked (mostly) by price. We discuss in Section 2 how varia-
tions on these two approaches are used by many, if not most, e-commerce platforms, and use
a simple theoretical framework to illustrate the associated trade-o¤s. In particular, we assess
the trade-o¤ between guiding consumers to their most desired products and strengthening
seller incentives to o¤er low prices.
To motivate the analysis, we show in Section 3 that across a fairly broad set of consumer
product categories, re-organizing the search process is associated with both a change in pur-
chasing patterns and a fall in the distribution of posted prices. After the change, transaction
prices fell by roughly 5-15% for many products. We also point out that all of these cate-
gories are characterized by a wide degree of price dispersion, and by di¢ culties in accurately
classifying and �ltering relevant products. Despite a very large number of sellers o¤ering
high-volume products, consumers see only a relatively small fraction of o¤ers, and regularly
do not buy from the lowest-price seller. That is, search frictions appear to be prevalent
despite the low physical search costs associated with internet browsing.
We also present results from a randomized A/B experiment that eBay ran subsequent
to the search redesign. The experiment randomized the default search results presented to
consumers. The experiment results highlight that the impact of the search redesign varies
considerably across product categories that are more homogenous or less so. It also points to
the limitation of an A/B experiment in testing equilibrium predictions, which may require
longer time and greater scale to materialize and cannot capture equilibrium responses that
occur at a level higher than the randomization.
Motivated by these limitations, the primary empirical exercise of the paper proposes a
model of consumer demand and price competition in Section 4, and estimates it in Section 5
for a speci�c and highly homogeneous product, the Halo Reach video game. We �nd that even
2

after incorporating limited search, demand is highly price sensitive, and price elasticities are
on the order of -10. We do �nd some degree of consumer preference across retailers, especially
for sellers who are �top-rated,�a characteristic that eBay �ags conspicuously in the search
process. We also use the model to decompose the sources of seller pricing power into three
sources: variation in seller costs, perceived seller vertical and horizontal di¤erentiation, and
search frictions.
We estimate the model using data from before the search redesign. In Section 6, we apply
the model (out-of-sample) to analyze the search redesign. The model can explain, both qual-
itatively and quantitatively, many of the e¤ects of the redesign: a reduction in posted prices,
a shift toward lower-priced purchases, and consequently a reduction in transaction prices.
The redesign had the e¤ect of increasing the set of relevant o¤ers exposed to consumers, and
prioritizing low price o¤ers. We �nd that the latter e¤ect is by far the most important in
terms of increasing price sensitivity and competitive pressure. In fact, we �nd that under the
redesigned selection algorithm that prioritizes low prices, narrowing the number of listings
shown to buyers tends to increase, rather than decrease, price competition. In contrast, when
we apply the same exercise to a product category that exhibits much greater heterogeneity
across items, prioritizing prices in the search design has negative consequences, and appears
less e¢ cient than search designs that prioritize product quality.
Our paper is related to an important literature on search frictions and price competi-
tion that dates back to Stigler (1961). Recent empirical contributions include Hortacsu and
Syverson (2003), Hong and Shum (2006), and Hortacsu et al. (2012). A number of papers
speci�cally have tried to assess price dispersion in online markets (e.g., Bailey, 1998; Smith
and Brynjolfsson, 2001; Baye, Morgan, and Scholten, 2004; Einav et al., 2015), to estimate
price elasticities (e.g., Ellison and Ellison, 2009; Einav et al., 2014), or to show that consumer
search may be relatively limited (Malmendier and Lee, 2011). Ellison and Ellison (2014) pro-
pose a model to rationalize price dispersion based on sellers having di¤erent consumer arrival
rates, and use the model to analyze online and o ine prices for used books. Their model
is natural for thinking about consumer search across di¤erent websites. Lewis and Wang
(2013) examine the theoretical conditions under which reducing search frictions bene�ts all
market participants. Fradkin (2014) and Horton (2014) are two other recent papers that
3

study search design for internet platforms, in both cases focusing on settings where there is
a richer two-sided matching problem.
2 Search Design in Online Markets
2.1 Conceptual Framework
We begin by describing the simple economics of platform design. Consider J sellers, each
listing one product for sale on a single platform. Each product j (o¤ered by seller j) is
associated with a �xed vector of product attributes xj and is o¤ered for sale at a posted
price pj, which is determined by the seller. Each consumer i who arrives at the platform
is de�ned by a vector of characteristics � i, drawn from a population distribution F . Each
consumer has a unit demand and decides which product to purchase, or not to purchase at
all. Conditional on purchasing product j, consumer i�s utility is given by u(xj; pj; � i).
So far we described a standard, traditional setting of demand and supply of di¤erentiated
goods. The distinction, which is the focus of this paper, is the existence of a platform as a
market intermediary, whose main role is in allocating consumers�attention and/or awareness
to di¤erent products. This role is less essential in more traditional markets, where the
number of products is limited and consumers are likely to be reasonably familiar with most
of the products. But in online markets, where there are hundreds or sometimes thousands
of di¤erent competing products available for sale at a given time, and product churn is high,
consumers cannot be expected to consider, or even be aware of, all these products. This is
the context in which the platform has an important role in deciding which products to make
visible to a given consumer.
A simple generic way to model the platform is by assuming that the platform sets an
awareness/visibility function aij 2 [0; 1], where aij is the probability that product j is being
considered by consumer i. For example, the platform can decide not to show product j to
anyone, in which case aij = 0 for all i, or can decide to rank order certain products when it
presents search results, which would imply aij > aik for all i i¤ product j is ranked higher
than product k for all searches. We will consider below the trade-o¤s associated with di¤erent
4

platform designs, and while we will not explicitly model the optimality of the platform design,
it would be implicit in the discussion that technological or consumer attention generates a
constraint of the formP
j aij � Ki. To keep things simple, and consistent with the empirical
setting presented below, we further assume that aij = aj = a(pj; xj; p�j; x�j) for all i. That
is, the platform presents products to consumers based on their prices and attributes, but
does not discriminate presentation across consumers.1
Given this setting, platform design implies (possibly stochastic) choice sets, L, for con-
sumers, so that overall demand for product j is given by
Dj(pj; p�j) =P
L22J aLDj(pj; p�j;L); (1)
where
Dj(pj; p�j;L) =R1(u(xj; pj; � i) � u(xk; pk; � i)8k 2 L)dF (� i) (2)
and
aL =�Q
j2L aj
��Qj =2L(1� aj)
�: (3)
This consideration set approach to modeling demand is not new (see, e.g., Goeree 2008;
Honka et al. 2014), but our focus is di¤erent. While earlier papers mostly took the consider-
ation sets as given, our focus is on the platform�s decision as to how to a¤ect it.2 Note also
that we make the assumption that the platform design a¤ects choices, but does not enter the
consumer�s utility directly; this can be motivated by the fact that conditional on engaging
in a search process, the consumer exerts a �xed amount of e¤ort regardless of the outcome.
Consider now the seller�s pricing decisions. Seller j sets pj to maximize pro�ts
�j = maxpj
Dj(pj; p�j)(pj � cj); (4)
1From an ex ante perspective, this still allows for setting 0 < aj < 1, which would be implemented byrandomizing across consumers, and thus generates discrimination ex post.
2The literature sometimes draws a distinction between consumer actively �considering�a product and theconsumer seeing a product but ultimately disregarding it. We will treat a product as part of a consumer�sconsideration set if she is shown the o¤er, regardless of how seriously she considers it when deciding whetherto purchase. We discuss in Appendix A why our data do not allow us to make such a distinction.
5

leading to the familiar �rst order condition
pj = cj ��@Dj(pj; p�j)
@pj
��1Dj(pj; p�j): (5)
Note that we can write
@Dj(pj; p�j)
@pj=P
L aL@Dj(pj; p�j;L)
@pj+P
L
@aL@pj
Dj(pj; p�j;L); (6)
so the price has two distinct e¤ects. One is the usual e¤ect on demand: conditional on
considering product j, consumers are more likely to buy it if its price is lower. The second
e¤ect of price depends on the platform design. If the platform is more likely to show the
product when its price is lower �that is, if @aj@pj
< 0 �it provides yet another incentive for
sellers to reduce prices.
This will be a key point that we will focus on throughout the paper. The platform has
two distinct roles in choosing its search design. One is the familiar role of generating more
e¢ cient sorting: trying to help imperfectly informed (or imperfectly attentive) consumers
�nd their desired product within a large assortment of di¤erent products. The second role
of the platform design is to exert stronger pricing incentives on sellers. It seems natural
that if the platform tries to maximize consumer surplus (which we assume is the case),3 the
platform should tilt its optimal design from trying to predict demand for product j towards
a design that assigns greater weight to price, as a way to increase demand elasticities faced
by the seller.
2.2 A Toy Example
We now use this framework to present a highly stylized example, which illustrates some key
elements that will be the focus of the empirical exercise. Consider two products (J = 2),
which are associated with di¤erentiated qualities q1 > q2 such that q1 = q and we normalize
q2 = 0. Corresponding marginal costs are c1 = c and c2 = 0. Consumers have unit demand,
3In the context of most e-commerce platforms, including eBay, it seems reasonable to approximate plat-form revenues as a �xed share of transaction volume. To the extent that the platform maximizes long-run(rather than short-run) volume, and driving consumers to the platform (rather than sellers) is the mainchallenge, short-run consumer surplus would be highly correlated with long-run platform revenues.
6
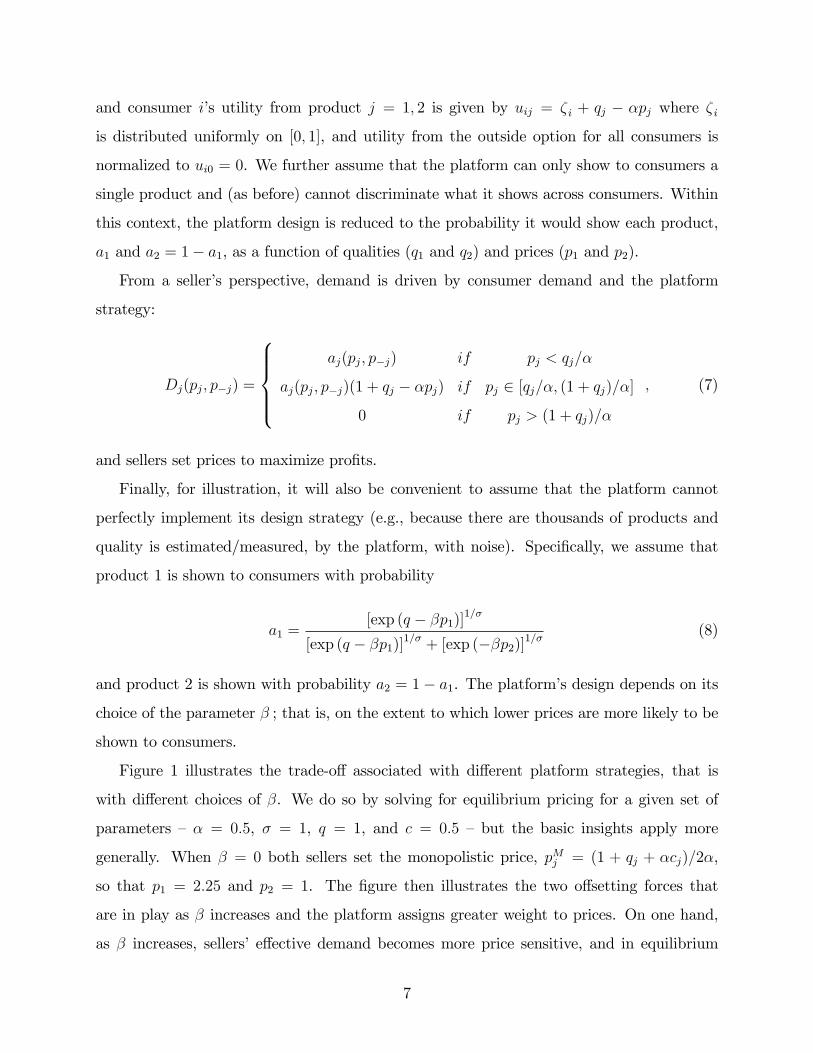
and consumer i�s utility from product j = 1; 2 is given by uij = � i + qj � �pj where � i
is distributed uniformly on [0; 1], and utility from the outside option for all consumers is
normalized to ui0 = 0. We further assume that the platform can only show to consumers a
single product and (as before) cannot discriminate what it shows across consumers. Within
this context, the platform design is reduced to the probability it would show each product,
a1 and a2 = 1� a1, as a function of qualities (q1 and q2) and prices (p1 and p2).
From a seller�s perspective, demand is driven by consumer demand and the platform
strategy:
Dj(pj; p�j) =
8>>><>>>:aj(pj; p�j) if pj < qj=�
aj(pj; p�j)(1 + qj � �pj) if pj 2 [qj=�; (1 + qj)=�]
0 if pj > (1 + qj)=�
; (7)
and sellers set prices to maximize pro�ts.
Finally, for illustration, it will also be convenient to assume that the platform cannot
perfectly implement its design strategy (e.g., because there are thousands of products and
quality is estimated/measured, by the platform, with noise). Speci�cally, we assume that
product 1 is shown to consumers with probability
a1 =[exp (q � �p1)]
1=�
[exp (q � �p1)]1=� + [exp (��p2)]1=�
(8)
and product 2 is shown with probability a2 = 1� a1. The platform�s design depends on its
choice of the parameter � ; that is, on the extent to which lower prices are more likely to be
shown to consumers.
Figure 1 illustrates the trade-o¤ associated with di¤erent platform strategies, that is
with di¤erent choices of �. We do so by solving for equilibrium pricing for a given set of
parameters �� = 0:5, � = 1, q = 1, and c = 0:5 �but the basic insights apply more
generally. When � = 0 both sellers set the monopolistic price, pMj = (1 + qj + �cj)=2�,
so that p1 = 2:25 and p2 = 1. The �gure then illustrates the two o¤setting forces that
are in play as � increases and the platform assigns greater weight to prices. On one hand,
as � increases, sellers�e¤ective demand becomes more price sensitive, and in equilibrium
7

both sellers set lower prices, bene�ting consumers. On the other hand, as � increases, the
cheaper (and lower quality) product obtains �preferential�treatment by the platform, and
is being shown more often. The ine¢ ciency is easy to see at the extreme, as � approaches
in�nity; then, the cheaper product is always shown, and (given the cost di¤erences) the
higher cost (and higher quality) product (product 1) is never shown, which is ine¢ cient.
As the bottom panel of Figure 1 shows, the trade-o¤ is then resolved with an intermediate
value of � (�� = 4:55 at the given values of the parameters), which maximizes consumer
surplus. It is important to note that this optimal value of � is still signi�cantly greater than
the corresponding weight assigned to price by consumers (recall � = 0:5).
In Figure 2 we use the same setting to illustrate some comparative statics, which are
useful in thinking about the optimal platform design across a range of di¤erent product
categories. The top left panel shows how the optimal platform design, ��, varies with the
price sensitivity of consumer demand. Naturally, all else equal, as consumers are more price
sensitive (higher �), it is more e¢ cient to increase the importance of price in the platform
design, thus leading to higher ��. In the top right panel, we show how the platform design
changes with the cost c of the higher quality product. As the cost increases, the seller of
the higher quality product has less ability to mark up its price, so the value to emphasizing
price in the platform design is lower, and �� is lower. Similarly, the bottom left panel shows
that as the products are more vertically di¤erentiated, again the optimal platform design
should apply lower weight to price as distorting demand toward the cheaper product leads
to greater ine¢ ciency. In the bottom right panel, we show that as the noise in measuring
quality (�) increases, the platform design applies a higher weight to price, which is the
product characteristic that can be targeted without error.
2.3 Existing Approaches to Platform Design
The above framework captures what we view as the two key dimensions of consumer search in
online markets. The �rst is to try to �predict�consumers�demand, and guide them toward
relevant products, either in response to a user query, or through advertising or product
recommendations. The second is to help consumers �nd a retailer o¤ering an attractive price
for a product the consumer desires, and by doing so amplify the e¤ective price elasticity faced
8

by sellers. Empirically, due to di¤erent consumer mix and di¤erent product o¤ering, online
platforms adopt heterogeneous approaches to the search problem by emphasizing one of the
above dimensions, or both.
Platforms have to identify a relevant set of o¤ers, and present the information to con-
sumers. Identifying relevant o¤ers is easier when products have well-de�ned SKUs or catalog
numbers (in the context of the model, this can be thought of as a case with relatively low
�). But as we will note below, it is still a di¢ cult problem for platforms that have tens of
thousands of di¤erent listed products. Platforms also take di¤erent approaches to presenting
information. A typical consideration is whether to try to present all the relevant products
in a single ordered list that attempts to prioritize items of highest interest, or try to classify
products into sets of �identical�products, and then order products within each set based on
price or other vertical attributes.
Figure 3 contrasts the approaches of three prominent e-commerce sites. Each panel shows
the search results that follow a query for �playstation 3.�At the top, Craigslist presents a
list of items that it judges to be relevant, ordered by listing date. The buyer must navigate
what is potentially a long and loosely �ltered list to �nd her ideal match. On the other hand,
because the top listings are recent, the item is more likely to still be available than in lower
listings, which helps to address the fact that Craigslist listings do not necessarily disappear
if the seller stocks out. In the bottom panel, Amazon takes the other extreme. It highlights
a single product model (the 160 GB version) and quotes the lowest price. Buyers can change
the model, or click through to see a list of individual sellers, ordered by price. In the middle
panel, Google Shopping takes a somewhat intermediate approach.
These approaches to search design illustrate some trade-o¤s. Erring on the side of inclu-
siveness makes it more di¢ cult for a buyer to �nd the lowest price for a speci�c well-de�ned
product. On the other hand, it allows for serendipitous matches, and provides more oppor-
tunities to sellers who may be less professional in categorizing their products. The latter
approach works well for a shopper interested in price comparisons, and would seem to pro-
mote price competition, provided that the platform is able to accurately identify and classify
listings according to the product being o¤ered. At the same time, as Ellison and Ellison
(2009) have highlighted, it may provide sellers with a strong incentive to search for unpro-
9

ductive tactics that avoid head-to-head price competition.
3 Setting and Motivating Evidence
3.1 Background: Changes in Platform Design on eBay
With this general framework in mind, the rest of the paper will use detailed data from eBay,
taking advantage of an interesting episode of platform design changes to eBay�s marketplace,
which allows us to compare the di¤erent approaches. Appendix B provides more details about
the data construction.
The top panel of Figure 4 shows eBay�s traditional listings page. It is generated by
an algorithm that �rst �lters listings based on query terms, and then presents the listings
according to a ranking order. The default is a relevance ranking that eBay calls Best Match.4
Users can change the sort order or re�ne their search in various ways. Unlike some search
results on the internet, the Best Match algorithm traditionally has not been tailored to
individual users, nor did it consider price explicitly.5 While it may seem strange not to use
price as an explicit ranking factor, it is less surprising when one appreciates the di¢ culty of
�ltering the set of products. For example, re-sorting the displayed page on price would have
yielded cheap accessories (e.g., cables or replacement buttons or controllers).
In spring 2011, eBay introduced an alternative two-stage search design. A buyer �rst
sees the relevant product models (e.g., a user who searches for �iPhone�sees �Black iPhone
4s 16GB (AT&T)�and other models). The buyer then clicks on the model to see a product
page with speci�c listings, shown in the bottom panel of Figure 4.6 The product page has
a prominent �Buy Box�that displays the seller with the lowest posted price (plus shipping)
4When eBay was predominantly an auction platform, it sorted listings in order of their ending time, withlistings set to expire soonest at the top of the page. This ordering is still used for auction results, but eBayintroduced the more multi-dimensional Best Match ordering in 2008.
5At various times, the Best Match algorithm has incorporated price or attempted more tailoring withrespect to individual users, but it did not during the period we study. However, it does incorporate factorsthat may be correlated with prices. For instance, if Best Match moved sellers with high conversion rates upin the search, and these sellers are likely to have low prices, then Best Match results may e¤ectively prioritizelow prices.
6The concept of a product page existed on eBay earlier, but its design was very di¤erent and it wasdi¢ cult to �nd, so that only a small minority of users ever viewed it.
10
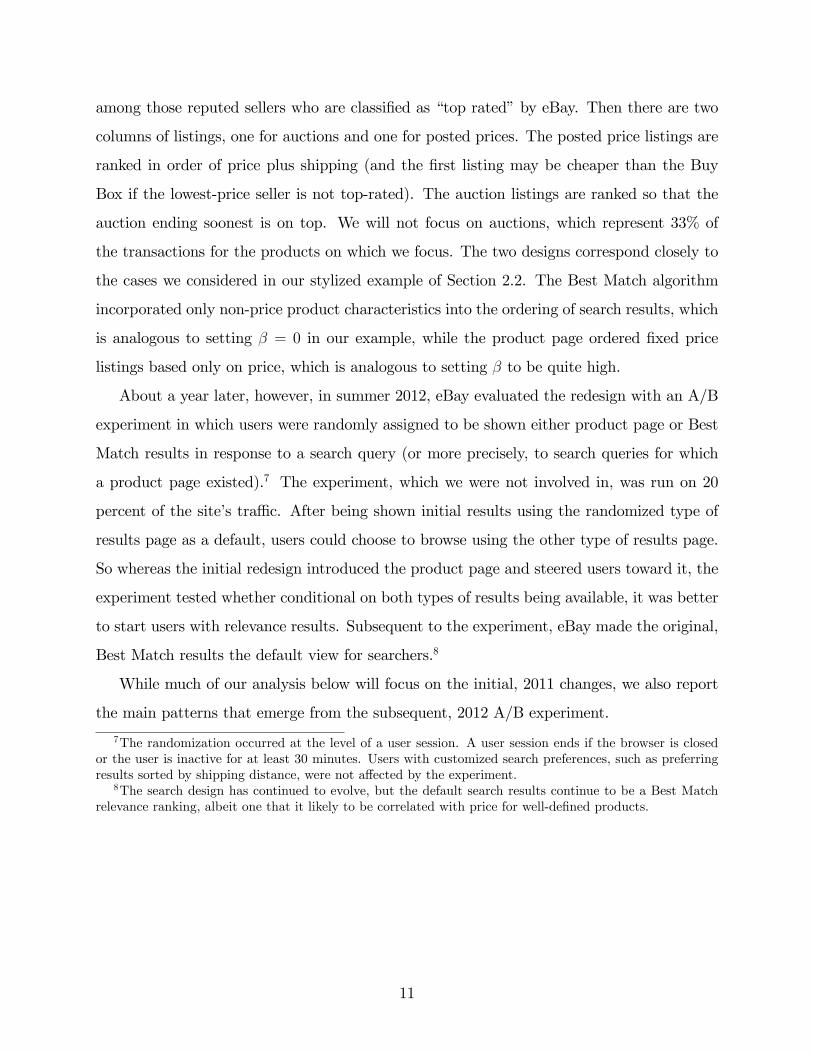
among those reputed sellers who are classi�ed as �top rated�by eBay. Then there are two
columns of listings, one for auctions and one for posted prices. The posted price listings are
ranked in order of price plus shipping (and the �rst listing may be cheaper than the Buy
Box if the lowest-price seller is not top-rated). The auction listings are ranked so that the
auction ending soonest is on top. We will not focus on auctions, which represent 33% of
the transactions for the products on which we focus. The two designs correspond closely to
the cases we considered in our stylized example of Section 2.2. The Best Match algorithm
incorporated only non-price product characteristics into the ordering of search results, which
is analogous to setting � = 0 in our example, while the product page ordered �xed price
listings based only on price, which is analogous to setting � to be quite high.
About a year later, however, in summer 2012, eBay evaluated the redesign with an A/B
experiment in which users were randomly assigned to be shown either product page or Best
Match results in response to a search query (or more precisely, to search queries for which
a product page existed).7 The experiment, which we were not involved in, was run on 20
percent of the site�s tra¢ c. After being shown initial results using the randomized type of
results page as a default, users could choose to browse using the other type of results page.
So whereas the initial redesign introduced the product page and steered users toward it, the
experiment tested whether conditional on both types of results being available, it was better
to start users with relevance results. Subsequent to the experiment, eBay made the original,
Best Match results the default view for searchers.8
While much of our analysis below will focus on the initial, 2011 changes, we also report
the main patterns that emerge from the subsequent, 2012 A/B experiment.
7The randomization occurred at the level of a user session. A user session ends if the browser is closedor the user is inactive for at least 30 minutes. Users with customized search preferences, such as preferringresults sorted by shipping distance, were not a¤ected by the experiment.
8The search design has continued to evolve, but the default search results continue to be a Best Matchrelevance ranking, albeit one that it likely to be correlated with price for well-de�ned products.
11

3.2 The Impact of The Product Page: Descriptive Evidence
The new product page was introduced on May 19, 2011.9 However, the traditional search
results page remained the default view for buyers. The new product page became the
default presentation of search results for �ve large categories � cell phones, digital cameras,
textbooks, video games, and video game systems � over a one-week period from June 27,
2011 to July 2, 2011. The traditional Best Match results were still accessible to buyers, so
the best way to view the change is probably to think of buyers as now having access to two
types of search results, and being nudged toward (and defaulted into) the product page.
Table 1 shows statistics for these �ve categories in the period before the product page
was introduced (April 6 to May 18) and the period after the introduction was completed
(August 1 to September 20). We drop the intermediate period during which the product
page was available, but not the default. We also exclude the month of July to allow time for
sellers to respond to the platform redesign. The sample period covers nearly half a year, so
one potential concern is that there may have been changes in the set of products available,
especially in the categories with shorter product life cycles. To deal with this, we restrict
attention to the ten products in each category that were most commonly transacted in the
week before the product page became the default. As an example, a typical product in the
cell phone category is the black, 16GB iPhone 4 for use with AT&T. We also show statistics
for the narrower product category of iPhone 4.
Several patterns are clear in the data. There are many listings for each product. The
average number of listings ranges from 16 to 41 across the �ve categories. There is also
remarkable variation in prices. The average ratio of the 75th percentile price to the 25th
percentile price is 1.22 in cell phones, 1.32 in digital cameras, and higher in the other cate-
gories. The extreme prices, especially on the high end, are even more dramatic. Consumers
generally do not purchase at the lowest price. In the period before the redesign the average
purchase price often was around the 25-40th percentile of the price distribution. As an ex-
ample, in the digital camera category, consumers pay on average around 18% more than if
they had selected the 10th percentile price.
9eBay ran a small pilot in September 2010 and implemented the product page for the GPS, DVD, andMP3 categories. These categories are not included in our subsequent analyses.
12

The comparison between the two periods is also informative. With one exception (video
game systems), transacted prices fell in every category after the new product page was
introduced. The fall was relatively small in the cell phone and video game categories (2.1%
and 7.7%, respectively), and larger in digital cameras and textbooks (15.7% and 15.9%).
The decrease does not appear to be driven by a general time trend. The qualitative results
remain similar when we control for product-speci�c (linear) time trends. In part, the drop
in transacted prices re�ects a fall in the posted prices that were being o¤ered. Posted prices
fell in every category (again, with the exception of video game systems), by between 0.9%
and 17.7%, demonstrating the redesign�s long-run e¤ect on seller pricing.
Several statistics are suggestive of changes in which listings consumers considered. In
every category except one, consumers after the redesign purchased items that were cheaper
relative to the current distribution of prices. The share of purchases from top-rated sellers
also increased markedly for many of the products. Both of these results seem fairly natural.
The redesigned search selects and sorts listings by price, focusing attention on the low-price
o¤ers, and the product page Buy Box especially promotes the low-priced Top-Rated Seller
(TRS).10
Figure 5 presents a �nal piece of descriptive evidence, that is also consistent with a change
in consumer search patterns after the redesign. The �gure is constructed using browsing data
for a single product, the video game Halo Reach, which we will use to estimate our model
below. The top panel shows the distribution of new, �xed price Halo Reach o¤ers that were
displayed to each consumer following a targeted search, before and after the change in the
search design. The size of the consumer �consideration set�increased sharply. The second
panel shows the distribution of the total number of clicks made in a browsing session, for
consumers who ended up purchasing a new, �xed price Halo Reach video game listing. After
the search redesign, consumers generally clicked fewer times on their way to a purchase,
consistent with a more streamlined process.
10As mentioned, we focus on the August-September �After�period, because it seemed plausible that thee¤ect of the change on seller�s pricing may take some time to play out. The July results are generally inter-mediate, with most of the change in TRS transactions, and price percentile changes occurring immediately.
13

3.3 Moving Back to Traditional Best Match: Results from eBay�s
A/B Experiment
As the stylized example in Section 2.2 highlights, the e¤ects of platform design likely depend
on the product�s degree of quality di¤erentiation, q. The A/B experiment provides a clean
comparison of demand behavior under the di¤erent platform designs. Note, however, that
because the two designs were simultaneously active and sellers set a single price per listing,
the experiment will not induce any di¤erential changes to pricing incentives. Therefore, the
experimental results will only capture the platform�s ability to e¢ ciently sort consumers to
listings and not its e¤ect on pricing. We will return to this shortcoming in the next section.
We �rst examine the experiment�s average results, aggregating across all product cate-
gories. A starting point is that the experiment did succeed in steering users toward particular
results. For users randomly assigned to the product page by default, 3.45% of all sessions
included a product page visit, compared to 1.87% for users who were randomly assigned to
the Best Match default. A straight comparison of the two user groups, focusing on products
for which the product page was feasible, showed that the Best Match group had a higher
purchase rate: 0.280% versus 0.267%, with a t-statistic of 10.75 on the di¤erence. The Best
Match group also had slightly higher average transacted prices: $53.35 versus $52.23, with
the di¤erence being only marginally signi�cant (t-stat of 1.85). As mentioned, this compar-
ison made eBay make the traditional Best Match results the default view for searchers.
The higher purchase rate for the Best Match group (despite slightly higher average prices
paid) suggests that non-price characteristics play an important role. To explore further, we
collected data on all purchases from the experimental user sessions, for the period July 25,
2012 to August 30, 2012. We restrict attention to the 200 products with product pages that
were visited at least 1,000 times and had at least 20 purchases during the experiment, and
to �xed price listings for these products.
Following our earlier discussion, we conjectured that relevance ranking might have been
particularly e¤ective for di¤erentiated products, where consumers may care about features
other than price. We therefore construct a proxy for each product�s level of homogeneity.
We use the fact that when a seller posts a new listing, eBay often suggests a title based
14

on the product code. We take the fraction of product listings with the most common (i.e.
suggested) title as a measure of product homogeneity.11
Figure 6 reports statistics based on this cut of the experimental data. The top panel
shows, by product, the price e¤ect of making the Best Match the default search results
page relative to making the Product Page the default. The bottom panel shows the same
for quantity. The e¤ect is highly heterogeneous across products, presumably re�ecting a
combination of sampling variation and idiosyncrasies across products in how much residual
heterogeneity across listings exists. Overall, while the average price and quantity e¤ects
are both small, but positive, there is a remarkable variation across products, with products
that are more heterogeneous having the greatest (and non-trivial) positive quantity and
price e¤ect when Best Match is used, while more homogeneous products are associated with
essentially no quantity e¤ect and a slight negative price e¤ect due to Best Match.
3.4 Discussion
The results in Section 3.2 provide a descriptive and qualitative sense of the overall e¤ects
of the platform change. After the change, transaction prices fell for many products. This
appears to have resulted from both a change in purchasing patterns and a fall in the dis-
tribution of posted prices. The A/B experiment results (reported in Section 3.3) highlight
the important heterogeneity in this response across products, even within a fairly narrow
product category. The estimated heterogeneous e¤ects con�rm that the platform�s trade-o¤
between prioritizing price or non-price characteristics depends closely on the product�s level
of di¤erentiation. Taken together, the collection of descriptive results reported in this sec-
tion suggests that the platform design is an important feature of the eBay market, and that
platform changes could make a non-trivial di¤erence for market outcomes. At the same time,
while the patterns are suggestive regarding some of the channels that are in play, the analysis
also highlights the di¢ culties in interpreting the empirical patterns without a model.
11Implicitly the idea we have in mind is that for a more heterogeneous product, say with accessories orslightly di¤erent speci�cations, the seller would need to modify the title. Sellers might also modify the titleas a way to create perceived heterogeneity. We also tried constructing a Her�ndahl index based on the listingshares of di¤erent titles for each product, and obtained similar types of results to what we report below. Forour empirical model, we will construct a more direct measure of listing quality. The measure will rely onextensive search results data and thus is not practical for analysis across many products.
15

Consider the results from the A/B experiment �rst in light of the empirical framework
presented in Section 2. The premise of the framework is that pricing on the platform re-
sponds to the platform design, yet the A/B experiment, while useful in highlighting the
importance of heterogeneity across products, cannot capture this pricing response for two
reasons. First, sellers respond to their expected demand, and the experiment a¤ected only a
small share of users. Furthermore, expected demand is integrated over users reaching both
types of search results, so we cannot compare across experimental groups. Second, sellers�
pricing decision and strategies are unlikely to respond immediately, so although the short
run response (captured in the results presented earlier) might be indicative of the longer run
e¤ects, quantitatively it could be quite di¤erent. On the other hand, the A/B results sug-
gest that heterogeneity across products appears to be quite important, and this may make
it di¢ cult to interpret the category-average patterns we presented in Section 3.2.
Therefore, in the next section we develop and estimate a more complete model of the
underlying economic primitives. The model allows us to explain the price levels and the
purchasing patterns in the data, and separate the demand and pricing incentive e¤ects of
the platform change, as well as to evaluate alternative platform changes and product types
not present in the data.
4 An Empirical Model
In this section, we describe a model of consumer search and price competition. In the next
section, we estimate the model�s parameters using data from a single product market, and use
the estimates to quantify search frictions, the importance of retailer and listing heterogeneity,
the size of retailer margins, and the way that the platform redesign a¤ected all of these.
The model�s ingredients are fairly standard. Each potential buyer considers a speci�c
and limited set of products. He or she then chooses the most preferred. This is modeled as
a traditional discrete choice problem. Sellers set prices in a Nash Equilibrium, taking into
account buyer demand. The role of the platform is to shape consumer search. Rather than
considering all available products, consumers consider the ones suggested by the platform.
We take advantage of detailed browsing histories to explicitly collect data on each buyer�s
16

consideration set. In this context, search rankings a¤ect the set of considered products, and
hence consumer choices, and indirectly, the incentives for price competition.
4.1 Consumer Demand
We consider a market in which, at a given point in time, there are a large number of di¤erent
sellers o¤ering either the targeted or a non-targeted product. The targeted product is the
product that is the focus of the market (e.g., the product corresponding to the search terms
the user speci�es) while non-targeted products are other, possibly-related products. We
allow listings to vary only by their price p, vertical quality q,12 and by whether they are
listed by a top-rated seller (denoted TRS). We attribute any additional di¤erentiation to
a logit error. We assume that consumer i�s utility from listing j of the targeted product is
given by
uij = �0 + �1pj + �2TRSj + �3pjTRSj + �4qj + "ij; (9)
where �ij is distributed Type I extreme value and is independent of the listing�s price, quality,
and TRS status.
We assume that consumer i�s utility from listing m of the non-targeted product is given
by
uim = � + �"im; (10)
where �im is independently distributed Type I extreme value. We parameterize the degree
of horizontal di¤erentiation of non-targeted products by � to allow non-targeted products to
be more or less di¤erentiated than targeted products.13
The main distinction of the model comes in analyzing the consideration set. The consid-
eration set is denoted by Ji, such that Ji � J , where J is the set of all available o¤erings on
the platform. Let JJi and JMi denote the set of targeted and non-targeted listings, respec-
tively, in the consideration set. We assume that the outside good, good 0, which represents
either not buying the product or buying it via another sales channel or by auction, is also
part of the consideration set. It has utility ui0 = "i0, where "i0 is also an independent Type
12We describe the way we measure quality in the next section.13This parameterization yields the same substitution patterns across the non-targeted and targeted prod-
ucts as a nested logit.
17

I extreme value random variable. Consumers choose the utility-maximizing option in their
consideration set.
To estimate the demand parameters, we rely on our browsing data to identify the consid-
eration sets of a large sample of buyers, and their resulting choices. Speci�cally, we assume
the consideration set includes all the listings on the page seen by the consumer following
his last search query. This is usually the listings page prior to the platform redesign, and
the product page afterwards. With an observable consideration set for each buyer, demand
estimation is straightforward using the familiar multinomial logit choice probabilities.
4.2 Consideration Sets
In order to analyze pricing decisions, and make out-of-sample predictions, we also develop a
simple econometric model of how consideration sets are formed. To do this, we assume that
consumer i observes the o¤ers of Li = (LJi ; LMi ) sellers, where Li is random. We estimate its
distribution directly from the data, that is, by measuring the frequency with which observed
consideration sets include a given number of targeted and non-targeted listings. We assume
that Li, the number of the items in the consideration set, is independent of any particular
buyer characteristics, or the distribution of prices.
Which listings of the targeted product make it into the consideration set? Prior to the
redesign, we noted that price did not factor directly into search ranking, but that after the
redesign, it played a predominant role. In practice, the complexity of the search ranking and
�ltering algorithms, which must be general enough to work for every possible search query
and product, as well as factors such as which server provides the results, adds less purposeful
(and perhaps unintentional) elements to what results are shown.
To capture this, we adopt a stochastic model of how listings are selected onto the displayed
page. Speci�cally, we assume that products are sampled from the set of available targeted
products Ji, such that each product j 2 Ji is associated with a sampling weight of !j. Before
the redesign, the sampling weight is the listing�s quality, qj. While a listing�s quality may be
correlated with its price, it is �xed and thus price changes do not a¤ect the listing�s sampling
weight. This re�ects eBay�s use of the Best Match algorithm, which attempts to rank listings
based on a single-dimensional measure of a listing�s quality. This model therefore allows us
18
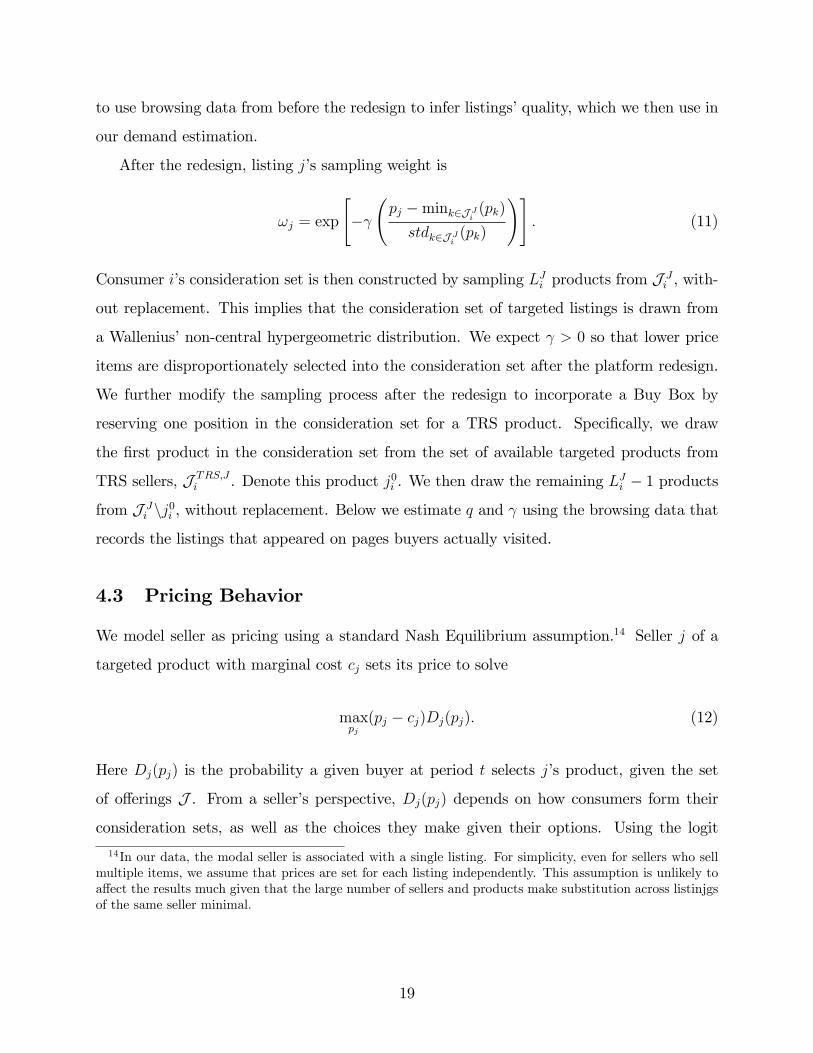
to use browsing data from before the redesign to infer listings�quality, which we then use in
our demand estimation.
After the redesign, listing j�s sampling weight is
!j = exp
"� pj �mink2J J
i(pk)
stdk2J Ji(pk)
!#: (11)
Consumer i�s consideration set is then constructed by sampling LJi products from J Ji , with-
out replacement. This implies that the consideration set of targeted listings is drawn from
a Wallenius�non-central hypergeometric distribution. We expect > 0 so that lower price
items are disproportionately selected into the consideration set after the platform redesign.
We further modify the sampling process after the redesign to incorporate a Buy Box by
reserving one position in the consideration set for a TRS product. Speci�cally, we draw
the �rst product in the consideration set from the set of available targeted products from
TRS sellers, J TRS;Ji . Denote this product j0i . We then draw the remaining L
Ji � 1 products
from J Ji nj0i , without replacement. Below we estimate q and using the browsing data that
records the listings that appeared on pages buyers actually visited.
4.3 Pricing Behavior
We model seller as pricing using a standard Nash Equilibrium assumption.14 Seller j of a
targeted product with marginal cost cj sets its price to solve
maxpj(pj � cj)Dj(pj): (12)
Here Dj(pj) is the probability a given buyer at period t selects j�s product, given the set
of o¤erings J . From a seller�s perspective, Dj(pj) depends on how consumers form their
consideration sets, as well as the choices they make given their options. Using the logit
14In our data, the modal seller is associated with a single listing. For simplicity, even for sellers who sellmultiple items, we assume that prices are set for each listing independently. This assumption is unlikely toa¤ect the results much given that the large number of sellers and products make substitution across listinjgsof the same seller minimal.
19

choice probabilities, we have
Dj(pj) =X
J : j2J�J
26666664exp (�0 + �1pj + �2TRSj + �3pjTRSj + �4qj)
1 + exp (� + � ln jJM j) +P
k2JJ exp
0@ �0 + �1pk + �2TRSk+
+�3pkTRSk + �4qk
1A
37777775Pr (J jJ ) :(13)
Another important consideration here is the set (J ) of competing items that the seller has
in mind when it sets its price. We assume that the seller optimizes against the (stochastic)
set of competing products over the entire lifetime of the listing. The competing items are
drawn from the approximately one month (either �before� or �after�) period considered.
When a competing listing is simulated to be purchased, it is replaced on the site by another
listing from the period.15 See Backus and Lewis (2016) for related work on stochastic sets
of competing products.
To understand the seller�s pricing incentives, it is useful to write Dj (pj) = Aj (pj)Qj (pj),
where Aj is the probability that the listing enters the consideration set given pj and J ,
and Qj is the probability that the consumer purchases item j conditional on being in the
consideration set. With this notation, the optimal price pj satis�es:
pjcj=
�1 +
1
�D
��1=
�1 +
1
�A + �Q
��1; (14)
where �D, �A, �Q are respective price elasticities.16 When > 0, reducing price increases
demand in two ways: by making it more likely that the seller ends up in the consideration set
(�A < 0) and by making it more likely that the consumer picks the seller, conditional on the
seller being in the choice set (�Q < 0). Increasing intensi�es the �rst e¤ect. In addition,
increasing e¤ectively faces each seller with tougher competition conditional on making it
15The new listing that replaces the purchased one is sampled according to the length of time the listingswere actually active on eBay during our estimation period. Thus, sellers are more likely to face competitorswho are selling many units at once or competitors with relatively unattractive products as they remain onthe simulated site for longer. Every 100 searches we exogenously reset the set of competing products toaccount for the feature that some eBay listings expire without being purchased.16To see this, note that �D = D
0(p=D), D = AQ, and D0 = Q0A+A0Q. This implies that �D = D0(p=D) =
Q0(p=Q) +A0(p=A) = �Q + �A.
20
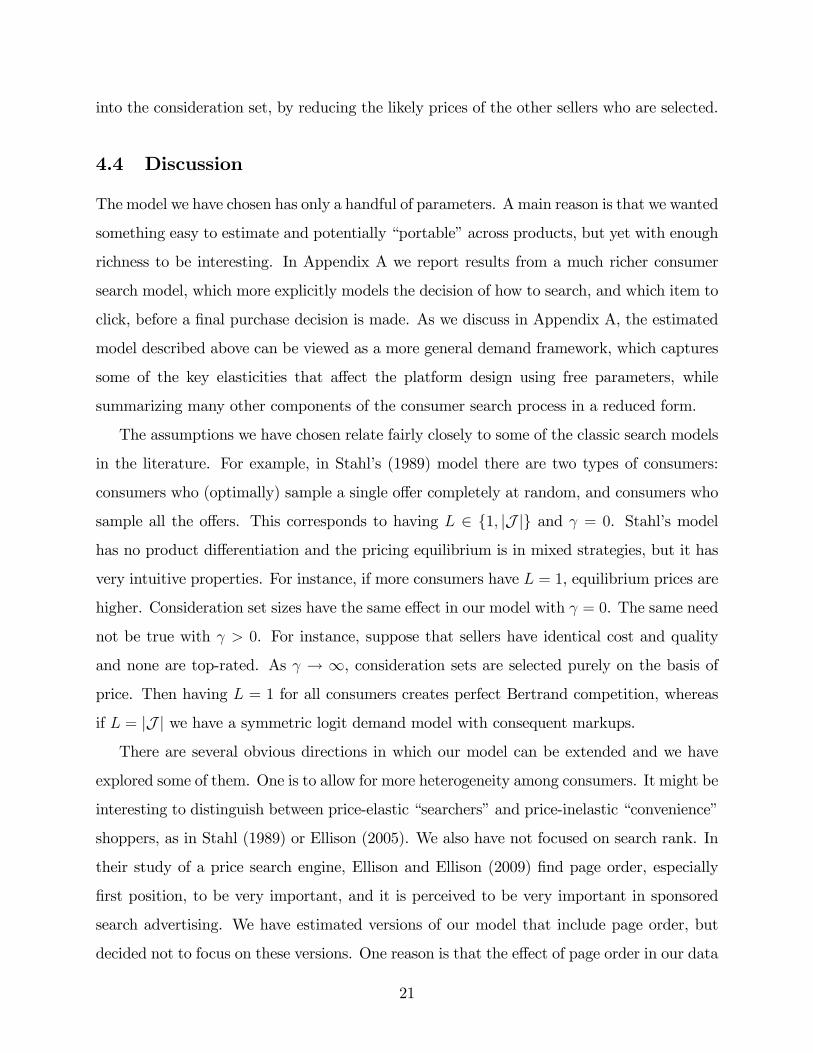
into the consideration set, by reducing the likely prices of the other sellers who are selected.
4.4 Discussion
The model we have chosen has only a handful of parameters. A main reason is that we wanted
something easy to estimate and potentially �portable�across products, but yet with enough
richness to be interesting. In Appendix A we report results from a much richer consumer
search model, which more explicitly models the decision of how to search, and which item to
click, before a �nal purchase decision is made. As we discuss in Appendix A, the estimated
model described above can be viewed as a more general demand framework, which captures
some of the key elasticities that a¤ect the platform design using free parameters, while
summarizing many other components of the consumer search process in a reduced form.
The assumptions we have chosen relate fairly closely to some of the classic search models
in the literature. For example, in Stahl�s (1989) model there are two types of consumers:
consumers who (optimally) sample a single o¤er completely at random, and consumers who
sample all the o¤ers. This corresponds to having L 2 f1; jJ jg and = 0. Stahl�s model
has no product di¤erentiation and the pricing equilibrium is in mixed strategies, but it has
very intuitive properties. For instance, if more consumers have L = 1, equilibrium prices are
higher. Consideration set sizes have the same e¤ect in our model with = 0. The same need
not be true with > 0. For instance, suppose that sellers have identical cost and quality
and none are top-rated. As ! 1, consideration sets are selected purely on the basis of
price. Then having L = 1 for all consumers creates perfect Bertrand competition, whereas
if L = jJ j we have a symmetric logit demand model with consequent markups.
There are several obvious directions in which our model can be extended and we have
explored some of them. One is to allow for more heterogeneity among consumers. It might be
interesting to distinguish between price-elastic �searchers�and price-inelastic �convenience�
shoppers, as in Stahl (1989) or Ellison (2005). We also have not focused on search rank. In
their study of a price search engine, Ellison and Ellison (2009) �nd page order, especially
�rst position, to be very important, and it is perceived to be very important in sponsored
search advertising. We have estimated versions of our model that include page order, but
decided not to focus on these versions. One reason is that the e¤ect of page order in our data
21

seems to be far less dramatic than in sponsored search. The estimates also are much harder
to interpret, a signi�cant drawback given the modest increase in explanatory power.17
5 Estimation and Results
5.1 Estimation Sample
To estimate the model, we focus on a single, well-de�ned product: the popular Microsoft
Xbox 360 video game, Halo Reach. This video game is one in a series of Halo video games.
It was released in September 2010. Microsoft originally set an o¢ cial list price of $59.99,
which it shortly dropped to $39.99. We chose this speci�c game because a large number of
units transact on eBay, and because it had a relatively stable supply and demand during our
observation period of Spring-Summer 2011. The prices of many consumer electronics on the
platform exhibit a time trend, usually starting high and falling quickly over the product life
cycle. Others have a range of characteristics that vary across listings, complicating demand
and supply estimation. In fact, 51% of Halo Reach listings share the same title, our proxy
for degree of product homogeneity when we compared products from the A/B experiments
in Section 3. This places Halo Reach at the 82nd percentile for product homogeneity.18
The data for the analysis come directly from eBay and is described in more detail in
Appendix B. They include all listing-level characteristics as well as individual user searches.
We can observe every aspect of the search process, including what the user saw and her
actions. We use data from two periods: the �before�period from April 6 until May 18, 2011,
and the �after� period, which we de�ne to be August 1 until September 20, 2011.19 The
17One reason for this is that, to the extent that rank and price are correlated, it is somewhat challengingto identify the two terms separately. Another issue is that pages tend to include many non-targeted items(accessories, etc.) as well as auctions, which makes for many complicated modeling decisions in terms ofwhether to include absolute rank, or relative rank among targeted listings, or some mixture of the two.18The Halo Reach viedo game is a farily homogenous product. It would have been interesting to compare
and contrast results from this product against a less homogeneous product, but once a product becomesheterogeneous the challenge faced by the platform immediately translates to a challenge faced by the re-searcher: to identify the set of listings who would be classi�ed as such a product. Instead, we therefore usethe counterfactual exercise as way to qunatitatively assess the tradeo¤.19As before, we drop July 2-31, 2011, when the product page was the default because our descriptive
analysis in Section 3 suggested that price adjustment did not happen immediately and we want to use anequilibrium model for prediction. The predictive �t is similar for demand if we include July, and a bit worsefor pricing.
22

search data consist of all visits to the Halo Reach product page as well as all visits to the
standard search results page derived from query terms that include the words �xbox� (or
�x-box�), �halo,�and �reach.�This results in 14; 753 visits to the search results page (9; 409
of them in the pre-period) and 6; 733 visits to the product page (18 in the pre-period).20
As search results often include extraneous results while the product page only shows
items that are listed under �Halo Reach�in eBay�s catalog, we identify listings as the Halo
Reach video game if eBay catalogued them as such. We also visually inspected each listing�s
title to verify that the listing is for just the video game. Illustrating the di¢ culty of precisely
�ltering listings, even after we restrict attention to listings catalogued as Halo Reach, we
found that 12% of listings were not Halo Reach-related, and 33% were not the game itself
(e.g., they were accessories). We de�ne �targeted listings�as new Halo Reach items, listed
either with a posted price, or as an auction but with a Buy-It-Now price.21 The non-targeted
�xed price listings are those that appear in search results but do not meet our de�nition of
targeted because they are used items or are not the Halo Reach video game itself.
Finally, as mentioned earlier, sellers are allowed to change a listing�s price even after
it has been listed. When this happens, we always observe whether there has been a price
change, and we observe the price if there was a transaction, or if a user in our search data
clicked on the item, or if it was the �nal posted price of the listing. This leaves a relatively
small number of cases where we have a listing for which we know the price was changed but
do not observe the exact price because the listing was ignored during this period.22
5.2 Descriptive Statistics
Table 2 reports summary statistics for the before and after periods. The numbers of sellers
and listings are slightly lower in the after period, and more of the listings come from top-
rated sellers. These di¤erences, particularly the increase in top-rated seller listings, could
20The �product page�in the pre-period was more rudimentary than one introduced on May 19 (see footnote6), and relatively few people navigated to it.21According to eBay, �new�items must be unopened and usually still have the manufacturer�s sealing or
original shrink wrap. The auction listings with a Buy-It-Now price have a posted price that is available untilthe �rst bid has been made. We only consider these listings during the period prior to the �rst bid.22For 89% of the targeted listings in the data, the price is never missing. For the remaining 11% the price
is missing during some of the time in which they are active. We use these listings for estimation when theirprices are known, but drop them from the analysis when the price is unknown.
23
be a consequence of the platform change. In addition, the mean and median list prices both
drop by about $2 in the after period, which is consistent with the earlier results on a broader
set of products in Section 3, and with the hypothesis that competitive pressure increased
after the platform change.
Table 2 also reports our measure of item quality, which relies on eBay�s internal rankings
of listings that enters the Best Match algorithm. eBay assigns each listing a score, which does
not depend on price, that is intended to re�ect how attractive the listing is to consumers.
While we do not observe the score directly, we infer it from the frequency with which a
listing appears in Best Match search results when it is active on the site. As the Best Match
algorithm samples listings onto the page without replacement, we use Wallenius�non-central
hypergeometric distribution, just as we speci�ed in our model, to estimate a listing�s Best
Match score.23 We are only able to estimate quality for listings appearing in the before
period,24 which (as discussed below) further motivates our use of only before period data
in estimating the demand parameters. The scores are only identi�ed up to a scalar, so we
normalize them to be between 0 and 1. As reported in Table 2, the median listing has
extremely low quality while the mean quality is an order of magnitude larger, though still
small relative to the best listing�s quality. The quality distribution is highly right skewed
with a small number of listings at much higher quality levels than the rest.
The bottom panel in Table 2 shows statistics on searches. In the before period, listings
appearing in search results were positively selected on quality. Consumers saw lower prices
in the after period, and a larger fraction of searches resulted in purchases of targeted listings
(1.2% compared to 1.0%) and non-targeted listings (2.6% compared to 2.0%). Recall that
in Figure 5, displayed earlier, we already showed that there was a signi�cant increase in the
number of targeted listings consumers saw after a search. We also showed in Figure 5 that
eventual purchasers seem to have had an easier time getting to the point of sale: eventual
23When estimating the listing�s quality, we account for variation in the number of search results on apage. For instance, if listings A and B each appeared in half of their eligible searches, but searches whenlisting A was active led to many more search results on average, we would infer a higher score for listingB. Additionally, solving for all of the listings� scores simultaneously would be computationally infeasible.We therefore make the simpli�cation that each listing is competing for page space with other listings all ofaverage quality. Simulations suggest that this simpli�cation has minimal e¤ect on our estimates.24While there are many searches in the after period that use the Search Results Page (see Table 2), only
few are sorted by Best Match (compared to, say, time ending soonest).
24
purchasers had to click fewer times after the platform change.
5.3 Model Estimates
To estimate the parameters of the model, we use the data on consumer choices and consid-
eration sets to estimate the demand parameters, and then impose an assumption of optimal
pricing to back out the implied marginal costs of each listing. Appendix B provides more
details.
The �rst step is to estimate the consideration set model. We obtain the empirical dis-
tribution of Li (the number of targeted and non-targeted items sampled by a consumer)
directly from the browsing data, and separately for the before and after periods (see Figure
5). We use the browsing data to estimate the sampling weight of each listing in the before
period.25 For the sampling process in the after period, we estimate the sampling parameter
in equation (11) that determines the extent to which cheaper listings are more likely to
enter the results page. We estimate using ordinary least squares (see Appendix B) and
obtain an estimate of 0.80 (with a standard error of 0.14). This implies that a ten percent
reduction in the posted price would, on average, make the listing 27% more likely to be part
of a consumer�s consideration set.
Estimating the demand parameters is straightforward. As described earlier, we have a
standard logit demand with individual-level data and observed individual-speci�c consid-
eration sets. We estimate the demand parameters using maximum likelihood, restricting
attention only to consumer data from the before period. The results appear in the �rst col-
umn of Table 3. The top-rated seller (TRS) indicator is quite important. A top-rated seller
pricing at $37 has an equal probability of transacting as a non-top-rated seller of similar
quality pricing at $35.21. Recall that in the before period, there is no advantage given to
TRS sellers that is analogous to the Buy Box introduced in the search redesign, so this e¤ect
is large. Price also has a very large e¤ect. The price elasticity implied by the estimates is
about -11. It is even higher (closer to -14) for TRS sellers. The pro�t margin implied by
25For the sampling weight, we use all searches in the before period that reached the search results page. Asmall number of these searches were made with customized search preferences (e.g., ordering by time endingsoonest) that meant the results were not displayed according to Best Match.
25

these estimates is about 10%: $2.94 for TRS sellers and $4.20 for other sellers. The degree
of quality di¤erentiation is limited and right-skewed. The di¤erence between the lowest- and
highest-quality listings is equivalent to just $2.67. Finally, we estimate that the average non-
targeted listing is less desirable than the average targeted listing, and non-targeted listings
have a higher degree of horizontal di¤erentiation. This is consistent with the non-targeted
listings including a diversity of products.
The last step is to estimate seller costs. From the seller�s optimization problem,26 we
have:
cj = pj +Djt (pj) =D0jt (pj) ; (15)
where Djt depends on the search process and consumer choices. We use the estimated
demand parameters from the �rst estimation stage, combined with the consideration set
model to obtain estimates of Djt and D0jt for every listing in the �before�period. Then we
use the �rst order condition above to back out the cost cj that rationalizes each listing�s
price as optimal.
The implied cost distribution is presented in Figure 7, which also shows the optimal
pricing functions for both TRS and non-TRS sellers. We estimate a fair amount of dispersion
in seller costs. The 25th percentile of the cost distribution is just slightly under $30; the
75th percentile is just slightly under $40. There are also a considerable number of sellers
who post extremely high prices. Thirteen percent post prices above $50, and �ve percent
post prices above $60! To rationalize these prices, we infer that these most extreme sellers
all have costs about $59.27 We discuss the high price sellers in more detail in Section 6.3.
26As in the example of Section 2, we assume that sellers set prices simultaneously to maximize expectedpro�ts, where the expectations are taken over the all consumers and consideration sets the seller�s item couldbe part of, taking the platform design as given and assuming (as in a Nash Equilibrium) that competingsellers set prices in the same way.27We also investigated whether the implied cost distribution was sensitive to our assumptions about the
consideration set. Interestingly, it is not. Re-estimating the model under the assumption that consumersconsider the entire set of available items leads to a similar cost distribution. This likely re�ects the fact thatprior to the platform redesign, the observed consideration sets are quite representative, in terms of listedprices, of the full set of listings.
26

6 The E¤ect of Search Design
6.1 Changing the Search Design
We �rst use our estimates to assess the introduction of the product page and compare the
model predictions to the data. To do this, we combine our demand and cost estimates
from the before period, with our estimates of the consideration set process from the after
period. We use this combined model to calculate equilibrium prices and expected sales with
the post-redesign search process, assuming that consumer choice behavior and the listing
cost-quality distribution remains unchanged. The results from this exercise are reported in
Table 4, and Figures 8 and 9. In particular, Table 4 shows model-based estimates of optimal
seller margins for scenarios where we impose speci�c e¤ects of the redesign, as well as the
full redesign.
A main e¤ect of the platform change was to make demand more responsive to seller
prices. Figure 8 provides a visual illustration of this change in incentives. It shows the
demand curves from the model, for TRS and non-TRS sellers, for both periods. Demand
became considerably more elastic in the after period, with the largest e¤ect for TRS sellers.
The implication is that seller margins should fall. Comparing the top and bottom rows of the
top panel of Table 4 shows that the median optimal margin fell from $2.94 (or 8% of price)
to $2.46 for TRS sellers, and from $4.20 to $3.23 for non-TRS sellers, implying roughly a
twenty percent fall in pro�t margins.
Several factors may have contributed to the shift in seller incentives. As we showed in
Figure 5, there was a noticeable increase in the size of consideration sets, and buyers had
a much smaller chance of seeing just a single targeted listing. In addition, price became an
important factor in entering the consideration set. With our estimate of = 0:80 for the after
period, a ten percent price reduction increases the odds of appearing in the consideration set
from 0.08 to 0.11, providing sellers with a new incentive to reduce prices. The new platform
also included a �Buy Box�that guaranteed at least one listing from a top-rated seller would
appear in the consideration set. Finally, there was an increase in the number of available
listings, which may or may not have been directly related to the platform change.
To assess the relative importance of these e¤ects, we start with the model from the before
27

period and separately impose the increase in consideration set size, the increase in listings,
the Buy Box, and the increase in . In each case, we compute the new pricing equilibrium.
The middle rows of Table 4 report the median equilibrium margin for TRS and non-TRS
sellers for each of the three scenarios, and also the predicted buyer purchase rate. Making
price a factor in selecting what listings to display (i.e. increasing ) has by far the largest
e¤ect on seller incentives. The increased size of consideration sets, the increase in the number
of sellers, and the introduction of the Buy Box have minimal e¤ects on equilibrium margins.
The increase in purchase rates is driven by making price a factor in forming consideration
sets in combination with the other redesign elements.
In the bottom panel, we evaluate the importance of the supply response in explaining
the increased purchase rates. We implement the four components of the redesign � the
larger consideration sets, the increase in the number of sellers, the Buy Box, and making
price a factor in forming consideration sets �but �x listing prices. We �nd that 62% of the
total e¤ect on purchase rates is driven by the redesign without a price response. Thus, the
remaining 38% comes from the supply response.
These calculations are based on model estimates obtained primarily using the �before�
data. A natural question is whether the model�s predictions for the after period are similar to
the outcomes we actually observe. Figure 9 compares seller prices. It plots the distribution
of prices in the before period (where the model matches the data by construction), and then
both the distribution of prices for the after period predicted by the model, and observed
in the data. The predicted and observed distributions are reasonably close. So at least for
seller prices, the model�s out-of-sample predictions match quite well with what happened.28
Our model�s predictions outperform other reasonable benchmarks. Between the before and
after periods, Amazon prices were remarkably similar on average, dropping only from $37.59
to $37.39, though prices for third-party sellers listing used versions of the game on Amazon
fell from $22.93 to $19.51. We therefore consider three alternative predictions: no price
change, price change equal to the change in Amazon�s list price, and price change equal
28While the estimation of projects platform outcomes onto prices from after the redesign, the correlationbetween prices and probability of appearing in a choice set is a much larger driver of the results than a smallshift in the price distribution. We thus view this use of data from after the redesign as having little e¤ecton how well we �t the price distribution.
28
to the change in Amazon�s third-party used list prices. In all three cases, a Kolmogorov-
Smirnov test of the null hypothesis that the distribution of the predicted prices is the same
as the actual distribution is rejected at the 5% level. On the other hand, when we test our
model�s predicted price distribution, we fail to reject (p-value of 0.13).
It is also possible to compare how well our model predicts other data moments. In the
bottom rows of Table 3 we show the consumer purchase rates of targeted listings predicted
by the model, and those that we observe after the redesign. We predict a sizable increase
(the model predicts 1.47%, which is a bit higher than the 1.23% observed in the data).
Despite modeling the Buy Box without adding parameters to the model, our estimates of
the percentage of targeted purchases coming from the Buy Box listing are very close (the
model predicts 65% compared to the 64% observed in the data). We match some additional
unreported moments fairly well. We predict a large increase in TRS purchase share (44% to
83%) which matches the trend in the data (38% to 65%). We also predict a drop in average
transacted prices ($34.30 to $33.54) similar to the one in the data ($34.56 to $33.30) and
con�rm that the decrease is larger for listings not from top-rated sellers.
6.2 Platform Design and Product Di¤erentiation
Recall that in the simple framework of Section 2, and motivated by the A/B experiment
results reported in Section 3, we discussed how the optimal platform design varies with
product type, especially with the degree of horizontal and vertical di¤erentiation. The
estimated model provides a way for us to obtain a quantitative assessment of these e¤ects
by analyzing how di¤erent platform designs perform empirically across a variety of product
types. Therefore, in this section we use the estimates more broadly (and, consequently, more
out of sample) to consider various ways of reducing search frictions across di¤erent types of
products and to identify the sources of online price markups.
We analyze these factors in Table 5. The Table compares equilibrium outcomes for
variations of the model that di¤er along three dimensions. Across the columns, we vary the
consideration set design. In the �rst and second columns, we consider using quality rank
and price rank to form consideration sets, analogous to the before and after search regimes.
In the third column, we introduce demand weights rank where listings are sampled based
29

on purchase probability. In the last column, we assume that all Halo Reach listings on the
platform enter each consumer�s consideration set. Across the two rows in each panel, we
vary the degree of horizontal product di¤erentiation. The �di¤erentiation�model assumes
the estimated logit demand, in which each seller enjoys some market power. In the �limited
di¤erentiation�model, we assume a nested logit demand structure in which the outside good
and non-targeted listings form one nest and all sellers of targeted listings are part of a second
nest. Speci�cally, the "ij in our logit demand model (9) becomes � iJ + (1� �) "ij, where all
sellers of targeted listings share the same � iJ , whose distribution depends on � (see Berry,
1994). The �limited di¤erentiation�model assumes � = 0:8, which reduces the weight on
the listing-speci�c error and makes the products much less di¤erentiated than the baseline
logit �di¤erentiation� case, which corresponds to � = 0. Across the panels, we vary the
degree of vertical product di¤erentiation. Panel A uses our estimated qualities for the Halo
Reach listings, a relatively homogenous product. Panel B draws qualities from a uniform
distribution with a range 30 times larger than the estimated range for Halo Reach.29
In the eight scenarios in Panel A, we �x the joint distribution of seller costs and quality,
and draw costs and quality for each seller on the platform (assuming 28 sellers, which is the
mean from the after period).30 For the eight scenarios in Panel B, we �x the distribution of
seller costs and draw quality from a uniform distribution over (-15,15). Sellers are assumed to
set prices knowing the assumptions about consumer search and choice behavior, but without
knowledge of the exact realization of opponents�costs and qualities. To solve for equilibrium
prices and markups, we start from the original price distribution and update sellers�prices
one-by-one using their �rst-order conditions with the counterfactual model and the new
price distribution. We continue iterating over sellers until every seller�s �rst-order condition
simultaneously holds.
The results can be used to understand the sources of seller margins and di¤erential
purchase rates. Consider �rst the case with no search costs and limited horizontal and
29We choose to increase the range by a factor of 30 because this matches the degree of vertical di¤erentiationwe estimate for a less homogenous product, the Canon Mark II digital camera, active at the time of theredesign. Most of this product�s listings include additional accessories (an extra lens, a battery pack, etc.),consistent with a large degree of vertical di¤erentiation.30Across all scenarios, we also �x the consideration set size distribution to match the after period and
exclude the Buy Box.
30

vertical di¤erentiation (top right of Panel A). In this scenario, sellers sustain positive margins
because there is some possibility that they have a strictly lower cost than all competing sellers
(as in the incomplete information Bertrand pricing model of Spulber, 1995). The median
markup is less than $1, and the average transaction price is $25. Purchase rates are very
high, as markups are low and users�consideration sets include all available listings.
As we incorporate search frictions through smaller consideration sets (moving from right
to left on the top row), we see that search frictions lead to substantially increased markups
and transaction prices and decreased purchase rates. Listing horizontal di¤erentiation, how-
ever, is an even more potent force for pricing power. For any assumption about search design,
increased seller di¤erentiation leads to higher markups and higher prices.31 Moreover, even
with no search frictions prices are higher than in any of the limited di¤erentiation cases.
Interestingly, once listing di¤erentiation is present, the �price rank�search design actually
leads to more intense price competition than is present with no search frictions. The reason,
of course, is that the (limited) consideration set is selected with signi�cant weight on price,
whereas given a choice set, consumers focus on the idiosyncratic match (the "ij) as well as
price.
For a product with considerable vertical di¤erentiation (Panel B), we reach similar con-
clusions when comparing outcomes between the no search frictions design and the designs
with limited consideration set sizes, albeit we �nd somewhat higher markups for this prod-
uct, supported by the increased di¤erentiation. The main di¤erence we see is that whereas
price rank led to a higher purchase rate for the less vertically di¤erentiated product, qual-
ity and demand rank outperform price rank here. This insight �which is obtained from a
complete model that uses parameter estimated from actual data �is qualitatively similar to
the key insight we obtained in Section 2 from our toy example, where increasing the degree
of vertical di¤erentiation called for a lower weighting of price in determining which product
enters the consideration set.31Purchase rates are not directly comparable across the rows as they come from di¤erent demand systems.
31

6.3 Discussion and Extensions
We considered a number of other permutations of the model. In one exercise, we investigated
how the platform�s choice of how many targeted versus non-targeted listings to include in
the consideration set a¤ects pricing incentives and purchase rates. The platform may want
to have several listings of both types if some consumers are engaging in product search. The
return to replacing a targeted listing with a non-targeted listing depends on how di¤erent
the new listing is compared to the other listings already in the consideration set. In other
words, if the non-targeted listings are relatively homogenous (� � 0), adding another will
not increase purchase rates much. The discussion also potentially relates to the importance
of obfuscation and the ability of the platform to �lter less relevant listings. If the non-
targeted listings show up even for users who specify clear search terms, then better �ltering
might replace some extraneous listings (e.g., iPhone covers or chargers when the search terms
clearly specify the device itself) with more relevant ones.
We �rst assessed the e¤ect of replacing a single targeted listing with a non-targeted
listing. We �nd the purchase rate of targeted listings decreases signi�cantly and the purchase
rate of non-targeted listings increases slightly. The e¤ect on targeted purchase rates is
stronger because most consideration sets already include many non-targeted listings while
many include just one or two targeted listings. We also see minimal e¤ect on seller margins.
We then examined the consequences of a less marginal change by replacing all non-targeted
listings with targeted listings and recomputing the pricing equilibrium. These results are
not reported, but we found the e¤ects were not large, and in fact prices (and margins)
are slightly higher compared to the �after�search regime. This is because having a larger
targeted listing consideration set has two e¤ects. One e¤ect is the increase in competition,
which pushes sellers to lower prices. The second e¤ect is that it becomes easier to enter the
consideration set, reducing the incentive to price low as a way to become visible. The latter
e¤ect (slightly) dominates.
As a second exercise, we also explored at some length a puzzling feature of the data noted
above, namely the presence of very high price listings. This phenomenon is not speci�c to
our data. A cursory glance at many e-commerce websites (eBay, Amazon, etc.) often
32

reveals an upper tail of outrageous prices. Our econometric model rationalizes high prices
by imputing high seller costs, but these high costs alternatively can be viewed as a puzzle. We
found the following calculation illustrative because it separates the issue from the particular
assumptions of our model. Using all the listings in our �before�data (N=270) and ignoring
di¤erences in quality and TRS status, we estimated the probability of sale as a function of
the listing�s posted price.32 We did this �exibly using a local polynomial regression to obtain
the demand estimate shown in Figure 10. The Figure shows that listings priced above $41
� which constitute 35 percent of the listings � sell with virtually zero probability. Using
the same demand curve one can calculate that any price above $41 is dominated by prices
between $35 and $41 provided that cost is less than $34.33 So these sellers, if they are pricing
optimally, must have costs above $34. Yet twenty-�ve percent of the sellers in our data have
posted prices below $34, going as low as 18.95, and presumably even lower costs.
So even abstracting from our speci�c parametric assumptions, it seems di¢ cult to ratio-
nalize high prices without a great deal of cost dispersion or an alternative behavioral model
for high-price sellers. To explore the latter, we looked for seller characteristics that might be
correlated with setting high prices or equivalently having high imputed costs. The results are
in Table 6. Sellers who have been on the platform for more years are less likely to set high
prices. Several measures that might be viewed as proxies for �professionalism�(o¤ering free
shipping and using posted prices) also are negatively correlated with high prices. But the
relationships are rather noisy, and other measures such as being top-rated and being highly
active as a seller are not predictive. Table 6 does show that high-price sellers also have more
Halo Reach listings, suggesting that these sellers may be experimenting or using high-price
listings to frame buyer expectations. However, we �nd little support for these hypotheses:
the multi-listing high-price sellers typically do not also o¤er low price listings, nor do they
change their prices frequently. Therefore, while we view the high-end prices as puzzling,
we lack a neat behavioral explanation, and view our strategy of imputing high costs as a
32As demonstrated with our parametric model, quality di¤erences across Halo Reach listings are minimal.TRS status, however, may strongly a¤ect probability of sale. If we estimate the probability of sale fornon-TRS listings only, we reach the same conclusions.33Recall that given a demand curve D (p) a price p will dominate a price p0 > p for a seller with cost c so
long aspD(p)�p0D(p0)D(p)�D(p0) > c.
33

reasonable solution for our current purposes.
7 Conclusion
This paper has explored the role of platform design in online markets, emphasizing the trade-
o¤ between reducing search frictions by matching buyers to their most desired products and
intensifying price competition among sellers. We began with a stylized theoretical framework
that illustrated the trade-o¤, and then used a particular episode of a platform redesign at
eBay to examine this trade-o¤ empirically. We presented descriptive evidence pointing to
the impact of the platform design on both consumer and seller pricing behavior, and used
results from an experiment run by eBay to show that the impact of the platform design
varies quite considerably across product categories that cover more versus less homogeneous
sets of products.
The descriptive evidence also highlighted the distinction between short-run and longer-
run e¤ects of platform design changes, and the potential for equilibrium e¤ects that a smaller-
scale A/B experiment may miss. In the last part of the paper, we therefore developed a
complete equilibrium model and estimated it on a narrow, yet well de�ned product cate-
gory, where we can quantitatively assess the platform design trade-o¤ using counterfactual
exercises.
Of course, our analysis is narrow, in the sense that we focused on speci�c product markets,
where products vary only in price and quality. Yet, the broader lesson that we draw from
our analysis regards the importance of the platform design in a¤ecting not only consumer
behavior and reducing their search frictions, but also in a¤ecting sellers� decisions. Our
analysis focused on price, but similar forces would be at play for other product attributes
that can be changed in the short run, such as service quality or information disclosure. We
view our work as an initial step. With the increasing importance of internet platforms, such
as eBay, Amazon, Uber, and Airbnb, to the overall economy, we think that further studies
that would assess the e¢ ciency of di¤erent platform designs in a variety of contexts is a
promising direction for further work.
34

References
Backus, Matthew, and Gregory Lewis (2016). �Dynamic Demand Estimation in AuctionMarkets.�NBER Working Paper No. 22375.
Bailey, Joseph (1998). �Intermediation and Electronic Markets: Aggregation and Pricingin Internet Commerce.�Ph.D. Thesis, Massachusetts Institute of Technology.
Baye, Michael R., and John Morgan (2001). �Information Gatekeepers on the Internet andthe Competitiveness of Homogeneous Product Markets.�American Economic Review91(3), 454-474.
Baye, Michael R., John Morgan, and Patrick Scholten (2004). �Price Dispersion in theSmall and the Large: Evidence from an Internet Price Comparison Site.�Journal ofIndustrial Economics 52(4), 463-496.
Berry, Steven T. (1994). �Estimating Discrete-Choice Models of Product Di¤erentiation.�RAND Journal of Economics 25(2), 242-262.
Chen, Yuxin, and Song Yao (forthcoming). �Sequential Search with Re�nement: Modeland Application with Click-Stream Data.�Management Science, forthcoming.
Einav, Liran, Dan Knoep�e, Jonathan Levin and Neel Sundaresan (2014). �Sales Taxesand Internet Commerce.�American Economic Review 114(1), 1-26.
Einav, Liran, Theresa Kuchler, Jonathan Levin, and Neel Sundaresan (2015). �Assess-ing Sales Strategies in Online Markets Using Matched Listings.�American EconomicJournals: Microeconomics 7(2), 215-247
Ellison, Glenn (2005). �A Model of Add-On Pricing.�Quarterly Journal of Economics120(2), 585-637.
Ellison, Glenn, and Sara F. Ellison (2009). �Search, Obfuscation, and Price Elasticities onthe Internet.�Econometrica 77(2), 427-452.
Ellison, Glenn, and Sara F. Ellison (2014). �Match Quality, Search, and the Internet Marketfor Used Books.�MIT Working Paper.
Ellison, Glenn, and Alexander Wolitzky (2012). �A Search Cost Model of Obfuscation.�RAND Journal of Economics 43(3), 417-441.
Fradkin, Andrey (2014). �Search Frictions and the Design of Online Marketplaces.�Stan-ford Working Paper.
Gabaix, Xavier, and David Laibson (2006). �Shrouded Attributes, Consumer Myopia andInformation Suppression in Competitive Markets.�Quarterly Journal of Economics121(2), 505-540.
Goeree, Michelle (2008). �Limited Information and Advertising in the U.S. Personal Com-puter Industry.�Econometrica 76(5), 1017-1074.
35

Hong, Han, and Matthew Shum (2006). �Using Price Distributions to Estimate SearchCosts.�RAND Journal of Economics 37(3), 257-275.
Honka, Elisabeth, Ali Hortacsu, and Maria Ana Vitorino (2014). �Advertising, ConsumerAwareness and Choice: Evidence from the U.S. Banking Industry.�Mimeo, Universityof Chicago.
Hortacsu, Ali, Babur De los Santos, and Matthijs Wildenbeest (2012). �Testing Models ofConsumer Search using Data on Web Browsing and Purchasing Behavior.�AmericanEconomic Review 102(6), 2955-2980.
Hortacsu, Ali, and Chad Syverson (2004). �Product Di¤erentiation, Search Costs andCompetition in the Mutual Fund Industry: A Case Study of the S&P 500 Index Funds.�Quarterly Journal of Economics 119(2), 403-456.
Horton, John (2014). �Misdirected Search E¤ort in a Matching Market: Causes, Conse-quences and a Partial Solution.�NYU Working Paper.
Kim, Jun P., Paulo Albuquerque, and Bart J. Bronnenberg (2010). �Online Demand underLimited Consumer Search.�Marketing Science 29(6), 1001-1023.
Lewis, Gregory and Albert Wang (2013). �Who Bene�ts from Improved Search in PlatformMarkets?�Harvard Working Paper.
Malmendier, Ulrike, and Young Han Lee (2011). �The Bidder�s Curse.�American EconomicReview 101(2), 749-787.
Smith, Michael, and Erik Brynjolfsson (2001). �Consumer Decision-Making at an InternetShopbot: Brand Still Matters.�Journal of Industrial Economics 49(4), 541-558.
Spulber, Daniel F. (1995). �Bertrand Competition when Rivals� Costs are Unknown.�Journal of Industrial Economics 43(1), 1-11.
Stahl, Dale (1989). �Oligopolistic Pricing with Sequential Consumer Search.�AmericanEconomic Review 79(4), 700-712.
Stigler, George (1961). �The Economics of Information.� Journal of Political Economy69(3), 213-225.
Ursu, Raluca M. (2016). �The Power of Rankings: Quantifying the E¤ect of Rankingson Online Consumer Search and Purchase Decisions.�New York Univesity WorkingPaper.
36

Figure 1: Comparative Statics in Platform Choice
Figure shows seller prices (Panel A), seller ex ante probabilities of being shown (Panel B), and consumer surplus (Panel C) as a function of the platform’s choice of the relative weight (β) on price when determining which product to show users.
Panel A: Seller Prices as a Function of Platform Choice (β)
Panel B: Seller Probabilities of Appearing as a Function of Platform Choice (β)
Panel C: Consumer Surplus as a Function of Platform Choice (β)

Figure 2: Optimal Platform Choice
Figure shows β*, the platform’s choice of the relative weight to put on price that maximizes consumer surplus, as a function of consumers’ price sensitivity in demand (Panel A), the cost of the higher-quality product (Panel B), the quality difference between the products (Panel C), and the platform’s noise in observing quality (Panel D). Parameters are fixed at α=0.5, q=1, c=0.5q, and σ=1 unless they are the parameter being varied for the comparative static.
Panel A: β* as a Function of α Panel B: β* as a Function of c
Panel C: β* as a Function of q Panel D: β* as a Function of σ

Figure 3: Different approaches to platform design
Figure shows search results following a query for “playstation 3” on Craigslist (top), Google Shopping (middle), and Amazon (bottom).
Crai
gslis
t
Goo
gle
Shop
ping
Amaz
on

Figure 4: eBay’s platform re-design
Figure shows the change in eBay’s presentation of search results. The top panel shows eBay’s Best Match results. Thebottom panel shows a product page, with listings ordered by sales format and price.

Figure 5: Change in Size of Consideration Set
Figure shows changes in browsing experience between the Before (4/6/11-5/18/11) and After (8/1/11-9/20/11) periods. Top panel shows distributions of the size of the targeted consideration set, LJ - that is,the number of targeted items shown on the search results page (the default in the “Before” period) orthe product page (the default in the “After” period) – for Halo Reach listings. For users that visitedmultiple pages, the consideration set includes all listings on the pages. Bottom panel plots thedistribution of clicks per search session prior to eventual purchase of a targeted (i.e. new, fixed price)Halo Reach listing. A click counts if it led to eBay loading a page, and counting starts from the first "HaloReach" search event.

Figure 6: A/B Experiment
Figure shows results of the A/B experiment on transacted prices (Panel A) and transacted quantities (Panel B). Each point is an eBay product. The sample is restricted to products with at least 1,000 visits to its product page and at least 20 total purchases in the experiment. The y-axis is the percentage change in prices/quantities comparing users given the Best Match default to users given the Product Pages default. The x-axis is the share of listings of the product that use the most common (i.e., suggested) listing title.
Panel A: Effect on Price (%) by Share of Most Common Title
Panel B: Effect on Quantity Sold (%) by Share of Most Common Title

Figure 7: Implied Cost Distribution
Figure shows the distribution of seller costs imputed from the observed prices and the sellers’ first ordercondition. This cost distribution is assumed to remain the same after the platform re-design, and is heldfixed in the counterfactual exercises. The dashed black line shows the cost distribution of TRS sellers; thesolid black line is non-TRS sellers. The optimal mark-ups associated with each level of cost, given ourdemand estimates, are presented by the gray lines for TRS and non-TRS.

Figure 8: Estimated Demand Curves
Figure plots demand curves based on our model estimates. The x-axis is the per-search probability of beingtransacted, which is the probability of appearing in the consideration set multiplied by the probability ofbeing transacted conditional on being in the consideration set.

Figure 9: Observed and Predicted Price Distributions
Figure shows distributions of posted prices from the Before (4/6/11-5/18/11) and After (8/1/11-9/20/11)periods, and the predicted price distribution for the after period based on our estimated model. Note thatthe model is estimated using only before data (except for the use of the after data to estimate the size ofthe consideration set and parameter γ).

Figure 10: Non-Parametric Plot of Listing Demand
Figure shows the probability of sale for listings in the before period, estimated using a local polynomialregression plotted against listing price. The sample size is N=270 listings.

Table 1: Category-Level Effects of the Platform Re-Design
Table presents statistics at the category level before and after the product page introduction. The Beforeperiod spans 4/6/11-5/18/11; the After period spans 8/1/11-9/20/11. For each category we choose the 10products that appeared most often in search results during the week before July 2, and report statistics basedon a weighted average across these 10 products. To calculate the price percentiles of bought items: for eachpurchase, we find all the listings that were available at the time of purchase, and use the percentile in thisdistribution. We note that we use eBay’s classification of listings to product identifiers. In some cases (mostcommonly in the context of cell phones, accessories get classified as the product itself, leading to what mayappear as large price dispersion, which more likely reflects product misclassification).

Table 2: Halo Reach Estimation Sample – Summary Statistics
The first panel uses listing-level data. The second panel uses search-level data. Targeted listings are considered tobe the correct product if they are listed with the Halo Reach product code and inspection of their title indicates thatthe listing is not for an accessory. "TRS" refers to top-rated sellers, an eBay designation that depends on a seller'svolume and feedback.

Table 3: Estimation Results
Estimates of demand model parameters use data from the “before” period only (estimated standard errors inparentheses). The remaining statistics are calculated from these estimates. The implied price elasticities and pricingpredictions for the “after” period use browsing data from the “after” period as described in the main text. The HaloReach and Other purchase rates are defined as the shares of relevant search queries that end up transacting in atargeted (new, fixed price) Halo Reach listing or other listing, respectively. The Buy Box purchase rates are thepercentage of Halo Reach purchases that came from the Buy Box listing.

Table 4: Components of the Platform Re-Design
The top and bottom rows of the “Implementing the Platform Change” panel report the margins and purchase rateof targeted listings from the estimated model, as shown in Table 3. The middle rows break down the effect of theplatform change by starting from the before parameters and separately increasing consideration sets, addingadditional sellers, introducing a Buy Box that samples a TRS listing, and increasing price-dependence in the search.The “Implementing the Platform Change without Price Changes” panel estimates the effect of the platform changeon purchase rates while keeping the prices at the before levels.

Table 5: The Impact of Search Frictions
Panel A uses the estimated quality distribution from the Halo Reach product used in estimation. Panel Bconsiders a hypothetical product with 30 times the dispersion in quality of Halo Reach. The labels "SellerDifferentiation" and “Limited Seller Differentiation" refer to whether we include a seller-specific logit errorfor targeted listings. The version with differentiation keeps the error, while the “Limited Differentiation”specification assumes a nested logit model in which all “targeted listings” are in the same nest and thenested logit σ parameter is set to 0.8. Each column refers to a different platform design: Quality Rank (the“Before” regime), Price Rank (the “After” regime), a counterfactual regime with Demand Weights Rank, anda counterfactual regime in which consumers are shown the entire set of targeted listings available on theplatform.
Panel A: Using Estimated Quality
Panel B: Using Quality with 30x the Dispersion of Estimated Quality
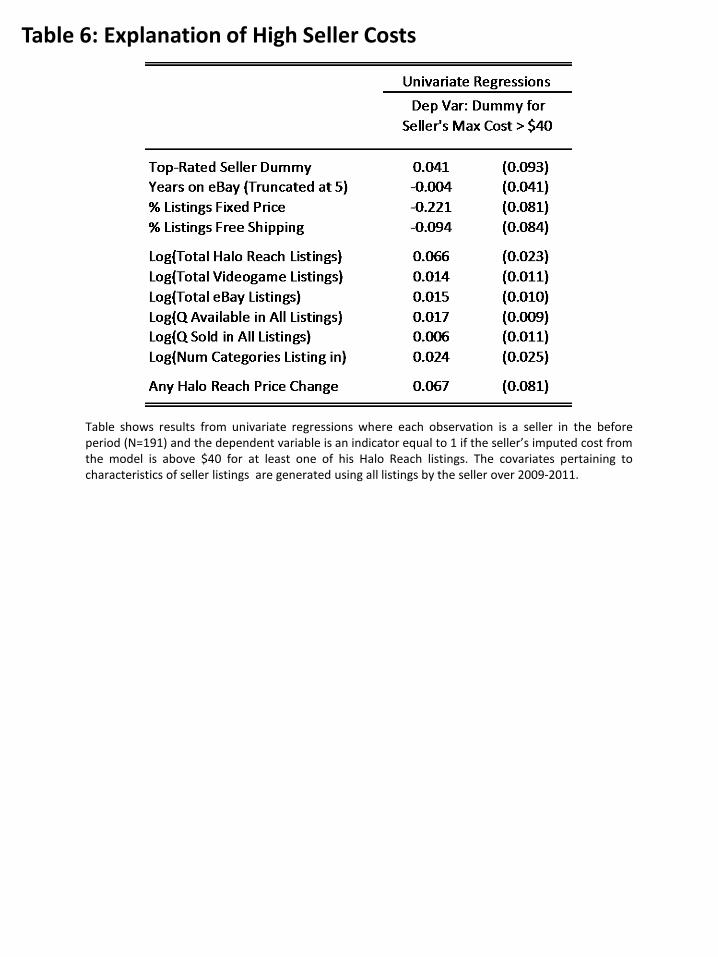
Table 6: Explanation of High Seller Costs
Table shows results from univariate regressions where each observation is a seller in the beforeperiod (N=191) and the dependent variable is an indicator equal to 1 if the seller’s imputed cost fromthe model is above $40 for at least one of his Halo Reach listings. The covariates pertaining tocharacteristics of seller listings are generated using all listings by the seller over 2009-2011.

Appendix: not for publication
0

Appendix A: Complete Search and Platform Model
In this appendix, we develop and estimate a more complete model than the version presentedin the main text. This more complete version more explicitly models the sequential searchprocess where the user speci�es a search strategy as a function of her preferences, decideswhich listings to click on to acquire additional information, and decides which of the clickeditems to purchase, if any.1 We conclude this appendix by discussing how the model andits estimates relate to the baseline model we use in the main text, and why this simpli�edapproach should capture the most important aspects of the platform design in our empiricalcontext.
A.1 Setting
The role of the eBay platform. When a user i makes a search on eBay, she receivessearch results that typically include multiple, often-related products. As in the main text,we focus on searches for Halo Reach, but consider all possible search results We grouplistings into three product types, indexed by k: listings unrelated to Halo Reach (k = 1),Halo Reach accessories or used games (k = 2), and new, �xed price listings for the HaloReach (HR) video game (k = 3). As usual, we also index by k = 0 the outside optionof not purchasing a �xed price listing.2 We refer to product type k = 3 as the targetedproduct. Let Li = (Li0; Li1; Li2; Li3)0 be a vector of the number of listings of each producttype considered by user i. We normalize Li0 = 1 8i. In the next section we specify a nesteddemand structure that allows for correlated preferences across these product types.The platform o¤ers user i two search options, indexed by s: a �Search Results Page�
(s = 0) or a �Product Page�(s = 1). The options correspond to eBay�s most common waysof presenting search results and we borrow eBay�s labels. The search options di¤er alongtwo dimensions. First, user i draws the size of consideration set by product type, Li, from adistribution FLs which may di¤er by search option s. Loosely, the �Product Page�will o¤ermore targeted products while the �Search Results Page�will o¤er more listings from theother product types. Second, in �lling the Li3 positions on the page, the platform samplesfrom all listings of the targeted product that are available at the time of the search. Therules for sampling may di¤er across the search options.User i may choose which search option to pursue, depending on her preferences across
product types. The platform sets a default search option and a cost to deviating from thedefault option. As we have maintained throughout the paper, the platform treats all usersidentically from an ex ante perspective. Users, however, may experience di¤erent searchprocesses ex post due to stochastic draws from a common distribution of listings or becauseusers select di¤erent search strategies.The platform thus a¤ects user i�s search process in three ways: (i) by choosing the default
search option and the cost to deviating; (ii) by choosing the distribution of consideration set
1Kim, Albuquerque, and Bronnenberg (2010), Chen and Yao (forthcoming), and Ursu (2016) estimatesequential search models that share many similar features.
2As in the simple model, auction listings are bundled with not purchasing any listing as the outsideoption.
1

size across di¤erent product types; and (iii) by choosing how the targeted product listingsare sampled into the consideration set.
The platform redesign. Before the redesign, the �Search Results Page�(s = 0) wasthe default search option and the cost to deviation was d0. After the redesign, the �ProductPage�(s = 1) blame the default search option and the cost to deviation was d1. The sizeof i�s consideration set, Li, is has changed as well, and we assume that it is drawn from adistribution that is speci�c to the period �before or after �and the search option.For the �Search Results Page,� the targeted product listings are sampled according to
the same process in both periods. The process is identical to how we specify the samplingprocess in the before period in our model in the main text: let Jt be the set of targetedproduct listings that are active at time t, and the we assume that the platform samples Li3listings from Jt without replacement, where each listing j has sampling weight !j. Thisweight may correlate with price but it does not change if a seller decides to change the priceof a given listing.For the �Product Page,�we specify separate sampling processes in line with the empirical
setting. In the before period, listings are sampled according to the same process as for the�Search Results Page.� In the after period, the �Product Page� is now sorted by priceand includes a buy box. The platform places the lowest-priced listings on the page andreserves one spot for the lowest-priced listing from a top-rated seller. Speci�cally, let JTRSt
be the targeted product listings from top-rated sellers that are active at time t. The platformidenti�es the lowest-priced listing in this set and places it in the Buy Box. Then the remainingLi3 � 1 spots on the page are �lled with the lowest Li3 � 1 remaining prices in the set Jt.
A.2 Demand
Utility Speci�cation. User i�s utility from purchasing listing j of type k is given by:
uij = vik + wj + �ij; (16)
where vik is a product type component that may vary across users, wj is a listing component,and �ij is an idiosyncratic preference distributed i.i.d. from a standard normal distributionN(0; 1). We normalize vi0 = 0, and parameterize
vik = �k +Pk
l=1 �ik for k = 1; 2; 3; (17)
with �in � N(0; �2n) This parameterization imposes a particular correlation structure inthe random e¤ects across product types, which seems (to us) natural; for example, it makesproduct type 2 and 3 closer substitutes than product types 1 and 3.For the listing component, we set wj = 0 for all products except those that belong to the
targeted product type (k = 3). For targeted product listings, we parameterize wj as
wj = �1pj + �2TRSj + �3pjTRSj; (18)
where pj is the item�s posted price and TRSj is an indicator equal to one if listing j is listed
2

by a top-rated seller.3
Search Option, Information, and Clicks. User i chooses a search option and theplatform gives her a consideration set with size drawn from the distribution corresponding tothe chosen search option. The user observes her entire consideration set with one exception:she observes her idiosyncratic valuation of a targeted listing j, �ij, with noise. She may thenincur a costly click to learn �ij without noise. Conditional on the listings she observes withoutnoise, the user chooses the one that provides her with the highest level of utility (includingthe outside option). We start by describing the click process and then work backward to thechoice of search options.When the user is given her consideration set by the platform, she only observes a signal
of �ij for listings of the targeted product (k = 3). For other listings, �ij is observed withoutnoise. Denote the signal by �ij and the correlation between �ij and �ij by �. To observe�ij, the user must click on the listing at cost �. Clicking has a dual role: it reveals �ij andis also a necessary action before purchasing listing j. Making clicking a necessary actionbefore purchase parallels the actual process of buying an item on eBay. We treat the BuyBox separately from other listings to account for its more detailed presentation in searchresults and the fact that the user can proceed to purchase the Buy Box listing immediatelyfrom the search results. We model this di¤erence by making the click cost to the Buy Boxequal zero. Finally, because some of the clicks in our data are di¢ cult to rationalize withthe above model, we also introduce click noise by assuming that with probability the usermakes a clicking mistake �clicking when a click was not intended or not clicking when aclick was intended. Including the click noise is not strictly necessary, as extreme draws of �ijcan rationalize any click. But we still include the noise because we think some eBay usersare likely to click unintentionally and because it speeds up our computation considerably byrequiring fewer draws for our maximum simulated likelihood estimation.The user employs an optimal sequential click strategy for up to three costly, intentional
clicks. This restriction on the maximum number of clicks is made for computational tractabil-ity and is consistent with the data, where very few users (0.12%) click on more than 3 targetedlistings during a single browsing session. Let uij be the utility user i derives from purchasinglisting j. Let uij be the utility user i expects to derive from owning listing j prior to clickingon it. For listings of non-targeted products, uij = uij, and let �ui = maxk<2 uij be the utilityof the most preferred non-targeted listing. The user employs the following optimal sequentialclick strategy. First, she �nds the listing of the targeted product with the highest expectedutility. Without loss of generality, denote this listing by j = 1, so the expected utility is ui1.The expected utility from clicking on item 1 is
E(u if click on 1) = E(ui1jui1 > �ui)Prob(ui1 > �ui) + �uiProb(ui1 � �ui)� � (19)
The expected utility from not clicking is �ui. The user clicks if E(u if click on 1) > �ui,or equivalently if the expected gain from the click (E(ui1jui1 > �ui)� �ui)Prob(ui1 > �ui) are
3We note that wj di¤ers from our simple model as it does not include a listing�s quality. This omission is anecessary shortcoming of the more complete model as it requires data from both the before and after periodsfor identi�cation. Our measure of quality is derived from �Best Match� search results, but the platformredesign lowered the number of �Best Match�searches to the point where we are unable to estimate qualityconsistently in the after period.
3

greater than the click cost �. If the click is made, the user observes ui1 and listing 1 is eligibleto be purchased. We use the normality of the errors for a closed-form representation ofE(ui1jui1 > �ui), which depends only on the parameters and �ui� ui1. The user then considerswhether to make a second click, and the process is similar. We rede�ne �ui = maxf �ui; ui1g,and the user �nds the listing of the targeted product with the highest expected utility,excluding all listings that have already received clicks. The user then follows the same ruleas above in deciding whether to click again. The user repeats this process for the third click.With the click process described, we return to the user�s choice of search option: Search
Result Pages (s = 0) or Product Page (s = 1). Let Iis be the expected continuation utilityfrom choosing search option s, which excludes the cost to deviating from the default. Notethat the continuation utility will depend on i�s idiosyncratic preferences across product nests,�ik, such that users with strong preferences for the targeted product will systematically preferthe search option that on average includes more targeted listings in the consideration set(empirically, s = 1).Let �i be an i.i.d. unobserved (to the econometrician) preference for search option 0.
We parameterize �i � N(0; 1). Then in the before period, i chooses s = 0 if and only ifIi0 � Ii1 + d0 > �i. In the after period, i chooses s = 0 if and only if Ii0 � Ii1 � d1 > �i.
A.3 Supply
Our model of supply mirrors the supply side of the model in the main text, except that thesellers now faces consumer demand determined by the more complete model search process.LetG be the cumulative density function over user types (�i1; �i2; �i3; �i). Then total demandfor listing j is Dj(pj; TRSj; wj) =
RiDij(pj; TRSj; !j)dGi, where the arguments are the
listing�s price, whether the seller is a top-rated seller, and the listing�s sampling weight (!j)and Dij(pj; TRSj; !j) is i�s expected demand for listing j, integrated over the distributionof competitor listings and the distributions of consideration sets.For each targeted listing j, we model seller pricing using a standard Nash in prices
assumption. Each seller sets its price to solve
maxpj(pj � cj)Dj(pj; TRSj; !j): (20)
We recover each seller�s marginal cost cj by inverting the �rst-order condition:
cj = pj +
�@Dj
@pj
��1Dj(pj): (21)
A.4 Estimation and Identi�cation
Estimation. We start by estimating the process that forms consideration sets directlyfrom data on search results. We estimate the distribution of consideration set sizes, FLs ,separately for each search option and period as the empirical distribution. To determinewhich targeted listings enter the consideration set, the platform relies on a set of samplingweights, !j (except for the �Product Page�option after the redesign, for which the platformsamples according to price). We estimate the weights !j using the same procedure as in
4

the simple model, which relies only on search results data. We estimate separate weightsfor �Search Results Page�searches (s = 0) before and after the redesign. For the �ProductPage�searches (s = 1) before the redesign, we have insu¢ cient observations so we use theweights from the s = 0 searches.We then estimate the demand parameters plus the cost to deviating from the platform�s
default search option. There are three user decisions within our model: (i) the choice ofsearch strategy; (ii) which listings in the consideration to clicks on; and (iii) which listingsin the consideration set to purchase. We observe each of these decisions in our data. LetKi be i�s observed consideration set. Then for user i we label the observed strategy with si,whether i clicked on listing j 2 Ki with Cij, and whether i purchased listing j 2 Ki withYij.For a given set of demand parameters, we use our model to generate the predicted
probabilities of these decisions. Let Pifs = 0g = �(Ii0 � Ii1 + d0) be the model-predictedprobability that i chooses search option 0, QCij be the model-predicted probability that iclicks on j, and QYij be the model-predicted probability that i chooses j. We estimate Iis, i�sexpected continuation utility from choosing search option s, by simulation. We draw a seriesof consideration sets for each search option and predict i�s click and purchase decisions. Letji be the listing (or outside option) that i bought. Then the likelihood function is
L =Yi
Pifs = 0g1�si(1� Pifs = 0g)si(QYiji)YijiYj
(QCij)Cij(1�QCij)
1�Cij (22)
The 14 parameters to estimate are the product type �xed e¤ects (�1; �2; �3), the vari-ances of the random e¤ects (�21; �
22; �
23), the coe¢ cients on targeted listings�characteristics
(�1; �2; �3), the correlation of the signal with the idiosyncratic listing-speci�c preference (�),the cost of an intentional click (�), the probability of a click mistake ( ), and the costs todeviating from the default search strategy (d0; d1). We estimate using maximum simulatedlikelihood where we simulate from the distributions of the random e¤ects (�ik), the signal(�ij), and the listing-speci�c preference term (�ij).Once we have the demand estimates, we estimate a seller�s expected demand by simulat-
ing sets of competitors (both set size and members of the set), consideration sets, and users.We draw the set of competitors from a smoothed empirical distribution of prices. We thenrecover seller costs by inverting the estimated �rst-order conditions.
Identi�cation. The seller costs are identi�ed from an optimal price setting assumption.We thus focus on identi�cation of the demand and platform parameters. The product type�xed e¤ects (�1; �2; �3) are identi�ed by the relative purchase probabilities of listings ofdi¤erent product types. The coe¢ cients on the targeted product characteristics (�1; �2; �3)are identi�ed by how purchase probabilities vary across new, �xed price Halo Reach listingsdepending on their prices and whether they are sold by TRS. The variances of the randome¤ects (�21; �
22; �
23) are identi�ed by how purchase probabilities of listings in di¤erent nests
vary as the number of listings in each nest changes in di¤erent searches. Users with a strongpreference for listings in a speci�c nest may select into di¤erent search strategies, but thisselection depends on an expectation about which search results she will receive, not theconsideration set that is actually realized. We therefore have residual exogenous variation in
5

the number of listings from each nest, even conditional on selection into a search strategy,and this variation allows us to identify the variances of the random e¤ects.Identifying parameters related to the click process is more complicated. Because we
speci�ed a sequential search process where the choice of making intentional clicks dependson the same characteristics that a¤ect utility from purchase, di¤erences between observedclick patterns and observed purchase patterns conditional on click are rationalized as clickmistakes. For instance, in the data we see no purchases of very high-priced listings eventhough they occasionally appear in search results. Thus, the extent to which users click onthese listings identi�es the probability of making a click mistake.The number of clicks we see is informative about the click cost and the correlation of
the signal with the true idiosyncratic preference. Few clicks could be indicative of a highclick cost or that clicking reveals little new information about a listing. To separate thesecomponents, we rely on two sources of variation: the order of clicks and the introduction ofthe Buy Box in the after period. If we observe that users��rst clicks are more likely to goto listings based on their observable characteristics (price, TRS) than the logit probabilitieswould imply, then we would infer that the signal is not very informative about the trueidiosyncratic preference.The Buy Box does not require a costly click and already has all of its information dis-
played. Conditional on the user making a purchase, if we see that the lowest-priced TRSlisting on the page has a higher market share in the after period than the before period,our model attributes this to not having to incur a click cost or better information about thelisting. But even in the before period when users only see a signal of the lowest-priced TRSlisting�s value, in expectation this signal is the same as the true value. Thus, conditionalon making a purchase, the lowest-priced TRS listing should not capture more market sharein the after period if the value to the click is learning about the listing�s value. Therefore,the observed change in market share for this listing type identi�es the click cost. We notethat because having the Buy Box is so helpful for identifying this click process, our ability toidentify the complete model using only data from the before period, as we do for the simplermodel in the main text, is limited.Finally, the costs to deviating from the default search strategies relate to the fraction of
users who end up on the default search page, combined with the exogenous change to whichpage is the default. For instance, in the before period nearly all users see �Search ResultsPages,� implying a very large cost to deviating. In the after period, users are split moreevenly across the two page types; hence, we estimate a smaller cost to deviating from thedefault.
A.5 Estimates
We present the estimates of the demand and platform parameters from the more complexmodel.
6

Parameter Description Estimate�1 product 1 FE -3.7807�2 product 2 FE -3.2929�3 product 3 FE 4.2683�21 nest 1 RE Variance 0.9329�22 nest 2 RE Variance 0.0164�23 nest 3 RE Variance 1.6000�1 coe¢ cient on price -0.2000�2 coe¢ cient on TRS 2.0764�3 coe¢ cient on price*TRS -0.0442� correlation(signal,�) 0.9998� click cost 1.5454p probability of a click mistake 0.0586d0 search strategy deviation cost, before 3.2461d1 search strategy deviation cost, after -0.1475
As in the simple model, we �nd that price and whether the listing is from a top-ratedseller are important in predicting which targeted listing a user purchases. Compared to $35listing from a non-TRS seller, a TRS seller could price at $37.17 and be purchased at thesame rate. The large price coe¢ cient implies very elastic demand. The implied median priceelasticities are -8 and -11 for non-TRS and TRS sellers.The estimates also imply considerable preference heterogeneity across the di¤erent prod-
uct types. The estimated standard deviations of the random e¤ects on all listings and thetargeted listings are 0.93 and 1.60, respectively (or $4.65 and $8.00 when divided by theprice coe¢ cient). The random e¤ect on Halo Reach-related listings is estimated to be verysmall.As for the click process, we estimate a very large click cost, equivalent to $7.73, but that
clicking reveals essentially no new information about the listing. The estimated correlationbetween the signal and the idiosyncratic valuation is 1. The large click cost is driven bya small number of total clicks and the Buy Box�s high market share. The lowest-pricedTRS listing captured 27% of purchases of targeted listings in the before period and 64%in the after period. The very informative signal is consistent with most (84%) users whopurchased a targeted listing clicking only on the purchased item. The additional clicks can beexplained with minimal noise, and indeed we estimate that click mistakes are rare, occurringfor under 6% of listings. This is unsurprising as click patterns are highly predictable giventhe coe¢ cients on listings characteristics. If we use our estimates of � to rank targetedlistings according to their non-idiosyncratic valuations, 45% of users who click once clickedon the highest ranked listing and 17% clicked on the second highest ranked listing. Just 1%clicked on the lowest ranked listing (conditional on seeing at least four targeted listings).Finally, the estimated cost to deviating from the default search strategy is very large
in the before period and small in the after period. These estimates are consistent with the�Product Pages�being very hard to �nd prior to the platform change while both types ofpages were readily accessible after the platform change. In the before period, just 18 of 9,427searches led to �Product Pages.� In the after period, users were more evenly split betweensearch strategies in the data, as 56% reached �Product Pages.�
7

A.6 Discussion and Relationship to the Baseline Model
There are three main di¤erences between the more complete model and the simpler modelwe use in the main text: the product type de�nition, the click process, and the choice ofsearch strategy. With the above estimated parameters, we �nd that it reduces to a versionsimilar to our simpler model.The �rst di¤erence between the models is that the more complete version allows for
more product types than the simpler model. Product types k = 1 (non-Halo Reach relatedlistings) and k = 2 (Halo Reach accessories) are separate to allow consumers to have di¤erentpreferences for listings closer to the new Halo Reach video game than completely unrelatedlistings. The simpler model, on the other hand, pools these product types into one category.While the more complete model has the �exibility to allow for heterogeneous preferencesacross these product types, the estimates indicate that consumers�purchase patterns do notvary across these product types. We �nd that �1 � �2 and �
22 � 0, and thus the simpler
model captures the relevant product type distinctions.The more complete model also allows for consumers to click on listings to learn more
information about them and as a prerequisite for purchase. Our estimates, however, �ndthat the information acquisition motive does not empirically drive clicking patterns. Weestimate that the signal, observed prior to clicking, already contains all of the informationabout the product: � � 1. Therefore, the only reason to click on an item is because theplatform requires a click before purchase. The click cost, �, can thus be subsumed into theproduct 3 �xed e¤ect, �3, which is included in the baseline model. The exception is that thecomplex model speci�es the Buy Box click as costless. For the simpler model to capture this,we would need to include a separate indicator for the Buy Box in the utility speci�cation.Estimating such a parameter in the simpler model would require using purchase data fromafter the platform change. But as described in the text, our inability to estimate listingquality after the platform change, plus the ability to validate our model predictions usingactual data, lead us to leave out a Buy Box-speci�c parameter. Even with this omission,we still predict a large shift in purchases to the listing in the Buy Box. In our data, thelowest-priced TRS listings accounts for 27% of purchases of the targeted product in thebefore period and 64% in the after period. Our simple model predicts a similar shift, from40% to 65%.Finally, the complex model allows consumers to select between two possible search strate-
gies in each period while the simple model imposes a single search strategy per period. Inthe before period, we estimate that the cost to deviating from the default strategy, d0, is solarge that nearly all users choose the �Search Results Page.�The simple model thus approx-imates the search environment well in the before period. In the after period, we estimate afairly small cost to deviating from the default strategy, d1. This implies that di¤erent userswill select into di¤erent search strategies. Users might choose a speci�c search strategy dueto idiosyncratic preferences over product nests (�i) or idiosyncratic preferences over searchstrategies (�i).Our simple model is a reduced form version that summarizes the sampling process of
the two search strategies with a single sampling process, where a listing�s sampling weight issummarized as a function of the reduced form parameter. This reduced form representationcould distort substitution patterns if it ignores that consumers with di¤erent preferences over
8
product types (�i) will select into pages with di¤erent sampling processes. If the selectionis instead driven by the idiosyncratic preference over search strategies (�i), which is inde-pendent from preferences over product types, then treating consideration sets as exogenousdoes not yield inconsistent estimates of the preference parameters.To evaluate whether such a distortion is large, we assess how much a consumer i might
gain, in expectation, from choosing a speci�c search strategy. The expected gain depends onconsumer i�s preferences over the di¤erent product types but not i�s preference over searchstrategies. For example, a consumer with a strong idiosyncratic preference for the targetedproduct is more likely to have large gains from searching via the �Product Page.�We �nd that consumers choose their search strategy largely based on their idiosyncratic
search strategy preference rather than their product type taste heterogeneity. We simu-late 1,000 consumer types i, where the consumer type is a draw of the distribution of nestrandom e¤ects, and estimate the expected gain from searching via �Search Results Pages�versus �Product Pages� in the after period, Ii0 � Ii1. We �nd that the standard deviationacross consumer types of these estimated gains is 0:10, which is small relative to the standarddeviation of search strategy preferences, set to 1. While the product type preference hetero-geneity is empirically relevant in a¤ecting purchase decisions, both search strategies includemultiple listings from all product types in most of their consideration sets, and thus the gainfrom using one search strategy over another is small. This lack of targeted search is perhapsnot surprising based on the search patterns we see in the data. Under 5% of sessions, andabout 3% of sessions ending in a purchase, included multiple search queries for Halo Reach.Users also rarely clicked beyond the �rst page of search results, with users averaging just1.1 results pages per session. We thus conclude that our reduced form representation, whichtreats consideration sets as exogenous to the consumer, is a reasonable approximation andcaptures the relevant substitution patterns.
Appendix B: Data and Estimation
In this appendix, we provide further details of how we constructed our data samples andestimated our empirical model.
B.1 Data Samples
Product Category Analysis. For the product category analysis presented in Section 3.2,we gathered data from products in the �ve categories a¤ected by the platform redesign inSummer, 2011. For each product as de�ned by eBay�s catalog, we counted the number ofvisits to its product page from 6/27/11 �7/2/11, the week during which the platform redesignbecame fully implemented. Within each product category, we chose the 10 products thathad the highest number of product page visits.4 We also kept a smaller group of products �all iPhone 4 products �as a separate subcategory for comparison.
A/B Experiment. For the A/B experiment results presented in Section 3.3, we col-
4The textbooks category had 10 products, but one of them did not have transactions in the before andafter periods so it is dropped from the analysis.
9

lected data on all products active during the A/B experiment (6/25/12 � 8/30/12). Werestrict our sample to products with at least 1,000 visits to its product page and at least 20total purchases in the experiment. This left us with 200 di¤erent products.
Estimation Sample. For our empirical model (Section 4, 5, and 6), we focus on a singleproduct, the Halo Reach video game for Xbox 360. The data for the analysis come directlyfrom eBay and cover 4/6/11 �5/18/11 and 8/1/11 �9/20/11. The search data consist of allvisits to the Halo Reach product page as well as all visits to the standard search results pagederived from query terms that include the words �xbox�(or �x-box�), �halo,�and �reach.�We keep searches that lead to at least one click or transaction on any listing following thequery. We keep all search results (listings shown to the user) derived from the user�s lastsearch query. This results in 14; 753 visits to the search results page (9; 409 of them in thepre-period) and 6; 733 visits to the product page (18 in the pre-period).We further drop two types of search results: auctions and listings with missing prices.
Some auction listings have a Buy-It-Now price that lets the user purchase the listing at aposted price. After the �rst auction bid, the posted price is no longer available. We onlydrop the listing after its posted price is no longer available. As mentioned in the text, thereis a special case when we may not observe a listing�s price during a portion of its active timeon the site. If the listing will subsequently have a price change but prior to the change thelisting never receives a click nor is transacted, then we sometimes do not observe its price.In these cases, we drop the listing from the search results during the period when we do notobserve its price.We de�ne the user�s consideration set as all listings that eBay included on the search
results or product page in the user�s search. As discussed in the paper and Appendix A, wedo not distinguish whether listings received clicks or by their placement on the page.For listings that appear in users�consideration sets, we divide them into �targeted�and
�non-targeted�products. Targeted products are new, �xed price (or auction, while a postedprice is available) listings of the Halo Reach video game. We identify listings as the HaloReach video game if eBay catalogues them as such. We further visually inspected eachlisting�s title to verify that the listing is for just the video game. Illustrating the di¢ cultyof precisely �ltering listings, even after we restrict attention to listings catalogued as HaloReach, we found that 12% of listings were not Halo Reach-related, and 33% were not thegame itself (e.g., they were accessories). The non-targeted products therefore include listingsof used goods, listings catalogued as products other than Halo Reach, or listings cataloguedas Halo Reach but whose titles indicate they are not the video game itself.For the supply model, our sample consists of all listings classi�ed as the targeted product.
B.2 Estimation
Demand. We estimate the consumer demand parameters using maximum likelihood. Foruser i and targeted listing j in i�s consideration set, let QJij be an indicator that equals 1 ifi purchased j. Let QMi be an indicator that equals 1 if i purchased a non-targeted product.LetDi = 1+exp(�+� ln jJMi j)+
Pk2JJi
exp (�0 + �1pk + �2TRSk + �3pkTRSk + �4qk). The
10

likelihood function is:
L =Yi
�1
Di
�1�QMi �Pk2JJiQJik�exp(� + � ln jJMi j)
Di
�QMi Yj
�exp
��0 + �1pj + �2TRSj+�3pjTRSj + �4qj
�=Di
�QJij(23)
The likelihood only depends on observables and parameters, with one exception: a list-ing�s quality, qj. We describe at the end of the next section how we recover quality.
Platform. From the search estimation sample, we recover the joint empirical distributionof the number of targeted and non-targeted listings in a consideration set, L = (LJ ; LM).We estimate separate distributions for the before and after periods.From the search estimation sample, we construct the empirical sampling probability, vj,
for each targeted listing j, separately for the before and after periods. From the eBay data,we calculate vj as the percentage of searches made while j was active on the eBay site inwhich j appeared in the consideration set (in the search results). For each listing j wealso calculate the percentage of searches made while j was active on the eBay site that hadconsideration set size l: vlj.The platform forms consideration sets by sampling LJi products from J J
i , without re-placement. Listings are sampled according to their heterogeneous sampling weights, !j. Thisimplies that the consideration set of targeted listings is drawn from a Wallenius�non-centralhypergeometric distribution. The probability any given listing is drawn into the considera-tion set depends on the sampling weights of all competing listings. Estimating the full vectorof sampling weights is computationally intractable, so we make the simpli�cation that allcompeting listings are of a normalized sampling weight, 1. With this simpli�cation, theprobability that listing j is drawn into a consideration set of size l, with jJJi j � 1 competingtargeted listings is:
al(!j) =
�1
1
��jJJi j � 1l � 1
�Z 1
0
(1� t!j=D)(1� t1=D)l�1dt (24)
where D = jJJi j� l. In the before period, we set jJJi j = 21, and in the after period jJJi j = 28.Using the model-predicted probability that listing j is drawn into a consideration set
of size l, al(!j), we can construct the model-predicted fraction of searches that listing jappears in:
Plmax
l=1 al(!j)vlj. We then solve to �nd the sampling weight, !j, such that the
model-predicted fraction of appearances matches the data:5
vj =
lmaxXl=1
al(!j)vlj: (25)
We follow the same procedure in the before and after periods. In the after period, we
5There are a few listings with vj = 0 or vj = 1. Our model is unable to �nd a unique positive !j torationalize the data. Therefore, for listings with vj = 0, we set !j = mink:0<vk<1 !k, and for listings withvj = 1, we set !j = maxk:0<vk<1 !k.
11

project these weights onto listing prices:
!j = exp
"� pj �mink2J J
i(pk)
stdk2J Ji(pk)
!+ �j
#: (26)
We estimate with the following OLS regression:
ln!j = � � pj
stdk2J Ji(pk)
+ �j (27)
We simulate new consideration sets with the following procedure. First, we determinethe J J
i targeted listings that are on the simulated site for user i. We form a queue oflistings where we sample listings from the full set of listings available in the before or afterperiod. We sample each listing with equal probability except we duplicate multi-unit listingsaccording to their listed quantities. Thus, a listing with two units for sale will appear twiceas frequently in the queue than a single-unit listing, on average. The �rst 21 (before period)or 28 (after period) listings in the queue are active on the simulated site.Second, we draw the consideration set size from the empirical distribution. Third, we
�ll the targeted product positions in the consideration set by sampling from the listingsactive on the simulated site. We sample according to heterogeneous sampling weights, ~!j.
In the before period, ~!j = !j. In the after period, ~!j = exp�� �pj�mink2JJ
i(pk)
stdk2JJ
i(pk)
��. In some
versions of the model, we also include a Buy Box. We model the Buy Box by reserving the�rst position in the consideration set for a listing from a TRS seller. This seller is drawnaccording to the same process, but the set of competing listings is comprised only of otherTRS listings.Once the consideration set is formed for user i, we simulate a purchase decision. We
then reconstruct the simulated site for the next user, i0. If user i purchases one of the
targeted listings, we replace that listing on the simulated site with the next one in thequeue. Otherwise, if user i does not purchase a targeted listing, the set of active listings onthe simulated site is unchanged. Note that unpopular listings are likely to last longer onthe site. We repeat this process for 100 users and then reset the site by drawing an entirelynew queue. This resetting of the site accounts for the feature that some eBay listings expirewithout being purchased.While unrelated to the model of the platform, the estimation of listing j�s quality, qj,
follows a similar procedure. We repeat the process of estimating !j except we use onlysearches from the before period that led to Best Match results (i.e., we exclude results fromtime-ending soonest searches, etc.). Let !BMj be this estimated listing weight. We then setqj = !BMj .
Supply. As detailed in the text, estimating marginal cost cj amounts to estimating theelasticity of demand (�Dj). It is useful to write Dj (pj) =
Plmax
l alj (pj)Qlj (pj)Prl, where
alj (pj) is the probability listing j appears in a consideration set that includes l targetedlistings, Qlj (pj) is the expected probability of transacting given a consideration set size l(where the expectation is taken over di¤erent sets of competitors and di¤erent numbers of
12

non-targeted listings in the consideration set), and Prl is the probability the considerationset will consist of l targeted listings. We estimate Qlj (pj) by simulating 1000 searchers perlisting and forming their consideration sets according to the model of the platform.We estimate @alj(pj)=@pj using the platform model. With the chain rule, we have
@alj(pj)=@pj = (@alj=@ ~wj)(@ ~wj=@pj). In the before period, we have (@ ~wj=@pj) = 0. Inthe after period, (@ ~wj=@pj) = � ~wj. We use the probability mass function for Wallenius�non-central hypergeometric distribution to numerically estimate @alj=@ ~wj.We use the logit formula to get @Qlj(pj)=@pj = (�1 + �3TRSj)Q
lj(pj)(1�Qlj(pj)). With
these components, we can then estimate �Dj and back out cj.
Counterfactuals. The counterfactuals alter components of the platform design, thedistribution of listing quality, or the substitution patterns across targeted listings. Thecounterfactuals are largely self-explanatory with two exceptions. For the third column ofTable 5, we construct consideration sets with �Demand Weight Rank.�We seek to includeboth price and quality as determinants of a listing�s sampling weight. We construct thesampling probability as:
~!j = exp
"� pj �mink2J J
i(pk)� j�4=�1jqj
stdk2J Ji(pk)
!#(28)
For Table 5, Panel B, we increase the degree of quality di¤erentiation. To do so, we drawnew listing quality, qj, from a Uniform[-15,15] distribution and set sampling weights for thebefore period to ~!j = qj + 15.
13