Consumer Price Index - March 2018 · -3-Food The food index rose 0.1 percent in March after being...
38
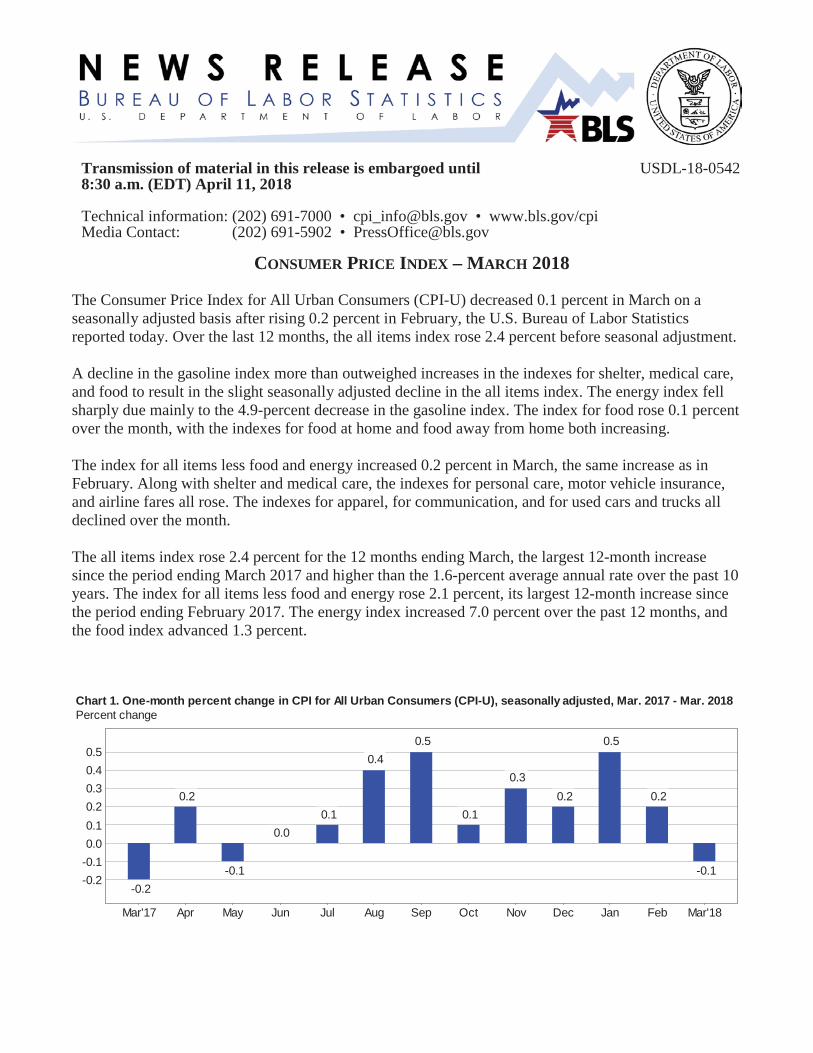
Transmission of material in this release is embargoed until USDL-18-0542 8:30 a.m. (EDT) April 11, 2018 Technical information: (202) 691-7000 • [email protected] • www.bls.gov/cpi Media Contact: (202) 691-5902 • [email protected] CONSUMER PRICE INDEX –MARCH 2018 The Consumer Price Index for All Urban Consumers (CPI-U) decreased 0.1 percent in March on a seasonally adjusted basis after rising 0.2 percent in February, the U.S. Bureau of Labor Statistics reported today. Over the last 12 months, the all items index rose 2.4 percent before seasonal adjustment. A decline in the gasoline index more than outweighed increases in the indexes for shelter, medical care, and food to result in the slight seasonally adjusted decline in the all items index. The energy index fell sharply due mainly to the 4.9-percent decrease in the gasoline index. The index for food rose 0.1 percent over the month, with the indexes for food at home and food away from home both increasing. The index for all items less food and energy increased 0.2 percent in March, the same increase as in February. Along with shelter and medical care, the indexes for personal care, motor vehicle insurance, and airline fares all rose. The indexes for apparel, for communication, and for used cars and trucks all declined over the month. The all items index rose 2.4 percent for the 12 months ending March, the largest 12-month increase since the period ending March 2017 and higher than the 1.6-percent average annual rate over the past 10 years. The index for all items less food and energy rose 2.1 percent, its largest 12-month increase since the period ending February 2017. The energy index increased 7.0 percent over the past 12 months, and the food index advanced 1.3 percent. -0.2 -0.1 0.0 0.1 0.2 0.3 0.4 0.5 Mar'17 Apr May Jun Jul Aug Sep Oct Nov Dec Jan Feb Mar'18 Chart 1. One-month percent change in CPI for All Urban Consumers (CPI-U), seasonally adjusted, Mar. 2017 - Mar. 2018 Percent change -0.2 0.2 -0.1 0.0 0.1 0.4 0.5 0.1 0.3 0.2 0.5 0.2 -0.1
-
Upload
hoangthuan -
Category
Documents
-
view
214 -
download
0
Transcript of Consumer Price Index - March 2018 · -3-Food The food index rose 0.1 percent in March after being...
Transmission of material in this release is embargoed until USDL-18-05428:30 a.m. (EDT) April 11, 2018
Technical information: (202) 691-7000 • [email protected] • www.bls.gov/cpiMedia Contact: (202) 691-5902 • [email protected]
CONSUMER PRICE INDEX – MARCH 2018
The Consumer Price Index for All Urban Consumers (CPI-U) decreased 0.1 percent in March on a seasonally adjusted basis after rising 0.2 percent in February, the U.S. Bureau of Labor Statistics reported today. Over the last 12 months, the all items index rose 2.4 percent before seasonal adjustment.
A decline in the gasoline index more than outweighed increases in the indexes for shelter, medical care, and food to result in the slight seasonally adjusted decline in the all items index. The energy index fell sharply due mainly to the 4.9-percent decrease in the gasoline index. The index for food rose 0.1 percentover the month, with the indexes for food at home and food away from home both increasing.
The index for all items less food and energy increased 0.2 percent in March, the same increase as in February. Along with shelter and medical care, the indexes for personal care, motor vehicle insurance, and airline fares all rose. The indexes for apparel, for communication, and for used cars and trucks all declined over the month.
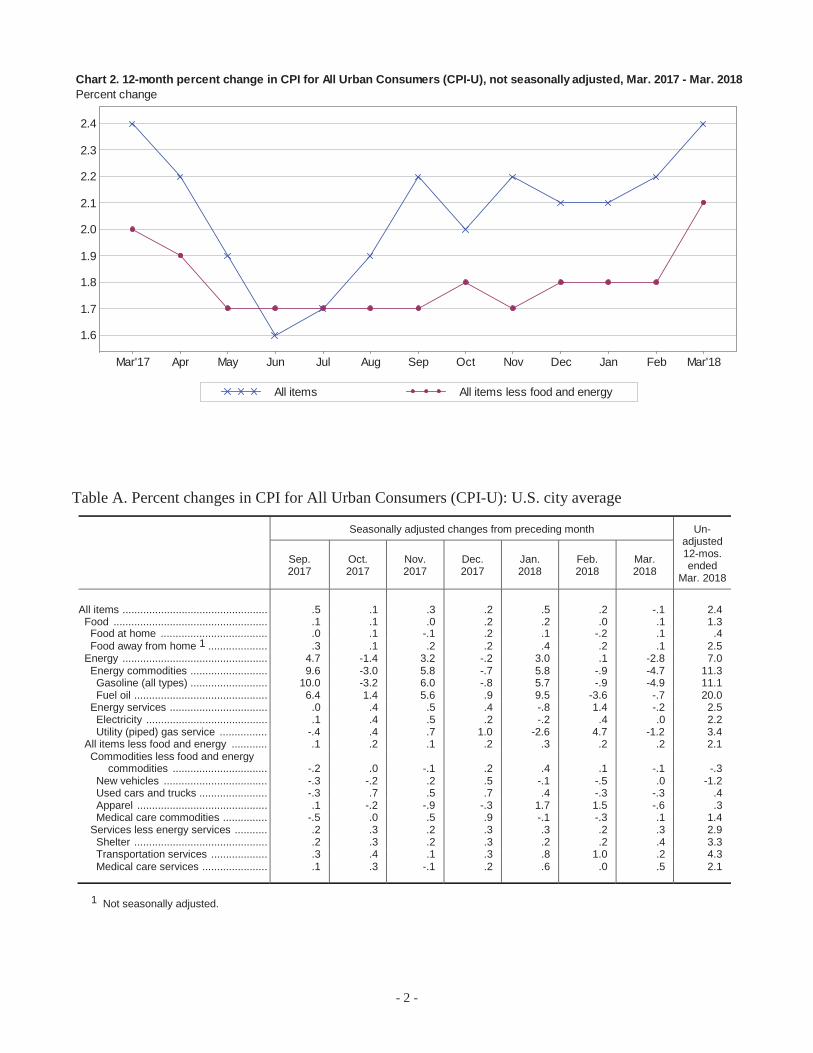
The all items index rose 2.4 percent for the 12 months ending March, the largest 12-month increase since the period ending March 2017 and higher than the 1.6-percent average annual rate over the past 10 years. The index for all items less food and energy rose 2.1 percent, its largest 12-month increase since the period ending February 2017. The energy index increased 7.0 percent over the past 12 months, and the food index advanced 1.3 percent.
-0.2-0.10.00.10.20.30.40.5
Mar'17 Apr May Jun Jul Aug Sep Oct Nov Dec Jan Feb Mar'18
Chart 1. One-month percent change in CPI for All Urban Consumers (CPI-U), seasonally adjusted, Mar. 2017 - Mar. 2018Percent change
-0.2
0.2
-0.1
0.0 0.1
0.4 0.5
0.1
0.3 0.2
0.5
0.2
-0.1
- 2 -
Table A. Percent changes in CPI for All Urban Consumers (CPI-U): U.S. city average
Seasonally adjusted changes from preceding month Un-adjusted 12-mos. ended
Mar. 2018
Sep. 2017
Oct. 2017
Nov. 2017
Dec. 2017
Jan. 2018
Feb. 2018
Mar. 2018
All items ................................................. .5 .1 .3 .2 .5 .2 -.1 2.4Food .................................................... .1 .1 .0 .2 .2 .0 .1 1.3Food at home .................................... .0 .1 -.1 .2 .1 -.2 .1 .4Food away from home 1 .................... .3 .1 .2 .2 .4 .2 .1 2.5
Energy ................................................. 4.7 -1.4 3.2 -.2 3.0 .1 -2.8 7.0Energy commodities .......................... 9.6 -3.0 5.8 -.7 5.8 -.9 -4.7 11.3Gasoline (all types) .......................... 10.0 -3.2 6.0 -.8 5.7 -.9 -4.9 11.1Fuel oil ............................................. 6.4 1.4 5.6 .9 9.5 -3.6 -.7 20.0
Energy services ................................. .0 .4 .5 .4 -.8 1.4 -.2 2.5Electricity ......................................... .1 .4 .5 .2 -.2 .4 .0 2.2Utility (piped) gas service ................ -.4 .4 .7 1.0 -2.6 4.7 -1.2 3.4
All items less food and energy ............ .1 .2 .1 .2 .3 .2 .2 2.1Commodities less food and energy
commodities ................................ -.2 .0 -.1 .2 .4 .1 -.1 -.3New vehicles ................................... -.3 -.2 .2 .5 -.1 -.5 .0 -1.2Used cars and trucks ....................... -.3 .7 .5 .7 .4 -.3 -.3 .4Apparel ............................................ .1 -.2 -.9 -.3 1.7 1.5 -.6 .3Medical care commodities ............... -.5 .0 .5 .9 -.1 -.3 .1 1.4
Services less energy services ........... .2 .3 .2 .3 .3 .2 .3 2.9Shelter ............................................. .2 .3 .2 .3 .2 .2 .4 3.3Transportation services ................... .3 .4 .1 .3 .8 1.0 .2 4.3Medical care services ...................... .1 .3 -.1 .2 .6 .0 .5 2.1
1 Not seasonally adjusted.
1.6
1.7
1.8
1.9
2.0
2.1
2.2
2.3
2.4
Mar'17 Apr May Jun Jul Aug Sep Oct Nov Dec Jan Feb Mar'18
Chart 2. 12-month percent change in CPI for All Urban Consumers (CPI-U), not seasonally adjusted, Mar. 2017 - Mar. 2018Percent change
All items All items less food and energy

- 3 -
Food
The food index rose 0.1 percent in March after being unchanged in February. The index for food away from home increased 0.1 percent in March. The index for food at home also increased 0.1 percent as four of the six major grocery store food group indexes rose. The index for meats, poultry, fish, and eggs increased 0.8 percent in March after declining in January and February. The index for cereals and bakery products rose 0.4 percent, as did the index for nonalcoholic beverages. The index for dairy and related products also rose in March, advancing 0.3 percent after declining 0.3 percent in February.
The fruits and vegetables index declined 0.7 percent in March after falling 0.5 percent the prior month. The index for other food at home also fell for the second month in a row, declining 0.2 percent.
The index for food at home rose 0.4 percent over the last 12 months. The index for meats, poultry, fish, and eggs increased 2.1 percent over the span. Other food at home price indexes were relatively flat; all five of the remaining grocery store food groups moved less than 1 percent over the last year. The index for food away from home increased 2.5 percent over the last 12 months.
Energy
The energy index fell 2.8 percent in March after rising in 3 of the last 4 months. The gasoline index fell 4.9 percent in March after a 0.9-percent decrease in February. (Before seasonal adjustment, gasoline prices decreased 0.2 percent in March.) The index for natural gas also declined in March, falling 1.2 percent after rising 4.7 percent in February. The index for electricity was unchanged in March.
The energy index increased 7.0 percent over the past year, with all the major component indexes rising.The gasoline index increased 11.1 percent and the fuel oil index rose 20.0 percent. The electricity index increased 2.2 percent, and the index for natural gas advanced 3.4 percent.
All items less food and energy
The index for all items less food and energy increased 0.2 percent in March. The shelter index increased 0.4 percent, with the indexes for rent and owners' equivalent rent both rising 0.3 percent. The index for lodging away from home increased 2.3 percent in March after falling in January and being unchanged in February. The medical care index rose 0.4 percent, with the hospital services index rising 0.6 percent, the physicians' services index increasing 0.2 percent, but the index for prescription drugs declining 0.2percent.
The personal care index increased 0.3 percent in March. The index for motor vehicle insurance continued to rise, increasing 0.3 percent. The airline fares index increased 0.6 percent, the same increase as in February. The indexes for alcoholic beverages and household furnishings and operations both increased 0.1 percent in March, while the indexes for new vehicles and for recreation were unchanged.
The apparel index fell 0.6 percent in March after rising in each of the two prior months. The index for communication declined 0.3 percent. The used cars and trucks index fell 0.3 percent in March, the same decline as in February. The indexes for education and for tobacco also declined in March.
The index for all items less food and energy rose 2.1 percent over the past 12 months, a higher figure than the 1.8-percent annual average increase over the past 10 years. The shelter index rose 3.3 percent over the last 12 months, a higher figure than the 2.2-percent average annual increase over the past

- 4 -
decade. The index for medical care advanced 2.0 percent, a lower rate than the 2.9-percent average annual rate over the past 10 years.
Not seasonally adjusted CPI measures
The Consumer Price Index for All Urban Consumers (CPI-U) increased 2.4 percent over the last 12 months to an index level of 249.554 (1982-84=100). For the month, the index increased 0.2 percent prior to seasonal adjustment.
The Consumer Price Index for Urban Wage Earners and Clerical Workers (CPI-W) increased 2.4percent over the last 12 months to an index level of 243.463 (1982-84=100). For the month, the index increased 0.2 percent prior to seasonal adjustment.
The Chained Consumer Price Index for All Urban Consumers (C-CPI-U) increased 2.2 percent over the last 12 months. For the month, the index increased 0.2 percent on a not seasonally adjusted basis. Please note that the indexes for the past 10 to 12 months are subject to revision.
The Consumer Price Index for April 2018 is scheduled to be released on Thursday, May 10, 2018,at 8:30 a.m. (EDT).
- 5 -
Technical Note
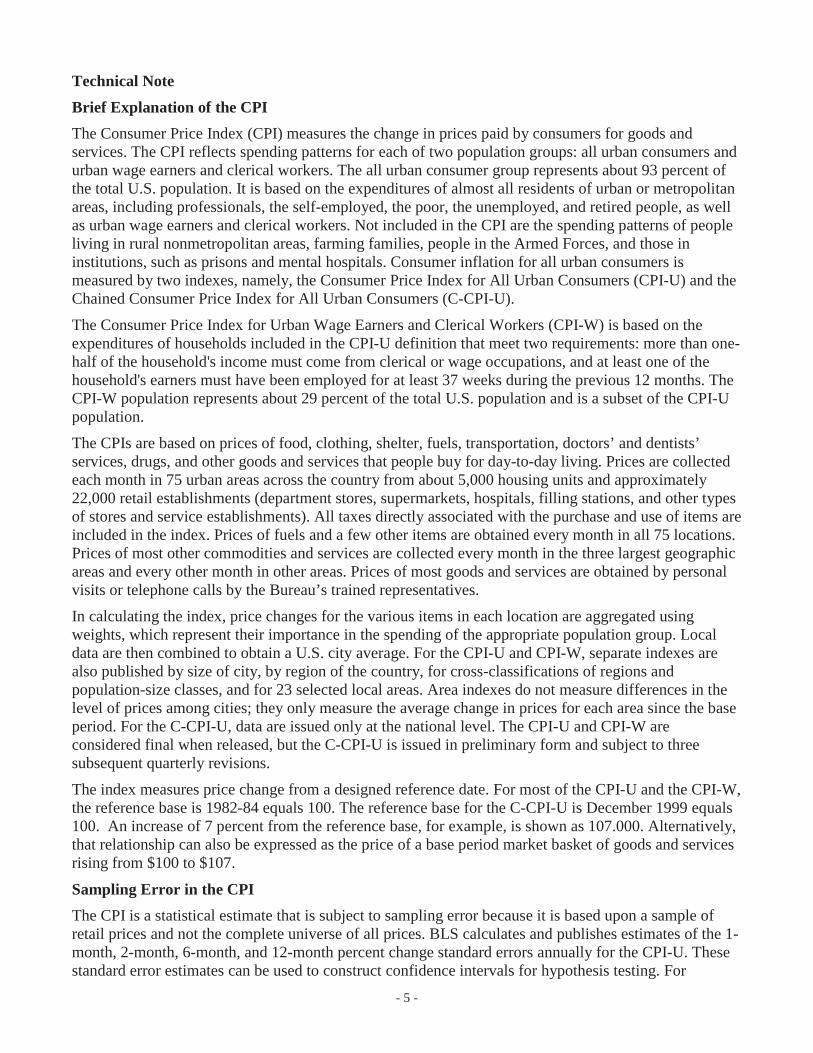
Brief Explanation of the CPIThe Consumer Price Index (CPI) measures the change in prices paid by consumers for goods and services. The CPI reflects spending patterns for each of two population groups: all urban consumers and urban wage earners and clerical workers. The all urban consumer group represents about 93 percent of the total U.S. population. It is based on the expenditures of almost all residents of urban or metropolitan areas, including professionals, the self-employed, the poor, the unemployed, and retired people, as well as urban wage earners and clerical workers. Not included in the CPI are the spending patterns of people living in rural nonmetropolitan areas, farming families, people in the Armed Forces, and those in institutions, such as prisons and mental hospitals. Consumer inflation for all urban consumers is measured by two indexes, namely, the Consumer Price Index for All Urban Consumers (CPI-U) and the Chained Consumer Price Index for All Urban Consumers (C-CPI-U).
The Consumer Price Index for Urban Wage Earners and Clerical Workers (CPI-W) is based on the expenditures of households included in the CPI-U definition that meet two requirements: more than one-half of the household's income must come from clerical or wage occupations, and at least one of the household's earners must have been employed for at least 37 weeks during the previous 12 months. The CPI-W population represents about 29 percent of the total U.S. population and is a subset of the CPI-Upopulation.
The CPIs are based on prices of food, clothing, shelter, fuels, transportation, doctors’ and dentists’ services, drugs, and other goods and services that people buy for day-to-day living. Prices are collected each month in 75 urban areas across the country from about 5,000 housing units and approximately 22,000 retail establishments (department stores, supermarkets, hospitals, filling stations, and other types of stores and service establishments). All taxes directly associated with the purchase and use of items are included in the index. Prices of fuels and a few other items are obtained every month in all 75 locations. Prices of most other commodities and services are collected every month in the three largest geographic areas and every other month in other areas. Prices of most goods and services are obtained by personal visits or telephone calls by the Bureau’s trained representatives.
In calculating the index, price changes for the various items in each location are aggregated using weights, which represent their importance in the spending of the appropriate population group. Local data are then combined to obtain a U.S. city average. For the CPI-U and CPI-W, separate indexes are also published by size of city, by region of the country, for cross-classifications of regions and population-size classes, and for 23 selected local areas. Area indexes do not measure differences in the level of prices among cities; they only measure the average change in prices for each area since the base period. For the C-CPI-U, data are issued only at the national level. The CPI-U and CPI-W are considered final when released, but the C-CPI-U is issued in preliminary form and subject to three subsequent quarterly revisions.
The index measures price change from a designed reference date. For most of the CPI-U and the CPI-W, the reference base is 1982-84 equals 100. The reference base for the C-CPI-U is December 1999 equals 100. An increase of 7 percent from the reference base, for example, is shown as 107.000. Alternatively, that relationship can also be expressed as the price of a base period market basket of goods and services rising from $100 to $107.
Sampling Error in the CPIThe CPI is a statistical estimate that is subject to sampling error because it is based upon a sample of retail prices and not the complete universe of all prices. BLS calculates and publishes estimates of the 1-month, 2-month, 6-month, and 12-month percent change standard errors annually for the CPI-U. These standard error estimates can be used to construct confidence intervals for hypothesis testing. For
- 6 -
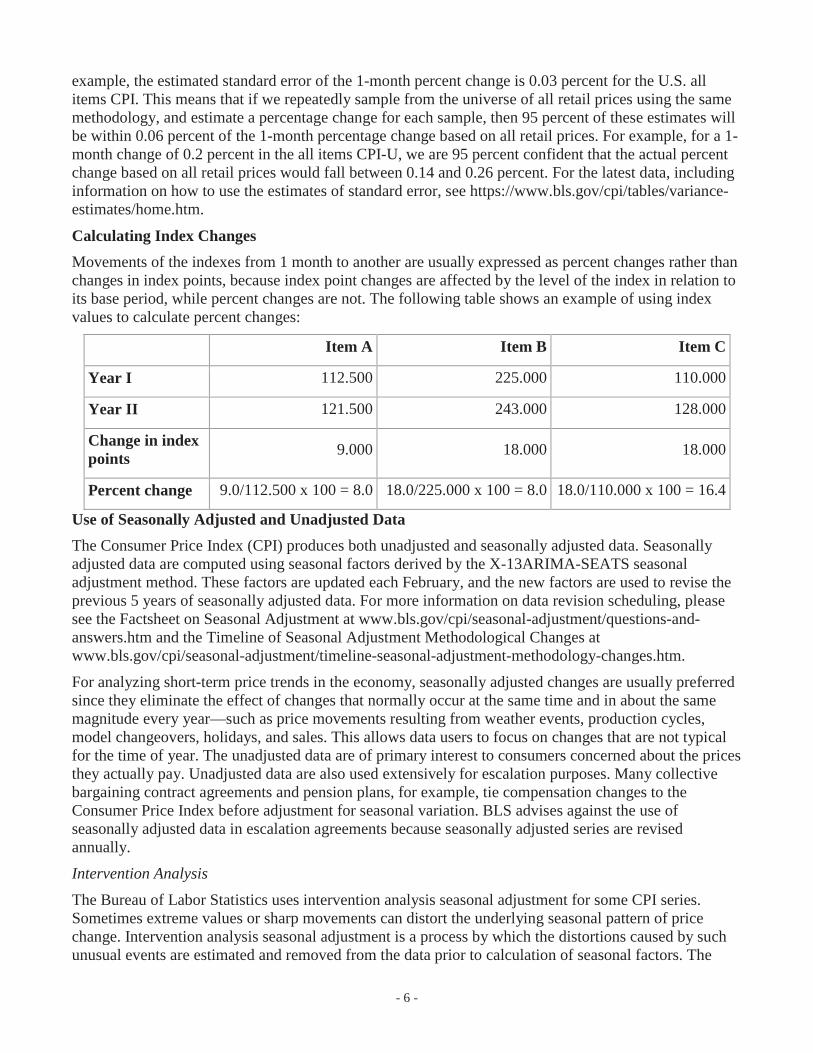
example, the estimated standard error of the 1-month percent change is 0.03 percent for the U.S. all items CPI. This means that if we repeatedly sample from the universe of all retail prices using the same methodology, and estimate a percentage change for each sample, then 95 percent of these estimates will be within 0.06 percent of the 1-month percentage change based on all retail prices. For example, for a 1-month change of 0.2 percent in the all items CPI-U, we are 95 percent confident that the actual percent change based on all retail prices would fall between 0.14 and 0.26 percent. For the latest data, including information on how to use the estimates of standard error, see https://www.bls.gov/cpi/tables/variance-estimates/home.htm.
Calculating Index ChangesMovements of the indexes from 1 month to another are usually expressed as percent changes rather than changes in index points, because index point changes are affected by the level of the index in relation to its base period, while percent changes are not. The following table shows an example of using index values to calculate percent changes:
Item A Item B Item C
Year I 112.500 225.000 110.000
Year II 121.500 243.000 128.000
Change in index points 9.000 18.000 18.000
Percent change 9.0/112.500 x 100 = 8.0 18.0/225.000 x 100 = 8.0 18.0/110.000 x 100 = 16.4
Use of Seasonally Adjusted and Unadjusted DataThe Consumer Price Index (CPI) produces both unadjusted and seasonally adjusted data. Seasonally adjusted data are computed using seasonal factors derived by the X-13ARIMA-SEATS seasonal adjustment method. These factors are updated each February, and the new factors are used to revise the previous 5 years of seasonally adjusted data. For more information on data revision scheduling, please see the Factsheet on Seasonal Adjustment at www.bls.gov/cpi/seasonal-adjustment/questions-and-answers.htm and the Timeline of Seasonal Adjustment Methodological Changes at www.bls.gov/cpi/seasonal-adjustment/timeline-seasonal-adjustment-methodology-changes.htm.
For analyzing short-term price trends in the economy, seasonally adjusted changes are usually preferred since they eliminate the effect of changes that normally occur at the same time and in about the same magnitude every year—such as price movements resulting from weather events, production cycles, model changeovers, holidays, and sales. This allows data users to focus on changes that are not typical for the time of year. The unadjusted data are of primary interest to consumers concerned about the prices they actually pay. Unadjusted data are also used extensively for escalation purposes. Many collective bargaining contract agreements and pension plans, for example, tie compensation changes to the Consumer Price Index before adjustment for seasonal variation. BLS advises against the use of seasonally adjusted data in escalation agreements because seasonally adjusted series are revised annually.
Intervention AnalysisThe Bureau of Labor Statistics uses intervention analysis seasonal adjustment for some CPI series. Sometimes extreme values or sharp movements can distort the underlying seasonal pattern of price change. Intervention analysis seasonal adjustment is a process by which the distortions caused by such unusual events are estimated and removed from the data prior to calculation of seasonal factors. The
- 7 -
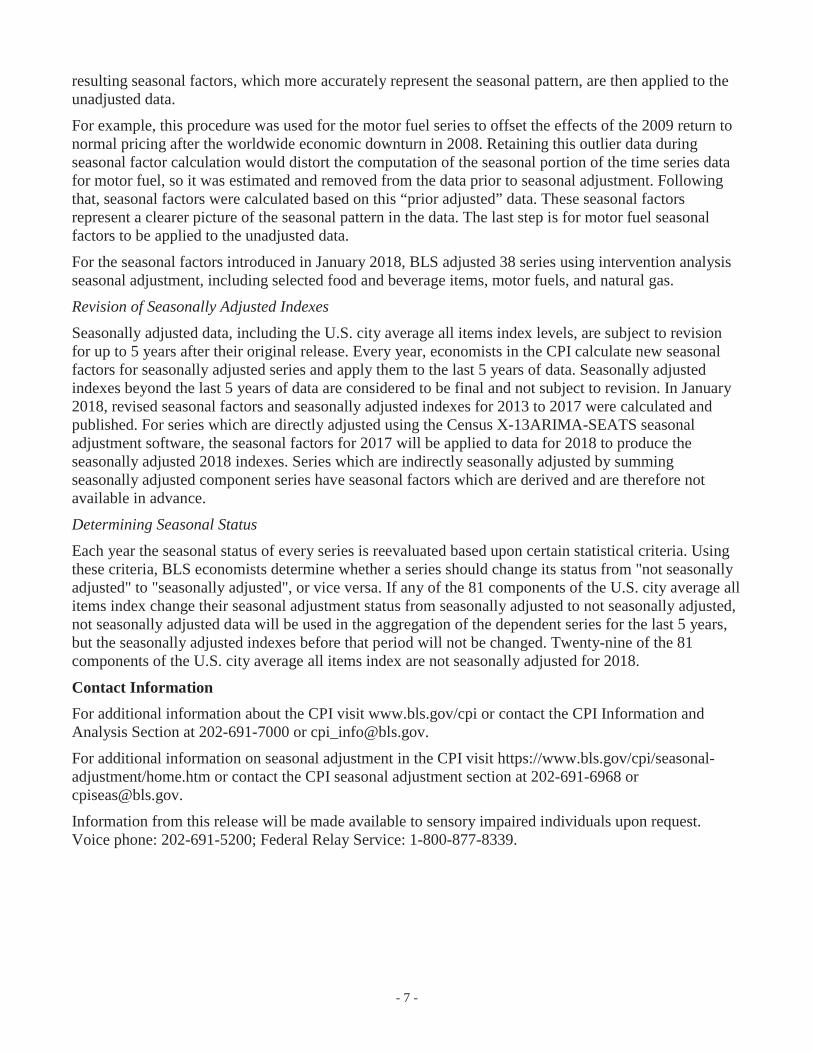
resulting seasonal factors, which more accurately represent the seasonal pattern, are then applied to the unadjusted data.
For example, this procedure was used for the motor fuel series to offset the effects of the 2009 return to normal pricing after the worldwide economic downturn in 2008. Retaining this outlier data during seasonal factor calculation would distort the computation of the seasonal portion of the time series data for motor fuel, so it was estimated and removed from the data prior to seasonal adjustment. Following that, seasonal factors were calculated based on this “prior adjusted” data. These seasonal factors represent a clearer picture of the seasonal pattern in the data. The last step is for motor fuel seasonal factors to be applied to the unadjusted data.
For the seasonal factors introduced in January 2018, BLS adjusted 38 series using intervention analysis seasonal adjustment, including selected food and beverage items, motor fuels, and natural gas.
Revision of Seasonally Adjusted IndexesSeasonally adjusted data, including the U.S. city average all items index levels, are subject to revision for up to 5 years after their original release. Every year, economists in the CPI calculate new seasonal factors for seasonally adjusted series and apply them to the last 5 years of data. Seasonally adjusted indexes beyond the last 5 years of data are considered to be final and not subject to revision. In January 2018, revised seasonal factors and seasonally adjusted indexes for 2013 to 2017 were calculated and published. For series which are directly adjusted using the Census X-13ARIMA-SEATS seasonal adjustment software, the seasonal factors for 2017 will be applied to data for 2018 to produce the seasonally adjusted 2018 indexes. Series which are indirectly seasonally adjusted by summing seasonally adjusted component series have seasonal factors which are derived and are therefore not available in advance.
Determining Seasonal StatusEach year the seasonal status of every series is reevaluated based upon certain statistical criteria. Using these criteria, BLS economists determine whether a series should change its status from "not seasonally adjusted" to "seasonally adjusted", or vice versa. If any of the 81 components of the U.S. city average all items index change their seasonal adjustment status from seasonally adjusted to not seasonally adjusted, not seasonally adjusted data will be used in the aggregation of the dependent series for the last 5 years, but the seasonally adjusted indexes before that period will not be changed. Twenty-nine of the 81 components of the U.S. city average all items index are not seasonally adjusted for 2018.
Contact InformationFor additional information about the CPI visit www.bls.gov/cpi or contact the CPI Information and Analysis Section at 202-691-7000 or [email protected].
For additional information on seasonal adjustment in the CPI visit https://www.bls.gov/cpi/seasonal-adjustment/home.htm or contact the CPI seasonal adjustment section at 202-691-6968 or [email protected].
Information from this release will be made available to sensory impaired individuals upon request. Voice phone: 202-691-5200; Federal Relay Service: 1-800-877-8339.
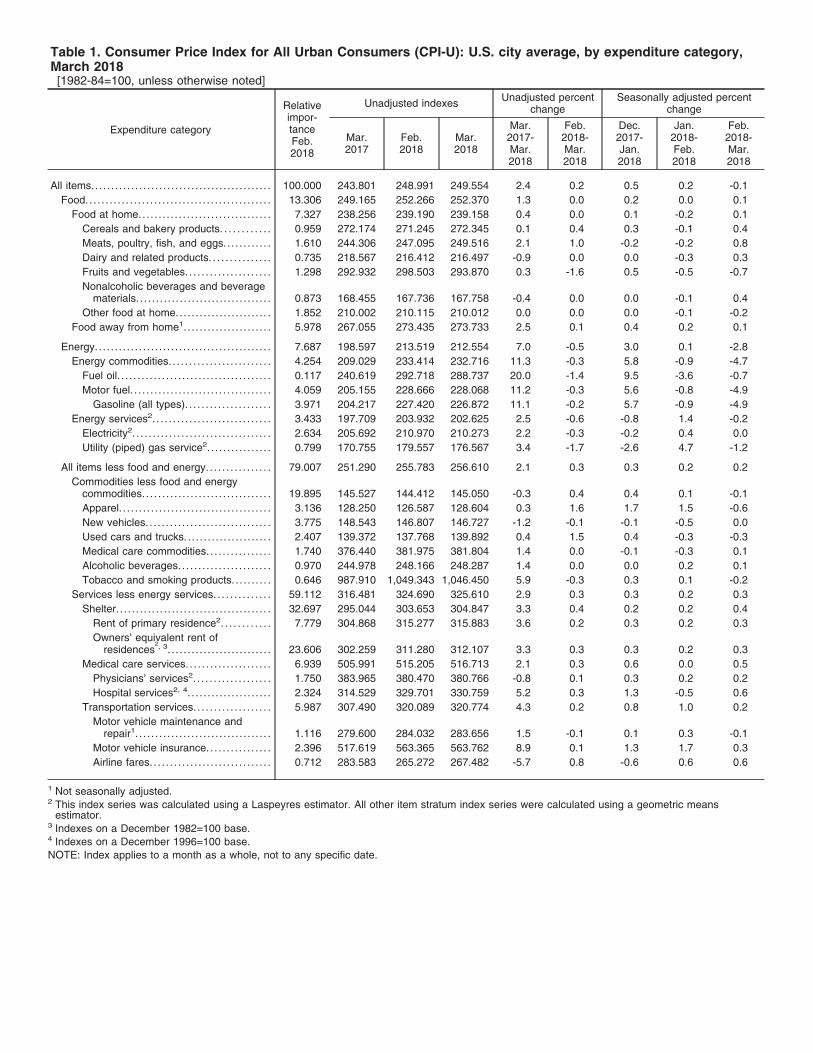
Table 1. Consumer Price Index for All Urban Consumers (CPI-U): U.S. city average, by expenditure category,March 2018[1982-84=100, unless otherwise noted]
Expenditure category
Relativeimpor-tanceFeb.2018
Unadjusted indexes Unadjusted percentchange
Seasonally adjusted percentchange
Mar.2017
Feb.2018
Mar.2018
Mar.2017-Mar.2018
Feb.2018-Mar.2018
Dec.2017-Jan.2018
Jan.2018-Feb.2018
Feb.2018-Mar.2018
All items.. . . . . . . . . . . . . . . . . . . . . . . . . . . . . . . . . . . . . . . . . . . . 100.000 243.801 248.991 249.554 2.4 0.2 0.5 0.2 -0.1Food.. . . . . . . . . . . . . . . . . . . . . . . . . . . . . . . . . . . . . . . . . . . . . 13.306 249.165 252.266 252.370 1.3 0.0 0.2 0.0 0.1
Food at home.. . . . . . . . . . . . . . . . . . . . . . . . . . . . . . . . 7.327 238.256 239.190 239.158 0.4 0.0 0.1 -0.2 0.1Cereals and bakery products. . . . . . . . . . . . 0.959 272.174 271.245 272.345 0.1 0.4 0.3 -0.1 0.4Meats, poultry, fish, and eggs.. . . . . . . . . . . 1.610 244.306 247.095 249.516 2.1 1.0 -0.2 -0.2 0.8Dairy and related products. . . . . . . . . . . . . . . 0.735 218.567 216.412 216.497 -0.9 0.0 0.0 -0.3 0.3Fruits and vegetables. . . . . . . . . . . . . . . . . . . . . 1.298 292.932 298.503 293.870 0.3 -1.6 0.5 -0.5 -0.7Nonalcoholic beverages and beverage
materials. . . . . . . . . . . . . . . . . . . . . . . . . . . . . . . . . . 0.873 168.455 167.736 167.758 -0.4 0.0 0.0 -0.1 0.4Other food at home.. . . . . . . . . . . . . . . . . . . . . . . 1.852 210.002 210.115 210.012 0.0 0.0 0.0 -0.1 -0.2
Food away from home1.. . . . . . . . . . . . . . . . . . . . . 5.978 267.055 273.435 273.733 2.5 0.1 0.4 0.2 0.1
Energy. . . . . . . . . . . . . . . . . . . . . . . . . . . . . . . . . . . . . . . . . . . . 7.687 198.597 213.519 212.554 7.0 -0.5 3.0 0.1 -2.8Energy commodities. . . . . . . . . . . . . . . . . . . . . . . . . 4.254 209.029 233.414 232.716 11.3 -0.3 5.8 -0.9 -4.7
Fuel oil. . . . . . . . . . . . . . . . . . . . . . . . . . . . . . . . . . . . . . 0.117 240.619 292.718 288.737 20.0 -1.4 9.5 -3.6 -0.7Motor fuel. . . . . . . . . . . . . . . . . . . . . . . . . . . . . . . . . . . 4.059 205.155 228.666 228.068 11.2 -0.3 5.6 -0.8 -4.9
Gasoline (all types). . . . . . . . . . . . . . . . . . . . . 3.971 204.217 227.420 226.872 11.1 -0.2 5.7 -0.9 -4.9Energy services2. . . . . . . . . . . . . . . . . . . . . . . . . . . . . 3.433 197.709 203.932 202.625 2.5 -0.6 -0.8 1.4 -0.2
Electricity2. . . . . . . . . . . . . . . . . . . . . . . . . . . . . . . . . . 2.634 205.692 210.970 210.273 2.2 -0.3 -0.2 0.4 0.0Utility (piped) gas service2. . . . . . . . . . . . . . . . 0.799 170.755 179.557 176.567 3.4 -1.7 -2.6 4.7 -1.2
All items less food and energy. . . . . . . . . . . . . . . . 79.007 251.290 255.783 256.610 2.1 0.3 0.3 0.2 0.2Commodities less food and energy
commodities. . . . . . . . . . . . . . . . . . . . . . . . . . . . . . . . 19.895 145.527 144.412 145.050 -0.3 0.4 0.4 0.1 -0.1Apparel. . . . . . . . . . . . . . . . . . . . . . . . . . . . . . . . . . . . . . 3.136 128.250 126.587 128.604 0.3 1.6 1.7 1.5 -0.6New vehicles. . . . . . . . . . . . . . . . . . . . . . . . . . . . . . . 3.775 148.543 146.807 146.727 -1.2 -0.1 -0.1 -0.5 0.0Used cars and trucks.. . . . . . . . . . . . . . . . . . . . . 2.407 139.372 137.768 139.892 0.4 1.5 0.4 -0.3 -0.3Medical care commodities. . . . . . . . . . . . . . . . 1.740 376.440 381.975 381.804 1.4 0.0 -0.1 -0.3 0.1Alcoholic beverages. . . . . . . . . . . . . . . . . . . . . . . 0.970 244.978 248.166 248.287 1.4 0.0 0.0 0.2 0.1Tobacco and smoking products. . . . . . . . . . 0.646 987.910 1,049.343 1,046.450 5.9 -0.3 0.3 0.1 -0.2
Services less energy services. . . . . . . . . . . . . . 59.112 316.481 324.690 325.610 2.9 0.3 0.3 0.2 0.3Shelter. . . . . . . . . . . . . . . . . . . . . . . . . . . . . . . . . . . . . . . 32.697 295.044 303.653 304.847 3.3 0.4 0.2 0.2 0.4
Rent of primary residence2. . . . . . . . . . . . 7.779 304.868 315.277 315.883 3.6 0.2 0.3 0.2 0.3Owners’ equivalent rent of
residences2, 3. . . . . . . . . . . . . . . . . . . . . . . . . . 23.606 302.259 311.280 312.107 3.3 0.3 0.3 0.2 0.3
Medical care services. . . . . . . . . . . . . . . . . . . . . 6.939 505.991 515.205 516.713 2.1 0.3 0.6 0.0 0.5Physicians’ services2. . . . . . . . . . . . . . . . . . . 1.750 383.965 380.470 380.766 -0.8 0.1 0.3 0.2 0.2Hospital services2, 4. . . . . . . . . . . . . . . . . . . . . 2.324 314.529 329.701 330.759 5.2 0.3 1.3 -0.5 0.6
Transportation services. . . . . . . . . . . . . . . . . . . 5.987 307.490 320.089 320.774 4.3 0.2 0.8 1.0 0.2Motor vehicle maintenance and
repair1. . . . . . . . . . . . . . . . . . . . . . . . . . . . . . . . . . 1.116 279.600 284.032 283.656 1.5 -0.1 0.1 0.3 -0.1Motor vehicle insurance. . . . . . . . . . . . . . . . 2.396 517.619 563.365 563.762 8.9 0.1 1.3 1.7 0.3Airline fares. . . . . . . . . . . . . . . . . . . . . . . . . . . . . . 0.712 283.583 265.272 267.482 -5.7 0.8 -0.6 0.6 0.6
1 Not seasonally adjusted.2 This index series was calculated using a Laspeyres estimator. All other item stratum index series were calculated using a geometric means
estimator.3 Indexes on a December 1982=100 base.4 Indexes on a December 1996=100 base.NOTE: Index applies to a month as a whole, not to any specific date.
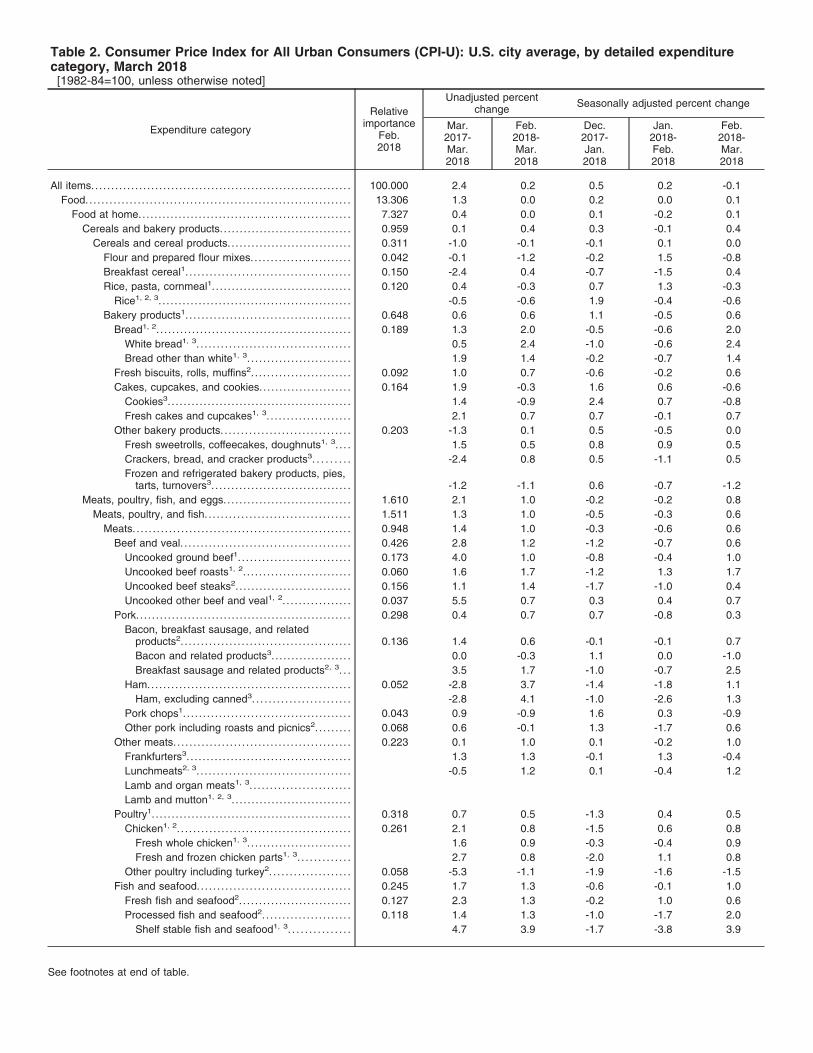
Table 2. Consumer Price Index for All Urban Consumers (CPI-U): U.S. city average, by detailed expenditurecategory, March 2018[1982-84=100, unless otherwise noted]
Expenditure category
Relativeimportance
Feb.2018
Unadjusted percentchange Seasonally adjusted percent change
Mar.2017-Mar.2018
Feb.2018-Mar.2018
Dec.2017-Jan.2018
Jan.2018-Feb.2018
Feb.2018-Mar.2018
All items.. . . . . . . . . . . . . . . . . . . . . . . . . . . . . . . . . . . . . . . . . . . . . . . . . . . . . . . . . . . . . . . . 100.000 2.4 0.2 0.5 0.2 -0.1Food.. . . . . . . . . . . . . . . . . . . . . . . . . . . . . . . . . . . . . . . . . . . . . . . . . . . . . . . . . . . . . . . . . 13.306 1.3 0.0 0.2 0.0 0.1
Food at home.. . . . . . . . . . . . . . . . . . . . . . . . . . . . . . . . . . . . . . . . . . . . . . . . . . . . 7.327 0.4 0.0 0.1 -0.2 0.1Cereals and bakery products. . . . . . . . . . . . . . . . . . . . . . . . . . . . . . . . . 0.959 0.1 0.4 0.3 -0.1 0.4
Cereals and cereal products. . . . . . . . . . . . . . . . . . . . . . . . . . . . . . . 0.311 -1.0 -0.1 -0.1 0.1 0.0Flour and prepared flour mixes. . . . . . . . . . . . . . . . . . . . . . . . . 0.042 -0.1 -1.2 -0.2 1.5 -0.8Breakfast cereal1. . . . . . . . . . . . . . . . . . . . . . . . . . . . . . . . . . . . . . . . . 0.150 -2.4 0.4 -0.7 -1.5 0.4Rice, pasta, cornmeal1. . . . . . . . . . . . . . . . . . . . . . . . . . . . . . . . . . . 0.120 0.4 -0.3 0.7 1.3 -0.3
Rice1, 2, 3. . . . . . . . . . . . . . . . . . . . . . . . . . . . . . . . . . . . . . . . . . . . . . . . -0.5 -0.6 1.9 -0.4 -0.6Bakery products1. . . . . . . . . . . . . . . . . . . . . . . . . . . . . . . . . . . . . . . . . 0.648 0.6 0.6 1.1 -0.5 0.6
Bread1, 2. . . . . . . . . . . . . . . . . . . . . . . . . . . . . . . . . . . . . . . . . . . . . . . . . 0.189 1.3 2.0 -0.5 -0.6 2.0White bread1, 3. . . . . . . . . . . . . . . . . . . . . . . . . . . . . . . . . . . . . . 0.5 2.4 -1.0 -0.6 2.4Bread other than white1, 3. . . . . . . . . . . . . . . . . . . . . . . . . . 1.9 1.4 -0.2 -0.7 1.4
Fresh biscuits, rolls, muffins2. . . . . . . . . . . . . . . . . . . . . . . . . 0.092 1.0 0.7 -0.6 -0.2 0.6Cakes, cupcakes, and cookies. . . . . . . . . . . . . . . . . . . . . . . 0.164 1.9 -0.3 1.6 0.6 -0.6
Cookies3. . . . . . . . . . . . . . . . . . . . . . . . . . . . . . . . . . . . . . . . . . . . . . 1.4 -0.9 2.4 0.7 -0.8Fresh cakes and cupcakes1, 3. . . . . . . . . . . . . . . . . . . . . 2.1 0.7 0.7 -0.1 0.7
Other bakery products. . . . . . . . . . . . . . . . . . . . . . . . . . . . . . . . 0.203 -1.3 0.1 0.5 -0.5 0.0Fresh sweetrolls, coffeecakes, doughnuts1, 3. . . . 1.5 0.5 0.8 0.9 0.5Crackers, bread, and cracker products3. . . . . . . . . -2.4 0.8 0.5 -1.1 0.5Frozen and refrigerated bakery products, pies,
tarts, turnovers3. . . . . . . . . . . . . . . . . . . . . . . . . . . . . . . . . . . -1.2 -1.1 0.6 -0.7 -1.2Meats, poultry, fish, and eggs.. . . . . . . . . . . . . . . . . . . . . . . . . . . . . . . 1.610 2.1 1.0 -0.2 -0.2 0.8
Meats, poultry, and fish. . . . . . . . . . . . . . . . . . . . . . . . . . . . . . . . . . . . 1.511 1.3 1.0 -0.5 -0.3 0.6Meats. . . . . . . . . . . . . . . . . . . . . . . . . . . . . . . . . . . . . . . . . . . . . . . . . . . . . . 0.948 1.4 1.0 -0.3 -0.6 0.6
Beef and veal. . . . . . . . . . . . . . . . . . . . . . . . . . . . . . . . . . . . . . . . . . 0.426 2.8 1.2 -1.2 -0.7 0.6Uncooked ground beef1. . . . . . . . . . . . . . . . . . . . . . . . . . . . 0.173 4.0 1.0 -0.8 -0.4 1.0Uncooked beef roasts1, 2. . . . . . . . . . . . . . . . . . . . . . . . . . . 0.060 1.6 1.7 -1.2 1.3 1.7Uncooked beef steaks2. . . . . . . . . . . . . . . . . . . . . . . . . . . . . 0.156 1.1 1.4 -1.7 -1.0 0.4Uncooked other beef and veal1, 2. . . . . . . . . . . . . . . . . 0.037 5.5 0.7 0.3 0.4 0.7
Pork.. . . . . . . . . . . . . . . . . . . . . . . . . . . . . . . . . . . . . . . . . . . . . . . . . . . . . 0.298 0.4 0.7 0.7 -0.8 0.3Bacon, breakfast sausage, and related
products2. . . . . . . . . . . . . . . . . . . . . . . . . . . . . . . . . . . . . . . . . . 0.136 1.4 0.6 -0.1 -0.1 0.7Bacon and related products3. . . . . . . . . . . . . . . . . . . . 0.0 -0.3 1.1 0.0 -1.0Breakfast sausage and related products2, 3. . . 3.5 1.7 -1.0 -0.7 2.5
Ham... . . . . . . . . . . . . . . . . . . . . . . . . . . . . . . . . . . . . . . . . . . . . . . . . 0.052 -2.8 3.7 -1.4 -1.8 1.1Ham, excluding canned3. . . . . . . . . . . . . . . . . . . . . . . . -2.8 4.1 -1.0 -2.6 1.3
Pork chops1. . . . . . . . . . . . . . . . . . . . . . . . . . . . . . . . . . . . . . . . . . 0.043 0.9 -0.9 1.6 0.3 -0.9Other pork including roasts and picnics2. . . . . . . . . 0.068 0.6 -0.1 1.3 -1.7 0.6
Other meats. . . . . . . . . . . . . . . . . . . . . . . . . . . . . . . . . . . . . . . . . . . . 0.223 0.1 1.0 0.1 -0.2 1.0Frankfurters3. . . . . . . . . . . . . . . . . . . . . . . . . . . . . . . . . . . . . . . . . 1.3 1.3 -0.1 1.3 -0.4Lunchmeats2, 3. . . . . . . . . . . . . . . . . . . . . . . . . . . . . . . . . . . . . . -0.5 1.2 0.1 -0.4 1.2Lamb and organ meats1, 3. . . . . . . . . . . . . . . . . . . . . . . . .Lamb and mutton1, 2, 3. . . . . . . . . . . . . . . . . . . . . . . . . . . . . .
Poultry1. . . . . . . . . . . . . . . . . . . . . . . . . . . . . . . . . . . . . . . . . . . . . . . . . . 0.318 0.7 0.5 -1.3 0.4 0.5Chicken1, 2. . . . . . . . . . . . . . . . . . . . . . . . . . . . . . . . . . . . . . . . . . . 0.261 2.1 0.8 -1.5 0.6 0.8
Fresh whole chicken1, 3. . . . . . . . . . . . . . . . . . . . . . . . . . 1.6 0.9 -0.3 -0.4 0.9Fresh and frozen chicken parts1, 3. . . . . . . . . . . . . 2.7 0.8 -2.0 1.1 0.8
Other poultry including turkey2. . . . . . . . . . . . . . . . . . . . 0.058 -5.3 -1.1 -1.9 -1.6 -1.5Fish and seafood. . . . . . . . . . . . . . . . . . . . . . . . . . . . . . . . . . . . . . 0.245 1.7 1.3 -0.6 -0.1 1.0
Fresh fish and seafood2. . . . . . . . . . . . . . . . . . . . . . . . . . . . 0.127 2.3 1.3 -0.2 1.0 0.6Processed fish and seafood2. . . . . . . . . . . . . . . . . . . . . . 0.118 1.4 1.3 -1.0 -1.7 2.0
Shelf stable fish and seafood1, 3. . . . . . . . . . . . . . . 4.7 3.9 -1.7 -3.8 3.9
See footnotes at end of table.
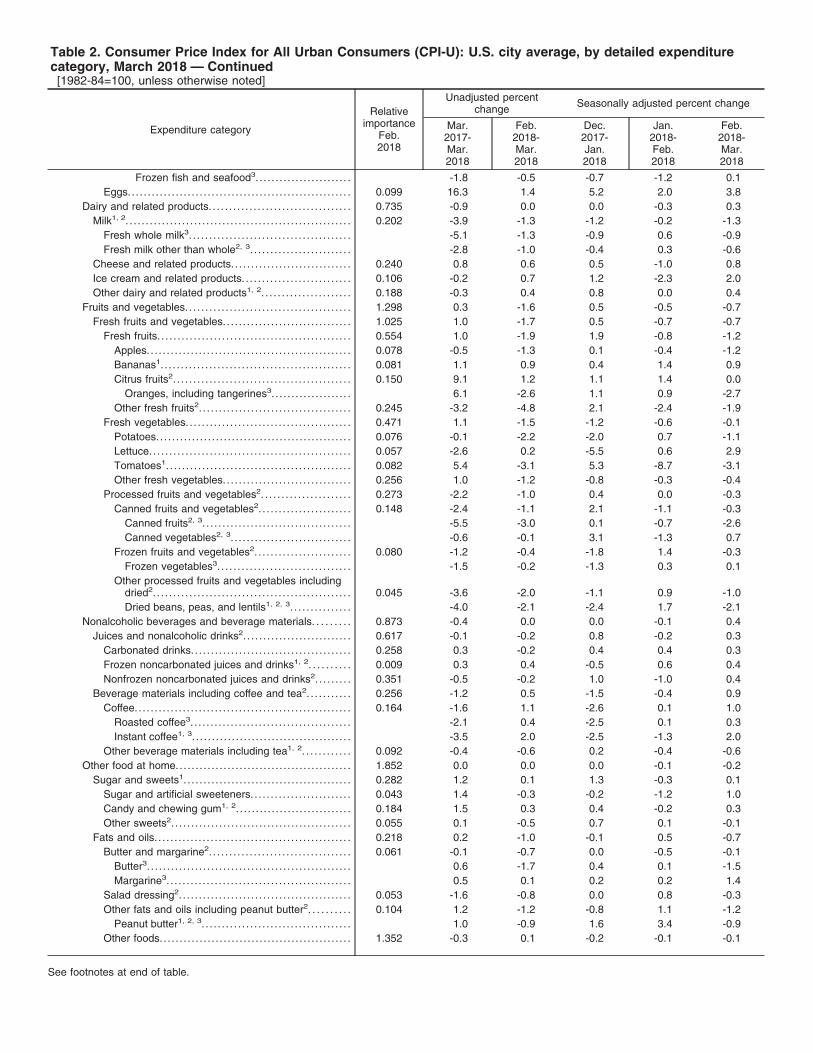
Table 2. Consumer Price Index for All Urban Consumers (CPI-U): U.S. city average, by detailed expenditurecategory, March 2018 — Continued[1982-84=100, unless otherwise noted]
Expenditure category
Relativeimportance
Feb.2018
Unadjusted percentchange Seasonally adjusted percent change
Mar.2017-Mar.2018
Feb.2018-Mar.2018
Dec.2017-Jan.2018
Jan.2018-Feb.2018
Feb.2018-Mar.2018
Frozen fish and seafood3. . . . . . . . . . . . . . . . . . . . . . . . -1.8 -0.5 -0.7 -1.2 0.1Eggs.. . . . . . . . . . . . . . . . . . . . . . . . . . . . . . . . . . . . . . . . . . . . . . . . . . . . . . . 0.099 16.3 1.4 5.2 2.0 3.8
Dairy and related products. . . . . . . . . . . . . . . . . . . . . . . . . . . . . . . . . . . 0.735 -0.9 0.0 0.0 -0.3 0.3Milk1, 2. . . . . . . . . . . . . . . . . . . . . . . . . . . . . . . . . . . . . . . . . . . . . . . . . . . . . . . . 0.202 -3.9 -1.3 -1.2 -0.2 -1.3
Fresh whole milk3. . . . . . . . . . . . . . . . . . . . . . . . . . . . . . . . . . . . . . . . -5.1 -1.3 -0.9 0.6 -0.9Fresh milk other than whole2, 3. . . . . . . . . . . . . . . . . . . . . . . . . -2.8 -1.0 -0.4 0.3 -0.6
Cheese and related products. . . . . . . . . . . . . . . . . . . . . . . . . . . . . . 0.240 0.8 0.6 0.5 -1.0 0.8Ice cream and related products. . . . . . . . . . . . . . . . . . . . . . . . . . . 0.106 -0.2 0.7 1.2 -2.3 2.0Other dairy and related products1, 2. . . . . . . . . . . . . . . . . . . . . . 0.188 -0.3 0.4 0.8 0.0 0.4
Fruits and vegetables. . . . . . . . . . . . . . . . . . . . . . . . . . . . . . . . . . . . . . . . . 1.298 0.3 -1.6 0.5 -0.5 -0.7Fresh fruits and vegetables. . . . . . . . . . . . . . . . . . . . . . . . . . . . . . . . 1.025 1.0 -1.7 0.5 -0.7 -0.7
Fresh fruits. . . . . . . . . . . . . . . . . . . . . . . . . . . . . . . . . . . . . . . . . . . . . . . . 0.554 1.0 -1.9 1.9 -0.8 -1.2Apples. . . . . . . . . . . . . . . . . . . . . . . . . . . . . . . . . . . . . . . . . . . . . . . . . . . 0.078 -0.5 -1.3 0.1 -0.4 -1.2Bananas1. . . . . . . . . . . . . . . . . . . . . . . . . . . . . . . . . . . . . . . . . . . . . . . 0.081 1.1 0.9 0.4 1.4 0.9Citrus fruits2. . . . . . . . . . . . . . . . . . . . . . . . . . . . . . . . . . . . . . . . . . . . 0.150 9.1 1.2 1.1 1.4 0.0
Oranges, including tangerines3. . . . . . . . . . . . . . . . . . . . 6.1 -2.6 1.1 0.9 -2.7Other fresh fruits2. . . . . . . . . . . . . . . . . . . . . . . . . . . . . . . . . . . . . . 0.245 -3.2 -4.8 2.1 -2.4 -1.9
Fresh vegetables. . . . . . . . . . . . . . . . . . . . . . . . . . . . . . . . . . . . . . . . . 0.471 1.1 -1.5 -1.2 -0.6 -0.1Potatoes.. . . . . . . . . . . . . . . . . . . . . . . . . . . . . . . . . . . . . . . . . . . . . . . . 0.076 -0.1 -2.2 -2.0 0.7 -1.1Lettuce. . . . . . . . . . . . . . . . . . . . . . . . . . . . . . . . . . . . . . . . . . . . . . . . . . 0.057 -2.6 0.2 -5.5 0.6 2.9Tomatoes1. . . . . . . . . . . . . . . . . . . . . . . . . . . . . . . . . . . . . . . . . . . . . . 0.082 5.4 -3.1 5.3 -8.7 -3.1Other fresh vegetables. . . . . . . . . . . . . . . . . . . . . . . . . . . . . . . . 0.256 1.0 -1.2 -0.8 -0.3 -0.4
Processed fruits and vegetables2. . . . . . . . . . . . . . . . . . . . . . 0.273 -2.2 -1.0 0.4 0.0 -0.3Canned fruits and vegetables2. . . . . . . . . . . . . . . . . . . . . . . 0.148 -2.4 -1.1 2.1 -1.1 -0.3
Canned fruits2, 3. . . . . . . . . . . . . . . . . . . . . . . . . . . . . . . . . . . . . -5.5 -3.0 0.1 -0.7 -2.6Canned vegetables2, 3. . . . . . . . . . . . . . . . . . . . . . . . . . . . . . -0.6 -0.1 3.1 -1.3 0.7
Frozen fruits and vegetables2. . . . . . . . . . . . . . . . . . . . . . . . 0.080 -1.2 -0.4 -1.8 1.4 -0.3Frozen vegetables3. . . . . . . . . . . . . . . . . . . . . . . . . . . . . . . . . -1.5 -0.2 -1.3 0.3 0.1
Other processed fruits and vegetables includingdried2. . . . . . . . . . . . . . . . . . . . . . . . . . . . . . . . . . . . . . . . . . . . . . . . . 0.045 -3.6 -2.0 -1.1 0.9 -1.0Dried beans, peas, and lentils1, 2, 3. . . . . . . . . . . . . . . -4.0 -2.1 -2.4 1.7 -2.1
Nonalcoholic beverages and beverage materials. . . . . . . . . 0.873 -0.4 0.0 0.0 -0.1 0.4Juices and nonalcoholic drinks2. . . . . . . . . . . . . . . . . . . . . . . . . . . 0.617 -0.1 -0.2 0.8 -0.2 0.3
Carbonated drinks. . . . . . . . . . . . . . . . . . . . . . . . . . . . . . . . . . . . . . . . 0.258 0.3 -0.2 0.4 0.4 0.3Frozen noncarbonated juices and drinks1, 2. . . . . . . . . . 0.009 0.3 0.4 -0.5 0.6 0.4Nonfrozen noncarbonated juices and drinks2. . . . . . . . . 0.351 -0.5 -0.2 1.0 -1.0 0.4
Beverage materials including coffee and tea2. . . . . . . . . . . 0.256 -1.2 0.5 -1.5 -0.4 0.9Coffee. . . . . . . . . . . . . . . . . . . . . . . . . . . . . . . . . . . . . . . . . . . . . . . . . . . . . . 0.164 -1.6 1.1 -2.6 0.1 1.0
Roasted coffee3. . . . . . . . . . . . . . . . . . . . . . . . . . . . . . . . . . . . . . . . -2.1 0.4 -2.5 0.1 0.3Instant coffee1, 3. . . . . . . . . . . . . . . . . . . . . . . . . . . . . . . . . . . . . . . . -3.5 2.0 -2.5 -1.3 2.0
Other beverage materials including tea1, 2. . . . . . . . . . . . 0.092 -0.4 -0.6 0.2 -0.4 -0.6Other food at home.. . . . . . . . . . . . . . . . . . . . . . . . . . . . . . . . . . . . . . . . . . . 1.852 0.0 0.0 0.0 -0.1 -0.2
Sugar and sweets1. . . . . . . . . . . . . . . . . . . . . . . . . . . . . . . . . . . . . . . . . . 0.282 1.2 0.1 1.3 -0.3 0.1Sugar and artificial sweeteners. . . . . . . . . . . . . . . . . . . . . . . . . 0.043 1.4 -0.3 -0.2 -1.2 1.0Candy and chewing gum1, 2. . . . . . . . . . . . . . . . . . . . . . . . . . . . . 0.184 1.5 0.3 0.4 -0.2 0.3Other sweets2. . . . . . . . . . . . . . . . . . . . . . . . . . . . . . . . . . . . . . . . . . . . . 0.055 0.1 -0.5 0.7 0.1 -0.1
Fats and oils. . . . . . . . . . . . . . . . . . . . . . . . . . . . . . . . . . . . . . . . . . . . . . . . . 0.218 0.2 -1.0 -0.1 0.5 -0.7Butter and margarine2. . . . . . . . . . . . . . . . . . . . . . . . . . . . . . . . . . . 0.061 -0.1 -0.7 0.0 -0.5 -0.1
Butter3. . . . . . . . . . . . . . . . . . . . . . . . . . . . . . . . . . . . . . . . . . . . . . . . . . . 0.6 -1.7 0.4 0.1 -1.5Margarine3. . . . . . . . . . . . . . . . . . . . . . . . . . . . . . . . . . . . . . . . . . . . . . 0.5 0.1 0.2 0.2 1.4
Salad dressing2. . . . . . . . . . . . . . . . . . . . . . . . . . . . . . . . . . . . . . . . . . . 0.053 -1.6 -0.8 0.0 0.8 -0.3Other fats and oils including peanut butter2. . . . . . . . . . 0.104 1.2 -1.2 -0.8 1.1 -1.2
Peanut butter1, 2, 3. . . . . . . . . . . . . . . . . . . . . . . . . . . . . . . . . . . . . 1.0 -0.9 1.6 3.4 -0.9Other foods.. . . . . . . . . . . . . . . . . . . . . . . . . . . . . . . . . . . . . . . . . . . . . . . 1.352 -0.3 0.1 -0.2 -0.1 -0.1
See footnotes at end of table.
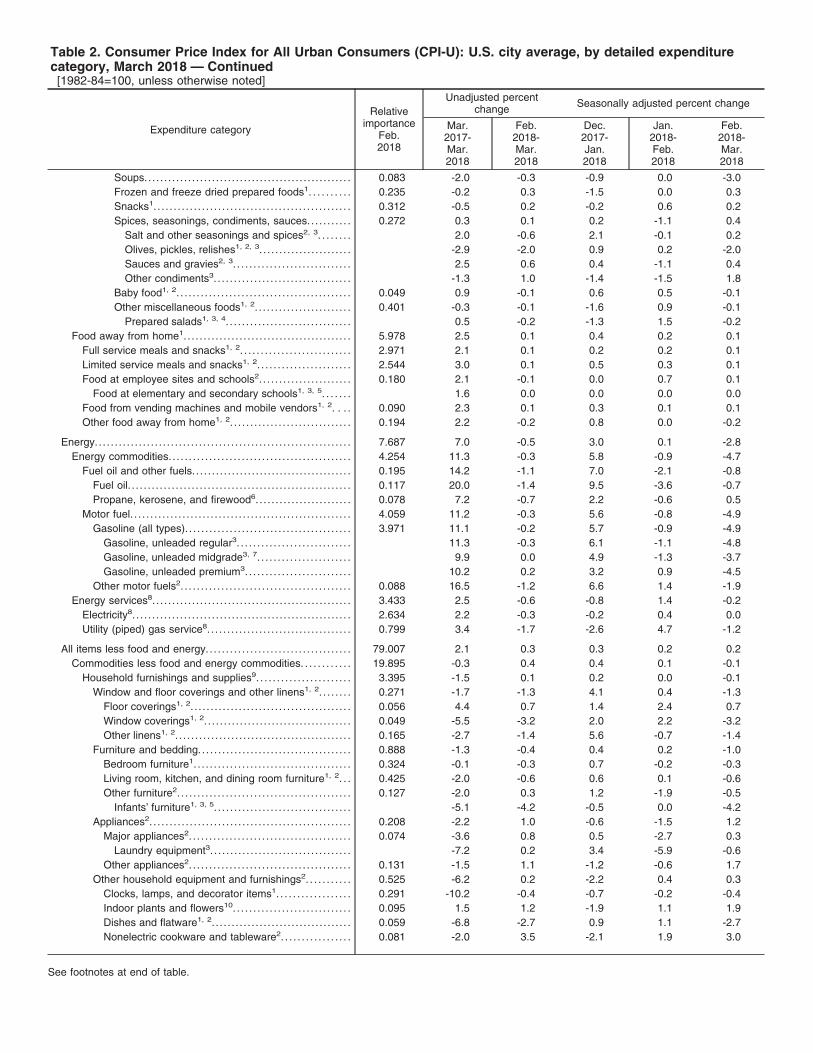
Table 2. Consumer Price Index for All Urban Consumers (CPI-U): U.S. city average, by detailed expenditurecategory, March 2018 — Continued[1982-84=100, unless otherwise noted]
Expenditure category
Relativeimportance
Feb.2018
Unadjusted percentchange Seasonally adjusted percent change
Mar.2017-Mar.2018
Feb.2018-Mar.2018
Dec.2017-Jan.2018
Jan.2018-Feb.2018
Feb.2018-Mar.2018
Soups.. . . . . . . . . . . . . . . . . . . . . . . . . . . . . . . . . . . . . . . . . . . . . . . . . . . 0.083 -2.0 -0.3 -0.9 0.0 -3.0Frozen and freeze dried prepared foods1. . . . . . . . . . 0.235 -0.2 0.3 -1.5 0.0 0.3Snacks1. . . . . . . . . . . . . . . . . . . . . . . . . . . . . . . . . . . . . . . . . . . . . . . . . 0.312 -0.5 0.2 -0.2 0.6 0.2Spices, seasonings, condiments, sauces. . . . . . . . . . . 0.272 0.3 0.1 0.2 -1.1 0.4
Salt and other seasonings and spices2, 3. . . . . . . . 2.0 -0.6 2.1 -0.1 0.2Olives, pickles, relishes1, 2, 3. . . . . . . . . . . . . . . . . . . . . . . -2.9 -2.0 0.9 0.2 -2.0Sauces and gravies2, 3. . . . . . . . . . . . . . . . . . . . . . . . . . . . . 2.5 0.6 0.4 -1.1 0.4Other condiments3. . . . . . . . . . . . . . . . . . . . . . . . . . . . . . . . . . -1.3 1.0 -1.4 -1.5 1.8
Baby food1, 2. . . . . . . . . . . . . . . . . . . . . . . . . . . . . . . . . . . . . . . . . . . 0.049 0.9 -0.1 0.6 0.5 -0.1Other miscellaneous foods1, 2. . . . . . . . . . . . . . . . . . . . . . . . 0.401 -0.3 -0.1 -1.6 0.9 -0.1
Prepared salads1, 3, 4. . . . . . . . . . . . . . . . . . . . . . . . . . . . . . . 0.5 -0.2 -1.3 1.5 -0.2Food away from home1.. . . . . . . . . . . . . . . . . . . . . . . . . . . . . . . . . . . . . . . . . 5.978 2.5 0.1 0.4 0.2 0.1
Full service meals and snacks1, 2. . . . . . . . . . . . . . . . . . . . . . . . . . . 2.971 2.1 0.1 0.2 0.2 0.1Limited service meals and snacks1, 2. . . . . . . . . . . . . . . . . . . . . . . 2.544 3.0 0.1 0.5 0.3 0.1Food at employee sites and schools2. . . . . . . . . . . . . . . . . . . . . . . 0.180 2.1 -0.1 0.0 0.7 0.1
Food at elementary and secondary schools1, 3, 5. . . . . . . 1.6 0.0 0.0 0.0 0.0Food from vending machines and mobile vendors1, 2. . . . 0.090 2.3 0.1 0.3 0.1 0.1Other food away from home1, 2. . . . . . . . . . . . . . . . . . . . . . . . . . . . . . 0.194 2.2 -0.2 0.8 0.0 -0.2
Energy.. . . . . . . . . . . . . . . . . . . . . . . . . . . . . . . . . . . . . . . . . . . . . . . . . . . . . . . . . . . . . . . 7.687 7.0 -0.5 3.0 0.1 -2.8Energy commodities. . . . . . . . . . . . . . . . . . . . . . . . . . . . . . . . . . . . . . . . . . . . . 4.254 11.3 -0.3 5.8 -0.9 -4.7
Fuel oil and other fuels. . . . . . . . . . . . . . . . . . . . . . . . . . . . . . . . . . . . . . . . 0.195 14.2 -1.1 7.0 -2.1 -0.8Fuel oil. . . . . . . . . . . . . . . . . . . . . . . . . . . . . . . . . . . . . . . . . . . . . . . . . . . . . . . . 0.117 20.0 -1.4 9.5 -3.6 -0.7Propane, kerosene, and firewood6.. . . . . . . . . . . . . . . . . . . . . . . 0.078 7.2 -0.7 2.2 -0.6 0.5
Motor fuel. . . . . . . . . . . . . . . . . . . . . . . . . . . . . . . . . . . . . . . . . . . . . . . . . . . . . . . 4.059 11.2 -0.3 5.6 -0.8 -4.9Gasoline (all types). . . . . . . . . . . . . . . . . . . . . . . . . . . . . . . . . . . . . . . . . 3.971 11.1 -0.2 5.7 -0.9 -4.9
Gasoline, unleaded regular3. . . . . . . . . . . . . . . . . . . . . . . . . . . . 11.3 -0.3 6.1 -1.1 -4.8Gasoline, unleaded midgrade3, 7. . . . . . . . . . . . . . . . . . . . . . . 9.9 0.0 4.9 -1.3 -3.7Gasoline, unleaded premium3. . . . . . . . . . . . . . . . . . . . . . . . . . 10.2 0.2 3.2 0.9 -4.5
Other motor fuels2. . . . . . . . . . . . . . . . . . . . . . . . . . . . . . . . . . . . . . . . . . 0.088 16.5 -1.2 6.6 1.4 -1.9Energy services8. . . . . . . . . . . . . . . . . . . . . . . . . . . . . . . . . . . . . . . . . . . . . . . . . . 3.433 2.5 -0.6 -0.8 1.4 -0.2
Electricity8. . . . . . . . . . . . . . . . . . . . . . . . . . . . . . . . . . . . . . . . . . . . . . . . . . . . . . . 2.634 2.2 -0.3 -0.2 0.4 0.0Utility (piped) gas service8. . . . . . . . . . . . . . . . . . . . . . . . . . . . . . . . . . . . 0.799 3.4 -1.7 -2.6 4.7 -1.2
All items less food and energy. . . . . . . . . . . . . . . . . . . . . . . . . . . . . . . . . . . . 79.007 2.1 0.3 0.3 0.2 0.2Commodities less food and energy commodities. . . . . . . . . . . . 19.895 -0.3 0.4 0.4 0.1 -0.1
Household furnishings and supplies9. . . . . . . . . . . . . . . . . . . . . . . 3.395 -1.5 0.1 0.2 0.0 -0.1Window and floor coverings and other linens1, 2. . . . . . . . 0.271 -1.7 -1.3 4.1 0.4 -1.3
Floor coverings1, 2. . . . . . . . . . . . . . . . . . . . . . . . . . . . . . . . . . . . . . . . 0.056 4.4 0.7 1.4 2.4 0.7Window coverings1, 2. . . . . . . . . . . . . . . . . . . . . . . . . . . . . . . . . . . . . 0.049 -5.5 -3.2 2.0 2.2 -3.2Other linens1, 2. . . . . . . . . . . . . . . . . . . . . . . . . . . . . . . . . . . . . . . . . . . . 0.165 -2.7 -1.4 5.6 -0.7 -1.4
Furniture and bedding. . . . . . . . . . . . . . . . . . . . . . . . . . . . . . . . . . . . . . 0.888 -1.3 -0.4 0.4 0.2 -1.0Bedroom furniture1. . . . . . . . . . . . . . . . . . . . . . . . . . . . . . . . . . . . . . . 0.324 -0.1 -0.3 0.7 -0.2 -0.3Living room, kitchen, and dining room furniture1, 2. . . 0.425 -2.0 -0.6 0.6 0.1 -0.6Other furniture2. . . . . . . . . . . . . . . . . . . . . . . . . . . . . . . . . . . . . . . . . . . 0.127 -2.0 0.3 1.2 -1.9 -0.5
Infants’ furniture1, 3, 5. . . . . . . . . . . . . . . . . . . . . . . . . . . . . . . . . . -5.1 -4.2 -0.5 0.0 -4.2Appliances2. . . . . . . . . . . . . . . . . . . . . . . . . . . . . . . . . . . . . . . . . . . . . . . . . . 0.208 -2.2 1.0 -0.6 -1.5 1.2
Major appliances2. . . . . . . . . . . . . . . . . . . . . . . . . . . . . . . . . . . . . . . . 0.074 -3.6 0.8 0.5 -2.7 0.3Laundry equipment3. . . . . . . . . . . . . . . . . . . . . . . . . . . . . . . . . . . -7.2 0.2 3.4 -5.9 -0.6
Other appliances2. . . . . . . . . . . . . . . . . . . . . . . . . . . . . . . . . . . . . . . . 0.131 -1.5 1.1 -1.2 -0.6 1.7Other household equipment and furnishings2. . . . . . . . . . . 0.525 -6.2 0.2 -2.2 0.4 0.3
Clocks, lamps, and decorator items1. . . . . . . . . . . . . . . . . . 0.291 -10.2 -0.4 -0.7 -0.2 -0.4Indoor plants and flowers10. . . . . . . . . . . . . . . . . . . . . . . . . . . . . 0.095 1.5 1.2 -1.9 1.1 1.9Dishes and flatware1, 2. . . . . . . . . . . . . . . . . . . . . . . . . . . . . . . . . . . 0.059 -6.8 -2.7 0.9 1.1 -2.7Nonelectric cookware and tableware2. . . . . . . . . . . . . . . . . 0.081 -2.0 3.5 -2.1 1.9 3.0
See footnotes at end of table.

Table 2. Consumer Price Index for All Urban Consumers (CPI-U): U.S. city average, by detailed expenditurecategory, March 2018 — Continued[1982-84=100, unless otherwise noted]
Expenditure category
Relativeimportance
Feb.2018
Unadjusted percentchange Seasonally adjusted percent change
Mar.2017-Mar.2018
Feb.2018-Mar.2018
Dec.2017-Jan.2018
Jan.2018-Feb.2018
Feb.2018-Mar.2018
Tools, hardware, outdoor equipment and supplies2. . . . 0.673 0.0 0.4 0.3 0.4 0.2Tools, hardware and supplies1, 2. . . . . . . . . . . . . . . . . . . . . . . 0.199 1.4 0.1 0.8 1.2 0.1Outdoor equipment and supplies2. . . . . . . . . . . . . . . . . . . . . . 0.311 -0.8 0.6 0.1 0.1 0.4
Housekeeping supplies1. . . . . . . . . . . . . . . . . . . . . . . . . . . . . . . . . . . . 0.830 -0.1 0.4 0.6 -0.1 0.4Household cleaning products2. . . . . . . . . . . . . . . . . . . . . . . . . . 0.326 -1.3 0.5 -1.1 -0.1 0.3Household paper products1, 2. . . . . . . . . . . . . . . . . . . . . . . . . . . 0.221 -0.5 -0.7 0.5 0.0 -0.7Miscellaneous household products1, 2. . . . . . . . . . . . . . . . . 0.283 1.6 1.1 2.8 -0.4 1.1
Apparel. . . . . . . . . . . . . . . . . . . . . . . . . . . . . . . . . . . . . . . . . . . . . . . . . . . . . . . . . . 3.136 0.3 1.6 1.7 1.5 -0.6Men’s and boys’ apparel. . . . . . . . . . . . . . . . . . . . . . . . . . . . . . . . . . . 0.778 0.4 -1.2 1.8 1.7 -1.0
Men’s apparel. . . . . . . . . . . . . . . . . . . . . . . . . . . . . . . . . . . . . . . . . . . . . 0.612 -0.4 -1.2 1.2 1.3 -1.0Men’s suits, sport coats, and outerwear. . . . . . . . . . . . 0.111 -2.4 -1.6 -0.4 -0.2 -2.5Men’s furnishings. . . . . . . . . . . . . . . . . . . . . . . . . . . . . . . . . . . . . . 0.150 -1.8 1.4 -1.8 -0.8 1.2Men’s shirts and sweaters2. . . . . . . . . . . . . . . . . . . . . . . . . . . 0.182 0.2 -1.5 4.2 4.3 -2.7Men’s pants and shorts. . . . . . . . . . . . . . . . . . . . . . . . . . . . . . . 0.162 1.7 -3.1 0.9 1.2 -2.1
Boys’ apparel. . . . . . . . . . . . . . . . . . . . . . . . . . . . . . . . . . . . . . . . . . . . . 0.166 3.4 -1.2 4.5 3.6 -1.2Women’s and girls’ apparel. . . . . . . . . . . . . . . . . . . . . . . . . . . . . . . . 1.292 -1.0 2.6 2.8 1.5 -2.1
Women’s apparel. . . . . . . . . . . . . . . . . . . . . . . . . . . . . . . . . . . . . . . . . 1.111 -1.2 2.6 3.4 1.8 -2.5Women’s outerwear. . . . . . . . . . . . . . . . . . . . . . . . . . . . . . . . . . . 0.070 -9.6 3.5 -6.3 4.8 0.9Women’s dresses.. . . . . . . . . . . . . . . . . . . . . . . . . . . . . . . . . . . . . 0.135 3.2 7.7 3.8 1.9 -1.7Women’s suits and separates2. . . . . . . . . . . . . . . . . . . . . . . 0.588 -2.3 2.8 4.8 2.4 -4.0Women’s underwear, nightwear, sportswear and
accessories2. . . . . . . . . . . . . . . . . . . . . . . . . . . . . . . . . . . . . . . . . 0.305 -1.1 -0.3 2.6 1.1 -2.5Girls’ apparel. . . . . . . . . . . . . . . . . . . . . . . . . . . . . . . . . . . . . . . . . . . . . . 0.181 -1.1 3.1 -1.5 0.1 0.3
Footwear. . . . . . . . . . . . . . . . . . . . . . . . . . . . . . . . . . . . . . . . . . . . . . . . . . . . . 0.674 0.8 3.1 0.4 1.5 1.2Men’s footwear1. . . . . . . . . . . . . . . . . . . . . . . . . . . . . . . . . . . . . . . . . . 0.217 0.6 2.1 2.2 1.8 2.1Boys’ and girls’ footwear. . . . . . . . . . . . . . . . . . . . . . . . . . . . . . . . 0.153 0.2 4.7 -2.7 -0.5 2.8Women’s footwear. . . . . . . . . . . . . . . . . . . . . . . . . . . . . . . . . . . . . . . . 0.304 1.1 2.9 1.0 3.0 0.8
Infants’ and toddlers’ apparel. . . . . . . . . . . . . . . . . . . . . . . . . . . . . . 0.134 4.6 2.6 1.1 0.9 2.2Jewelry and watches6. . . . . . . . . . . . . . . . . . . . . . . . . . . . . . . . . . . . . . 0.257 2.6 0.5 -1.5 0.6 1.8
Watches1, 6. . . . . . . . . . . . . . . . . . . . . . . . . . . . . . . . . . . . . . . . . . . . . . . . 0.099 7.8 -0.7 2.4 1.2 -0.7Jewelry6. . . . . . . . . . . . . . . . . . . . . . . . . . . . . . . . . . . . . . . . . . . . . . . . . . . . 0.159 0.0 1.2 -1.5 1.8 1.6
Transportation commodities less motor fuel9. . . . . . . . . . . . . . 6.676 -0.5 0.6 0.2 -0.4 -0.1New vehicles.. . . . . . . . . . . . . . . . . . . . . . . . . . . . . . . . . . . . . . . . . . . . . . . . 3.775 -1.2 -0.1 -0.1 -0.5 0.0
New cars and trucks2, 3. . . . . . . . . . . . . . . . . . . . . . . . . . . . . . . . . . -1.3 -0.1 -0.1 -0.5 0.0New cars3. . . . . . . . . . . . . . . . . . . . . . . . . . . . . . . . . . . . . . . . . . . . . . . -1.8 -0.1 0.0 -0.6 0.0New trucks3, 11. . . . . . . . . . . . . . . . . . . . . . . . . . . . . . . . . . . . . . . . . -0.7 0.0 0.0 -0.6 0.0
Used cars and trucks. . . . . . . . . . . . . . . . . . . . . . . . . . . . . . . . . . . . . . . 2.407 0.4 1.5 0.4 -0.3 -0.3Motor vehicle parts and equipment1. . . . . . . . . . . . . . . . . . . . . . 0.380 -0.4 0.3 0.4 0.2 0.3
Tires1. . . . . . . . . . . . . . . . . . . . . . . . . . . . . . . . . . . . . . . . . . . . . . . . . . . . . . . 0.228 -1.5 0.0 0.6 0.4 0.0Vehicle accessories other than tires1, 2. . . . . . . . . . . . . . . . 0.152 1.3 0.8 0.2 -0.2 0.8
Vehicle parts and equipment other than tires1, 3.. . 2.2 1.2 0.4 -0.1 1.2Motor oil, coolant, and fluids1, 3. . . . . . . . . . . . . . . . . . . . . . 1.3 0.1 -0.3 -0.9 0.1
Medical care commodities. . . . . . . . . . . . . . . . . . . . . . . . . . . . . . . . . . . . 1.740 1.4 0.0 -0.1 -0.3 0.1Medicinal drugs1, 9. . . . . . . . . . . . . . . . . . . . . . . . . . . . . . . . . . . . . . . . . . 1.682 1.5 0.0 0.2 0.3 0.0
Prescription drugs8. . . . . . . . . . . . . . . . . . . . . . . . . . . . . . . . . . . . . . . 1.338 1.9 -0.2 -0.2 -0.4 -0.2Nonprescription drugs1, 9. . . . . . . . . . . . . . . . . . . . . . . . . . . . . . . . 0.345 0.2 0.9 -0.8 0.3 0.9
Medical equipment and supplies1, 9. . . . . . . . . . . . . . . . . . . . . . 0.058 -1.6 -2.0 0.5 0.6 -2.0Recreation commodities9. . . . . . . . . . . . . . . . . . . . . . . . . . . . . . . . . . . . . 1.849 -2.9 0.2 -0.3 -0.3 0.3
Video and audio products9. . . . . . . . . . . . . . . . . . . . . . . . . . . . . . . . . 0.247 -12.0 -0.5 -1.8 -2.1 -0.8Televisions. . . . . . . . . . . . . . . . . . . . . . . . . . . . . . . . . . . . . . . . . . . . . . . . 0.117 -14.3 -1.3 -3.8 -3.3 -1.6Other video equipment2. . . . . . . . . . . . . . . . . . . . . . . . . . . . . . . . . 0.027 -3.7 0.5 0.3 -0.2 -0.8Audio equipment1. . . . . . . . . . . . . . . . . . . . . . . . . . . . . . . . . . . . . . . . 0.044 -17.6 -0.2 0.7 -3.1 -0.2Recorded music and music subscriptions1, 2. . . . . . . . . 0.051 -2.0 0.3 -0.6 0.2 0.3
Pets and pet products1. . . . . . . . . . . . . . . . . . . . . . . . . . . . . . . . . . . . . 0.600 -0.7 0.1 0.4 -0.1 0.1
See footnotes at end of table.
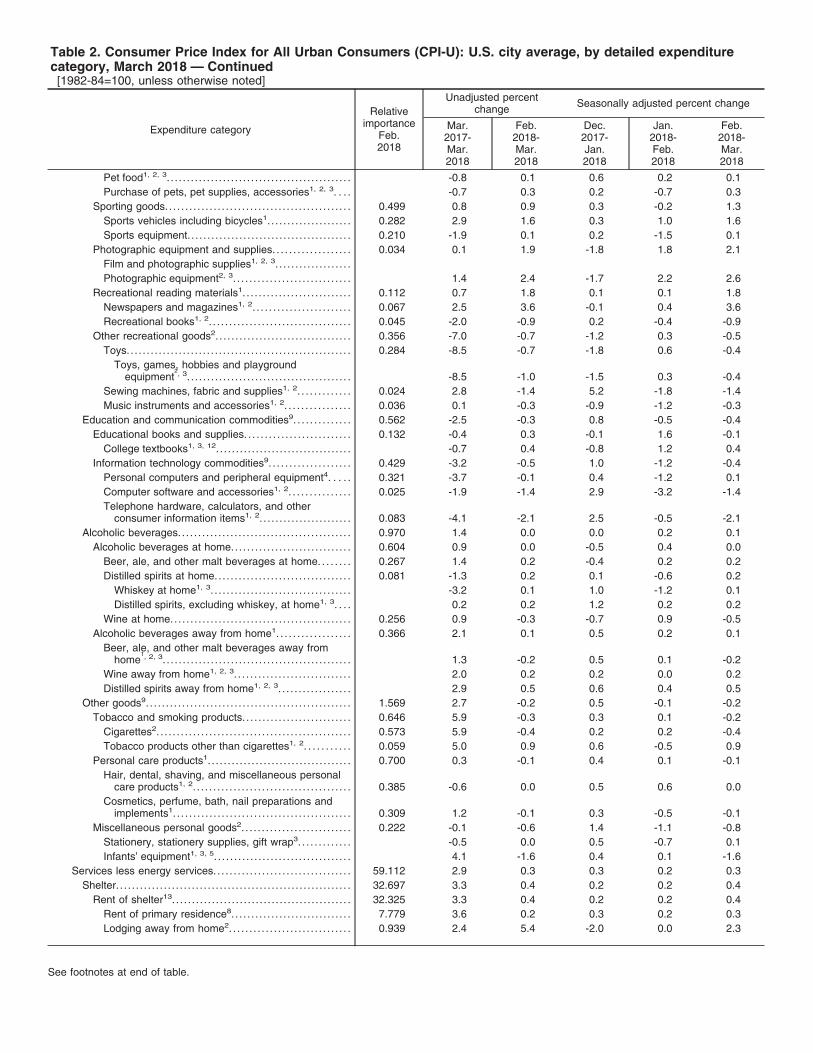
Table 2. Consumer Price Index for All Urban Consumers (CPI-U): U.S. city average, by detailed expenditurecategory, March 2018 — Continued[1982-84=100, unless otherwise noted]
Expenditure category
Relativeimportance
Feb.2018
Unadjusted percentchange Seasonally adjusted percent change
Mar.2017-Mar.2018
Feb.2018-Mar.2018
Dec.2017-Jan.2018
Jan.2018-Feb.2018
Feb.2018-Mar.2018
Pet food1, 2, 3. . . . . . . . . . . . . . . . . . . . . . . . . . . . . . . . . . . . . . . . . . . . . . -0.8 0.1 0.6 0.2 0.1Purchase of pets, pet supplies, accessories1, 2, 3. . . . -0.7 0.3 0.2 -0.7 0.3
Sporting goods. . . . . . . . . . . . . . . . . . . . . . . . . . . . . . . . . . . . . . . . . . . . . . 0.499 0.8 0.9 0.3 -0.2 1.3Sports vehicles including bicycles1. . . . . . . . . . . . . . . . . . . . . 0.282 2.9 1.6 0.3 1.0 1.6Sports equipment. . . . . . . . . . . . . . . . . . . . . . . . . . . . . . . . . . . . . . . . . 0.210 -1.9 0.1 0.2 -1.5 0.1
Photographic equipment and supplies. . . . . . . . . . . . . . . . . . . 0.034 0.1 1.9 -1.8 1.8 2.1Film and photographic supplies1, 2, 3. . . . . . . . . . . . . . . . . . .Photographic equipment2, 3. . . . . . . . . . . . . . . . . . . . . . . . . . . . . 1.4 2.4 -1.7 2.2 2.6
Recreational reading materials1. . . . . . . . . . . . . . . . . . . . . . . . . . . 0.112 0.7 1.8 0.1 0.1 1.8Newspapers and magazines1, 2. . . . . . . . . . . . . . . . . . . . . . . . 0.067 2.5 3.6 -0.1 0.4 3.6Recreational books1, 2. . . . . . . . . . . . . . . . . . . . . . . . . . . . . . . . . . . 0.045 -2.0 -0.9 0.2 -0.4 -0.9
Other recreational goods2. . . . . . . . . . . . . . . . . . . . . . . . . . . . . . . . . . 0.356 -7.0 -0.7 -1.2 0.3 -0.5Toys.. . . . . . . . . . . . . . . . . . . . . . . . . . . . . . . . . . . . . . . . . . . . . . . . . . . . . . . 0.284 -8.5 -0.7 -1.8 0.6 -0.4
Toys, games, hobbies and playgroundequipment
2, 3. . . . . . . . . . . . . . . . . . . . . . . . . . . . . . . . . . . . . . . . . -8.5 -1.0 -1.5 0.3 -0.4Sewing machines, fabric and supplies1, 2. . . . . . . . . . . . . 0.024 2.8 -1.4 5.2 -1.8 -1.4Music instruments and accessories1, 2. . . . . . . . . . . . . . . . 0.036 0.1 -0.3 -0.9 -1.2 -0.3
Education and communication commodities9. . . . . . . . . . . . . . 0.562 -2.5 -0.3 0.8 -0.5 -0.4Educational books and supplies. . . . . . . . . . . . . . . . . . . . . . . . . . 0.132 -0.4 0.3 -0.1 1.6 -0.1
College textbooks1, 3, 12. . . . . . . . . . . . . . . . . . . . . . . . . . . . . . . . . . -0.7 0.4 -0.8 1.2 0.4Information technology commodities9. . . . . . . . . . . . . . . . . . . . 0.429 -3.2 -0.5 1.0 -1.2 -0.4
Personal computers and peripheral equipment4. . . . . 0.321 -3.7 -0.1 0.4 -1.2 0.1Computer software and accessories1, 2. . . . . . . . . . . . . . . 0.025 -1.9 -1.4 2.9 -3.2 -1.4Telephone hardware, calculators, and other
consumer information items1, 2. . . . . . . . . . . . . . . . . . . . . . . 0.083 -4.1 -2.1 2.5 -0.5 -2.1Alcoholic beverages. . . . . . . . . . . . . . . . . . . . . . . . . . . . . . . . . . . . . . . . . . . 0.970 1.4 0.0 0.0 0.2 0.1
Alcoholic beverages at home.. . . . . . . . . . . . . . . . . . . . . . . . . . . . . 0.604 0.9 0.0 -0.5 0.4 0.0Beer, ale, and other malt beverages at home. . . . . . . . 0.267 1.4 0.2 -0.4 0.2 0.2Distilled spirits at home.. . . . . . . . . . . . . . . . . . . . . . . . . . . . . . . . . 0.081 -1.3 0.2 0.1 -0.6 0.2
Whiskey at home1, 3. . . . . . . . . . . . . . . . . . . . . . . . . . . . . . . . . . . -3.2 0.1 1.0 -1.2 0.1Distilled spirits, excluding whiskey, at home1, 3. . . . 0.2 0.2 1.2 0.2 0.2
Wine at home.. . . . . . . . . . . . . . . . . . . . . . . . . . . . . . . . . . . . . . . . . . . . 0.256 0.9 -0.3 -0.7 0.9 -0.5Alcoholic beverages away from home1. . . . . . . . . . . . . . . . . . 0.366 2.1 0.1 0.5 0.2 0.1
Beer, ale, and other malt beverages away fromhome
1, 2, 3. . . . . . . . . . . . . . . . . . . . . . . . . . . . . . . . . . . . . . . . . . . . . . . 1.3 -0.2 0.5 0.1 -0.2Wine away from home1, 2, 3. . . . . . . . . . . . . . . . . . . . . . . . . . . . . 2.0 0.2 0.2 0.0 0.2Distilled spirits away from home1, 2, 3. . . . . . . . . . . . . . . . . . 2.9 0.5 0.6 0.4 0.5
Other goods9. . . . . . . . . . . . . . . . . . . . . . . . . . . . . . . . . . . . . . . . . . . . . . . . . . . 1.569 2.7 -0.2 0.5 -0.1 -0.2Tobacco and smoking products. . . . . . . . . . . . . . . . . . . . . . . . . . . 0.646 5.9 -0.3 0.3 0.1 -0.2
Cigarettes2. . . . . . . . . . . . . . . . . . . . . . . . . . . . . . . . . . . . . . . . . . . . . . . . 0.573 5.9 -0.4 0.2 0.2 -0.4Tobacco products other than cigarettes1, 2. . . . . . . . . . . 0.059 5.0 0.9 0.6 -0.5 0.9
Personal care products1. . . . . . . . . . . . . . . . . . . . . . . . . . . . . . . . . . . . 0.700 0.3 -0.1 0.4 0.1 -0.1Hair, dental, shaving, and miscellaneous personal
care products1, 2. . . . . . . . . . . . . . . . . . . . . . . . . . . . . . . . . . . . . . . 0.385 -0.6 0.0 0.5 0.6 0.0Cosmetics, perfume, bath, nail preparations and
implements1. . . . . . . . . . . . . . . . . . . . . . . . . . . . . . . . . . . . . . . . . . . . 0.309 1.2 -0.1 0.3 -0.5 -0.1Miscellaneous personal goods2. . . . . . . . . . . . . . . . . . . . . . . . . . . 0.222 -0.1 -0.6 1.4 -1.1 -0.8
Stationery, stationery supplies, gift wrap3. . . . . . . . . . . . . -0.5 0.0 0.5 -0.7 0.1Infants’ equipment1, 3, 5. . . . . . . . . . . . . . . . . . . . . . . . . . . . . . . . . . 4.1 -1.6 0.4 0.1 -1.6
Services less energy services. . . . . . . . . . . . . . . . . . . . . . . . . . . . . . . . . . 59.112 2.9 0.3 0.3 0.2 0.3Shelter. . . . . . . . . . . . . . . . . . . . . . . . . . . . . . . . . . . . . . . . . . . . . . . . . . . . . . . . . . . 32.697 3.3 0.4 0.2 0.2 0.4
Rent of shelter13. . . . . . . . . . . . . . . . . . . . . . . . . . . . . . . . . . . . . . . . . . . . . 32.325 3.3 0.4 0.2 0.2 0.4Rent of primary residence8. . . . . . . . . . . . . . . . . . . . . . . . . . . . . . 7.779 3.6 0.2 0.3 0.2 0.3Lodging away from home2. . . . . . . . . . . . . . . . . . . . . . . . . . . . . . 0.939 2.4 5.4 -2.0 0.0 2.3
See footnotes at end of table.
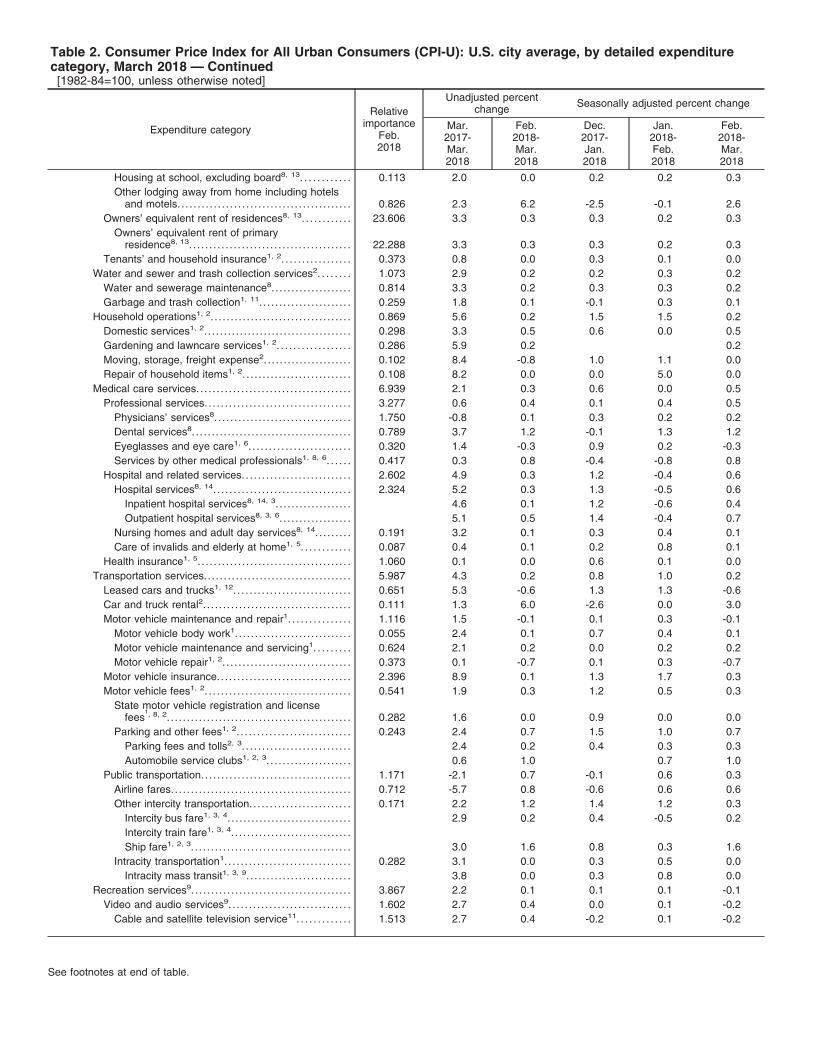
Table 2. Consumer Price Index for All Urban Consumers (CPI-U): U.S. city average, by detailed expenditurecategory, March 2018 — Continued[1982-84=100, unless otherwise noted]
Expenditure category
Relativeimportance
Feb.2018
Unadjusted percentchange Seasonally adjusted percent change
Mar.2017-Mar.2018
Feb.2018-Mar.2018
Dec.2017-Jan.2018
Jan.2018-Feb.2018
Feb.2018-Mar.2018
Housing at school, excluding board8, 13. . . . . . . . . . . . 0.113 2.0 0.0 0.2 0.2 0.3Other lodging away from home including hotels
and motels. . . . . . . . . . . . . . . . . . . . . . . . . . . . . . . . . . . . . . . . . . . 0.826 2.3 6.2 -2.5 -0.1 2.6Owners’ equivalent rent of residences8, 13. . . . . . . . . . . . 23.606 3.3 0.3 0.3 0.2 0.3
Owners’ equivalent rent of primaryresidence8, 13. . . . . . . . . . . . . . . . . . . . . . . . . . . . . . . . . . . . . . . . 22.288 3.3 0.3 0.3 0.2 0.3
Tenants’ and household insurance1, 2. . . . . . . . . . . . . . . . . 0.373 0.8 0.0 0.3 0.1 0.0Water and sewer and trash collection services2. . . . . . . . 1.073 2.9 0.2 0.2 0.3 0.2
Water and sewerage maintenance8. . . . . . . . . . . . . . . . . . . . 0.814 3.3 0.2 0.3 0.3 0.2Garbage and trash collection1, 11. . . . . . . . . . . . . . . . . . . . . . . 0.259 1.8 0.1 -0.1 0.3 0.1
Household operations1, 2. . . . . . . . . . . . . . . . . . . . . . . . . . . . . . . . . . . 0.869 5.6 0.2 1.5 1.5 0.2Domestic services1, 2. . . . . . . . . . . . . . . . . . . . . . . . . . . . . . . . . . . . . 0.298 3.3 0.5 0.6 0.0 0.5Gardening and lawncare services1, 2. . . . . . . . . . . . . . . . . . 0.286 5.9 0.2 0.2Moving, storage, freight expense2.. . . . . . . . . . . . . . . . . . . . . 0.102 8.4 -0.8 1.0 1.1 0.0Repair of household items1, 2. . . . . . . . . . . . . . . . . . . . . . . . . . . 0.108 8.2 0.0 0.0 5.0 0.0
Medical care services. . . . . . . . . . . . . . . . . . . . . . . . . . . . . . . . . . . . . . 6.939 2.1 0.3 0.6 0.0 0.5Professional services. . . . . . . . . . . . . . . . . . . . . . . . . . . . . . . . . . . . 3.277 0.6 0.4 0.1 0.4 0.5
Physicians’ services8. . . . . . . . . . . . . . . . . . . . . . . . . . . . . . . . . . 1.750 -0.8 0.1 0.3 0.2 0.2Dental services8. . . . . . . . . . . . . . . . . . . . . . . . . . . . . . . . . . . . . . . . 0.789 3.7 1.2 -0.1 1.3 1.2Eyeglasses and eye care1, 6. . . . . . . . . . . . . . . . . . . . . . . . . 0.320 1.4 -0.3 0.9 0.2 -0.3Services by other medical professionals1, 8, 6. . . . . . 0.417 0.3 0.8 -0.4 -0.8 0.8
Hospital and related services. . . . . . . . . . . . . . . . . . . . . . . . . . . 2.602 4.9 0.3 1.2 -0.4 0.6Hospital services8, 14. . . . . . . . . . . . . . . . . . . . . . . . . . . . . . . . . . 2.324 5.2 0.3 1.3 -0.5 0.6
Inpatient hospital services8, 14, 3. . . . . . . . . . . . . . . . . . . 4.6 0.1 1.2 -0.6 0.4Outpatient hospital services8, 3, 6. . . . . . . . . . . . . . . . . . 5.1 0.5 1.4 -0.4 0.7
Nursing homes and adult day services8, 14. . . . . . . . . 0.191 3.2 0.1 0.3 0.4 0.1Care of invalids and elderly at home1, 5. . . . . . . . . . . . 0.087 0.4 0.1 0.2 0.8 0.1
Health insurance1, 5. . . . . . . . . . . . . . . . . . . . . . . . . . . . . . . . . . . . . . 1.060 0.1 0.0 0.6 0.1 0.0Transportation services.. . . . . . . . . . . . . . . . . . . . . . . . . . . . . . . . . . . . 5.987 4.3 0.2 0.8 1.0 0.2
Leased cars and trucks1, 12. . . . . . . . . . . . . . . . . . . . . . . . . . . . . 0.651 5.3 -0.6 1.3 1.3 -0.6Car and truck rental2. . . . . . . . . . . . . . . . . . . . . . . . . . . . . . . . . . . . . 0.111 1.3 6.0 -2.6 0.0 3.0Motor vehicle maintenance and repair1. . . . . . . . . . . . . . . 1.116 1.5 -0.1 0.1 0.3 -0.1
Motor vehicle body work1. . . . . . . . . . . . . . . . . . . . . . . . . . . . . 0.055 2.4 0.1 0.7 0.4 0.1Motor vehicle maintenance and servicing1. . . . . . . . . 0.624 2.1 0.2 0.0 0.2 0.2Motor vehicle repair1, 2. . . . . . . . . . . . . . . . . . . . . . . . . . . . . . . . 0.373 0.1 -0.7 0.1 0.3 -0.7
Motor vehicle insurance. . . . . . . . . . . . . . . . . . . . . . . . . . . . . . . . . 2.396 8.9 0.1 1.3 1.7 0.3Motor vehicle fees1, 2. . . . . . . . . . . . . . . . . . . . . . . . . . . . . . . . . . . . 0.541 1.9 0.3 1.2 0.5 0.3
State motor vehicle registration and licensefees
1, 8, 2. . . . . . . . . . . . . . . . . . . . . . . . . . . . . . . . . . . . . . . . . . . . . . 0.282 1.6 0.0 0.9 0.0 0.0Parking and other fees1, 2. . . . . . . . . . . . . . . . . . . . . . . . . . . . 0.243 2.4 0.7 1.5 1.0 0.7
Parking fees and tolls2, 3. . . . . . . . . . . . . . . . . . . . . . . . . . . 2.4 0.2 0.4 0.3 0.3Automobile service clubs1, 2, 3. . . . . . . . . . . . . . . . . . . . . 0.6 1.0 0.7 1.0
Public transportation. . . . . . . . . . . . . . . . . . . . . . . . . . . . . . . . . . . . . 1.171 -2.1 0.7 -0.1 0.6 0.3Airline fares. . . . . . . . . . . . . . . . . . . . . . . . . . . . . . . . . . . . . . . . . . . . . 0.712 -5.7 0.8 -0.6 0.6 0.6Other intercity transportation. . . . . . . . . . . . . . . . . . . . . . . . . 0.171 2.2 1.2 1.4 1.2 0.3
Intercity bus fare1, 3, 4. . . . . . . . . . . . . . . . . . . . . . . . . . . . . . . 2.9 0.2 0.4 -0.5 0.2Intercity train fare1, 3, 4. . . . . . . . . . . . . . . . . . . . . . . . . . . . . .Ship fare1, 2, 3. . . . . . . . . . . . . . . . . . . . . . . . . . . . . . . . . . . . . . . . 3.0 1.6 0.8 0.3 1.6
Intracity transportation1. . . . . . . . . . . . . . . . . . . . . . . . . . . . . . . 0.282 3.1 0.0 0.3 0.5 0.0Intracity mass transit1, 3, 9. . . . . . . . . . . . . . . . . . . . . . . . . . 3.8 0.0 0.3 0.8 0.0
Recreation services9. . . . . . . . . . . . . . . . . . . . . . . . . . . . . . . . . . . . . . . . 3.867 2.2 0.1 0.1 0.1 -0.1Video and audio services9. . . . . . . . . . . . . . . . . . . . . . . . . . . . . . 1.602 2.7 0.4 0.0 0.1 -0.2
Cable and satellite television service11. . . . . . . . . . . . . 1.513 2.7 0.4 -0.2 0.1 -0.2
See footnotes at end of table.

Table 2. Consumer Price Index for All Urban Consumers (CPI-U): U.S. city average, by detailed expenditurecategory, March 2018 — Continued[1982-84=100, unless otherwise noted]
Expenditure category
Relativeimportance
Feb.2018
Unadjusted percentchange Seasonally adjusted percent change
Mar.2017-Mar.2018
Feb.2018-Mar.2018
Dec.2017-Jan.2018
Jan.2018-Feb.2018
Feb.2018-Mar.2018
Video discs and other media, including rental ofvideo
1, 2. . . . . . . . . . . . . . . . . . . . . . . . . . . . . . . . . . . . . . . . . . . . . . . 0.089 2.1 -0.3 3.9 0.0 -0.3Video discs and other media1, 2, 3. . . . . . . . . . . . . . . . -1.3 0.3 5.3 0.3 0.3Rental of video discs and other media1, 2, 3. . . . . 2.7 0.0 -0.2 -0.1 0.0
Pet services including veterinary2. . . . . . . . . . . . . . . . . . . . . . 0.411 2.3 0.2 0.5 -0.4 0.2Pet services1, 2, 3. . . . . . . . . . . . . . . . . . . . . . . . . . . . . . . . . . . . . . . 1.1 0.0 -0.1 0.1 0.0Veterinarian services2, 3. . . . . . . . . . . . . . . . . . . . . . . . . . . . . . . 2.5 0.3 0.6 -0.5 0.4
Photographers and film processing1, 2. . . . . . . . . . . . . . . . . 0.038 -3.0 -0.8 -1.0 -0.2 -0.8Photographer fees1, 2, 3. . . . . . . . . . . . . . . . . . . . . . . . . . . . . . . 0.0 -0.1 -0.3 0.0 -0.1Film processing1, 2, 3. . . . . . . . . . . . . . . . . . . . . . . . . . . . . . . . . . -8.7 -0.8 -4.1 -0.4 -0.8
Other recreation services2. . . . . . . . . . . . . . . . . . . . . . . . . . . . . . . 1.814 1.9 -0.1 0.1 0.3 -0.1Club membership for shopping clubs, fraternal, or
other organizations, or participant sportsfees1, 2. . . . . . . . . . . . . . . . . . . . . . . . . . . . . . . . . . . . . . . . . . . . . . . . 0.668 3.2 0.6 0.2 -0.3 0.6
Admissions. . . . . . . . . . . . . . . . . . . . . . . . . . . . . . . . . . . . . . . . . . . . . 0.655 0.2 -0.9 -0.4 1.1 -1.0Admission to movies, theaters, and
concerts1, 2, 3. . . . . . . . . . . . . . . . . . . . . . . . . . . . . . . . . . . . . . 2.9 -0.1 -0.3 1.0 -0.1
Admission to sporting events1, 2, 3. . . . . . . . . . . . . . . . -3.0 -3.4 2.1 2.8 -3.4Fees for lessons or instructions1, 6. . . . . . . . . . . . . . . . . . 0.218 3.3 0.3 0.5 -0.5 0.3
Education and communication services9. . . . . . . . . . . . . . . . . 6.063 0.1 -0.2 0.0 -0.2 -0.2Tuition, other school fees, and childcare. . . . . . . . . . . . . . 2.869 1.9 -0.3 0.1 0.2 -0.1
College tuition and fees.. . . . . . . . . . . . . . . . . . . . . . . . . . . . . . 1.590 1.7 -0.5 0.1 0.0 -0.2Elementary and high school tuition and fees. . . . . . 0.327 3.8 0.0 0.3 0.3 0.3Child care and nursery school10. . . . . . . . . . . . . . . . . . . . . 0.802 1.3 0.0 0.0 0.3 0.0Technical and business school tuition and fees2.. . 0.032 1.7 0.1 -0.3 0.1 0.1
Postage and delivery services2. . . . . . . . . . . . . . . . . . . . . . . . . 0.109 2.4 0.0 0.6 -0.6 0.2Postage. . . . . . . . . . . . . . . . . . . . . . . . . . . . . . . . . . . . . . . . . . . . . . . . . 0.095 2.0 0.0 0.4 -0.8 0.2Delivery services2. . . . . . . . . . . . . . . . . . . . . . . . . . . . . . . . . . . . . . 0.014 6.1 0.0 1.5 0.2 0.3
Telephone services1, 2. . . . . . . . . . . . . . . . . . . . . . . . . . . . . . . . . . . 2.298 -1.5 0.0 -0.1 -0.4 0.0Wireless telephone services1, 2. . . . . . . . . . . . . . . . . . . . . . 1.719 -2.4 0.2 -0.2 -0.5 0.2Land-line telephone services1, 9. . . . . . . . . . . . . . . . . . . . . 0.579 0.5 -0.8 0.1 0.2 -0.8
Internet services and electronic informationproviders2. . . . . . . . . . . . . . . . . . . . . . . . . . . . . . . . . . . . . . . . . . . . . . . 0.778 -2.8 -0.4 -0.3 -1.0 -1.0
Other personal services1, 9. . . . . . . . . . . . . . . . . . . . . . . . . . . . . . . . . 1.616 2.5 0.6 0.4 0.4 0.6Personal care services1. . . . . . . . . . . . . . . . . . . . . . . . . . . . . . . . . 0.621 1.9 0.3 0.5 0.2 0.3
Haircuts and other personal care services1, 2. . . . . . 0.621 1.9 0.3 0.5 0.2 0.3Miscellaneous personal services. . . . . . . . . . . . . . . . . . . . . . . 0.995 2.8 0.8 0.3 0.5 0.7
Legal services1, 6. . . . . . . . . . . . . . . . . . . . . . . . . . . . . . . . . . . . . . 0.306 4.3 0.6 1.1 2.6 0.6Funeral expenses1, 6. . . . . . . . . . . . . . . . . . . . . . . . . . . . . . . . . . 0.127 1.7 0.1 -0.1 0.4 0.1Laundry and dry cleaning services1, 2. . . . . . . . . . . . . . . 0.237 2.8 0.5 0.3 0.4 0.5Apparel services other than laundry and dry
cleaning1, 2. . . . . . . . . . . . . . . . . . . . . . . . . . . . . . . . . . . . . . . . . . . 0.028 -0.3 -0.3 0.1 0.1 -0.3
Financial services6. . . . . . . . . . . . . . . . . . . . . . . . . . . . . . . . . . . . . 0.227 1.4 2.1 -0.2 -2.2 1.5Checking account and other bank
services1, 2, 3. . . . . . . . . . . . . . . . . . . . . . . . . . . . . . . . . . . . . . 9.4 4.7 0.0 1.1 4.7Tax return preparation and other accounting
fees2, 3. . . . . . . . . . . . . . . . . . . . . . . . . . . . . . . . . . . . . . . . . . . . . . -1.7 0.8 0.8 -4.6 -0.4
1 Not seasonally adjusted.2 Indexes on a December 1997=100 base.3 Special index based on a substantially smaller sample.4 Indexes on a December 2007=100 base.5 Indexes on a December 2005=100 base.6 Indexes on a December 1986=100 base.7 Indexes on a December 1993=100 base.8 This index series was calculated using a Laspeyres estimator. All other item stratum index series were calculated using a geometric means
estimator.

9 Indexes on a December 2009=100 base.10 Indexes on a December 1990=100 base.11 Indexes on a December 1983=100 base.12 Indexes on a December 2001=100 base.13 Indexes on a December 1982=100 base.14 Indexes on a December 1996=100 base.NOTE: Index applies to a month as a whole, not to any specific date.

Table 3. Consumer Price Index for All Urban Consumers (CPI-U): U.S. city average, special aggregate indexes,March 2018[1982-84=100, unless otherwise noted]
Special aggregate indexes
Relativeimpor-tanceFeb.2018
Unadjusted indexes Unadjusted percentchange
Seasonally adjusted percentchange
Mar.2017
Feb.2018
Mar.2018
Mar.2017-Mar.2018
Feb.2018-Mar.2018
Dec.2017-Jan.2018
Jan.2018-Feb.2018
Feb.2018-Mar.2018
All items less food.. . . . . . . . . . . . . . . . . . . . . . . . . . . . . . . . . . 86.694 242.962 248.469 249.102 2.5 0.3 0.6 0.2 -0.1All items less shelter. . . . . . . . . . . . . . . . . . . . . . . . . . . . . . . . 67.303 226.469 230.358 230.692 1.9 0.1 0.7 0.1 -0.3All items less food and shelter. . . . . . . . . . . . . . . . . . . . . 53.997 220.508 224.545 224.927 2.0 0.2 0.8 0.2 -0.4All items less food, shelter, and energy. . . . . . . . . . 46.309 226.956 229.090 229.717 1.2 0.3 0.4 0.2 0.0All items less food, shelter, energy, and used
cars and trucks.. . . . . . . . . . . . . . . . . . . . . . . . . . . . . . . . . . . 43.902 232.304 234.707 235.187 1.2 0.2 0.4 0.2 0.1All items less medical care. . . . . . . . . . . . . . . . . . . . . . . . . 91.321 232.732 237.767 238.305 2.4 0.2 0.6 0.2 -0.1All items less energy. . . . . . . . . . . . . . . . . . . . . . . . . . . . . . . . 92.313 250.277 254.555 255.275 2.0 0.3 0.3 0.2 0.2Commodities. . . . . . . . . . . . . . . . . . . . . . . . . . . . . . . . . . . . . . . . . 37.455 181.136 183.385 183.780 1.5 0.2 1.0 -0.1 -0.6
Commodities less food, energy, and usedcars and trucks. . . . . . . . . . . . . . . . . . . . . . . . . . . . . . . . . 17.488 146.911 145.851 146.274 -0.4 0.3 0.4 0.1 -0.1
Commodities less food.. . . . . . . . . . . . . . . . . . . . . . . . . . 24.149 150.691 152.487 152.962 1.5 0.3 1.4 -0.1 -1.0Commodities less food and beverages. . . . . . . . 23.179 147.435 149.182 149.663 1.5 0.3 1.4 -0.1 -1.0
Services. . . . . . . . . . . . . . . . . . . . . . . . . . . . . . . . . . . . . . . . . . . . . . 62.545 305.590 313.608 314.337 2.9 0.2 0.3 0.3 0.2Services less rent of shelter1. . . . . . . . . . . . . . . . . . . . 30.220 327.067 334.488 334.676 2.3 0.1 0.2 0.5 0.2Services less medical care services. . . . . . . . . . . 55.606 290.423 298.306 298.978 2.9 0.2 0.2 0.4 0.3
Durables. . . . . . . . . . . . . . . . . . . . . . . . . . . . . . . . . . . . . . . . . . . . . . 10.087 106.343 104.626 105.046 -1.2 0.4 0.1 -0.4 0.0Nondurables.. . . . . . . . . . . . . . . . . . . . . . . . . . . . . . . . . . . . . . . . . 27.368 218.705 223.624 223.953 2.4 0.1 1.1 0.2 -0.7
Nondurables less food. . . . . . . . . . . . . . . . . . . . . . . . . . . 14.062 192.856 199.039 199.529 3.5 0.2 2.1 0.2 -1.5Nondurables less food and beverages. . . . . . . . 13.092 189.614 195.966 196.477 3.6 0.3 2.3 0.2 -1.6Nondurables less food, beverages, and
apparel. . . . . . . . . . . . . . . . . . . . . . . . . . . . . . . . . . . . . . . . . . 9.957 232.124 243.516 243.131 4.7 -0.2 2.2 -0.1 -1.7Nondurables less food and apparel. . . . . . . . . . . . 10.927 232.147 242.772 242.432 4.4 -0.1 2.0 0.0 -1.5
Housing.. . . . . . . . . . . . . . . . . . . . . . . . . . . . . . . . . . . . . . . . . . . . . . 41.663 248.978 255.713 256.388 3.0 0.3 0.2 0.3 0.3Education and communication2. . . . . . . . . . . . . . . . . . . . 6.624 136.234 136.327 136.029 -0.2 -0.2 0.1 -0.2 -0.2
Education2. . . . . . . . . . . . . . . . . . . . . . . . . . . . . . . . . . . . . . . . . 3.001 251.113 256.291 255.609 1.8 -0.3 0.1 0.2 -0.1Communication2. . . . . . . . . . . . . . . . . . . . . . . . . . . . . . . . . . 3.623 75.275 74.015 73.883 -1.8 -0.2 0.0 -0.6 -0.3
Information and information processing2. . . . 3.514 71.409 70.117 69.988 -2.0 -0.2 0.0 -0.6 -0.3Information technology, hardware and
services3. . . . . . . . . . . . . . . . . . . . . . . . . . . . . . . . . . . . . . 1.216 7.666 7.474 7.438 -3.0 -0.5 0.2 -1.1 -0.8Recreation2. . . . . . . . . . . . . . . . . . . . . . . . . . . . . . . . . . . . . . . . . . . 5.716 118.573 119.093 119.281 0.6 0.2 0.0 0.0 0.0
Video and audio2. . . . . . . . . . . . . . . . . . . . . . . . . . . . . . . . . 1.849 104.011 104.650 104.921 0.9 0.3 -0.2 -0.2 -0.3Pets, pet products and services2. . . . . . . . . . . . . . . 1.011 170.197 170.706 171.011 0.5 0.2 0.5 -0.2 0.2Photography2. . . . . . . . . . . . . . . . . . . . . . . . . . . . . . . . . . . . . . 0.074 75.883 74.383 74.728 -1.5 0.5 -1.3 0.7 0.5
Food and beverages. . . . . . . . . . . . . . . . . . . . . . . . . . . . . . . . 14.276 248.967 252.076 252.182 1.3 0.0 0.2 0.0 0.1Domestically produced farm food.. . . . . . . . . . . . . . 6.128 246.104 247.369 247.165 0.4 -0.1 0.0 -0.2 0.1
Other services. . . . . . . . . . . . . . . . . . . . . . . . . . . . . . . . . . . . . . . 11.546 346.601 350.392 350.476 1.1 0.0 0.1 0.0 -0.1Apparel less footwear. . . . . . . . . . . . . . . . . . . . . . . . . . . . . . . 2.462 121.342 120.049 121.481 0.1 1.2 2.0 1.5 -1.1Fuels and utilities. . . . . . . . . . . . . . . . . . . . . . . . . . . . . . . . . . . . 4.701 232.714 240.938 239.786 3.0 -0.5 -0.2 1.0 -0.2
Household energy. . . . . . . . . . . . . . . . . . . . . . . . . . . . . . . . 3.628 193.703 200.993 199.657 3.1 -0.7 -0.4 1.2 -0.3Medical care. . . . . . . . . . . . . . . . . . . . . . . . . . . . . . . . . . . . . . . . . 8.679 474.561 482.897 483.984 2.0 0.2 0.4 -0.1 0.4Transportation. . . . . . . . . . . . . . . . . . . . . . . . . . . . . . . . . . . . . . . 16.723 200.091 207.359 207.845 3.9 0.2 1.8 0.0 -1.2
Private transportation. . . . . . . . . . . . . . . . . . . . . . . . . . . . 15.551 194.890 202.935 203.343 4.3 0.2 2.0 0.0 -1.3New and used motor vehicles2. . . . . . . . . . . . . . . 7.059 99.582 99.010 99.552 0.0 0.5 0.2 -0.2 -0.1
Utilities and public transportation. . . . . . . . . . . . . . . . . . 9.489 214.482 217.061 216.906 1.1 -0.1 -0.2 0.8 0.0Household furnishings and operations. . . . . . . . . . . 4.264 121.548 121.376 121.484 -0.1 0.1 0.4 0.3 0.1Other goods and services. . . . . . . . . . . . . . . . . . . . . . . . . . 3.184 428.336 438.306 439.269 2.6 0.2 0.4 0.2 0.2
Personal care. . . . . . . . . . . . . . . . . . . . . . . . . . . . . . . . . . . . . 2.538 226.301 229.218 230.011 1.6 0.3 0.5 0.2 0.3
1 Indexes on a December 1982=100 base.2 Indexes on a December 1997=100 base.3 Indexes on a December 1988=100 base.NOTE: Index applies to a month as a whole, not to any specific date.

Table 4. Consumer Price Index for All Urban Consumers (CPI-U): Selected areas, all items index, March 2018[1982-84=100, unless otherwise noted]
AreaPricing
Schedule1
Percent change to Mar. 2018 from: Percent change to Feb. 2018 from:
Mar.2017
Jan.2018
Feb.2018
Feb.2017
Dec.2017
Jan.2018
U.S. city average. . . . . . . . . . . . . . . . . . . . . . . . . . . . . . . . . . . . . . . . . . . . . . . M 2.4 0.7 0.2 2.2 1.0 0.5
Region and area size2
Northeast. . . . . . . . . . . . . . . . . . . . . . . . . . . . . . . . . . . . . . . . . . . . . . . . . . . . . . M 2.0 0.5 0.1 1.7 0.9 0.4Northeast - Size Class A.. . . . . . . . . . . . . . . . . . . . . . . . . . . . . . . . M 1.9 0.6 0.1 1.7 0.9 0.5Northeast - Size Class B/C3. . . . . . . . . . . . . . . . . . . . . . . . . . . . . M 2.1 0.5 0.1 1.8 1.0 0.3New England4. . . . . . . . . . . . . . . . . . . . . . . . . . . . . . . . . . . . . . . . . . . . . M 0.7 0.3 1.1 0.4Middle Atlantic4. . . . . . . . . . . . . . . . . . . . . . . . . . . . . . . . . . . . . . . . . . . . M 0.5 0.0 0.9 0.4
Midwest. . . . . . . . . . . . . . . . . . . . . . . . . . . . . . . . . . . . . . . . . . . . . . . . . . . . . . . M 1.8 0.4 0.2 1.7 0.9 0.2Midwest - Size Class A.. . . . . . . . . . . . . . . . . . . . . . . . . . . . . . . . . . M 1.8 0.3 0.2 1.7 0.7 0.1Midwest - Size Class B/C3. . . . . . . . . . . . . . . . . . . . . . . . . . . . . . . M 1.4 0.5 0.2 1.2 1.0 0.3East North Central4. . . . . . . . . . . . . . . . . . . . . . . . . . . . . . . . . . . . . . . M 0.2 0.1 0.8 0.1West North Central4. . . . . . . . . . . . . . . . . . . . . . . . . . . . . . . . . . . . . . . M 0.8 0.3 1.0 0.5
South. . . . . . . . . . . . . . . . . . . . . . . . . . . . . . . . . . . . . . . . . . . . . . . . . . . . . . . . . . M 2.3 0.8 0.2 2.1 1.1 0.6South - Size Class A.. . . . . . . . . . . . . . . . . . . . . . . . . . . . . . . . . . . . . M 2.6 0.8 0.0 2.7 1.2 0.8South - Size Class B/C3. . . . . . . . . . . . . . . . . . . . . . . . . . . . . . . . . . M 2.1 0.7 0.3 1.9 1.1 0.4South Atlantic4. . . . . . . . . . . . . . . . . . . . . . . . . . . . . . . . . . . . . . . . . . . . . M 0.9 0.3 1.3 0.6East South Central4. . . . . . . . . . . . . . . . . . . . . . . . . . . . . . . . . . . . . . . M 0.8 0.3 1.0 0.4West South Central4. . . . . . . . . . . . . . . . . . . . . . . . . . . . . . . . . . . . . . M 0.5 -0.1 0.8 0.5
West. . . . . . . . . . . . . . . . . . . . . . . . . . . . . . . . . . . . . . . . . . . . . . . . . . . . . . . . . . . M 3.2 0.9 0.4 3.1 1.0 0.5West - Size Class A. . . . . . . . . . . . . . . . . . . . . . . . . . . . . . . . . . . . . . M 3.5 1.0 0.4 3.4 1.2 0.6West - Size Class B/C3.. . . . . . . . . . . . . . . . . . . . . . . . . . . . . . . . . . M 2.6 0.8 0.3 2.5 0.9 0.4Mountain4. . . . . . . . . . . . . . . . . . . . . . . . . . . . . . . . . . . . . . . . . . . . . . . . . . . M 0.7 0.3 0.9 0.5Pacific4. . . . . . . . . . . . . . . . . . . . . . . . . . . . . . . . . . . . . . . . . . . . . . . . . . . . . . M 1.0 0.4 1.1 0.5
Size classes
Size Class A5.. . . . . . . . . . . . . . . . . . . . . . . . . . . . . . . . . . . . . . . . . . . . . . . . M 2.5 0.7 0.2 2.4 1.0 0.5Size Class B/C3. . . . . . . . . . . . . . . . . . . . . . . . . . . . . . . . . . . . . . . . . . . . . . M 2.1 0.6 0.3 1.8 1.0 0.4
Selected local areas
Chicago-Naperville-Elgin, IL-IN-WI. . . . . . . . . . . . . . . . . . . . . . . . M 1.8 0.1 0.0 1.6 0.9 0.0Los Angeles-Long Beach-Anaheim, CA. . . . . . . . . . . . . . . . . . M 3.8 1.1 0.4 3.6 1.5 0.7New York-Newark-Jersey City, NY-NJ-PA. . . . . . . . . . . . . . . M 1.7 0.5 0.0 1.7 1.0 0.5
Atlanta-Sandy Springs-Roswell, GA.. . . . . . . . . . . . . . . . . . . . . . 2 3.3 1.2Baltimore-Columbia-Towson, MD6.. . . . . . . . . . . . . . . . . . . . . . . . 2 1.0Detroit-Warren-Dearborn, MI. . . . . . . . . . . . . . . . . . . . . . . . . . . . . . . 2 2.1 0.3Houston-The Woodlands-Sugar Land, TX.. . . . . . . . . . . . . . . 2 2.6 1.4Miami-Fort Lauderdale-West Palm Beach, FL. . . . . . . . . . . 2 3.2 2.6Philadelphia-Camden-Wilmington, PA-NJ-DE-MD. . . . . . . 2 0.5 0.4Phoenix-Mesa-Scottsdale, AZ7. . . . . . . . . . . . . . . . . . . . . . . . . . . . . 2 1.8San Francisco-Oakland-Hayward, CA.. . . . . . . . . . . . . . . . . . . . 2 3.6 1.4Seattle-Tacoma-Bellevue, WA.. . . . . . . . . . . . . . . . . . . . . . . . . . . . 2 3.3 0.8St. Louis, MO-IL. . . . . . . . . . . . . . . . . . . . . . . . . . . . . . . . . . . . . . . . . . . . . . 2 0.8Urban Alaska.. . . . . . . . . . . . . . . . . . . . . . . . . . . . . . . . . . . . . . . . . . . . . . . . 2 0.6
Boston-Cambridge-Newton, MA-NH.. . . . . . . . . . . . . . . . . . . . . . 1 3.6 0.9Dallas-Fort Worth-Arlington, TX.. . . . . . . . . . . . . . . . . . . . . . . . . . . 1 2.9 0.5Denver-Aurora-Lakewood, CO.. . . . . . . . . . . . . . . . . . . . . . . . . . . . 1 0.3Minneapolis-St.Paul-Bloomington, MN-WI. . . . . . . . . . . . . . . . 1 0.5Riverside-San Bernardino-Ontario, CA4.. . . . . . . . . . . . . . . . . . 1 1.0San Diego-Carlsbad, CA.. . . . . . . . . . . . . . . . . . . . . . . . . . . . . . . . . . . 1 0.9Tampa-St. Petersburg-Clearwater, FL8. . . . . . . . . . . . . . . . . . . 1 0.6Urban Hawaii. . . . . . . . . . . . . . . . . . . . . . . . . . . . . . . . . . . . . . . . . . . . . . . . . 1 0.5Washington-Arlington-Alexandria, DC-VA-MD-WV6. . . . . 1 1.8 -0.1
1 Foods, fuels, and several other items are priced every month in all areas. Most other goods and services are priced as indicated: M - Every month.1 - January, March, May, July, September, and November. 2 - February, April, June, August, October, and December.
2 Regions defined as the four Census regions.

3 Indexes on a December 1996=100 base.4 Indexes on a December 2017=100 base.5 Indexes on a December 1986=100 base.6 1998 - 2017 indexes based on substantially smaller sample.7 Indexes on a December 2001=100 base.8 Indexes on a 1987=100 base.NOTE: Local area indexes are byproducts of the national CPI program. Each local index has a smaller sample size than the national index and is,therefore, subject to substantially more sampling and other measurement error. As a result, local area indexes show greater volatility than the nationalindex, although their long-term trends are similar. Therefore, the Bureau of Labor Statistics strongly urges users to consider adopting the nationalaverage CPI for use in their escalator clauses.NOTE: Index applies to a month as a whole, not to any specific date.
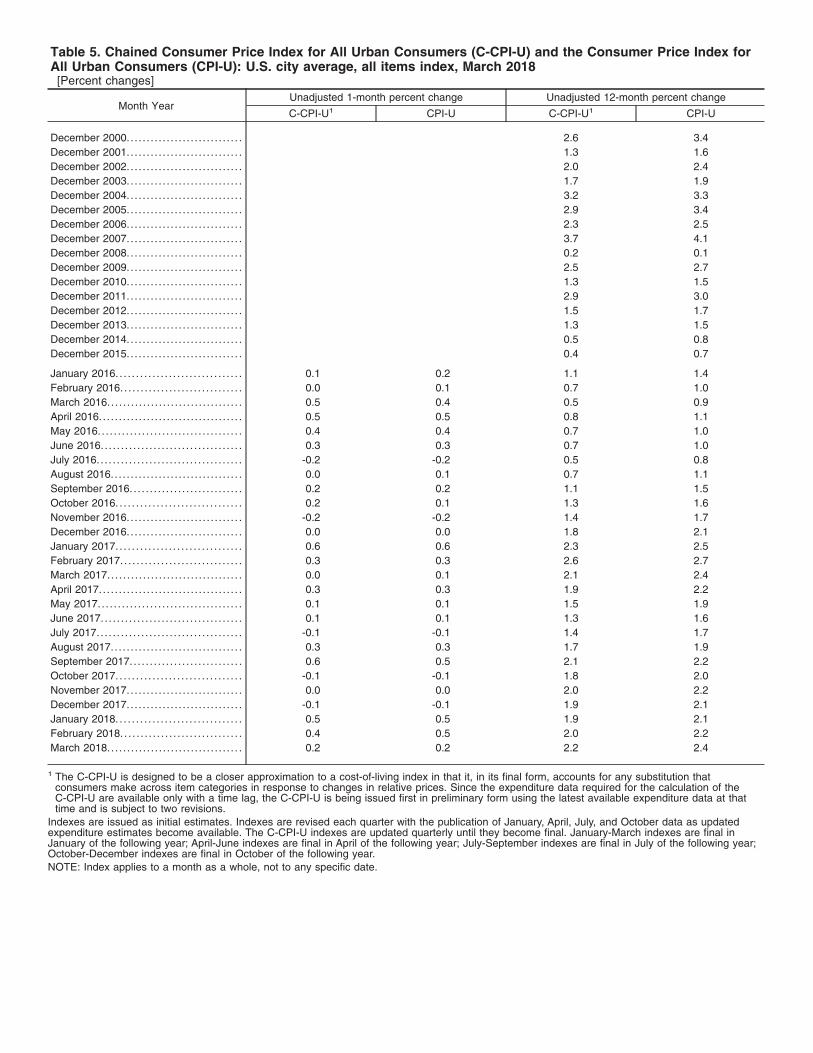
Table 5. Chained Consumer Price Index for All Urban Consumers (C-CPI-U) and the Consumer Price Index forAll Urban Consumers (CPI-U): U.S. city average, all items index, March 2018[Percent changes]
Month YearUnadjusted 1-month percent change Unadjusted 12-month percent change
C-CPI-U1 CPI-U C-CPI-U1 CPI-U
December 2000.. . . . . . . . . . . . . . . . . . . . . . . . . . . . 2.6 3.4December 2001.. . . . . . . . . . . . . . . . . . . . . . . . . . . . 1.3 1.6December 2002.. . . . . . . . . . . . . . . . . . . . . . . . . . . . 2.0 2.4December 2003.. . . . . . . . . . . . . . . . . . . . . . . . . . . . 1.7 1.9December 2004.. . . . . . . . . . . . . . . . . . . . . . . . . . . . 3.2 3.3December 2005.. . . . . . . . . . . . . . . . . . . . . . . . . . . . 2.9 3.4December 2006.. . . . . . . . . . . . . . . . . . . . . . . . . . . . 2.3 2.5December 2007.. . . . . . . . . . . . . . . . . . . . . . . . . . . . 3.7 4.1December 2008.. . . . . . . . . . . . . . . . . . . . . . . . . . . . 0.2 0.1December 2009.. . . . . . . . . . . . . . . . . . . . . . . . . . . . 2.5 2.7December 2010.. . . . . . . . . . . . . . . . . . . . . . . . . . . . 1.3 1.5December 2011.. . . . . . . . . . . . . . . . . . . . . . . . . . . . 2.9 3.0December 2012.. . . . . . . . . . . . . . . . . . . . . . . . . . . . 1.5 1.7December 2013.. . . . . . . . . . . . . . . . . . . . . . . . . . . . 1.3 1.5December 2014.. . . . . . . . . . . . . . . . . . . . . . . . . . . . 0.5 0.8December 2015.. . . . . . . . . . . . . . . . . . . . . . . . . . . . 0.4 0.7
January 2016. . . . . . . . . . . . . . . . . . . . . . . . . . . . . . . 0.1 0.2 1.1 1.4February 2016. . . . . . . . . . . . . . . . . . . . . . . . . . . . . . 0.0 0.1 0.7 1.0March 2016.. . . . . . . . . . . . . . . . . . . . . . . . . . . . . . . . . 0.5 0.4 0.5 0.9April 2016.. . . . . . . . . . . . . . . . . . . . . . . . . . . . . . . . . . . 0.5 0.5 0.8 1.1May 2016.. . . . . . . . . . . . . . . . . . . . . . . . . . . . . . . . . . . 0.4 0.4 0.7 1.0June 2016. . . . . . . . . . . . . . . . . . . . . . . . . . . . . . . . . . . 0.3 0.3 0.7 1.0July 2016. . . . . . . . . . . . . . . . . . . . . . . . . . . . . . . . . . . . -0.2 -0.2 0.5 0.8August 2016.. . . . . . . . . . . . . . . . . . . . . . . . . . . . . . . . 0.0 0.1 0.7 1.1September 2016.. . . . . . . . . . . . . . . . . . . . . . . . . . . 0.2 0.2 1.1 1.5October 2016. . . . . . . . . . . . . . . . . . . . . . . . . . . . . . . 0.2 0.1 1.3 1.6November 2016.. . . . . . . . . . . . . . . . . . . . . . . . . . . . -0.2 -0.2 1.4 1.7December 2016.. . . . . . . . . . . . . . . . . . . . . . . . . . . . 0.0 0.0 1.8 2.1January 2017. . . . . . . . . . . . . . . . . . . . . . . . . . . . . . . 0.6 0.6 2.3 2.5February 2017. . . . . . . . . . . . . . . . . . . . . . . . . . . . . . 0.3 0.3 2.6 2.7March 2017.. . . . . . . . . . . . . . . . . . . . . . . . . . . . . . . . . 0.0 0.1 2.1 2.4April 2017.. . . . . . . . . . . . . . . . . . . . . . . . . . . . . . . . . . . 0.3 0.3 1.9 2.2May 2017.. . . . . . . . . . . . . . . . . . . . . . . . . . . . . . . . . . . 0.1 0.1 1.5 1.9June 2017. . . . . . . . . . . . . . . . . . . . . . . . . . . . . . . . . . . 0.1 0.1 1.3 1.6July 2017. . . . . . . . . . . . . . . . . . . . . . . . . . . . . . . . . . . . -0.1 -0.1 1.4 1.7August 2017.. . . . . . . . . . . . . . . . . . . . . . . . . . . . . . . . 0.3 0.3 1.7 1.9September 2017.. . . . . . . . . . . . . . . . . . . . . . . . . . . 0.6 0.5 2.1 2.2October 2017. . . . . . . . . . . . . . . . . . . . . . . . . . . . . . . -0.1 -0.1 1.8 2.0November 2017.. . . . . . . . . . . . . . . . . . . . . . . . . . . . 0.0 0.0 2.0 2.2December 2017.. . . . . . . . . . . . . . . . . . . . . . . . . . . . -0.1 -0.1 1.9 2.1January 2018. . . . . . . . . . . . . . . . . . . . . . . . . . . . . . . 0.5 0.5 1.9 2.1February 2018. . . . . . . . . . . . . . . . . . . . . . . . . . . . . . 0.4 0.5 2.0 2.2March 2018.. . . . . . . . . . . . . . . . . . . . . . . . . . . . . . . . . 0.2 0.2 2.2 2.4
1 The C-CPI-U is designed to be a closer approximation to a cost-of-living index in that it, in its final form, accounts for any substitution thatconsumers make across item categories in response to changes in relative prices. Since the expenditure data required for the calculation of theC-CPI-U are available only with a time lag, the C-CPI-U is being issued first in preliminary form using the latest available expenditure data at thattime and is subject to two revisions.
Indexes are issued as initial estimates. Indexes are revised each quarter with the publication of January, April, July, and October data as updatedexpenditure estimates become available. The C-CPI-U indexes are updated quarterly until they become final. January-March indexes are final inJanuary of the following year; April-June indexes are final in April of the following year; July-September indexes are final in July of the following year;October-December indexes are final in October of the following year.NOTE: Index applies to a month as a whole, not to any specific date.
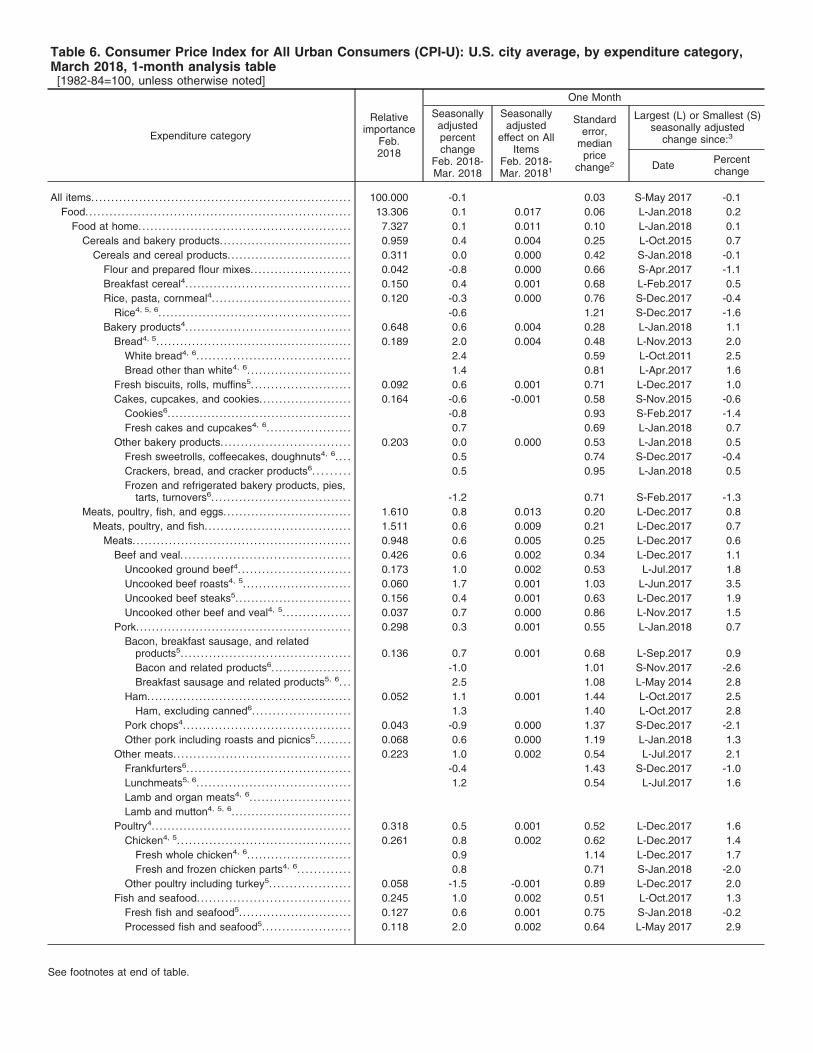
Table 6. Consumer Price Index for All Urban Consumers (CPI-U): U.S. city average, by expenditure category,March 2018, 1-month analysis table[1982-84=100, unless otherwise noted]
Expenditure category
Relativeimportance
Feb.2018
One Month
Seasonallyadjustedpercentchange
Feb. 2018-Mar. 2018
Seasonallyadjusted
effect on AllItems
Feb. 2018-Mar. 20181
Standarderror,
medianprice
change2
Largest (L) or Smallest (S)seasonally adjusted
change since:3
Date Percentchange
All items.. . . . . . . . . . . . . . . . . . . . . . . . . . . . . . . . . . . . . . . . . . . . . . . . . . . . . . . . . . . . . . . . 100.000 -0.1 0.03 S-May 2017 -0.1Food.. . . . . . . . . . . . . . . . . . . . . . . . . . . . . . . . . . . . . . . . . . . . . . . . . . . . . . . . . . . . . . . . . 13.306 0.1 0.017 0.06 L-Jan.2018 0.2
Food at home.. . . . . . . . . . . . . . . . . . . . . . . . . . . . . . . . . . . . . . . . . . . . . . . . . . . . 7.327 0.1 0.011 0.10 L-Jan.2018 0.1Cereals and bakery products. . . . . . . . . . . . . . . . . . . . . . . . . . . . . . . . . 0.959 0.4 0.004 0.25 L-Oct.2015 0.7
Cereals and cereal products. . . . . . . . . . . . . . . . . . . . . . . . . . . . . . . 0.311 0.0 0.000 0.42 S-Jan.2018 -0.1Flour and prepared flour mixes. . . . . . . . . . . . . . . . . . . . . . . . . 0.042 -0.8 0.000 0.66 S-Apr.2017 -1.1Breakfast cereal4. . . . . . . . . . . . . . . . . . . . . . . . . . . . . . . . . . . . . . . . . 0.150 0.4 0.001 0.68 L-Feb.2017 0.5Rice, pasta, cornmeal4. . . . . . . . . . . . . . . . . . . . . . . . . . . . . . . . . . . 0.120 -0.3 0.000 0.76 S-Dec.2017 -0.4
Rice4, 5, 6. . . . . . . . . . . . . . . . . . . . . . . . . . . . . . . . . . . . . . . . . . . . . . . . -0.6 1.21 S-Dec.2017 -1.6Bakery products4. . . . . . . . . . . . . . . . . . . . . . . . . . . . . . . . . . . . . . . . . 0.648 0.6 0.004 0.28 L-Jan.2018 1.1
Bread4, 5. . . . . . . . . . . . . . . . . . . . . . . . . . . . . . . . . . . . . . . . . . . . . . . . . 0.189 2.0 0.004 0.48 L-Nov.2013 2.0White bread4, 6. . . . . . . . . . . . . . . . . . . . . . . . . . . . . . . . . . . . . . 2.4 0.59 L-Oct.2011 2.5Bread other than white4, 6. . . . . . . . . . . . . . . . . . . . . . . . . . 1.4 0.81 L-Apr.2017 1.6
Fresh biscuits, rolls, muffins5. . . . . . . . . . . . . . . . . . . . . . . . . 0.092 0.6 0.001 0.71 L-Dec.2017 1.0Cakes, cupcakes, and cookies. . . . . . . . . . . . . . . . . . . . . . . 0.164 -0.6 -0.001 0.58 S-Nov.2015 -0.6
Cookies6. . . . . . . . . . . . . . . . . . . . . . . . . . . . . . . . . . . . . . . . . . . . . . -0.8 0.93 S-Feb.2017 -1.4Fresh cakes and cupcakes4, 6. . . . . . . . . . . . . . . . . . . . . 0.7 0.69 L-Jan.2018 0.7
Other bakery products. . . . . . . . . . . . . . . . . . . . . . . . . . . . . . . . 0.203 0.0 0.000 0.53 L-Jan.2018 0.5Fresh sweetrolls, coffeecakes, doughnuts4, 6. . . . 0.5 0.74 S-Dec.2017 -0.4Crackers, bread, and cracker products6. . . . . . . . . 0.5 0.95 L-Jan.2018 0.5Frozen and refrigerated bakery products, pies,
tarts, turnovers6. . . . . . . . . . . . . . . . . . . . . . . . . . . . . . . . . . . -1.2 0.71 S-Feb.2017 -1.3Meats, poultry, fish, and eggs.. . . . . . . . . . . . . . . . . . . . . . . . . . . . . . . 1.610 0.8 0.013 0.20 L-Dec.2017 0.8
Meats, poultry, and fish. . . . . . . . . . . . . . . . . . . . . . . . . . . . . . . . . . . . 1.511 0.6 0.009 0.21 L-Dec.2017 0.7Meats. . . . . . . . . . . . . . . . . . . . . . . . . . . . . . . . . . . . . . . . . . . . . . . . . . . . . . 0.948 0.6 0.005 0.25 L-Dec.2017 0.6
Beef and veal. . . . . . . . . . . . . . . . . . . . . . . . . . . . . . . . . . . . . . . . . . 0.426 0.6 0.002 0.34 L-Dec.2017 1.1Uncooked ground beef4. . . . . . . . . . . . . . . . . . . . . . . . . . . . 0.173 1.0 0.002 0.53 L-Jul.2017 1.8Uncooked beef roasts4, 5. . . . . . . . . . . . . . . . . . . . . . . . . . . 0.060 1.7 0.001 1.03 L-Jun.2017 3.5Uncooked beef steaks5. . . . . . . . . . . . . . . . . . . . . . . . . . . . . 0.156 0.4 0.001 0.63 L-Dec.2017 1.9Uncooked other beef and veal4, 5. . . . . . . . . . . . . . . . . 0.037 0.7 0.000 0.86 L-Nov.2017 1.5
Pork.. . . . . . . . . . . . . . . . . . . . . . . . . . . . . . . . . . . . . . . . . . . . . . . . . . . . . 0.298 0.3 0.001 0.55 L-Jan.2018 0.7Bacon, breakfast sausage, and related
products5. . . . . . . . . . . . . . . . . . . . . . . . . . . . . . . . . . . . . . . . . . 0.136 0.7 0.001 0.68 L-Sep.2017 0.9Bacon and related products6. . . . . . . . . . . . . . . . . . . . -1.0 1.01 S-Nov.2017 -2.6Breakfast sausage and related products5, 6. . . 2.5 1.08 L-May 2014 2.8
Ham... . . . . . . . . . . . . . . . . . . . . . . . . . . . . . . . . . . . . . . . . . . . . . . . . 0.052 1.1 0.001 1.44 L-Oct.2017 2.5Ham, excluding canned6. . . . . . . . . . . . . . . . . . . . . . . . 1.3 1.40 L-Oct.2017 2.8
Pork chops4. . . . . . . . . . . . . . . . . . . . . . . . . . . . . . . . . . . . . . . . . . 0.043 -0.9 0.000 1.37 S-Dec.2017 -2.1Other pork including roasts and picnics5. . . . . . . . . 0.068 0.6 0.000 1.19 L-Jan.2018 1.3
Other meats. . . . . . . . . . . . . . . . . . . . . . . . . . . . . . . . . . . . . . . . . . . . 0.223 1.0 0.002 0.54 L-Jul.2017 2.1Frankfurters6. . . . . . . . . . . . . . . . . . . . . . . . . . . . . . . . . . . . . . . . . -0.4 1.43 S-Dec.2017 -1.0Lunchmeats5, 6. . . . . . . . . . . . . . . . . . . . . . . . . . . . . . . . . . . . . . 1.2 0.54 L-Jul.2017 1.6Lamb and organ meats4, 6. . . . . . . . . . . . . . . . . . . . . . . . .Lamb and mutton4, 5, 6. . . . . . . . . . . . . . . . . . . . . . . . . . . . . .
Poultry4. . . . . . . . . . . . . . . . . . . . . . . . . . . . . . . . . . . . . . . . . . . . . . . . . . 0.318 0.5 0.001 0.52 L-Dec.2017 1.6Chicken4, 5. . . . . . . . . . . . . . . . . . . . . . . . . . . . . . . . . . . . . . . . . . . 0.261 0.8 0.002 0.62 L-Dec.2017 1.4
Fresh whole chicken4, 6. . . . . . . . . . . . . . . . . . . . . . . . . . 0.9 1.14 L-Dec.2017 1.7Fresh and frozen chicken parts4, 6. . . . . . . . . . . . . 0.8 0.71 S-Jan.2018 -2.0
Other poultry including turkey5. . . . . . . . . . . . . . . . . . . . 0.058 -1.5 -0.001 0.89 L-Dec.2017 2.0Fish and seafood. . . . . . . . . . . . . . . . . . . . . . . . . . . . . . . . . . . . . . 0.245 1.0 0.002 0.51 L-Oct.2017 1.3
Fresh fish and seafood5. . . . . . . . . . . . . . . . . . . . . . . . . . . . 0.127 0.6 0.001 0.75 S-Jan.2018 -0.2Processed fish and seafood5. . . . . . . . . . . . . . . . . . . . . . 0.118 2.0 0.002 0.64 L-May 2017 2.9
See footnotes at end of table.
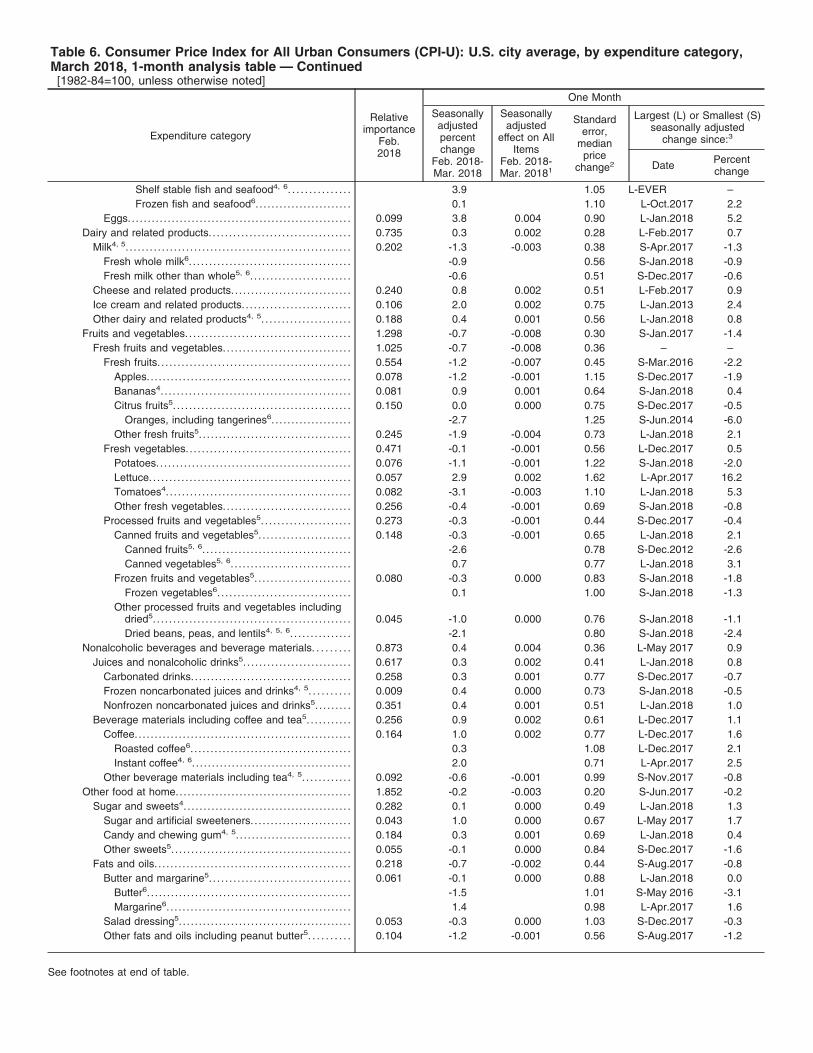
Table 6. Consumer Price Index for All Urban Consumers (CPI-U): U.S. city average, by expenditure category,March 2018, 1-month analysis table — Continued[1982-84=100, unless otherwise noted]
Expenditure category
Relativeimportance
Feb.2018
One Month
Seasonallyadjustedpercentchange
Feb. 2018-Mar. 2018
Seasonallyadjusted
effect on AllItems
Feb. 2018-Mar. 20181
Standarderror,
medianprice
change2
Largest (L) or Smallest (S)seasonally adjusted
change since:3
Date Percentchange
Shelf stable fish and seafood4, 6. . . . . . . . . . . . . . . 3.9 1.05 L-EVER –Frozen fish and seafood6. . . . . . . . . . . . . . . . . . . . . . . . 0.1 1.10 L-Oct.2017 2.2
Eggs.. . . . . . . . . . . . . . . . . . . . . . . . . . . . . . . . . . . . . . . . . . . . . . . . . . . . . . . 0.099 3.8 0.004 0.90 L-Jan.2018 5.2Dairy and related products. . . . . . . . . . . . . . . . . . . . . . . . . . . . . . . . . . . 0.735 0.3 0.002 0.28 L-Feb.2017 0.7
Milk4, 5. . . . . . . . . . . . . . . . . . . . . . . . . . . . . . . . . . . . . . . . . . . . . . . . . . . . . . . . 0.202 -1.3 -0.003 0.38 S-Apr.2017 -1.3Fresh whole milk6. . . . . . . . . . . . . . . . . . . . . . . . . . . . . . . . . . . . . . . . -0.9 0.56 S-Jan.2018 -0.9Fresh milk other than whole5, 6. . . . . . . . . . . . . . . . . . . . . . . . . -0.6 0.51 S-Dec.2017 -0.6
Cheese and related products. . . . . . . . . . . . . . . . . . . . . . . . . . . . . . 0.240 0.8 0.002 0.51 L-Feb.2017 0.9Ice cream and related products. . . . . . . . . . . . . . . . . . . . . . . . . . . 0.106 2.0 0.002 0.75 L-Jan.2013 2.4Other dairy and related products4, 5. . . . . . . . . . . . . . . . . . . . . . 0.188 0.4 0.001 0.56 L-Jan.2018 0.8
Fruits and vegetables. . . . . . . . . . . . . . . . . . . . . . . . . . . . . . . . . . . . . . . . . 1.298 -0.7 -0.008 0.30 S-Jan.2017 -1.4Fresh fruits and vegetables. . . . . . . . . . . . . . . . . . . . . . . . . . . . . . . . 1.025 -0.7 -0.008 0.36 – –
Fresh fruits. . . . . . . . . . . . . . . . . . . . . . . . . . . . . . . . . . . . . . . . . . . . . . . . 0.554 -1.2 -0.007 0.45 S-Mar.2016 -2.2Apples. . . . . . . . . . . . . . . . . . . . . . . . . . . . . . . . . . . . . . . . . . . . . . . . . . . 0.078 -1.2 -0.001 1.15 S-Dec.2017 -1.9Bananas4. . . . . . . . . . . . . . . . . . . . . . . . . . . . . . . . . . . . . . . . . . . . . . . 0.081 0.9 0.001 0.64 S-Jan.2018 0.4Citrus fruits5. . . . . . . . . . . . . . . . . . . . . . . . . . . . . . . . . . . . . . . . . . . . 0.150 0.0 0.000 0.75 S-Dec.2017 -0.5
Oranges, including tangerines6. . . . . . . . . . . . . . . . . . . . -2.7 1.25 S-Jun.2014 -6.0Other fresh fruits5. . . . . . . . . . . . . . . . . . . . . . . . . . . . . . . . . . . . . . 0.245 -1.9 -0.004 0.73 L-Jan.2018 2.1
Fresh vegetables. . . . . . . . . . . . . . . . . . . . . . . . . . . . . . . . . . . . . . . . . 0.471 -0.1 -0.001 0.56 L-Dec.2017 0.5Potatoes.. . . . . . . . . . . . . . . . . . . . . . . . . . . . . . . . . . . . . . . . . . . . . . . . 0.076 -1.1 -0.001 1.22 S-Jan.2018 -2.0Lettuce. . . . . . . . . . . . . . . . . . . . . . . . . . . . . . . . . . . . . . . . . . . . . . . . . . 0.057 2.9 0.002 1.62 L-Apr.2017 16.2Tomatoes4. . . . . . . . . . . . . . . . . . . . . . . . . . . . . . . . . . . . . . . . . . . . . . 0.082 -3.1 -0.003 1.10 L-Jan.2018 5.3Other fresh vegetables. . . . . . . . . . . . . . . . . . . . . . . . . . . . . . . . 0.256 -0.4 -0.001 0.69 S-Jan.2018 -0.8
Processed fruits and vegetables5. . . . . . . . . . . . . . . . . . . . . . 0.273 -0.3 -0.001 0.44 S-Dec.2017 -0.4Canned fruits and vegetables5. . . . . . . . . . . . . . . . . . . . . . . 0.148 -0.3 -0.001 0.65 L-Jan.2018 2.1
Canned fruits5, 6. . . . . . . . . . . . . . . . . . . . . . . . . . . . . . . . . . . . . -2.6 0.78 S-Dec.2012 -2.6Canned vegetables5, 6. . . . . . . . . . . . . . . . . . . . . . . . . . . . . . 0.7 0.77 L-Jan.2018 3.1
Frozen fruits and vegetables5. . . . . . . . . . . . . . . . . . . . . . . . 0.080 -0.3 0.000 0.83 S-Jan.2018 -1.8Frozen vegetables6. . . . . . . . . . . . . . . . . . . . . . . . . . . . . . . . . 0.1 1.00 S-Jan.2018 -1.3
Other processed fruits and vegetables includingdried5. . . . . . . . . . . . . . . . . . . . . . . . . . . . . . . . . . . . . . . . . . . . . . . . . 0.045 -1.0 0.000 0.76 S-Jan.2018 -1.1Dried beans, peas, and lentils4, 5, 6. . . . . . . . . . . . . . . -2.1 0.80 S-Jan.2018 -2.4
Nonalcoholic beverages and beverage materials. . . . . . . . . 0.873 0.4 0.004 0.36 L-May 2017 0.9Juices and nonalcoholic drinks5. . . . . . . . . . . . . . . . . . . . . . . . . . . 0.617 0.3 0.002 0.41 L-Jan.2018 0.8
Carbonated drinks. . . . . . . . . . . . . . . . . . . . . . . . . . . . . . . . . . . . . . . . 0.258 0.3 0.001 0.77 S-Dec.2017 -0.7Frozen noncarbonated juices and drinks4, 5. . . . . . . . . . 0.009 0.4 0.000 0.73 S-Jan.2018 -0.5Nonfrozen noncarbonated juices and drinks5. . . . . . . . . 0.351 0.4 0.001 0.51 L-Jan.2018 1.0
Beverage materials including coffee and tea5. . . . . . . . . . . 0.256 0.9 0.002 0.61 L-Dec.2017 1.1Coffee. . . . . . . . . . . . . . . . . . . . . . . . . . . . . . . . . . . . . . . . . . . . . . . . . . . . . . 0.164 1.0 0.002 0.77 L-Dec.2017 1.6
Roasted coffee6. . . . . . . . . . . . . . . . . . . . . . . . . . . . . . . . . . . . . . . . 0.3 1.08 L-Dec.2017 2.1Instant coffee4, 6. . . . . . . . . . . . . . . . . . . . . . . . . . . . . . . . . . . . . . . . 2.0 0.71 L-Apr.2017 2.5
Other beverage materials including tea4, 5. . . . . . . . . . . . 0.092 -0.6 -0.001 0.99 S-Nov.2017 -0.8Other food at home.. . . . . . . . . . . . . . . . . . . . . . . . . . . . . . . . . . . . . . . . . . . 1.852 -0.2 -0.003 0.20 S-Jun.2017 -0.2
Sugar and sweets4. . . . . . . . . . . . . . . . . . . . . . . . . . . . . . . . . . . . . . . . . . 0.282 0.1 0.000 0.49 L-Jan.2018 1.3Sugar and artificial sweeteners. . . . . . . . . . . . . . . . . . . . . . . . . 0.043 1.0 0.000 0.67 L-May 2017 1.7Candy and chewing gum4, 5. . . . . . . . . . . . . . . . . . . . . . . . . . . . . 0.184 0.3 0.001 0.69 L-Jan.2018 0.4Other sweets5. . . . . . . . . . . . . . . . . . . . . . . . . . . . . . . . . . . . . . . . . . . . . 0.055 -0.1 0.000 0.84 S-Dec.2017 -1.6
Fats and oils. . . . . . . . . . . . . . . . . . . . . . . . . . . . . . . . . . . . . . . . . . . . . . . . . 0.218 -0.7 -0.002 0.44 S-Aug.2017 -0.8Butter and margarine5. . . . . . . . . . . . . . . . . . . . . . . . . . . . . . . . . . . 0.061 -0.1 0.000 0.88 L-Jan.2018 0.0
Butter6. . . . . . . . . . . . . . . . . . . . . . . . . . . . . . . . . . . . . . . . . . . . . . . . . . . -1.5 1.01 S-May 2016 -3.1Margarine6. . . . . . . . . . . . . . . . . . . . . . . . . . . . . . . . . . . . . . . . . . . . . . 1.4 0.98 L-Apr.2017 1.6
Salad dressing5. . . . . . . . . . . . . . . . . . . . . . . . . . . . . . . . . . . . . . . . . . . 0.053 -0.3 0.000 1.03 S-Dec.2017 -0.3Other fats and oils including peanut butter5. . . . . . . . . . 0.104 -1.2 -0.001 0.56 S-Aug.2017 -1.2
See footnotes at end of table.
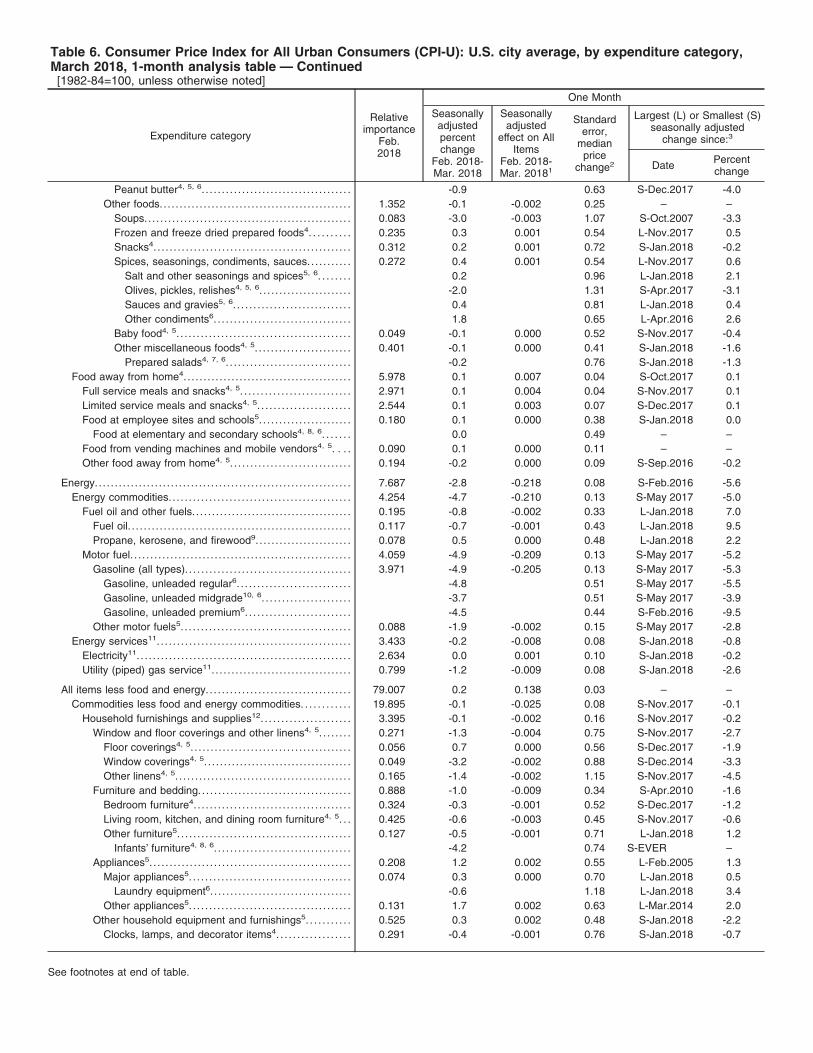
Table 6. Consumer Price Index for All Urban Consumers (CPI-U): U.S. city average, by expenditure category,March 2018, 1-month analysis table — Continued[1982-84=100, unless otherwise noted]
Expenditure category
Relativeimportance
Feb.2018
One Month
Seasonallyadjustedpercentchange
Feb. 2018-Mar. 2018
Seasonallyadjusted
effect on AllItems
Feb. 2018-Mar. 20181
Standarderror,
medianprice
change2
Largest (L) or Smallest (S)seasonally adjusted
change since:3
Date Percentchange
Peanut butter4, 5, 6. . . . . . . . . . . . . . . . . . . . . . . . . . . . . . . . . . . . . -0.9 0.63 S-Dec.2017 -4.0Other foods.. . . . . . . . . . . . . . . . . . . . . . . . . . . . . . . . . . . . . . . . . . . . . . . 1.352 -0.1 -0.002 0.25 – –
Soups.. . . . . . . . . . . . . . . . . . . . . . . . . . . . . . . . . . . . . . . . . . . . . . . . . . . 0.083 -3.0 -0.003 1.07 S-Oct.2007 -3.3Frozen and freeze dried prepared foods4. . . . . . . . . . 0.235 0.3 0.001 0.54 L-Nov.2017 0.5Snacks4. . . . . . . . . . . . . . . . . . . . . . . . . . . . . . . . . . . . . . . . . . . . . . . . . 0.312 0.2 0.001 0.72 S-Jan.2018 -0.2Spices, seasonings, condiments, sauces. . . . . . . . . . . 0.272 0.4 0.001 0.54 L-Nov.2017 0.6
Salt and other seasonings and spices5, 6. . . . . . . . 0.2 0.96 L-Jan.2018 2.1Olives, pickles, relishes4, 5, 6. . . . . . . . . . . . . . . . . . . . . . . -2.0 1.31 S-Apr.2017 -3.1Sauces and gravies5, 6. . . . . . . . . . . . . . . . . . . . . . . . . . . . . 0.4 0.81 L-Jan.2018 0.4Other condiments6. . . . . . . . . . . . . . . . . . . . . . . . . . . . . . . . . . 1.8 0.65 L-Apr.2016 2.6
Baby food4, 5. . . . . . . . . . . . . . . . . . . . . . . . . . . . . . . . . . . . . . . . . . . 0.049 -0.1 0.000 0.52 S-Nov.2017 -0.4Other miscellaneous foods4, 5. . . . . . . . . . . . . . . . . . . . . . . . 0.401 -0.1 0.000 0.41 S-Jan.2018 -1.6
Prepared salads4, 7, 6. . . . . . . . . . . . . . . . . . . . . . . . . . . . . . . -0.2 0.76 S-Jan.2018 -1.3Food away from home4.. . . . . . . . . . . . . . . . . . . . . . . . . . . . . . . . . . . . . . . . . 5.978 0.1 0.007 0.04 S-Oct.2017 0.1
Full service meals and snacks4, 5. . . . . . . . . . . . . . . . . . . . . . . . . . . 2.971 0.1 0.004 0.04 S-Nov.2017 0.1Limited service meals and snacks4, 5. . . . . . . . . . . . . . . . . . . . . . . 2.544 0.1 0.003 0.07 S-Dec.2017 0.1Food at employee sites and schools5. . . . . . . . . . . . . . . . . . . . . . . 0.180 0.1 0.000 0.38 S-Jan.2018 0.0
Food at elementary and secondary schools4, 8, 6. . . . . . . 0.0 0.49 – –Food from vending machines and mobile vendors4, 5. . . . 0.090 0.1 0.000 0.11 – –Other food away from home4, 5. . . . . . . . . . . . . . . . . . . . . . . . . . . . . . 0.194 -0.2 0.000 0.09 S-Sep.2016 -0.2
Energy.. . . . . . . . . . . . . . . . . . . . . . . . . . . . . . . . . . . . . . . . . . . . . . . . . . . . . . . . . . . . . . . 7.687 -2.8 -0.218 0.08 S-Feb.2016 -5.6Energy commodities. . . . . . . . . . . . . . . . . . . . . . . . . . . . . . . . . . . . . . . . . . . . . 4.254 -4.7 -0.210 0.13 S-May 2017 -5.0
Fuel oil and other fuels. . . . . . . . . . . . . . . . . . . . . . . . . . . . . . . . . . . . . . . . 0.195 -0.8 -0.002 0.33 L-Jan.2018 7.0Fuel oil. . . . . . . . . . . . . . . . . . . . . . . . . . . . . . . . . . . . . . . . . . . . . . . . . . . . . . . . 0.117 -0.7 -0.001 0.43 L-Jan.2018 9.5Propane, kerosene, and firewood9.. . . . . . . . . . . . . . . . . . . . . . . 0.078 0.5 0.000 0.48 L-Jan.2018 2.2
Motor fuel. . . . . . . . . . . . . . . . . . . . . . . . . . . . . . . . . . . . . . . . . . . . . . . . . . . . . . . 4.059 -4.9 -0.209 0.13 S-May 2017 -5.2Gasoline (all types). . . . . . . . . . . . . . . . . . . . . . . . . . . . . . . . . . . . . . . . . 3.971 -4.9 -0.205 0.13 S-May 2017 -5.3
Gasoline, unleaded regular6. . . . . . . . . . . . . . . . . . . . . . . . . . . . -4.8 0.51 S-May 2017 -5.5Gasoline, unleaded midgrade10, 6. . . . . . . . . . . . . . . . . . . . . . -3.7 0.51 S-May 2017 -3.9Gasoline, unleaded premium6. . . . . . . . . . . . . . . . . . . . . . . . . . -4.5 0.44 S-Feb.2016 -9.5
Other motor fuels5. . . . . . . . . . . . . . . . . . . . . . . . . . . . . . . . . . . . . . . . . . 0.088 -1.9 -0.002 0.15 S-May 2017 -2.8Energy services11. . . . . . . . . . . . . . . . . . . . . . . . . . . . . . . . . . . . . . . . . . . . . . . . 3.433 -0.2 -0.008 0.08 S-Jan.2018 -0.8
Electricity11. . . . . . . . . . . . . . . . . . . . . . . . . . . . . . . . . . . . . . . . . . . . . . . . . . . . . 2.634 0.0 0.001 0.10 S-Jan.2018 -0.2Utility (piped) gas service11. . . . . . . . . . . . . . . . . . . . . . . . . . . . . . . . . . . 0.799 -1.2 -0.009 0.08 S-Jan.2018 -2.6
All items less food and energy. . . . . . . . . . . . . . . . . . . . . . . . . . . . . . . . . . . . 79.007 0.2 0.138 0.03 – –Commodities less food and energy commodities. . . . . . . . . . . . 19.895 -0.1 -0.025 0.08 S-Nov.2017 -0.1
Household furnishings and supplies12. . . . . . . . . . . . . . . . . . . . . . 3.395 -0.1 -0.002 0.16 S-Nov.2017 -0.2Window and floor coverings and other linens4, 5. . . . . . . . 0.271 -1.3 -0.004 0.75 S-Nov.2017 -2.7
Floor coverings4, 5. . . . . . . . . . . . . . . . . . . . . . . . . . . . . . . . . . . . . . . . 0.056 0.7 0.000 0.56 S-Dec.2017 -1.9Window coverings4, 5. . . . . . . . . . . . . . . . . . . . . . . . . . . . . . . . . . . . . 0.049 -3.2 -0.002 0.88 S-Dec.2014 -3.3Other linens4, 5. . . . . . . . . . . . . . . . . . . . . . . . . . . . . . . . . . . . . . . . . . . . 0.165 -1.4 -0.002 1.15 S-Nov.2017 -4.5
Furniture and bedding. . . . . . . . . . . . . . . . . . . . . . . . . . . . . . . . . . . . . . 0.888 -1.0 -0.009 0.34 S-Apr.2010 -1.6Bedroom furniture4. . . . . . . . . . . . . . . . . . . . . . . . . . . . . . . . . . . . . . . 0.324 -0.3 -0.001 0.52 S-Dec.2017 -1.2Living room, kitchen, and dining room furniture4, 5. . . 0.425 -0.6 -0.003 0.45 S-Nov.2017 -0.6Other furniture5. . . . . . . . . . . . . . . . . . . . . . . . . . . . . . . . . . . . . . . . . . . 0.127 -0.5 -0.001 0.71 L-Jan.2018 1.2
Infants’ furniture4, 8, 6. . . . . . . . . . . . . . . . . . . . . . . . . . . . . . . . . . -4.2 0.74 S-EVER –Appliances5. . . . . . . . . . . . . . . . . . . . . . . . . . . . . . . . . . . . . . . . . . . . . . . . . . 0.208 1.2 0.002 0.55 L-Feb.2005 1.3
Major appliances5. . . . . . . . . . . . . . . . . . . . . . . . . . . . . . . . . . . . . . . . 0.074 0.3 0.000 0.70 L-Jan.2018 0.5Laundry equipment6. . . . . . . . . . . . . . . . . . . . . . . . . . . . . . . . . . . -0.6 1.18 L-Jan.2018 3.4
Other appliances5. . . . . . . . . . . . . . . . . . . . . . . . . . . . . . . . . . . . . . . . 0.131 1.7 0.002 0.63 L-Mar.2014 2.0Other household equipment and furnishings5. . . . . . . . . . . 0.525 0.3 0.002 0.48 S-Jan.2018 -2.2
Clocks, lamps, and decorator items4. . . . . . . . . . . . . . . . . . 0.291 -0.4 -0.001 0.76 S-Jan.2018 -0.7
See footnotes at end of table.
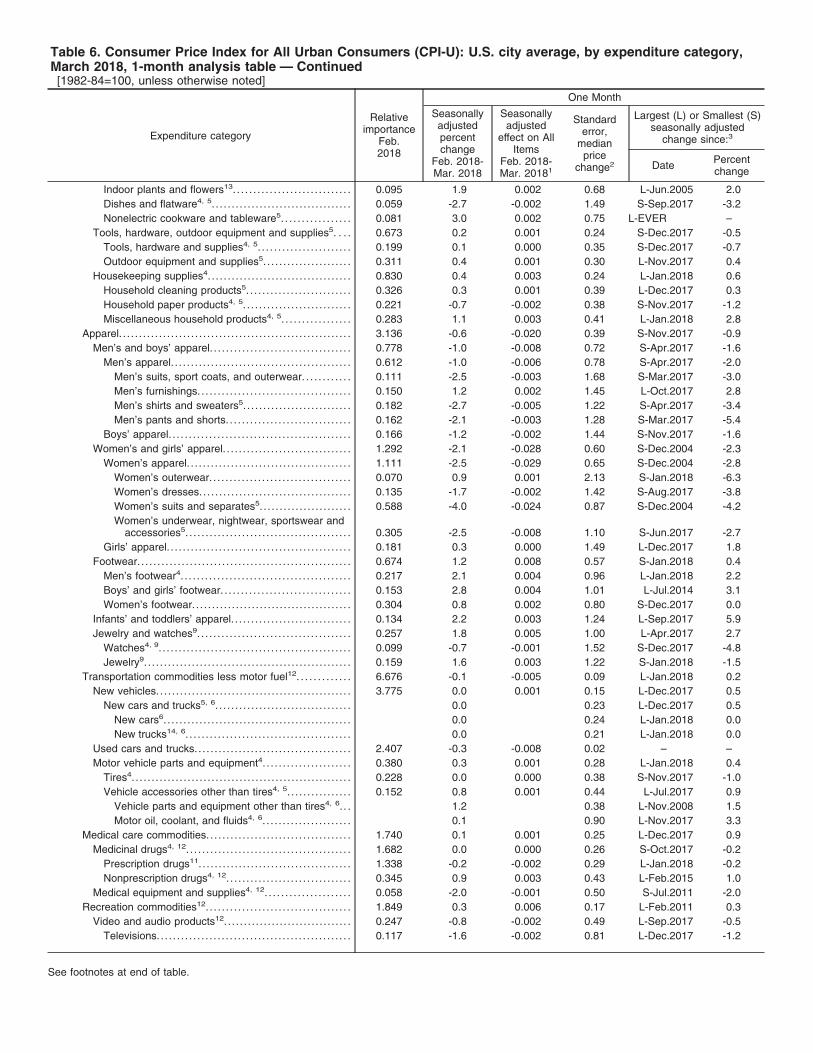
Table 6. Consumer Price Index for All Urban Consumers (CPI-U): U.S. city average, by expenditure category,March 2018, 1-month analysis table — Continued[1982-84=100, unless otherwise noted]
Expenditure category
Relativeimportance
Feb.2018
One Month
Seasonallyadjustedpercentchange
Feb. 2018-Mar. 2018
Seasonallyadjusted
effect on AllItems
Feb. 2018-Mar. 20181
Standarderror,
medianprice
change2
Largest (L) or Smallest (S)seasonally adjusted
change since:3
Date Percentchange
Indoor plants and flowers13. . . . . . . . . . . . . . . . . . . . . . . . . . . . . 0.095 1.9 0.002 0.68 L-Jun.2005 2.0Dishes and flatware4, 5. . . . . . . . . . . . . . . . . . . . . . . . . . . . . . . . . . . 0.059 -2.7 -0.002 1.49 S-Sep.2017 -3.2Nonelectric cookware and tableware5. . . . . . . . . . . . . . . . . 0.081 3.0 0.002 0.75 L-EVER –
Tools, hardware, outdoor equipment and supplies5. . . . 0.673 0.2 0.001 0.24 S-Dec.2017 -0.5Tools, hardware and supplies4, 5. . . . . . . . . . . . . . . . . . . . . . . 0.199 0.1 0.000 0.35 S-Dec.2017 -0.7Outdoor equipment and supplies5. . . . . . . . . . . . . . . . . . . . . . 0.311 0.4 0.001 0.30 L-Nov.2017 0.4
Housekeeping supplies4. . . . . . . . . . . . . . . . . . . . . . . . . . . . . . . . . . . . 0.830 0.4 0.003 0.24 L-Jan.2018 0.6Household cleaning products5. . . . . . . . . . . . . . . . . . . . . . . . . . 0.326 0.3 0.001 0.39 L-Dec.2017 0.3Household paper products4, 5. . . . . . . . . . . . . . . . . . . . . . . . . . . 0.221 -0.7 -0.002 0.38 S-Nov.2017 -1.2Miscellaneous household products4, 5. . . . . . . . . . . . . . . . . 0.283 1.1 0.003 0.41 L-Jan.2018 2.8
Apparel. . . . . . . . . . . . . . . . . . . . . . . . . . . . . . . . . . . . . . . . . . . . . . . . . . . . . . . . . . 3.136 -0.6 -0.020 0.39 S-Nov.2017 -0.9Men’s and boys’ apparel. . . . . . . . . . . . . . . . . . . . . . . . . . . . . . . . . . . 0.778 -1.0 -0.008 0.72 S-Apr.2017 -1.6
Men’s apparel. . . . . . . . . . . . . . . . . . . . . . . . . . . . . . . . . . . . . . . . . . . . . 0.612 -1.0 -0.006 0.78 S-Apr.2017 -2.0Men’s suits, sport coats, and outerwear. . . . . . . . . . . . 0.111 -2.5 -0.003 1.68 S-Mar.2017 -3.0Men’s furnishings. . . . . . . . . . . . . . . . . . . . . . . . . . . . . . . . . . . . . . 0.150 1.2 0.002 1.45 L-Oct.2017 2.8Men’s shirts and sweaters5. . . . . . . . . . . . . . . . . . . . . . . . . . . 0.182 -2.7 -0.005 1.22 S-Apr.2017 -3.4Men’s pants and shorts. . . . . . . . . . . . . . . . . . . . . . . . . . . . . . . 0.162 -2.1 -0.003 1.28 S-Mar.2017 -5.4
Boys’ apparel. . . . . . . . . . . . . . . . . . . . . . . . . . . . . . . . . . . . . . . . . . . . . 0.166 -1.2 -0.002 1.44 S-Nov.2017 -1.6Women’s and girls’ apparel. . . . . . . . . . . . . . . . . . . . . . . . . . . . . . . . 1.292 -2.1 -0.028 0.60 S-Dec.2004 -2.3
Women’s apparel. . . . . . . . . . . . . . . . . . . . . . . . . . . . . . . . . . . . . . . . . 1.111 -2.5 -0.029 0.65 S-Dec.2004 -2.8Women’s outerwear. . . . . . . . . . . . . . . . . . . . . . . . . . . . . . . . . . . 0.070 0.9 0.001 2.13 S-Jan.2018 -6.3Women’s dresses.. . . . . . . . . . . . . . . . . . . . . . . . . . . . . . . . . . . . . 0.135 -1.7 -0.002 1.42 S-Aug.2017 -3.8Women’s suits and separates5. . . . . . . . . . . . . . . . . . . . . . . 0.588 -4.0 -0.024 0.87 S-Dec.2004 -4.2Women’s underwear, nightwear, sportswear and
accessories5. . . . . . . . . . . . . . . . . . . . . . . . . . . . . . . . . . . . . . . . . 0.305 -2.5 -0.008 1.10 S-Jun.2017 -2.7Girls’ apparel. . . . . . . . . . . . . . . . . . . . . . . . . . . . . . . . . . . . . . . . . . . . . . 0.181 0.3 0.000 1.49 L-Dec.2017 1.8
Footwear. . . . . . . . . . . . . . . . . . . . . . . . . . . . . . . . . . . . . . . . . . . . . . . . . . . . . 0.674 1.2 0.008 0.57 S-Jan.2018 0.4Men’s footwear4. . . . . . . . . . . . . . . . . . . . . . . . . . . . . . . . . . . . . . . . . . 0.217 2.1 0.004 0.96 L-Jan.2018 2.2Boys’ and girls’ footwear. . . . . . . . . . . . . . . . . . . . . . . . . . . . . . . . 0.153 2.8 0.004 1.01 L-Jul.2014 3.1Women’s footwear. . . . . . . . . . . . . . . . . . . . . . . . . . . . . . . . . . . . . . . . 0.304 0.8 0.002 0.80 S-Dec.2017 0.0
Infants’ and toddlers’ apparel. . . . . . . . . . . . . . . . . . . . . . . . . . . . . . 0.134 2.2 0.003 1.24 L-Sep.2017 5.9Jewelry and watches9. . . . . . . . . . . . . . . . . . . . . . . . . . . . . . . . . . . . . . 0.257 1.8 0.005 1.00 L-Apr.2017 2.7
Watches4, 9. . . . . . . . . . . . . . . . . . . . . . . . . . . . . . . . . . . . . . . . . . . . . . . . 0.099 -0.7 -0.001 1.52 S-Dec.2017 -4.8Jewelry9. . . . . . . . . . . . . . . . . . . . . . . . . . . . . . . . . . . . . . . . . . . . . . . . . . . . 0.159 1.6 0.003 1.22 S-Jan.2018 -1.5
Transportation commodities less motor fuel12. . . . . . . . . . . . . 6.676 -0.1 -0.005 0.09 L-Jan.2018 0.2New vehicles.. . . . . . . . . . . . . . . . . . . . . . . . . . . . . . . . . . . . . . . . . . . . . . . . 3.775 0.0 0.001 0.15 L-Dec.2017 0.5
New cars and trucks5, 6. . . . . . . . . . . . . . . . . . . . . . . . . . . . . . . . . . 0.0 0.23 L-Dec.2017 0.5New cars6. . . . . . . . . . . . . . . . . . . . . . . . . . . . . . . . . . . . . . . . . . . . . . . 0.0 0.24 L-Jan.2018 0.0New trucks14, 6. . . . . . . . . . . . . . . . . . . . . . . . . . . . . . . . . . . . . . . . . 0.0 0.21 L-Jan.2018 0.0
Used cars and trucks. . . . . . . . . . . . . . . . . . . . . . . . . . . . . . . . . . . . . . . 2.407 -0.3 -0.008 0.02 – –Motor vehicle parts and equipment4. . . . . . . . . . . . . . . . . . . . . . 0.380 0.3 0.001 0.28 L-Jan.2018 0.4
Tires4. . . . . . . . . . . . . . . . . . . . . . . . . . . . . . . . . . . . . . . . . . . . . . . . . . . . . . . 0.228 0.0 0.000 0.38 S-Nov.2017 -1.0Vehicle accessories other than tires4, 5. . . . . . . . . . . . . . . . 0.152 0.8 0.001 0.44 L-Jul.2017 0.9
Vehicle parts and equipment other than tires4, 6.. . 1.2 0.38 L-Nov.2008 1.5Motor oil, coolant, and fluids4, 6. . . . . . . . . . . . . . . . . . . . . . 0.1 0.90 L-Nov.2017 3.3
Medical care commodities. . . . . . . . . . . . . . . . . . . . . . . . . . . . . . . . . . . . 1.740 0.1 0.001 0.25 L-Dec.2017 0.9Medicinal drugs4, 12. . . . . . . . . . . . . . . . . . . . . . . . . . . . . . . . . . . . . . . . . 1.682 0.0 0.000 0.26 S-Oct.2017 -0.2
Prescription drugs11. . . . . . . . . . . . . . . . . . . . . . . . . . . . . . . . . . . . . . 1.338 -0.2 -0.002 0.29 L-Jan.2018 -0.2Nonprescription drugs4, 12. . . . . . . . . . . . . . . . . . . . . . . . . . . . . . . 0.345 0.9 0.003 0.43 L-Feb.2015 1.0
Medical equipment and supplies4, 12. . . . . . . . . . . . . . . . . . . . . 0.058 -2.0 -0.001 0.50 S-Jul.2011 -2.0Recreation commodities12. . . . . . . . . . . . . . . . . . . . . . . . . . . . . . . . . . . . 1.849 0.3 0.006 0.17 L-Feb.2011 0.3
Video and audio products12. . . . . . . . . . . . . . . . . . . . . . . . . . . . . . . . 0.247 -0.8 -0.002 0.49 L-Sep.2017 -0.5Televisions. . . . . . . . . . . . . . . . . . . . . . . . . . . . . . . . . . . . . . . . . . . . . . . . 0.117 -1.6 -0.002 0.81 L-Dec.2017 -1.2
See footnotes at end of table.
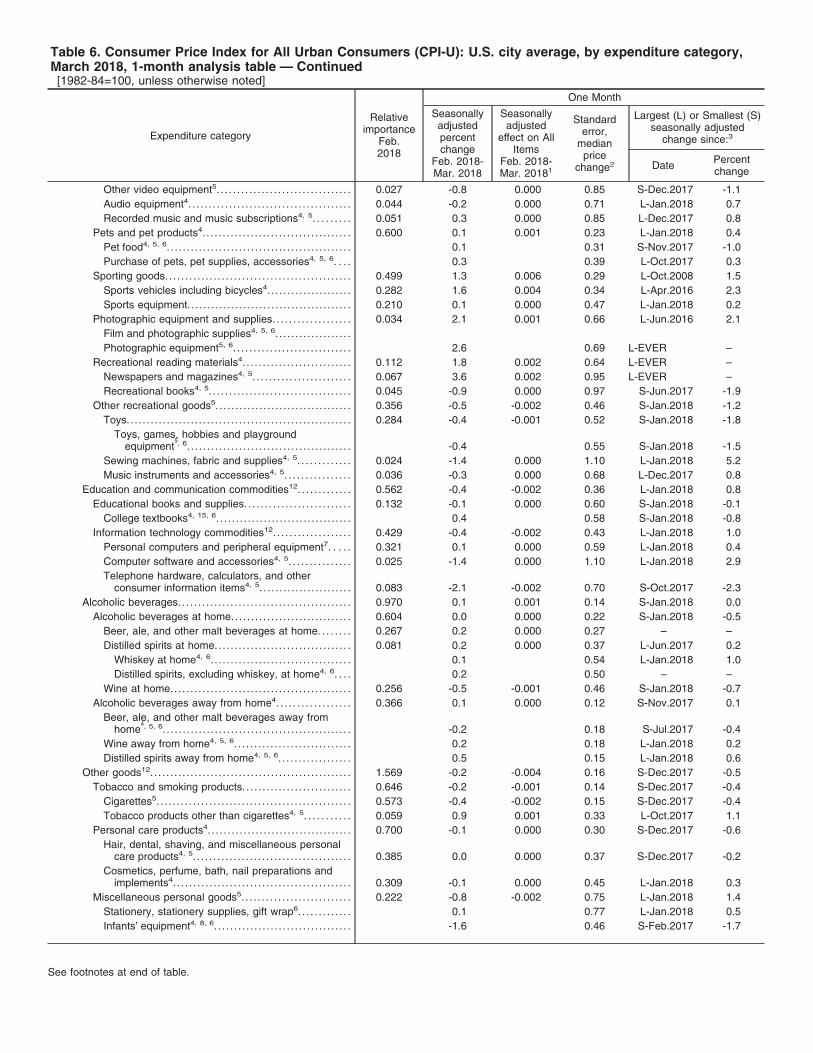
Table 6. Consumer Price Index for All Urban Consumers (CPI-U): U.S. city average, by expenditure category,March 2018, 1-month analysis table — Continued[1982-84=100, unless otherwise noted]
Expenditure category
Relativeimportance
Feb.2018
One Month
Seasonallyadjustedpercentchange
Feb. 2018-Mar. 2018
Seasonallyadjusted
effect on AllItems
Feb. 2018-Mar. 20181
Standarderror,
medianprice
change2
Largest (L) or Smallest (S)seasonally adjusted
change since:3
Date Percentchange
Other video equipment5. . . . . . . . . . . . . . . . . . . . . . . . . . . . . . . . . 0.027 -0.8 0.000 0.85 S-Dec.2017 -1.1Audio equipment4. . . . . . . . . . . . . . . . . . . . . . . . . . . . . . . . . . . . . . . . 0.044 -0.2 0.000 0.71 L-Jan.2018 0.7Recorded music and music subscriptions4, 5. . . . . . . . . 0.051 0.3 0.000 0.85 L-Dec.2017 0.8
Pets and pet products4. . . . . . . . . . . . . . . . . . . . . . . . . . . . . . . . . . . . . 0.600 0.1 0.001 0.23 L-Jan.2018 0.4Pet food4, 5, 6. . . . . . . . . . . . . . . . . . . . . . . . . . . . . . . . . . . . . . . . . . . . . . 0.1 0.31 S-Nov.2017 -1.0Purchase of pets, pet supplies, accessories4, 5, 6. . . . 0.3 0.39 L-Oct.2017 0.3
Sporting goods. . . . . . . . . . . . . . . . . . . . . . . . . . . . . . . . . . . . . . . . . . . . . . 0.499 1.3 0.006 0.29 L-Oct.2008 1.5Sports vehicles including bicycles4. . . . . . . . . . . . . . . . . . . . . 0.282 1.6 0.004 0.34 L-Apr.2016 2.3Sports equipment. . . . . . . . . . . . . . . . . . . . . . . . . . . . . . . . . . . . . . . . . 0.210 0.1 0.000 0.47 L-Jan.2018 0.2
Photographic equipment and supplies. . . . . . . . . . . . . . . . . . . 0.034 2.1 0.001 0.66 L-Jun.2016 2.1Film and photographic supplies4, 5, 6. . . . . . . . . . . . . . . . . . .Photographic equipment5, 6. . . . . . . . . . . . . . . . . . . . . . . . . . . . . 2.6 0.69 L-EVER –
Recreational reading materials4. . . . . . . . . . . . . . . . . . . . . . . . . . . 0.112 1.8 0.002 0.64 L-EVER –Newspapers and magazines4, 5. . . . . . . . . . . . . . . . . . . . . . . . 0.067 3.6 0.002 0.95 L-EVER –Recreational books4, 5. . . . . . . . . . . . . . . . . . . . . . . . . . . . . . . . . . . 0.045 -0.9 0.000 0.97 S-Jun.2017 -1.9
Other recreational goods5. . . . . . . . . . . . . . . . . . . . . . . . . . . . . . . . . . 0.356 -0.5 -0.002 0.46 S-Jan.2018 -1.2Toys.. . . . . . . . . . . . . . . . . . . . . . . . . . . . . . . . . . . . . . . . . . . . . . . . . . . . . . . 0.284 -0.4 -0.001 0.52 S-Jan.2018 -1.8
Toys, games, hobbies and playgroundequipment
5, 6. . . . . . . . . . . . . . . . . . . . . . . . . . . . . . . . . . . . . . . . . -0.4 0.55 S-Jan.2018 -1.5Sewing machines, fabric and supplies4, 5. . . . . . . . . . . . . 0.024 -1.4 0.000 1.10 L-Jan.2018 5.2Music instruments and accessories4, 5. . . . . . . . . . . . . . . . 0.036 -0.3 0.000 0.68 L-Dec.2017 0.8
Education and communication commodities12. . . . . . . . . . . . . 0.562 -0.4 -0.002 0.36 L-Jan.2018 0.8Educational books and supplies. . . . . . . . . . . . . . . . . . . . . . . . . . 0.132 -0.1 0.000 0.60 S-Jan.2018 -0.1
College textbooks4, 15, 6. . . . . . . . . . . . . . . . . . . . . . . . . . . . . . . . . . 0.4 0.58 S-Jan.2018 -0.8Information technology commodities12. . . . . . . . . . . . . . . . . . . 0.429 -0.4 -0.002 0.43 L-Jan.2018 1.0
Personal computers and peripheral equipment7. . . . . 0.321 0.1 0.000 0.59 L-Jan.2018 0.4Computer software and accessories4, 5. . . . . . . . . . . . . . . 0.025 -1.4 0.000 1.10 L-Jan.2018 2.9Telephone hardware, calculators, and other
consumer information items4, 5. . . . . . . . . . . . . . . . . . . . . . . 0.083 -2.1 -0.002 0.70 S-Oct.2017 -2.3Alcoholic beverages. . . . . . . . . . . . . . . . . . . . . . . . . . . . . . . . . . . . . . . . . . . 0.970 0.1 0.001 0.14 S-Jan.2018 0.0
Alcoholic beverages at home.. . . . . . . . . . . . . . . . . . . . . . . . . . . . . 0.604 0.0 0.000 0.22 S-Jan.2018 -0.5Beer, ale, and other malt beverages at home. . . . . . . . 0.267 0.2 0.000 0.27 – –Distilled spirits at home.. . . . . . . . . . . . . . . . . . . . . . . . . . . . . . . . . 0.081 0.2 0.000 0.37 L-Jun.2017 0.2
Whiskey at home4, 6. . . . . . . . . . . . . . . . . . . . . . . . . . . . . . . . . . . 0.1 0.54 L-Jan.2018 1.0Distilled spirits, excluding whiskey, at home4, 6. . . . 0.2 0.50 – –
Wine at home.. . . . . . . . . . . . . . . . . . . . . . . . . . . . . . . . . . . . . . . . . . . . 0.256 -0.5 -0.001 0.46 S-Jan.2018 -0.7Alcoholic beverages away from home4. . . . . . . . . . . . . . . . . . 0.366 0.1 0.000 0.12 S-Nov.2017 0.1
Beer, ale, and other malt beverages away fromhome
4, 5, 6. . . . . . . . . . . . . . . . . . . . . . . . . . . . . . . . . . . . . . . . . . . . . . . -0.2 0.18 S-Jul.2017 -0.4Wine away from home4, 5, 6. . . . . . . . . . . . . . . . . . . . . . . . . . . . . 0.2 0.18 L-Jan.2018 0.2Distilled spirits away from home4, 5, 6. . . . . . . . . . . . . . . . . . 0.5 0.15 L-Jan.2018 0.6
Other goods12. . . . . . . . . . . . . . . . . . . . . . . . . . . . . . . . . . . . . . . . . . . . . . . . . . 1.569 -0.2 -0.004 0.16 S-Dec.2017 -0.5Tobacco and smoking products. . . . . . . . . . . . . . . . . . . . . . . . . . . 0.646 -0.2 -0.001 0.14 S-Dec.2017 -0.4
Cigarettes5. . . . . . . . . . . . . . . . . . . . . . . . . . . . . . . . . . . . . . . . . . . . . . . . 0.573 -0.4 -0.002 0.15 S-Dec.2017 -0.4Tobacco products other than cigarettes4, 5. . . . . . . . . . . 0.059 0.9 0.001 0.33 L-Oct.2017 1.1
Personal care products4. . . . . . . . . . . . . . . . . . . . . . . . . . . . . . . . . . . . 0.700 -0.1 0.000 0.30 S-Dec.2017 -0.6Hair, dental, shaving, and miscellaneous personal
care products4, 5. . . . . . . . . . . . . . . . . . . . . . . . . . . . . . . . . . . . . . . 0.385 0.0 0.000 0.37 S-Dec.2017 -0.2Cosmetics, perfume, bath, nail preparations and
implements4. . . . . . . . . . . . . . . . . . . . . . . . . . . . . . . . . . . . . . . . . . . . 0.309 -0.1 0.000 0.45 L-Jan.2018 0.3Miscellaneous personal goods5. . . . . . . . . . . . . . . . . . . . . . . . . . . 0.222 -0.8 -0.002 0.75 L-Jan.2018 1.4
Stationery, stationery supplies, gift wrap6. . . . . . . . . . . . . 0.1 0.77 L-Jan.2018 0.5Infants’ equipment4, 8, 6. . . . . . . . . . . . . . . . . . . . . . . . . . . . . . . . . . -1.6 0.46 S-Feb.2017 -1.7
See footnotes at end of table.
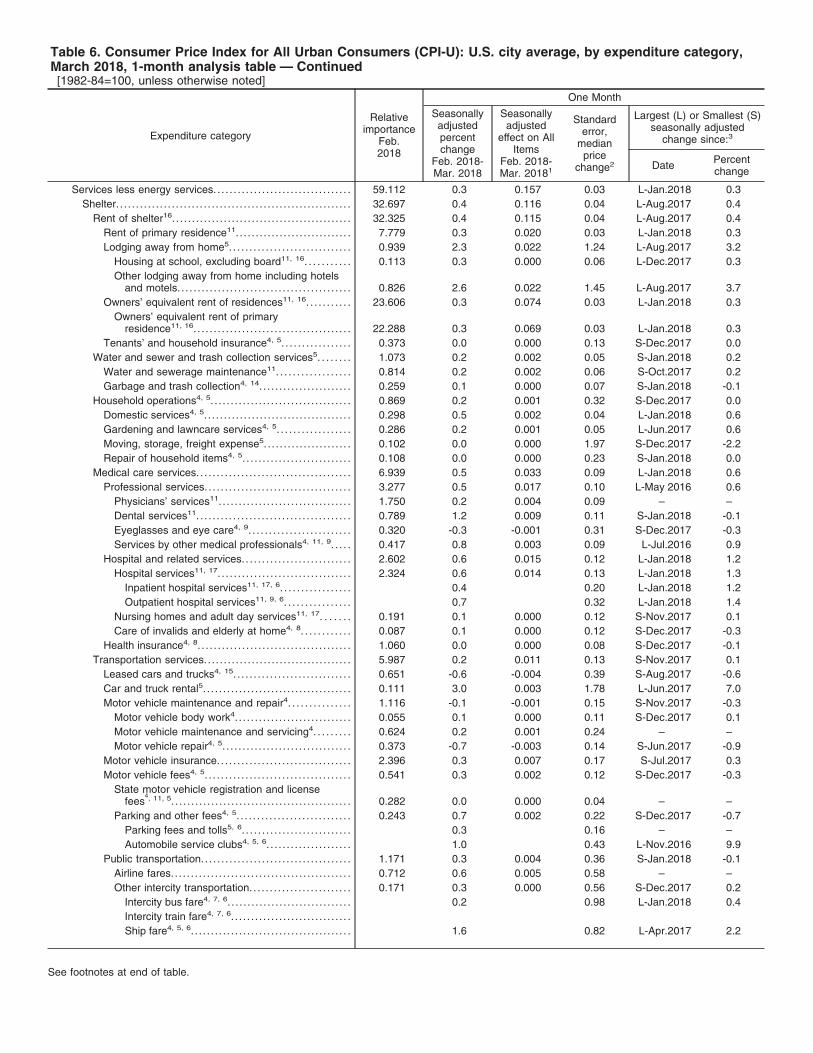
Table 6. Consumer Price Index for All Urban Consumers (CPI-U): U.S. city average, by expenditure category,March 2018, 1-month analysis table — Continued[1982-84=100, unless otherwise noted]
Expenditure category
Relativeimportance
Feb.2018
One Month
Seasonallyadjustedpercentchange
Feb. 2018-Mar. 2018
Seasonallyadjusted
effect on AllItems
Feb. 2018-Mar. 20181
Standarderror,
medianprice
change2
Largest (L) or Smallest (S)seasonally adjusted
change since:3
Date Percentchange
Services less energy services. . . . . . . . . . . . . . . . . . . . . . . . . . . . . . . . . . 59.112 0.3 0.157 0.03 L-Jan.2018 0.3Shelter. . . . . . . . . . . . . . . . . . . . . . . . . . . . . . . . . . . . . . . . . . . . . . . . . . . . . . . . . . . 32.697 0.4 0.116 0.04 L-Aug.2017 0.4
Rent of shelter16. . . . . . . . . . . . . . . . . . . . . . . . . . . . . . . . . . . . . . . . . . . . . 32.325 0.4 0.115 0.04 L-Aug.2017 0.4Rent of primary residence11. . . . . . . . . . . . . . . . . . . . . . . . . . . . . 7.779 0.3 0.020 0.03 L-Jan.2018 0.3Lodging away from home5. . . . . . . . . . . . . . . . . . . . . . . . . . . . . . 0.939 2.3 0.022 1.24 L-Aug.2017 3.2
Housing at school, excluding board11, 16. . . . . . . . . . . 0.113 0.3 0.000 0.06 L-Dec.2017 0.3Other lodging away from home including hotels
and motels. . . . . . . . . . . . . . . . . . . . . . . . . . . . . . . . . . . . . . . . . . . 0.826 2.6 0.022 1.45 L-Aug.2017 3.7Owners’ equivalent rent of residences11, 16. . . . . . . . . . . 23.606 0.3 0.074 0.03 L-Jan.2018 0.3
Owners’ equivalent rent of primaryresidence11, 16. . . . . . . . . . . . . . . . . . . . . . . . . . . . . . . . . . . . . . . 22.288 0.3 0.069 0.03 L-Jan.2018 0.3
Tenants’ and household insurance4, 5. . . . . . . . . . . . . . . . . 0.373 0.0 0.000 0.13 S-Dec.2017 0.0Water and sewer and trash collection services5. . . . . . . . 1.073 0.2 0.002 0.05 S-Jan.2018 0.2
Water and sewerage maintenance11. . . . . . . . . . . . . . . . . . 0.814 0.2 0.002 0.06 S-Oct.2017 0.2Garbage and trash collection4, 14. . . . . . . . . . . . . . . . . . . . . . . 0.259 0.1 0.000 0.07 S-Jan.2018 -0.1
Household operations4, 5. . . . . . . . . . . . . . . . . . . . . . . . . . . . . . . . . . . 0.869 0.2 0.001 0.32 S-Dec.2017 0.0Domestic services4, 5. . . . . . . . . . . . . . . . . . . . . . . . . . . . . . . . . . . . . 0.298 0.5 0.002 0.04 L-Jan.2018 0.6Gardening and lawncare services4, 5. . . . . . . . . . . . . . . . . . 0.286 0.2 0.001 0.05 L-Jun.2017 0.6Moving, storage, freight expense5.. . . . . . . . . . . . . . . . . . . . . 0.102 0.0 0.000 1.97 S-Dec.2017 -2.2Repair of household items4, 5. . . . . . . . . . . . . . . . . . . . . . . . . . . 0.108 0.0 0.000 0.23 S-Jan.2018 0.0
Medical care services. . . . . . . . . . . . . . . . . . . . . . . . . . . . . . . . . . . . . . 6.939 0.5 0.033 0.09 L-Jan.2018 0.6Professional services. . . . . . . . . . . . . . . . . . . . . . . . . . . . . . . . . . . . 3.277 0.5 0.017 0.10 L-May 2016 0.6
Physicians’ services11. . . . . . . . . . . . . . . . . . . . . . . . . . . . . . . . . 1.750 0.2 0.004 0.09 – –Dental services11. . . . . . . . . . . . . . . . . . . . . . . . . . . . . . . . . . . . . . 0.789 1.2 0.009 0.11 S-Jan.2018 -0.1Eyeglasses and eye care4, 9. . . . . . . . . . . . . . . . . . . . . . . . . 0.320 -0.3 -0.001 0.31 S-Dec.2017 -0.3Services by other medical professionals4, 11, 9. . . . . 0.417 0.8 0.003 0.09 L-Jul.2016 0.9
Hospital and related services. . . . . . . . . . . . . . . . . . . . . . . . . . . 2.602 0.6 0.015 0.12 L-Jan.2018 1.2Hospital services11, 17. . . . . . . . . . . . . . . . . . . . . . . . . . . . . . . . . 2.324 0.6 0.014 0.13 L-Jan.2018 1.3
Inpatient hospital services11, 17, 6. . . . . . . . . . . . . . . . . 0.4 0.20 L-Jan.2018 1.2Outpatient hospital services11, 9, 6. . . . . . . . . . . . . . . . 0.7 0.32 L-Jan.2018 1.4
Nursing homes and adult day services11, 17. . . . . . . 0.191 0.1 0.000 0.12 S-Nov.2017 0.1Care of invalids and elderly at home4, 8. . . . . . . . . . . . 0.087 0.1 0.000 0.12 S-Dec.2017 -0.3
Health insurance4, 8. . . . . . . . . . . . . . . . . . . . . . . . . . . . . . . . . . . . . . 1.060 0.0 0.000 0.08 S-Dec.2017 -0.1Transportation services.. . . . . . . . . . . . . . . . . . . . . . . . . . . . . . . . . . . . 5.987 0.2 0.011 0.13 S-Nov.2017 0.1
Leased cars and trucks4, 15. . . . . . . . . . . . . . . . . . . . . . . . . . . . . 0.651 -0.6 -0.004 0.39 S-Aug.2017 -0.6Car and truck rental5. . . . . . . . . . . . . . . . . . . . . . . . . . . . . . . . . . . . . 0.111 3.0 0.003 1.78 L-Jun.2017 7.0Motor vehicle maintenance and repair4. . . . . . . . . . . . . . . 1.116 -0.1 -0.001 0.15 S-Nov.2017 -0.3
Motor vehicle body work4. . . . . . . . . . . . . . . . . . . . . . . . . . . . . 0.055 0.1 0.000 0.11 S-Dec.2017 0.1Motor vehicle maintenance and servicing4. . . . . . . . . 0.624 0.2 0.001 0.24 – –Motor vehicle repair4, 5. . . . . . . . . . . . . . . . . . . . . . . . . . . . . . . . 0.373 -0.7 -0.003 0.14 S-Jun.2017 -0.9
Motor vehicle insurance. . . . . . . . . . . . . . . . . . . . . . . . . . . . . . . . . 2.396 0.3 0.007 0.17 S-Jul.2017 0.3Motor vehicle fees4, 5. . . . . . . . . . . . . . . . . . . . . . . . . . . . . . . . . . . . 0.541 0.3 0.002 0.12 S-Dec.2017 -0.3
State motor vehicle registration and licensefees
4, 11, 5. . . . . . . . . . . . . . . . . . . . . . . . . . . . . . . . . . . . . . . . . . . . . 0.282 0.0 0.000 0.04 – –Parking and other fees4, 5. . . . . . . . . . . . . . . . . . . . . . . . . . . . 0.243 0.7 0.002 0.22 S-Dec.2017 -0.7
Parking fees and tolls5, 6. . . . . . . . . . . . . . . . . . . . . . . . . . . 0.3 0.16 – –Automobile service clubs4, 5, 6. . . . . . . . . . . . . . . . . . . . . 1.0 0.43 L-Nov.2016 9.9
Public transportation. . . . . . . . . . . . . . . . . . . . . . . . . . . . . . . . . . . . . 1.171 0.3 0.004 0.36 S-Jan.2018 -0.1Airline fares. . . . . . . . . . . . . . . . . . . . . . . . . . . . . . . . . . . . . . . . . . . . . 0.712 0.6 0.005 0.58 – –Other intercity transportation. . . . . . . . . . . . . . . . . . . . . . . . . 0.171 0.3 0.000 0.56 S-Dec.2017 0.2
Intercity bus fare4, 7, 6. . . . . . . . . . . . . . . . . . . . . . . . . . . . . . . 0.2 0.98 L-Jan.2018 0.4Intercity train fare4, 7, 6. . . . . . . . . . . . . . . . . . . . . . . . . . . . . .Ship fare4, 5, 6. . . . . . . . . . . . . . . . . . . . . . . . . . . . . . . . . . . . . . . . 1.6 0.82 L-Apr.2017 2.2
See footnotes at end of table.
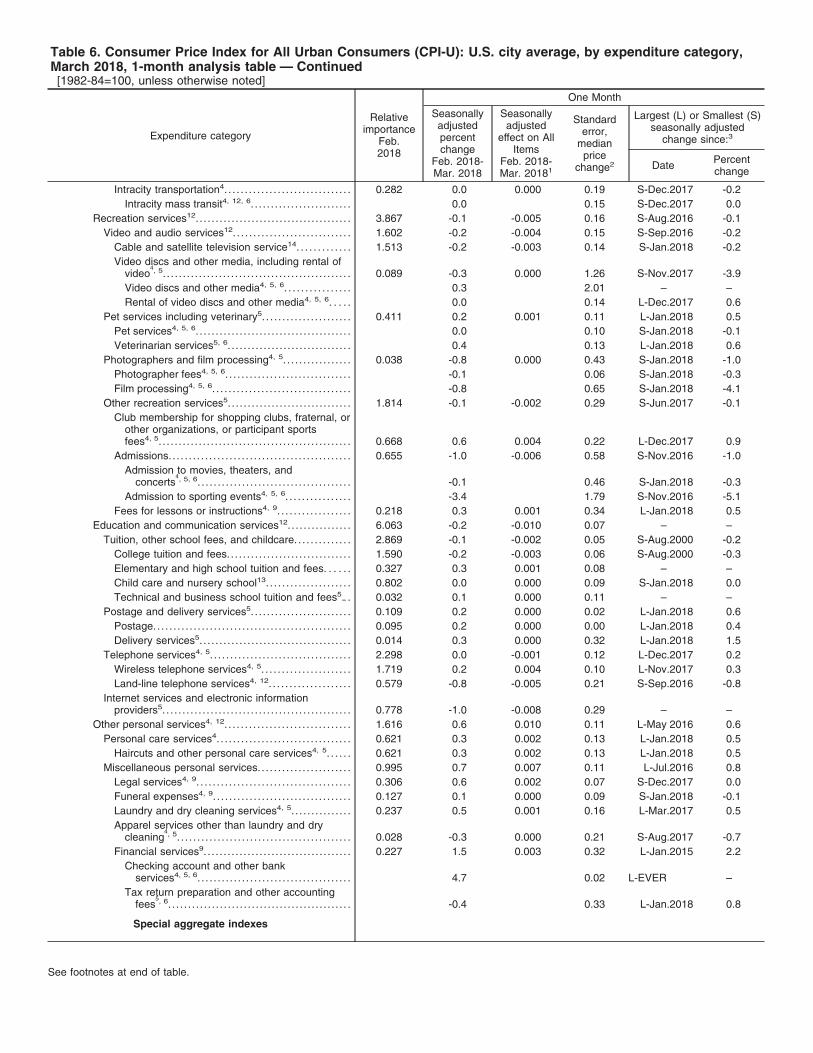
Table 6. Consumer Price Index for All Urban Consumers (CPI-U): U.S. city average, by expenditure category,March 2018, 1-month analysis table — Continued[1982-84=100, unless otherwise noted]
Expenditure category
Relativeimportance
Feb.2018
One Month
Seasonallyadjustedpercentchange
Feb. 2018-Mar. 2018
Seasonallyadjusted
effect on AllItems
Feb. 2018-Mar. 20181
Standarderror,
medianprice
change2
Largest (L) or Smallest (S)seasonally adjusted
change since:3
Date Percentchange
Intracity transportation4. . . . . . . . . . . . . . . . . . . . . . . . . . . . . . . 0.282 0.0 0.000 0.19 S-Dec.2017 -0.2Intracity mass transit4, 12, 6. . . . . . . . . . . . . . . . . . . . . . . . . 0.0 0.15 S-Dec.2017 0.0
Recreation services12. . . . . . . . . . . . . . . . . . . . . . . . . . . . . . . . . . . . . . . 3.867 -0.1 -0.005 0.16 S-Aug.2016 -0.1Video and audio services12. . . . . . . . . . . . . . . . . . . . . . . . . . . . . 1.602 -0.2 -0.004 0.15 S-Sep.2016 -0.2
Cable and satellite television service14. . . . . . . . . . . . . 1.513 -0.2 -0.003 0.14 S-Jan.2018 -0.2Video discs and other media, including rental of
video4, 5. . . . . . . . . . . . . . . . . . . . . . . . . . . . . . . . . . . . . . . . . . . . . . . 0.089 -0.3 0.000 1.26 S-Nov.2017 -3.9
Video discs and other media4, 5, 6. . . . . . . . . . . . . . . . 0.3 2.01 – –Rental of video discs and other media4, 5, 6. . . . . 0.0 0.14 L-Dec.2017 0.6
Pet services including veterinary5. . . . . . . . . . . . . . . . . . . . . . 0.411 0.2 0.001 0.11 L-Jan.2018 0.5Pet services4, 5, 6. . . . . . . . . . . . . . . . . . . . . . . . . . . . . . . . . . . . . . . 0.0 0.10 S-Jan.2018 -0.1Veterinarian services5, 6. . . . . . . . . . . . . . . . . . . . . . . . . . . . . . . 0.4 0.13 L-Jan.2018 0.6
Photographers and film processing4, 5. . . . . . . . . . . . . . . . . 0.038 -0.8 0.000 0.43 S-Jan.2018 -1.0Photographer fees4, 5, 6. . . . . . . . . . . . . . . . . . . . . . . . . . . . . . . -0.1 0.06 S-Jan.2018 -0.3Film processing4, 5, 6. . . . . . . . . . . . . . . . . . . . . . . . . . . . . . . . . . -0.8 0.65 S-Jan.2018 -4.1
Other recreation services5. . . . . . . . . . . . . . . . . . . . . . . . . . . . . . . 1.814 -0.1 -0.002 0.29 S-Jun.2017 -0.1Club membership for shopping clubs, fraternal, or
other organizations, or participant sportsfees4, 5. . . . . . . . . . . . . . . . . . . . . . . . . . . . . . . . . . . . . . . . . . . . . . . . 0.668 0.6 0.004 0.22 L-Dec.2017 0.9
Admissions. . . . . . . . . . . . . . . . . . . . . . . . . . . . . . . . . . . . . . . . . . . . . 0.655 -1.0 -0.006 0.58 S-Nov.2016 -1.0Admission to movies, theaters, and
concerts4, 5, 6. . . . . . . . . . . . . . . . . . . . . . . . . . . . . . . . . . . . . . -0.1 0.46 S-Jan.2018 -0.3
Admission to sporting events4, 5, 6. . . . . . . . . . . . . . . . -3.4 1.79 S-Nov.2016 -5.1Fees for lessons or instructions4, 9. . . . . . . . . . . . . . . . . . 0.218 0.3 0.001 0.34 L-Jan.2018 0.5
Education and communication services12. . . . . . . . . . . . . . . . 6.063 -0.2 -0.010 0.07 – –Tuition, other school fees, and childcare. . . . . . . . . . . . . . 2.869 -0.1 -0.002 0.05 S-Aug.2000 -0.2
College tuition and fees.. . . . . . . . . . . . . . . . . . . . . . . . . . . . . . 1.590 -0.2 -0.003 0.06 S-Aug.2000 -0.3Elementary and high school tuition and fees. . . . . . 0.327 0.3 0.001 0.08 – –Child care and nursery school13. . . . . . . . . . . . . . . . . . . . . 0.802 0.0 0.000 0.09 S-Jan.2018 0.0Technical and business school tuition and fees5.. . 0.032 0.1 0.000 0.11 – –
Postage and delivery services5. . . . . . . . . . . . . . . . . . . . . . . . . 0.109 0.2 0.000 0.02 L-Jan.2018 0.6Postage. . . . . . . . . . . . . . . . . . . . . . . . . . . . . . . . . . . . . . . . . . . . . . . . . 0.095 0.2 0.000 0.00 L-Jan.2018 0.4Delivery services5. . . . . . . . . . . . . . . . . . . . . . . . . . . . . . . . . . . . . . 0.014 0.3 0.000 0.32 L-Jan.2018 1.5
Telephone services4, 5. . . . . . . . . . . . . . . . . . . . . . . . . . . . . . . . . . . 2.298 0.0 -0.001 0.12 L-Dec.2017 0.2Wireless telephone services4, 5. . . . . . . . . . . . . . . . . . . . . . 1.719 0.2 0.004 0.10 L-Nov.2017 0.3Land-line telephone services4, 12. . . . . . . . . . . . . . . . . . . . 0.579 -0.8 -0.005 0.21 S-Sep.2016 -0.8
Internet services and electronic informationproviders5. . . . . . . . . . . . . . . . . . . . . . . . . . . . . . . . . . . . . . . . . . . . . . . 0.778 -1.0 -0.008 0.29 – –
Other personal services4, 12. . . . . . . . . . . . . . . . . . . . . . . . . . . . . . . 1.616 0.6 0.010 0.11 L-May 2016 0.6Personal care services4. . . . . . . . . . . . . . . . . . . . . . . . . . . . . . . . . 0.621 0.3 0.002 0.13 L-Jan.2018 0.5
Haircuts and other personal care services4, 5. . . . . . 0.621 0.3 0.002 0.13 L-Jan.2018 0.5Miscellaneous personal services. . . . . . . . . . . . . . . . . . . . . . . 0.995 0.7 0.007 0.11 L-Jul.2016 0.8
Legal services4, 9. . . . . . . . . . . . . . . . . . . . . . . . . . . . . . . . . . . . . . 0.306 0.6 0.002 0.07 S-Dec.2017 0.0Funeral expenses4, 9. . . . . . . . . . . . . . . . . . . . . . . . . . . . . . . . . . 0.127 0.1 0.000 0.09 S-Jan.2018 -0.1Laundry and dry cleaning services4, 5. . . . . . . . . . . . . . . 0.237 0.5 0.001 0.16 L-Mar.2017 0.5Apparel services other than laundry and dry
cleaning4, 5. . . . . . . . . . . . . . . . . . . . . . . . . . . . . . . . . . . . . . . . . . . 0.028 -0.3 0.000 0.21 S-Aug.2017 -0.7
Financial services9. . . . . . . . . . . . . . . . . . . . . . . . . . . . . . . . . . . . . 0.227 1.5 0.003 0.32 L-Jan.2015 2.2Checking account and other bank
services4, 5, 6. . . . . . . . . . . . . . . . . . . . . . . . . . . . . . . . . . . . . . 4.7 0.02 L-EVER –Tax return preparation and other accounting
fees5, 6. . . . . . . . . . . . . . . . . . . . . . . . . . . . . . . . . . . . . . . . . . . . . . -0.4 0.33 L-Jan.2018 0.8
Special aggregate indexes
See footnotes at end of table.

Table 6. Consumer Price Index for All Urban Consumers (CPI-U): U.S. city average, by expenditure category,March 2018, 1-month analysis table — Continued[1982-84=100, unless otherwise noted]
Expenditure category
Relativeimportance
Feb.2018
One Month
Seasonallyadjustedpercentchange
Feb. 2018-Mar. 2018
Seasonallyadjusted
effect on AllItems
Feb. 2018-Mar. 20181
Standarderror,
medianprice
change2
Largest (L) or Smallest (S)seasonally adjusted
change since:3
Date Percentchange
All items less food. . . . . . . . . . . . . . . . . . . . . . . . . . . . . . . . . . . . . . . . . . . . . . . . . . 86.694 -0.1 -0.080 0.03 S-May 2017 -0.1All items less shelter. . . . . . . . . . . . . . . . . . . . . . . . . . . . . . . . . . . . . . . . . . . . . . . . 67.303 -0.3 -0.179 0.03 S-Mar.2017 -0.3All items less food and shelter. . . . . . . . . . . . . . . . . . . . . . . . . . . . . . . . . . . . 53.997 -0.4 -0.196 0.04 S-Mar.2017 -0.5All items less food, shelter, and energy. . . . . . . . . . . . . . . . . . . . . . . . . . 46.309 0.0 0.023 0.05 S-Nov.2017 0.0All items less food, shelter, energy, and used cars and
trucks.. . . . . . . . . . . . . . . . . . . . . . . . . . . . . . . . . . . . . . . . . . . . . . . . . . . . . . . . . . . . . . 43.902 0.1 0.031 0.05 S-Nov.2017 0.0All items less medical care. . . . . . . . . . . . . . . . . . . . . . . . . . . . . . . . . . . . . . . . 91.321 -0.1 -0.097 0.03 S-May 2017 -0.1All items less energy.. . . . . . . . . . . . . . . . . . . . . . . . . . . . . . . . . . . . . . . . . . . . . . . 92.313 0.2 0.156 0.03 – –Commodities. . . . . . . . . . . . . . . . . . . . . . . . . . . . . . . . . . . . . . . . . . . . . . . . . . . . . . . . . 37.455 -0.6 -0.218 0.05 S-Feb.2016 -0.9
Commodities less food, energy, and used cars andtrucks. . . . . . . . . . . . . . . . . . . . . . . . . . . . . . . . . . . . . . . . . . . . . . . . . . . . . . . . . . . . 17.488 -0.1 -0.017 0.09 S-Nov.2017 -0.2
Commodities less food. . . . . . . . . . . . . . . . . . . . . . . . . . . . . . . . . . . . . . . . . . 24.149 -1.0 -0.235 0.07 S-May 2017 -1.0Commodities less food and beverages. . . . . . . . . . . . . . . . . . . . . . . . 23.179 -1.0 -0.236 0.07 S-May 2017 -1.0
Services. . . . . . . . . . . . . . . . . . . . . . . . . . . . . . . . . . . . . . . . . . . . . . . . . . . . . . . . . . . . . . 62.545 0.2 0.149 0.03 S-Nov.2017 0.2Services less rent of shelter16. . . . . . . . . . . . . . . . . . . . . . . . . . . . . . . . . . 30.220 0.2 0.047 0.05 S-Jan.2018 0.2Services less medical care services. . . . . . . . . . . . . . . . . . . . . . . . . . . 55.606 0.3 0.139 0.04 S-Jan.2018 0.2
Durables.. . . . . . . . . . . . . . . . . . . . . . . . . . . . . . . . . . . . . . . . . . . . . . . . . . . . . . . . . . . . . 10.087 0.0 0.002 0.08 L-Jan.2018 0.1Nondurables. . . . . . . . . . . . . . . . . . . . . . . . . . . . . . . . . . . . . . . . . . . . . . . . . . . . . . . . . 27.368 -0.7 -0.183 0.07 S-Feb.2016 -1.1
Nondurables less food.. . . . . . . . . . . . . . . . . . . . . . . . . . . . . . . . . . . . . . . . . . 14.062 -1.5 -0.211 0.11 S-Feb.2016 -2.5Nondurables less food and beverages. . . . . . . . . . . . . . . . . . . . . . . . 13.092 -1.6 -0.210 0.12 S-Feb.2016 -2.7Nondurables less food, beverages, and apparel. . . . . . . . . . . . . 9.957 -1.7 -0.171 0.09 S-Jun.2017 -1.7Nondurables less food and apparel. . . . . . . . . . . . . . . . . . . . . . . . . . . . 10.927 -1.5 -0.170 0.08 S-Jun.2017 -1.5
Housing.. . . . . . . . . . . . . . . . . . . . . . . . . . . . . . . . . . . . . . . . . . . . . . . . . . . . . . . . . . . . . . 41.663 0.3 0.110 0.04 – –Education and communication5. . . . . . . . . . . . . . . . . . . . . . . . . . . . . . . . . . . 6.624 -0.2 -0.012 0.07 – –
Education5. . . . . . . . . . . . . . . . . . . . . . . . . . . . . . . . . . . . . . . . . . . . . . . . . . . . . . . . . 3.001 -0.1 -0.002 0.06 S-Aug.2000 -0.1Communication5. . . . . . . . . . . . . . . . . . . . . . . . . . . . . . . . . . . . . . . . . . . . . . . . . . 3.623 -0.3 -0.010 0.11 L-Jan.2018 0.0
Information and information processing5. . . . . . . . . . . . . . . . . . . 3.514 -0.3 -0.010 0.12 L-Jan.2018 0.0Information technology, hardware and services18. . . . . . . . . 1.216 -0.8 -0.010 0.25 L-Jan.2018 0.2
Recreation5. . . . . . . . . . . . . . . . . . . . . . . . . . . . . . . . . . . . . . . . . . . . . . . . . . . . . . . . . . 5.716 0.0 0.001 0.11 – –Video and audio5. . . . . . . . . . . . . . . . . . . . . . . . . . . . . . . . . . . . . . . . . . . . . . . . . 1.849 -0.3 -0.006 0.15 S-Sep.2016 -0.5Pets, pet products and services5. . . . . . . . . . . . . . . . . . . . . . . . . . . . . . . 1.011 0.2 0.002 0.16 L-Jan.2018 0.5Photography5.. . . . . . . . . . . . . . . . . . . . . . . . . . . . . . . . . . . . . . . . . . . . . . . . . . . . . 0.074 0.5 0.000 0.41 S-Jan.2018 -1.3
Food and beverages.. . . . . . . . . . . . . . . . . . . . . . . . . . . . . . . . . . . . . . . . . . . . . . . 14.276 0.1 0.018 0.06 L-Jan.2018 0.2Domestically produced farm food. . . . . . . . . . . . . . . . . . . . . . . . . . . . . . 6.128 0.1 0.005 0.11 L-Dec.2017 0.2
Other services. . . . . . . . . . . . . . . . . . . . . . . . . . . . . . . . . . . . . . . . . . . . . . . . . . . . . . . 11.546 -0.1 -0.007 0.06 S-Apr.2017 -0.1Apparel less footwear. . . . . . . . . . . . . . . . . . . . . . . . . . . . . . . . . . . . . . . . . . . . . . 2.462 -1.1 -0.028 0.45 S-Nov.2017 -1.1Fuels and utilities. . . . . . . . . . . . . . . . . . . . . . . . . . . . . . . . . . . . . . . . . . . . . . . . . . . . 4.701 -0.2 -0.007 0.06 S-Jan.2018 -0.2
Household energy. . . . . . . . . . . . . . . . . . . . . . . . . . . . . . . . . . . . . . . . . . . . . . . . 3.628 -0.3 -0.010 0.08 S-Jan.2018 -0.4Medical care. . . . . . . . . . . . . . . . . . . . . . . . . . . . . . . . . . . . . . . . . . . . . . . . . . . . . . . . . 8.679 0.4 0.034 0.09 L-Jan.2018 0.4Transportation. . . . . . . . . . . . . . . . . . . . . . . . . . . . . . . . . . . . . . . . . . . . . . . . . . . . . . . 16.723 -1.2 -0.202 0.06 S-Feb.2016 -2.4
Private transportation. . . . . . . . . . . . . . . . . . . . . . . . . . . . . . . . . . . . . . . . . . . . 15.551 -1.3 -0.206 0.06 S-Feb.2016 -2.5New and used motor vehicles5. . . . . . . . . . . . . . . . . . . . . . . . . . . . . . 7.059 -0.1 -0.006 0.10 L-Jan.2018 0.2
Utilities and public transportation. . . . . . . . . . . . . . . . . . . . . . . . . . . . . . . . . 9.489 0.0 0.001 0.07 S-Jan.2018 -0.2Household furnishings and operations. . . . . . . . . . . . . . . . . . . . . . . . . . . 4.264 0.1 0.002 0.16 S-Dec.2017 0.0Other goods and services.. . . . . . . . . . . . . . . . . . . . . . . . . . . . . . . . . . . . . . . . . 3.184 0.2 0.007 0.10 – –
Personal care4. . . . . . . . . . . . . . . . . . . . . . . . . . . . . . . . . . . . . . . . . . . . . . . . . . . . 2.538 0.3 0.009 0.13 L-Jan.2018 0.5
1 The ’effect’ of an item category is a measure of that item’s contribution to the All items price change. For example, if the Food index had an effect of0.40, and the All items index rose 1.2 percent, then the increase in food prices contributed 0.40 / 1.2, or 33.3 percent, to that All items increase.Said another way, had food prices been unchanged for that month the change in the All items index would have been 1.2 percent minus 0.40, or 0.8percent. Effects can be negative as well. For example, if the effect of food was a negative 0.1, and the All items index rose 0.5 percent, the All itemsindex actually would have been 0.1 percent higher (or 0.6 percent) had food prices been unchanged. Since food prices fell while prices overall wererising, the contribution of food to the All items price change was negative (in this case, -0.1 / 0.5, or minus 20 percent).
2 A statistic’s margin of error is often expressed as its point estimate plus or minus two standard errors. For example, if a CPI category rose 0.6percent, and its standard error was 0.15 percent, the margin of error on this item’s 1-month percent change would be 0.6 percent, plus or minus 0.3percent.
3 If the current seasonally adjusted 1-month percent change is greater than the previous published 1-month percent change, then this columnidentifies the closest prior month with a 1-month percent change as (L)arge as or (L)arger than the current 1-month change. If the current 1-monthpercent change is smaller than the previous published 1-month percent change, the most recent month with a change as (S)mall or (S)maller thanthe current month change is identified. If the current and previous published 1-month percent changes are equal, a dash will appear. Standardnumerical comparisons are used. For example, 0.8% is greater than 0.6%, -0.4% is less than -0.2%, and -0.2% is less than 0.0%. Note that a(L)arger change can be a smaller decline, for example, a -0.2% change is larger than a -0.4% change, but still represents a decline in the priceindex. Likewise, (S)maller changes can be increases, for example, a 0.6% change is smaller than 0.8%, but still represents an increase in the priceindex. In this context, a -0.2% change is considered to be smaller than a 0.0% change.
4 Not seasonally adjusted.5 Indexes on a December 1997=100 base.6 Special indexes based on a substantially smaller sample. These series do not contribute to the all items index aggregation and therefore do not
have a relative importance or effect.7 Indexes on a December 2007=100 base.8 Indexes on a December 2005=100 base.9 Indexes on a December 1986=100 base.10 Indexes on a December 1993=100 base.11 This index series was calculated using a Laspeyres estimator. All other item stratum index series were calculated using a geometric means
estimator.12 Indexes on a December 2009=100 base.13 Indexes on a December 1990=100 base.14 Indexes on a December 1983=100 base.15 Indexes on a December 2001=100 base.16 Indexes on a December 1982=100 base.17 Indexes on a December 1996=100 base.18 Indexes on a December 1988=100 base.NOTE: Index applies to a month as a whole, not to any specific date.
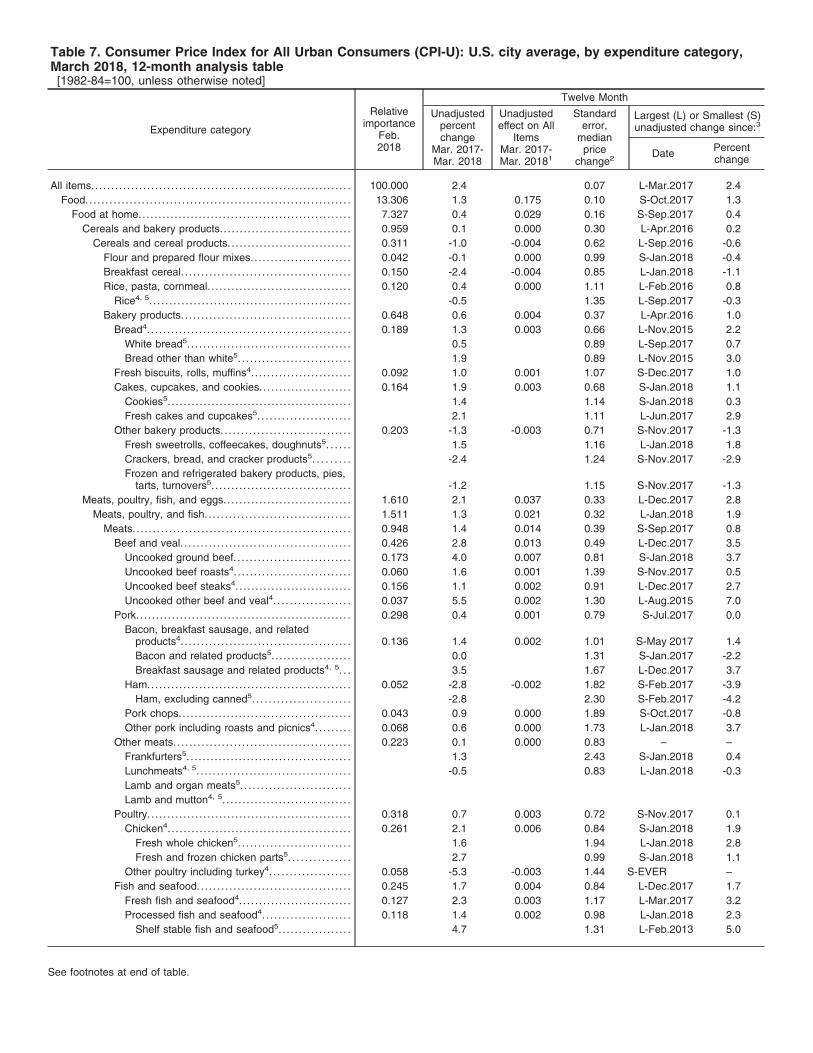
Table 7. Consumer Price Index for All Urban Consumers (CPI-U): U.S. city average, by expenditure category,March 2018, 12-month analysis table[1982-84=100, unless otherwise noted]
Expenditure category
Relativeimportance
Feb.2018
Twelve Month
Unadjustedpercentchange
Mar. 2017-Mar. 2018
Unadjustedeffect on All
ItemsMar. 2017-Mar. 20181
Standarderror,
medianprice
change2
Largest (L) or Smallest (S)unadjusted change since:3
Date Percentchange
All items.. . . . . . . . . . . . . . . . . . . . . . . . . . . . . . . . . . . . . . . . . . . . . . . . . . . . . . . . . . . . . . . . 100.000 2.4 0.07 L-Mar.2017 2.4Food.. . . . . . . . . . . . . . . . . . . . . . . . . . . . . . . . . . . . . . . . . . . . . . . . . . . . . . . . . . . . . . . . . 13.306 1.3 0.175 0.10 S-Oct.2017 1.3
Food at home.. . . . . . . . . . . . . . . . . . . . . . . . . . . . . . . . . . . . . . . . . . . . . . . . . . . . 7.327 0.4 0.029 0.16 S-Sep.2017 0.4Cereals and bakery products. . . . . . . . . . . . . . . . . . . . . . . . . . . . . . . . . 0.959 0.1 0.000 0.30 L-Apr.2016 0.2
Cereals and cereal products. . . . . . . . . . . . . . . . . . . . . . . . . . . . . . . 0.311 -1.0 -0.004 0.62 L-Sep.2016 -0.6Flour and prepared flour mixes. . . . . . . . . . . . . . . . . . . . . . . . . 0.042 -0.1 0.000 0.99 S-Jan.2018 -0.4Breakfast cereal. . . . . . . . . . . . . . . . . . . . . . . . . . . . . . . . . . . . . . . . . . 0.150 -2.4 -0.004 0.85 L-Jan.2018 -1.1Rice, pasta, cornmeal. . . . . . . . . . . . . . . . . . . . . . . . . . . . . . . . . . . . 0.120 0.4 0.000 1.11 L-Feb.2016 0.8
Rice4, 5. . . . . . . . . . . . . . . . . . . . . . . . . . . . . . . . . . . . . . . . . . . . . . . . . . -0.5 1.35 L-Sep.2017 -0.3Bakery products. . . . . . . . . . . . . . . . . . . . . . . . . . . . . . . . . . . . . . . . . . 0.648 0.6 0.004 0.37 L-Apr.2016 1.0
Bread4. . . . . . . . . . . . . . . . . . . . . . . . . . . . . . . . . . . . . . . . . . . . . . . . . . . 0.189 1.3 0.003 0.66 L-Nov.2015 2.2White bread5. . . . . . . . . . . . . . . . . . . . . . . . . . . . . . . . . . . . . . . . . 0.5 0.89 L-Sep.2017 0.7Bread other than white5. . . . . . . . . . . . . . . . . . . . . . . . . . . . 1.9 0.89 L-Nov.2015 3.0
Fresh biscuits, rolls, muffins4. . . . . . . . . . . . . . . . . . . . . . . . . 0.092 1.0 0.001 1.07 S-Dec.2017 1.0Cakes, cupcakes, and cookies. . . . . . . . . . . . . . . . . . . . . . . 0.164 1.9 0.003 0.68 S-Jan.2018 1.1
Cookies5. . . . . . . . . . . . . . . . . . . . . . . . . . . . . . . . . . . . . . . . . . . . . . 1.4 1.14 S-Jan.2018 0.3Fresh cakes and cupcakes5. . . . . . . . . . . . . . . . . . . . . . . 2.1 1.11 L-Jun.2017 2.9
Other bakery products. . . . . . . . . . . . . . . . . . . . . . . . . . . . . . . . 0.203 -1.3 -0.003 0.71 S-Nov.2017 -1.3Fresh sweetrolls, coffeecakes, doughnuts5. . . . . . 1.5 1.16 L-Jan.2018 1.8Crackers, bread, and cracker products5. . . . . . . . . -2.4 1.24 S-Nov.2017 -2.9Frozen and refrigerated bakery products, pies,
tarts, turnovers5. . . . . . . . . . . . . . . . . . . . . . . . . . . . . . . . . . . -1.2 1.15 S-Nov.2017 -1.3Meats, poultry, fish, and eggs.. . . . . . . . . . . . . . . . . . . . . . . . . . . . . . . 1.610 2.1 0.037 0.33 L-Dec.2017 2.8
Meats, poultry, and fish. . . . . . . . . . . . . . . . . . . . . . . . . . . . . . . . . . . . 1.511 1.3 0.021 0.32 L-Jan.2018 1.9Meats. . . . . . . . . . . . . . . . . . . . . . . . . . . . . . . . . . . . . . . . . . . . . . . . . . . . . . 0.948 1.4 0.014 0.39 S-Sep.2017 0.8
Beef and veal. . . . . . . . . . . . . . . . . . . . . . . . . . . . . . . . . . . . . . . . . . 0.426 2.8 0.013 0.49 L-Dec.2017 3.5Uncooked ground beef. . . . . . . . . . . . . . . . . . . . . . . . . . . . . 0.173 4.0 0.007 0.81 S-Jan.2018 3.7Uncooked beef roasts4. . . . . . . . . . . . . . . . . . . . . . . . . . . . . 0.060 1.6 0.001 1.39 S-Nov.2017 0.5Uncooked beef steaks4. . . . . . . . . . . . . . . . . . . . . . . . . . . . . 0.156 1.1 0.002 0.91 L-Dec.2017 2.7Uncooked other beef and veal4. . . . . . . . . . . . . . . . . . . 0.037 5.5 0.002 1.30 L-Aug.2015 7.0
Pork.. . . . . . . . . . . . . . . . . . . . . . . . . . . . . . . . . . . . . . . . . . . . . . . . . . . . . 0.298 0.4 0.001 0.79 S-Jul.2017 0.0Bacon, breakfast sausage, and related
products4. . . . . . . . . . . . . . . . . . . . . . . . . . . . . . . . . . . . . . . . . . 0.136 1.4 0.002 1.01 S-May 2017 1.4Bacon and related products5. . . . . . . . . . . . . . . . . . . . 0.0 1.31 S-Jan.2017 -2.2Breakfast sausage and related products4, 5. . . 3.5 1.67 L-Dec.2017 3.7
Ham... . . . . . . . . . . . . . . . . . . . . . . . . . . . . . . . . . . . . . . . . . . . . . . . . 0.052 -2.8 -0.002 1.82 S-Feb.2017 -3.9Ham, excluding canned5. . . . . . . . . . . . . . . . . . . . . . . . -2.8 2.30 S-Feb.2017 -4.2
Pork chops.. . . . . . . . . . . . . . . . . . . . . . . . . . . . . . . . . . . . . . . . . . 0.043 0.9 0.000 1.89 S-Oct.2017 -0.8Other pork including roasts and picnics4. . . . . . . . . 0.068 0.6 0.000 1.73 L-Jan.2018 3.7
Other meats. . . . . . . . . . . . . . . . . . . . . . . . . . . . . . . . . . . . . . . . . . . . 0.223 0.1 0.000 0.83 – –Frankfurters5. . . . . . . . . . . . . . . . . . . . . . . . . . . . . . . . . . . . . . . . . 1.3 2.43 S-Jan.2018 0.4Lunchmeats4, 5. . . . . . . . . . . . . . . . . . . . . . . . . . . . . . . . . . . . . . -0.5 0.83 L-Jan.2018 -0.3Lamb and organ meats5. . . . . . . . . . . . . . . . . . . . . . . . . . .Lamb and mutton4, 5. . . . . . . . . . . . . . . . . . . . . . . . . . . . . . . .
Poultry. . . . . . . . . . . . . . . . . . . . . . . . . . . . . . . . . . . . . . . . . . . . . . . . . . . 0.318 0.7 0.003 0.72 S-Nov.2017 0.1Chicken4. . . . . . . . . . . . . . . . . . . . . . . . . . . . . . . . . . . . . . . . . . . . . . 0.261 2.1 0.006 0.84 S-Jan.2018 1.9
Fresh whole chicken5. . . . . . . . . . . . . . . . . . . . . . . . . . . . 1.6 1.94 L-Jan.2018 2.8Fresh and frozen chicken parts5. . . . . . . . . . . . . . . 2.7 0.99 S-Jan.2018 1.1
Other poultry including turkey4. . . . . . . . . . . . . . . . . . . . 0.058 -5.3 -0.003 1.44 S-EVER –Fish and seafood. . . . . . . . . . . . . . . . . . . . . . . . . . . . . . . . . . . . . . 0.245 1.7 0.004 0.84 L-Dec.2017 1.7
Fresh fish and seafood4. . . . . . . . . . . . . . . . . . . . . . . . . . . . 0.127 2.3 0.003 1.17 L-Mar.2017 3.2Processed fish and seafood4. . . . . . . . . . . . . . . . . . . . . . 0.118 1.4 0.002 0.98 L-Jan.2018 2.3
Shelf stable fish and seafood5. . . . . . . . . . . . . . . . . . 4.7 1.31 L-Feb.2013 5.0
See footnotes at end of table.
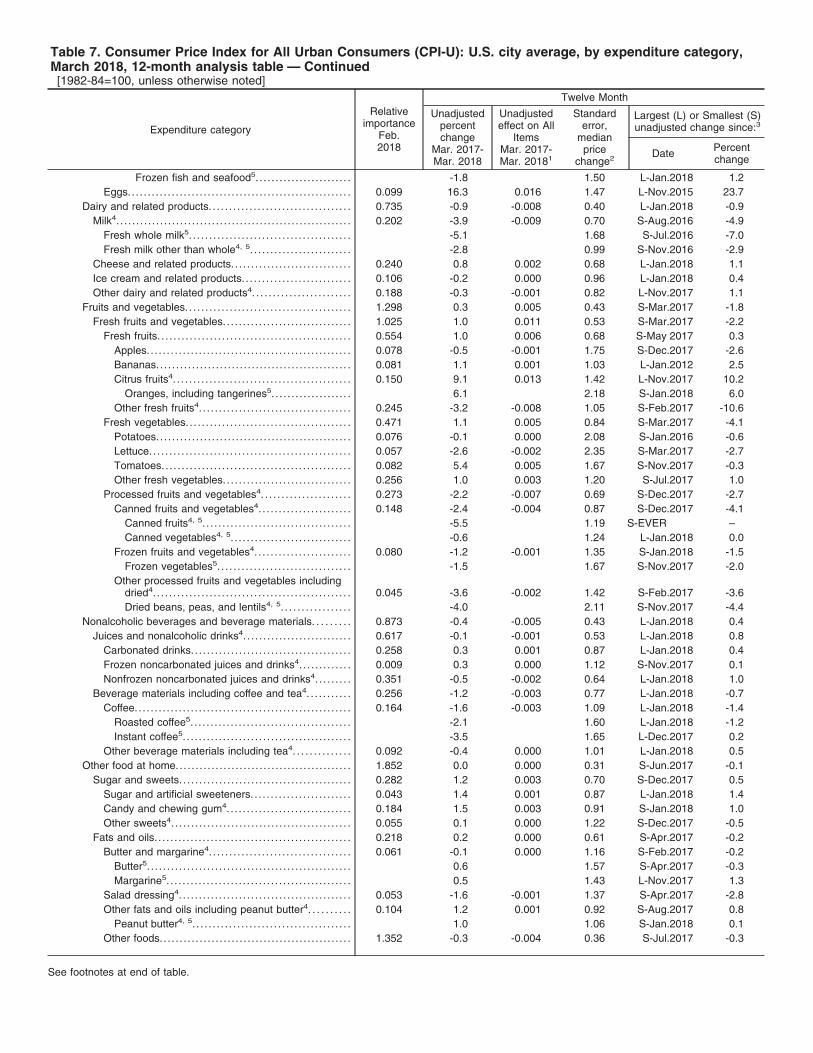
Table 7. Consumer Price Index for All Urban Consumers (CPI-U): U.S. city average, by expenditure category,March 2018, 12-month analysis table — Continued[1982-84=100, unless otherwise noted]
Expenditure category
Relativeimportance
Feb.2018
Twelve Month
Unadjustedpercentchange
Mar. 2017-Mar. 2018
Unadjustedeffect on All
ItemsMar. 2017-Mar. 20181
Standarderror,
medianprice
change2
Largest (L) or Smallest (S)unadjusted change since:3
Date Percentchange
Frozen fish and seafood5. . . . . . . . . . . . . . . . . . . . . . . . -1.8 1.50 L-Jan.2018 1.2Eggs.. . . . . . . . . . . . . . . . . . . . . . . . . . . . . . . . . . . . . . . . . . . . . . . . . . . . . . . 0.099 16.3 0.016 1.47 L-Nov.2015 23.7
Dairy and related products. . . . . . . . . . . . . . . . . . . . . . . . . . . . . . . . . . . 0.735 -0.9 -0.008 0.40 L-Jan.2018 -0.9Milk4. . . . . . . . . . . . . . . . . . . . . . . . . . . . . . . . . . . . . . . . . . . . . . . . . . . . . . . . . . . 0.202 -3.9 -0.009 0.70 S-Aug.2016 -4.9
Fresh whole milk5. . . . . . . . . . . . . . . . . . . . . . . . . . . . . . . . . . . . . . . . -5.1 1.68 S-Jul.2016 -7.0Fresh milk other than whole4, 5. . . . . . . . . . . . . . . . . . . . . . . . . -2.8 0.99 S-Nov.2016 -2.9
Cheese and related products. . . . . . . . . . . . . . . . . . . . . . . . . . . . . . 0.240 0.8 0.002 0.68 L-Jan.2018 1.1Ice cream and related products. . . . . . . . . . . . . . . . . . . . . . . . . . . 0.106 -0.2 0.000 0.96 L-Jan.2018 0.4Other dairy and related products4. . . . . . . . . . . . . . . . . . . . . . . . 0.188 -0.3 -0.001 0.82 L-Nov.2017 1.1
Fruits and vegetables. . . . . . . . . . . . . . . . . . . . . . . . . . . . . . . . . . . . . . . . . 1.298 0.3 0.005 0.43 S-Mar.2017 -1.8Fresh fruits and vegetables. . . . . . . . . . . . . . . . . . . . . . . . . . . . . . . . 1.025 1.0 0.011 0.53 S-Mar.2017 -2.2
Fresh fruits. . . . . . . . . . . . . . . . . . . . . . . . . . . . . . . . . . . . . . . . . . . . . . . . 0.554 1.0 0.006 0.68 S-May 2017 0.3Apples. . . . . . . . . . . . . . . . . . . . . . . . . . . . . . . . . . . . . . . . . . . . . . . . . . . 0.078 -0.5 -0.001 1.75 S-Dec.2017 -2.6Bananas.. . . . . . . . . . . . . . . . . . . . . . . . . . . . . . . . . . . . . . . . . . . . . . . . 0.081 1.1 0.001 1.03 L-Jan.2012 2.5Citrus fruits4. . . . . . . . . . . . . . . . . . . . . . . . . . . . . . . . . . . . . . . . . . . . 0.150 9.1 0.013 1.42 L-Nov.2017 10.2
Oranges, including tangerines5. . . . . . . . . . . . . . . . . . . . 6.1 2.18 S-Jan.2018 6.0Other fresh fruits4. . . . . . . . . . . . . . . . . . . . . . . . . . . . . . . . . . . . . . 0.245 -3.2 -0.008 1.05 S-Feb.2017 -10.6
Fresh vegetables. . . . . . . . . . . . . . . . . . . . . . . . . . . . . . . . . . . . . . . . . 0.471 1.1 0.005 0.84 S-Mar.2017 -4.1Potatoes.. . . . . . . . . . . . . . . . . . . . . . . . . . . . . . . . . . . . . . . . . . . . . . . . 0.076 -0.1 0.000 2.08 S-Jan.2016 -0.6Lettuce. . . . . . . . . . . . . . . . . . . . . . . . . . . . . . . . . . . . . . . . . . . . . . . . . . 0.057 -2.6 -0.002 2.35 S-Mar.2017 -2.7Tomatoes. . . . . . . . . . . . . . . . . . . . . . . . . . . . . . . . . . . . . . . . . . . . . . . 0.082 5.4 0.005 1.67 S-Nov.2017 -0.3Other fresh vegetables. . . . . . . . . . . . . . . . . . . . . . . . . . . . . . . . 0.256 1.0 0.003 1.20 S-Jul.2017 1.0
Processed fruits and vegetables4. . . . . . . . . . . . . . . . . . . . . . 0.273 -2.2 -0.007 0.69 S-Dec.2017 -2.7Canned fruits and vegetables4. . . . . . . . . . . . . . . . . . . . . . . 0.148 -2.4 -0.004 0.87 S-Dec.2017 -4.1
Canned fruits4, 5. . . . . . . . . . . . . . . . . . . . . . . . . . . . . . . . . . . . . -5.5 1.19 S-EVER –Canned vegetables4, 5. . . . . . . . . . . . . . . . . . . . . . . . . . . . . . -0.6 1.24 L-Jan.2018 0.0
Frozen fruits and vegetables4. . . . . . . . . . . . . . . . . . . . . . . . 0.080 -1.2 -0.001 1.35 S-Jan.2018 -1.5Frozen vegetables5. . . . . . . . . . . . . . . . . . . . . . . . . . . . . . . . . -1.5 1.67 S-Nov.2017 -2.0
Other processed fruits and vegetables includingdried4. . . . . . . . . . . . . . . . . . . . . . . . . . . . . . . . . . . . . . . . . . . . . . . . . 0.045 -3.6 -0.002 1.42 S-Feb.2017 -3.6Dried beans, peas, and lentils4, 5. . . . . . . . . . . . . . . . . -4.0 2.11 S-Nov.2017 -4.4
Nonalcoholic beverages and beverage materials. . . . . . . . . 0.873 -0.4 -0.005 0.43 L-Jan.2018 0.4Juices and nonalcoholic drinks4. . . . . . . . . . . . . . . . . . . . . . . . . . . 0.617 -0.1 -0.001 0.53 L-Jan.2018 0.8
Carbonated drinks. . . . . . . . . . . . . . . . . . . . . . . . . . . . . . . . . . . . . . . . 0.258 0.3 0.001 0.87 L-Jan.2018 0.4Frozen noncarbonated juices and drinks4. . . . . . . . . . . . . 0.009 0.3 0.000 1.12 S-Nov.2017 0.1Nonfrozen noncarbonated juices and drinks4. . . . . . . . . 0.351 -0.5 -0.002 0.64 L-Jan.2018 1.0
Beverage materials including coffee and tea4. . . . . . . . . . . 0.256 -1.2 -0.003 0.77 L-Jan.2018 -0.7Coffee. . . . . . . . . . . . . . . . . . . . . . . . . . . . . . . . . . . . . . . . . . . . . . . . . . . . . . 0.164 -1.6 -0.003 1.09 L-Jan.2018 -1.4
Roasted coffee5. . . . . . . . . . . . . . . . . . . . . . . . . . . . . . . . . . . . . . . . -2.1 1.60 L-Jan.2018 -1.2Instant coffee5. . . . . . . . . . . . . . . . . . . . . . . . . . . . . . . . . . . . . . . . . . -3.5 1.65 L-Dec.2017 0.2
Other beverage materials including tea4. . . . . . . . . . . . . . 0.092 -0.4 0.000 1.01 L-Jan.2018 0.5Other food at home.. . . . . . . . . . . . . . . . . . . . . . . . . . . . . . . . . . . . . . . . . . . 1.852 0.0 0.000 0.31 S-Jun.2017 -0.1
Sugar and sweets. . . . . . . . . . . . . . . . . . . . . . . . . . . . . . . . . . . . . . . . . . . 0.282 1.2 0.003 0.70 S-Dec.2017 0.5Sugar and artificial sweeteners. . . . . . . . . . . . . . . . . . . . . . . . . 0.043 1.4 0.001 0.87 L-Jan.2018 1.4Candy and chewing gum4.. . . . . . . . . . . . . . . . . . . . . . . . . . . . . . 0.184 1.5 0.003 0.91 S-Jan.2018 1.0Other sweets4. . . . . . . . . . . . . . . . . . . . . . . . . . . . . . . . . . . . . . . . . . . . . 0.055 0.1 0.000 1.22 S-Dec.2017 -0.5
Fats and oils. . . . . . . . . . . . . . . . . . . . . . . . . . . . . . . . . . . . . . . . . . . . . . . . . 0.218 0.2 0.000 0.61 S-Apr.2017 -0.2Butter and margarine4. . . . . . . . . . . . . . . . . . . . . . . . . . . . . . . . . . . 0.061 -0.1 0.000 1.16 S-Feb.2017 -0.2
Butter5. . . . . . . . . . . . . . . . . . . . . . . . . . . . . . . . . . . . . . . . . . . . . . . . . . . 0.6 1.57 S-Apr.2017 -0.3Margarine5. . . . . . . . . . . . . . . . . . . . . . . . . . . . . . . . . . . . . . . . . . . . . . 0.5 1.43 L-Nov.2017 1.3
Salad dressing4. . . . . . . . . . . . . . . . . . . . . . . . . . . . . . . . . . . . . . . . . . . 0.053 -1.6 -0.001 1.37 S-Apr.2017 -2.8Other fats and oils including peanut butter4. . . . . . . . . . 0.104 1.2 0.001 0.92 S-Aug.2017 0.8
Peanut butter4, 5. . . . . . . . . . . . . . . . . . . . . . . . . . . . . . . . . . . . . . . 1.0 1.06 S-Jan.2018 0.1Other foods.. . . . . . . . . . . . . . . . . . . . . . . . . . . . . . . . . . . . . . . . . . . . . . . 1.352 -0.3 -0.004 0.36 S-Jul.2017 -0.3
See footnotes at end of table.

Table 7. Consumer Price Index for All Urban Consumers (CPI-U): U.S. city average, by expenditure category,March 2018, 12-month analysis table — Continued[1982-84=100, unless otherwise noted]
Expenditure category
Relativeimportance
Feb.2018
Twelve Month
Unadjustedpercentchange
Mar. 2017-Mar. 2018
Unadjustedeffect on All
ItemsMar. 2017-Mar. 20181
Standarderror,
medianprice
change2
Largest (L) or Smallest (S)unadjusted change since:3
Date Percentchange
Soups.. . . . . . . . . . . . . . . . . . . . . . . . . . . . . . . . . . . . . . . . . . . . . . . . . . . 0.083 -2.0 -0.002 1.65 S-Apr.2014 -2.6Frozen and freeze dried prepared foods. . . . . . . . . . . 0.235 -0.2 0.000 0.89 L-Jan.2018 -0.1Snacks. . . . . . . . . . . . . . . . . . . . . . . . . . . . . . . . . . . . . . . . . . . . . . . . . . 0.312 -0.5 -0.002 0.82 S-Jul.2017 -1.3Spices, seasonings, condiments, sauces. . . . . . . . . . . 0.272 0.3 0.001 0.79 – –
Salt and other seasonings and spices4, 5. . . . . . . . 2.0 1.40 S-Dec.2017 0.1Olives, pickles, relishes4, 5. . . . . . . . . . . . . . . . . . . . . . . . . -2.9 1.68 S-Jul.2017 -4.2Sauces and gravies4, 5. . . . . . . . . . . . . . . . . . . . . . . . . . . . . 2.5 1.16 L-Jan.2018 2.7Other condiments5. . . . . . . . . . . . . . . . . . . . . . . . . . . . . . . . . . -1.3 1.74 L-Jan.2018 0.2
Baby food4. . . . . . . . . . . . . . . . . . . . . . . . . . . . . . . . . . . . . . . . . . . . . . 0.049 0.9 0.000 1.16 L-Oct.2017 1.0Other miscellaneous foods4. . . . . . . . . . . . . . . . . . . . . . . . . . 0.401 -0.3 -0.001 0.51 S-Jan.2018 -0.4
Prepared salads6, 5. . . . . . . . . . . . . . . . . . . . . . . . . . . . . . . . . 0.5 1.26 S-Jan.2018 0.5Food away from home.. . . . . . . . . . . . . . . . . . . . . . . . . . . . . . . . . . . . . . . . . . 5.978 2.5 0.146 0.10 S-Jan.2018 2.5
Full service meals and snacks4. . . . . . . . . . . . . . . . . . . . . . . . . . . . . . 2.971 2.1 0.061 0.13 – –Limited service meals and snacks4. . . . . . . . . . . . . . . . . . . . . . . . . . 2.544 3.0 0.074 0.18 S-Jan.2018 2.9Food at employee sites and schools4. . . . . . . . . . . . . . . . . . . . . . . 0.180 2.1 0.004 0.63 – –
Food at elementary and secondary schools7, 5. . . . . . . . . 1.6 0.52 – –Food from vending machines and mobile vendors4. . . . . . . 0.090 2.3 0.002 1.49 S-Oct.2017 1.9Other food away from home4. . . . . . . . . . . . . . . . . . . . . . . . . . . . . . . . 0.194 2.2 0.005 0.53 S-Dec.2017 2.2
Energy.. . . . . . . . . . . . . . . . . . . . . . . . . . . . . . . . . . . . . . . . . . . . . . . . . . . . . . . . . . . . . . . 7.687 7.0 0.508 0.11 S-Jan.2018 5.5Energy commodities. . . . . . . . . . . . . . . . . . . . . . . . . . . . . . . . . . . . . . . . . . . . . 4.254 11.3 0.420 0.17 S-Jan.2018 9.0
Fuel oil and other fuels. . . . . . . . . . . . . . . . . . . . . . . . . . . . . . . . . . . . . . . . 0.195 14.2 0.026 0.91 S-Dec.2017 12.6Fuel oil. . . . . . . . . . . . . . . . . . . . . . . . . . . . . . . . . . . . . . . . . . . . . . . . . . . . . . . . 0.117 20.0 0.020 1.08 S-Dec.2017 15.2Propane, kerosene, and firewood8.. . . . . . . . . . . . . . . . . . . . . . . 0.078 7.2 0.006 1.58 L-Jan.2018 9.0
Motor fuel. . . . . . . . . . . . . . . . . . . . . . . . . . . . . . . . . . . . . . . . . . . . . . . . . . . . . . . 4.059 11.2 0.393 0.18 S-Jan.2018 8.6Gasoline (all types). . . . . . . . . . . . . . . . . . . . . . . . . . . . . . . . . . . . . . . . . 3.971 11.1 0.384 0.18 S-Jan.2018 8.5
Gasoline, unleaded regular5. . . . . . . . . . . . . . . . . . . . . . . . . . . . 11.3 0.94 S-Jan.2018 8.5Gasoline, unleaded midgrade9, 5. . . . . . . . . . . . . . . . . . . . . . . 9.9 0.78 S-Jan.2018 7.9Gasoline, unleaded premium5. . . . . . . . . . . . . . . . . . . . . . . . . . 10.2 0.79 S-Jan.2018 8.4
Other motor fuels4. . . . . . . . . . . . . . . . . . . . . . . . . . . . . . . . . . . . . . . . . . 0.088 16.5 0.009 0.28 S-Jan.2018 15.8Energy services10. . . . . . . . . . . . . . . . . . . . . . . . . . . . . . . . . . . . . . . . . . . . . . . . 3.433 2.5 0.088 0.15 S-Jan.2018 1.9
Electricity10. . . . . . . . . . . . . . . . . . . . . . . . . . . . . . . . . . . . . . . . . . . . . . . . . . . . . 2.634 2.2 0.061 0.18 – –Utility (piped) gas service10. . . . . . . . . . . . . . . . . . . . . . . . . . . . . . . . . . . 0.799 3.4 0.027 0.22 S-Jan.2018 0.2
All items less food and energy. . . . . . . . . . . . . . . . . . . . . . . . . . . . . . . . . . . . 79.007 2.1 1.677 0.08 L-Feb.2017 2.2Commodities less food and energy commodities. . . . . . . . . . . . 19.895 -0.3 -0.041 0.19 L-Jan.2017 -0.2
Household furnishings and supplies11. . . . . . . . . . . . . . . . . . . . . . 3.395 -1.5 -0.045 0.33 L-Jun.2017 -1.3Window and floor coverings and other linens4. . . . . . . . . . 0.271 -1.7 -0.004 1.10 S-Dec.2017 -2.1
Floor coverings4. . . . . . . . . . . . . . . . . . . . . . . . . . . . . . . . . . . . . . . . . . 0.056 4.4 0.002 1.56 L-Apr.2009 5.1Window coverings4. . . . . . . . . . . . . . . . . . . . . . . . . . . . . . . . . . . . . . . 0.049 -5.5 -0.003 2.47 S-Jan.2018 -5.7Other linens4. . . . . . . . . . . . . . . . . . . . . . . . . . . . . . . . . . . . . . . . . . . . . . 0.165 -2.7 -0.003 1.79 S-Nov.2017 -5.5
Furniture and bedding. . . . . . . . . . . . . . . . . . . . . . . . . . . . . . . . . . . . . . 0.888 -1.3 -0.010 0.84 S-May 2017 -1.4Bedroom furniture. . . . . . . . . . . . . . . . . . . . . . . . . . . . . . . . . . . . . . . . 0.324 -0.1 0.000 1.05 S-Jul.2017 -1.8Living room, kitchen, and dining room furniture4. . . . . 0.425 -2.0 -0.007 1.41 S-Jan.2018 -2.0Other furniture4. . . . . . . . . . . . . . . . . . . . . . . . . . . . . . . . . . . . . . . . . . . 0.127 -2.0 -0.003 1.58 L-Jan.2018 -0.8
Infants’ furniture7, 5. . . . . . . . . . . . . . . . . . . . . . . . . . . . . . . . . . . . -5.1 2.26 L-Dec.2017 -4.7Appliances4. . . . . . . . . . . . . . . . . . . . . . . . . . . . . . . . . . . . . . . . . . . . . . . . . . 0.208 -2.2 -0.003 1.10 L-Jan.2018 -1.4
Major appliances4. . . . . . . . . . . . . . . . . . . . . . . . . . . . . . . . . . . . . . . . 0.074 -3.6 -0.002 1.29 L-Jan.2018 -2.4Laundry equipment5. . . . . . . . . . . . . . . . . . . . . . . . . . . . . . . . . . . -7.2 2.84 L-Jan.2018 -3.6
Other appliances4. . . . . . . . . . . . . . . . . . . . . . . . . . . . . . . . . . . . . . . . 0.131 -1.5 -0.002 1.52 L-Jan.2018 -1.1Other household equipment and furnishings4. . . . . . . . . . . 0.525 -6.2 -0.028 1.03 L-Dec.2017 -5.1
Clocks, lamps, and decorator items.. . . . . . . . . . . . . . . . . . . 0.291 -10.2 -0.025 1.64 – –Indoor plants and flowers12. . . . . . . . . . . . . . . . . . . . . . . . . . . . . 0.095 1.5 0.001 1.28 L-Dec.2017 2.0Dishes and flatware4. . . . . . . . . . . . . . . . . . . . . . . . . . . . . . . . . . . . . 0.059 -6.8 -0.004 3.20 S-Dec.2016 -7.2Nonelectric cookware and tableware4. . . . . . . . . . . . . . . . . 0.081 -2.0 -0.001 1.49 L-Mar.2017 -1.6
See footnotes at end of table.
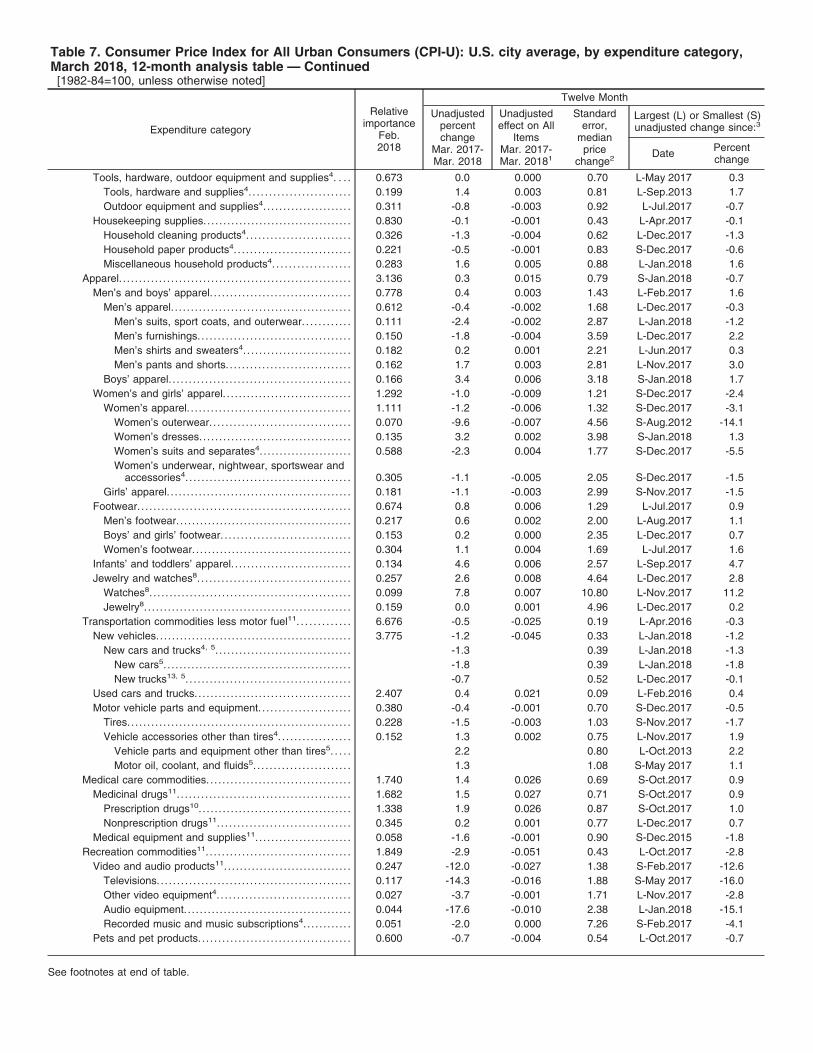
Table 7. Consumer Price Index for All Urban Consumers (CPI-U): U.S. city average, by expenditure category,March 2018, 12-month analysis table — Continued[1982-84=100, unless otherwise noted]
Expenditure category
Relativeimportance
Feb.2018
Twelve Month
Unadjustedpercentchange
Mar. 2017-Mar. 2018
Unadjustedeffect on All
ItemsMar. 2017-Mar. 20181
Standarderror,
medianprice
change2
Largest (L) or Smallest (S)unadjusted change since:3
Date Percentchange
Tools, hardware, outdoor equipment and supplies4. . . . 0.673 0.0 0.000 0.70 L-May 2017 0.3Tools, hardware and supplies4. . . . . . . . . . . . . . . . . . . . . . . . . 0.199 1.4 0.003 0.81 L-Sep.2013 1.7Outdoor equipment and supplies4. . . . . . . . . . . . . . . . . . . . . . 0.311 -0.8 -0.003 0.92 L-Jul.2017 -0.7
Housekeeping supplies. . . . . . . . . . . . . . . . . . . . . . . . . . . . . . . . . . . . . 0.830 -0.1 -0.001 0.43 L-Apr.2017 -0.1Household cleaning products4. . . . . . . . . . . . . . . . . . . . . . . . . . 0.326 -1.3 -0.004 0.62 L-Dec.2017 -1.3Household paper products4. . . . . . . . . . . . . . . . . . . . . . . . . . . . . 0.221 -0.5 -0.001 0.83 S-Dec.2017 -0.6Miscellaneous household products4. . . . . . . . . . . . . . . . . . . 0.283 1.6 0.005 0.88 L-Jan.2018 1.6
Apparel. . . . . . . . . . . . . . . . . . . . . . . . . . . . . . . . . . . . . . . . . . . . . . . . . . . . . . . . . . 3.136 0.3 0.015 0.79 S-Jan.2018 -0.7Men’s and boys’ apparel. . . . . . . . . . . . . . . . . . . . . . . . . . . . . . . . . . . 0.778 0.4 0.003 1.43 L-Feb.2017 1.6
Men’s apparel. . . . . . . . . . . . . . . . . . . . . . . . . . . . . . . . . . . . . . . . . . . . . 0.612 -0.4 -0.002 1.68 L-Dec.2017 -0.3Men’s suits, sport coats, and outerwear. . . . . . . . . . . . 0.111 -2.4 -0.002 2.87 L-Jan.2018 -1.2Men’s furnishings. . . . . . . . . . . . . . . . . . . . . . . . . . . . . . . . . . . . . . 0.150 -1.8 -0.004 3.59 L-Dec.2017 2.2Men’s shirts and sweaters4. . . . . . . . . . . . . . . . . . . . . . . . . . . 0.182 0.2 0.001 2.21 L-Jun.2017 0.3Men’s pants and shorts. . . . . . . . . . . . . . . . . . . . . . . . . . . . . . . 0.162 1.7 0.003 2.81 L-Nov.2017 3.0
Boys’ apparel. . . . . . . . . . . . . . . . . . . . . . . . . . . . . . . . . . . . . . . . . . . . . 0.166 3.4 0.006 3.18 S-Jan.2018 1.7Women’s and girls’ apparel. . . . . . . . . . . . . . . . . . . . . . . . . . . . . . . . 1.292 -1.0 -0.009 1.21 S-Dec.2017 -2.4
Women’s apparel. . . . . . . . . . . . . . . . . . . . . . . . . . . . . . . . . . . . . . . . . 1.111 -1.2 -0.006 1.32 S-Dec.2017 -3.1Women’s outerwear. . . . . . . . . . . . . . . . . . . . . . . . . . . . . . . . . . . 0.070 -9.6 -0.007 4.56 S-Aug.2012 -14.1Women’s dresses.. . . . . . . . . . . . . . . . . . . . . . . . . . . . . . . . . . . . . 0.135 3.2 0.002 3.98 S-Jan.2018 1.3Women’s suits and separates4. . . . . . . . . . . . . . . . . . . . . . . 0.588 -2.3 0.004 1.77 S-Dec.2017 -5.5Women’s underwear, nightwear, sportswear and
accessories4. . . . . . . . . . . . . . . . . . . . . . . . . . . . . . . . . . . . . . . . . 0.305 -1.1 -0.005 2.05 S-Dec.2017 -1.5Girls’ apparel. . . . . . . . . . . . . . . . . . . . . . . . . . . . . . . . . . . . . . . . . . . . . . 0.181 -1.1 -0.003 2.99 S-Nov.2017 -1.5
Footwear. . . . . . . . . . . . . . . . . . . . . . . . . . . . . . . . . . . . . . . . . . . . . . . . . . . . . 0.674 0.8 0.006 1.29 L-Jul.2017 0.9Men’s footwear. . . . . . . . . . . . . . . . . . . . . . . . . . . . . . . . . . . . . . . . . . . . 0.217 0.6 0.002 2.00 L-Aug.2017 1.1Boys’ and girls’ footwear. . . . . . . . . . . . . . . . . . . . . . . . . . . . . . . . 0.153 0.2 0.000 2.35 L-Dec.2017 0.7Women’s footwear. . . . . . . . . . . . . . . . . . . . . . . . . . . . . . . . . . . . . . . . 0.304 1.1 0.004 1.69 L-Jul.2017 1.6
Infants’ and toddlers’ apparel. . . . . . . . . . . . . . . . . . . . . . . . . . . . . . 0.134 4.6 0.006 2.57 L-Sep.2017 4.7Jewelry and watches8. . . . . . . . . . . . . . . . . . . . . . . . . . . . . . . . . . . . . . 0.257 2.6 0.008 4.64 L-Dec.2017 2.8
Watches8. . . . . . . . . . . . . . . . . . . . . . . . . . . . . . . . . . . . . . . . . . . . . . . . . . 0.099 7.8 0.007 10.80 L-Nov.2017 11.2Jewelry8. . . . . . . . . . . . . . . . . . . . . . . . . . . . . . . . . . . . . . . . . . . . . . . . . . . . 0.159 0.0 0.001 4.96 L-Dec.2017 0.2
Transportation commodities less motor fuel11. . . . . . . . . . . . . 6.676 -0.5 -0.025 0.19 L-Apr.2016 -0.3New vehicles.. . . . . . . . . . . . . . . . . . . . . . . . . . . . . . . . . . . . . . . . . . . . . . . . 3.775 -1.2 -0.045 0.33 L-Jan.2018 -1.2
New cars and trucks4, 5. . . . . . . . . . . . . . . . . . . . . . . . . . . . . . . . . . -1.3 0.39 L-Jan.2018 -1.3New cars5. . . . . . . . . . . . . . . . . . . . . . . . . . . . . . . . . . . . . . . . . . . . . . . -1.8 0.39 L-Jan.2018 -1.8New trucks13, 5. . . . . . . . . . . . . . . . . . . . . . . . . . . . . . . . . . . . . . . . . -0.7 0.52 L-Dec.2017 -0.1
Used cars and trucks. . . . . . . . . . . . . . . . . . . . . . . . . . . . . . . . . . . . . . . 2.407 0.4 0.021 0.09 L-Feb.2016 0.4Motor vehicle parts and equipment. . . . . . . . . . . . . . . . . . . . . . . 0.380 -0.4 -0.001 0.70 S-Dec.2017 -0.5
Tires. . . . . . . . . . . . . . . . . . . . . . . . . . . . . . . . . . . . . . . . . . . . . . . . . . . . . . . . 0.228 -1.5 -0.003 1.03 S-Nov.2017 -1.7Vehicle accessories other than tires4. . . . . . . . . . . . . . . . . . 0.152 1.3 0.002 0.75 L-Nov.2017 1.9
Vehicle parts and equipment other than tires5. . . . . 2.2 0.80 L-Oct.2013 2.2Motor oil, coolant, and fluids5. . . . . . . . . . . . . . . . . . . . . . . . 1.3 1.08 S-May 2017 1.1
Medical care commodities. . . . . . . . . . . . . . . . . . . . . . . . . . . . . . . . . . . . 1.740 1.4 0.026 0.69 S-Oct.2017 0.9Medicinal drugs11. . . . . . . . . . . . . . . . . . . . . . . . . . . . . . . . . . . . . . . . . . . 1.682 1.5 0.027 0.71 S-Oct.2017 0.9
Prescription drugs10. . . . . . . . . . . . . . . . . . . . . . . . . . . . . . . . . . . . . . 1.338 1.9 0.026 0.87 S-Oct.2017 1.0Nonprescription drugs11. . . . . . . . . . . . . . . . . . . . . . . . . . . . . . . . . 0.345 0.2 0.001 0.77 L-Dec.2017 0.7
Medical equipment and supplies11. . . . . . . . . . . . . . . . . . . . . . . . 0.058 -1.6 -0.001 0.90 S-Dec.2015 -1.8Recreation commodities11. . . . . . . . . . . . . . . . . . . . . . . . . . . . . . . . . . . . 1.849 -2.9 -0.051 0.43 L-Oct.2017 -2.8
Video and audio products11. . . . . . . . . . . . . . . . . . . . . . . . . . . . . . . . 0.247 -12.0 -0.027 1.38 S-Feb.2017 -12.6Televisions. . . . . . . . . . . . . . . . . . . . . . . . . . . . . . . . . . . . . . . . . . . . . . . . 0.117 -14.3 -0.016 1.88 S-May 2017 -16.0Other video equipment4. . . . . . . . . . . . . . . . . . . . . . . . . . . . . . . . . 0.027 -3.7 -0.001 1.71 L-Nov.2017 -2.8Audio equipment. . . . . . . . . . . . . . . . . . . . . . . . . . . . . . . . . . . . . . . . . . 0.044 -17.6 -0.010 2.38 L-Jan.2018 -15.1Recorded music and music subscriptions4. . . . . . . . . . . . 0.051 -2.0 0.000 7.26 S-Feb.2017 -4.1
Pets and pet products. . . . . . . . . . . . . . . . . . . . . . . . . . . . . . . . . . . . . . 0.600 -0.7 -0.004 0.54 L-Oct.2017 -0.7
See footnotes at end of table.
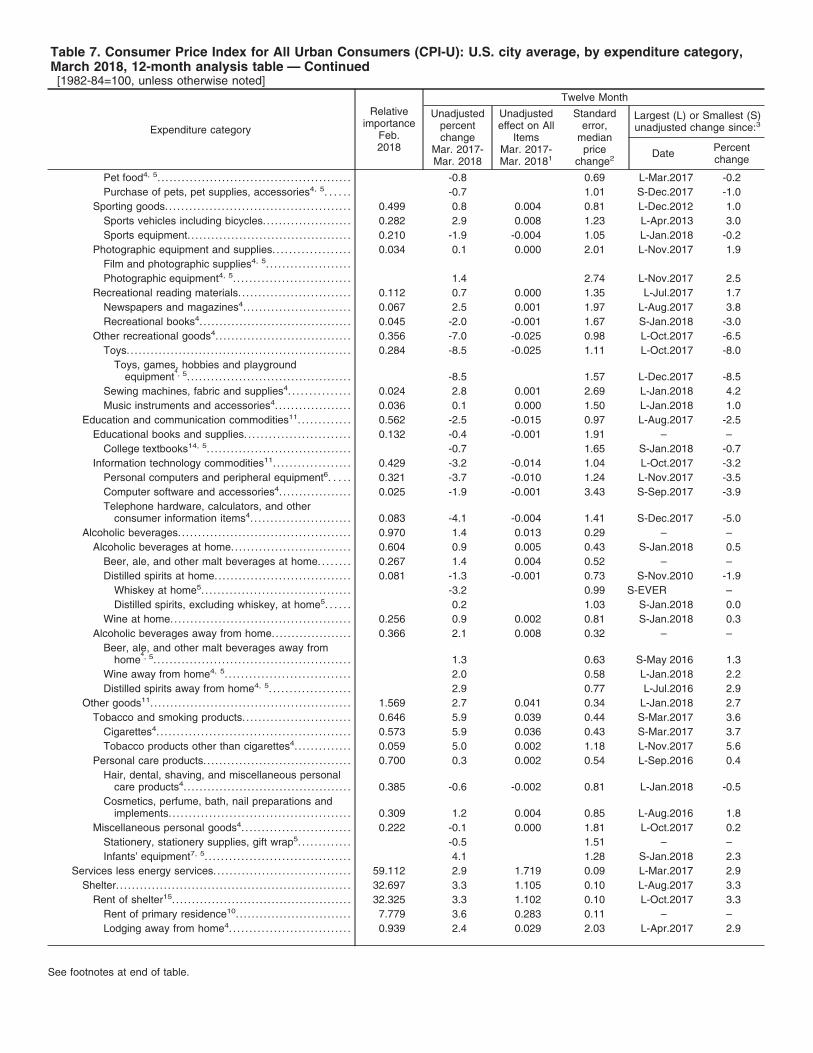
Table 7. Consumer Price Index for All Urban Consumers (CPI-U): U.S. city average, by expenditure category,March 2018, 12-month analysis table — Continued[1982-84=100, unless otherwise noted]
Expenditure category
Relativeimportance
Feb.2018
Twelve Month
Unadjustedpercentchange
Mar. 2017-Mar. 2018
Unadjustedeffect on All
ItemsMar. 2017-Mar. 20181
Standarderror,
medianprice
change2
Largest (L) or Smallest (S)unadjusted change since:3
Date Percentchange
Pet food4, 5. . . . . . . . . . . . . . . . . . . . . . . . . . . . . . . . . . . . . . . . . . . . . . . . -0.8 0.69 L-Mar.2017 -0.2Purchase of pets, pet supplies, accessories4, 5. . . . . . -0.7 1.01 S-Dec.2017 -1.0
Sporting goods. . . . . . . . . . . . . . . . . . . . . . . . . . . . . . . . . . . . . . . . . . . . . . 0.499 0.8 0.004 0.81 L-Dec.2012 1.0Sports vehicles including bicycles. . . . . . . . . . . . . . . . . . . . . . 0.282 2.9 0.008 1.23 L-Apr.2013 3.0Sports equipment. . . . . . . . . . . . . . . . . . . . . . . . . . . . . . . . . . . . . . . . . 0.210 -1.9 -0.004 1.05 L-Jan.2018 -0.2
Photographic equipment and supplies. . . . . . . . . . . . . . . . . . . 0.034 0.1 0.000 2.01 L-Nov.2017 1.9Film and photographic supplies4, 5. . . . . . . . . . . . . . . . . . . . .Photographic equipment4, 5. . . . . . . . . . . . . . . . . . . . . . . . . . . . . 1.4 2.74 L-Nov.2017 2.5
Recreational reading materials. . . . . . . . . . . . . . . . . . . . . . . . . . . . 0.112 0.7 0.000 1.35 L-Jul.2017 1.7Newspapers and magazines4. . . . . . . . . . . . . . . . . . . . . . . . . . . 0.067 2.5 0.001 1.97 L-Aug.2017 3.8Recreational books4. . . . . . . . . . . . . . . . . . . . . . . . . . . . . . . . . . . . . . 0.045 -2.0 -0.001 1.67 S-Jan.2018 -3.0
Other recreational goods4. . . . . . . . . . . . . . . . . . . . . . . . . . . . . . . . . . 0.356 -7.0 -0.025 0.98 L-Oct.2017 -6.5Toys.. . . . . . . . . . . . . . . . . . . . . . . . . . . . . . . . . . . . . . . . . . . . . . . . . . . . . . . 0.284 -8.5 -0.025 1.11 L-Oct.2017 -8.0
Toys, games, hobbies and playgroundequipment
4, 5. . . . . . . . . . . . . . . . . . . . . . . . . . . . . . . . . . . . . . . . . -8.5 1.57 L-Dec.2017 -8.5Sewing machines, fabric and supplies4. . . . . . . . . . . . . . . 0.024 2.8 0.001 2.69 L-Jan.2018 4.2Music instruments and accessories4. . . . . . . . . . . . . . . . . . . 0.036 0.1 0.000 1.50 L-Jan.2018 1.0
Education and communication commodities11. . . . . . . . . . . . . 0.562 -2.5 -0.015 0.97 L-Aug.2017 -2.5Educational books and supplies. . . . . . . . . . . . . . . . . . . . . . . . . . 0.132 -0.4 -0.001 1.91 – –
College textbooks14, 5. . . . . . . . . . . . . . . . . . . . . . . . . . . . . . . . . . . . -0.7 1.65 S-Jan.2018 -0.7Information technology commodities11. . . . . . . . . . . . . . . . . . . 0.429 -3.2 -0.014 1.04 L-Oct.2017 -3.2
Personal computers and peripheral equipment6. . . . . 0.321 -3.7 -0.010 1.24 L-Nov.2017 -3.5Computer software and accessories4. . . . . . . . . . . . . . . . . . 0.025 -1.9 -0.001 3.43 S-Sep.2017 -3.9Telephone hardware, calculators, and other
consumer information items4. . . . . . . . . . . . . . . . . . . . . . . . . 0.083 -4.1 -0.004 1.41 S-Dec.2017 -5.0Alcoholic beverages. . . . . . . . . . . . . . . . . . . . . . . . . . . . . . . . . . . . . . . . . . . 0.970 1.4 0.013 0.29 – –
Alcoholic beverages at home.. . . . . . . . . . . . . . . . . . . . . . . . . . . . . 0.604 0.9 0.005 0.43 S-Jan.2018 0.5Beer, ale, and other malt beverages at home. . . . . . . . 0.267 1.4 0.004 0.52 – –Distilled spirits at home.. . . . . . . . . . . . . . . . . . . . . . . . . . . . . . . . . 0.081 -1.3 -0.001 0.73 S-Nov.2010 -1.9
Whiskey at home5. . . . . . . . . . . . . . . . . . . . . . . . . . . . . . . . . . . . . -3.2 0.99 S-EVER –Distilled spirits, excluding whiskey, at home5. . . . . . 0.2 1.03 S-Jan.2018 0.0
Wine at home.. . . . . . . . . . . . . . . . . . . . . . . . . . . . . . . . . . . . . . . . . . . . 0.256 0.9 0.002 0.81 S-Jan.2018 0.3Alcoholic beverages away from home.. . . . . . . . . . . . . . . . . . . 0.366 2.1 0.008 0.32 – –
Beer, ale, and other malt beverages away fromhome
4, 5. . . . . . . . . . . . . . . . . . . . . . . . . . . . . . . . . . . . . . . . . . . . . . . . . 1.3 0.63 S-May 2016 1.3Wine away from home4, 5. . . . . . . . . . . . . . . . . . . . . . . . . . . . . . . 2.0 0.58 L-Jan.2018 2.2Distilled spirits away from home4, 5. . . . . . . . . . . . . . . . . . . . 2.9 0.77 L-Jul.2016 2.9
Other goods11. . . . . . . . . . . . . . . . . . . . . . . . . . . . . . . . . . . . . . . . . . . . . . . . . . 1.569 2.7 0.041 0.34 L-Jan.2018 2.7Tobacco and smoking products. . . . . . . . . . . . . . . . . . . . . . . . . . . 0.646 5.9 0.039 0.44 S-Mar.2017 3.6
Cigarettes4. . . . . . . . . . . . . . . . . . . . . . . . . . . . . . . . . . . . . . . . . . . . . . . . 0.573 5.9 0.036 0.43 S-Mar.2017 3.7Tobacco products other than cigarettes4. . . . . . . . . . . . . . 0.059 5.0 0.002 1.18 L-Nov.2017 5.6
Personal care products. . . . . . . . . . . . . . . . . . . . . . . . . . . . . . . . . . . . . 0.700 0.3 0.002 0.54 L-Sep.2016 0.4Hair, dental, shaving, and miscellaneous personal
care products4. . . . . . . . . . . . . . . . . . . . . . . . . . . . . . . . . . . . . . . . . . 0.385 -0.6 -0.002 0.81 L-Jan.2018 -0.5Cosmetics, perfume, bath, nail preparations and
implements. . . . . . . . . . . . . . . . . . . . . . . . . . . . . . . . . . . . . . . . . . . . . 0.309 1.2 0.004 0.85 L-Aug.2016 1.8Miscellaneous personal goods4. . . . . . . . . . . . . . . . . . . . . . . . . . . 0.222 -0.1 0.000 1.81 L-Oct.2017 0.2
Stationery, stationery supplies, gift wrap5. . . . . . . . . . . . . -0.5 1.51 – –Infants’ equipment7, 5. . . . . . . . . . . . . . . . . . . . . . . . . . . . . . . . . . . . 4.1 1.28 S-Jan.2018 2.3
Services less energy services. . . . . . . . . . . . . . . . . . . . . . . . . . . . . . . . . . 59.112 2.9 1.719 0.09 L-Mar.2017 2.9Shelter. . . . . . . . . . . . . . . . . . . . . . . . . . . . . . . . . . . . . . . . . . . . . . . . . . . . . . . . . . . 32.697 3.3 1.105 0.10 L-Aug.2017 3.3
Rent of shelter15. . . . . . . . . . . . . . . . . . . . . . . . . . . . . . . . . . . . . . . . . . . . . 32.325 3.3 1.102 0.10 L-Oct.2017 3.3Rent of primary residence10. . . . . . . . . . . . . . . . . . . . . . . . . . . . . 7.779 3.6 0.283 0.11 – –Lodging away from home4. . . . . . . . . . . . . . . . . . . . . . . . . . . . . . 0.939 2.4 0.029 2.03 L-Apr.2017 2.9
See footnotes at end of table.
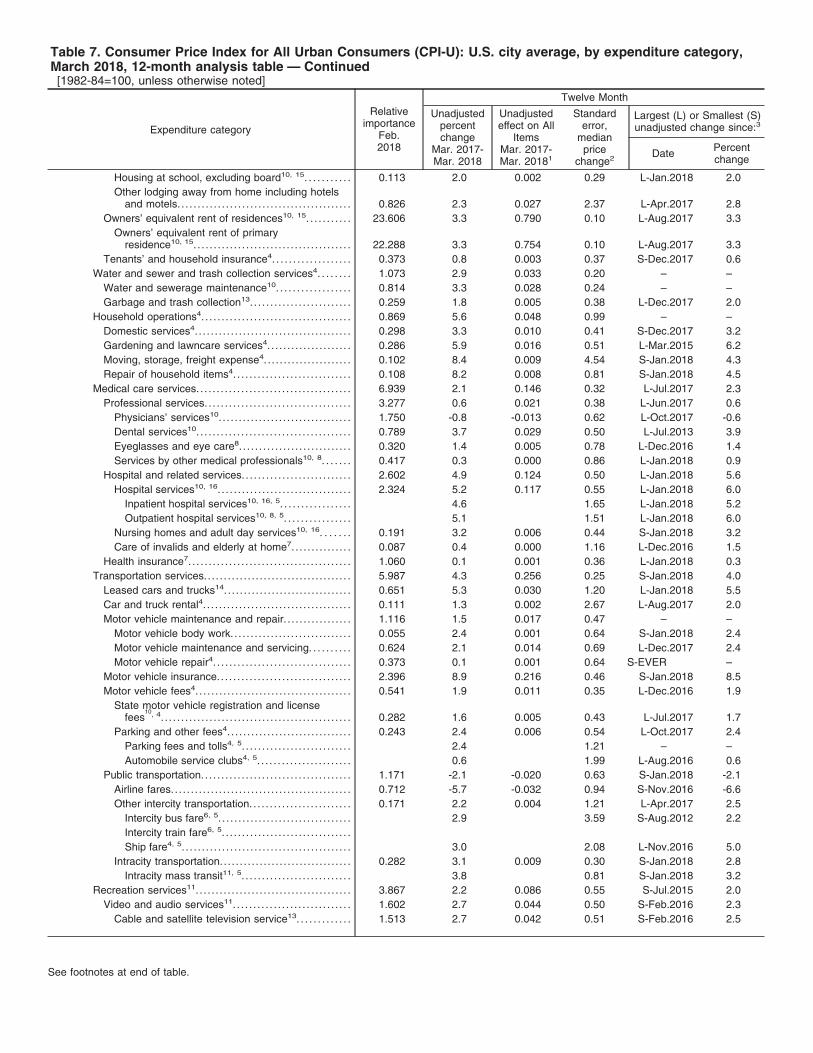
Table 7. Consumer Price Index for All Urban Consumers (CPI-U): U.S. city average, by expenditure category,March 2018, 12-month analysis table — Continued[1982-84=100, unless otherwise noted]
Expenditure category
Relativeimportance
Feb.2018
Twelve Month
Unadjustedpercentchange
Mar. 2017-Mar. 2018
Unadjustedeffect on All
ItemsMar. 2017-Mar. 20181
Standarderror,
medianprice
change2
Largest (L) or Smallest (S)unadjusted change since:3
Date Percentchange
Housing at school, excluding board10, 15. . . . . . . . . . . 0.113 2.0 0.002 0.29 L-Jan.2018 2.0Other lodging away from home including hotels
and motels. . . . . . . . . . . . . . . . . . . . . . . . . . . . . . . . . . . . . . . . . . . 0.826 2.3 0.027 2.37 L-Apr.2017 2.8Owners’ equivalent rent of residences10, 15. . . . . . . . . . . 23.606 3.3 0.790 0.10 L-Aug.2017 3.3
Owners’ equivalent rent of primaryresidence10, 15. . . . . . . . . . . . . . . . . . . . . . . . . . . . . . . . . . . . . . . 22.288 3.3 0.754 0.10 L-Aug.2017 3.3
Tenants’ and household insurance4. . . . . . . . . . . . . . . . . . . 0.373 0.8 0.003 0.37 S-Dec.2017 0.6Water and sewer and trash collection services4. . . . . . . . 1.073 2.9 0.033 0.20 – –
Water and sewerage maintenance10. . . . . . . . . . . . . . . . . . 0.814 3.3 0.028 0.24 – –Garbage and trash collection13. . . . . . . . . . . . . . . . . . . . . . . . . 0.259 1.8 0.005 0.38 L-Dec.2017 2.0
Household operations4. . . . . . . . . . . . . . . . . . . . . . . . . . . . . . . . . . . . . 0.869 5.6 0.048 0.99 – –Domestic services4. . . . . . . . . . . . . . . . . . . . . . . . . . . . . . . . . . . . . . . 0.298 3.3 0.010 0.41 S-Dec.2017 3.2Gardening and lawncare services4. . . . . . . . . . . . . . . . . . . . . 0.286 5.9 0.016 0.51 L-Mar.2015 6.2Moving, storage, freight expense4.. . . . . . . . . . . . . . . . . . . . . 0.102 8.4 0.009 4.54 S-Jan.2018 4.3Repair of household items4. . . . . . . . . . . . . . . . . . . . . . . . . . . . . 0.108 8.2 0.008 0.81 S-Jan.2018 4.5
Medical care services. . . . . . . . . . . . . . . . . . . . . . . . . . . . . . . . . . . . . . 6.939 2.1 0.146 0.32 L-Jul.2017 2.3Professional services. . . . . . . . . . . . . . . . . . . . . . . . . . . . . . . . . . . . 3.277 0.6 0.021 0.38 L-Jun.2017 0.6
Physicians’ services10. . . . . . . . . . . . . . . . . . . . . . . . . . . . . . . . . 1.750 -0.8 -0.013 0.62 L-Oct.2017 -0.6Dental services10. . . . . . . . . . . . . . . . . . . . . . . . . . . . . . . . . . . . . . 0.789 3.7 0.029 0.50 L-Jul.2013 3.9Eyeglasses and eye care8. . . . . . . . . . . . . . . . . . . . . . . . . . . . 0.320 1.4 0.005 0.78 L-Dec.2016 1.4Services by other medical professionals10, 8. . . . . . . 0.417 0.3 0.000 0.86 L-Jan.2018 0.9
Hospital and related services. . . . . . . . . . . . . . . . . . . . . . . . . . . 2.602 4.9 0.124 0.50 L-Jan.2018 5.6Hospital services10, 16. . . . . . . . . . . . . . . . . . . . . . . . . . . . . . . . . 2.324 5.2 0.117 0.55 L-Jan.2018 6.0
Inpatient hospital services10, 16, 5. . . . . . . . . . . . . . . . . 4.6 1.65 L-Jan.2018 5.2Outpatient hospital services10, 8, 5. . . . . . . . . . . . . . . . 5.1 1.51 L-Jan.2018 6.0
Nursing homes and adult day services10, 16. . . . . . . 0.191 3.2 0.006 0.44 S-Jan.2018 3.2Care of invalids and elderly at home7.. . . . . . . . . . . . . . 0.087 0.4 0.000 1.16 L-Dec.2016 1.5
Health insurance7. . . . . . . . . . . . . . . . . . . . . . . . . . . . . . . . . . . . . . . . 1.060 0.1 0.001 0.36 L-Jan.2018 0.3Transportation services.. . . . . . . . . . . . . . . . . . . . . . . . . . . . . . . . . . . . 5.987 4.3 0.256 0.25 S-Jan.2018 4.0
Leased cars and trucks14. . . . . . . . . . . . . . . . . . . . . . . . . . . . . . . . 0.651 5.3 0.030 1.20 L-Jan.2018 5.5Car and truck rental4. . . . . . . . . . . . . . . . . . . . . . . . . . . . . . . . . . . . . 0.111 1.3 0.002 2.67 L-Aug.2017 2.0Motor vehicle maintenance and repair. . . . . . . . . . . . . . . . . 1.116 1.5 0.017 0.47 – –
Motor vehicle body work. . . . . . . . . . . . . . . . . . . . . . . . . . . . . . 0.055 2.4 0.001 0.64 S-Jan.2018 2.4Motor vehicle maintenance and servicing. . . . . . . . . . 0.624 2.1 0.014 0.69 L-Dec.2017 2.4Motor vehicle repair4. . . . . . . . . . . . . . . . . . . . . . . . . . . . . . . . . . 0.373 0.1 0.001 0.64 S-EVER –
Motor vehicle insurance. . . . . . . . . . . . . . . . . . . . . . . . . . . . . . . . . 2.396 8.9 0.216 0.46 S-Jan.2018 8.5Motor vehicle fees4. . . . . . . . . . . . . . . . . . . . . . . . . . . . . . . . . . . . . . . 0.541 1.9 0.011 0.35 L-Dec.2016 1.9
State motor vehicle registration and licensefees
10, 4. . . . . . . . . . . . . . . . . . . . . . . . . . . . . . . . . . . . . . . . . . . . . . . 0.282 1.6 0.005 0.43 L-Jul.2017 1.7Parking and other fees4. . . . . . . . . . . . . . . . . . . . . . . . . . . . . . . 0.243 2.4 0.006 0.54 L-Oct.2017 2.4
Parking fees and tolls4, 5. . . . . . . . . . . . . . . . . . . . . . . . . . . 2.4 1.21 – –Automobile service clubs4, 5. . . . . . . . . . . . . . . . . . . . . . . 0.6 1.99 L-Aug.2016 0.6
Public transportation. . . . . . . . . . . . . . . . . . . . . . . . . . . . . . . . . . . . . 1.171 -2.1 -0.020 0.63 S-Jan.2018 -2.1Airline fares. . . . . . . . . . . . . . . . . . . . . . . . . . . . . . . . . . . . . . . . . . . . . 0.712 -5.7 -0.032 0.94 S-Nov.2016 -6.6Other intercity transportation. . . . . . . . . . . . . . . . . . . . . . . . . 0.171 2.2 0.004 1.21 L-Apr.2017 2.5
Intercity bus fare6, 5. . . . . . . . . . . . . . . . . . . . . . . . . . . . . . . . . 2.9 3.59 S-Aug.2012 2.2Intercity train fare6, 5. . . . . . . . . . . . . . . . . . . . . . . . . . . . . . . .Ship fare4, 5. . . . . . . . . . . . . . . . . . . . . . . . . . . . . . . . . . . . . . . . . . 3.0 2.08 L-Nov.2016 5.0
Intracity transportation.. . . . . . . . . . . . . . . . . . . . . . . . . . . . . . . . 0.282 3.1 0.009 0.30 S-Jan.2018 2.8Intracity mass transit11, 5. . . . . . . . . . . . . . . . . . . . . . . . . . . 3.8 0.81 S-Jan.2018 3.2
Recreation services11. . . . . . . . . . . . . . . . . . . . . . . . . . . . . . . . . . . . . . . 3.867 2.2 0.086 0.55 S-Jul.2015 2.0Video and audio services11. . . . . . . . . . . . . . . . . . . . . . . . . . . . . 1.602 2.7 0.044 0.50 S-Feb.2016 2.3
Cable and satellite television service13. . . . . . . . . . . . . 1.513 2.7 0.042 0.51 S-Feb.2016 2.5
See footnotes at end of table.
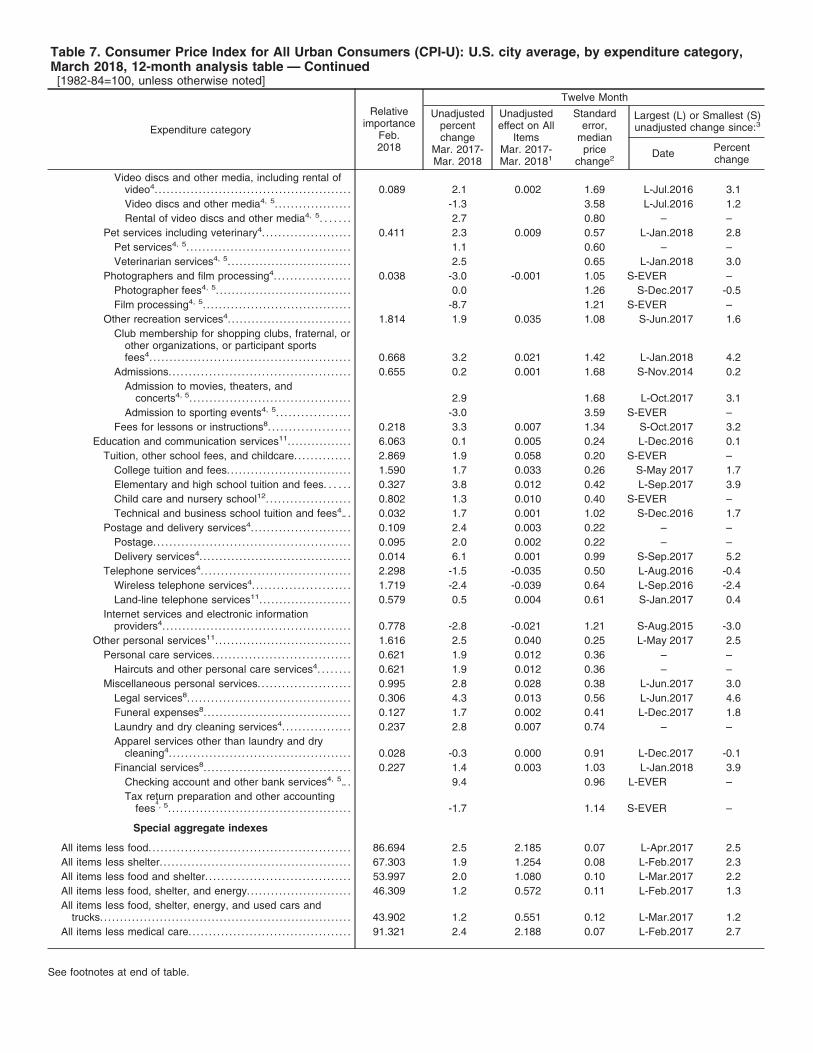
Table 7. Consumer Price Index for All Urban Consumers (CPI-U): U.S. city average, by expenditure category,March 2018, 12-month analysis table — Continued[1982-84=100, unless otherwise noted]
Expenditure category
Relativeimportance
Feb.2018
Twelve Month
Unadjustedpercentchange
Mar. 2017-Mar. 2018
Unadjustedeffect on All
ItemsMar. 2017-Mar. 20181
Standarderror,
medianprice
change2
Largest (L) or Smallest (S)unadjusted change since:3
Date Percentchange
Video discs and other media, including rental ofvideo4. . . . . . . . . . . . . . . . . . . . . . . . . . . . . . . . . . . . . . . . . . . . . . . . . 0.089 2.1 0.002 1.69 L-Jul.2016 3.1Video discs and other media4, 5. . . . . . . . . . . . . . . . . . . -1.3 3.58 L-Jul.2016 1.2Rental of video discs and other media4, 5. . . . . . . 2.7 0.80 – –
Pet services including veterinary4. . . . . . . . . . . . . . . . . . . . . . 0.411 2.3 0.009 0.57 L-Jan.2018 2.8Pet services4, 5. . . . . . . . . . . . . . . . . . . . . . . . . . . . . . . . . . . . . . . . . 1.1 0.60 – –Veterinarian services4, 5. . . . . . . . . . . . . . . . . . . . . . . . . . . . . . . 2.5 0.65 L-Jan.2018 3.0
Photographers and film processing4. . . . . . . . . . . . . . . . . . . 0.038 -3.0 -0.001 1.05 S-EVER –Photographer fees4, 5. . . . . . . . . . . . . . . . . . . . . . . . . . . . . . . . . . 0.0 1.26 S-Dec.2017 -0.5Film processing4, 5. . . . . . . . . . . . . . . . . . . . . . . . . . . . . . . . . . . . . -8.7 1.21 S-EVER –
Other recreation services4. . . . . . . . . . . . . . . . . . . . . . . . . . . . . . . 1.814 1.9 0.035 1.08 S-Jun.2017 1.6Club membership for shopping clubs, fraternal, or
other organizations, or participant sportsfees4. . . . . . . . . . . . . . . . . . . . . . . . . . . . . . . . . . . . . . . . . . . . . . . . . . 0.668 3.2 0.021 1.42 L-Jan.2018 4.2
Admissions. . . . . . . . . . . . . . . . . . . . . . . . . . . . . . . . . . . . . . . . . . . . . 0.655 0.2 0.001 1.68 S-Nov.2014 0.2Admission to movies, theaters, and
concerts4, 5. . . . . . . . . . . . . . . . . . . . . . . . . . . . . . . . . . . . . . . . 2.9 1.68 L-Oct.2017 3.1Admission to sporting events4, 5. . . . . . . . . . . . . . . . . . -3.0 3.59 S-EVER –
Fees for lessons or instructions8. . . . . . . . . . . . . . . . . . . . 0.218 3.3 0.007 1.34 S-Oct.2017 3.2Education and communication services11. . . . . . . . . . . . . . . . 6.063 0.1 0.005 0.24 L-Dec.2016 0.1
Tuition, other school fees, and childcare. . . . . . . . . . . . . . 2.869 1.9 0.058 0.20 S-EVER –College tuition and fees.. . . . . . . . . . . . . . . . . . . . . . . . . . . . . . 1.590 1.7 0.033 0.26 S-May 2017 1.7Elementary and high school tuition and fees. . . . . . 0.327 3.8 0.012 0.42 L-Sep.2017 3.9Child care and nursery school12. . . . . . . . . . . . . . . . . . . . . 0.802 1.3 0.010 0.40 S-EVER –Technical and business school tuition and fees4.. . 0.032 1.7 0.001 1.02 S-Dec.2016 1.7
Postage and delivery services4. . . . . . . . . . . . . . . . . . . . . . . . . 0.109 2.4 0.003 0.22 – –Postage. . . . . . . . . . . . . . . . . . . . . . . . . . . . . . . . . . . . . . . . . . . . . . . . . 0.095 2.0 0.002 0.22 – –Delivery services4. . . . . . . . . . . . . . . . . . . . . . . . . . . . . . . . . . . . . . 0.014 6.1 0.001 0.99 S-Sep.2017 5.2
Telephone services4. . . . . . . . . . . . . . . . . . . . . . . . . . . . . . . . . . . . . 2.298 -1.5 -0.035 0.50 L-Aug.2016 -0.4Wireless telephone services4. . . . . . . . . . . . . . . . . . . . . . . . 1.719 -2.4 -0.039 0.64 L-Sep.2016 -2.4Land-line telephone services11. . . . . . . . . . . . . . . . . . . . . . . 0.579 0.5 0.004 0.61 S-Jan.2017 0.4
Internet services and electronic informationproviders4. . . . . . . . . . . . . . . . . . . . . . . . . . . . . . . . . . . . . . . . . . . . . . . 0.778 -2.8 -0.021 1.21 S-Aug.2015 -3.0
Other personal services11. . . . . . . . . . . . . . . . . . . . . . . . . . . . . . . . . . 1.616 2.5 0.040 0.25 L-May 2017 2.5Personal care services. . . . . . . . . . . . . . . . . . . . . . . . . . . . . . . . . . 0.621 1.9 0.012 0.36 – –
Haircuts and other personal care services4. . . . . . . . 0.621 1.9 0.012 0.36 – –Miscellaneous personal services. . . . . . . . . . . . . . . . . . . . . . . 0.995 2.8 0.028 0.38 L-Jun.2017 3.0
Legal services8. . . . . . . . . . . . . . . . . . . . . . . . . . . . . . . . . . . . . . . . . 0.306 4.3 0.013 0.56 L-Jun.2017 4.6Funeral expenses8. . . . . . . . . . . . . . . . . . . . . . . . . . . . . . . . . . . . . 0.127 1.7 0.002 0.41 L-Dec.2017 1.8Laundry and dry cleaning services4. . . . . . . . . . . . . . . . . 0.237 2.8 0.007 0.74 – –Apparel services other than laundry and dry
cleaning4. . . . . . . . . . . . . . . . . . . . . . . . . . . . . . . . . . . . . . . . . . . . . 0.028 -0.3 0.000 0.91 L-Dec.2017 -0.1Financial services8. . . . . . . . . . . . . . . . . . . . . . . . . . . . . . . . . . . . . 0.227 1.4 0.003 1.03 L-Jan.2018 3.9
Checking account and other bank services4, 5.. . 9.4 0.96 L-EVER –Tax return preparation and other accounting
fees4, 5. . . . . . . . . . . . . . . . . . . . . . . . . . . . . . . . . . . . . . . . . . . . . . -1.7 1.14 S-EVER –
Special aggregate indexes
All items less food. . . . . . . . . . . . . . . . . . . . . . . . . . . . . . . . . . . . . . . . . . . . . . . . . . 86.694 2.5 2.185 0.07 L-Apr.2017 2.5All items less shelter. . . . . . . . . . . . . . . . . . . . . . . . . . . . . . . . . . . . . . . . . . . . . . . . 67.303 1.9 1.254 0.08 L-Feb.2017 2.3All items less food and shelter. . . . . . . . . . . . . . . . . . . . . . . . . . . . . . . . . . . . 53.997 2.0 1.080 0.10 L-Mar.2017 2.2All items less food, shelter, and energy. . . . . . . . . . . . . . . . . . . . . . . . . . 46.309 1.2 0.572 0.11 L-Feb.2017 1.3All items less food, shelter, energy, and used cars and
trucks.. . . . . . . . . . . . . . . . . . . . . . . . . . . . . . . . . . . . . . . . . . . . . . . . . . . . . . . . . . . . . . 43.902 1.2 0.551 0.12 L-Mar.2017 1.2All items less medical care. . . . . . . . . . . . . . . . . . . . . . . . . . . . . . . . . . . . . . . . 91.321 2.4 2.188 0.07 L-Feb.2017 2.7
See footnotes at end of table.
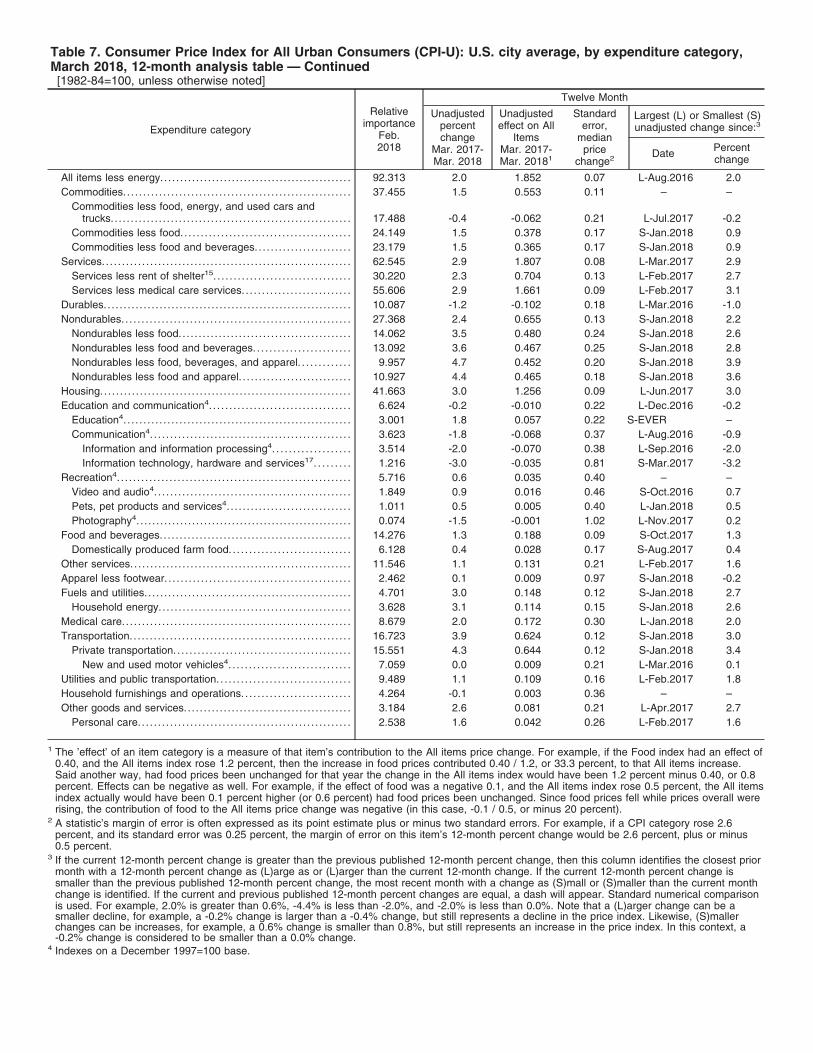
Table 7. Consumer Price Index for All Urban Consumers (CPI-U): U.S. city average, by expenditure category,March 2018, 12-month analysis table — Continued[1982-84=100, unless otherwise noted]
Expenditure category
Relativeimportance
Feb.2018
Twelve Month
Unadjustedpercentchange
Mar. 2017-Mar. 2018
Unadjustedeffect on All
ItemsMar. 2017-Mar. 20181
Standarderror,
medianprice
change2
Largest (L) or Smallest (S)unadjusted change since:3
Date Percentchange
All items less energy.. . . . . . . . . . . . . . . . . . . . . . . . . . . . . . . . . . . . . . . . . . . . . . . 92.313 2.0 1.852 0.07 L-Aug.2016 2.0Commodities. . . . . . . . . . . . . . . . . . . . . . . . . . . . . . . . . . . . . . . . . . . . . . . . . . . . . . . . . 37.455 1.5 0.553 0.11 – –
Commodities less food, energy, and used cars andtrucks. . . . . . . . . . . . . . . . . . . . . . . . . . . . . . . . . . . . . . . . . . . . . . . . . . . . . . . . . . . . 17.488 -0.4 -0.062 0.21 L-Jul.2017 -0.2
Commodities less food. . . . . . . . . . . . . . . . . . . . . . . . . . . . . . . . . . . . . . . . . . 24.149 1.5 0.378 0.17 S-Jan.2018 0.9Commodities less food and beverages. . . . . . . . . . . . . . . . . . . . . . . . 23.179 1.5 0.365 0.17 S-Jan.2018 0.9
Services. . . . . . . . . . . . . . . . . . . . . . . . . . . . . . . . . . . . . . . . . . . . . . . . . . . . . . . . . . . . . . 62.545 2.9 1.807 0.08 L-Mar.2017 2.9Services less rent of shelter15. . . . . . . . . . . . . . . . . . . . . . . . . . . . . . . . . . 30.220 2.3 0.704 0.13 L-Feb.2017 2.7Services less medical care services. . . . . . . . . . . . . . . . . . . . . . . . . . . 55.606 2.9 1.661 0.09 L-Feb.2017 3.1
Durables.. . . . . . . . . . . . . . . . . . . . . . . . . . . . . . . . . . . . . . . . . . . . . . . . . . . . . . . . . . . . . 10.087 -1.2 -0.102 0.18 L-Mar.2016 -1.0Nondurables. . . . . . . . . . . . . . . . . . . . . . . . . . . . . . . . . . . . . . . . . . . . . . . . . . . . . . . . . 27.368 2.4 0.655 0.13 S-Jan.2018 2.2
Nondurables less food.. . . . . . . . . . . . . . . . . . . . . . . . . . . . . . . . . . . . . . . . . . 14.062 3.5 0.480 0.24 S-Jan.2018 2.6Nondurables less food and beverages. . . . . . . . . . . . . . . . . . . . . . . . 13.092 3.6 0.467 0.25 S-Jan.2018 2.8Nondurables less food, beverages, and apparel. . . . . . . . . . . . . 9.957 4.7 0.452 0.20 S-Jan.2018 3.9Nondurables less food and apparel. . . . . . . . . . . . . . . . . . . . . . . . . . . . 10.927 4.4 0.465 0.18 S-Jan.2018 3.6
Housing.. . . . . . . . . . . . . . . . . . . . . . . . . . . . . . . . . . . . . . . . . . . . . . . . . . . . . . . . . . . . . . 41.663 3.0 1.256 0.09 L-Jun.2017 3.0Education and communication4. . . . . . . . . . . . . . . . . . . . . . . . . . . . . . . . . . . 6.624 -0.2 -0.010 0.22 L-Dec.2016 -0.2
Education4. . . . . . . . . . . . . . . . . . . . . . . . . . . . . . . . . . . . . . . . . . . . . . . . . . . . . . . . . 3.001 1.8 0.057 0.22 S-EVER –Communication4. . . . . . . . . . . . . . . . . . . . . . . . . . . . . . . . . . . . . . . . . . . . . . . . . . 3.623 -1.8 -0.068 0.37 L-Aug.2016 -0.9
Information and information processing4. . . . . . . . . . . . . . . . . . . 3.514 -2.0 -0.070 0.38 L-Sep.2016 -2.0Information technology, hardware and services17. . . . . . . . . 1.216 -3.0 -0.035 0.81 S-Mar.2017 -3.2
Recreation4. . . . . . . . . . . . . . . . . . . . . . . . . . . . . . . . . . . . . . . . . . . . . . . . . . . . . . . . . . 5.716 0.6 0.035 0.40 – –Video and audio4. . . . . . . . . . . . . . . . . . . . . . . . . . . . . . . . . . . . . . . . . . . . . . . . . 1.849 0.9 0.016 0.46 S-Oct.2016 0.7Pets, pet products and services4. . . . . . . . . . . . . . . . . . . . . . . . . . . . . . . 1.011 0.5 0.005 0.40 L-Jan.2018 0.5Photography4.. . . . . . . . . . . . . . . . . . . . . . . . . . . . . . . . . . . . . . . . . . . . . . . . . . . . . 0.074 -1.5 -0.001 1.02 L-Nov.2017 0.2
Food and beverages.. . . . . . . . . . . . . . . . . . . . . . . . . . . . . . . . . . . . . . . . . . . . . . . 14.276 1.3 0.188 0.09 S-Oct.2017 1.3Domestically produced farm food. . . . . . . . . . . . . . . . . . . . . . . . . . . . . . 6.128 0.4 0.028 0.17 S-Aug.2017 0.4
Other services. . . . . . . . . . . . . . . . . . . . . . . . . . . . . . . . . . . . . . . . . . . . . . . . . . . . . . . 11.546 1.1 0.131 0.21 L-Feb.2017 1.6Apparel less footwear. . . . . . . . . . . . . . . . . . . . . . . . . . . . . . . . . . . . . . . . . . . . . . 2.462 0.1 0.009 0.97 S-Jan.2018 -0.2Fuels and utilities. . . . . . . . . . . . . . . . . . . . . . . . . . . . . . . . . . . . . . . . . . . . . . . . . . . . 4.701 3.0 0.148 0.12 S-Jan.2018 2.7
Household energy. . . . . . . . . . . . . . . . . . . . . . . . . . . . . . . . . . . . . . . . . . . . . . . . 3.628 3.1 0.114 0.15 S-Jan.2018 2.6Medical care. . . . . . . . . . . . . . . . . . . . . . . . . . . . . . . . . . . . . . . . . . . . . . . . . . . . . . . . . 8.679 2.0 0.172 0.30 L-Jan.2018 2.0Transportation. . . . . . . . . . . . . . . . . . . . . . . . . . . . . . . . . . . . . . . . . . . . . . . . . . . . . . . 16.723 3.9 0.624 0.12 S-Jan.2018 3.0
Private transportation. . . . . . . . . . . . . . . . . . . . . . . . . . . . . . . . . . . . . . . . . . . . 15.551 4.3 0.644 0.12 S-Jan.2018 3.4New and used motor vehicles4. . . . . . . . . . . . . . . . . . . . . . . . . . . . . . 7.059 0.0 0.009 0.21 L-Mar.2016 0.1
Utilities and public transportation. . . . . . . . . . . . . . . . . . . . . . . . . . . . . . . . . 9.489 1.1 0.109 0.16 L-Feb.2017 1.8Household furnishings and operations. . . . . . . . . . . . . . . . . . . . . . . . . . . 4.264 -0.1 0.003 0.36 – –Other goods and services.. . . . . . . . . . . . . . . . . . . . . . . . . . . . . . . . . . . . . . . . . 3.184 2.6 0.081 0.21 L-Apr.2017 2.7
Personal care. . . . . . . . . . . . . . . . . . . . . . . . . . . . . . . . . . . . . . . . . . . . . . . . . . . . . 2.538 1.6 0.042 0.26 L-Feb.2017 1.6
1 The ’effect’ of an item category is a measure of that item’s contribution to the All items price change. For example, if the Food index had an effect of0.40, and the All items index rose 1.2 percent, then the increase in food prices contributed 0.40 / 1.2, or 33.3 percent, to that All items increase.Said another way, had food prices been unchanged for that year the change in the All items index would have been 1.2 percent minus 0.40, or 0.8percent. Effects can be negative as well. For example, if the effect of food was a negative 0.1, and the All items index rose 0.5 percent, the All itemsindex actually would have been 0.1 percent higher (or 0.6 percent) had food prices been unchanged. Since food prices fell while prices overall wererising, the contribution of food to the All items price change was negative (in this case, -0.1 / 0.5, or minus 20 percent).
2 A statistic’s margin of error is often expressed as its point estimate plus or minus two standard errors. For example, if a CPI category rose 2.6percent, and its standard error was 0.25 percent, the margin of error on this item’s 12-month percent change would be 2.6 percent, plus or minus0.5 percent.
3 If the current 12-month percent change is greater than the previous published 12-month percent change, then this column identifies the closest priormonth with a 12-month percent change as (L)arge as or (L)arger than the current 12-month change. If the current 12-month percent change issmaller than the previous published 12-month percent change, the most recent month with a change as (S)mall or (S)maller than the current monthchange is identified. If the current and previous published 12-month percent changes are equal, a dash will appear. Standard numerical comparisonis used. For example, 2.0% is greater than 0.6%, -4.4% is less than -2.0%, and -2.0% is less than 0.0%. Note that a (L)arger change can be asmaller decline, for example, a -0.2% change is larger than a -0.4% change, but still represents a decline in the price index. Likewise, (S)mallerchanges can be increases, for example, a 0.6% change is smaller than 0.8%, but still represents an increase in the price index. In this context, a-0.2% change is considered to be smaller than a 0.0% change.
4 Indexes on a December 1997=100 base.
5 Special indexes based on a substantially smaller sample. These series do not contribute to the all items index aggregation and therefore do nothave a relative importance or effect.
6 Indexes on a December 2007=100 base.7 Indexes on a December 2005=100 base.8 Indexes on a December 1986=100 base.9 Indexes on a December 1993=100 base.10 This index series was calculated using a Laspeyres estimator. All other item stratum index series were calculated using a geometric means
estimator.11 Indexes on a December 2009=100 base.12 Indexes on a December 1990=100 base.13 Indexes on a December 1983=100 base.14 Indexes on a December 2001=100 base.15 Indexes on a December 1982=100 base.16 Indexes on a December 1996=100 base.17 Indexes on a December 1988=100 base.NOTE: Index applies to a month as a whole, not to any specific date.