Consumer Experiences in Branchless Banking - bi.go.id · Users of branchless banking services...
42
Consumer Experiences in Branchless Banking This report was commissioned by the Department for International Development Bankable Frontier Associates LLC www.bankablefrontier.com Draft date: 31 August 2010
Transcript of Consumer Experiences in Branchless Banking - bi.go.id · Users of branchless banking services...
Consumer Experiences in Branchless Banking
This report was commissioned by the Department for International Development
Bankable Frontier Associates LLC www.bankablefrontier.com Draft date: 31 August 2010
2
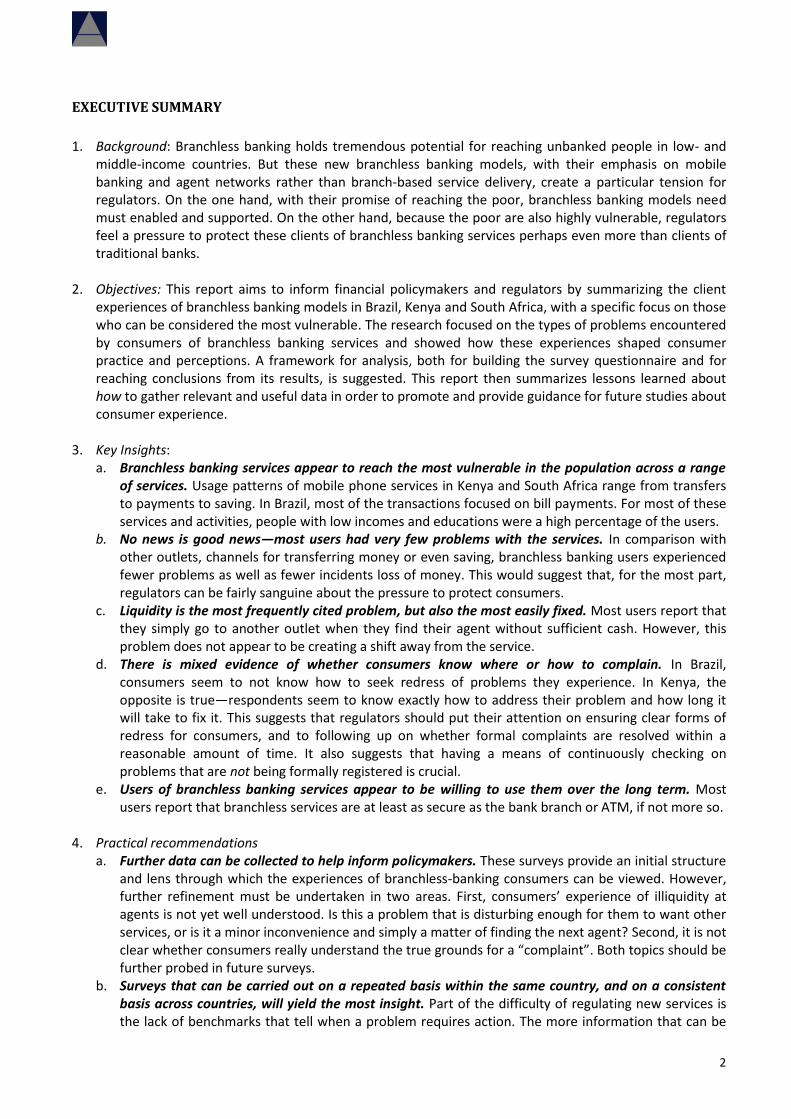
EXECUTIVE SUMMARY
1. Background: Branchless banking holds tremendous potential for reaching unbanked people in low- and
middle-income countries. But these new branchless banking models, with their emphasis on mobile banking and agent networks rather than branch-based service delivery, create a particular tension for regulators. On the one hand, with their promise of reaching the poor, branchless banking models need must enabled and supported. On the other hand, because the poor are also highly vulnerable, regulators feel a pressure to protect these clients of branchless banking services perhaps even more than clients of traditional banks.
2. Objectives: This report aims to inform financial policymakers and regulators by summarizing the client
experiences of branchless banking models in Brazil, Kenya and South Africa, with a specific focus on those who can be considered the most vulnerable. The research focused on the types of problems encountered by consumers of branchless banking services and showed how these experiences shaped consumer practice and perceptions. A framework for analysis, both for building the survey questionnaire and for reaching conclusions from its results, is suggested. This report then summarizes lessons learned about how to gather relevant and useful data in order to promote and provide guidance for future studies about consumer experience.
3. Key Insights:
a. Branchless banking services appear to reach the most vulnerable in the population across a range of services. Usage patterns of mobile phone services in Kenya and South Africa range from transfers to payments to saving. In Brazil, most of the transactions focused on bill payments. For most of these services and activities, people with low incomes and educations were a high percentage of the users.
b. No news is good news—most users had very few problems with the services. In comparison with other outlets, channels for transferring money or even saving, branchless banking users experienced fewer problems as well as fewer incidents loss of money. This would suggest that, for the most part, regulators can be fairly sanguine about the pressure to protect consumers.
c. Liquidity is the most frequently cited problem, but also the most easily fixed. Most users report that they simply go to another outlet when they find their agent without sufficient cash. However, this problem does not appear to be creating a shift away from the service.
d. There is mixed evidence of whether consumers know where or how to complain. In Brazil, consumers seem to not know how to seek redress of problems they experience. In Kenya, the opposite is true—respondents seem to know exactly how to address their problem and how long it will take to fix it. This suggests that regulators should put their attention on ensuring clear forms of redress for consumers, and to following up on whether formal complaints are resolved within a reasonable amount of time. It also suggests that having a means of continuously checking on problems that are not being formally registered is crucial.
e. Users of branchless banking services appear to be willing to use them over the long term. Most users report that branchless services are at least as secure as the bank branch or ATM, if not more so.
4. Practical recommendations a. Further data can be collected to help inform policymakers. These surveys provide an initial structure
and lens through which the experiences of branchless-banking consumers can be viewed. However, further refinement must be undertaken in two areas. First, consumers’ experience of illiquidity at agents is not yet well understood. Is this a problem that is disturbing enough for them to want other services, or is it a minor inconvenience and simply a matter of finding the next agent? Second, it is not clear whether consumers really understand the true grounds for a “complaint”. Both topics should be further probed in future surveys.
b. Surveys that can be carried out on a repeated basis within the same country, and on a consistent basis across countries, will yield the most insight. Part of the difficulty of regulating new services is the lack of benchmarks that tell when a problem requires action. The more information that can be
3
built up from experiences across time and across environments, the more information regulators have with which to manage this nascent sector in a supportive yet protective manner.
4
ACKNOWLEDGEMENTS
Our thanks are due to Kerry Nelson at the Department for International Development, who supported this work and provided much appreciated guidance; to Kate McKee, Michael Terazi, Denise Diaz and Yanina Seltzer of CGAP, who helped structure the content and commented on versions of questionnaires; to Mark Pickens who graciously allowed us to include our questions in a larger Wizzit survey; and to participants at the Windsor Global Leadership Seminar on Regulating Branchless Banking, Third Annual Seminar on March 8-10, 2010, at which this paper was first presented. All errors are our own.
Daryl Collins, Niketa Kulkarni and Shana Gavron
Somerville MA USA
31 August 2010
5
TABLE OF CONTENTS
EXECUTIVE SUMMARY ....................................................................................................................................................................... 2
1. INTRODUCTION ............................................................................................................................................................................... 7
2. METHODOLOGY ............................................................................................................................................................................... 7
2.1 SOURCING APPROPRIATE DATA ............................................................................................................................................. 7 2.2 FOCUSING ON VULNERABLE POPULATIONS .............................................................................................................................. 8
Table 1: Sample descriptions in each country ............................................................................................................................... 8 2.3 USING AN APPROPRIATE FRAMEWORK TO BUILD THE QUESTIONNAIRE .......................................................................................... 8
Figure 1: Framework of analysis .................................................................................................................................................... 9
3. DATA ANALYSIS ............................................................................................................................................................................... 9
3.1 BRAZIL—CORRESPONDENCE AGENTS .................................................................................................................................... 9 3.1.1 DATA ANALYSIS ............................................................................................................................................................ 10
Level 1: Who uses the outlet and for what purpose? ................................................................................................... 10 Chart 1: Outlets used for different activities ............................................................................................................................... 10 Chart 2: Who uses* different outlets? ........................................................................................................................................ 10
Level 2: Problems experienced ..................................................................................................................................... 11 Chart 3: “The last time you were charged more than the bank or agent was supposed to charge you for the transaction, what type of outlet was it?” ................................................................................................................................................................. 11 Chart 4: “The last time you were robbed at the outlet, what type of outlet was it?“ ................................................................ 12 Chart 5: Made a mistake and paid the wrong bill/sent to wrong account .................................................................................. 12 Chart 6: Payment you made was never received ........................................................................................................................ 13 Chart 7: Money someone sent to you was never received ......................................................................................................... 13 Chart 8: Money you deposited was never accounted for in your account.................................................................................. 14 Chart 9: “The last time you found that there was no cash when you went to withdraw, what type of outlet was it and what did you do about it?” .................................................................................................................................................................. 14
Level 3: Immediate reaction ......................................................................................................................................... 15 Chart 10: Respondent did not complain* because did not know what to do/did not think it would do any good .................... 15
Level 4: Long-term reaction ......................................................................................................................................... 15 Chart 11: Respondent stopped using the outlet or only kept using because did not think had option ...................................... 15
3.1.2 ADDITIONAL INFORMATION ............................................................................................................................................ 16 3.2 KENYA—M-PESA ........................................................................................................................................................... 16
Level 1: Who uses the outlet and for what purpose? ................................................................................................... 16 Chart 12: Use of M-Pesa services ................................................................................................................................................ 17
Level 2: Problems experienced ..................................................................................................................................... 17 Chart 13: “How much does it cost to send 1,000 KSh to a registered user?” ............................................................................. 17 Chart 14: “How much does it cost to withdraw 1,000 KSh sent to you by a registered user?” .................................................. 18 Chart 15: Methods of sending remittances ................................................................................................................................. 18 Chart 16: Methods of receiving remittances ............................................................................................................................... 19 Chart 17: Methods of savings ...................................................................................................................................................... 19
Level 4: Long term reaction ......................................................................................................................................... 19 Chart 18: The majority of vulnerable and non-vulnerable respondents alike feel that their money is or would be safe with M-PESA ............................................................................................................................................................................................ 20
3.3. SOUTH AFRICA—WIZZIT .................................................................................................................................................. 20 3.1.1 DATA ANALYSIS ............................................................................................................................................................ 20
Level 1: Who uses the outlet and for what purpose? ................................................................................................... 20 Chart 19: Outlets used for different activities ............................................................................................................................. 21 Chart 20: “What do you predominantly use your Wizzit account for?” ...................................................................................... 21 Chart 21: “Which of the following savings accounts do you have?” .......................................................................................... 22
Level 2: Problems experienced ..................................................................................................................................... 22 Chart 22: Transaction security ranking ........................................................................................................................................ 22 Chart 23: Do you believe the following statements to be true or false? ..................................................................................... 23 Chart 24: Payment was never received ....................................................................................................................................... 23 Chart 25: Someone was sent money but it was never received ................................................................................................. 24 Chart 26: Paid the wrong bill ....................................................................................................................................................... 24 Chart 27: Money never accounted for ........................................................................................................................................ 25
6
Chart 28: No cash to withdraw .................................................................................................................................................... 25 Chart 29: Service was not available ............................................................................................................................................. 26 Chart 30: Transaction never completed due to a technical reason ............................................................................................. 26
Level 3: Immediate reaction ......................................................................................................................................... 26 Chart 31: “What did you do when you experienced the mentioned problem the most recent time?” ..................................... 27 Chart 32: “How long did it take to resolve the mentioned problem the most recent time?” .................................................... 27
Level 4: Long-term reaction ......................................................................................................................................... 27 Chart 33: “Did you stop using the outlet altogether after experiencing the mentioned problem the most recent time?” ....... 28 Chart 34: “Did you stop using the outlet altogether after experiencing the mentioned problem the most recent time?” ....... 28
4. GATHERING MORE DATA: CREATING AN EFFECTIVE SURVEY OF CONSUMER EXPERIENCE ............................29
5. CONCLUSIONS .................................................................................................................................................................................29
ANNEX A: SECTION OF BRAZIL SURVEY .....................................................................................................................................30
ANNEX B: SECTION OF SOUTH AFRICA WIZZIT SURVEY .....................................................................................................36
7
1. INTRODUCTION
Across the globe, regulators, service providers and other interested parties are focusing attention on branchless banking, as they believe in the promise it holds for facilitating access to financial services. Regulators, in particular, are feeling pressure to develop policy environments that will enable and support innovative and transformative models of branchless banking. At the same time, regulators are charged with developing policies to protect consumers, with particular emphasis on those who are considered financially vulnerable. The tension between the desire to innovate and the need to protect has left many regulators without a clear understanding of the most prudent path to take. This problem is heightened by the current paucity of information about both the problems customers actually encounter when attempting to avail themselves of branchless banking services, and about how these problems shape customers’ use and perception of these services. Rather, regulators remain largely guided by analyses of conceivable risks and limited complaint data. Such information, however, is unlikely to provide an appropriately comprehensive picture of the consumer experience—hypothetical problems are often different from actual ones, and feedback data are often limited to customers who are motivated and who have the resources to lodge a complaint. This can have the unintended effect of misrepresenting the experiences of the most vulnerable, who are often the least likely to voice complaints and, therefore, form the group about which regulators have the least understanding of appropriate protection needs. This report aims to summarize consumer experience information gathered about disparate branchless banking models in Brazil, Kenya and South Africa, with a specific focus on the experience of individuals classified as the most vulnerable. In particular, the research focused on the types of problems encountered by consumers of branchless banking services, and on how these experiences have shaped consumer practice and perceptions. This report then summarizes lessons learned about how to gather relevant and useful data in order to promote and provide guidance for future studies about consumer experience.
2. METHODOLOGY
2.1 Sourcing appropriate data
The data in this report were sourced in several ways: creating a consumer-protection-in-financial-services-outlets section in an omnibus survey in Brazil; creating a consumer-protection section in a bespoke survey to Wizzit clients in South Africa; and using existing consumer-protection questions in an existing survey of M-PESA clients and non-clients in Kenya. The Brazil study was conducted in November 2009. The data were gathered through specially commissioned add-on questions to an omnibus survey conducted by TNS. The sample included 2 002 respondents, who were selected in a population-representative manner. The surveys were conducted in the household, using commonly accepted respondent selection and interviewing protocols. The financial activity of the respondents was not known prior to questioning. The South Africa survey was conducted using 389 Wizzit users and took place in the fourth quarter of 2009. CGAP commissioned the survey to better understand the consumer’s experiences with their banking products. The Kenya study was conducted between August and October of 2008, though not specifically to assess consumer protection. It was commissioned by the FSDK to provide a general overview of M-PESA use. The sample frame covers 92% of the Kenyan population and 98% of M-PESA agents at the time—remote northern and eastern parts of the country were excluded. Within this sampling frame, 3 000 were randomly selected and over-sampling was conducted in areas with many M-PESA agents to increase the chances of capturing M-PESA users.
8
2.2 Focusing on vulnerable populations
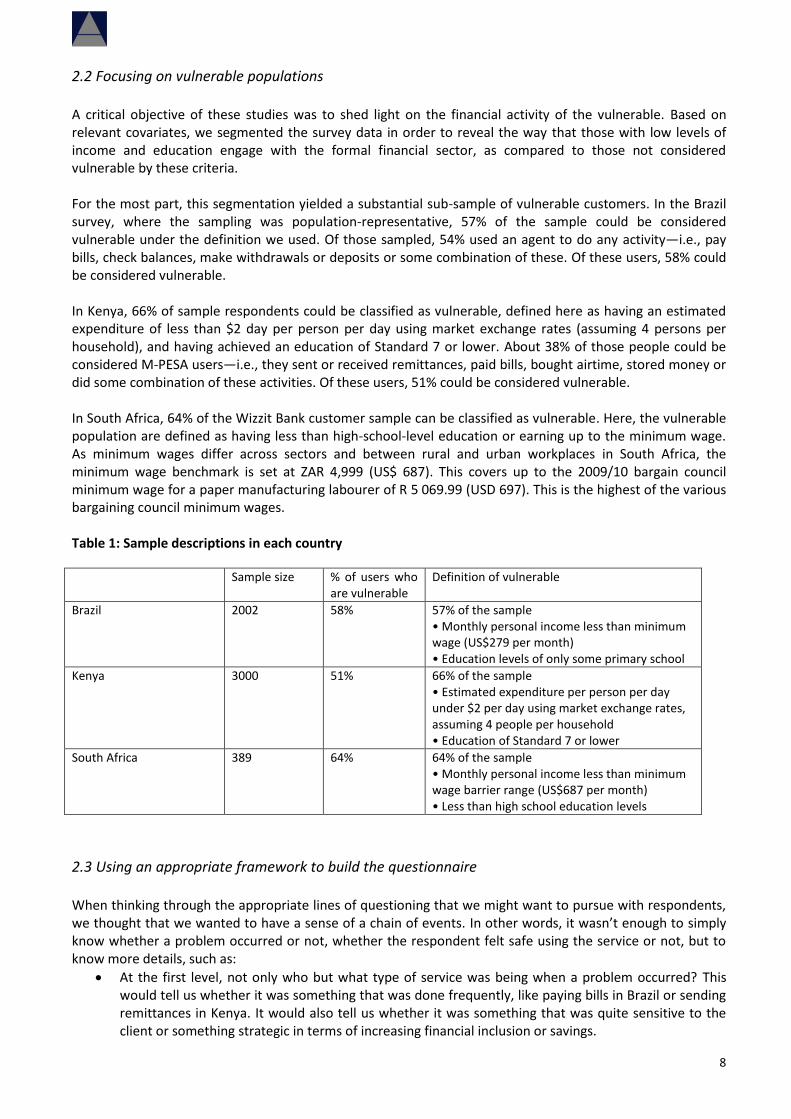
A critical objective of these studies was to shed light on the financial activity of the vulnerable. Based on relevant covariates, we segmented the survey data in order to reveal the way that those with low levels of income and education engage with the formal financial sector, as compared to those not considered vulnerable by these criteria. For the most part, this segmentation yielded a substantial sub-sample of vulnerable customers. In the Brazil survey, where the sampling was population-representative, 57% of the sample could be considered vulnerable under the definition we used. Of those sampled, 54% used an agent to do any activity—i.e., pay bills, check balances, make withdrawals or deposits or some combination of these. Of these users, 58% could be considered vulnerable. In Kenya, 66% of sample respondents could be classified as vulnerable, defined here as having an estimated expenditure of less than $2 day per person per day using market exchange rates (assuming 4 persons per household), and having achieved an education of Standard 7 or lower. About 38% of those people could be considered M-PESA users—i.e., they sent or received remittances, paid bills, bought airtime, stored money or did some combination of these activities. Of these users, 51% could be considered vulnerable. In South Africa, 64% of the Wizzit Bank customer sample can be classified as vulnerable. Here, the vulnerable population are defined as having less than high-school-level education or earning up to the minimum wage. As minimum wages differ across sectors and between rural and urban workplaces in South Africa, the minimum wage benchmark is set at ZAR 4,999 (US$ 687). This covers up to the 2009/10 bargain council minimum wage for a paper manufacturing labourer of R 5 069.99 (USD 697). This is the highest of the various bargaining council minimum wages. Table 1: Sample descriptions in each country
Sample size % of users who are vulnerable
Definition of vulnerable
Brazil 2002 58% 57% of the sample • Monthly personal income less than minimum wage (US$279 per month) • Education levels of only some primary school
Kenya 3000 51% 66% of the sample • Estimated expenditure per person per day under $2 per day using market exchange rates, assuming 4 people per household • Education of Standard 7 or lower
South Africa 389 64% 64% of the sample • Monthly personal income less than minimum wage barrier range (US$687 per month) • Less than high school education levels
2.3 Using an appropriate framework to build the questionnaire
When thinking through the appropriate lines of questioning that we might want to pursue with respondents, we thought that we wanted to have a sense of a chain of events. In other words, it wasn’t enough to simply know whether a problem occurred or not, whether the respondent felt safe using the service or not, but to know more details, such as:
At the first level, not only who but what type of service was being when a problem occurred? This would tell us whether it was something that was done frequently, like paying bills in Brazil or sending remittances in Kenya. It would also tell us whether it was something that was quite sensitive to the client or something strategic in terms of increasing financial inclusion or savings.
9
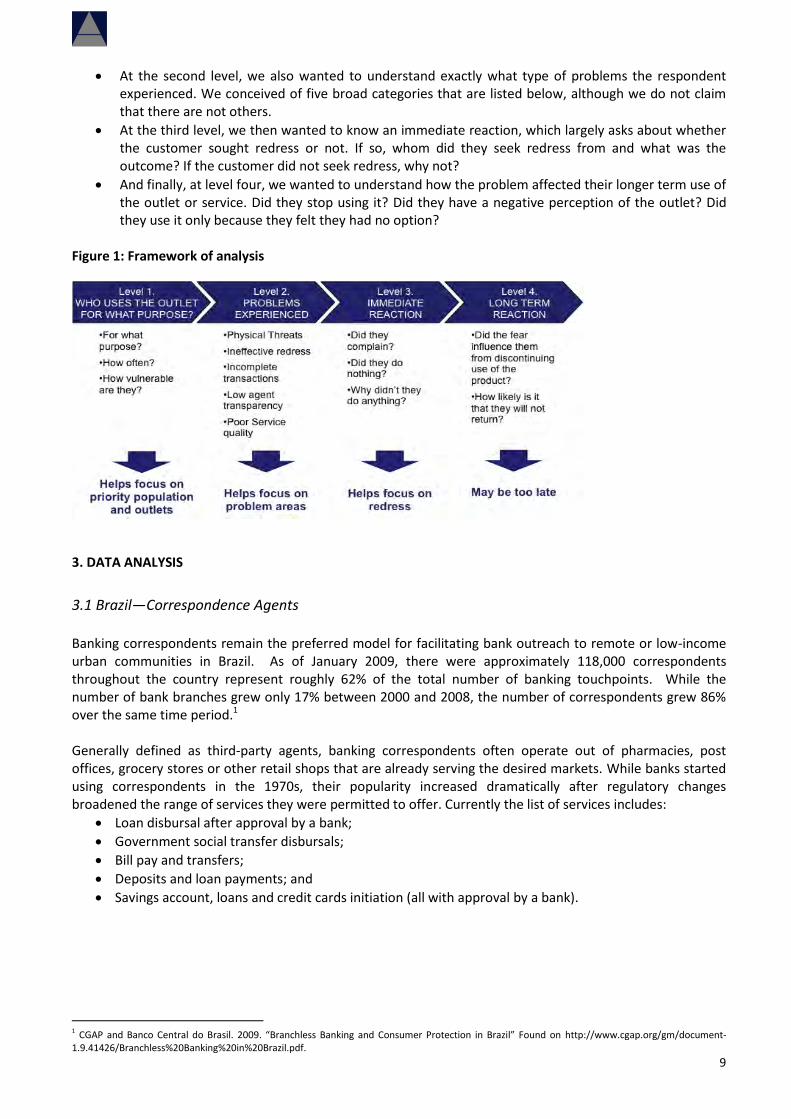
At the second level, we also wanted to understand exactly what type of problems the respondent experienced. We conceived of five broad categories that are listed below, although we do not claim that there are not others.
At the third level, we then wanted to know an immediate reaction, which largely asks about whether the customer sought redress or not. If so, whom did they seek redress from and what was the outcome? If the customer did not seek redress, why not?
And finally, at level four, we wanted to understand how the problem affected their longer term use of the outlet or service. Did they stop using it? Did they have a negative perception of the outlet? Did they use it only because they felt they had no option?
Figure 1: Framework of analysis
3. DATA ANALYSIS
3.1 Brazil—Correspondence Agents
Banking correspondents remain the preferred model for facilitating bank outreach to remote or low-income urban communities in Brazil. As of January 2009, there were approximately 118,000 correspondents throughout the country represent roughly 62% of the total number of banking touchpoints. While the number of bank branches grew only 17% between 2000 and 2008, the number of correspondents grew 86% over the same time period.1 Generally defined as third-party agents, banking correspondents often operate out of pharmacies, post offices, grocery stores or other retail shops that are already serving the desired markets. While banks started using correspondents in the 1970s, their popularity increased dramatically after regulatory changes broadened the range of services they were permitted to offer. Currently the list of services includes:
Loan disbursal after approval by a bank;
Government social transfer disbursals;
Bill pay and transfers;
Deposits and loan payments; and
Savings account, loans and credit cards initiation (all with approval by a bank).
1 CGAP and Banco Central do Brasil. 2009. “Branchless Banking and Consumer Protection in Brazil” Found on http://www.cgap.org/gm/document-1.9.41426/Branchless%20Banking%20in%20Brazil.pdf.
10
3.1.1 Data analysis
Level 1: Who uses the outlet and for what purpose?
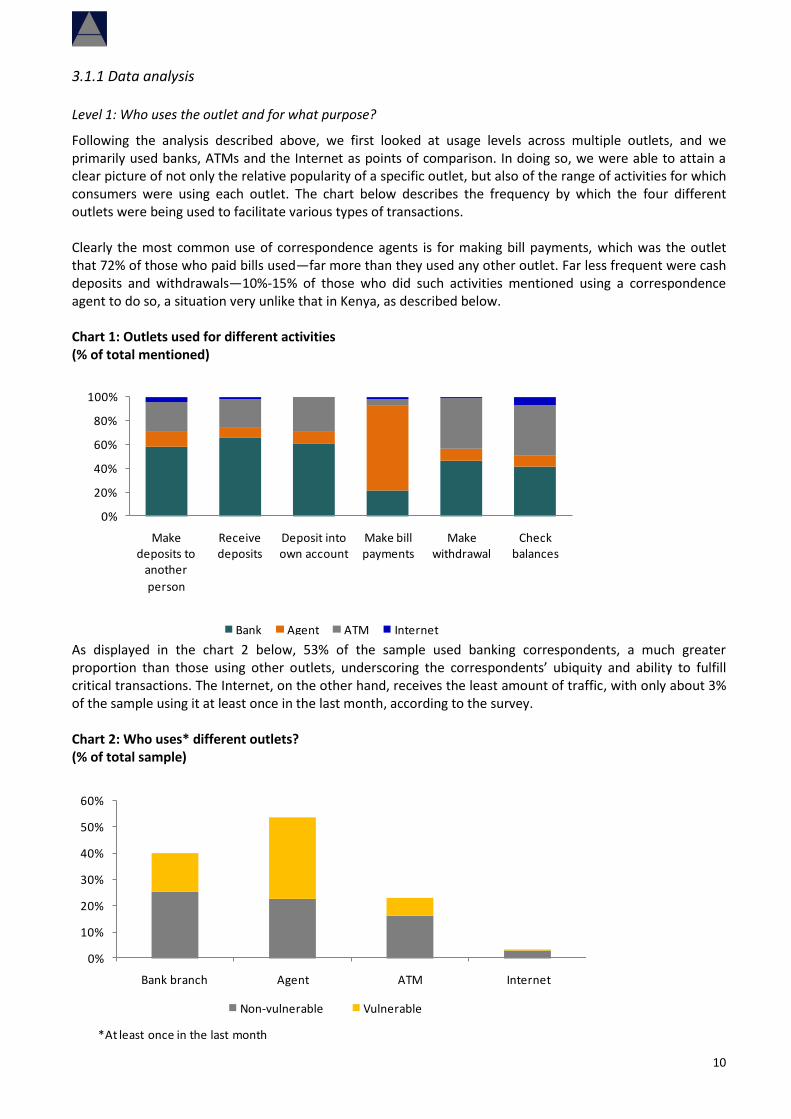
Following the analysis described above, we first looked at usage levels across multiple outlets, and we primarily used banks, ATMs and the Internet as points of comparison. In doing so, we were able to attain a clear picture of not only the relative popularity of a specific outlet, but also of the range of activities for which consumers were using each outlet. The chart below describes the frequency by which the four different outlets were being used to facilitate various types of transactions. Clearly the most common use of correspondence agents is for making bill payments, which was the outlet that 72% of those who paid bills used—far more than they used any other outlet. Far less frequent were cash deposits and withdrawals—10%-15% of those who did such activities mentioned using a correspondence agent to do so, a situation very unlike that in Kenya, as described below. Chart 1: Outlets used for different activities (% of total mentioned)
0%
20%
40%
60%
80%
100%
Make deposits to
another
person
Receive deposits
Deposit into own account
Make bill payments
Make withdrawal
Check balances
Bank Agent ATM Internet As displayed in the chart 2 below, 53% of the sample used banking correspondents, a much greater proportion than those using other outlets, underscoring the correspondents’ ubiquity and ability to fulfill critical transactions. The Internet, on the other hand, receives the least amount of traffic, with only about 3% of the sample using it at least once in the last month, according to the survey. Chart 2: Who uses* different outlets? (% of total sample)
0%
10%
20%
30%
40%
50%
60%
Bank branch Agent ATM Internet
Non-vulnerable Vulnerable
*At least once in the last month
11
Interestingly, despite the concentration of banking correspondents in higher-income areas, there does seem to be a greater level of usage amongst the vulnerable population. Indeed, of those using banking correspondents, almost 59% were classified as vulnerable. In contrast, approximately 37% of those using bank branches and 30% of those using an ATM were considered vulnerable. Therefore, not only is the role of banking correspondents clear across the population, but particularly so amongst the vulnerable populations, thereby highlighting the importance of the banking correspondents’ role in increasing financial inclusion.
Level 2: Problems experienced
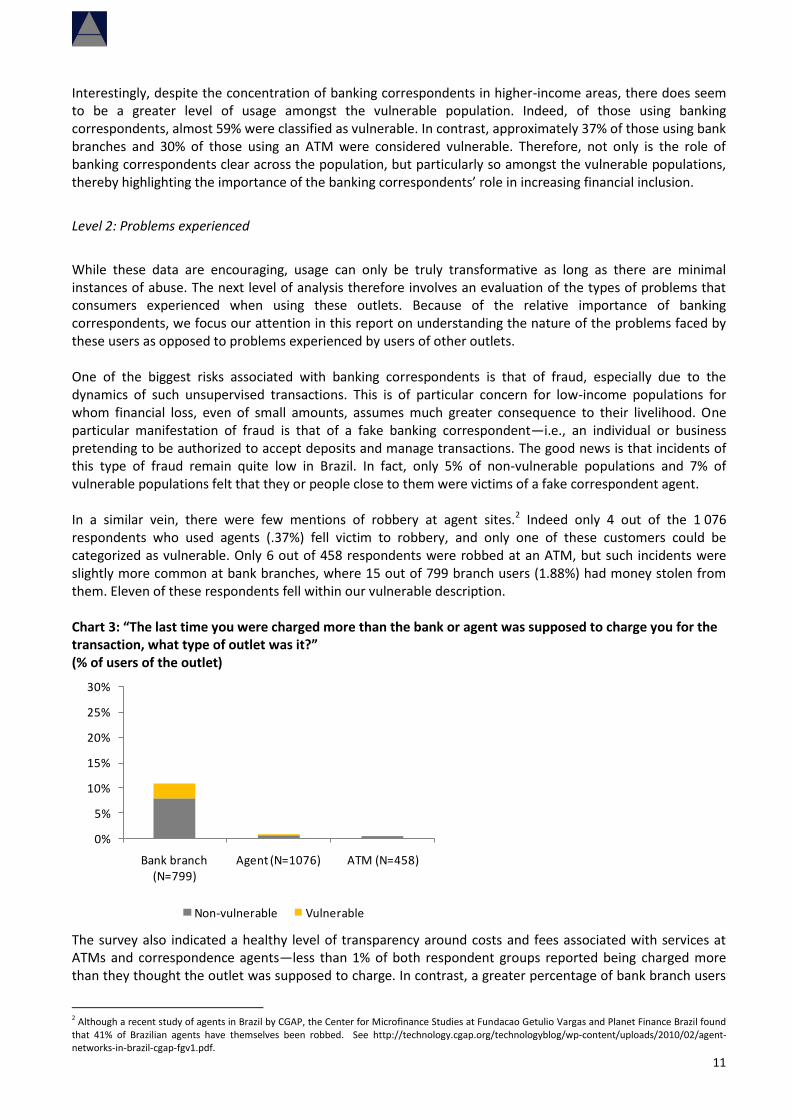
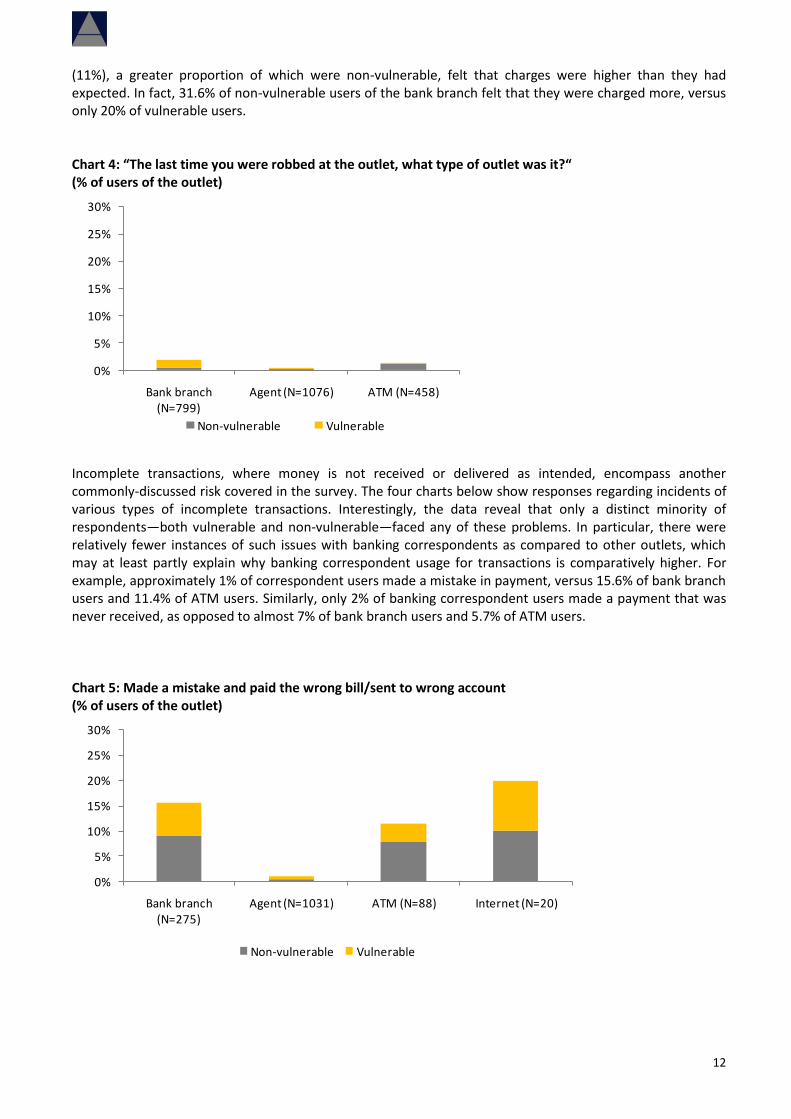
While these data are encouraging, usage can only be truly transformative as long as there are minimal instances of abuse. The next level of analysis therefore involves an evaluation of the types of problems that consumers experienced when using these outlets. Because of the relative importance of banking correspondents, we focus our attention in this report on understanding the nature of the problems faced by these users as opposed to problems experienced by users of other outlets. One of the biggest risks associated with banking correspondents is that of fraud, especially due to the dynamics of such unsupervised transactions. This is of particular concern for low-income populations for whom financial loss, even of small amounts, assumes much greater consequence to their livelihood. One particular manifestation of fraud is that of a fake banking correspondent—i.e., an individual or business pretending to be authorized to accept deposits and manage transactions. The good news is that incidents of this type of fraud remain quite low in Brazil. In fact, only 5% of non-vulnerable populations and 7% of vulnerable populations felt that they or people close to them were victims of a fake correspondent agent. In a similar vein, there were few mentions of robbery at agent sites.2 Indeed only 4 out of the 1 076 respondents who used agents (.37%) fell victim to robbery, and only one of these customers could be categorized as vulnerable. Only 6 out of 458 respondents were robbed at an ATM, but such incidents were slightly more common at bank branches, where 15 out of 799 branch users (1.88%) had money stolen from them. Eleven of these respondents fell within our vulnerable description. Chart 3: “The last time you were charged more than the bank or agent was supposed to charge you for the transaction, what type of outlet was it?” (% of users of the outlet)
0%
5%
10%
15%
20%
25%
30%
Bank branch (N=799)
Agent (N=1076) ATM (N=458)
Non-vulnerable Vulnerable
The survey also indicated a healthy level of transparency around costs and fees associated with services at ATMs and correspondence agents—less than 1% of both respondent groups reported being charged more than they thought the outlet was supposed to charge. In contrast, a greater percentage of bank branch users
2 Although a recent study of agents in Brazil by CGAP, the Center for Microfinance Studies at Fundacao Getulio Vargas and Planet Finance Brazil found that 41% of Brazilian agents have themselves been robbed. See http://technology.cgap.org/technologyblog/wp-content/uploads/2010/02/agent-networks-in-brazil-cgap-fgv1.pdf.
12
(11%), a greater proportion of which were non-vulnerable, felt that charges were higher than they had expected. In fact, 31.6% of non-vulnerable users of the bank branch felt that they were charged more, versus only 20% of vulnerable users. Chart 4: “The last time you were robbed at the outlet, what type of outlet was it?“ (% of users of the outlet)
0%
5%
10%
15%
20%
25%
30%
Bank branch (N=799)
Agent (N=1076) ATM (N=458)
Non-vulnerable Vulnerable
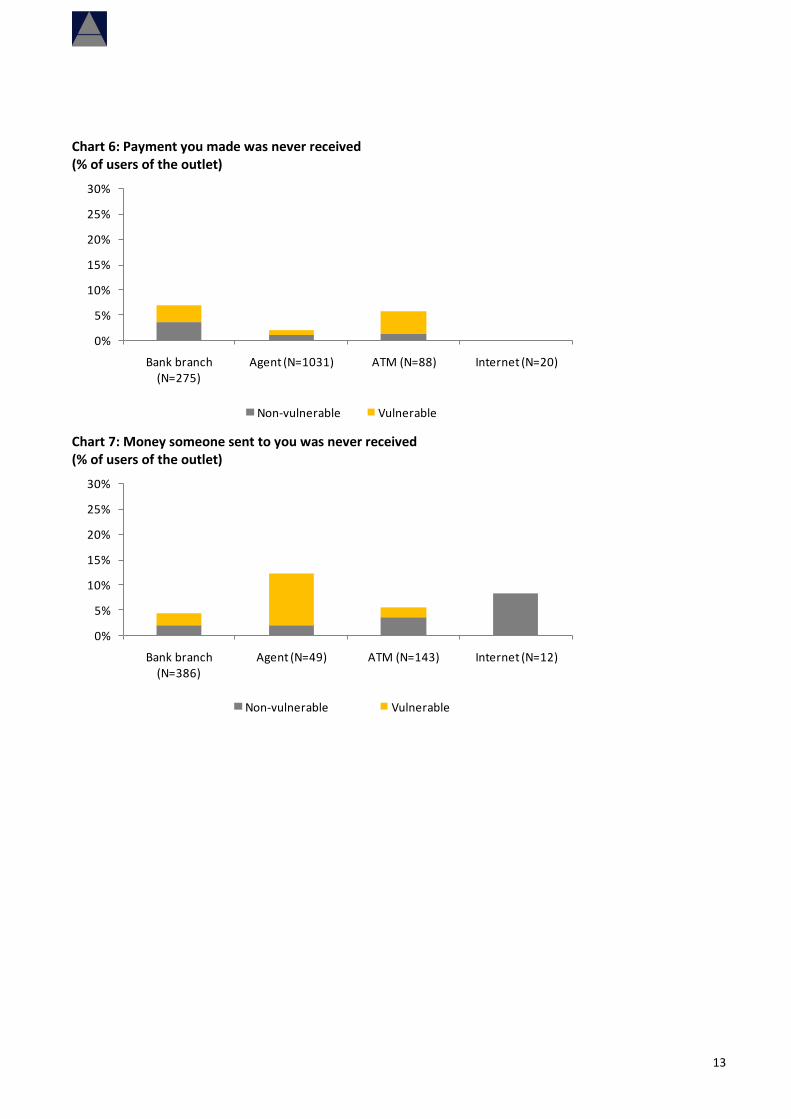
Incomplete transactions, where money is not received or delivered as intended, encompass another commonly-discussed risk covered in the survey. The four charts below show responses regarding incidents of various types of incomplete transactions. Interestingly, the data reveal that only a distinct minority of respondents—both vulnerable and non-vulnerable—faced any of these problems. In particular, there were relatively fewer instances of such issues with banking correspondents as compared to other outlets, which may at least partly explain why banking correspondent usage for transactions is comparatively higher. For example, approximately 1% of correspondent users made a mistake in payment, versus 15.6% of bank branch users and 11.4% of ATM users. Similarly, only 2% of banking correspondent users made a payment that was never received, as opposed to almost 7% of bank branch users and 5.7% of ATM users. Chart 5: Made a mistake and paid the wrong bill/sent to wrong account (% of users of the outlet)
0%
5%
10%
15%
20%
25%
30%
Bank branch (N=275)
Agent (N=1031) ATM (N=88) Internet (N=20)
Non-vulnerable Vulnerable
13
Chart 6: Payment you made was never received (% of users of the outlet)
0%
5%
10%
15%
20%
25%
30%
Bank branch (N=275)
Agent (N=1031) ATM (N=88) Internet (N=20)
Non-vulnerable Vulnerable
Chart 7: Money someone sent to you was never received (% of users of the outlet)
0%
5%
10%
15%
20%
25%
30%
Bank branch (N=386)
Agent (N=49) ATM (N=143) Internet (N=12)
Non-vulnerable Vulnerable
14
Chart 8: Money you deposited was never accounted for in your account (% of users of the outlet)
0%
5%
10%
15%
20%
25%
30%
Bank branch (N=358)
Agent (N=83) ATM (N=328)
Non-vulnerable Vulnerable
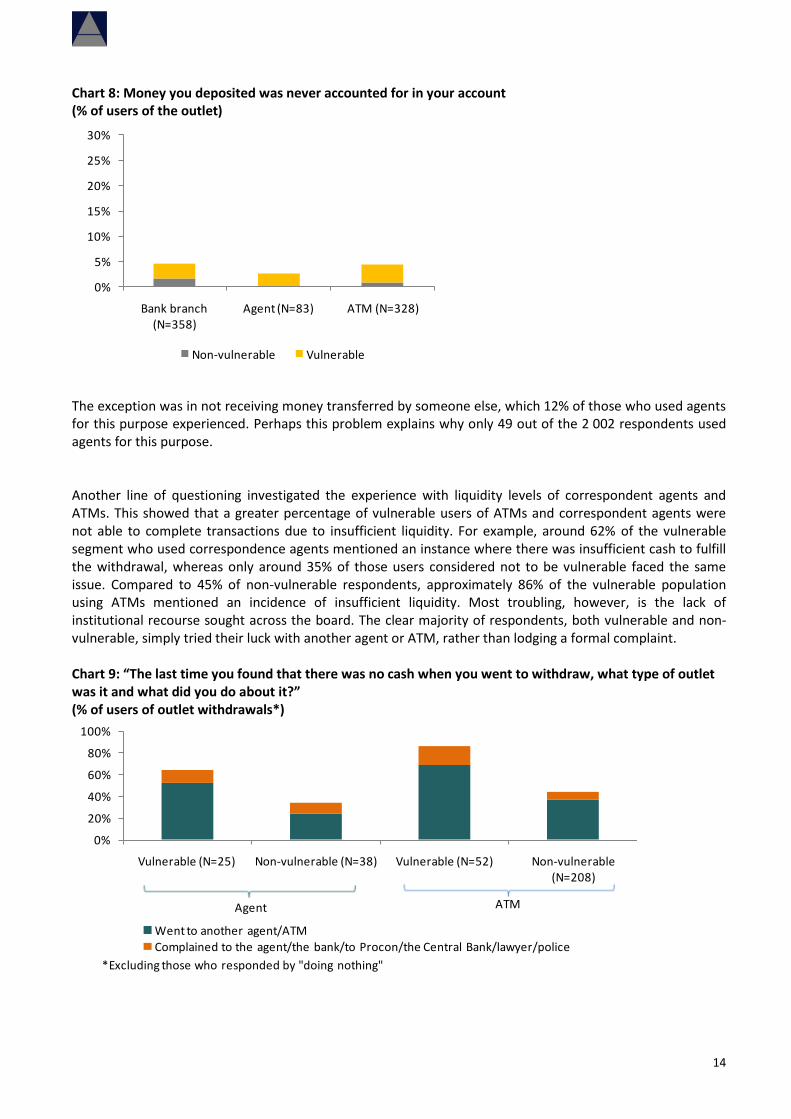
The exception was in not receiving money transferred by someone else, which 12% of those who used agents for this purpose experienced. Perhaps this problem explains why only 49 out of the 2 002 respondents used agents for this purpose. Another line of questioning investigated the experience with liquidity levels of correspondent agents and ATMs. This showed that a greater percentage of vulnerable users of ATMs and correspondent agents were not able to complete transactions due to insufficient liquidity. For example, around 62% of the vulnerable segment who used correspondence agents mentioned an instance where there was insufficient cash to fulfill the withdrawal, whereas only around 35% of those users considered not to be vulnerable faced the same issue. Compared to 45% of non-vulnerable respondents, approximately 86% of the vulnerable population using ATMs mentioned an incidence of insufficient liquidity. Most troubling, however, is the lack of institutional recourse sought across the board. The clear majority of respondents, both vulnerable and non-vulnerable, simply tried their luck with another agent or ATM, rather than lodging a formal complaint. Chart 9: “The last time you found that there was no cash when you went to withdraw, what type of outlet was it and what did you do about it?” (% of users of outlet withdrawals*)
0%
20%
40%
60%
80%
100%
Vulnerable (N=25) Non-vulnerable (N=38) Vulnerable (N=52) Non-vulnerable (N=208)
Went to another agent/ATMComplained to the agent/the bank/to Procon/the Central Bank/lawyer/police
*Excluding those who responded by "doing nothing"
Agent ATM
15
Level 3: Immediate reaction
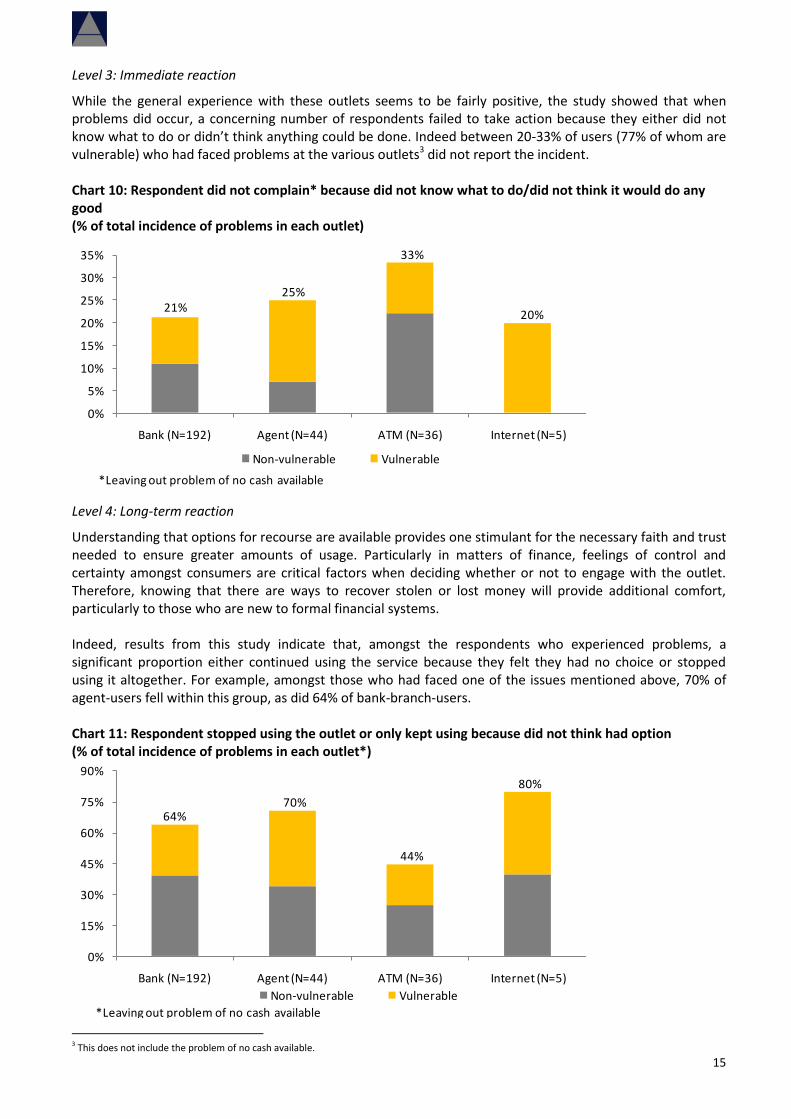
While the general experience with these outlets seems to be fairly positive, the study showed that when problems did occur, a concerning number of respondents failed to take action because they either did not know what to do or didn’t think anything could be done. Indeed between 20-33% of users (77% of whom are vulnerable) who had faced problems at the various outlets3 did not report the incident. Chart 10: Respondent did not complain* because did not know what to do/did not think it would do any good (% of total incidence of problems in each outlet)
0%
5%
10%
15%
20%
25%
30%
35%
Bank (N=192) Agent (N=44) ATM (N=36) Internet (N=5)
Non-vulnerable Vulnerable
*Leaving out problem of no cash available
21%25%
33%
20%
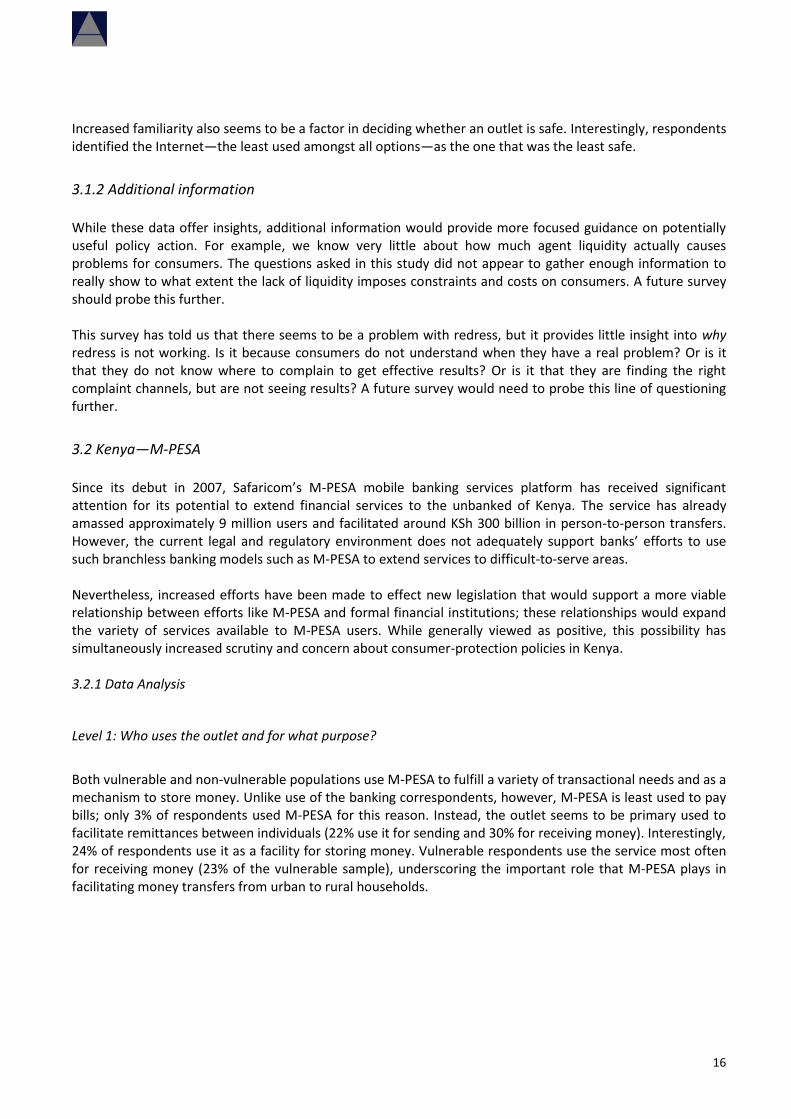
Level 4: Long-term reaction
Understanding that options for recourse are available provides one stimulant for the necessary faith and trust needed to ensure greater amounts of usage. Particularly in matters of finance, feelings of control and certainty amongst consumers are critical factors when deciding whether or not to engage with the outlet. Therefore, knowing that there are ways to recover stolen or lost money will provide additional comfort, particularly to those who are new to formal financial systems. Indeed, results from this study indicate that, amongst the respondents who experienced problems, a significant proportion either continued using the service because they felt they had no choice or stopped using it altogether. For example, amongst those who had faced one of the issues mentioned above, 70% of agent-users fell within this group, as did 64% of bank-branch-users. Chart 11: Respondent stopped using the outlet or only kept using because did not think had option (% of total incidence of problems in each outlet*)
0%
15%
30%
45%
60%
75%
90%
Bank (N=192) Agent (N=44) ATM (N=36) Internet (N=5)
Non-vulnerable Vulnerable
*Leaving out problem of no cash available
64%70%
44%
80%
3 This does not include the problem of no cash available.
16
Increased familiarity also seems to be a factor in deciding whether an outlet is safe. Interestingly, respondents identified the Internet—the least used amongst all options—as the one that was the least safe.
3.1.2 Additional information
While these data offer insights, additional information would provide more focused guidance on potentially useful policy action. For example, we know very little about how much agent liquidity actually causes problems for consumers. The questions asked in this study did not appear to gather enough information to really show to what extent the lack of liquidity imposes constraints and costs on consumers. A future survey should probe this further. This survey has told us that there seems to be a problem with redress, but it provides little insight into why redress is not working. Is it because consumers do not understand when they have a real problem? Or is it that they do not know where to complain to get effective results? Or is it that they are finding the right complaint channels, but are not seeing results? A future survey would need to probe this line of questioning further.
3.2 Kenya—M-PESA
Since its debut in 2007, Safaricom’s M-PESA mobile banking services platform has received significant attention for its potential to extend financial services to the unbanked of Kenya. The service has already amassed approximately 9 million users and facilitated around KSh 300 billion in person-to-person transfers. However, the current legal and regulatory environment does not adequately support banks’ efforts to use such branchless banking models such as M-PESA to extend services to difficult-to-serve areas. Nevertheless, increased efforts have been made to effect new legislation that would support a more viable relationship between efforts like M-PESA and formal financial institutions; these relationships would expand the variety of services available to M-PESA users. While generally viewed as positive, this possibility has simultaneously increased scrutiny and concern about consumer-protection policies in Kenya. 3.2.1 Data Analysis
Level 1: Who uses the outlet and for what purpose?
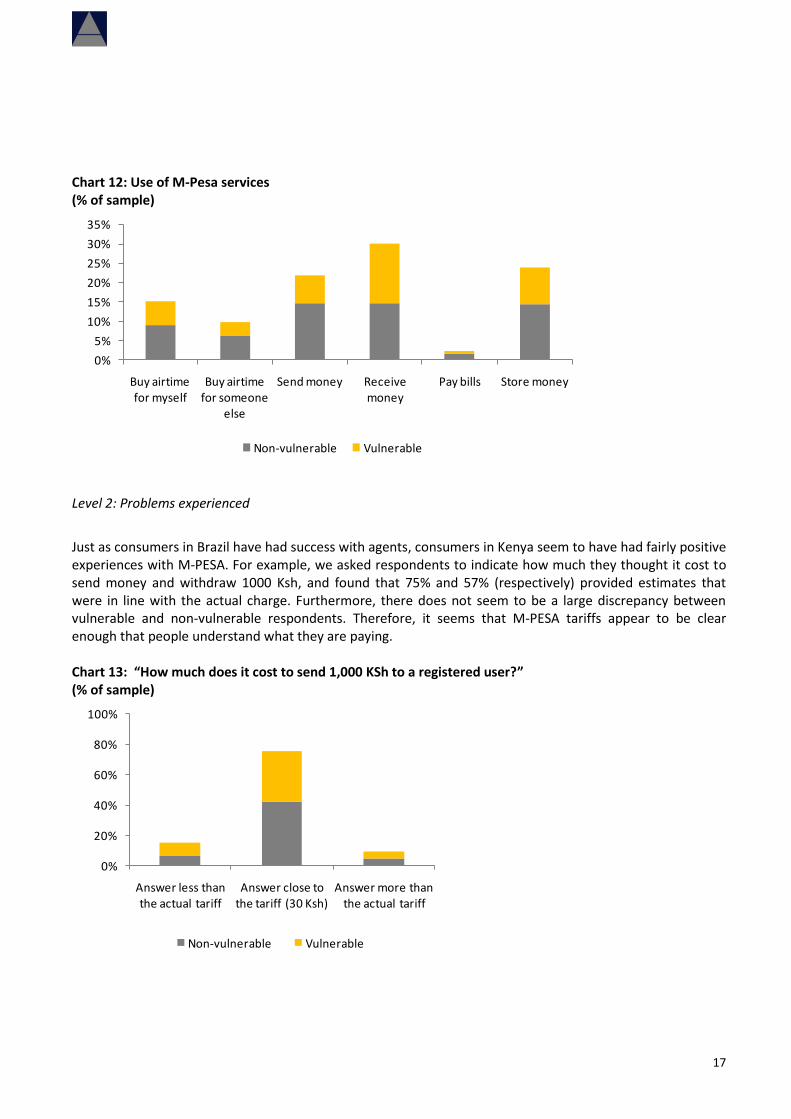
Both vulnerable and non-vulnerable populations use M-PESA to fulfill a variety of transactional needs and as a mechanism to store money. Unlike use of the banking correspondents, however, M-PESA is least used to pay bills; only 3% of respondents used M-PESA for this reason. Instead, the outlet seems to be primary used to facilitate remittances between individuals (22% use it for sending and 30% for receiving money). Interestingly, 24% of respondents use it as a facility for storing money. Vulnerable respondents use the service most often for receiving money (23% of the vulnerable sample), underscoring the important role that M-PESA plays in facilitating money transfers from urban to rural households.
17
Chart 12: Use of M-Pesa services (% of sample)
0%
5%
10%
15%
20%
25%
30%
35%
Buy airtime for myself
Buy airtime for someone
else
Send money Receive money
Pay bills Store money
Non-vulnerable Vulnerable
Level 2: Problems experienced
Just as consumers in Brazil have had success with agents, consumers in Kenya seem to have had fairly positive experiences with M-PESA. For example, we asked respondents to indicate how much they thought it cost to send money and withdraw 1000 Ksh, and found that 75% and 57% (respectively) provided estimates that were in line with the actual charge. Furthermore, there does not seem to be a large discrepancy between vulnerable and non-vulnerable respondents. Therefore, it seems that M-PESA tariffs appear to be clear enough that people understand what they are paying.
Chart 13: “How much does it cost to send 1,000 KSh to a registered user?” (% of sample)
0%
20%
40%
60%
80%
100%
Answer less than the actual tariff
Answer close to the tariff (30 Ksh)
Answer more than the actual tariff
Non-vulnerable Vulnerable
18
Chart 14: “How much does it cost to withdraw 1,000 KSh sent to you by a registered user?” (% of sample)
0%
20%
40%
60%
80%
100%
Answer less than the actual tariff
Answer close to the tariff (25 KSh)
Answer more than the actual tariff
Non-vulnerable Vulnerable
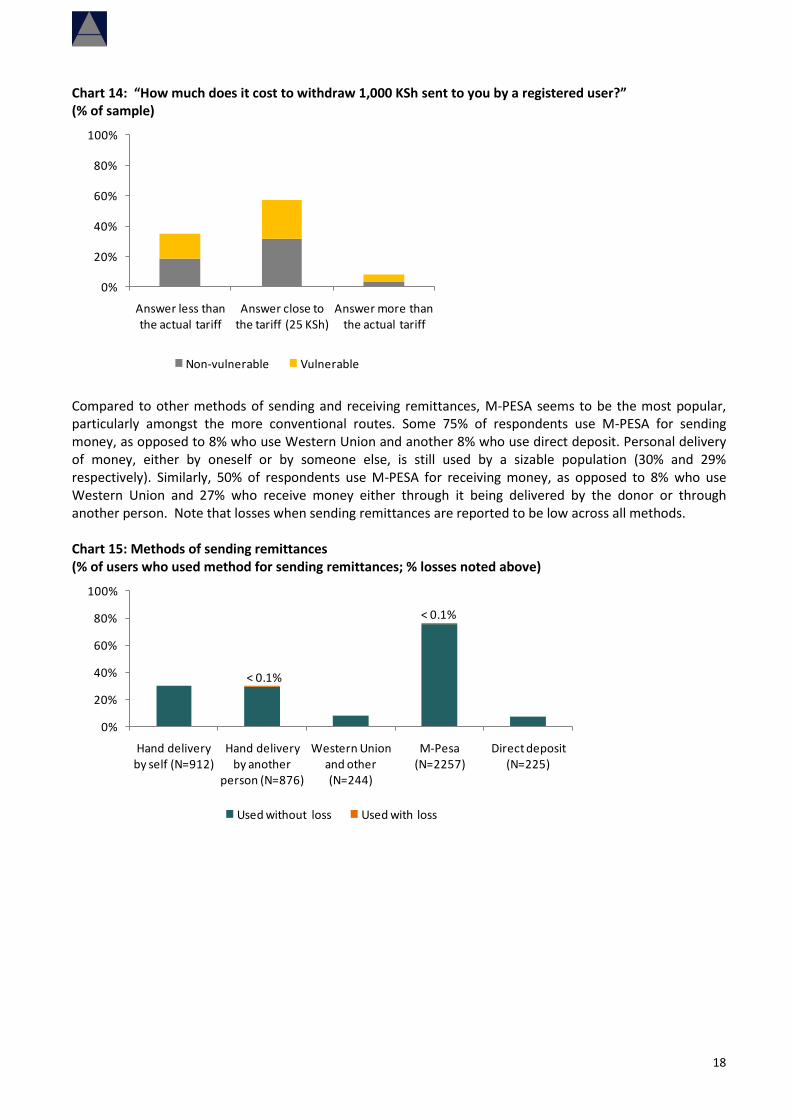
Compared to other methods of sending and receiving remittances, M-PESA seems to be the most popular, particularly amongst the more conventional routes. Some 75% of respondents use M-PESA for sending money, as opposed to 8% who use Western Union and another 8% who use direct deposit. Personal delivery of money, either by oneself or by someone else, is still used by a sizable population (30% and 29% respectively). Similarly, 50% of respondents use M-PESA for receiving money, as opposed to 8% who use Western Union and 27% who receive money either through it being delivered by the donor or through another person. Note that losses when sending remittances are reported to be low across all methods. Chart 15: Methods of sending remittances (% of users who used method for sending remittances; % losses noted above)
0%
20%
40%
60%
80%
100%
Hand delivery by self (N=912)
Hand delivery by another
person (N=876)
Western Union and other (N=244)
M-Pesa (N=2257)
Direct deposit (N=225)
Used without loss Used with loss
< 0.1%
< 0.1%
19
Chart 16: Methods of receiving remittances (% of users who used method for sending remittances; % losses noted above)
0%
20%
40%
60%
80%
100%
Hand delivery by self (N=307)
Hand delivery by another
person (N=511)
Western Union and other (N=224)
M-Pesa (N=1490)
Direct deposit (N=11)
Used without loss Used with loss
< 0.4%
< 0.4%
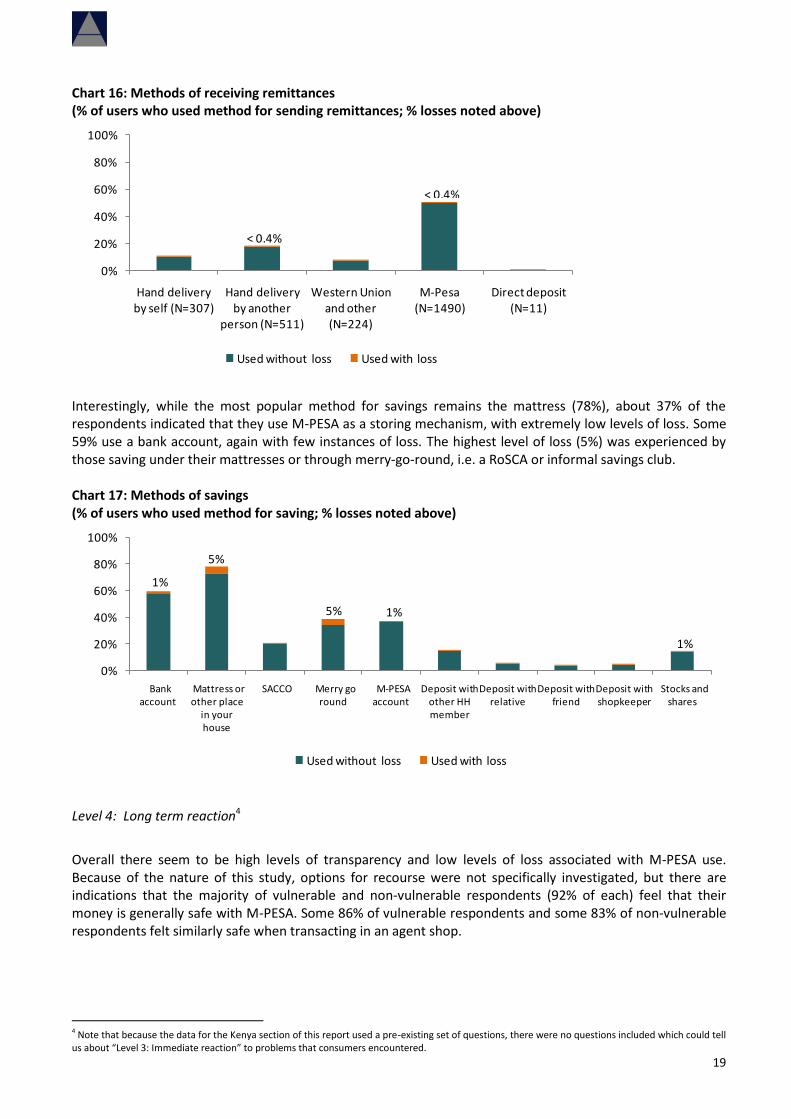
Interestingly, while the most popular method for savings remains the mattress (78%), about 37% of the respondents indicated that they use M-PESA as a storing mechanism, with extremely low levels of loss. Some 59% use a bank account, again with few instances of loss. The highest level of loss (5%) was experienced by those saving under their mattresses or through merry-go-round, i.e. a RoSCA or informal savings club. Chart 17: Methods of savings (% of users who used method for saving; % losses noted above)
0%
20%
40%
60%
80%
100%
Bank account
Mattress or other place
in your house
SACCO Merry go round
M-PESA account
Deposit with other HH member
Deposit with relative
Deposit with friend
Deposit with shopkeeper
Stocks and shares
Used without loss Used with loss
5%
5% 1%
1%
1%
Level 4: Long term reaction4
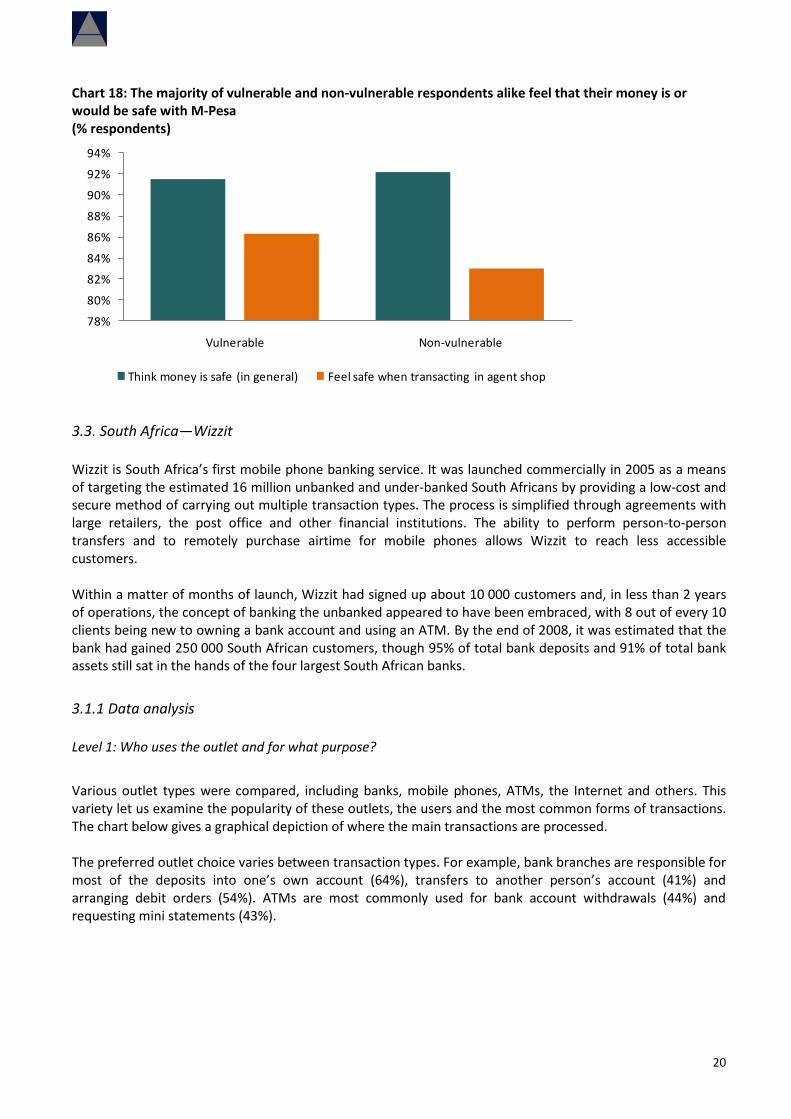
Overall there seem to be high levels of transparency and low levels of loss associated with M-PESA use. Because of the nature of this study, options for recourse were not specifically investigated, but there are indications that the majority of vulnerable and non-vulnerable respondents (92% of each) feel that their money is generally safe with M-PESA. Some 86% of vulnerable respondents and some 83% of non-vulnerable respondents felt similarly safe when transacting in an agent shop.
4 Note that because the data for the Kenya section of this report used a pre-existing set of questions, there were no questions included which could tell us about “Level 3: Immediate reaction” to problems that consumers encountered.
20
Chart 18: The majority of vulnerable and non-vulnerable respondents alike feel that their money is or would be safe with M-Pesa (% respondents)
78%
80%
82%
84%
86%
88%
90%
92%
94%
Vulnerable Non-vulnerable
Think money is safe (in general) Feel safe when transacting in agent shop
3.3. South Africa—Wizzit
Wizzit is South Africa’s first mobile phone banking service. It was launched commercially in 2005 as a means of targeting the estimated 16 million unbanked and under-banked South Africans by providing a low-cost and secure method of carrying out multiple transaction types. The process is simplified through agreements with large retailers, the post office and other financial institutions. The ability to perform person-to-person transfers and to remotely purchase airtime for mobile phones allows Wizzit to reach less accessible customers. Within a matter of months of launch, Wizzit had signed up about 10 000 customers and, in less than 2 years of operations, the concept of banking the unbanked appeared to have been embraced, with 8 out of every 10 clients being new to owning a bank account and using an ATM. By the end of 2008, it was estimated that the bank had gained 250 000 South African customers, though 95% of total bank deposits and 91% of total bank assets still sat in the hands of the four largest South African banks.
3.1.1 Data analysis
Level 1: Who uses the outlet and for what purpose?
Various outlet types were compared, including banks, mobile phones, ATMs, the Internet and others. This variety let us examine the popularity of these outlets, the users and the most common forms of transactions. The chart below gives a graphical depiction of where the main transactions are processed. The preferred outlet choice varies between transaction types. For example, bank branches are responsible for most of the deposits into one’s own account (64%), transfers to another person’s account (41%) and arranging debit orders (54%). ATMs are most commonly used for bank account withdrawals (44%) and requesting mini statements (43%).
21
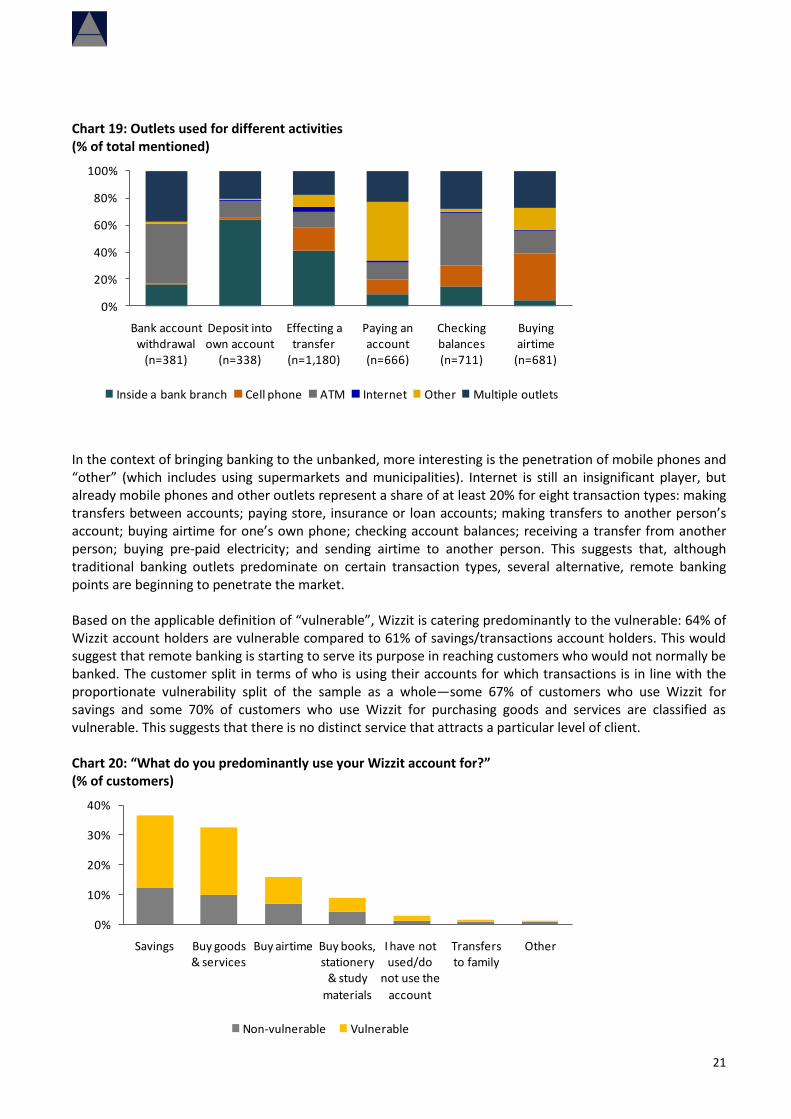
Chart 19: Outlets used for different activities (% of total mentioned)
0%
20%
40%
60%
80%
100%
Bank account withdrawal
(n=381)
Deposit into own account
(n=338)
Effecting a transfer
(n=1,180)
Paying an account (n=666)
Checking balances (n=711)
Buying airtime
(n=681)
Inside a bank branch Cell phone ATM Internet Other Multiple outlets
In the context of bringing banking to the unbanked, more interesting is the penetration of mobile phones and “other” (which includes using supermarkets and municipalities). Internet is still an insignificant player, but already mobile phones and other outlets represent a share of at least 20% for eight transaction types: making transfers between accounts; paying store, insurance or loan accounts; making transfers to another person’s account; buying airtime for one’s own phone; checking account balances; receiving a transfer from another person; buying pre-paid electricity; and sending airtime to another person. This suggests that, although traditional banking outlets predominate on certain transaction types, several alternative, remote banking points are beginning to penetrate the market. Based on the applicable definition of “vulnerable”, Wizzit is catering predominantly to the vulnerable: 64% of Wizzit account holders are vulnerable compared to 61% of savings/transactions account holders. This would suggest that remote banking is starting to serve its purpose in reaching customers who would not normally be banked. The customer split in terms of who is using their accounts for which transactions is in line with the proportionate vulnerability split of the sample as a whole—some 67% of customers who use Wizzit for savings and some 70% of customers who use Wizzit for purchasing goods and services are classified as vulnerable. This suggests that there is no distinct service that attracts a particular level of client. Chart 20: “What do you predominantly use your Wizzit account for?” (% of customers)
0%
10%
20%
30%
40%
Savings Buy goods & services
Buy airtime Buy books, stationery
& study
materials
I have not used/do
not use the
account
Transfers to family
Other
Non-vulnerable Vulnerable
22
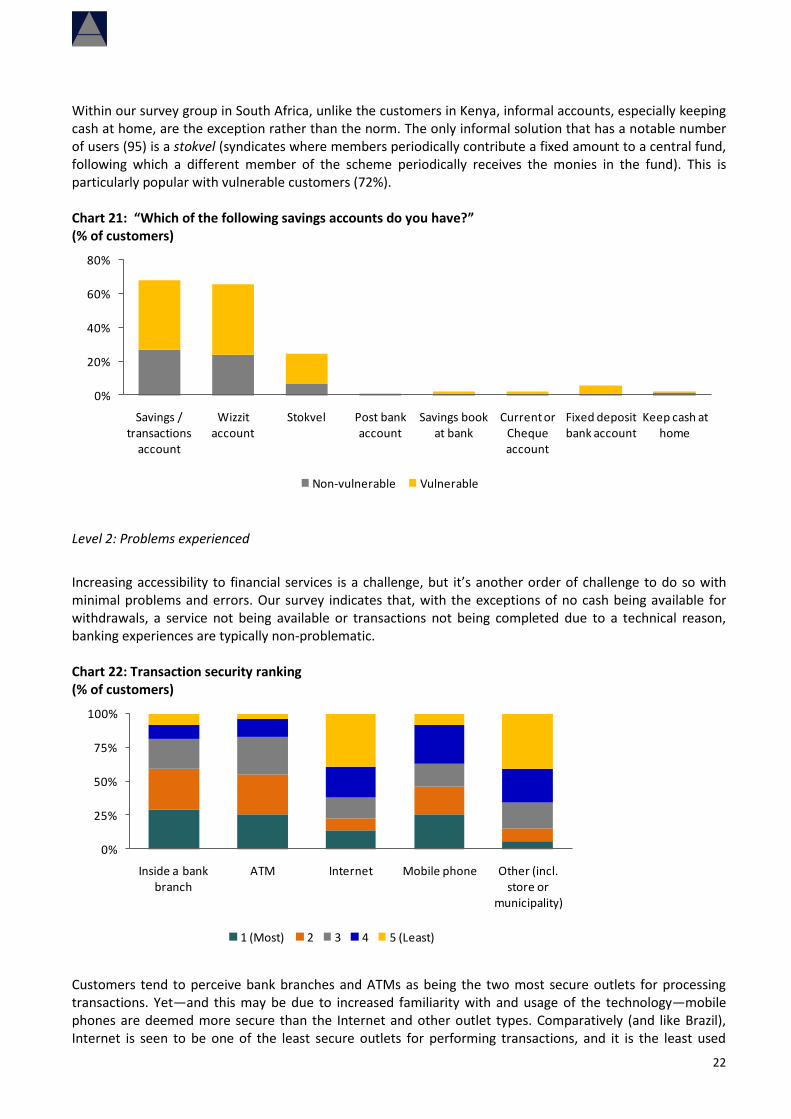
Within our survey group in South Africa, unlike the customers in Kenya, informal accounts, especially keeping cash at home, are the exception rather than the norm. The only informal solution that has a notable number of users (95) is a stokvel (syndicates where members periodically contribute a fixed amount to a central fund, following which a different member of the scheme periodically receives the monies in the fund). This is particularly popular with vulnerable customers (72%). Chart 21: “Which of the following savings accounts do you have?” (% of customers)
0%
20%
40%
60%
80%
Savings / transactions
account
Wizzit account
Stokvel Post bank account
Savings book at bank
Current or Cheque account
Fixed deposit bank account
Keep cash at home
Non-vulnerable Vulnerable
Level 2: Problems experienced
Increasing accessibility to financial services is a challenge, but it’s another order of challenge to do so with minimal problems and errors. Our survey indicates that, with the exceptions of no cash being available for withdrawals, a service not being available or transactions not being completed due to a technical reason, banking experiences are typically non-problematic. Chart 22: Transaction security ranking (% of customers)
0%
25%
50%
75%
100%
Inside a bank branch
ATM Internet Mobile phone Other (incl. store or
municipality)
1 (Most) 2 3 4 5 (Least)
Customers tend to perceive bank branches and ATMs as being the two most secure outlets for processing transactions. Yet—and this may be due to increased familiarity with and usage of the technology—mobile phones are deemed more secure than the Internet and other outlet types. Comparatively (and like Brazil), Internet is seen to be one of the least secure outlets for performing transactions, and it is the least used
23
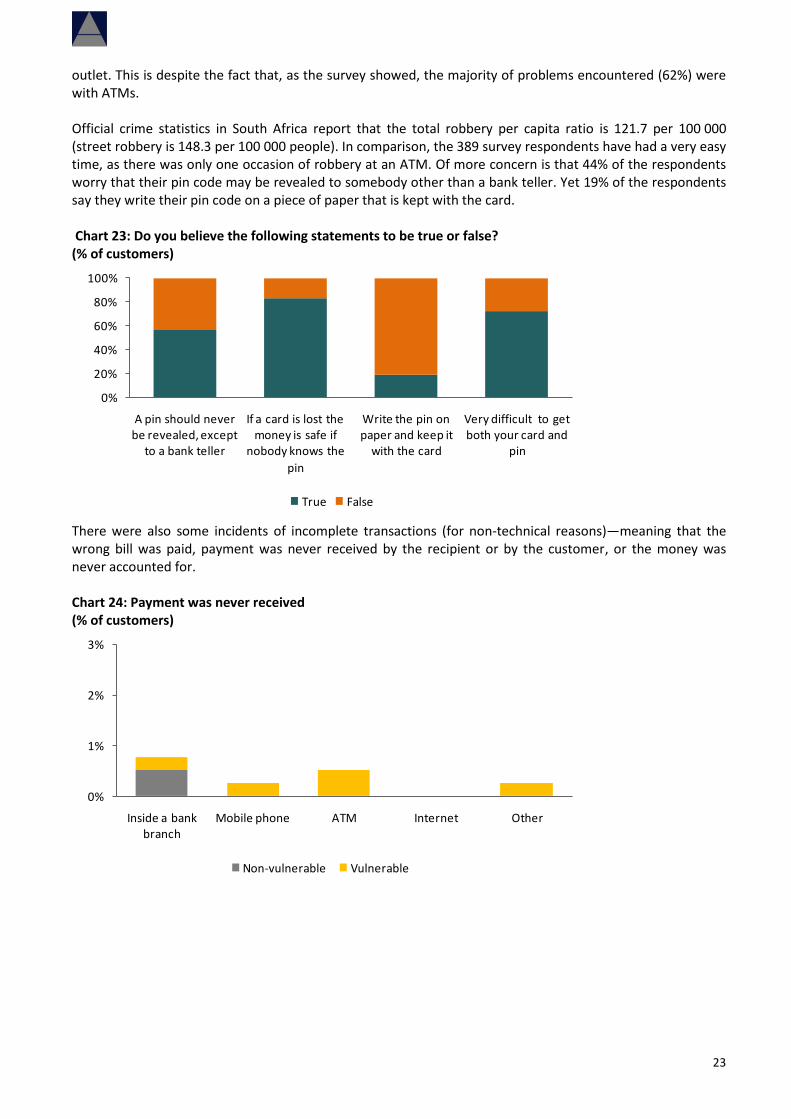
outlet. This is despite the fact that, as the survey showed, the majority of problems encountered (62%) were with ATMs. Official crime statistics in South Africa report that the total robbery per capita ratio is 121.7 per 100 000 (street robbery is 148.3 per 100 000 people). In comparison, the 389 survey respondents have had a very easy time, as there was only one occasion of robbery at an ATM. Of more concern is that 44% of the respondents worry that their pin code may be revealed to somebody other than a bank teller. Yet 19% of the respondents say they write their pin code on a piece of paper that is kept with the card. Chart 23: Do you believe the following statements to be true or false? (% of customers)
0%
20%
40%
60%
80%
100%
A pin should never be revealed, except
to a bank teller
If a card is lost the money is safe if
nobody knows the
pin
Write the pin on paper and keep it
with the card
Very difficult to get both your card and
pin
True False
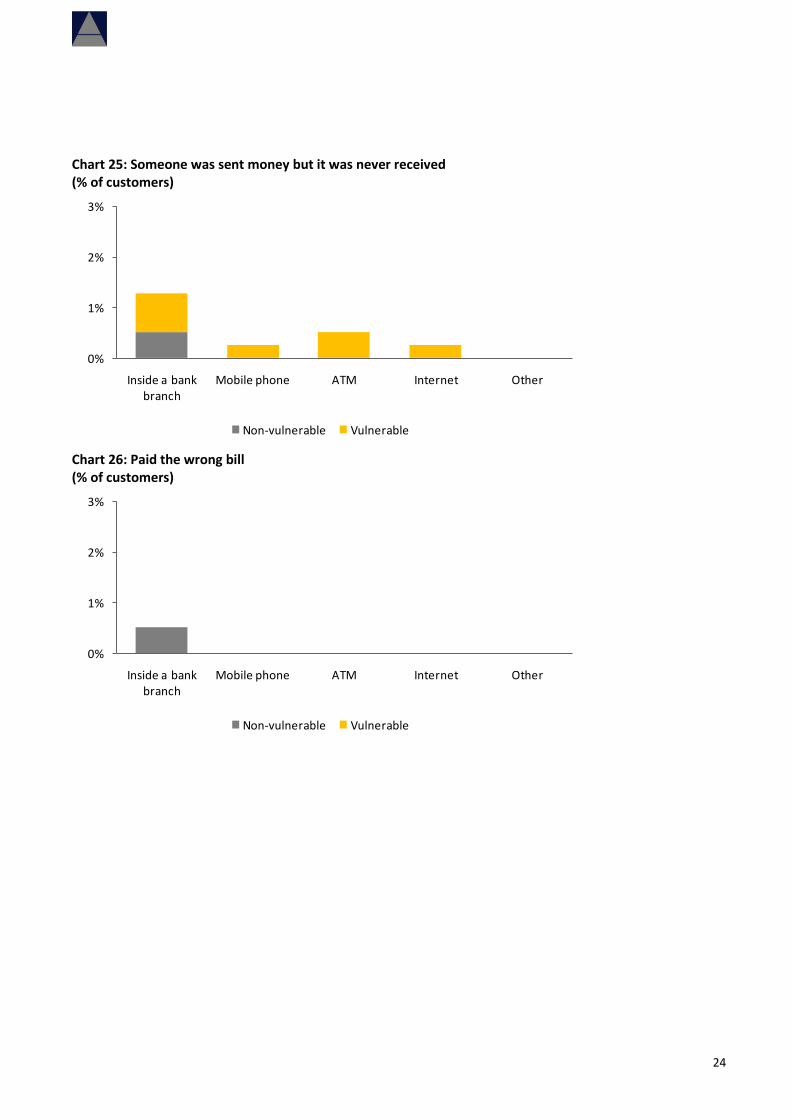
There were also some incidents of incomplete transactions (for non-technical reasons)—meaning that the wrong bill was paid, payment was never received by the recipient or by the customer, or the money was never accounted for. Chart 24: Payment was never received (% of customers)
0%
1%
2%
3%
Inside a bank branch
Mobile phone ATM Internet Other
Non-vulnerable Vulnerable
24
Chart 25: Someone was sent money but it was never received (% of customers)
0%
1%
2%
3%
Inside a bank branch
Mobile phone ATM Internet Other
Non-vulnerable Vulnerable
Chart 26: Paid the wrong bill (% of customers)
0%
1%
2%
3%
Inside a bank branch
Mobile phone ATM Internet Other
Non-vulnerable Vulnerable
25
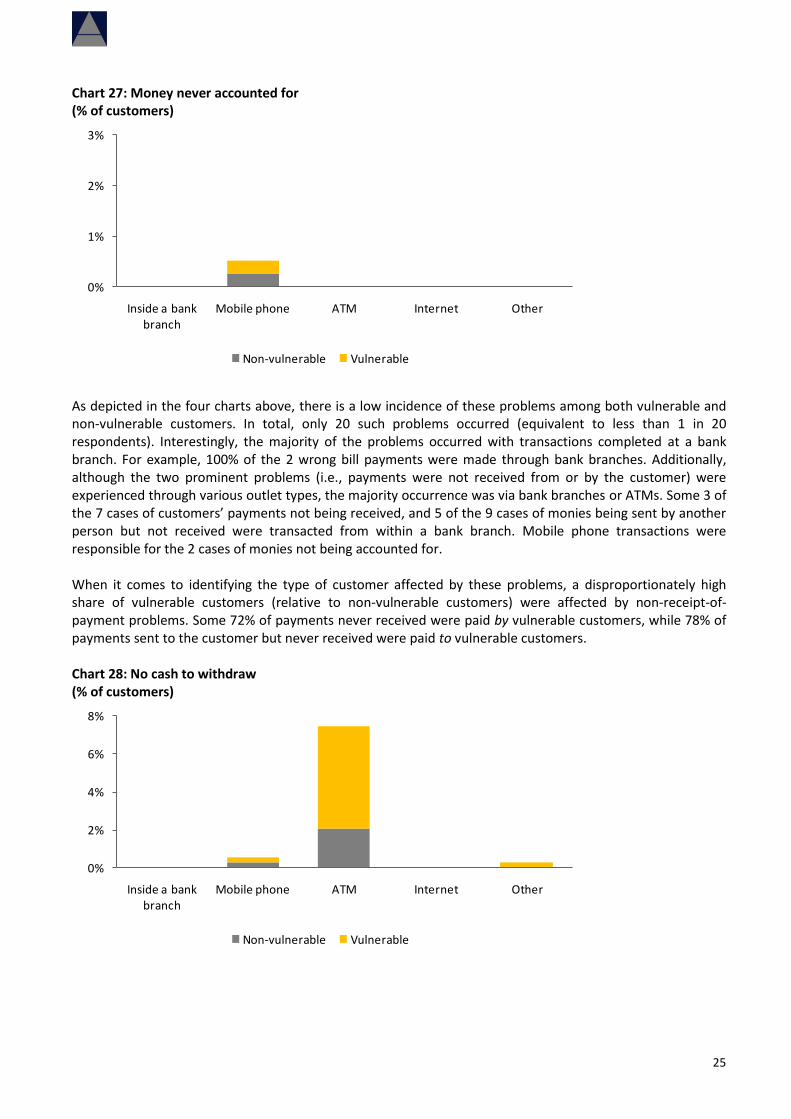
Chart 27: Money never accounted for (% of customers)
0%
1%
2%
3%
Inside a bank branch
Mobile phone ATM Internet Other
Non-vulnerable Vulnerable
As depicted in the four charts above, there is a low incidence of these problems among both vulnerable and non-vulnerable customers. In total, only 20 such problems occurred (equivalent to less than 1 in 20 respondents). Interestingly, the majority of the problems occurred with transactions completed at a bank branch. For example, 100% of the 2 wrong bill payments were made through bank branches. Additionally, although the two prominent problems (i.e., payments were not received from or by the customer) were experienced through various outlet types, the majority occurrence was via bank branches or ATMs. Some 3 of the 7 cases of customers’ payments not being received, and 5 of the 9 cases of monies being sent by another person but not received were transacted from within a bank branch. Mobile phone transactions were responsible for the 2 cases of monies not being accounted for. When it comes to identifying the type of customer affected by these problems, a disproportionately high share of vulnerable customers (relative to non-vulnerable customers) were affected by non-receipt-of-payment problems. Some 72% of payments never received were paid by vulnerable customers, while 78% of payments sent to the customer but never received were paid to vulnerable customers. Chart 28: No cash to withdraw (% of customers)
0%
2%
4%
6%
8%
Inside a bank branch
Mobile phone ATM Internet Other
Non-vulnerable Vulnerable
26
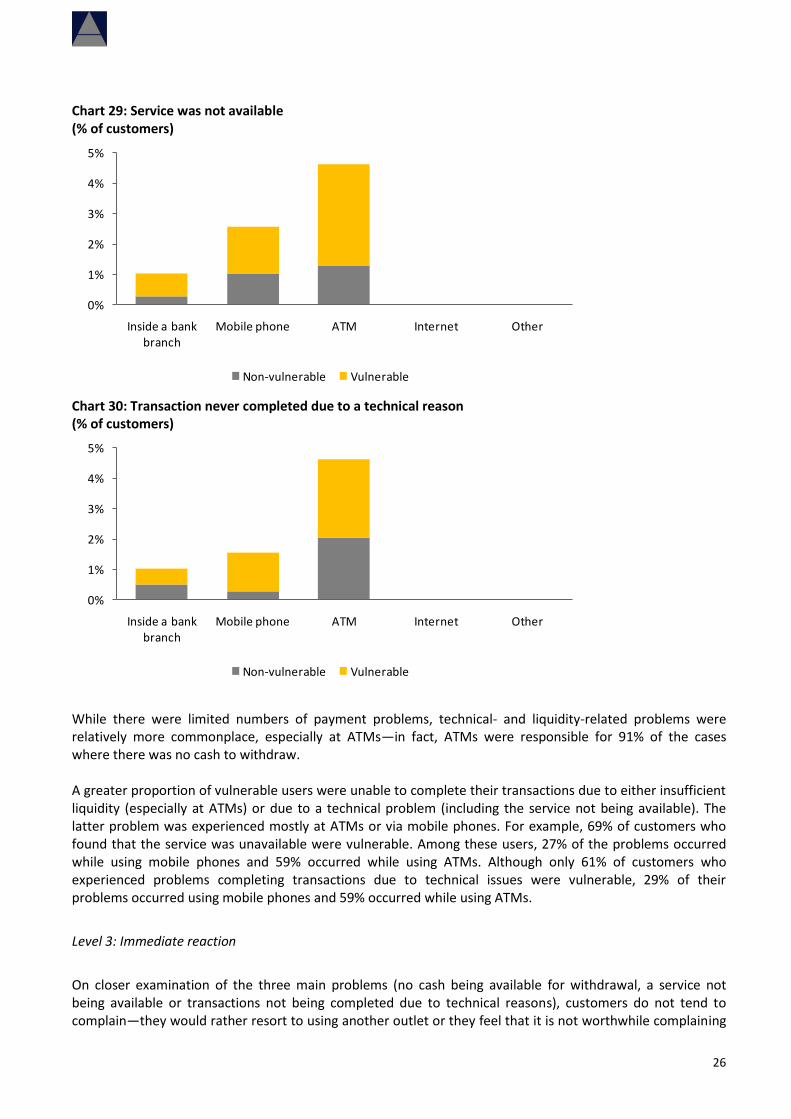
Chart 29: Service was not available (% of customers)
0%
1%
2%
3%
4%
5%
Inside a bank branch
Mobile phone ATM Internet Other
Non-vulnerable Vulnerable
Chart 30: Transaction never completed due to a technical reason (% of customers)
0%
1%
2%
3%
4%
5%
Inside a bank branch
Mobile phone ATM Internet Other
Non-vulnerable Vulnerable
While there were limited numbers of payment problems, technical- and liquidity-related problems were relatively more commonplace, especially at ATMs—in fact, ATMs were responsible for 91% of the cases where there was no cash to withdraw. A greater proportion of vulnerable users were unable to complete their transactions due to either insufficient liquidity (especially at ATMs) or due to a technical problem (including the service not being available). The latter problem was experienced mostly at ATMs or via mobile phones. For example, 69% of customers who found that the service was unavailable were vulnerable. Among these users, 27% of the problems occurred while using mobile phones and 59% occurred while using ATMs. Although only 61% of customers who experienced problems completing transactions due to technical issues were vulnerable, 29% of their problems occurred using mobile phones and 59% occurred while using ATMs.
Level 3: Immediate reaction
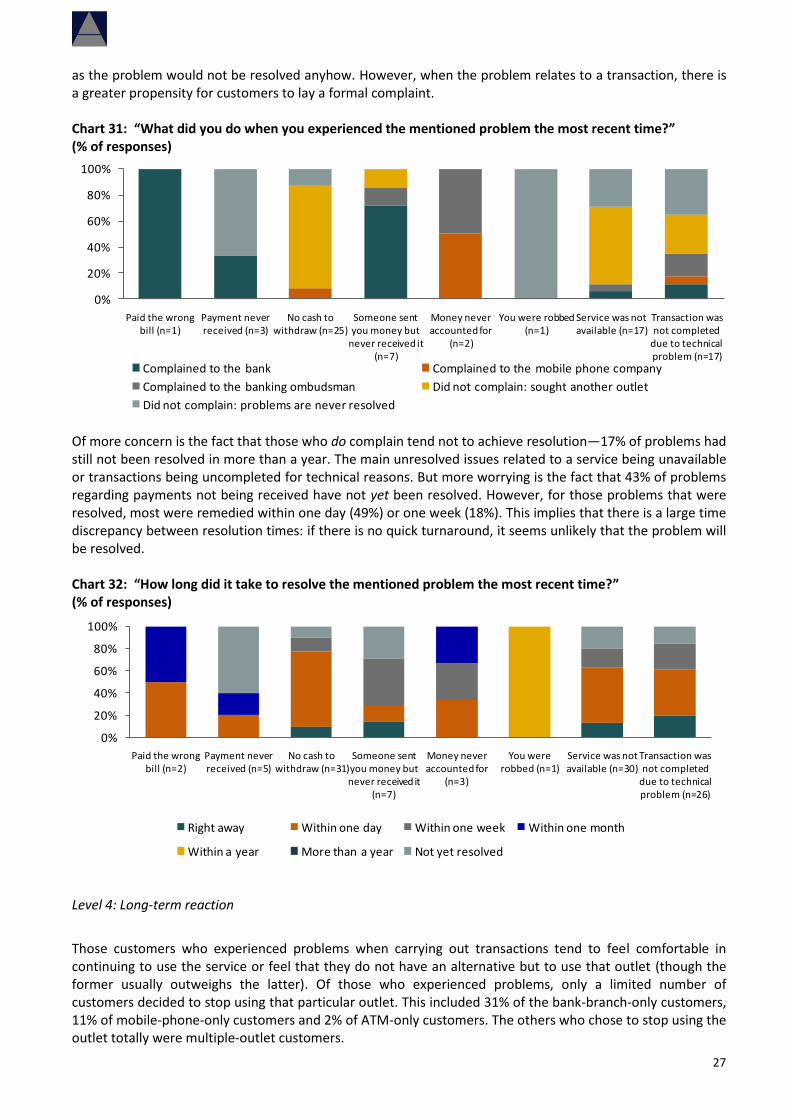
On closer examination of the three main problems (no cash being available for withdrawal, a service not being available or transactions not being completed due to technical reasons), customers do not tend to complain—they would rather resort to using another outlet or they feel that it is not worthwhile complaining
27
as the problem would not be resolved anyhow. However, when the problem relates to a transaction, there is a greater propensity for customers to lay a formal complaint. Chart 31: “What did you do when you experienced the mentioned problem the most recent time?” (% of responses)
0%
20%
40%
60%
80%
100%
Paid the wrong bill (n=1)
Payment never received (n=3)
No cash to withdraw (n=25)
Someone sent you money but
never received it (n=7)
Money never accounted for
(n=2)
You were robbed (n=1)
Service was not available (n=17)
Transaction was not completed
due to technical problem (n=17)
Complained to the bank Complained to the mobile phone company
Complained to the banking ombudsman Did not complain: sought another outlet
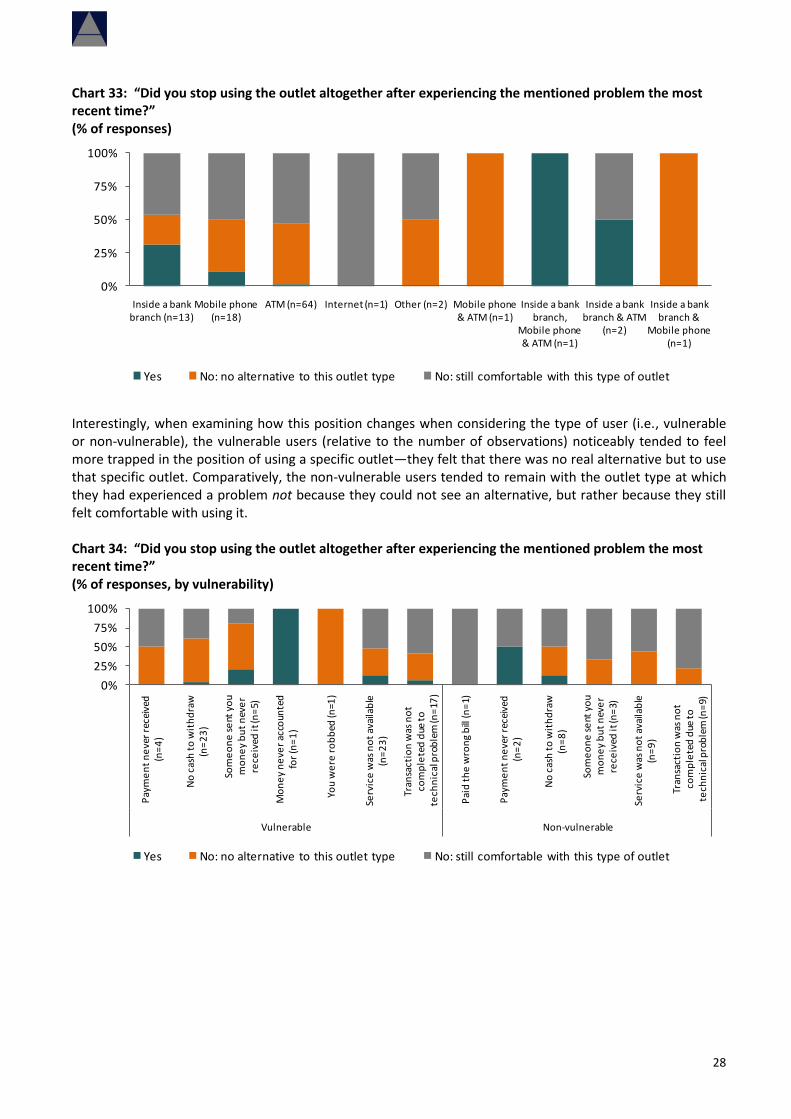
Did not complain: problems are never resolved Of more concern is the fact that those who do complain tend not to achieve resolution—17% of problems had still not been resolved in more than a year. The main unresolved issues related to a service being unavailable or transactions being uncompleted for technical reasons. But more worrying is the fact that 43% of problems regarding payments not being received have not yet been resolved. However, for those problems that were resolved, most were remedied within one day (49%) or one week (18%). This implies that there is a large time discrepancy between resolution times: if there is no quick turnaround, it seems unlikely that the problem will be resolved. Chart 32: “How long did it take to resolve the mentioned problem the most recent time?” (% of responses)
0%
20%
40%
60%
80%
100%
Paid the wrong bill (n=2)
Payment never received (n=5)
No cash to withdraw (n=31)
Someone sent you money but never received it
(n=7)
Money never accounted for
(n=3)
You were robbed (n=1)
Service was not available (n=30)
Transaction was not completed
due to technical problem (n=26)
Right away Within one day Within one week Within one month
Within a year More than a year Not yet resolved
Level 4: Long-term reaction
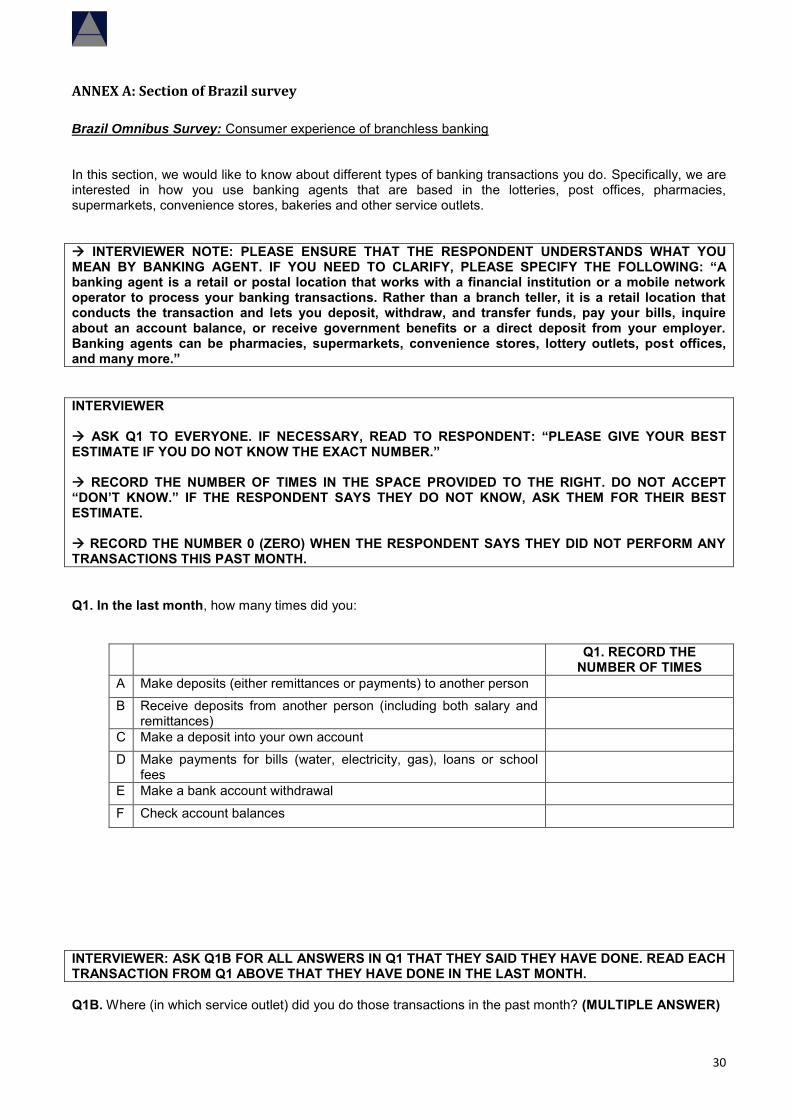
Those customers who experienced problems when carrying out transactions tend to feel comfortable in continuing to use the service or feel that they do not have an alternative but to use that outlet (though the former usually outweighs the latter). Of those who experienced problems, only a limited number of customers decided to stop using that particular outlet. This included 31% of the bank-branch-only customers, 11% of mobile-phone-only customers and 2% of ATM-only customers. The others who chose to stop using the outlet totally were multiple-outlet customers.
28
Chart 33: “Did you stop using the outlet altogether after experiencing the mentioned problem the most recent time?” (% of responses)
0%
25%
50%
75%
100%
Inside a bank branch (n=13)
Mobile phone (n=18)
ATM (n=64) Internet (n=1) Other (n=2) Mobile phone & ATM (n=1)
Inside a bank branch,
Mobile phone & ATM (n=1)
Inside a bank branch & ATM
(n=2)
Inside a bank branch &
Mobile phone (n=1)
Yes No: no alternative to this outlet type No: still comfortable with this type of outlet
Interestingly, when examining how this position changes when considering the type of user (i.e., vulnerable or non-vulnerable), the vulnerable users (relative to the number of observations) noticeably tended to feel more trapped in the position of using a specific outlet—they felt that there was no real alternative but to use that specific outlet. Comparatively, the non-vulnerable users tended to remain with the outlet type at which they had experienced a problem not because they could not see an alternative, but rather because they still felt comfortable with using it. Chart 34: “Did you stop using the outlet altogether after experiencing the mentioned problem the most recent time?” (% of responses, by vulnerability)
0%
25%
50%
75%
100%
Pay
me
nt
ne
ver
rece
ived
(n
=4
)
No
cas
h t
o w
ith
dra
w
(n=
23
)
Som
eo
ne
se
nt y
ou
mo
ne
y b
ut
nev
er
rece
ived
it (n
=5)
Mo
ne
y n
eve
r ac
coun
ted
fo
r (n
=1
)
You
we
re r
ob
bed
(n=1
)
Serv
ice
was
no
t av
aila
ble
(n
=2
3)
Tran
sact
ion
was
no
t co
mp
lete
d d
ue t
o
tech
nic
al p
rob
lem
(n=
17)
Pai
d t
he
wro
ng
bill
(n=
1)
Pay
me
nt
ne
ver
rece
ived
(n
=2
)
No
cas
h t
o w
ith
dra
w
(n=
8)
Som
eo
ne
se
nt y
ou
mo
ne
y b
ut
nev
er
rece
ived
it (n
=3)
Serv
ice
was
no
t av
aila
ble
(n
=9
)
Tran
sact
ion
was
no
t co
mp
lete
d d
ue t
o
tech
nic
al p
rob
lem
(n=
9)
Vulnerable Non-vulnerable
Yes No: no alternative to this outlet type No: still comfortable with this type of outlet

29
4. GATHERING MORE DATA: Creating an effective survey of consumer experience
The results of the above three surveys suggest that having a simple, comparable survey of clients of various branchless banking products across countries provides an essential check to ensure that customer experiences with these new services are providing additional choices in financial management. The comparability of these surveys is crucial, as being able to compare experiences across products and environments provides important benchmarks with which to interpret the results. It is also crucial to execute the survey as a comparison across all types of outlets—i.e., within a bank branch, ATM, internet, and other types of services—to provide an internal benchmark as well as an external one. Branchless banking services may or may not be created to improve financial inclusion, but certainly the poorest and most vulnerable are likely to make up a sizable percentage of the clientele. These clients, however, are also the most vulnerable in having the means to report on their experiences, and therefore appropriate minimum education and income levels should be found with which to identify the most vulnerable clientele and to segment experiences that might be happening disproportionately to them. Finally, understanding the consumer’s full experience—from the usage patterns that generate problems to seeing what the consumer does to rectify problems—should be included in the survey, in order to best understand and highlight how well the services are being included in the client’s financial life. One possible way of gathering such data in a cost-effective and consistent manner is to develop short questionnaires that can be deployed within the context of a national omnibus survey, such as that used in this report for the Brazil survey.
5. CONCLUSIONS
Generally, the news from these surveys is quite good, providing some evidence that policymakers can be sanguine in their concerns about protecting the consumers of branchless banking services. First, a range of branchless-banking services do appear to reach the most vulnerable population members. Usage patterns of mobile phone services in Kenya and South Africa range from transfers to making payments to saving. In Brazil, most of the transactions focused on bill payments. For most of these services and activities, people with low incomes and educations were a high percentage of the users. Second, it seems that most users have had very few problems with the services. In comparison with other outlets, channels for transferring money or even saving, branchless banking users have experienced fewer problems and less loss of money. Liquidity is the most frequently-cited problem but also the most easily fixed. Most users report that they simply go to another outlet when they find their agent without cash. This problem does not appear to be creating a shift away from the service. There is, however, mixed evidence of whether consumers know where or how to complain. In Brazil, consumers seem to not know how to seek redress of problems. In Kenya, the opposite is true—respondents seem to know exactly how to address their problems and how long they will take to fix. This suggests that regulators should put their attention on ensuring clear forms of redress for consumers, and to following up on whether complaints are resolved within a reasonable amount of time. It also suggests that having a means of continuously checking on problems for which consumers are not formally registering complaints is crucial. Nonetheless, users of branchless banking services appear to be ready to use them over the long term. Most users report that services are at least as secure as the bank branch or ATM, if not more secure. This suggests that branchless banking may not only be the way in which poor consumers are brought into the formal financial system, but where they also learn to blend it seamlessly into their financial lives.
30
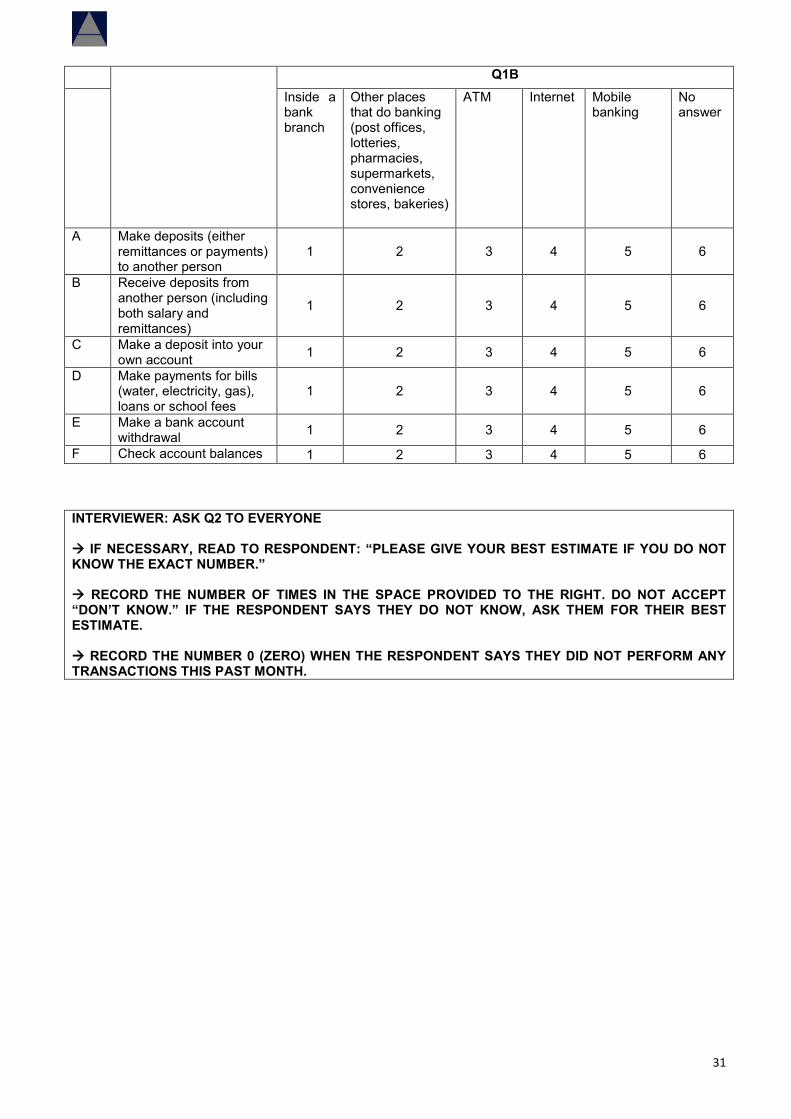
ANNEX A: Section of Brazil survey
Brazil Omnibus Survey: Consumer experience of branchless banking In this section, we would like to know about different types of banking transactions you do. Specifically, we are interested in how you use banking agents that are based in the lotteries, post offices, pharmacies, supermarkets, convenience stores, bakeries and other service outlets. INTERVIEWER NOTE: PLEASE ENSURE THAT THE RESPONDENT UNDERSTANDS WHAT YOU MEAN BY BANKING AGENT. IF YOU NEED TO CLARIFY, PLEASE SPECIFY THE FOLLOWING: “A banking agent is a retail or postal location that works with a financial institution or a mobile network operator to process your banking transactions. Rather than a branch teller, it is a retail location that conducts the transaction and lets you deposit, withdraw, and transfer funds, pay your bills, inquire about an account balance, or receive government benefits or a direct deposit from your employer. Banking agents can be pharmacies, supermarkets, convenience stores, lottery outlets, post offices, and many more.”
INTERVIEWER ASK Q1 TO EVERYONE. IF NECESSARY, READ TO RESPONDENT: “PLEASE GIVE YOUR BEST ESTIMATE IF YOU DO NOT KNOW THE EXACT NUMBER.” RECORD THE NUMBER OF TIMES IN THE SPACE PROVIDED TO THE RIGHT. DO NOT ACCEPT “DON’T KNOW.” IF THE RESPONDENT SAYS THEY DO NOT KNOW, ASK THEM FOR THEIR BEST ESTIMATE. RECORD THE NUMBER 0 (ZERO) WHEN THE RESPONDENT SAYS THEY DID NOT PERFORM ANY TRANSACTIONS THIS PAST MONTH. Q1. In the last month, how many times did you:
Q1. RECORD THE NUMBER OF TIMES
A Make deposits (either remittances or payments) to another person
B Receive deposits from another person (including both salary and remittances)
C Make a deposit into your own account
D Make payments for bills (water, electricity, gas), loans or school fees
E Make a bank account withdrawal
F Check account balances
INTERVIEWER: ASK Q1B FOR ALL ANSWERS IN Q1 THAT THEY SAID THEY HAVE DONE. READ EACH TRANSACTION FROM Q1 ABOVE THAT THEY HAVE DONE IN THE LAST MONTH. Q1B. Where (in which service outlet) did you do those transactions in the past month? (MULTIPLE ANSWER)
31
Q1B Inside a
bank branch
Other places that do banking (post offices, lotteries, pharmacies, supermarkets, convenience stores, bakeries)
ATM Internet Mobile banking
No answer
A Make deposits (either remittances or payments) to another person
1 2 3 4 5 6
B Receive deposits from another person (including both salary and remittances)
1 2 3 4 5 6
C Make a deposit into your own account 1 2 3 4 5 6
D Make payments for bills (water, electricity, gas), loans or school fees
1 2 3 4 5 6
E Make a bank account withdrawal 1 2 3 4 5 6
F Check account balances 1 2 3 4 5 6
INTERVIEWER: ASK Q2 TO EVERYONE IF NECESSARY, READ TO RESPONDENT: “PLEASE GIVE YOUR BEST ESTIMATE IF YOU DO NOT KNOW THE EXACT NUMBER.” RECORD THE NUMBER OF TIMES IN THE SPACE PROVIDED TO THE RIGHT. DO NOT ACCEPT “DON’T KNOW.” IF THE RESPONDENT SAYS THEY DO NOT KNOW, ASK THEM FOR THEIR BEST ESTIMATE. RECORD THE NUMBER 0 (ZERO) WHEN THE RESPONDENT SAYS THEY DID NOT PERFORM ANY TRANSACTIONS THIS PAST MONTH.
32
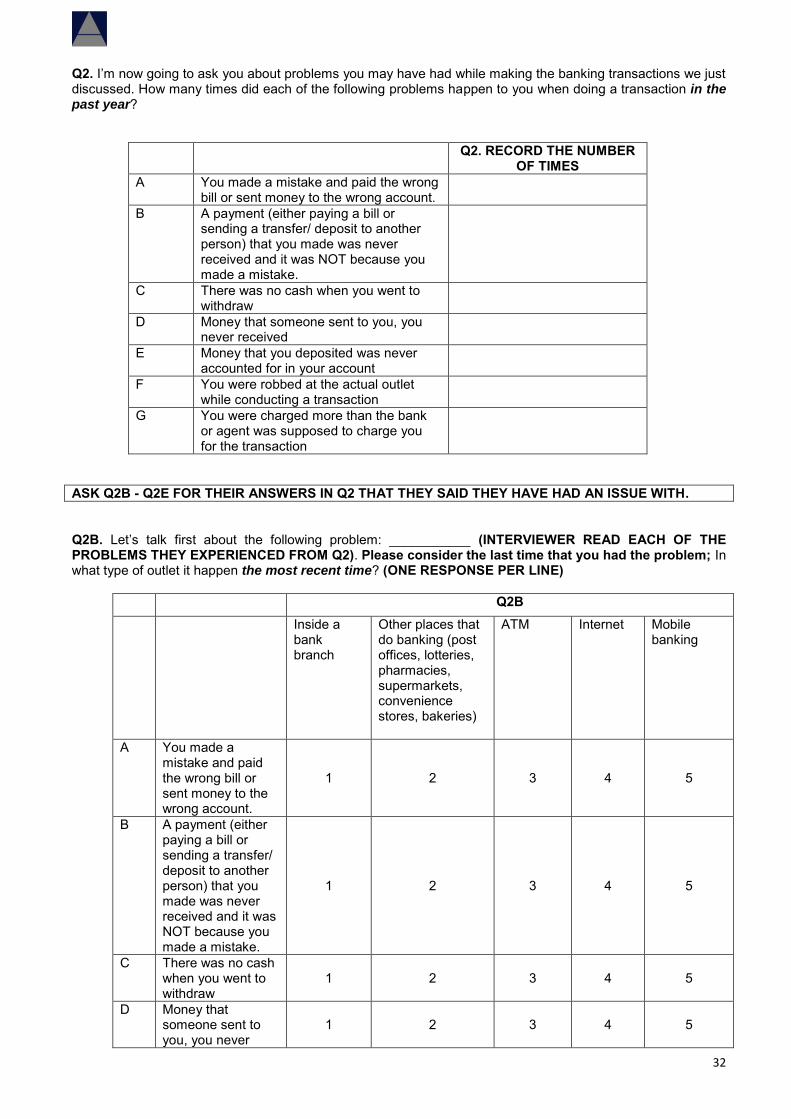
Q2. I’m now going to ask you about problems you may have had while making the banking transactions we just discussed. How many times did each of the following problems happen to you when doing a transaction in the past year?
Q2. RECORD THE NUMBER OF TIMES
A You made a mistake and paid the wrong bill or sent money to the wrong account.
B A payment (either paying a bill or sending a transfer/ deposit to another person) that you made was never received and it was NOT because you made a mistake.
C There was no cash when you went to withdraw
D Money that someone sent to you, you never received
E Money that you deposited was never accounted for in your account
F You were robbed at the actual outlet while conducting a transaction
G You were charged more than the bank or agent was supposed to charge you for the transaction
ASK Q2B - Q2E FOR THEIR ANSWERS IN Q2 THAT THEY SAID THEY HAVE HAD AN ISSUE WITH. Q2B. Let’s talk first about the following problem: ___________ (INTERVIEWER READ EACH OF THE PROBLEMS THEY EXPERIENCED FROM Q2). Please consider the last time that you had the problem; In what type of outlet it happen the most recent time? (ONE RESPONSE PER LINE)
Q2B Inside a
bank branch
Other places that do banking (post offices, lotteries, pharmacies, supermarkets, convenience stores, bakeries)
ATM Internet Mobile banking
A You made a mistake and paid the wrong bill or sent money to the wrong account.
1 2 3 4 5
B A payment (either paying a bill or sending a transfer/ deposit to another person) that you made was never received and it was NOT because you made a mistake.
1 2 3 4 5
C There was no cash when you went to withdraw
1 2 3 4 5
D Money that someone sent to you, you never
1 2 3 4 5
33
received
E Money that you deposited was never accounted for in your account
1 2 3 4 5
F You were robbed at the actual outlet while conducting a transaction
1 2 3 4 5
G You were charged more than the bank or agent was supposed to charge you for the transaction
1 2 3 4 5
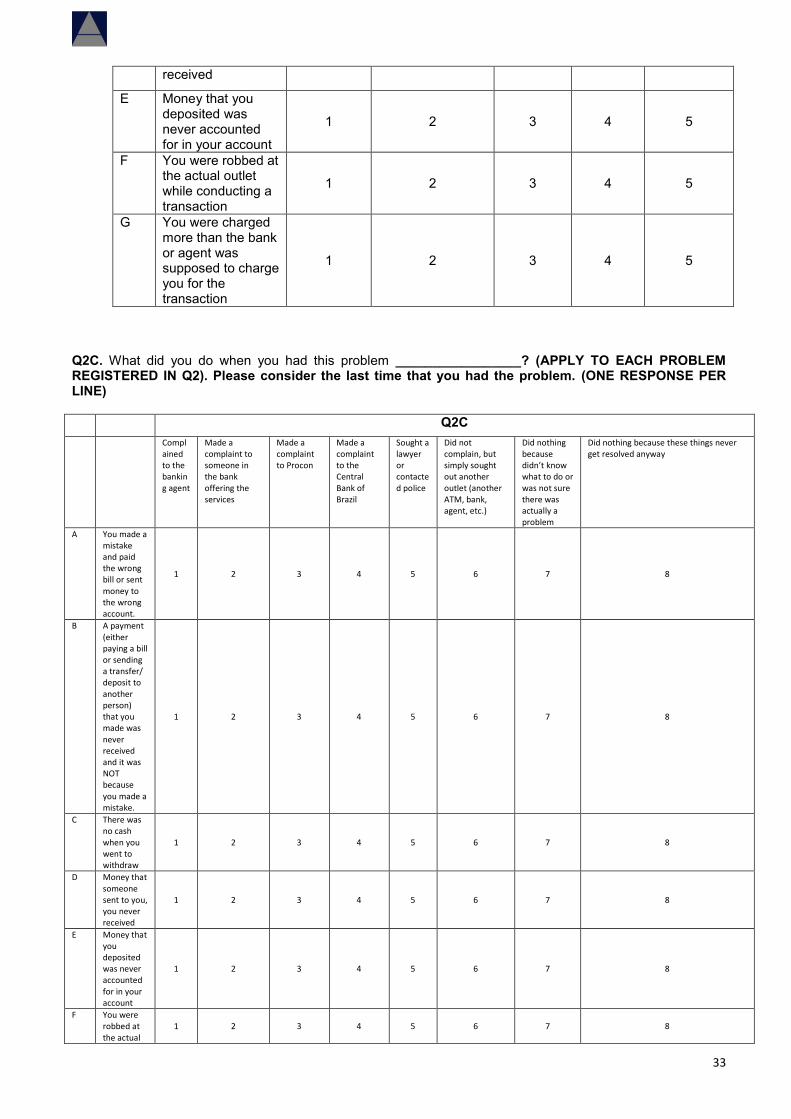
Q2C. What did you do when you had this problem _________________? (APPLY TO EACH PROBLEM REGISTERED IN Q2). Please consider the last time that you had the problem. (ONE RESPONSE PER LINE) Q2C Compl
ained to the banking agent
Made a complaint to someone in the bank offering the services
Made a complaint to Procon
Made a complaint to the Central Bank of Brazil
Sought a lawyer or contacted police
Did not complain, but simply sought out another outlet (another ATM, bank, agent, etc.)
Did nothing because didn’t know what to do or was not sure there was actually a problem
Did nothing because these things never get resolved anyway
A You made a mistake and paid the wrong bill or sent money to the wrong account.
1 2 3 4 5 6 7 8
B A payment (either paying a bill or sending a transfer/ deposit to another person) that you made was never received and it was NOT because you made a mistake.
1 2 3 4 5 6 7 8
C There was no cash when you went to withdraw
1 2 3 4 5 6 7 8
D Money that someone sent to you, you never received
1 2 3 4 5 6 7 8
E Money that you deposited was never accounted for in your account
1 2 3 4 5 6 7 8
F You were robbed at the actual
1 2 3 4 5 6 7 8
34
outlet while conducting a transaction
G You were charged more than the bank or agent was supposed to charge you for the transaction
1 2 3 4 5 6 7 8
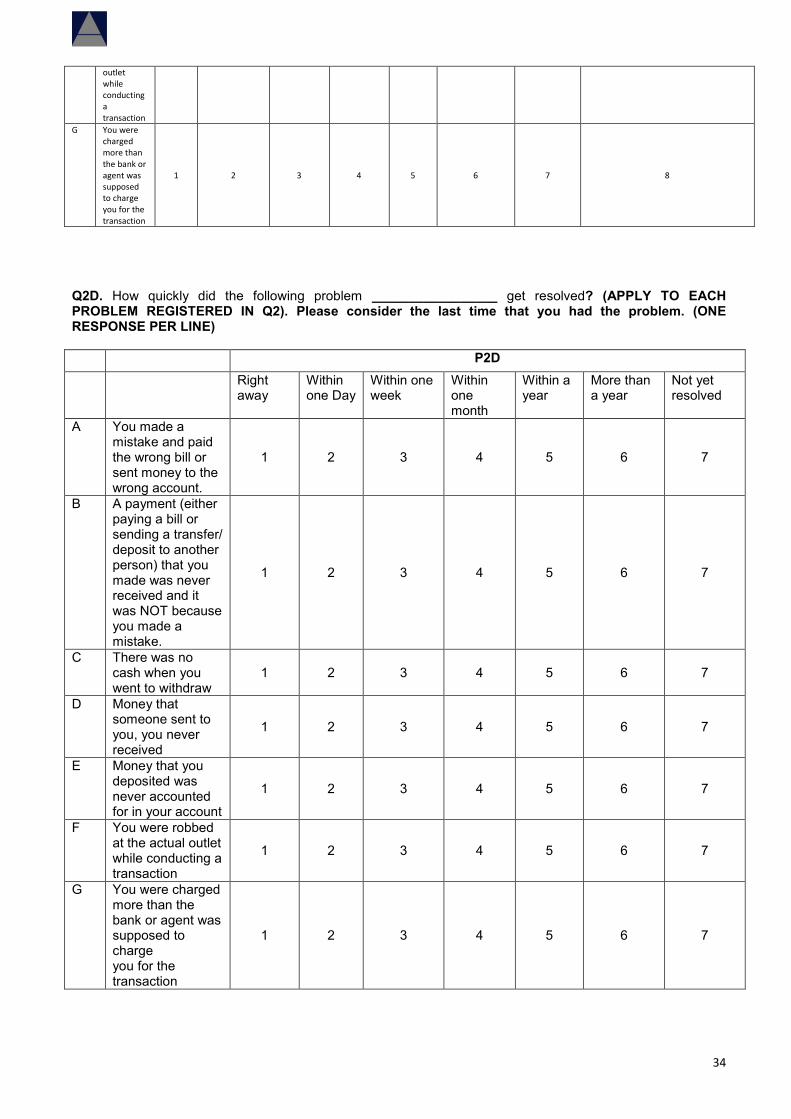
Q2D. How quickly did the following problem _________________ get resolved? (APPLY TO EACH PROBLEM REGISTERED IN Q2). Please consider the last time that you had the problem. (ONE RESPONSE PER LINE) P2D Right
away Within one Day
Within one week
Within one month
Within a year
More than a year
Not yet resolved
A You made a mistake and paid the wrong bill or sent money to the wrong account.
1 2 3 4 5 6 7
B A payment (either paying a bill or sending a transfer/ deposit to another person) that you made was never received and it was NOT because you made a mistake.
1 2 3 4 5 6 7
C There was no cash when you went to withdraw
1 2 3 4 5 6 7
D Money that someone sent to you, you never received
1 2 3 4 5 6 7
E Money that you deposited was never accounted for in your account
1 2 3 4 5 6 7
F You were robbed at the actual outlet while conducting a transaction
1 2 3 4 5 6 7
G You were charged more than the bank or agent was supposed to charge you for the transaction
1 2 3 4 5 6 7
35
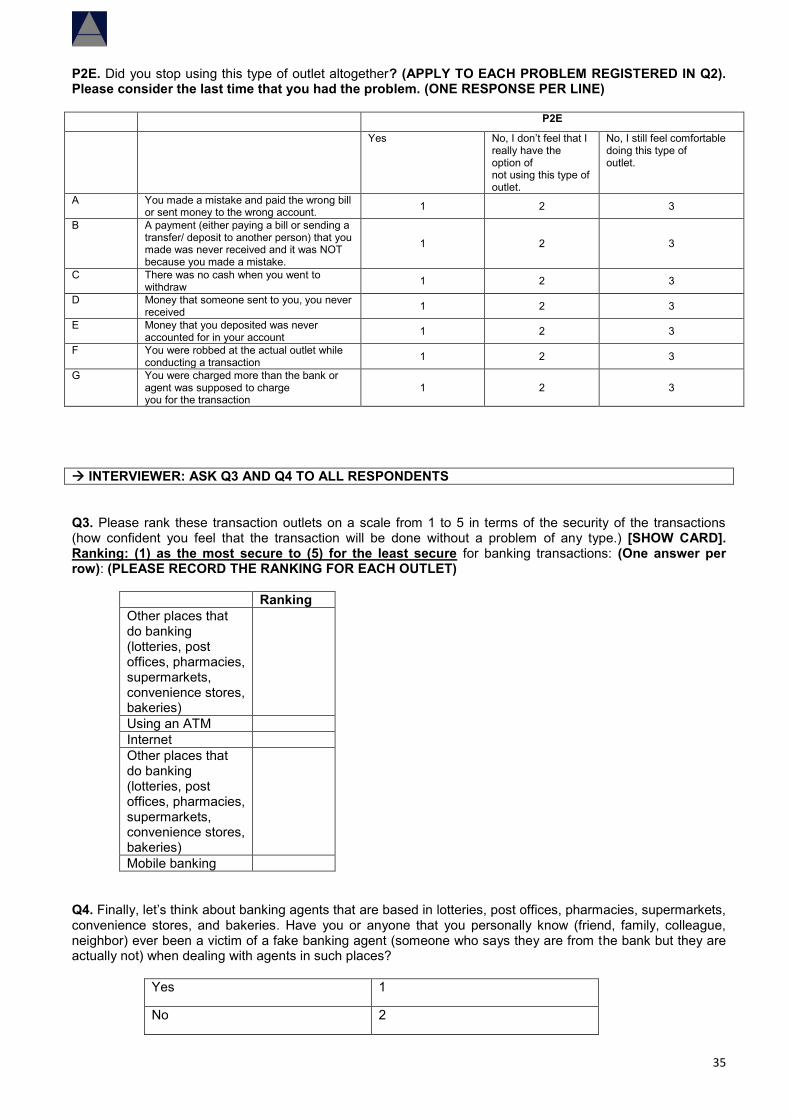
P2E. Did you stop using this type of outlet altogether? (APPLY TO EACH PROBLEM REGISTERED IN Q2). Please consider the last time that you had the problem. (ONE RESPONSE PER LINE) P2E
Yes No, I don’t feel that I really have the option of not using this type of outlet.
No, I still feel comfortable doing this type of outlet.
A You made a mistake and paid the wrong bill or sent money to the wrong account. 1 2 3
B A payment (either paying a bill or sending a transfer/ deposit to another person) that you made was never received and it was NOT because you made a mistake.
1 2 3
C There was no cash when you went to withdraw 1 2 3
D Money that someone sent to you, you never received 1 2 3
E Money that you deposited was never accounted for in your account 1 2 3
F You were robbed at the actual outlet while conducting a transaction 1 2 3
G You were charged more than the bank or agent was supposed to charge you for the transaction
1 2 3
INTERVIEWER: ASK Q3 AND Q4 TO ALL RESPONDENTS Q3. Please rank these transaction outlets on a scale from 1 to 5 in terms of the security of the transactions (how confident you feel that the transaction will be done without a problem of any type.) [SHOW CARD]. Ranking: (1) as the most secure to (5) for the least secure for banking transactions: (One answer per row): (PLEASE RECORD THE RANKING FOR EACH OUTLET)
Ranking Other places that do banking (lotteries, post offices, pharmacies, supermarkets, convenience stores, bakeries)
Using an ATM Internet Other places that do banking (lotteries, post offices, pharmacies, supermarkets, convenience stores, bakeries)
Mobile banking Q4. Finally, let’s think about banking agents that are based in lotteries, post offices, pharmacies, supermarkets, convenience stores, and bakeries. Have you or anyone that you personally know (friend, family, colleague, neighbor) ever been a victim of a fake banking agent (someone who says they are from the bank but they are actually not) when dealing with agents in such places?
Yes 1
No 2
36
ANNEX B: Section of South Africa Wizzit survey
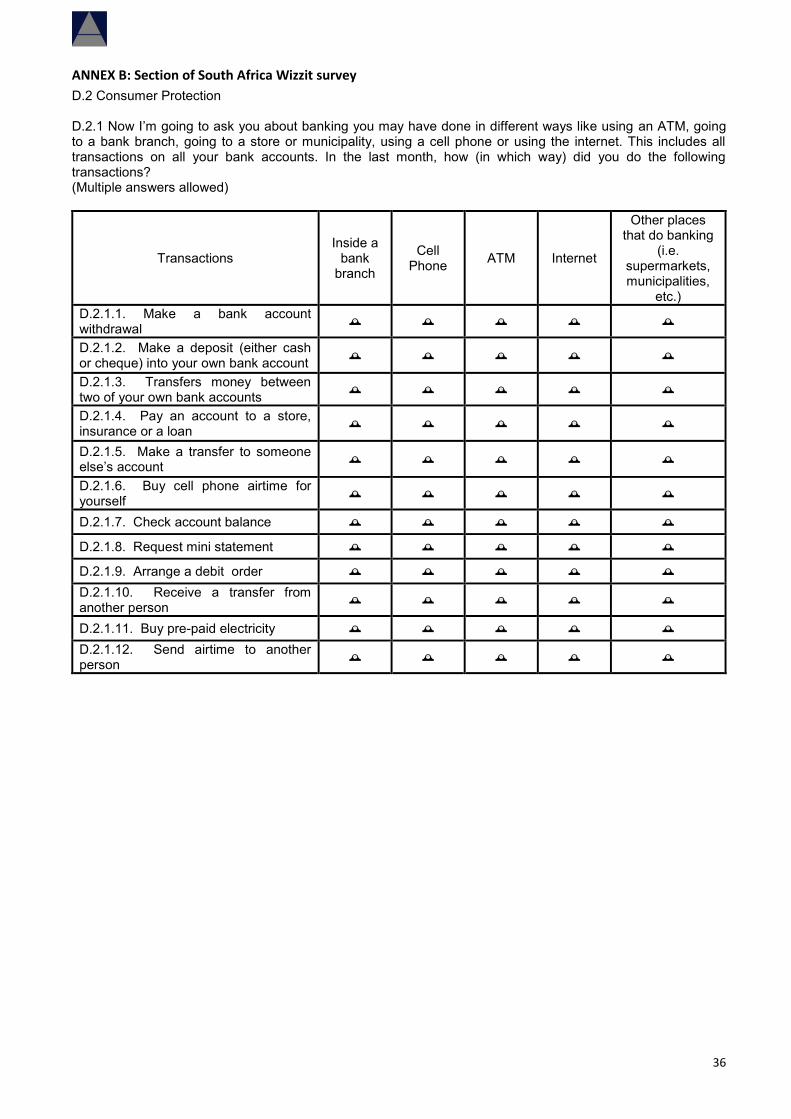
D.2 Consumer Protection D.2.1 Now I’m going to ask you about banking you may have done in different ways like using an ATM, going to a bank branch, going to a store or municipality, using a cell phone or using the internet. This includes all transactions on all your bank accounts. In the last month, how (in which way) did you do the following transactions? (Multiple answers allowed)
Transactions Inside a
bank branch
Cell Phone ATM Internet
Other places that do banking
(i.e. supermarkets, municipalities,
etc.) D.2.1.1. Make a bank account withdrawal
D.2.1.2. Make a deposit (either cash or cheque) into your own bank account
D.2.1.3. Transfers money between two of your own bank accounts
D.2.1.4. Pay an account to a store, insurance or a loan
D.2.1.5. Make a transfer to someone else’s account
D.2.1.6. Buy cell phone airtime for yourself
D.2.1.7. Check account balance
D.2.1.8. Request mini statement
D.2.1.9. Arrange a debit order D.2.1.10. Receive a transfer from another person
D.2.1.11. Buy pre-paid electricity D.2.1.12. Send airtime to another person
37
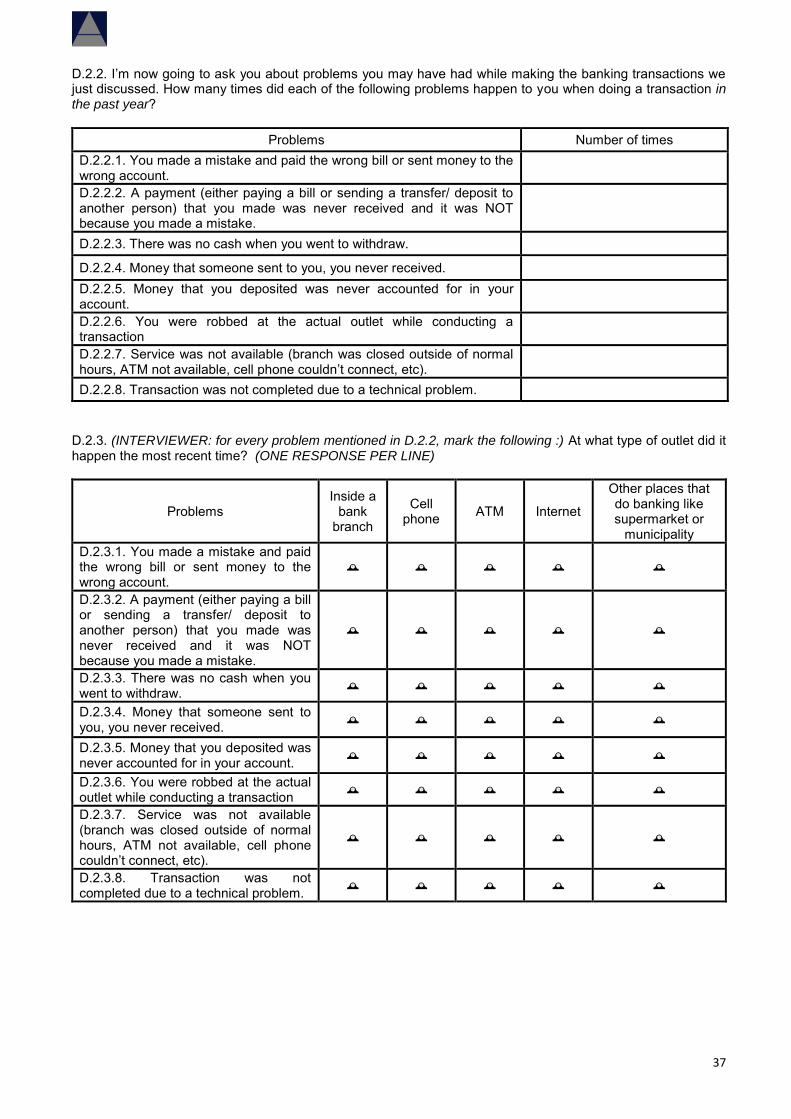
D.2.2. I’m now going to ask you about problems you may have had while making the banking transactions we just discussed. How many times did each of the following problems happen to you when doing a transaction in the past year?
Problems Number of times D.2.2.1. You made a mistake and paid the wrong bill or sent money to the wrong account.
D.2.2.2. A payment (either paying a bill or sending a transfer/ deposit to another person) that you made was never received and it was NOT because you made a mistake.
D.2.2.3. There was no cash when you went to withdraw.
D.2.2.4. Money that someone sent to you, you never received.
D.2.2.5. Money that you deposited was never accounted for in your account.
D.2.2.6. You were robbed at the actual outlet while conducting a transaction
D.2.2.7. Service was not available (branch was closed outside of normal hours, ATM not available, cell phone couldn’t connect, etc).
D.2.2.8. Transaction was not completed due to a technical problem.
D.2.3. (INTERVIEWER: for every problem mentioned in D.2.2, mark the following :) At what type of outlet did it happen the most recent time? (ONE RESPONSE PER LINE)
Problems Inside a
bank branch
Cell
phone
ATM Internet Other places that do banking like supermarket or
municipality D.2.3.1. You made a mistake and paid the wrong bill or sent money to the wrong account.
D.2.3.2. A payment (either paying a bill or sending a transfer/ deposit to another person) that you made was never received and it was NOT because you made a mistake.
D.2.3.3. There was no cash when you went to withdraw.
D.2.3.4. Money that someone sent to you, you never received.
D.2.3.5. Money that you deposited was never accounted for in your account.
D.2.3.6. You were robbed at the actual outlet while conducting a transaction
D.2.3.7. Service was not available (branch was closed outside of normal hours, ATM not available, cell phone couldn’t connect, etc).
D.2.3.8. Transaction was not completed due to a technical problem.
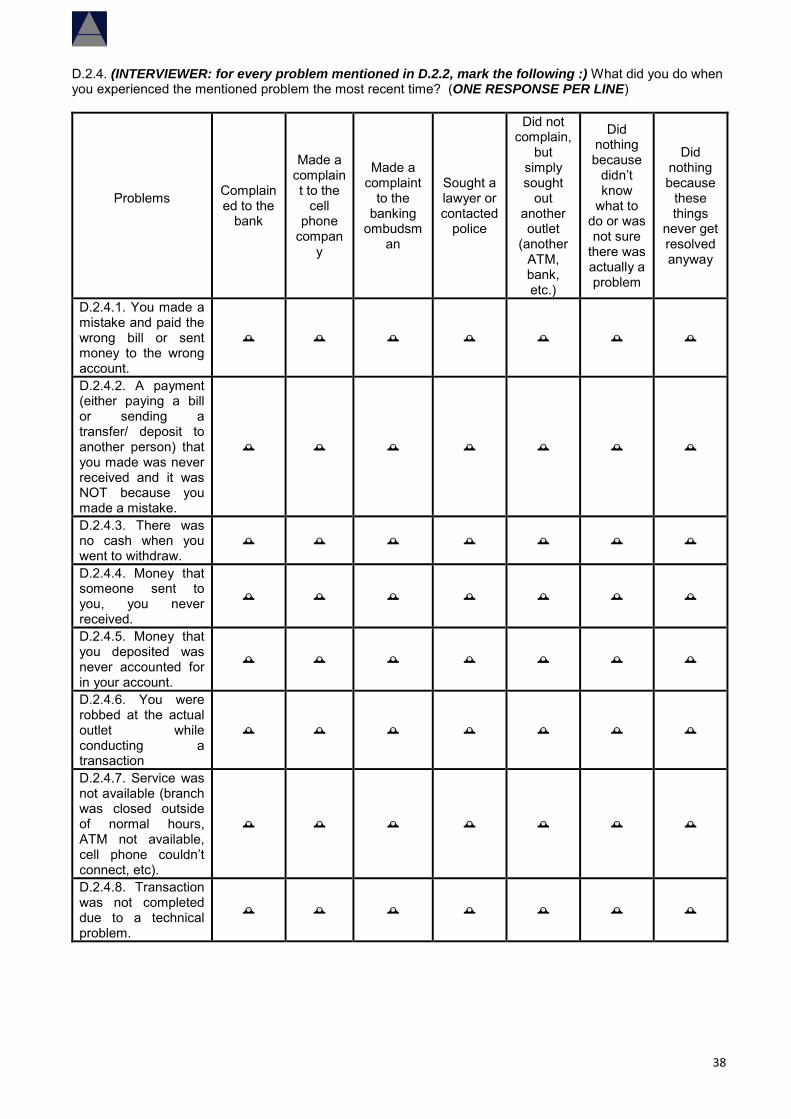
38
D.2.4. (INTERVIEWER: for every problem mentioned in D.2.2, mark the following :) What did you do when you experienced the mentioned problem the most recent time? (ONE RESPONSE PER LINE)
Problems
Complained to the
bank
Made a complaint to the
cell phone
company
Made a complaint
to the banking
ombudsman
Sought a lawyer or contacted
police
Did not complain,
but simply sought
out another outlet
(another ATM, bank, etc.)
Did nothing because
didn’t know
what to do or was not sure
there was actually a problem
Did nothing because
these things
never get resolved anyway
D.2.4.1. You made a mistake and paid the wrong bill or sent money to the wrong account.
D.2.4.2. A payment (either paying a bill or sending a transfer/ deposit to another person) that you made was never received and it was NOT because you made a mistake.
D.2.4.3. There was no cash when you went to withdraw.
D.2.4.4. Money that someone sent to you, you never received.
D.2.4.5. Money that you deposited was never accounted for in your account.
D.2.4.6. You were robbed at the actual outlet while conducting a transaction
D.2.4.7. Service was not available (branch was closed outside of normal hours, ATM not available, cell phone couldn’t connect, etc).
D.2.4.8. Transaction was not completed due to a technical problem.
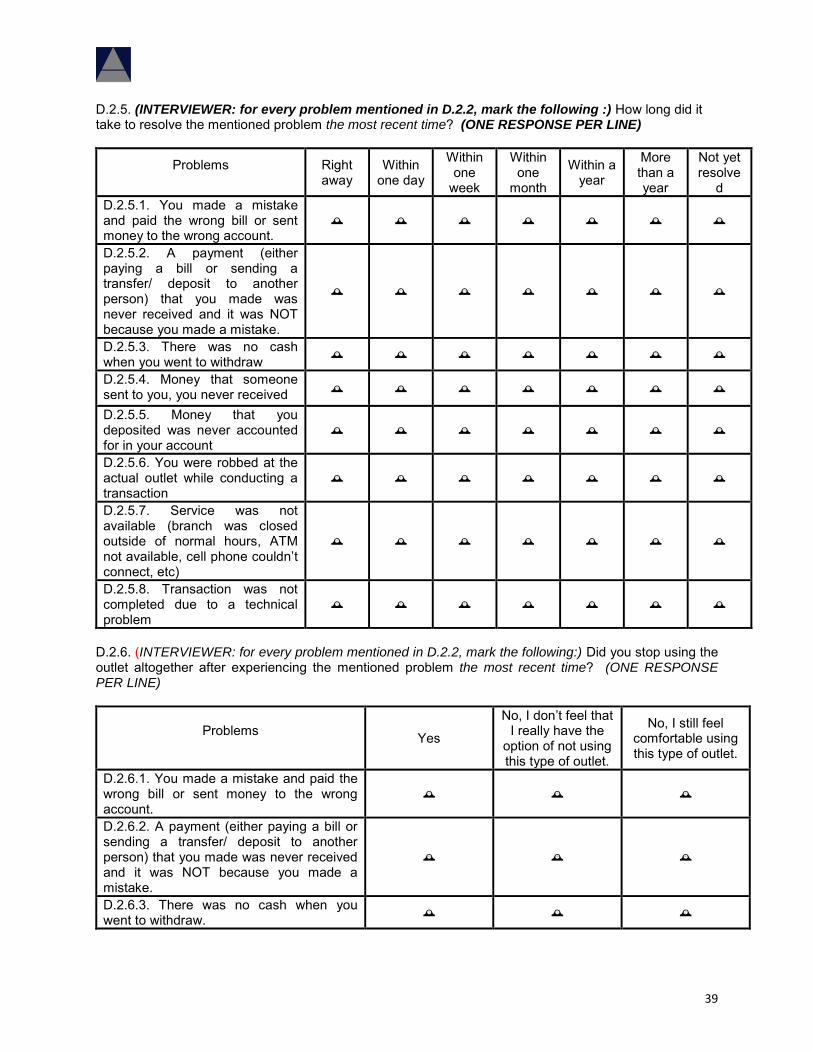
39
D.2.5. (INTERVIEWER: for every problem mentioned in D.2.2, mark the following :) How long did it take to resolve the mentioned problem the most recent time? (ONE RESPONSE PER LINE)
Problems
Right away
Within one day
Within one
week
Within one
month
Within a year
More than a year
Not yet resolve
d D.2.5.1. You made a mistake and paid the wrong bill or sent money to the wrong account.
D.2.5.2. A payment (either paying a bill or sending a transfer/ deposit to another person) that you made was never received and it was NOT because you made a mistake.
D.2.5.3. There was no cash when you went to withdraw
D.2.5.4. Money that someone sent to you, you never received
D.2.5.5. Money that you deposited was never accounted for in your account
D.2.5.6. You were robbed at the actual outlet while conducting a transaction
D.2.5.7. Service was not available (branch was closed outside of normal hours, ATM not available, cell phone couldn’t connect, etc)
D.2.5.8. Transaction was not completed due to a technical problem
D.2.6. (INTERVIEWER: for every problem mentioned in D.2.2, mark the following:) Did you stop using the outlet altogether after experiencing the mentioned problem the most recent time? (ONE RESPONSE PER LINE)
Problems Yes
No, I don’t feel that I really have the
option of not using this type of outlet.
No, I still feel comfortable using this type of outlet.
D.2.6.1. You made a mistake and paid the wrong bill or sent money to the wrong account.
D.2.6.2. A payment (either paying a bill or sending a transfer/ deposit to another person) that you made was never received and it was NOT because you made a mistake.
D.2.6.3. There was no cash when you went to withdraw.
40
Problems Yes
No, I don’t feel that I really have the
option of not using this type of outlet.
No, I still feel comfortable using this type of outlet.
D.2.6.4. Money that someone sent to you, you never received.
D.2.6.5. Money that you deposited was never accounted for in your account.
D.2.6.6. You were robbed at the actual outlet while conducting a transaction.
D.2.6.7. Service was not available (branch was closed outside of normal hours, ATM not available, cell phone couldn’t connect, etc).
D.2.6.8. Transaction was not completed due to a technical problem.
D.2.7. Please rank these transaction outlets on a scale from 1 to 5 in terms of the security of the transactions (how confident you feel that the transaction will be done without a problem of any type.) The ranking means: (1) as the most secure to (5) for the least secure for banking transactions. (ONE RESPONSE PER ROW - PLEASE RECORD THE RANKING FOR EACH OUTLET)
Ranking
D.2.7.1 Inside the bank branch
D.2.7.2. Using an ATM
D.2.7.3. Internet
D.2.7.4. Using a cell phone
D.2.7.5. Other places that do banking like a store or municipality
D.2.8. How many people know your pin code for your ATM or Wizzit account?
D.2.9. Who knows your pin code? List all that apply
D.2.9.1. Only me
D.2.9.2. My closest family (spouse, children, parents)
D.2.9.3. My friends
D.2.9.4. Work colleagues
D.2.9.5. People who help me do transactions (i.e. people in bank branches, or agents)
41
D.2.10. Do you believe the following statements to be true or false? TRUE FALSE
D.2.10.1. I should never reveal my pin, except to a teller at my bank.
D.2.10.2. If I lose my card, my money is still safe because no one knows my pin.
D.2.10.3. A good way to remember your pin is to write it on a paper and keep it with your card.
D.2.10.4. It is very difficult for someone to get both your card and your pin.
Yes No
D.2.11. Do you know which bank Wizzit is associated with?
D.2.12. If yes, which bank is it?
Yes No
D.2.13. Do you know who to call if you have a problem with the service?
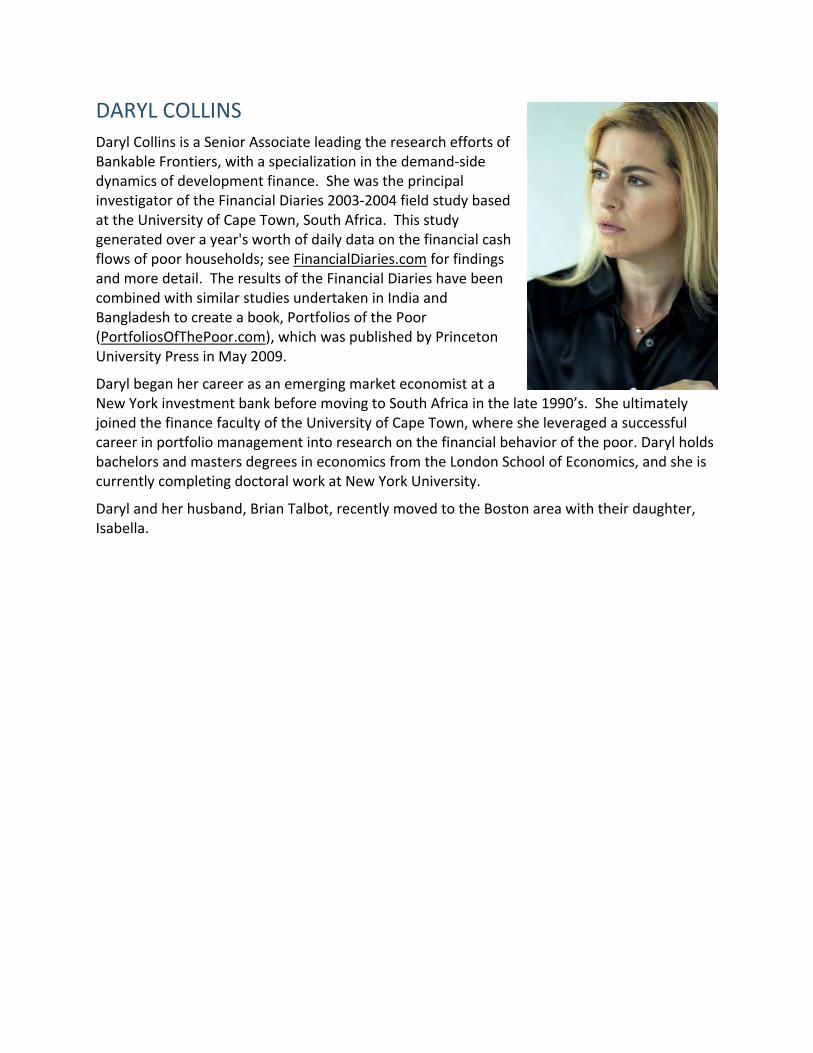
DARYL COLLINS
Daryl Collins is a Senior Associate leading the research efforts of Bankable Frontiers, with a specialization in the demand‐side dynamics of development finance. She was the principal investigator of the Financial Diaries 2003‐2004 field study based at the University of Cape Town, South Africa. This study generated over a year's worth of daily data on the financial cash flows of poor households; see FinancialDiaries.com for findings and more detail. The results of the Financial Diaries have been combined with similar studies undertaken in India and Bangladesh to create a book, Portfolios of the Poor (PortfoliosOfThePoor.com), which was published by Princeton University Press in May 2009.
Daryl began her career as an emerging market economist at a New York investment bank before moving to South Africa in the late 1990’s. She ultimately joined the finance faculty of the University of Cape Town, where she leveraged a successful career in portfolio management into research on the financial behavior of the poor. Daryl holds bachelors and masters degrees in economics from the London School of Economics, and she is currently completing doctoral work at New York University.
Daryl and her husband, Brian Talbot, recently moved to the Boston area with their daughter, Isabella.