Consumer Discretionary Sector Presentation May 5, 2009 Diego Benavente, Matt Berkowitz, Conrad...
25
Consumer Discretionary Sector Presentation May 5, 2009 Diego Benavente, Matt Berkowitz, Conrad Bowman, Julie McGrover
-
Upload
emery-lamb -
Category
Documents
-
view
214 -
download
0
Transcript of Consumer Discretionary Sector Presentation May 5, 2009 Diego Benavente, Matt Berkowitz, Conrad...

Consumer Discretionary Sector Presentation
May 5, 2009
Diego Benavente, Matt Berkowitz, Conrad Bowman, Julie McGrover

Agenda
Sector Overview
Business Analysis
Economic Analysis
Financial Analysis
Valuation Analysis
Recommendation

Sector in relation to S&P 500
7th largest

Sector Performance YTD & 10 Years

Top 10 Companies in Sector

Top 5 - 12 Month Returns
Industry 1 mth 3 mths 6 mths 12 mths 5 yrs IncludesCASINOS & GAMING 7.7% 15.9% 15.0% 3.2% 27.5% Intl Game Technology, Wynn Resorts LtdRESTAURANTS 20.4% 33.2% 32.3% -4.2% 8.3% Darden Restaurants, McDonald's, Starbucks, Yum! BrandsSPECIALTY STORES 22.0% 54.5% 36.6% -6.8% -3.7% Office Depot Inc, Staples, Tiffany & CoPUBLISHING 15.3% 21.2% 4.8% -13.2% -5.0% Gannett Co, Meredith, McGraw-Hill, NY Times, Washington PostMOVIES & ENTMT 35.2% 27.6% 21.9% -13.5% 7.8% Walt Disney, News Corporation, Time Warner, Viacom Inc
Bottom 5 - 12 Month ReturnsIndustry
Industry 1 mth 3 mths 6 mths 12 mths 5 yrsEDUCATION SERVICES 97.7% 19.9% -28.1% -79.6% -85.0% Apollo Group IncRETAIL-INTERNET 14.4% -4.8% -20.2% -67.8% -78.0% Amazon.com Inc, ExpediaHOMEFURNISHING RETL 83.3% 24.0% -24.2% -65.8% -68.0% Bed Bath & Beyond IncBROADCASTING 30.0% -42.3% -45.1% -61.6% - CBS Corp BAUTOMOTIVE RETAIL 41.4% 2.7% -30.6% -54.9% -37.0% AutoNation Inc, AutoZone, O'Reilly Automotive
Total Return % Change
Total Return % Change
Business Analysis – Sector Composition
Industries within Consumer Discretionary Sector: source: Baseline
ADVERTISING CASINOS & GAMING GENERAL MERCHANDISE LEISURE PRODUCTS RETAIL-APPARELAPPAREL & ACCESSORY CONSUMER ELECTRONICS HOMEBUILDING MOTORCYCLE MFRS RETAIL-COMP/ELECTRNAUTO PARTS & EQUIP DEPARTMENT STORES HOMEFURNISHING RETL MOVIES & ENTMT RETAIL-HOME IMPROVEAUTOMOBILE MFRS DISTRIBUTORS HOTEL/RESORT/CRUISE PHOTOGRAPHIC PRODS SPECIAL CONSM SERVAUTOMOTIVE RETAIL EDUCATION SERVICES HOUSEHOLD APPLIANCES PUBLISHING SPECIALTY STORESBROADCASTING FOOTWEAR HOUSEWARES & SPECS RESTAURANTS TIRES & RUBBERCABLE & SATELLITE

Business Analysis – 5 Forces
• Barriers to Entry: High– Many well established companies with strong brand recognition
• Competition: High– Companies have to keep evolving to stay current and keep/gain
market share
• Substitution: High– Consumers can trade up, down, sideways
• Supplier Power: Varied depending on industry
• Buyer Power: High

Business Analysis – Current Economic Conditions
• Positive Factors– Consumers' cash savings continue
to expand and are now at a record level
– More than 60% of homeowners have more than 30% equity in their homes
– Mortgage rates have declined
– The recently passed stimulus package includes some modest tax cuts
– The recently launched Term Asset Loan Program (TALF) aims to loosen up consumer lending by unfreezing the securitization market
– Tax refunds are 15% higher than at the same time last year.
• Negative Factors– Margins in the retail space are
diminishing
– The unemployment rate continues to move higher
– Savings rates in the United States have been increasing.
– The credit card delinquency rate continues to move higher.
– Revolving credit limits are being reduced & credit standards remain tight.
– Personal net worth has declined
– Delinquency rates for prime mortgage loans continue to rise
Schwab Sector Views by Brad Sorensen

Economic Analysis
•Same Time Period•Negatively Correlated
•Brent Crude Oil•CPI
•Positively Correlated:•S&P500 Price Index
•One Month LagPositively Correlated:
S&P500 Price IndexRetail Sales
•One Month Lead•Negatively Correlated
•Brent Crude Oil Spot Price•CPI
•Positively Correlated•S&P500 Price Index
•3 Month LagNegatively Correlated:
Consumer SpendingPositively Correlated
Federal Funds Rate

Financial Analysis- Sector ROE
?

Financial Analysis- Sector Profit Margin
?
?

Financial Analysis- Industry Breakdown

Financial Analysis- Industry Breakdown
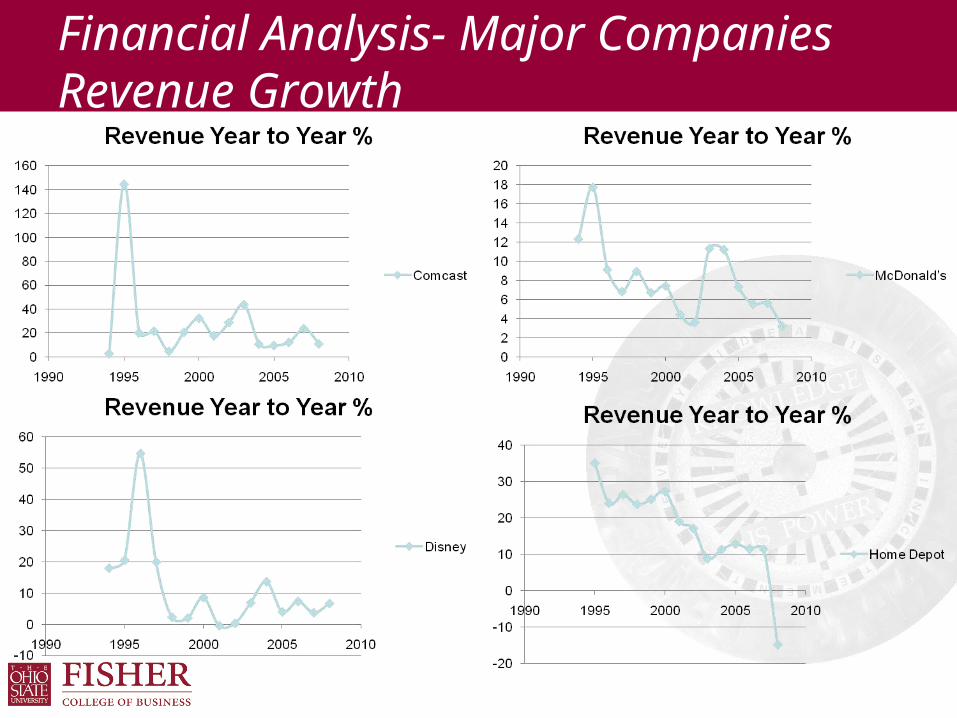
Financial Analysis- Major Companies Revenue Growth

Financial Analysis- Major Companies Net Income Growth

Financial Analysis- Major Companies Net Profit Margin

Valuation Analysis

Valuation Analysis:P/E
+ 10 Cos with negative earnings
(12%)
+ 11 Cos with negative earnings
(14%)
Only 23 Cos are expected to improve their earnings in the
next 4Qs (28%)
Earnings Latest 4 Qs
GENERAL MOTORS -28.83CENTEX -15.66KB HOME -9.88HORTON (D.R.) -8.12PULTE HOMES -5.82FORD MOTOR -4.05LENNAR CL A -2.45GOODYEAR TIRE -1.28EASTMAN KODAK -0.94OFFICE DEPOT -0.60

Valuation Analysis:EPS
?
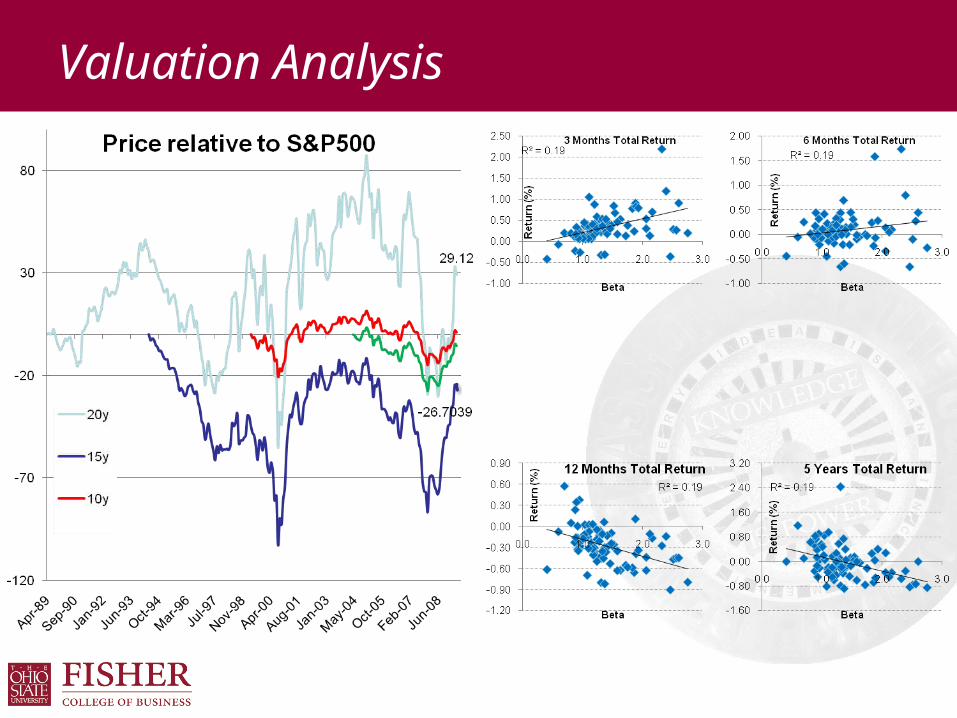
Valuation Analysis
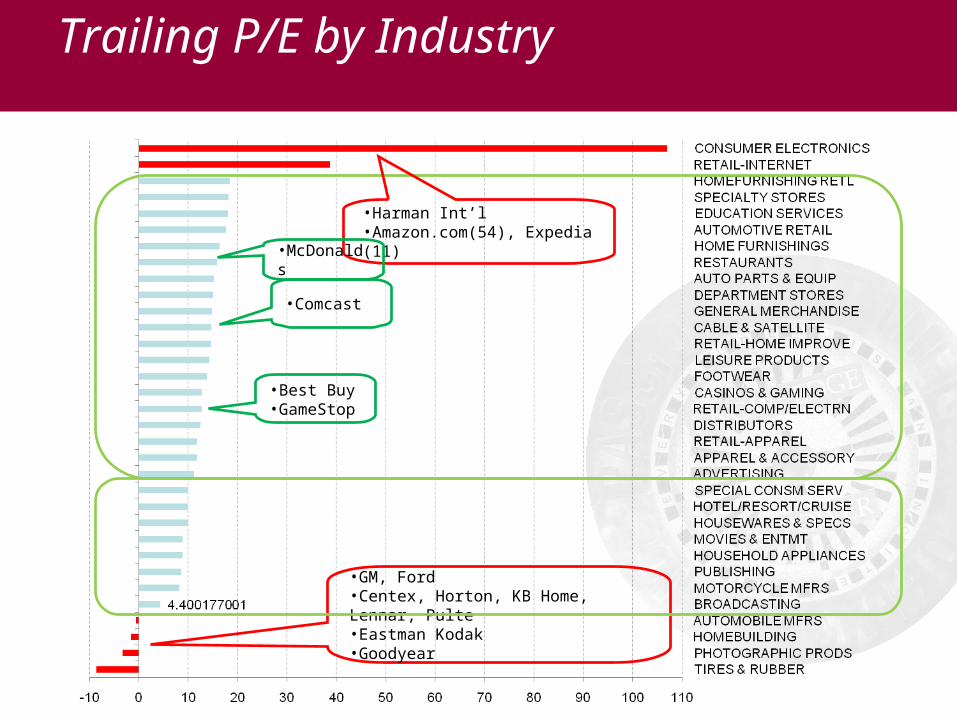
Trailing P/E by Industry
•GM, Ford•Centex, Horton, KB Home, Lennar, Pulte•Eastman Kodak•Goodyear
•Harman Int’l•Amazon.com(54), Expedia (11)
•Best Buy•GameStop
•McDonalds
•Comcast

Market cap vs Earnings
GM: $ -17.6 BFord: $ -11.6 B
Industry Mkt Cap EarningsTIRES & RUBBER 0.3% -1.5%PHOTOGRAPHIC PRODS 0.1% -1.2%HOMEBUILDING 1.5% -34.4%AUTOMOBILE MFRS 2.3% -137.4%BROADCASTING 0.6% 5.1%MOTORCYCLE MFRS 0.7% 2.9%PUBLISHING 2.1% 8.8%HOUSEHOLD APPLIANCES 1.4% 5.7%MOVIES & ENTMT 12.6% 52.8%HOUSEWARES & SPECS 1.1% 4.2%HOTEL/RESORT/CRUISE 3.9% 14.5%SPECIAL CONSM SERV 0.7% 2.4%ADVERTISING 1.6% 5.4%APPAREL & ACCESSORY 2.5% 7.8%RETAIL-APPAREL 3.6% 11.4%DISTRIBUTORS 0.7% 2.0%RETAIL-COMP/ELECTRN 2.9% 8.3%CASINOS & GAMING 1.1% 3.1%FOOTWEAR 3.2% 8.7%LEISURE PRODUCTS 1.1% 3.0%RETAIL-HOME IMPROVE 10.5% 26.5%CABLE & SATELLITE 10.8% 27.4%GENERAL MERCHANDISE 4.8% 12.1%DEPARTMENT STORES 4.9% 12.2%AUTO PARTS & EQUIP 1.4% 3.5%RESTAURANTS 11.4% 26.8%HOME FURNISHINGS 0.3% 0.6%AUTOMOTIVE RETAIL 2.3% 4.8%EDUCATION SERVICES 1.3% 2.6%SPECIALTY STORES 2.4% 4.9%HOMEFURNISHING RETL 1.0% 2.0%RETAIL-INTERNET 4.9% 4.7%CONSUMER ELECTRONICS 0.1% 0.0%CnDisc Total 100% 100%
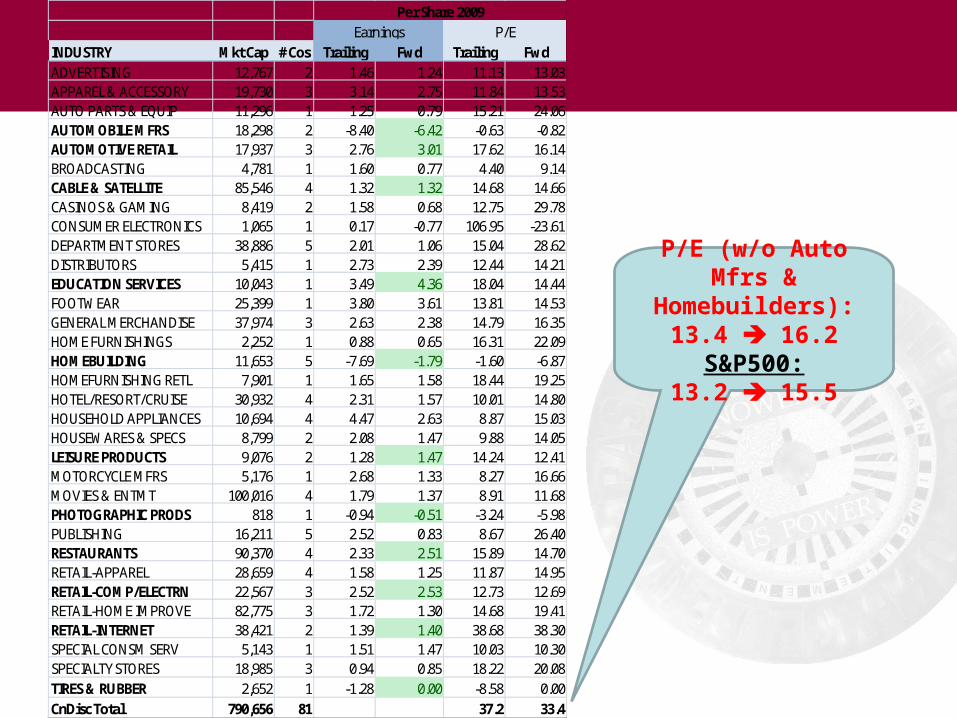
INDUSTRY Mkt Cap # Cos Trailing Fwd Trailing FwdADVERTISING 12,767 2 1.46 1.24 11.13 13.03APPAREL & ACCESSORY 19,730 3 3.14 2.75 11.84 13.53AUTO PARTS & EQUIP 11,296 1 1.25 0.79 15.21 24.06AUTOMOBILE MFRS 18,298 2 -8.40 -6.42 -0.63 -0.82AUTOMOTIVE RETAIL 17,937 3 2.76 3.01 17.62 16.14BROADCASTING 4,781 1 1.60 0.77 4.40 9.14CABLE & SATELLITE 85,546 4 1.32 1.32 14.68 14.66CASINOS & GAMING 8,419 2 1.58 0.68 12.75 29.78CONSUMER ELECTRONICS 1,065 1 0.17 -0.77 106.95 -23.61DEPARTMENT STORES 38,886 5 2.01 1.06 15.04 28.62DISTRIBUTORS 5,415 1 2.73 2.39 12.44 14.21EDUCATION SERVICES 10,043 1 3.49 4.36 18.04 14.44FOOTWEAR 25,399 1 3.80 3.61 13.81 14.53GENERAL MERCHANDISE 37,974 3 2.63 2.38 14.79 16.35HOME FURNISHINGS 2,252 1 0.88 0.65 16.31 22.09HOMEBUILDING 11,653 5 -7.69 -1.79 -1.60 -6.87HOMEFURNISHING RETL 7,901 1 1.65 1.58 18.44 19.25HOTEL/RESORT/CRUISE 30,932 4 2.31 1.57 10.01 14.80HOUSEHOLD APPLIANCES 10,694 4 4.47 2.63 8.87 15.03HOUSEWARES & SPECS 8,799 2 2.08 1.47 9.88 14.05LEISURE PRODUCTS 9,076 2 1.28 1.47 14.24 12.41MOTORCYCLE MFRS 5,176 1 2.68 1.33 8.27 16.66MOVIES & ENTMT 100,016 4 1.79 1.37 8.91 11.68PHOTOGRAPHIC PRODS 818 1 -0.94 -0.51 -3.24 -5.98PUBLISHING 16,211 5 2.52 0.83 8.67 26.40RESTAURANTS 90,370 4 2.33 2.51 15.89 14.70RETAIL-APPAREL 28,659 4 1.58 1.25 11.87 14.95RETAIL-COMP/ELECTRN 22,567 3 2.52 2.53 12.73 12.69RETAIL-HOME IMPROVE 82,775 3 1.72 1.30 14.68 19.41RETAIL-INTERNET 38,421 2 1.39 1.40 38.68 38.30SPECIAL CONSM SERV 5,143 1 1.51 1.47 10.03 10.30SPECIALTY STORES 18,985 3 0.94 0.85 18.22 20.08TIRES & RUBBER 2,652 1 -1.28 0.00 -8.58 0.00CnDisc Total 790,656 81 37.2 33.4
Earnings P/EPer Share 2009
P/E (w/o Auto Mfrs & Homebuilders):
13.4 16.2S&P500:
13.2 15.5

P/CF P/CF (w/o Auto Mfrs & Homebuilders):
0.85

Recommendation
1. Start by closing the
gap (-159 bps)
2. Overweight the
sector by at least
200 bps
Source: Fidelity.com