Consumer Buying Power | Entertainment Samples/CBP...Consumer Buying Power | Entertainment Trade...
4
Consumer Buying Power | Entertainment Trade Area: SPOTLIGHT - 3 mi Radius Consumer Units: 45,204 | Households: 45,204 | Dorm Pop: 0 2018 Aggregate Expenditure Estimate % 2018 Aggregate Expenditure Estimate % 2018 Annual Avg per Consumer Unit 2023 Annual Avg per Consumer Unit Compound Annual Growth Rate (%) 2018 Market Index Total Specif ied Consumer Expenditures 2,445,825,851 100.00 2,776,029,933 100.00 54,106.40 59,799.88 2.57 91 Entertainment Entertainment 134,015,140 100.00 152,393,567 100.00 2,964.67 3,282.79 2.60 88 Fees and Admissions Fees and admissions 27,434,997 20.47 31,336,343 20.56 606.92 675.03 2.69 77 Recreation expenses, out-of -town trips 1,166,860 0.87 1,294,098 0.85 25.81 27.88 2.09 80 Social, recreation, health club membership 8,940,500 6.67 10,358,084 6.80 197.78 223.13 2.99 85 Participant sports, out-of -town trips 853,262 0.64 983,152 0.65 18.88 21.18 2.87 75 Play, theater, opera, concert 2,209,091 1.65 2,627,742 1.72 48.87 56.61 3.53 74 Movies, parks, museums 3,206,176 2.39 3,517,637 2.31 70.93 75.78 1.87 80 Movie, other admissions, out-of -town trips 2,777,068 2.07 3,155,986 2.07 61.43 67.98 2.59 76 Admission to sporting events 2,211,132 1.65 2,550,194 1.67 48.91 54.94 2.89 79 Admission to sports events, out-of -town trips 932,049 0.70 1,058,385 0.69 20.62 22.80 2.57 76 Fees f or recreational lessons 3,428,936 2.56 3,933,520 2.58 75.85 84.73 2.78 64 Other entertainment services, out-of -town trips 1,166,860 0.87 1,294,098 0.85 25.81 27.88 2.09 80 Fees f or participant sports 543,062 0.41 563,447 0.37 12.01 12.14 0.74 66 Audio, Visual Equipment and Services Audio and visual equipment and services 60,092,861 44.84 68,224,438 44.77 1,329.37 1,469.66 2.57 104 Misc. video equipment and digital media players 91,860 0.07 110,364 0.07 2.03 2.38 3.74 117 Sound equipment accessories 83,042 0.06 101,170 0.07 1.84 2.18 4.03 86 Video game sof tware 46,510 0.03 53,828 0.04 1.03 1.16 2.97 100 Video game hardware and accessories 291,827 0.22 320,896 0.21 6.46 6.91 1.92 78 Stereos, radios, speakers, and sound components 613,020 0.46 717,966 0.47 13.56 15.47 3.21 90 Televisions 5,630,155 4.20 6,457,538 4.24 124.55 139.11 2.78 99 Cable and satellite television services 47,191,833 35.21 53,272,646 34.96 1,043.97 1,147.57 2.45 107 Satellite radio service 898,641 0.67 1,032,129 0.68 19.88 22.23 2.81 99 Online gaming services 214,123 0.16 242,989 0.16 4.74 5.23 2.56 78 VCRs and video disc players 175,485 0.13 194,115 0.13 3.88 4.18 2.04 89 Video cassettes, tapes, and discs 500,588 0.37 547,260 0.36 11.07 11.79 1.80 90 Streaming, downloading video 1,225,950 0.91 1,480,147 0.97 27.12 31.88 3.84 82 Applications, games, ringtones f or handheld devices 204,729 0.15 233,152 0.15 4.53 5.02 2.63 98 Repair of TV, radio, and sound equipment 80,609 0.06 90,156 0.06 1.78 1.94 2.26 82 Rental of televisions 98,189 0.07 91,596 0.06 2.17 1.97 -1.38 154 Personal digital audio players 61,776 0.05 68,602 0.05 1.37 1.48 2.12 85 Satellite dishes 59,903 0.04 69,145 0.05 1.33 1.49 2.91 98 CDs, records, audio tapes 289,674 0.22 343,070 0.23 6.41 7.39 3.44 83 Streaming, downloading audio 286,018 0.21 357,674 0.23 6.33 7.70 4.57 93 Rental of VCR, radio, and sound equipment 29,822 0.02 30,016 0.02 0.66 0.65 0.13 173 Musical instruments and accessories 1,205,677 0.90 1,478,612 0.97 26.67 31.85 4.17 86 Rental and repair of musical instruments 138,053 0.10 174,936 0.11 3.05 3.77 4.85 92 Rental of video cassettes, tapes, f ilms, and discs 520,532 0.39 579,412 0.38 11.52 12.48 2.17 88 Rental/installation of audio and video hardware 20,591 0.02 22,215 0.01 0.46 0.48 1.53 94 Rental of video sof tware 73,726 0.06 83,574 0.05 1.63 1.80 2.54 123 Installation of televisions 60,527 0.05 71,229 0.05 1.34 1.53 3.31 117 Benchmark: USA Copyright © 2018 by Environics Analytics (EA). Source: Consumer Buying Power 2018.
Transcript of Consumer Buying Power | Entertainment Samples/CBP...Consumer Buying Power | Entertainment Trade...
Consumer Buying Power | EntertainmentTrade Area: SPOTLIGHT - 3 mi Radius Consumer Units: 45,204 | Households: 45,204 | Dorm Pop: 0
2018 AggregateExpenditure Estimate % 2018 Aggregate
Expenditure Estimate % 2018 Annual Avg perConsumer Unit
2023 Annual Avg perConsumer Unit
Compound AnnualGrowth Rate (%)
2018 MarketIndex
Total Specif ied Consumer Expenditures 2,445,825,851 100.00 2,776,029,933 100.00 54,106.40 59,799.88 2.57 91Entertainment Entertainment 134,015,140 100.00 152,393,567 100.00 2,964.67 3,282.79 2.60 88Fees and Admissions Fees and admissions 27,434,997 20.47 31,336,343 20.56 606.92 675.03 2.69 77 Recreation expenses, out-of-town trips 1,166,860 0.87 1,294,098 0.85 25.81 27.88 2.09 80 Social, recreation, health club membership 8,940,500 6.67 10,358,084 6.80 197.78 223.13 2.99 85 Participant sports, out-of-town trips 853,262 0.64 983,152 0.65 18.88 21.18 2.87 75 Play, theater, opera, concert 2,209,091 1.65 2,627,742 1.72 48.87 56.61 3.53 74 Movies, parks, museums 3,206,176 2.39 3,517,637 2.31 70.93 75.78 1.87 80 Movie, other admissions, out-of-town trips 2,777,068 2.07 3,155,986 2.07 61.43 67.98 2.59 76 Admission to sporting events 2,211,132 1.65 2,550,194 1.67 48.91 54.94 2.89 79 Admission to sports events, out-of-town trips 932,049 0.70 1,058,385 0.69 20.62 22.80 2.57 76 Fees for recreational lessons 3,428,936 2.56 3,933,520 2.58 75.85 84.73 2.78 64 Other entertainment services, out-of-town trips 1,166,860 0.87 1,294,098 0.85 25.81 27.88 2.09 80 Fees for participant sports 543,062 0.41 563,447 0.37 12.01 12.14 0.74 66Audio, Visual Equipment and Services Audio and visual equipment and services 60,092,861 44.84 68,224,438 44.77 1,329.37 1,469.66 2.57 104 Misc. video equipment and digital media players 91,860 0.07 110,364 0.07 2.03 2.38 3.74 117 Sound equipment accessories 83,042 0.06 101,170 0.07 1.84 2.18 4.03 86 Video game software 46,510 0.03 53,828 0.04 1.03 1.16 2.97 100 Video game hardware and accessories 291,827 0.22 320,896 0.21 6.46 6.91 1.92 78 Stereos, radios, speakers, and sound components 613,020 0.46 717,966 0.47 13.56 15.47 3.21 90 Televisions 5,630,155 4.20 6,457,538 4.24 124.55 139.11 2.78 99 Cable and satellite television services 47,191,833 35.21 53,272,646 34.96 1,043.97 1,147.57 2.45 107 Satellite radio service 898,641 0.67 1,032,129 0.68 19.88 22.23 2.81 99 Online gaming services 214,123 0.16 242,989 0.16 4.74 5.23 2.56 78 VCRs and video disc players 175,485 0.13 194,115 0.13 3.88 4.18 2.04 89 Video cassettes, tapes, and discs 500,588 0.37 547,260 0.36 11.07 11.79 1.80 90 Streaming, downloading video 1,225,950 0.91 1,480,147 0.97 27.12 31.88 3.84 82 Applications, games, ringtones for handheld devices 204,729 0.15 233,152 0.15 4.53 5.02 2.63 98 Repair of TV, radio, and sound equipment 80,609 0.06 90,156 0.06 1.78 1.94 2.26 82 Rental of televisions 98,189 0.07 91,596 0.06 2.17 1.97 -1.38 154 Personal digital audio players 61,776 0.05 68,602 0.05 1.37 1.48 2.12 85 Satellite dishes 59,903 0.04 69,145 0.05 1.33 1.49 2.91 98 CDs, records, audio tapes 289,674 0.22 343,070 0.23 6.41 7.39 3.44 83 Streaming, downloading audio 286,018 0.21 357,674 0.23 6.33 7.70 4.57 93 Rental of VCR, radio, and sound equipment 29,822 0.02 30,016 0.02 0.66 0.65 0.13 173 Musical instruments and accessories 1,205,677 0.90 1,478,612 0.97 26.67 31.85 4.17 86 Rental and repair of musical instruments 138,053 0.10 174,936 0.11 3.05 3.77 4.85 92 Rental of video cassettes, tapes, f ilms, and discs 520,532 0.39 579,412 0.38 11.52 12.48 2.17 88 Rental/installation of audio and video hardware 20,591 0.02 22,215 0.01 0.46 0.48 1.53 94 Rental of video software 73,726 0.06 83,574 0.05 1.63 1.80 2.54 123 Installation of televisions 60,527 0.05 71,229 0.05 1.34 1.53 3.31 117
Benchmark: USA Copyright © 2018 by Environics Analytics (EA). Source: Consumer Buying Power 2018.

Consumer Buying Power | EntertainmentTrade Area: SPOTLIGHT - 3 mi Radius Consumer Units: 45,204 | Households: 45,204 | Dorm Pop: 0
2018 AggregateExpenditure Estimate % 2023 Aggregate
Expenditure Estimate % 2018 Annual Avg perConsumer Unit
2023 Annual Avg perConsumer Unit
Compound AnnualGrowth Rate (%)
2018 MarketIndex
Pets, Toys, Hobbies, and Playground Equipment Pets, toys, hobbies, and playground equipment 31,447,750 23.47 35,630,838 23.38 695.69 767.54 2.53 86 Pets 25,539,778 19.06 29,007,499 19.03 564.99 624.87 2.58 89 Pet food 3,841,827 2.87 4,324,137 2.84 84.99 93.15 2.39 73 Vet services 2,217,294 1.65 2,518,296 1.65 49.05 54.25 2.58 99 Pet purchase, supplies, medicine 14,138,405 10.55 15,794,670 10.36 312.77 340.24 2.24 93 Pet services 5,342,253 3.99 6,370,396 4.18 118.18 137.23 3.58 86 Toys, hobbies, and playground equipment 5,907,972 4.41 6,623,339 4.35 130.70 142.68 2.31 78 Toys, games, arts and crafts, and tricycles 4,503,623 3.36 5,017,785 3.29 99.63 108.09 2.19 84 Stamp and coin collecting 631,449 0.47 767,389 0.50 13.97 16.53 3.98 60 Playground equipment 772,899 0.58 838,166 0.55 17.10 18.06 1.63 65 Unmotorized recreational vehicles 4,119,722 3.07 4,595,791 3.02 91.14 99.00 2.21 47 Boat without motor and boat trailers 602,149 0.45 624,015 0.41 13.32 13.44 0.72 46 Trailer and other attachable campers 3,517,574 2.62 3,971,776 2.61 77.82 85.56 2.46 48 Motorized recreational vehicles 5,456,309 4.07 6,495,364 4.26 120.70 139.92 3.55 77 Purchase of motorized camper and other vehicles 2,709,101 2.02 3,272,230 2.15 59.93 70.49 3.85 59 Purchase of boat with motor 2,747,208 2.05 3,223,134 2.12 60.77 69.43 3.25 112 Rental of recreational vehicles 1,089,704 0.81 1,377,391 0.90 24.11 29.67 4.80 93 Rental non-camper trailer 27,044 0.02 30,807 0.02 0.60 0.66 2.64 114 Boat and trailer rental for out-of-town trips 80,619 0.06 102,543 0.07 1.78 2.21 4.93 99 Rental of campers for out-of-town trips 656,645 0.49 835,391 0.55 14.53 18.00 4.93 84 Rental of boat 91,647 0.07 116,524 0.08 2.03 2.51 4.92 102 Rental of motorized camper 68,106 0.05 81,044 0.05 1.51 1.75 3.54 105 Rental of other RVs 165,644 0.12 211,081 0.14 3.66 4.55 4.97 128 Docking and landing fees and outboard motors 620,488 0.46 712,664 0.47 13.73 15.35 2.81 95 Sports, recreation and exercise equipment 2,053,413 1.53 2,186,312 1.43 45.43 47.10 1.26 79 Athletic gear, game tables, and exercise equipment 268,224 0.20 286,846 0.19 5.93 6.18 1.35 74 Camping equipment and GPS devices 71,798 0.05 76,869 0.05 1.59 1.66 1.37 69 Hunting and f ishing equipment 219,369 0.16 225,041 0.15 4.85 4.85 0.51 70 Bicycles 749,336 0.56 813,873 0.53 16.58 17.53 1.67 79 Winter sports equipment 56,214 0.04 60,380 0.04 1.24 1.30 1.44 34 Water sports equipment 211,473 0.16 225,889 0.15 4.68 4.87 1.33 102 Other sports equipment and rental/repair 476,999 0.36 497,414 0.33 10.55 10.72 0.84 93 Photographic equipment, supplies and services 783,428 0.58 814,297 0.53 17.33 17.54 0.78 83 Photographer fees and other photographic supplies 112,011 0.08 118,050 0.08 2.48 2.54 1.06 62 Film 51,278 0.04 52,601 0.03 1.13 1.13 0.51 115 Photo processing 174,552 0.13 183,709 0.12 3.86 3.96 1.03 77 Repair and rental of photographic equipment 22,878 0.02 22,617 0.01 0.51 0.49 -0.23 88 Photographic equipment 422,709 0.32 437,321 0.29 9.35 9.42 0.68 90Other Entertainment Supplies, Equipment and Services Other entertainment supplies, equipment, and services 15,039,532 11.22 17,201,948 11.29 332.70 370.56 2.72 68 Fireworks 39,012 0.03 39,518 0.03 0.86 0.85 0.26 74 Souvenirs 22,351 0.02 24,439 0.02 0.49 0.53 1.80 92 Visual goods 12,652 0.01 13,109 0.01 0.28 0.28 0.71 103 Pinball, electronic video games 11,469 0.01 11,826 0.01 0.25 0.25 0.62 78 Live entertainment for catered affairs 297,751 0.22 331,382 0.22 6.59 7.14 2.16 93 Rental of party supplies for catered affairs 533,232 0.40 599,853 0.39 11.80 12.92 2.38 85
Benchmark: USA Copyright © 2018 by Environics Analytics (EA). Source: Consumer Buying Power 2018.
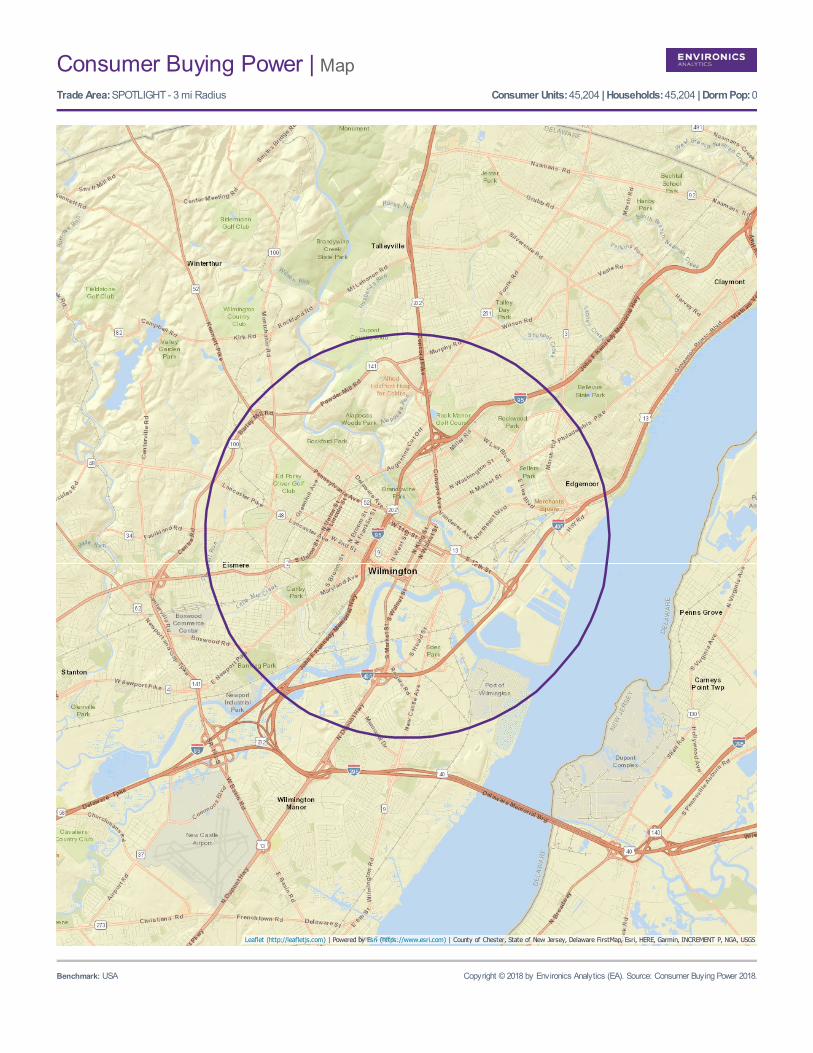
Consumer Buying Power | MapTrade Area: SPOTLIGHT - 3 mi Radius Consumer Units: 45,204 | Households: 45,204 | Dorm Pop: 0
Benchmark: USA Copyright © 2018 by Environics Analytics (EA). Source: Consumer Buying Power 2018.
Leaflet (http://leafletjs.com) | Powered by Esri (https://www.esri.com) | County of Chester, State of New Jersey, Delaware FirstMap, Esri, HERE, Garmin, INCREMENT P, NGA, USGS
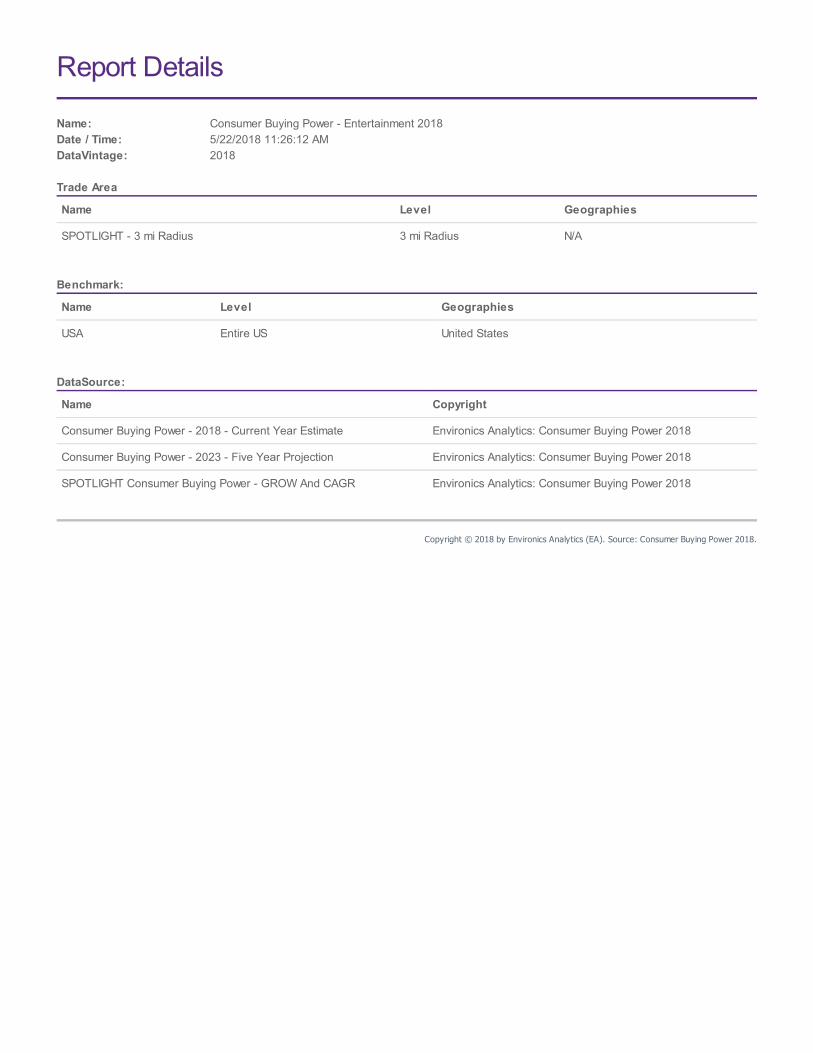
Report Details
Name: Consumer Buying Power - Entertainment 2018Date / Time: 5/22/2018 11:26:12 AMDataVintage: 2018 Trade Area
Name Level Geographies
SPOTLIGHT - 3 mi Radius 3 mi Radius N/A
Benchmark:
Name Level Geographies
USA Entire US United States
DataSource:
Name Copyright
Consumer Buying Power - 2018 - Current Year Estimate Environics Analytics: Consumer Buying Power 2018
Consumer Buying Power - 2023 - Five Year Projection Environics Analytics: Consumer Buying Power 2018
SPOTLIGHT Consumer Buying Power - GROW And CAGR Environics Analytics: Consumer Buying Power 2018
Copyright © 2018 by Environics Analytics (EA). Source: Consumer Buying Power 2018.