CONSUMER ACCEPTANCE OF GOAT MILK PRODUCTS I N ...
62
CONSUMER ACCEPTANCE OF GOAT MILK PRODUCTS I N WESTERN KENYA K. J. Boor, D. L. Brown, and H. A. Fitzhugh Wi nrock International Morrilton, Arkansas 72110 Ministry of Agriculture and Livestock Development Kenya January 1984
Transcript of CONSUMER ACCEPTANCE OF GOAT MILK PRODUCTS I N ...

CONSUMER ACCEPTANCE OF GOAT MILK PRODUCTS I N WESTERN KENYA
K. J. Boor, D. L. Brown, and H. A. F i t zhugh
W i n rock I n t e r n a t i o n a l M o r r i l t o n , Arkansas 72110
M i n i s t r y of A g r i c u l t u r e and L i ves tock Development Kenya
January 1984

TABLE OF CONTENTS
. . . . . . . . . . . . . . . . . . . . . . . . . . . . . . SUMMARY 1
. . . . . . . . . . . . . . . . . . . . . . . . . . . INTRODUCTION 2 ResearchGoals . . . . . . . . . . . . . . . . . . . . . . . . 2 . . . . . . . . . . . . . . . . . . . . . . . P r o j e c t Loca t i on 2 . . . . . . . . . . . . . . . . . . . . . . Kenyan A g r i c u l t u r e 4 . . . . . . . . . . . . . . . . . . . . D a i r y I n d u s t r y i n K e n y a 7 . . . . . . . . . . . . . . . . . . . . . . . . M i l k Market ing 7 . . . . . . . . . . . . . . . . . . . KCCProcess ingandSa les 8 . . . . . . . . . . . . . . . . . . Da i r y I ndus t r y Const r a i n t s 8 . . . . . . . . . . . . . . . . . . . M i l k i n t h e Kenyan D i e t 11 . . . . . Role o f L ives tock i n Kenyan Smal lho lder Farm Systems 14 . . . . . . . . . . . . . . . . . . . . . . Dual-Purpose Goats 14 . . . . . . . . . . . . . . . . . C h a r a c t e r i s t i c s o f Goat M i l k 15
MILK PRODUCTION. PURCHASE. PROCESSING. AND D A I R Y PRODUCT . . . . . . . . . CONSUMPTION IN EIGHTY HOMESTEADS IN WESTERN KENYA 17 . . . . . . . . . . . . . . . . . . . . . . . . . Met hod01 ogy 18 . . . . . . . . . . . . . . . . . . . . . . . . . . . Resu l ts 20 . . . . . . . . . . . . . . . Dai r y Products i n West e rn Kenya 22 . . . . . . . . . . . . . . . . . M i 1 k Product C h a r a c t e r i s t i c s 24 . . . Adequacy of Current M i l k Suppl ies i n t h e Research Areas 25
COMPARISON OF CONSUMER ACCEPTANCE OF GOAT AND COW MILK PRODUCTS . . 27 . . . . . . . . . . . . . . Prepa ra t i on o f Taste Test Samples 27 . . . . . . . . . . . . . . . . . . . . . Taste Test Loca t ions 28 . . . . . . . . . . . . . . . . . . . . . . . . . . . Resu l ts 30
. . . . . . . . . . . . . . . . . . . . . . . . . . . . DISCUSSION 36 . . . . . . . . . . . . . . . . . . . . . . . . . M i l k Supply 36 . . . . . . . . . . . . . . . . . D a i r y Products Commonly Used 37 . . . . . . . . . I n t r o d u c t i o n o f a New Product.. White Cheese 38 Potent i a1 f o r M i 1 k from Dual -Purpose Goat Systems . . . . . . . . . . . . . . . . . . . . . . i n Western Kenya 38
. . . . . . . . . . . . . . . . . . . . . . . . . . . . CONCLUSIONS 40
. . . . . . . . . . . . . . . . . . . . . . . . . . . BIBLIOGRAPHY 41
APPENDICES . . . . . . . . . . . . . . . . . . . . . . . . . . . . 44

LIST OF TABLES
Page
. . . . . . 1 . Kenyan P o p u l a t i o n and Employment Trends: 1970.1981 4
2 . Trends i n Kenyan Food Supply (Per Caput Per Day) . . . . . . . 6
. . . . . . . . . . . . . . . 3 KCC Products Processed: 1978-1980 9
. . . . . . . . 4 . KCC Average D a i l y Sales o f F l u i d M i l k Products 9
. . . . . . . . . . 5 . Sale o f ~ a n u f a c t u r e d KCC Products i n Kenya 10
. . . . . . . . . . . . . . . . . . . . . 6 KCC Expor ts : 1978.1980 10
7 . Represent a t i v e Values f o r Some Major C o n s t i t u e n t s o f Good Qua1 i t y M i l k (g1100 g) . . . . . . . . . . . . . . . . . . 15
8 . C h a r a c t e r i s t i c s of E i g h t y Farms S tud ied i n Kakamega and Siaya D i s t r i c t s . . . . . . . . . . . . . . . . . . . . . . 17
. . . . . . . . . . 9 . 1981 C a t t l e Numbers and Produc t ion F igu res 18
. . . . . . . . . . 10 . 1982 C a t t l e Numbers and Product i o n F igu res 20
11 . Frequency of M i l k Consumption . . . . . . . . . . . . . . . . . 21
. . . . . . . . . . 12 . Est imated D a i l y M i l k Consumption Per Fami ly 21
13 . Comparison o f D a i l y M i l k Consumption: Farms Wi th and Without C a t t l e . . . . . . . . . . . . . . . . . . . . 22
14 . D a i r y Products Consumed on Small Farms i n Western Kenya . . . . . . . . . . . . . . . . . . . . . . . . . . . . . 22
15 . Composi t ions o f D a i r y Products Sampled i n S iaya and Kakamega . . . . . . . . . . . . . . . . . . . . . . . . . 23
. . . . . . . . . . . . . . 16 . Proposed Uses f o r A d d i t i o n a l M i 1 k 26
17 . D i s t r i b u t i o n o f Scores Assigned t o Goat and Cow M i l k ( V i g i n a School) . . . . . . . . . . . . . . . . . . . 33
1 8 . Fresh Goat and Cow M i l k Taste Test Resu l t s : S iaya . . . . . . . . . . . . . . . . . . . . . . . . . and Kakamega 34

LIST OF FIGURES
Page
. . . . . . . . . . . . . . . . . . Figure 1 . Map o f western Kenya 3
F igure 2 . M i l k scores of goat and cow mi lk products . . . . . . . 31
F igure 3 . Cheese scores o f goat and mi lk products . . . . . . . . 32

ACKNOWLEDGMENTS
The coopera t ion and support o f t h e M i n i s t r y of A g r i c u l t u r e and L ives tock Development i s g r a t e f u l l y acknowledged.
P r i n c i p a l fund ing f o r t h e research i n Kenya was p rov ided by Winrock I n t e r n a t i o n a l and t h e U.S. Agency f o r I n t e r n a t i o n a l Development th rough Grant No. AID/DSAN/XII-G-0049 th rough t h e Small Rumi nant Col 1 aborat i v e Research Support Program (SR-CRSP) . Dr. S. Chema supported t h e research a c t i v i t i e s i n h i s r o l e as Coordi- n a t o r and Chairman o f t h e SR-CRSPIKenya Program A d m i n i s t r a t i o n Com- m i t t e e . R. Nal i a k a p rov ided va luab le admin is t r a t i v e support t o t h e research program. Drs. R. Har t and A. J. De Boer p a r t i c i p a t e d i n devel - opment of research plans.
C o l l e c t i o n o f f i e l d data was ab ly ass i s t ed by H. K i guh i , P. Amuhinda, L. Ongecha, 0. Evanns, E. Ochieng, and J. Onyodho. The support and coopera t ion of co l leagues, J. E. Reynolds, F. Ruvuna, F. B. Nyar ibo, A. Hauck, S. Russo, M. Salim, and K. O t ieno were impor tan t t o t h e success o f t h i s research.
The c o n t r i b u t i o n s of Drs. C. H. Amundson, N. Jorgensen, and C. Johnson f rom U n i v e r s i t y o f Wisconsin-Madison and o f E. A. Henderson, B. Robert- son, S. Zimmerman, J. Wh i t t i ng ton , D. Galloway, and T. Chism f rom Winrock I n t e r n a t i o n a l a re g r a t e f u l l y acknowledged.
Spec ia l thanks go t o t h e farm f a m i l i e s , school c h i l d r e n , and o thers who so very p a t i e n t l y p a r t i c i p a t e d i n our surveys and experiments.

CONSUER ACCEPTANCE OF GOAT MILK PRODUCTS I N WESTERN KENYA
The Small Rumi nants Col 1 aborat i ve Research Support Program i s eva l uat i ng t h e p o t e n t i a l r o l e f o r goats producing m i l k and meat f o r f a m i l y use on smal l farms i n western Kenya. The p o t e n t i a l f o r m i l k as a p r o t e i n supplement t o t h e d a i l y d i e t o f t hese f a m i l i e s i s o f p a r t i c u l a r i n t e r e s t . A r e l evan t ques t ion i n t h i s e v a l u a t i o n i s i f people w i l l r e a d i l y accept goat m i l k products. Answering t h i s ques t ion was t h e pr imary o b j e c t i v e o f t h e research descr ibed i n t h i s r epo r t .
Current m i 1 k product ion , p rocess i ng, and consumption p r a c t i c e s were moni tored on 80 sma l lho lder farms i n two d i s t r i c t s i n western Kenya. T h i r t y - s i x o f t h e e i g h t y farms had cows a t t h e end o f 1982. Average 1 a c t a t i o n y i e l d s were 295 kg over 216 days i n Siaya D i s t r i c t and 430 kg over 197 days i n Kakamega D i s t r i c t .
The most commonly consumed d a i r y products were m i l k used i n t e a prepara- t i o n i n both d i s t r i c t s and m i l k as a l i q u i d s tock f o r cook ing vegetables i n S i aya D i s t r i c t . Other common products were spontaneously fermented m i l k , b u t t e r prepared from soured m i l k and f r e s h m i l k .
Average d a i l y m i l k consumption was .82 l i t e r s per f a m i l y i n Kakamega and .42 l i t e r s per f a m i l y i n Siaya. I n bo th d i s t r i c t s , d a i l y m i l k consump- t i o n was h i ghe r on farms w i t h cows t han on farms w i t hou t cows (p<.01). E i g h t y - s i x percent o f a l l t h e farmers i n t e r v i ewed i n d i c a t e d t h a t cu r ren t m i l k supp l i es were inadequate f o r t h e i r f a m i l y needs.
Goat m i 1 k product acceptabi 1 i t y was eva luated i n t a s t e t e s t s i n schools and o t h e r s i t e s i n r u r a l western Kenya. The comparisons were aga ins t i d e n t i c a l l y prepared cow m i l k samples as re ferences. Resu l t s from t a s t e t e s t s i n v o l v i n g a t o t a l o f 367 people i n d i c a t e d no d i f f e r e n c e i n accept ab i 1 i t y of goat and cow m i 1 k products. Leve ls o f accept ab i 1 i t y , e s p e c i a l l y f o r f r e s h and soured m i l k , were high.
The conc lus ion drawn from t h i s study i s t h a t a c c e p t a b i l i t y o f goat m i l k products i s not a c o n s t r a i n t t o es tab l i shment o f dual -purpose goat p roduc t i on systems on smal l farms i n r u r a l western Kenya.

INTRODUCTION -
The Small Rumi nant Col 1 aborat i ve Research Sup o r t Program (SR-CRSP) i s i n v e s t i gat i ng t h e po ten t i a1 f o r dual -purpose ! m i 1 k and meat ) goat sys- terns on smal l farms i n western Kenya. The o b j e c t i v e s o f t h e SR-CRSP are t o i n v e s t i g a t e cu r ren t smal l farm p roduc t i on c o n s t r a i n t s and i d e n t i f y and t e s t potent i a1 i n t e r v e n t i ons t h a t might improve cond i t i ons on smal l farms.
SR-CRSP research i n Kenya i s done i n c o l l a b o r a t i o n w i t h t h e M i n i s t r y o f A g r i c u l t u r e and L i ves tock Development (MALD) . F i e l d enumerators were seconded f rom t h e Cent ra l Bureau of S t a t i s t i c s i n t h e M i n i s t r y o f Finance and Economi c P l anni ng .
RESEARCH GOALS
DAIRY PRODUCTION AND CONSUMPTION ON SMALL FARMS I N WESTERN KENYA
Accord ing t o t h e M i n i s t r y o f L i ves tock Development (1980) and Mbugua (19761, t h e r e i s a demand f o r more m i l k i n Kenya's r u r a l areas. Lack o f product i o n and consumption f i gures on smal l h o l d e r farms (MLD--Kakamega, 1982; MLD--Nyanza, 1982) f r u s t r a t e a t tempts t o q u a n t i f y t h a t demand.
One goal o f t h i s research was t o q u a n t i f y m i l k p roduc t i on and product consumption on e i g h t y small farms i n western Kenya and t o c o l l ec t on- farm m i 1 k p rocess ing i n f o rma t i on .
RELATIVE ACCEPTABILITY OF GOAT AND COW MILK
Al though cow m i l k i s a popular product i n fa rm ing reg ions of western Kenya, goat m i l k products a re not w ide l y consumed (Nolan, 1982). There- f o re , de te rm ina t i on o f t h e re1 a t i ve acceptabi 1 it i es o f goat and cow mi 1 k products a re an impor tan t aspect of t e s t i n g dual-purpose m i l k and meat goat product i o n systems.
A t t i t u d e s toward and anecdotes about goat m i l k were c o l l e c t e d , goat mi 1 k products were developed and exper iments were designed t o t e s t t h e hypothes is t h a t goat and cow m i l k products a re e q u a l l y acceptab le t o western Kenya consumers.
PRW ECT LOCAT I ON
The SR-CRSP i s based at t h e Maseno Ve te r i na r y Farm i n western Kenya. The f i e l d research s i t e s are i n Kakamega and Siaya D i s t r i c t s ( f i g u r e 1). A g r i c u l t u r e i n bo th Kakamega and Siaya c o n s i s t s p r i m a r i l y o f smal l , fami l y - r u n operat ions. Farm a c t i v i t i e s , p a r t i c u l a r l y cropping, are determined by r a i n f a l l pa t t e rns . Both areas g e n e r a l l y have an annual bimodal r a i n f a l l pa t t e rn . The " long r a i n s " may fa1 1 f rom March through

F i g u r e 1. Map o f wes te rn Kenya

May o r June and t h e "shor t r a i n s " i n October and November. Kakamega rece ives, on t h e average, between 1834 and 2015 mm o f r a i n per year ; Siaya averages 1139 mn (Sands, 1983).
I n 1978. Kakamega d i s t r i c t wa5 repor ted as hav ing 294 people/km2 i n most areas and up t o 880 peoplelkm i n o thers (Lihanda, 1978; c i t e d by Sands, 1983). Land pressure i n Siaya was est imated a t 186 people/km2 (Sands. 1983).
The predominant t r i b e i n Kakamega d i s t r i c t i s t h e Abaluhya. Siaya D i s t r i c t i s p r i m a r i l y i nhab i t ed by t h e Luo t r i b e .
KENYAN AGRICULTURE
Kenya has a t o t a l 1 and area o f 56,925,000 ha (FAO, 1982). O f t h a t 1 and, on l y about 7% i s c l a s s i f i e d as " s u i t a b l e f o r a g r i c u l t u r e " (Hopcraf t , 1976). Another 13% t o 18% may be considered marg ina l t o medium poten- t i a l land, i n terms o f adequate r a i n f a l l and s u i t a b l e s o i l ( M i n i s t r y o f L i ves tock Development, 1980). The remaining 75% t o 80% o f t h e t o t a l l and area rece ives l ess than 600 mn o f annual r a i n f a l l and i s considered t o be o f low a g r i c u l t u r a l p o t e n t i a l ( M i n i s t r y o f L i ves tock Development, 1980). According t o Hopcraf t , on ly .04% o f t o t a l l and area was under i r r i g a t i o n i n 1976. FA0 Produc t ion Yearbook es t imates t h a t i n 1980, 10.6% of t o t a l l and area was i n use f o r crops o r as pasture.
I n 1981, Kenya's popu la t i on topped 17 m i l l i o n and was i n c r e a s i n g a t an annual growth r a t e o f over 4% (FAO, 1982). Approx imate ly 80% o f t h e popu la t i on l i v e on t h e 20% t o 25% o f t h e land t h a t has marg ina l t o h igh a g r i c u l t u r a l p o t e n t i a l ( M i n i s t r y o f L i ves tock Development, 1980). Near ly 80% o f t o t a l employment i n Kenya i s de r i ved from t h e a g r i c u l t u r a l sec to r ( t a b l e 1 ) .
TABLE 1. KENYAN POPULATION AND EMPLOYMENT TRENDS: 1970-1981
Economical l y a c t i v e popul a t i ona Tot a1 A g r i c u l t u r a l
Year popul a t i on popul a t i on To ta l A g r i c u l t u r a l % A g r i c u l t u r a l
Source: FA0 (1982). a Inc ludes employers, s a l a r i e d and unsal a r i e d workers, and employees on
fami l y farms. b A l l f i g u r e s a re i n thousands.

There a re var ious types o f land ho ld ings i n Kenya. The l a r g e p lan ta - t i o n s and ranches s e t t l e d by European c o l o n i s t s were repor ted i n 1976 t o have been 1 itt 1 e changed s i nce Independence i n 1963 (Hopcraf t , 1976). These ranches produce almost e x c l u s i v e l y f o r expor t . A t t h e same t ime, t h e r e were 1540 l a rge -sca le mixed farms, averaging 600 ha t o 700 ha each (Hopcraf t , 1976). Europeans re ta i ned ownership o f a few o f these, but most are now owned by i n d i v i d u a l Af r icans, a g r i c u l t u r a l s o c i e t i e s o r cooperat ives. Near ly h a l f o f Kenya's marketed a g r i c u l t u r e output i s produced on these l a r g e ranches and farms (Hopcraf t , 1976).
The m a j o r i t y o f r u r a l Kenyans l i v e and work on i n d i v i d u a l small ho ld ings, most o f which are less than 2 ha i n s ize . Very few are l a r g e r t h a n 5 ha (Hopcraft , 1976). Personal observa t ion suggests t h a t s ince 1976, some o f t h e l a rge -sca le farms and ranches mentioned above have been p a r t i t i o n e d i n t o small -scale, i n d i v i d u a l f a m i l y ho ld ings.
MLD (1980) descr ibes a t y p i c a l sma l lho lder farm i n t h e medium- t o high- p o t e n t i a l areas as i n c l u d i n g cash and subs is tence crops, as w e l l as some l i v e s t o c k . Common cash crops are co f fee , t ea , pyrethrum, and s i s a l . Subsistence crops vary f rom area t o area, but gene ra l l y i nc l ude maize, beans, bananas, cassava, several Brass i ca species , and assor ted vegetables. "Unimproved" zebu c a t t l e , f a t - t a i l e d sheep, and n a t i v e goats are, by f a r , t h e most comnon l i v e s t o c k . Numbers o f "improved" l i v e s t o c k a re s l ow l y inc reas ing , but have not y e t become w e l l esta- b l i s h e d i n t h e very r u r a l areas.
The r a p i d popu la t i on growth i s c r e a t i n g a di lemna a t t h e smal l - farm l e v e l . As c h i l d r e n mature and i n h e r i t p a r t o f t h e f a m i l y ho ld ing , farms a re subdiv ided i n t o f r a c t i o n s t o o small t o produce enough food t o support each r e s u l t i n g f a m i l y ( t a b l e 2 ) . I n Kakamega D i s t r i c t , a h igh- p o t e n t i a l , a g r i c u l t u r a l area i n western Kenya, average farm s i z e has decreased t o .4 ha per ho ld i ng (MLD-Kakamega, 1982). As a r e s u l t :
1. Men a re f r e q u e n t l y fo rced t o leave t h e homestead and seek remunerat i ve employment (Sands, 1983) .
2. A farm's croplands are reduced t o l i t t l e more t han " k i t chen gardens" and t h e r e s u l t i n g food produced i s o f t e n inadequate f o r t h e f a m i l y ' s needs.
3. Fam i l i es a re i n c r e a s i n g l y fo rced t o choose between r a i s i n g f a m i l y food crops o r 1 i ves tock (MLD--Kakamega, 1982).
4. Fam i l i es must buy food t o supplement what l i t t l e t hey can produce, even tua l l y r e q u i r i n g impo r ta t i on from more p roduc t i ve d i s t r i c t s o r count r i es.
5. Soc ia l and economic s t r u c t u r e s must change r a p i d l y as soc ie t y depends l ess on subsistence farming and more on cash markets.
Improved a g r i c u l t u r a l p rac t i ces , aimed at maximizing small farm produc- t i v i t y , are needed t o counterbalance these a1 armi ng t rends.

WHO i n t a k e 66 - 68 69-71 75-77 78-80 recommendat i onsC
K c a l o r i e s grand t o t a l Vegetable Animal
P r o t e i n ( g ) grand t o t a l Vegetable Animal
tn Calcium (mg) grand t o t a l
Vegetable Animal
2055 Male (3000) 1830 Femal e (2200)
22 5
56.8 Male (37) 42.5 Female (29) 14.3
376 Male (400 -500 )~ 183 Female (400-500) 193
Sources: FA0 (1982). a These d e c l i n i n g t r ends may be due t o popu la t i on increases and (o r ) p roduc t ion o r impo r t decreases.
The 1980 f i g u r e s may be low due t o pro longed drought i n 1 a t e 1979 and e a r l y 1980. Data a r e based on t o t a l p roduc t ion and i m p o r t a t i o n f i g u r e s ; t h a t i s , t o t a l food t h e o r e t i c a l l y a v a i l - ab le . No losses, i n c l u d i n g processing, storage, etc., a r e taken i n t o account.
c These f i g u r e s a r e based on WHO recomnended i n t a k e s o f n u t r i e n t s f o r moderately a c t i v e a d u l t s (male--65 kg; female--55 kg). I n t h i s t a b l e , these da ta a r e in tended o n l y f o r use as re ference p o i n t s . Recent evidence i n d i c a t e s t h a t humans can probably adapt t o lower i n t a k e s o f ca lc ium than "recomnen- d a t i o n s " suggest. Therefore, l ow i n t a k e va lues do n o t n e c e s s a r i l y i n d i c a t e ca lc ium d e f i c i e n c i e s (Kon, 1972).

DAIRY INDUSTRY I N KENYA
The ~i ni s t ry o f L ives tock Devel opment est imates t h a t t o t a1 m i 1 k produced i n Kenya du r i ng 1979 was 1,149 x l o 6 1. Th is f i g u r e i n c l udes c a t t 1 e, camel, and goat product ion.
O f t h i s t o t a l f i g u r e , approx imate ly 60% o r more i s est imated t o be consumed by t h e farmer o r s o l d a t in formal markets. Less than 40% o f t h e t o t a l i s handled through formal market channels (i.e., through t h e Kenya Cooperat ive Creameries) (MLD , 1980).
Grade o r "improved" c a t t 1 e a re unevenly d i s t r i but ed throughout t h e country . The Centra l and R i f t Va l l ey Provinces, which i n c l u d e t h e h igh- land areas, had 82% (398,000) o f t h e grade herd i n 1976. The densely populated, sma l lho lder farming areas of Western and Nyanza Provinces had on l y 8.7% (42,000) o f t h e t o t a l (485,000) grade herd. The l a r g e farm sect or, which has t h e h ighest concent r a t i o n o f grade c a t t 1 e, produced an est imated 70% o f t h e f o r m a l l y marketed m i l k i n 1976 (Hopcraf t , 1976).
Zebu c a t t l e make up nea r l y 90% o f t h e t o t a l mature cow popu la t ion (4,253,000), but produce l ess than 50% o f t h e t o t a l m i l k supply. Zebu cows are t h e p r i n c i p a l source o f m i l k i n t h e sma l lho lder and pas to ra l areas; on l y about 2% o f t h e m i 1 k produced by Zebus leaves t h e community and passes through formal market ing channels (Hopcraf t , 1976).
I n d i v i d u a l animal product i o n f i g u r e s are d i f f i c u l t t o v e r i f y , s ince few producers keep accurate records, but est imates o f annual p roduc t ion have been made. For 1973, grade cow product i o n averaged 1491 l i t e r s . For Zebu c a t t l e , t h e average amount beyond t h a t t aken by t h e c a l f was 120 1 i t e r s (Hopcraf t , 1976).
MILK MARKETING
The Kenya Cooperat ive Creameries (KCC) essent i a1 l y have a monopoly on process ing and market ing Kenyan dai ry products . Approximately 96% o f a l l commercial l y handled m i 1 k passes th rough t h e KCC (Hopcraf t , 1976). The on ly a the r recognized processors are var ious small producers who, under laws supported by t h e KCC, must be 1 icensed t o s e l l m i l k . V i r t u a l l y a l l o f these producers are l oca ted i n i s o l a t e d r u r a l areas.
'The Kenya Da i ry Board was set up at t h e u r g i n g of t h e KCC, p r i m a r i l y t o ac t as an inst rument t o c o n t r o l and 1 icense non-KCC d i s t r i b u t o r s of d a i r y products. L icens ing i s very d i f f i c u l t t o enforce i n r u r a l areas. I n d i v i d u a l farmers f r equen t l y ignore t h e regu la t i ons . P e r i o d i c a l l y , however, t h e a u t h o r i t i e s do crack down. I n e a r l y March, 1983, t h e Engl i sh 1 anguage na t i ona l newspaper, "The Nat ion," repor ted t h a t t h r e e women had been f i n e d t h e equ iva len t of about USB140 f o r c a r r y i n g approx imate ly 8 l i t e r s o f m i l k f o r sa le w i thou t a permi t .

KCC PROCESSING AND SALES
The KCE produces an array o f products ( t a b l e 3). I n s t i t u t i o n o f t h e School M i l k Program* by President Daniel Arap Moi i n 1979 has g r e a t l y increased demand f o r f l u i d m i l k products. Th is program has a l so caused a dramatic s h i f t i n product manufacture ( t a b l e 3) . M i l k powders, cheese, b u t t e r , and ghee were ava i l ab le , however, i n 1983 (personal observat ion) .
Sales f i g u r e s f o r 1978 t o 1980 r e f l e c t these t r ends ( t a b l e s 4 and 5). A prolonged drought du r i ng l a t e 1979 and e a r l y 1980 g r e a t l y decreased m i l k p roduc t ion du r i ng t h a t per iod. M i l k products became both scarce and expensive (Sands, personal communication). Condi t ions had improved by 1 a te 1981, but a c t i v e product i o n f i g u r e s have not been pub1 i shed.
For many years before 1980, Kenya had s i g n i f i c a n t m i l k and d a i r y product expor ts ( t a b l e 6) .
FA0 (1972) repor ted t h a t KCC expor ts peaked i n 1968 t o 1969, w i t h 21% o f t h e t o t a l d a i r y produce so ld ou ts ide Kenya. By 1969 t o 1970, expor ts had dropped t o j u s t over 15% o f t o t a l product ion. I n 1968 t o 1969 and 1969 t o 1970, 95.5% and 98.8% o f t h e exported goods went t o Uganda and Tanzania. The remainder went t o o ther A f r i c a n count r ies , except small amounts o f ghee, b u t t e r , and skimmed m i l k powder so ld t o B r i t a i n and Germany.
By 1980, t h e combination o f increased demand f o r d a i r y products i n Kenya and t h e d rought - i nduced decrease i n m i 1 k product i o n caused a tremendous decrease i n export c a p a b i l i t i e s (Republ ic o f Kenya, 1980). By 1983, t h e da i r y indus t r y had not regai ned i t s pre-1980 export product i on l e v e l s.
DAIRY INDUSTRY CONSTRAINTS
The cu r ren t commercial d a i r y i n d u s t r y i n Kenya faces many ser ious obstac les (Hopcraf t , 1976 ; Mbugua, 1976; Mini s t r y o f L ives tock Develop- ment, 1980).
1. Dur ing t h e wet seasons, forage and c a t t l e feed are r e l a t i v e l y p l e n t i f u l and m i l k product ion increases sharp ly . Dur ing f l u s h seasons, 1 ack o f adequate process ing capabi 1 i t i e s i s a major l i m i t i n g fac to r . Large q u a n t i t i e s of raw m i l k may a c t u a l l y s p o i l w h i l e w a i t i n g i n c o l l e c t i o n cans, even when processing p l a n t s are working t o capaci ty (Mbugua, 1976).
* The goal o f t h e School M i l k Program i s t o p rov ide every school c h i l d w i t h one cup o f m i l k every day. The goal has not ye t been achieved, but progress i s cont i nu i ng .

TABLE 3. KCC PRODUCTS PROCESSED: 1978-1980
Source: Republ ic o f Kenya (1978-1980). w
Produc t
Who1 e m i 1 k powder Cheese Evaporated m i l k Skim m i 1 k powder B u t t e r Ghee Cream UHT mi 1 k Mala ( y o g u r t ) Bu lk m i l k Tetrapak
TABLE 4. KCC AVERAGE DAILY SALES OF FLUID MILK PRODUCTS
U n i t
MT MT MT MT MT MT 1000 l i t e r s 1000 l i t e r s 1000 l i t e r s 1000 l i t e r s 1000 l i t e r s
Source: Republ ic o f Kenya (1978-1980). a Kenya School M i l k Program begins. b Mala = y o g u r t
Product
Bu lk m i l k Tetrapak UHT and ~ a l a ~
T o t a l
1978
1 s t h a l f
3,302 9 9
573 1,582 1,464
611 3 0
18,898 3 9
4,331 60,691
U n i t
1000 l i t e r s 1000 l i t e r s 1000 l i t e r s
1000 l i t e r s
1979
2nd h a l f
934 154 11 2
1,374 1,348
451 3 0
23,867 16
4,294 66,617
1 s t h a l f
1,158 165 4 0
1,203 936 332
32 20,088
9 4,522 N.A.
1980
1978 1979
2nd h a l f
260 9 9 - - 26
1,070 195
10 16,458
9 2,278
86,264
1 s t h a l f
11 83 43 7 6
702 13 1 11
13,237 1
655 62,035
1980
1 s t h a l f
18 325 104
447
1 s t h a l f a
18 400 109
527
2nd h a l f
N.A. N .A. N .A. N .A. N .A. N .A. N.A. N.A. N .A. N .A. N.A.
1 s t h a l f
8 1,035
203
1,246
2nd h a l f
17 351 121
489
2nd h a l f
2 3 1,383
257
1,663
2nd h a l f
13 1,424
233
1,670

TABLE 5. SALE OF MANUFACTURED KCC PRODUCTS I N KENYA
Product
Who1 e m i 1 k powder Cheese Evaporated m i 1 k Skim m i l k powder B u t t e r G hee Cream
U n i t 1 1 s t h a l f I 2nd h a l f
MT 1,275 MT I 136 MT 502 MT 86 1 MT 947 MT 345 1000 l i t e r s 36
Source: Republ i c o f Kenya (1978-1980).
TABLE 6. KCC EXPORTS: 1978-1980
Product
Whole m i l k powder Cheese Skim m i l k powder B u t t e r Ghee
Source: Republ i c
1 s t h a l f 2nd h a l f I 1 s t h a l f I 2nd h b l f
----
U n i t
MT MT MT MT MT
I
' Kenya (1978-1980).
1978
1 s t h a l f
49 1 10 4
39 1 2
2nd h a l f
935 10 5 5
655 14
1979 1980
1 s t h a l f
6 37 8
264 506
3
1 s t h a l f
933 9 - - 1 - -
2nd h a l f
544 11
5 08 310
12
2nd h a l f
.02 - - - - .03 .04

Dur ing d ry seasons, m i l k p roduc t ion drops o f f . There are two major reasons f o r t h i s (Hopcraf t , 1976; MLD, 1980): - ( a ) Most farmers l ack t h e c a p i t a l and t h e e x p e r t i s e t o suc-
c e s s f u l l y preserve adequate amounts o f feed necessary t o ma in ta in l a c t a t i o n du r i ng t h e d ry season.
( b ) The cu r ren t government -cont r o l l ed p r i c i n g system does not p rov ide i ncen t i ves f o r farmers t o i n v e s t i n techno1 ogy needed t o increase m i l k p roduc t i on d u r i n g t h e d ry sea- son. The same p r i c e i s pa id f o r m i l k throughout t h e year. Therefore, it i s i n t h e fa rmers ' i n t e r e s t t o pro- duce .as much m i l k as he o r she can w h i l e feed costs are 1 ow.
M i l k shortages are, however, o f t e n handled c r e a t i v e l y . I n response t o Na i rob i consumer compla in ts about "an odd f l a v o r i n t h e mi l k , " an a r t i c l e appeared i n t h e A p r i l 9, 1982, Kenyan newsmagazine "The Weekly Review. " The KCC managing d i r e c t o r a t t r i b u t e d t h e odd f l a v o r t o product f o r m ~ ~ l a t i o n . Skimmed m i 1 k powder had been mixed w i t h b u t t e r o i 1 t o c rea te a product t h a t had been marketed as f l u i d m i l k . Fresh m i l k alone could not meet na t i ona l demand between January and March 1982.
2. KCC i s e s s e n t i a l l y on ly a surp lus buyer i n t h e small ho lde r farming areas (Hopcraf t , 1976; Mbugua, 1976). The r u r a l areas ' demand f o r mi 1 k has not y e t been met. Subs tan t i a l i ncreases i n m i 1 k p roduc t ion would be absorbed be fo re any impact could be made on t h e commercial market.
3. Evening m i l k i s very r a r e l y co l l ec ted . One reason may be t h e s u b s t a n t i a l l y increased d i f f i c u l t y o f d r i v i n g a f t e r dark on poor roads. By morning, t h e q u a l i t y o f raw evening m i l k has o f t e n d e t e r i o r a t e d beyond acceptable 1 i m i t s (Mbugua, 1976).
4. Payments t o farmers are o f t e n delayed.
5. Producers ' p r i c e s are q u i t e low.
6. R e l a t i v e l y h i gh consumer p r i c e s o f both commercial and non- commercial m i l k are p r o h i b i t i v e f o r very poor f a m i l i e s .
MILK I N M E KENYAN DIET
Along w i t h a chron ic need f o r c a l o r i e s , undernourished people r e q u i r e h i gh q u a l i t y p r o t e i n , calc ium, and both f a t and water so lub le v i tamins. As a s i n g l e food, m i l k comes c l oses t t o meet ing these needs, as w e l l as p r o v i d i n g a source of f a t and minera ls . M i l k i s , however, an incomplete source o f i r o n , copper, and v i tamins C and D.
Kenya has a long d a i r y i n g h i s t o r y t h a t extends, perhaps, as f a r back as 4000 t o 3000 B.C. (Johnson e t a1 . . 1974). M i l k and d a i r y products have
remained popular th rough t h e years (Kurwi j i l a , 1980; MLD, 1980) and demand. p a r t i c u l a r l y i n densely popula ted areas, exceeds cu r ren t 1y a v a i l a b l e supp l ies .
Desp i t e t h e n u t r i t i o n a l bene f i t s o f consuming m i l k , p o l i c i e s designed t o encourage i ncreased m i 1 k consumption i n devel op ing count r i es are cont ro - v e r s i a l . The major concern i nvo l ves malabsorpt i o n of l a c tose and subse- quent de t r iment a1 e f f e c t s on heal t h.
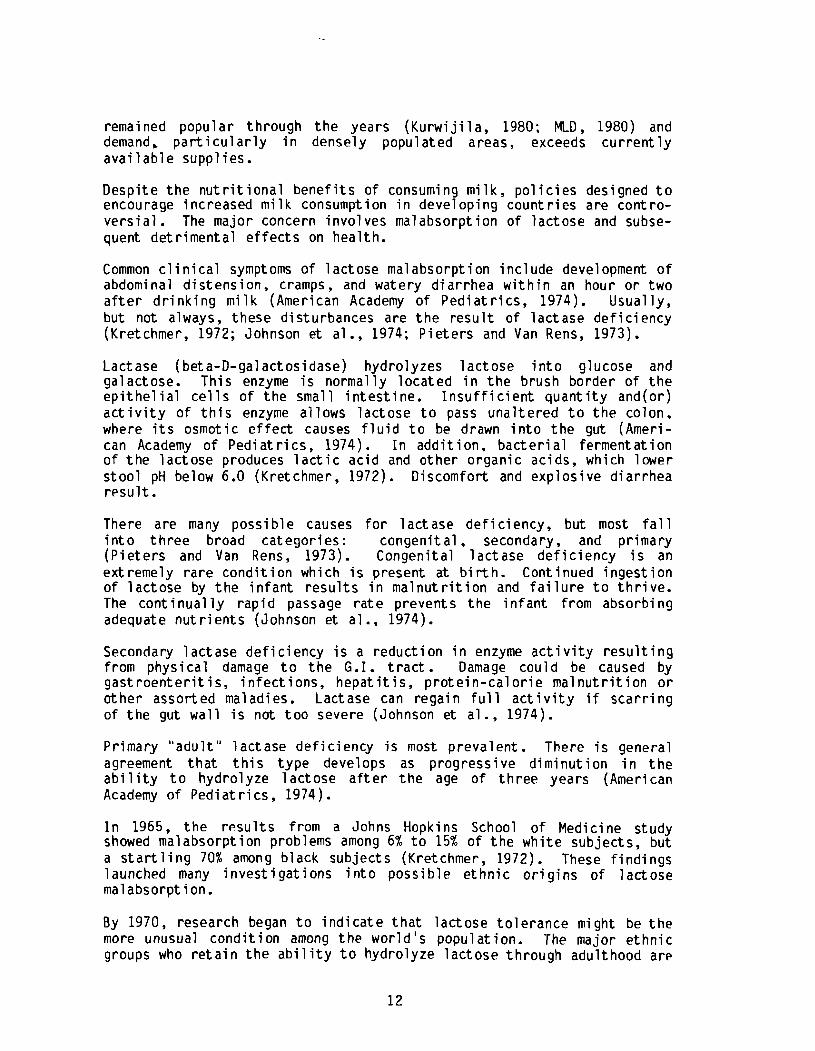
Common c l i n i ca l symptoms of 1 ac t ose ma1 absorpt i on i n c l u d e development o f abdominal d i s t ens ion , cramps, and watery d i a r r h e a w i t h i n an hour o r two a f t e r d r i n k i n g m i l k (American Academy o f P e d i a t r i c s , 1974). Usua l l y , but not always, these d is turbances are t h e r e s u l t o f l a c t ase d e f i c i e n c y (Kretchmer, 1972; Johnson e t al. , 1974; P i e t e r s and Van Rens, 1973).
Lact ase (be t a-D-gal ac t o s i dase) hydro lyzes 1 ac t ose i n t o glucose and galactose. Th i s enzyme i s normal ly l o c a t e d i n t h e brush border o f t h e e p i t h e l i a l c e l l s o f t h e smal l i n t e s t i n e . I n s u f f i c i e n t q u a n t i t y and(or ) a c t i v i t y o f t h i s enzyme a l lows l ac tose t o pass u n a l t e r e d t o t h e colon, where i t s osmotic e f fec t causes f l u i d t o be drawn i n t o t h e gut (Ameri- can Academy o f P e d i a t r i c s , 1974). I n add i t i o n , b a c t e r i a1 ferment a t i o n of t h e l a c t o s e produces l a c t i c a c i d and o the r o rgan ic ac ids, which lower s t o o l pH below 6.0 (Kre t chmer , 1972). D iscomfor t and exp los i ve d i a r rhea r e s u l t .
There are many p o s s i b l e causes f o r l a c t a s e d e f i c i e n c y , but most fa1 1 i n t o t h r e e broad ca tegor ies : congeni t a1 , secondary, and pr imary ( P i e t e r s and Van Rens, 1973). Congeni ta l l a c t a s e d e f i c i e n c y i s an ext remely r a r e c o n d i t i o n which i s present a t b i r t h. Cont inued inges t i o n o f l a c t o s e by t h e i n f a n t r e s u l t s i n m a l n u t r i t i o n and f a i l u r e t o t h r i v e . The con t i nua l l y r a p i d passage r a t e prevents t h e i n f an t from absorb ing adequate n u t r i e n t s (Johnson et a1 . , 1974).
Secondary 1 ac t ase d e f i c i ency i s a r e d u c t i on i n enzyme a c t i v i t y r e s u l t i n g f rom phys i ca l damage t o t h e G. I . t r a c t . Damage cou ld be caused by g a s t r o e n t e r i t i s , i n f ec t i ons , hepat it i s , p r o t e i n - c a l o r i e ma1 n u t r i t i o n o r o the r assor ted maladies. Lactase can rega in f u l l a c t i v i t y i f s c a r r i n g o f t h e gut w a l l i s not t o o severe (Johnson e t al. , 1974).
Pr imary " a d u l t " l a c t a s e d e f i c i e n c y i s most p reva len t . There i s general agreement t h a t t h i s t y p e develops as p rog ress i ve d i m i n u t i o n i n t h e a b i l i t y t o hydro lyze l a c t o s e a f t e r t h e age o f t h r e e years (American Academy o f Pedi a t r i cs , 1974) . I n 1965, t h e r e s u l t s f rom a Johns Hopkins School o f Medicine s tudy showed malabsorpt ion problems among 6% t o 15% of t h e w h i t e sub jec ts , but a s t a r t 1 i n g 70% among b lack sub jec ts (Kretchmer, 1972). These f i n d i n g s 1 aunched many i n v e s t i g a t i o n s i n t o p o s s i b l e e t h n i c o r i g i n s o f 1 act ose ma1 absorpt i on.
By 1970, research began t o i n d i c a t e t h a t l ac tose t o l e r a n c e might be t h e more unusual c o n d i t i o n among t h e w o r l d ' s popu la t ion . The major e t h n i c groups who r e t a i n t h e a b i l i t y t o hydro lyze l a c t o s e th rough adul thood are

no r the rn Europeans and t h e i r descendents and members o f t h r e e A f r i c a n pas to ra l t r i b e s . Many o ther genera l l y t o l e r a n t groups a l so e x i s t , but most o f t h e peoples o f t h e wor ld seem t o r e t a i n on ly a l i m i t e d a b i l i t y t o hydro lyze l a c t o s e (Kretchmer, 1972). Theor ies p e r t a i n i n g t o t h e r e t e n t i o n o f cont inued h igh l e v e l s o f l a c t ase act i v i t y throughout 1 i fe among c e r t a i n e t h n i c popul a t i ons a re s t i 11 open f o r specul a t i on (Kretchmer, 1972; Johnson e t a1 ., 1974).
Lactose malabsorpt ion i s diagnosed by one o r more o f t h e f o l l o w i n g methods (Kretchmer, 1972) :
1. Observat ion o f c l i n i c a l symptoms ( f l a t u l e n c e , d ia r rhea) 30 min t o 60 min a f t e r i n g e s t i o n of a l a c t o s e dose o f 2 g l k g body weight, up t o a maximum o f 50 g o r 100 g
2. Low l a c t a s e a c t i v i t y ( l e s s than 2 enzyme u n i t s per gram o f wet t i s s u e we igh t ) as determined by biopsy o f t h e small i n t e s t i n e f 01 1 owing 1 ac t ose i ngest i on
3. Blood glucose e l e v a t i o n o f l e s s t h a n 20 mg/100ml o f b lood f o l 1 owing i n g e s t i o n o f measured l a c t o s e doses
I n a b i l i t y t o complete ly hydro lyze lac tose , as i n d i c a t e d by low blood g l ucose e l evat i on, does not necessar i l y mean t h a t c l i n i ca l symptoms w i 11 develop when m i 1 k i s ingested. Adverse symptoms seem t o be a f u n c t i o n o f qua1 i t y o f m i 1 k consumed, i n t e r v a l s between consumption and o t h e r foods consumed along w i t h m i l k (Simoons e t al., 1977).
The r e s u l t s from a study i n Lagos, N ige r i a , suggest t h a t l a c t o s e t o l e r a n c e l e v e l s can be increased by r e g u l a r i n t a k e o f l ac tose over a l ong pe r i od o f t i m e (Kretchmer, 1972). 'The mechanism f o r t h i s apparent phenomenon i s unc l ear. Blood glucose 1 eve1 s remai ned depressed, i n d i - cat i ng no r e a l inc rease i n enzymat i c act i v i t y . Researchers hypothesized t h a t t h e d i e t e f f e c t e d a change i n t h e gut m i c r o f l o r a and t h a t t h e new b a c t e r i a was ab le t o metabol ize t h e l ac tose (Kretchmer, 1972).
Lactose ma1 absorpt i o n symptoms do not usual l y occur a f t e r inges t i o n o f fermented m i l k products such as yogur t and cheese. One poss ib l e exp la- n a t i o n f o r t h i s i s t h e o v e r a l l reduced l a c t o s e content i n fermented d a i r y foods (Johnson et a1 ., 1974). A recent study i n Na i rob i showed h igh consumer accept ab i 1 i t y of fermented m i 1 k products. No undesi r a b l e e f f e c t s were caused by t a s t i n g t h e var ious yogu r t s (Kurwi j i l a , 1980). The Department o f Food Science and Technology at t h e U n i v e r s i t y o f Nai r o b i i s c u r r e n t l y s tudy ing t h e p o t e n t i a l f o r development o f sa fe and acceptable fermented m i 1 k products (Schul t hess and Kurwi ji 1 a, personal communication).
Lactose ma1 absorp t ion has been documented among a group o f Kenyan school c h i l d r e n ( P i e t e r s and Van Rens, 1973). Seventy-three percent o f t h e 72 c h i l d r e n i n t h e study were found t o have low b lood glucose e l e v a t i o n l e v e l s f o l 1 owing 1 actose inges t ion . Desp i te t h i s evidence o f l a c t o s e malabsorpt ion , no c l i n i c a l symptoms developed w i t h i n t h i s group, even a f t e r t e s t doses o f m i l k were doubled and quadrupled.

The conc lus ions from t h i s s tudy were very s i m i l a r t o those of t h e American Academy o f P e d i a t r i c s (1974). Both s t a t e t h a t evidence i s i n s u f f i c i e n t t o d iscourage consumption o f m i 1 k i n areas where ch i 1 dhood m a l n u t r i t i o n a re common. The n u t r i t i o n a l e f f e c t s o f moderate, informed use of m i l k outweigh t h e p o t e n t i a l r i s k s .
ROLE OF LIVESTOCK I N KENYAN SMALLHOLDER FARM SYSTEMS
L i ves tock p l ay a very impor tan t r o l e on smal l farms i n r u r a l Kenya. L i ves tock ownership i s an i n t e g r a l p a r t o f t h e Kenyan s o c i a l f a b r i c and must be examined as p a r t o f a complex system r a t h e r t han as an indepen- dent phenomenon (Sands, 1983).
T r a d i t i o n a l l y , animals may have been valued more f o r q u a n t i t y t han q u a l i t y , so a f a rme r ' s o b j e c t i v e may be t o maximize h i s herd numbers r a t h e r t han any p a r t i c u l a r aspect o f p roduc t ion . L i ves tock may be u n i t s o f exchange, "sav i ngs account" equi va len ts , o r y a r d s t i cks o f soc i a1 ach i evement . I n a d d i t i on , l i v e s t o c k a re expected t o p rov i de t r a c t i on , meat, m i l k , h ides, and an assortment o f o t he r by-products (Hopcra f t , 1976: Sands, 1983).
The quest i on of resource a1 1 ocat i on bet ween 1 i vest ock product i on and ( o r ) p roduc t i on of s t r i c t l y human food i s a se r ious concern i n t h e densely popula ted smal 'I ho l de r farmi ng areas (MLD--Kakamega D i s t r i c t , 1982). The Counci 1 o f A g r i c u l t u r a l Science and Technology (CAST, 1975) warns t h a t l i v e s t o c k might disappear from smal l farm systems i n areas o r per iods of c r i t i c a l food shortages. Indeed, accord ing t o M i n i s t r y o f L i ves tock Development repor ts , a t r e n d toward sma l l e r numbers o f animals may be devel op ing (MLD-Kakamega D i s t r i c t , 1982).
Animal products are, however, a very impor tan t source o f h i gh q u a l i t y p r o t e i n i n t h e human d i e t . I n reg ions where food i s scarce, e f f o r t s must be made t o p l ace emphasis on animal p r o t e i n p roduc t i on th rough convers ion of feeds t h a t a re noncompet i t i ve w i t h human food resources (Devendra, 1980).
DUAL-PURPOSE GOATS
One SR-CRSP goal i n Kenya i s t o determine t h e v i a b i 1 i t y o f goat manage- ment systems produc ing m i 1 k f o r human consumption. A des i r a b l e system i s one i n which t h e farmer p rov ides goats w i t h fodder, c rop by-products, reasonable h e a l t h care, and p r o t e c t i o n f rom preda to rs . I n t u r n , t h e goat system would p rov i de t h e farmer w i t h m i l k , manure f o r f e r t i l i z e r , meat, and k i d s . 'The r a t i o n a l e behind s e l e c t i n g goats as t e s t animals i nc l udes t h e f o l 1 owing:
1. Goats a re l ess c o s t l y t han c a t t l e , r e q u i r i n g sma l l e r i n i t i a l - investment and t he re fo re l ess f i n a n c i a l r i s k by t h e farmer.
2. A goat may k i d between 1 yr and 2 yr o f age a f t e r o n l y a 5-mo g e s t a t i o n per iod , whereas a cow i n t h e t r o p i c s may t a k e 3 y r t o 5 y r t o reach t h e necessary weight and m a t u r i t y f o r he r f i r s t breedi ng.
3. A goat r equ i r es l ess feed t h a n a cow.
4. Goats can produce m i 1 k and meat p r o t e i n s f rom crop by-products t h a t o therw ise might not be u t i l i z e d .
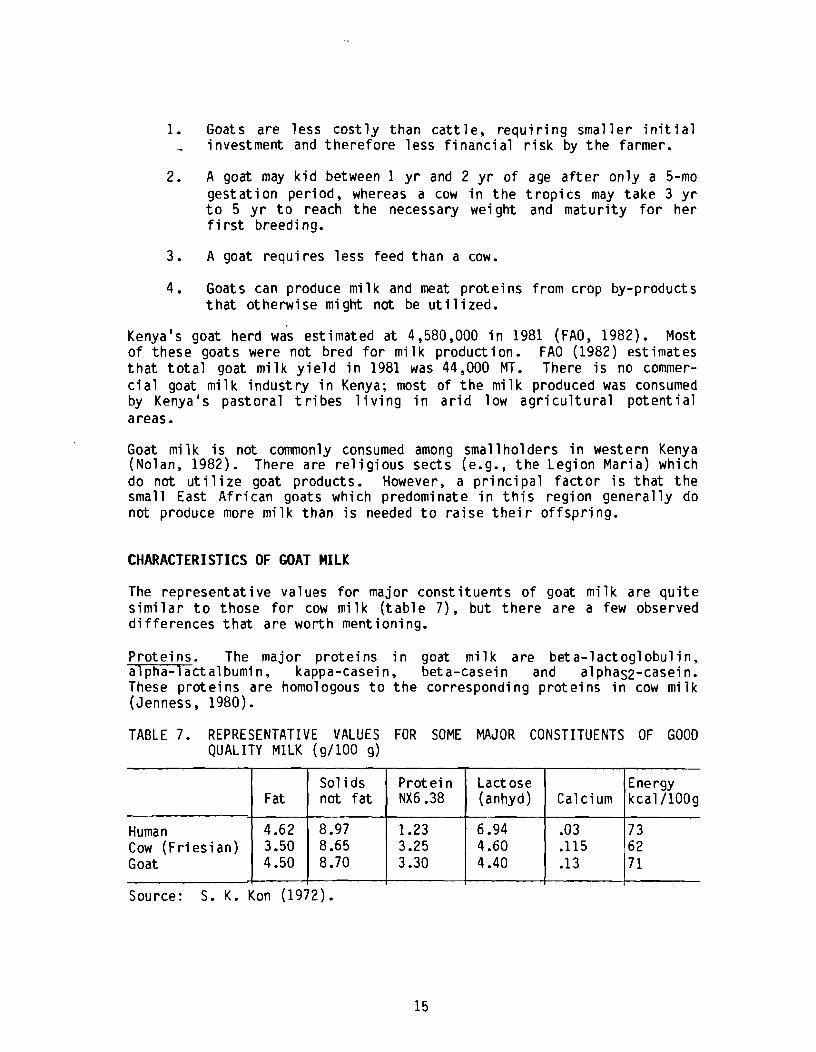
Kenya's goat herd wa's est imated a t 4,580,000 i n 1981 (FAO, 1982). Most o f t hese goats were not bred f o r m i l k p roduc t ion . FA0 (1982) est imates t h a t t o t a l goat m i l k y i e l d i n 1981 was 44,000 MT. There i s no commer- c i a l goat m i 1 k i n d u s t r y i n Kenya; most o f t h e m i l k produced was consumed by Kenya's p a s t o r a l t r i b e s l i v i n g i n a r i d low a g r i c u l t u r a l p o t e n t i a l a reas.
Goat m i l k i s not commonly consumed among smal l ho l de rs i n western Kenya (Nolan, 1982). There are r e l i g i o u s sec ts (e.g., t h e Legion Mar ia) which do not u t i l i z e goat products. However, a p r i n c i p a l f a c t o r i s t h a t t h e smal l East A f r i c a n goats which predominate i n t h i s r eg ion g e n e r a l l y do not produce more m i l k t han i s needed t o r a i s e t h e i r o f f s p r i n g .
CHARACTERISTICS OF GOAT MILK
The rep resen ta t i ve values f o r major c o n s t i t u e n t s o f goat m i l k a re q u i t e s i m i l a r t o t hose f o r cow m i l k ( t a b l e 7), but t h e r e a re a few observed d i f f e r e n c e s t h a t a re wor th ment ioning.
Pro te ins . The major p r o t e i n s i n goat m i 1 k a re be ta - l ac tog lobu l i n , a1 pha-1 ac t a1 bumi n, kappa-casei n, bet a-casei n and a1 phas2-casei n. These p r o t e i n s a re homologous t o t h e cor responding p r o t e i n s i n cow m i l k (Jenness , 1980).
TABLE 7. REPRESENTATIVE VALUES FOR SOME MAJOR CONSTITUENTS OF GOOD QUALITY MILK (g/100 g)
I Fat
Human b;t ( F r i e s i a n ) p- Source: S. K. Kon (19
Sol i d s not f a t -
8.97 8.65 8.70
2)
Prot e i n NX6.38
1.23 3.25 3.30
Lactose (anhyd)
6.94 4.60 4.40
Calcium
.03
.I15
.13
Energy kca1/100g
7 3 62 7 1
I

Goat m i l k has l i t t l e o r no a lphas l -case in . a p r o t e i n present i n cow m i l k (J.enness, 1980). The l ack o f t h i s p r o t e i n seems t o cause a c i d i f i e d goat m i l k t o have s o f t e r , sma l le r curds t han a c i d i f i e d cow m i l k . These s o f t e r curds have g iven r i s e t o specu la t i on t h a t goat m i l k p r o t e i n s may be more r e a d i l y d iges ted than cow m i l k p ro te i ns , but t h i s has not been experiment a1 l y proven (Jenness, 1980).
Nonprote in n i t r o g e n (NPN) i s h i ghe r i n goat m i l k t han i n cow m i l k (Jenness, 1980; Devendra, 1980).
V i tamins. When data on v i t am in content o f goat m i l k are c a l c u l a t e d i n r e l a t i o n t o c a l o r i e requirements o f i n f a n t s (i.e., goat m i l k as t h e so le food source), v i t am in A, n i a c i n , th iamin , r i b o f l a v i n , and pantothenate are found t o be adequate. Goat m i l k i s d e f i c i e n t i n v i t am ins C, 0, B12, py rox i d i ne , and f o l a t e (Jenness, 1980). By t h e same measure, cow m i l k i s d e f i c i e n t i n v i tamins C and 0, but i s cons idered adequate i n B v i tamins .
Agg lu t i n i n . Goat m i l k l acks " a g g l u t i n i n , " t h e f a c t o r present i n cow m i l k which causes f a t g lobu les t o c l u s t e r when cooled (Jenness, 1980). As a r e s u l t , cream r i s e s very s l ow l y i n goat m i 1 k.
MILK PRODUCTION, PURCHASE, PROCESSING, AND DAIRY PRODUCT CONSUMPTION I N EIGHTY HONESTEADS I N WESTERN KENYA -
INTRODUCTION
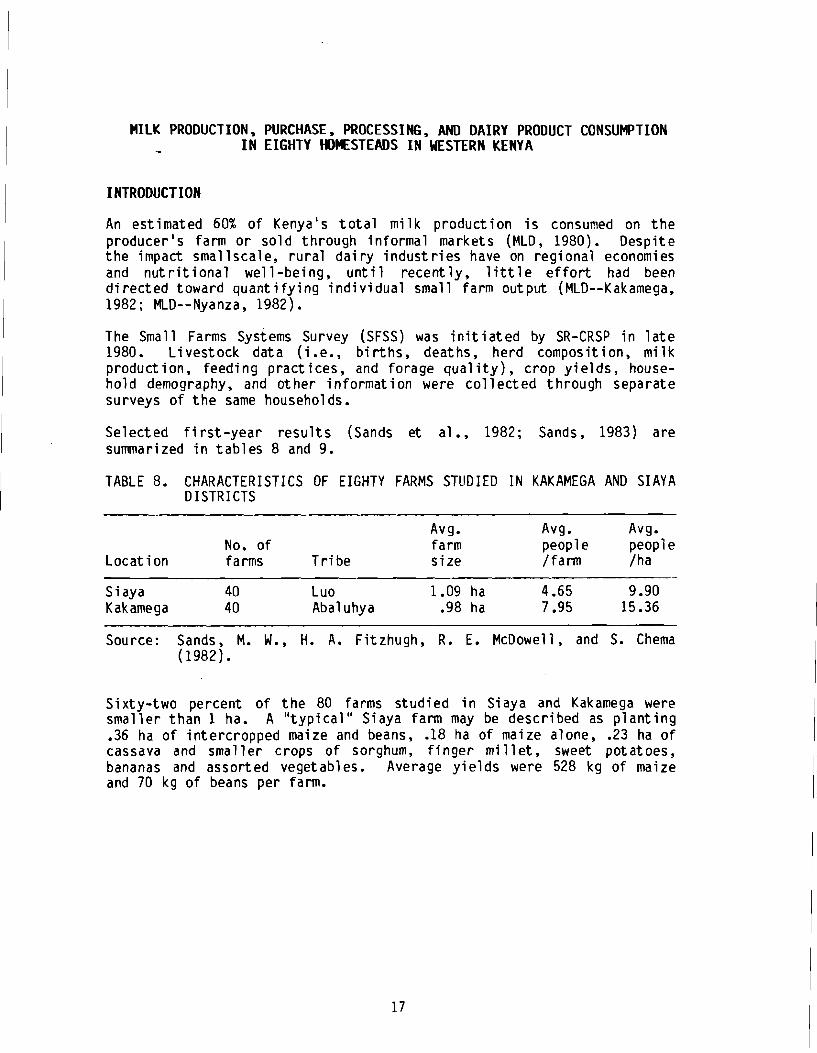
An est imated 60% o f Kenya's t o t a l m i l k p roduc t ion i s consumed on t h e p roducer ' s farm o r so ld through in fo rma l markets (MLD, 1980). Desp i te t h e impact smal l s ca le , r u r a l da i r y indus t r i e s have on reg iona l economies and n u t r i t i o n a l we1 1 -being, unt i 1 recen t l y , 1 itt l e e f f o r t had been d i rec ted toward quant i f y i n g i n d i v i d u a l smal l farm out put (MLD--Kakamega, 1982; MLD--Nyanza, 1982).
The Small Farms systems Survey (SFSS) was i n i t i a t e d by SR-CRSP i n l a t e 1980. L i ves tock data ( i . . b i r t h s , deaths, herd composit ion, m i l k product ion, feeding p rac t i ces , and forage qua1 i t y ) , crop y i e l d s , house- ho ld demography, and o the r in fo rmat i o n were c o l l e c t e d th rough separate surveys of t h e same households.
Selected f i r s t - y e a r r e s u l t s (Sands e t a1 . , 1982; Sands, 1983) a re summarized i n t a b l e s 8 and 9.
TABLE 8. CHARACTERISTICS OF EIGHTY FARMS STUDIED IN KAKAMEGA AND SIAYA DISTRICTS
Avg. Avg . Avg. No. o f farm peopl e people
Loca t i on farms T r i b e s i z e / farm /ha
S i aya 40 Luo 1.09 ha 4.65 9.90 Kakamega 40 Abal uhya .98 ha 7.95 15.36
Source: Sands, M. W., H. A. F i tzhugh, R. E. McDowell, and S. Chema (1982).
S ix ty - two percent o f t h e 80 farms s tud ied i n Siaya and Kakamega were sma l le r t han 1 ha. A " t y p i c a l " Siaya farm may be descr ibed as p l a n t i n g .36 ha o f in te rc ropped maize and beans, .18 ha of maize alone, .23 ha o f cassava and sma l le r crops of sorghum, f i n g e r m i l l e t , sweet potatoes, bananas and assor ted vegetables. Average y i e l d s were 528 kg o f maize and 70 kg o f beans per farm.

TABLE 9. 1981 CATTLE NUMBERS AND PRODUCTION FIGURES -
Avg . No. o f To ta l no. Cal v i ng 1 ac t a t i on M i l k y i e l d
Locat i on farms o f c a t t l e i n t e r v a l l e n g t h I 1 ac t a t i o n
S i aya 40 117 21.3 mo 9.8 mo 302 kg Kakamega 40 102 19.6 mo 10.9 mo 419 kg
Source: Sands, M. W., H. A. F i tzhugh, R. E. McDowe11, and S. Chema (1982).
About h a l f o f t h e farms had 1 i ves tock . A t y p i c a l herd i nc l udes 2 o r 3 cows, severa l sheep and goats, and 10 t o 15 ch ickens (Sands, 1983).
A " t y p i c a l " Kakamega farm had .41 ha o f i n t e r c ropped maize and beans and minor crops of maize alone, sorghum, bananas, sweet potatoes and assor ted vegetables on an average o f .3 ha. Average y i e l d s were 843 kg o f maize and 382 kg o f beans. H a l f o f t h e fami 1 i e s had 1 o r 2 cows, 1 sheep, and a few chickens; o n l y 1 f a m i l y had goats (Sands, 1983).
The s t a p l e d i e t i n bo th areas i s a coa rse l y ground maize meal paste c a l l e d u g a l i . Th i s d i s h may be served a lone o r w i t h fermented m i l k and(o r ) vegetables, meat, o r f i s h .
Survey r e s u l t s regard ing d a i r y consumption and p roduc t i on a r e presented i n t h i s sec t ion . Resu l t s f rom analyses o f d a i r y products sampled i n t h e research areas a re a l s o inc luded.
Surveys. M i l k p roduc t i on da ta were c o l l e c t e d f rom t h e Small Farms Systems Survey .*
The da i ry product process ing and consumption surveys (Appendix 1 ) were developed i n c o l l a b o r a t i o n w i t h t h e SR-CRSP f i e l d s t a f f . The survey ques t ions were f i e l d - t e s t ed and r e v i sed t w i c e be fo re da ta co l 1 e c t i on began i n Siaya and Kakamega research areas.
D a i r y Product Sampling. Fresh and fermented m i l k and b u t t e r samples were c o l l e c t e d from i n d i v i d u a l farmers i n t h e Kakamega area. I n Siaya, samples were purchased a t an outdoor market. Goat m i l k samples were c o l l e c t e d from farms c o l l aborat i n g w i t h SR-CRSP dual -purpose goat f i e l d t r i a l s .
* For d i scuss i on o f househol d s e l ec t i on and SFSS met hod01 ogy, see Sands, M. W., H. A. F i tzhugh, R. E. McDowell, and S. Chema (1982).

Two samples o f each product were placed i n 40-ml Nasco sample bags; 1 sample- was preserved by a d d i t i o n o f a few c r y s t a l s o f sodium d i ch ro - mate. Samples were dated, l a b e l l e d , and t r a n s p o r t e d on i c e t o t h e Maseno V a t e r i nary Farm.
The dichromate samples were placed d i r e c t l y i n a r e f r i g e r a t o r (about 4C), where t hey were he ld u n t i l t hey cou ld be t r a n s p o r t e d t o a labora - t o r y i n t h e R i f t Va l ley .
The nonpreserved samples were mixed w e l l , t h e n t r i p 1 i c a t e .2-ml por- t i o n s were p i p e t t e d i n t o c lean t e s t tubes. These tubes were covered w i t h p l a s t i c food wrap, l a b e l l e d , and f r ozen f o r l a t e r de te rm ina t i on o f 1 ac t ose.
T i t r a t a b l e a c i d i t y was immediately determined on t r i p 1 i c a t e 9-ml por- t i o n s o f t h e nonpreserved m i l k samples.
M i l k Sample Analyses. N i t r ogen was determined by t h e K j e l d a h l method and expressed as crude p r o t e i n by m u l t i p l y i n g by t h e f a c t o r 6.38. Fat was determined by t h e Gerber method, except f o r t h e b u t t e r samples, which were analyzed by e the r e x t r a c t i o n . M i l k samples were he ld at 102C i n t h e d r y i n g oven f o r t o t a l s o l i d s de te rmina t ion . Ash was determined by weighing t h e samples a f t e r h o l d i n g them overn igh t a t 500C i n t h e m u f f l e furnace. The tit r a t a b l e a c i d i t y method was descr ibed by Kosi kowski (1978).
Lactose Ana lys is . Lactose was analyzed by t h e f o l 1 owing m o d i f i c a t i o n o f t h e Fe i t osa Teles method (Fe i t osa Teles e t a1 ., 1978).
1. Add 4 m l d i s t i l l e d w a t e r t o .2 m l m i l k sample 2. Add .4 m l ZnSOq (5%) 3. Add .4 m l Ba(OH)2 (4.5%) 4. Vor tex 5. C e n t r i f u g e 1 min a t 1500 g 6. D e l i v e r .5 m l c l e a r supernatant f l u i d t o screw cap c u l t u r e
t u b e 7. D e l i v e r 1.25 m l Teles Reagent 8. Incuba te 10 min a t 85C t o 90C 9. D i l u t e w i t h 10 m l d i s t i l l e d water
10. Read absorbance a t 520 nm
0%, 2%, 4%, 6%, and 8% l a c t o s e standards a re made up i n d i s t i 1 l e d water.
Te les Reagent. 1 volume 1% phenol, 2 volumes 5% NaOH, 2 volumes 1% p i c r i c ac id , and 1 volunie 1% sodium b i s u l f i t e mixed i n t h a t order .
Chemicals used i n these analyses were f rom t h e f o l l o w i n g sources:
1. Ba(OH)2. BDH 1 abora to ry reagents. G l axo 1 abo ra to r i es , Bombay, I nd i a .
2. Phenol . BDH Chemicals , Ltd., Pool e, England. 3. Lactose. BDH Chemicals, Ltd., Poole, England.

A l l o t he r chemicals were purchased a t e i t h e r Howse and McGeorge, Ltd., o r E. T. Monks and Co., L td . i n Na i rob i . These chemicals were packed and l a b e l l e d by t h e above companies.
S t a t i s t i c a l Analyses. One way c l a s s i f i c a t i o n analyses o f va r iance were performed on survey data t o t e s t d i f f e r e n c e s i n p roduc t i on and consump- t i on p a t t e r n s between Si aya and Kakamega study areas.
RESULTS
M i l k Produc t ion and Supply. The 1982 c a t t l e numbers and p roduc t i on f i g u r e s s e a r c h farms a re i n t a b l e 10. There a re no improvements over 1981- f i gu res ; i n f a c t , c a t t l e numbers and average 1 act a t i on 1 engt hs decreased.
TABLE 10. 1982 CATTLE NUMBERS AND PRODUCTION FIGURES
No. o f No. o f farms No. o f Mean l a c t a t i o n Mean y i e l d
Locat i o n farms w/cows c a t t l e l e n g t h (days) (kg11 a c t a t i o n )
S i aya 40 18 86 215.6 * 63.84 295.0 * 147.3 Kakamega 40 18 6 7 197.4 * 122.10 430.1 * 324.1
Average monthly m i l k y i e l d s du r i ng l a c t a t i o n on t h e Kakamega and Siaya farms were 55.02 kg and 35.10 kg, r e s p e c t i v e l y . P roduc t ion on t h e Kakamega farms was g rea te r t han on t h e Siaya farms (pc.01).
S i x f a m i l i e s i n t h e Kakamega area and t h r e e f a m i l i e s i n Siaya claimed t o o b t a i n a " s a t i s f a c t o r y amount" o f m i 1 k from, t h e i r own cows.* Th i r t y - f o u r o f t h e f o r t y farmers i n Kakamega purchased m i l k , at l e a s t occas iona l l y . Eleven bought m i l k f rom KCC d i s t r i b u t o r s , f o u r o f them on a d a i l y bas is .
Twenty-s ix o f t h e t h i r t y - e i g h t farmers i n Siaya** purchased m i l k , w i t h n i ne buy ing occas iona l l y from KCC o u t l e t s . None purchased KCC m i l k everyday. I n both areas, non-KCC purchases were made from neighbors o r a t l o c a l shops o r markets.
* A l l o f these n i n e respondents s a i d t h i s c l a i m was t r u e on l y when t h e r e had been adequate r a i n f a l l and forage growth f o r maintenance of l a c t a t i o n i n t h e i r c a t t l e .
** By t h e end o f 1982, one of t h e o r i g i n a l f o r t y farmers d ied, another had moved away.

M i l k consumption. E igh t y percent o f t h e farm f a m i l i e s i n Kakamega consumed m i l k d a i l y ; 36.8% had m i l k d a i l y i n Siaya ( t a b l e 11).
TABLE 11. FREQLIENCY OF MILK CONSLIMPTION
Frequency Kakamega (no. o f f a m i l i e s )
Siaya (no. o f f a m i l i e s )
D a i l y 1 t imelwk Rare ly Never
To ta l 40 3 8
Average d a i l y m i l k consumption per f a m i l y i n Kakamega (.82 l i t e r s ) was g rea te r t h a n t h e .42 1 i t e r s d a i l y average i n S iaya (pC.01). Table 12 has average da i l y consumption data from both d i s t r i c t s.
I n both Siaya and Kakamega, m i l k consumption was h ighe r on farms w i t h c a t t l e t han on farms w i thou t c a t t l e ( t a b l e 13).
Nine farms i n Siaya and four teen farms i n Kakamega s o l d some m i l k i n 1982. I n Kakamega, t h e est imated average amount s o l d was 1.1 l i t e r s l d a y over a 130-day pe r i od o f t ime. I n Siaya, an est imated average o f 1.32 l i t e r s l d a y was s o l d over 71.5 days. Wi th few except ions, m i l k was s o l d on ly a f t e r 1 l i t e r s l d a y had been reserved f o r f a m i l y use.
TABLE 12. ESTIMATED DAILY MILK CONSUMPTION PER FAMILY
Kakamega S i aya
Avg. d a i l y No. o f % of No. o f % of consumpt i on ( 1 ) f ami 1 i es f ami 1 i es f a m i l i e s fami l i e s
Tot a1 40 100 .O 39a 100 .O
a One respondent died.

TABLE 13. COMPARISON OF DAILY MILK CONSUMPTION: FARMS WITH AND WITHOUT - CATTLE
Kakamega S i aya
Wi th Wi thou t W i t h Wi thout c a t t 1 e c a t t 1 e c a t t 1 e c a t t l e
No. farms 18 22 18 2 2
M i 1 k consumed, 1 /day Averagea 1.07 .61 .65 .23 S D .49 .28 .45 .14
a D i f f e r e n c e s between average consumpt i o n on farm w i t h and w i t h o u t c a t t l e were s i g n i f i c a n t (p<.01) f o r b o t h d i s t r i c t s .
DAIRY PRODUCTS I N WESTERN KENYA
The most p o p u l a r d a i r y p roduc ts i n western Kenya a r e f r e s h m i l k , wh ich i s p redomina te l y used i n t e a , soured m i l k , and b u t t e r prepared f rom fermented m i l k ( t a b l e 14) . The compos i t i ons o f v a r i o u s d a i r y p r o d u c t s sampled i n t h e s tudy areas a re r e p o r t e d i n t a b l e 15.
TABLE 14. DAIRY PRODUCTS CONSUMED ON SMALL FARMS I N WESTERN KENYAa pp - -
Kakamega (40 farms) -
S iaya (38 farms)
Farms u s i n g T o t a l farms Farms u s i n g T o t a l farms Product d a i l y ( I ) u s i n g (%) d a i l y (%) u s i n g (%)
Tea 87.5 100 .O 47.4 94.7 Fermented 5 .O 72.5 15.8 65.8 Cooki ng 5 .O 62.5 23.7 97.4 Fresh 17.5 60 .O 7.9 28.9
a These f i g u r e s i n c l u d e a l l farms t h a t r e p o r t e d u s i n g t h e p roduc t , regard1 ess o f f requency o f consumption.
A n a l y s i s o f f r e s h goat and cow mi 1 k and sour cow mi 1 k show them a1 1 t o be l e s s t h a n 3% p r o t e i n ( t a b l e 15). Lac tose was j u s t over 5% i n t h e f r e s h m i l k samples and 4.66% i n t h e sour m i l k samples.
Bo th f r e s h m i l k samples had mean f a t compos i t i ons g r e a t e r t h a n 5%. Fermented mi l k samples averaged 3.61% f a t .
T o t a l s o l i d s o f t h e f r e s h m i l k samples averaged over 15%. T h i s was h i g h e r t h a n p r e d i c t e d by measurement of i n d i v i d u a l m i 1 k c o n s t i t u e n t s but c o u l d be due t o ex t raneous m a t t e r i n t h e m i l k and(o r ) improper sample we igh ing t e c h n i q u e upon removal from t h e d r y i n g oven. The b u t t e r

TABLE 15. COMPOSITIONS OF DAIRY PRODUCTS SAMPLED I N SIAYA AND KAKAMEGA
Fresh cow m i l k
Fresh goat m i l k
Fermented cow m i l k
B u t t e r
Fermented reduced- fa t m i l k
-1 p r o t e i n I l at I T o t a l s o l i d s
a S i x f r e s h cow m i l k samples were analyzed f o r l a c t o s e . .
T h i r t e e n goat m i l k samples were analyzed f o r l a c t o s e and l a c t i c a c i d .
Ash

samples had a mean f a t compos i t i on o f 62.97%, a long w i t h 2.01% p r o t e i n . T o t a l s o l i d s were no t determined.
One reduced- fa t sour m i l k sample was analyzed. The sample was o n l y .70% f a t and 9.2% t o t a l s o l i d s . The sample was 2.71% p r o t e i n , 4.31% l a c t o s e , and 1.26% l a c t i c ac id .
MILK PRODUCT CHARACTERISTICS
MILK I N TEA
The most p o p u l a r use f o r m i l k on respondents ' farms was i n p r e p a r a t i o n o f t e a . I n bo th d i s t r i c t s , but p a r t i c u l a r l y i n Kakamega, o t h e r p roduc ts were o f t e n prepared o n l y when fami 1 i e s had more mi 1 k t h a n t h a t needed f o r d a i l y t e a p r e p a r a t i o n .
P repara t ion . Water i s brought t o a b o i l , t h e n t e a leaves a r e added (about 2 heaping teaspoons f o r every 3 cups of w a t e r ) . When t h i s comes t o a f u l l b o i l , m i l k i s added. The p r e f e r r e d m i l k t o wa te r r a t i o i s approx ima te ly 1:2, but t h i s can vary t o 1:6, depending on t h e a v a i l a b i l - i t y of m i l k . F requen t l y , sugar i s added a t t h e same t i m e as t h e m i l k (about 67 g / l o f beverage). T h i s m i x t u r e i s brought t o a b o i l . A l l o f t h e i n g r e d i e n t s a r e heated t o g e t h e r f o r about 5 t o 10 minutes.* The t e a i s s ieved b e f o r e se rv ing .
FRESH MILK (NOT I N TEA)
Fresh m i l k i n bo th areas was g e n e r a l l y consumed by c h i l d r e n , a l t h o u g h f o u r f a m i l i e s c la imed t h a t it was drunk p e r i o d i c a l l y by n e a r l y everyone i n t h e f a m i l y .
S i x t y - f i ve percent o f t h e fami 1 i e s i n Kakamega and f o r t y - t w o percent o f t h e f a m i l i e s i n S iaya heat o r b o i l t h e i r m i l k b e f o r e d r i n k i n g o r p ro - c e s s i ng.
SOUR MILK (MAZIWA LALA)
Sour m i l k i s prepared by spontaneous fe rmen ta t ion of m i l k i n a gourd c a l l e d a calabash. The calabash, a long w i t h a round, f l a t - b o t t o m e d cook ing pan, rep resen t t o t a l mi 1 k p rocess ing equipment ava i 1 a b l e on most o f t h e farms.
* Many respondents mentioned t h a t p r e p a r a t i o n t i m e v a r i e d g r e a t l y depending on t h e a v a i l a b l e f u e l source.

Sour m i l k f l a v o r development i s unique t o each calabash. Many respon- dents c l a i m a s t r ong preference f o r t h e f l a v o r o f t h e sour m i l k produced on t h e i r own farms. These f l a v o r s are very d i f f i c u l t t o cha rac te r i ze and a re nea r l y imposs ib le t o dup l i ca te . Smoky f l a v o r and extraneous ma t te r are very common.
Preparat ion. Fresh m i l k i s poured i n t o t h e calabash, which i s t hen plugged w i t h a p iece o f wood o r a wad o f banana leaves. The m i l k i s l e f t t o r e s t f o r about 3 days, but i s gene ra l l y consumed be fo re t h e 5 t h day.
The calabash i s u s u a l l y r i nsed w i t h water and l e f t t o d ry i n t h e sun a f t e r p repa ra t i on of , 2 batches of soured m i l k .
The res idua l c u l t u r e remaining i n t h e calabash, along w i t h microorga- nisms a l ready present i n t h e m i l k , are gene ra l l y a l l t h a t i s needed t o s t a r t t h e next fermentat ion. Some respondents i n Siaya repor ted adding f r e s h orange j u i c e t o r e l u c t a n t batches o f m i l k t o speed sour ing. One Siaya f a m i l y blends cow u r i n e i n t o t h e m i l k . Several people repo r t adding a " t r a d i t i o n a l herb" t o t h e calabash t o a i d coagu- l a t i o n . Attempts t o i d e n t i f y t h i s "herb" were unsuccessful .
BUTTER
B u t t e r i s gene ra l l y prepared on l y when t h e r e i s a r e l a t i v e surp lus o f m i l k a v a i l a b l e on t h e farm. Both t h e b u t t e r and t h e r e s u l t i n g reduced- f a t m i l k a re used i n cooking vegetables. I n a d d i t i o n , t h e m i l k may a l s o be drunk.
Preparat ion. B u t t e r i s churned when t h e calabash i s a t l e a s t h a l f f u l l o f 2-day t o 3-day o l d soured m i l k . The gourd i s shaken v i go rous l y on t h e lap. Churning i s cont inued u n t i l d i s t i n c t lumps develop. The gourd contents are t hen emptied i n t o a pan and t h e b u t t e r i s separated from t h e m i l k .
Fresh m i l k , soured f u l l - f a t and p a r t i a l - f a t m i l k and b u t t e r each may be used as l i q u i d stock f o r cooking vegetables. The use of m i l k i n cooking i s p a r t i c u l a r l y popular i n Siaya.
ADEQUACY OF CURRENT MILK SUPPLIES I N M E RESEARCH AREAS
E i g h t y - f i v e percent o f t h e fami 1 i e s i n te r v i ewed i n Kakamega and 87% i n Siaya complained t h a t cu r ren t m i l k suppl i e s were inadequate f o r t h e i r needs . The uses env is ioned by these f am i l i es f o r t h e des i r ed a d d i t i o n a l m i l k are l i s t e d i n t a b l e 16.

TABLE 16. PROPOSED USES FOR ADDITIONAL MILK
Kakamega Si aya (34 farms, %)a (33 farms, % ) a
Product use 1 s t cho ice Tot a1 1 s t cho ice Tot a1
M i l k i n t e a Fermented m i 1 k Feeding c h i l d r e n Cooki ng S e l l Fresh B u t t e r Feeding puppies
a These da ta a re f i r s t p r i o r i t y and o t h e r proposed m i 1 k uses obta ined from farmers c l a i m i n g inadequate cu r ren t m i 1 k suppl i e s .
GOAT MILK
Farmers were asked i f t hey would be w i l l i n g t o i n c l u d e goat m i l k i n t h e i r f a m i l i e s ' d i e t s . I n Kakamega, 77.5% s a i d yes, 20% s a i d no, and 2.5% were unce r t a i n . I n Siaya, 41% were p o s i t i v e , 46% were negat ive, and 13% were uncer ta in .
Anecdotes c o l l e c t e d concerning t h e use o f goat m i l k were o f t e n con t ra - d i c t o r y , and u s u a l l y negat ive. Most were based on hearsay r a t h e r t han exper ience w i t h goat m i l k .
Several 01 der people remembered mi 1 k i n g goats 30 years t o 40 years ago. They claimed t h a t d a i r y goats "disappeared" from t h e reg ion as emphasis was s h i f t e d t o r a i s i n g c a t t l e f o r m i l k . Some o f t hese people be l i eved t h a t , as a r e s u l t o f t h e growing p r e s t i g e assoc ia ted w i t h owning c a t t l e , consumption o f goat m i 1 k became assoc ia ted w i t h 1 ower soc i a1 s t atus.*
Many people c la imed t h a t goat m i l k i s best used as a medicine; o the rs c la imed t h a t consumption o f goat m i l k caused c e r t a i n diseases. A few o f these people mentioned t h a t m i l k o f a b lack goat i s sometimes used i n c a s t i n g w i t c h c r a f t s p e l l s.
Three f a m i l i e s i n Siaya claimed t h a t t h e i r r e l i g i o u s sect , t h e Legion Maria, forbade consumpt i o n of a1 1 goat products.
* I n Siaya, herdsboys consume smal l amounts o f m i l k ob ta ined from t h e i r n a t i v e goat herds.

COMPARISON OF CONSUMER ACCEPTANCE OF - 60AT AND COW MILK PRODUCTS
Consumer acceptance o f goat m i l k products was eva luated as one aspect o f es t i mat i ng t h e po ten t i a1 adopt i o n success of m i 1 k-meat goat systems i n western Kenya. A c c e p t a b i l i t y o f goat m i l k products was measured i n re fe rence t o i d e n t i c a l l y prepared cow m i 1 k products .
The c r i t e r i a f o r s e l e c t i o n o f d a i r y products f o r consumer t e s t i n g were:
1. Ease o f p repara t ion , us i ng technology c u r r e n t l y ava i 1 ab le on smal l farms
2. Re1 i a b l e , c o n s i s t e n t l y s a n i t a r y p roduc ts 3. Maximizat ion o f n u t r i e n t y i e l d 4. Economic f e a s i b i l i t y 5. Pleasant f l a v o r
Fresh, pas teur i zed m i l k , m i l k soured by a d d i t i o n o f f r u i t j u i c e , and a hea t -ac id coagulated w h i t e cheese were t es ted . Sources o f m i l k were grade A y r s h i r e cows and Toggenburg cross goats on t h e MLD Ve te r i na r y Farm a t Maseno.
PREPARATION OF TASTE TEST SAWLES
P a s t e u r i z a t i o n o f f l u i d m i l k products. Fresh m i l k was f i l t e r e d i n t o a c l ean pan and heated, w i t h constant a g i t a t i o n , t o 75C. T h i s temperature was ma in ta ined f o r 30 seconds. The m i l k was covered and a1 lowed t o coo l f o r about 15 minutes be fo re be ing p laced i n a 4C r e f r i g e r a t o r . When a f r e e z e r was ava i l ab l e , t h e hot m i l k was c h i l l e d i n t h e f r e e z e r f o r about 1 h r be fo re t r a n s f e r t o t h e r e f r i g e r a t o r .
Pas teur i zed m i l k soured w i t h orange j u i c e . F resh l y squeezed orange j u i c e was added t o f resh , pas teur i zed m i l k u n t i l t h e t e x t u r e o f t h e m i l k became smooth and t h i c k ; about 112 cup (125 m l ) o f orange j u i c e t o a l i t e r o f m i l k .
P repa ra t i on o f cheese.* The f o l l o w i n g method was adapted f rom k o s i kowski (1978) :
1. 2 l i t e r s o f f resh, f i l t e r e d m i l k were heated, w i t h constant a g i t a t i o n , t o 82C.
2. 113 cup (80 m l ) o f a commercial ly prepared 5% a c e t i c a c i d s o l u t i o n was s t i r r e d c a r e f u l l y i n t o t h e heated m i l k .
3. Heat was t u r n e d o f f , and t h e curds were a l lowed t o mat f o r about 30 mi nut es.
* For composi t ion of a t y p i c a l w h i t e cheese, see Appendix 2.

4. Whey was s t r a i n e d through a cheesecloth, which had been washed, bo i led , and placed over a colander.
5. About 1 teaspoon of s a l t was s t i r r e d thorough ly i n t o t h e curds .
6. Curds were c a r e f u l l y wrapped up i n t h e cheesecloth and were pressed f o r severa l hours, usual l y overn i ght , at room tempera- t u r e . The cheese press cons is ted of 2 f l a t boards t h a t had been cleaned w i t h b o i l i n g water. Pressure was con t r i bu ted by a bucket o f water placed on t h e t o p board.
TASTE TEST LOCATIONS
Formal t a s t e t e s t s were h e l d i n 2 l o c a l secondary schools and i n 4 l o c a t i o n s i n Siaya and Kakamega.
Goat mi ' l k was heat-processed and i n f o r m a l l y d i s t r i b u t e d on a d a i l y bas is a t t h e Maseno Ve te r i na ry Farm.
School #1 (Ebusakami). Students were asked t o complete d a i r y product consumption quest i onna r i es be fo re t h e day o f t h e t e s t .
Al though s tudents were t o l d t h a t t hey were t r y i n g goat and cow m i l k products, i d e n t i t i e s o f t h e i n d i v i d u a l products were revealed on ly a f t e r t h e t e s t s were completed.
To avo id t a s t e fa t igue , t e s t s were l i m i t e d t o f o u r products : f resh , pas teur i zed goat and cow m i l k s and f r esh goat and cow cheeses.
Each product was assigned a symbol t h a t was u n l i k e l y t o b i as t h e con- sumer (e.g., *, 0) . A l l poss ib l e t a s t i n g orders f o r t h e four products were 1 i s t e d . One o rder was assigned, by use o f t h e app rop r i a te symbols, t o each quest i onnai re .
Cheeses were cut i n t o smal l pieces. Each p iece was i n d i v i d u a l l y wrapped and l a b e l l e d w i t h a symbol. Paper cups were l a b e l l e d w i t h characters corresponding t o t h e assigned m i l k symbols.
Each student was g iven a ques t ionna i re and a penc i l . Test i n s t r u c t i o n s were repeated o r a l l y , i n both Eng l i sh and Swah i l i . Students were encouraged t o ask quest ions regard i ng t e s t procedures. Samples were handed out on l y a f t e r a l l quest ions had been answered.
Each student was asked t o t a s t e t h e f o u r samples, one a t a t i m e i n t h e o rder i n d i c a t e d on h i s o r her ques t ionna i re . Each person was requested t o ass ign each product a score from t h e f o l l o w i n g 5 -po in t hedonic sca le :

1 = L i k e very much 2 - = L i k e 3 = Ne i t he r l i k e nor d i s l i k e 4 = D i s l i k e 5 = D i s l i k e very much
School #2 ( V i g i n a ) . The same procedures as f o r Ebusakami were f o l l owed except :
1. No da i r y product consumption quest i onnai r es were completed be fo re t h e t e s t . Ins tead, s tudents were asked t o i n d i c a t e on t h e i r t a s t e t e s t forms on l y whether o r not t hey consume m i 1 k.
2. Only f l u i d m i l k samples were f o r m a l l y compared i n t h e t a s t e t e s t s . Upon recommendation o f t h e headmaster, cheeses were l e f t f o r cu r ious s tudents t o t r y a t t e a t ime.
I n bo th schools, s tuden ts w i sh i ng not t o p a r t i c i p a t e were asked t o s i t q u i e t l y and not d i s t u r b t h e i r classmates.
F i e l d Tests i n Siaya and Kakamega. SR-CRSP f i e l d s t a f f coord ina ted meet ing t imes and p laces w i t h f a m i l i e s i n t h e research areas.
Fresh, pas teur i zed goat and cow m i l k and soured goat and cow m i l k were t e s t e d i n one Siaya l o c a t ion. Only sweet m i 1 k samples were t e s t e d i n t h e remain ing Siaya s i t e and i n bo th Kakamega areas.
A f t e r t h e respondents had assembled, each person was asked t o s tep forward and t a s t e each sample presented. A f t e r t a s t i n g , each p a r t i c i - pant was quest ioned c l o s e l y t o determine h i s r e a c t i o n t o t h e product . Responses were q u a n t i f i e d on t h e 5-poi n t hedoni c scale.
A l l i n s t r u c t i ons were presented i n Engl i s h , Swahi 1 i , and t h e vernacu la r 1 anguage.
Products were i dent i f i e d when t h e t e s t s were completed.
Maseno Ve te r i na r y Farm. A hot p l a t e , s t r a i n e r , cook ing pan, t h e r - mometer, spoon, l a b book, and m i l k s torage con ta i ne rs were i n s t a l l e d a t t h e Vet Farm O f f i c e . O f f i c e s t a f f were i n s t r u c t e d on m i l k hand l i ng and equipment c l ean i ng and maintenance. I n s t r u c t i o n s were a1 so c l e a r l y posted. M i l k was brought i n t o t h e o f f i c e every day. Upon a r r i v a l , it was immediately f i l t e r e d , pasteur ized, then s to red i n t h e r e f r i g e r a t o r .
The f o l l owing da ta were recorded d a i l y : date, amount processed, temperature, d i sposal , and comments.

STAT I ST I CAL ANALYSIS
~ n a l ~ s i s o f var iance was performed on t a s t e t e s t data f rom t h e secondary schools. Three d i s t i n c t groups were t e s t e d a t Ebusakami ; t h e r e f o r e , da ta were b locked by date o f study.
The data f rom t h e research areas were analyzed us i ng t h e t t e s t f o r p a i red samples.
RESULTS
School #1--Ebusakami . Dai r y product consumption quest i onnai res were d i s t r i b u t e d t o c l a s s members o f 3 separate groups. F i f t y - seven com- p l e t e d forms were co l l ec ted .
Only 1 student i n d i c a t e d t h a t she d i d not d r i n k m i l k ; t h e o the r 56 c la imed t o have m i l k products every day. None o f t h e s tuden ts had t r i e d goat m i l k o r any t ypes o f cheeses before. A l l s tuden ts were between t h e ages o f 13 and 19.
On t e s t days, c l ass at tendance f o r t h e t h r e e groups was 27, 14, and 29. O u t o f these 70 s tudents , 2 re fused t o p a r t i c i p a t e , c l a i m i n g an avers ion t o m i l k products . Two o thers on l y p a r t i a l l y completed t h e i r t e s t forms. Test data c o l l e c t e d from t h e remaining 66 s tuden ts a re presented be1 ow.
Goat m i l k rece ived a pooled mean score o f 2.12; cow m i l k rece ived 1.91. Goat m i l k cheese had a pooled mean score o f 3.13, w h i l e t h e cow m i l k cheese mean score was 2.91.
There was no s i g n i f i c a n t v a r i a t i o n i n scores assigned t o goat and cow m i 1 k products.
A h is togram o f t h e scores r e f l e c t s h i g h s tudent op in i on o f bo th m i l k samples ( f i g u r e 2 ) . Most o f t h e scores r ece i ved were 1s o r 2s.
Cheese scores were more evenly d i s t r i b u t e d across t h e range t han t h e m i l k scores ( f i g u r e 3) . The most common cheese score recorded was "no op in ion , 3."
Ebusakami Secondary School . Combination o f both comments and scores f rom t h e Ebusakami t a s t e t e s t s i n d i c a t e s t h a t w h i l e s tudents cou ld d i f f e r e n t i a t e between cow and goat sampl es by co l o r , creami ness, etc., t h e r e was no d i f f e r e n c e i n a c c e p t a b i l i t y between t h e samples, f o r e i t h e r t h e m i 1 ks o r t h e cheeses.
There i s a s i g n i f i c a n t b lock e f fec t a t a l l l e v e l s f o r t h e cheese and a t t h e 10% l e v e l f o r t h e m i l k samples. Since t h e data were b locked by da te o f t e s t ,and thereby , batch of product and c l ass o f s tudents , t h e v a r i a - t i o n s cou ld be due t o one o r more of t h e f o l l o w i n g :
1. Natu ra l d a i l y v a r i a t i o n i n t h e q u a l i t y o f t h e raw m i l k

MILK SCORES
Figure 2 . M i l k scores o f goat and cow m i l k products

CHEESE SCORES
scores Figure 3. Cheese scores of goat and m i l k products

2. V a r i a t i o n i n method o f p r e p a r a t i o n o f t h e samples (e.g., s a l t i n e s s e s o f cheese, e f f e c t o f heat t r e a t m e n t on m i l k f l a - vors , etc.)
3. A t t i t u d e o f each c l a s s toward exper iment. D i f f e r e n t c lasses v a r i e d i n l e v e l o f enthusiasm f o r p a r t i c i p a t i n g i n t h e e x p e r i - ment. T h i s may have e f f e c t e d t h e o v e r a l l scores awarded t o p roduc ts ; however, t h e r e l a t i v e scores g i v e n t o t h e goat and cow p roduc ts d i d not va ry between c lasses .
School #2- -V ig ina. A l l 30 s tuden ts and t h e 5 t e a c h e r s a t V i g i n a Secondary School were asked t o p a r t i c i p a t e i n goat d a i r y product t e s t - i ng . 'The s t u d e n t s , ranged i n age f rom 12 t o 19; t h e t e a c h e r s were between 21 and 25.
O f t h e s e 35 people, 25 ( i n c l u d i n g t h e 5 t e a c h e r s ) c la imed t o d r i n k m i l k every day. S i x r e p o r t e d consuming m i l k more t h a n once a week and 4 c la imed never d r i n k i n g m i l k .
T h i r t y - t w o peop le t r i e d f r e s h , p a s t e u r i z e d goat and cow m i l k . Three peop le re fused t o p a r t i c i p a t e .
Mean scores f o r goat and cow m i l k were 2.94 and 2.47, r e s p e c t i v e l y .
There was no s i g n i f i c a n t v a r i a t i o n i n scores ass igned t o goat and cow m i l k samples.
Score d i s t r i b u t i o n i s r e p o r t e d i n t a b l e 17.
TABLE 17. DISTRIBUTION OF SCORES ASSIGNED TO GOAT AND COW MILK (VIGINA SCHOOL)
P rodu c t
S c o r i n g code I
Cow m i l k
Frequency Mean
The genera l response o f t h e s tuden ts a t V i g i n a school was t h a t t h e goat m i l k samples were w h i t e r , sweeter, and c reamie r t h a n t h e cow m i l k samples. D e s p i t e t h e s e d e t e c t e d d i f f e r e n c e s , t h e r e was no d i f f e r e n c e i n scores ass igned t o t h e goat and cow m i l k samples.
Goat m i l k 4 9 7 9 3 2.94

F i e l d Tests i n Siaya and Kakamega. A t o t a l o f 286 people were asked t o f o r m a l l y compare goat and cow m i l k products. Ages o f respondents ranged from 1 year t o over 80 years. Twenty people re fused t o t a s t e t h e m i l k samples; 16 were women over 30 years o ld ; 3 were teenage boys.
Goat and cow m i l k soured by a d d i t i o n o f orange j u i c e were t e s t e d at S i t e I i n Siaya. There was no d i f fe rence i n goat and cow scores ( t = .19). Mean scores were 1.67 f o r sour cow m i l k and 1.51 f o r sour goat m i 1 k.
Fresh goat and cow m i l k were t e s t e d at both s i t e s i n Siaya and Kaka- mega. Resu l ts are repor ted i n t a b l e 18. No d i f f e r e n c e was found between f r e s h goat and cow m i l k scores ( a l l t values were l e s s t han .50). The low mean scores, a l l l e ss t han 2, i n d i c a t e a h igh l e v e l o f acceptabi 1 i t y f o r bo th products.
TABLE 18. FRESH GOAT AND COW MILK TASTE TEST RESULTS
No. o f Mean scores people No. o f
L ocat i on present r e f u s a l s Cow m i l k Goat m i 1 k
Kakamega: S i t e I 68 S i t e I 1 88
Siaya: S i t e I 6 4 S i t e I 1 66
M i l k samples were t r anspo r ted from t h e research s t a t i o n t o t h e t e s t s i t e s i n an i c e chest. Samples had not y e t reached ambient temperature f o r t h e f i r s t few t a s t e comparisons. A few o f t h e respondents i n d i c a t e d s u r p r i s e upon t a s t i n g a c o l d f l u i d . Whi le t h i s may have a f f e c t e d over- a l l scor ing , it d i d not a f f e c t t h e r e l a t i v e scores assigned t o t h e products.
One person i n d i c a t e d t h a t t h e goat m i l k sample had a "goaty" t a s t e and two men claimed t h a t it was s l i g h t l y s a l t y . Both of these de fec t s cou ld have been due t o t h e f a c t t h a t t h e goat m i l k was obta ined du r i ng very l a t e l a c t a t i o n . Many respondents sa id t h e goat m i l k was "creamier."
Scores rece ived i n these t e s t s were overwhelmingly 1s and 2s. A l l mean scores were l e s s t han 2, r e f l e c t i n g a very h i gh l e v e l of accep tab i l i t y f o r both m i l k samples.
Maseno Ve te r i na ry Farm. Most of t h e goat m i l k prepared on t h e research farm was used t o make t e a f o r t h e o f f i c e s t a f f . V i s i t o r s t o t h e research s t a t i o n were a l so presented w i t h a cup of t e a o r a small cup o f f resh , c o l d m i l k .

Some s e l e c t e d comments f rom t h e l a b book and o f f i c e guest book were: .. - "It was f a n t a s t i c and everyone was ask ing f o r more."
(Mary Odep, C l e r i c a l O f f i c e r , Maseno V e t e r i n a r y Farm)
- "Goat m i l k t a s t e s so much b e t t e r t h a n cow m i l k i n t e a t h a t we should d i s c a r d any t r a d i t i o n a l a g a i n s t it." (Dr. J. 0. Ongare, Kabete V e t e r i n a r y Labs)
- "It was my f i r s t t i m e t o t a s t e mbuzi m i l k (goat m i l k ) . It i s good and t a s t y and I h i g h l y apprec ia ted i t s qua1 i t y . " (Andrew O jun i o r Omumbo, Ekwanda Secondary School )
- "I am i n t e r e s t e d w i t h m i l k , and I wish t o have one goat." (Samuel O t i edo, Maseno Secondary School )

DISCUSSION
HILK SUPPLY
Average l a c t a t i o n i e l d s i n Siaya and Kakamega a re low: 295 kg and 430 kg, r e s p e c t i v e l y ? t a b l e 10). Not inc luded i n t hese f igu res , however, a re t h e amounts o f m i l k suck led by calves.
I n genera l , ca lves a re a l lowed t o suck le be fo re m i l k i n g , t o s t i m u l a t e m i l k l e t down. The farmer t h e n removes a predetermined amount o f m i l k , u s u a l l y rang ing between 1 l i t e r and 2 l i t e r s per day. The c a l f i s a l lowed t o f i n i s h any remain ing m i l k .
M i l k p roduc t ion f o r f a m i l y use, a l though impor tan t on smal l farms, seems t o be j u s t one o f severa l o b j e c t i v e s o f c a t t l e p roduc t i on systems i n western Kenya. Increased m i 1 k product i o n on t h e s e farms would requ i r e increased c a p i t a1 i nvestment and(or ) readjustment o f management goals and techniques. Investment o f l a r g e amounts o f c a p i t a l i n t o 1 i ves tock p roduc t i on systems may be beyond t h e f i nanci a1 capabi 1 it i e s o f i n d i v i - dual smal l ho l ders.
F u r t h e r problems encountered when i n v e s t i g a t i n g t h e poss i b i 1 it i e s f o r improv ing animal p roduc t ion a re i 11 us t r a ted by t h e f o l l owing example.
Farmers i n one area o f Siaya a re p a r t i c u l a r l y susp ic ious o f "development schemes." Several years ago, t h e neighbor o f one survey respondent p a r t i c i p a t e d i n a scheme aimed a t i n c r e a s i n g "improved c a t t l e u numbers i n h i s area. He rece ived a f i n e d a i r y - t y p e animal but d i d not under- s tand t h a t t h e cow represented a loan. The cow con t rac ted a d isease and d i ed s h o r t l y a f t e r a r r i v a l on t h e farm. The farmer cou ld not r a i s e t h e cash t o repay t h e cost o f t h e cow and was f o r ced t o s e l l h i s farm t o do so. Rumor and gossip spread q u i c k l y . The community s t i l l remains b i t t e r .
A dilemma a r i s e s when, i n t h e face o f a l l o f t h e obs tac les t o improve- ment o f smal l farm m i l k p roduc t ion , 86% o f t h e f a m i l i e s surveyed i n d i c a t e d t h a t t h e i r cu r ren t m i l k supp l i es were inadequate f o r t h e i r f a m i l y needs. Current est imates o f d a i l y m i l k consumption per f a m i l y are very 1 ow; .82 1 i t e r s i n Kakamega and .42 1 i t e r s i n Siaya ( t a b l e s 11 and 12).
The need f o r more m i l k i s g rea tes t on farms c u r r e n t l y w i t hou t cows ( t a b l e 13). The reason most o f t e n g iven f o r low consumption o f m i l k i s p r o h i b i t i v e cost . The p r i c e o f m i l k on i n f o rma l markets v a r i e s depending on one's ba rga in i ng powers but can be nea r l y as h i gh as t h e KCC consumer p r i c e (USB1.331gal o f m i l k i n June 1983). In f a c t , produc- t i o n o f m i l k f o r s a l e on t h e l o c a l markets i s cons idered t o be so l u c r a - t i v e t h a t 60.6% o f t h e Siaya respondents l i s t e d " t o s e l l " as t h e i r f i r s t p r i o r i t y f o r use o f an increased m i l k supply ( t a b l e 16) .

DAIRY PRODUCTS COMMONLY USED
Improper ly handled d a i r y products can be a se r i ous h e a l t h hazard. M i 1 k has been t h e medium f o r t ransmiss ion of pat hogens causing undulant fever , t u b e r c u l o s i s , t y p h o i d fever , d i ph the r i a , and var ious i n t e s t i n a l d is turbances (S ieganthal e r , 1972).
P rese rva t i on o f high-qua1 i t y m i l k i s p a r t i c u l a r l y d i f f i c u l t i n warm c l imates . A d d i t i o n a l l y , l ack of adequate c o o l i n g f a c i 1 i t i e s , e a s i l y s a n i t i z e d m i l k hand1 i n g equipment, and c lean water f o r washing equipment compound spoi 1 age problems. The re1 a t i ve l y h i gh p r i c e commanded by m i 1 k a t t h e market a l so tempts producers t o t r y t o inc rease income by adding water o r o the r f l u i d s t o t h e i r supply o f m i l k f o r sa le . The hyg ien i c q u a l i t y o f t h e added ma te r i a l may present an a d d i t i o n a l hazard.
S l i g h t l y over h a l f (53.5%) o f t h e surveyed f a m i l i e s c laimed t o b o i l o r o therw ise heat t rea t t he i r m i 1 k be fo re consumpt i on o r process i ng. Sour i ng o f m i 1 k k i 11 s t y p h o i d , paratyphoid, and co l i form organisms , but b r u c e l l o s i s and t u b e r c u l o s i s organisms can s u r v i v e f o r days, perhaps weeks, even a t h igh a c i d i t y (Kon, 1972).
Fo r tuna te l y , p repa ra t i on o f t h e most popular m i l k products, t e a i n both Siaya and Kakamega and m i l k as a l i q u i d s tock f o r cooking vegetables i n Siaya, prov ides adequate heat t reatment f o r e l i m i n a t i o n of pat hogens. But t h e h i gh temperature encountered d u r i n g t hese processes may adverse ly a f f ec t t h e n u t r i t i o n a l value o f t h e m i l k .
Boi 1 i n g m i 1 k can cause l a r g e losses o f m i 1 k ' s heat l a b i l e compounds l i k e th iamine and v i t am in C. B12 can a l so become l a b i l e due t o i n t e r a c t i o n w i t h v i t am in D i n t h e presence o f oxygen. More s e r i o u s l y , up t o 14% o f t h e ca lc ium and p r o t e i n ( i n c l u d i n g about 75% o f t h e s o l u b l e whey pro- t e i n s ) and up t o 20% o f t h e f a t can be l o s t i n t h e s k i n t h a t forms on t h e t o p o f t h e m i l k and t h e depos i t t h a t c o l l e c t s on t h e bottom o f t h e pan (Kon, 1972).
Tea p repa ra t i on may present f u r t h e r p rob l ems. The most import ant com- ponents o f t e a a re i t s po lypheno l i c t e a t a n n i n s (Eden, 1976). Tannins are known t o form s o l u b l e and i n s o l u b l e p r o t e i n complexes t h a t are poo r l y d i g e s t i b l e (A ra i , 1980: Bozzi n i , and S i 1 ano, 1978). Phenol i c compounds have been shown t o b ind w i t h casein (A ra i , 1980).
I f such b ind ing were t o occur i n t h e ub iqu i t ous m i l k - t e a d r i n k , t h e e f f e c t could be reduced b i o a v a i l a b i l i t y o f t h e m i l k p ro te i ns .
Perhaps t h e most s i g n i f i c a n t s tep toward improvement of on-farm product qua1 i t y would be t h e i n t r o d u c t i o n of thermometers, accompanied by adequate i n s t r u c t i o n s f o r use. Even a f a i r l y fou l sour m i l k can be converted t o a safe s t a r t e r c u l t u r e by c a r e f u l l y hea t i ng t h e m i l k t o 62C. The whey i s separated from t h e curd, mixed w i t h an equal amount o f b o i l e d m i 1 k and t h e m ix tu re i s a1 lowed t o r es t a t room temperature f o r 24 hours t o 36 hours (S iegen tha le r , 1972). T h i s c u l t u r e cou ld then be added t o heat t r e a t e d m i 1 k, r e s u l t i n g i n a product t h a t preserves some

o f t h e very unique f l avo rs p r e f e r r e d by farm fami l i e s , but w i t h a h i ghe r margin o f sa fe t y t han an unheated m i l k product.
U n t i l thermometers are in t roduced, however, t h e most p r a c t i c a l recommen- d a t i o n would probably be t o b o i l a l l m i l k and t o make an e f f o r t t o recover t h e r e s u l t i n g s k i n and deposi t i n t h e pan.
INTRODUCTION OF A NEW PRODUCT--WHITE CHEESE
A look a t t h e uses f o r a d d i t i o n a l m i l k proposed by farmers ( t a b l e 16) shows t h a t a great deal o f m i l k would probably be absorbed by increased use o f m i l k i n products t h a t a re a l ready w e l l es tab l i shed i n t h e research areas. Th is i s a f a c t o r weighing against adopt ion o f a novel product l i k e wh i t e cheese.
White cheese was - i n i t i a l l y se lec ted f o r consumer t e s t i n g because it i s very s imple t o make. Curd can be obta ined us ing vinegar, f r u i t j u i ces , o r yogur t . Process ing t o 82C e l im ina tes pathogens and spo i lage orga- nisms and a l so causes t h e whey p r o t e i n s t o become i nso lub le . The r e s u l t i n g curd has very h i gh qua1 i t y p ro te i n . Lactose remains so lub le and i s l e f t behind i n t h e whey.
Pressed cheeses have repo r ted l y been s to red f o r up t o two months w i thou t spoi 1 age (Tor res and Chandan, 1981). B r i n e s torage (S iegenthal e r , 1972) o r aging i n o i 1 and v inegar (Anonymous, 1982) are two low-cost sugges- t i o n s f o r i nc reas ing s h e l f l i f e o f t h e cheeses.
The w h i t e cheese rece ived f a i r consumer scores du r i ng t e s t i n g a t Ebusakami Secondary School ( f i g u r e 3) . However, t h e m i 1 k supply avai 1 - ab le t o smal lho lders i n western Kenya w i l l p robably have t o inc rease cons iderab ly be fo re t h e need t o i n t r oduce new products a r i ses .
POTENTIAL FOR MILK FROM DUAL-PURPOSE GOAT SYSTEMS I N WESTERN KENYA
Resu l ts o f double b l i n d t a s t e t e s t s i n v o l v i n g a t o t a l o f 355 people show t h a t when goat and cow m i l k were i d e n t i c a l l y prepared, t h e r e was no d i f f e r e n c e i n a c c e p t a b i l i t y o f products due t o spec ie o f animal pro- v i d i ng t h e mi 1 k. The l e v e l o f acceptabi 1 i t y f o r a1 1 o f t h e product s was h igh.
A p i l o t s tudy i n v o l v i n g placement of 10 Toggenburg X East A f r i c a n does and k i d s i n 10 farms i n Siaya and Kakamega (Brown e t al . , 1983) showed t h a t t h e goat m i l k produced on t h e farms was used i n t h e same fash ion as cow m i l k . A l l 10 o f t h e farmers used t h e m i l k i n t ea , 6 used it f o r cooking vegetables, 5 fed it f resh t o t h e i r c h i l d r e n , 2 used it f o r cook ing "uga l i ," and 2 soured it f o r d r i nk i ng .
A l l o f t h e farmers claimed t o l i k e t h e m i l k very much. Several repor ted a preference f o r goat m i l k over cow m i l k f o r use i n t e a p repara t ion . They claimed t h a t , because of i t s "whiteness and creaminess," l e s s was needed f o r p repa ra t i on o f a " q u a l i t a t i v e " batch o f tea.

Fo l low-up q u e s t i o n s i n t h e research areas i n d i c a t e d t h a t many peop le would use goat m i l k if it were a v a i l a b l e . Severa l added t h a t goat m i l k would be used as a supplement t o c u r r e n t cow m i l k s u p p l i e s . Accepta- b i l i t y o f goat m i l k , t h e r e f o r e , does no t seem t o be a c o n s t r a i n t 1 i m i t i ng adopt i o n success o f dua l -purpose goat systems i n t h e research a reas.
V i a b i l i t y o f t h e mi lk -meat goat system on sma l l farms i s , however, s u b j e c t t o s e v e r a l o t h e r p o t e n t i a l c o n s t r a i n t s . D u r i n g t h i s f i r s t p i l o t s tudy , average m i l k p r o d u c t i o n was 140.5 kg /goat o v e r a 145-day l a c t a - t i o n . About one q u a r t e r o f t h i s m i l k was f e d t o t h e k i d s .
A c o n c u r r e n t exper iment on t h e research s t a t i o n de te rm ined t h a t app rox i - m a t e l y 60 k g o f m i l k were needed t o r a i s e k i d s t o an a p p r o p r i a t e weaning age (10 kg). The re fo re , a t c u r r e n t p r o d u c t i o n l e v e l s , t h e amount o f m i l k a v a i l a b l e f o r f a m i l y use would o n l y be about 64 k g t o 94 kg /goa t / y e a r . Severa l o f t h e fa rmers l o s t en thus iasm f o r t h e exper iment as t h e i r goat ' s mi 1 k p r o d u c t i on dropped o f f .
Severa l o f t h e respondents, p a r t i c u l a r l y i n Kakamega, where t h e r e a r e r e l a t i v e l y few goats, c la imed t h a t goa ts were " t o o t roub lesome" and c o u l d cause much damage, p a r t i c u l a r l y i n areas t h a t were i n t e n s e l y cropped.

CONCLUSIONS
1. here a re many obs tac les f o r i nc reas ing m i l k p roduc t ion on smal l farms i n western Kenya.
2. A demand f o r more m i l k e x i s t s i n r u r a l western Kenya.
3. The q u a l i t y o f d a i r y produce could improve d r a m a t i c a l l y by i n t r o - duct i on o f t hermometers and s u i t a b l e m i 1 k s t orage cont a i ners. Current m i l k hand1 i ng p rac t i ces , p a r t i c u l a r l y a d u l t u r a t i o n o f m i 1 k and sou r i ng o f m i l k w i t hou t p r i o r heat t rea tment , may lead t o pro- duct i o n o f hazardous product s.
4. Resu l t s o f t a s t e t e s t comparing goat and cow m i l k, as we1 1 as r e s u l t s f rom on-farm goat r e a r i n g t r i a l s , i n d i c a t e t h a t goat m i l k accept ab i l i t y i s not a const r a i n t t o est ab l i shment o f dual -purpose goat product i on systems.
5. Desp i te t h e apparent accept ab i 1 i t y of goat m i 1 k, w i t hou t necessary a d d i t i o n a l investments by t h e farmer i n adequate feed resources, housing, v e t e r i n a r y ca re and gene t i c s e l e c t i o n f o r da i r y - t ype animals, a dual-purpose goat system may not be v i a b l e f o r smal l - ho lders i n western Kenya.
6. Since such a 1 arge q u a n t i t y o f m i l k consumed on t hese smal l farms i s used i n t e a making, t h e n u t r i t i o n a l q u a l i t y o f t h e m i l k p r o t e i n s i n t h e d r i n k should be i nves t i ga ted .

BIBLIOGRAPHY
American Academy o f P e d i a t r i c s . 1974. Should m i l k d r i n k i n g by c h i l d r e n be discouraged?
Anonymous. 1982. From I n d i a comes t h i s cheese t h a t i s qu ick t o make, very ve rsa t i 1 e. Sunset, June 1982. pp 176-181.
Anonymous. 1982. M i l k : odd f l avou r . The Weekly Review. N a i r o b i , Kenya.
AOAC. 1980. B i o l o g i c a l e v a l u a t i o n of p r o t e i n qual i t y . I n : " O f f i c i a l Methods o f Analys is . " 1 3 t h Ed., pp 774-775.
A ra i , S. 1980. D e t e r i o r a t i o n o f food p r o t e i n s by b i n d i n g unwanted cornpounds such as f l a v o r s , l i p i d s and pigments. I n : M. Joan Com- s tock (Ed.) "Chemical D e t e r i o r a t i o n o f Food." Ameri can Chemical Soc ie ty . Chap. 9, pp 195-209.
Babel, F. J. 1977. A n t i b i o s i s by l a c t i c c u l t u r e bac te r i a . J. D a i r y Sc i . 60(5) :815-821.
Bozz in i , A. and V. S i lano. 1978. Con t ro l t h rough breeding methods of f a c t o r s a f f e c t i n g n u t r i t i o n a l qual i t y o f ce rea l s and g r a i n legumes. I n : Mendel Friedman (Ed.) " N u t r i t i o n a l Improvement o f Food and Feed Pro te ins . " Plenum Press, New York. Vol. 105. Chap. 13.
Brown, 0. L., H. A. F i tzhugh, E. Chavulimu, H. K i guh i , E. O t ieno and P. Amuhinda. 1983. Eva lua t i on o f l a c t a t i n g Toggenburg x East A f r i can does on smal l farms i n western Kenya. Proceedings o f Small Ruminant CRSP S c i e n t i f i c Meeting. Naivasha, Kenya.
Counci 1 f o r A g r i c u l t u r a l Science and Techno1 ogy (CAST). 1975. Rumi- nants as food producers: now and f o r t h e f u t u r e . Spec ia l pub1 i c a - t i o n #4. Iowa S ta te U n i v e r s i t y , Ames, Iowa. 6 t h Ed.
Devendra, C. 1980. M i l k p roduc t i on i n goats compared t o b u f f a l o and c a t t l e i n humid t r o p i c s . J. Da i r y Sc i . 63:1755-1767.
Eden, T. 1976. Tea. T rop i ca l A g r i c u l t u r e Ser ies . 3 rd Ed. Longman Group Ltd., London. Chap. 12. pp 153-165.
FAO. 1982. Produc t ion Yearbook 1981. Vol . 35. Rome.
FAO. 1972. Prospects f o r p roduc t ion , market ing, and t r a d e i n l i v e s t o c k and l i v e s t o c k products i n Eastern A f r i c a t o 1985. Addis Ababa. Vol. 1. 276 p.
Fe i t osa Teles, F. F., C. K. Young and W. S t u l l . 1978. A method f o r r a p i d de te rm ina t i on o f l ac tose . J. Dai r y S c i . 61 :506-508.

Gordin, S. 1980. M i l k i n g animals and fermented m i l k s o f t h e Middle East and t h e i r c o n t r i b u t i o n t o man's welfare. J. Da i r y Sc i . 63 : 1031-1038.
Hack ler , L. R. 1978. An overview o f t h e AACCIASTM c o l l a b o r a t i v e study on p r o t e i n qual i t y eva lua t ion . Food Techno1 ogy. December 1978. pp 62-64.
Hopcra f t , P. N. ( coo rd ina to r ) . 1976. An eva lua t i on of t h e Kenya Dai r y Product i o n improvement programme. Occasional paper #20. I n s t i t u t e f o r Devel opment S tud i es , Uni v e r s i t y o f Nai r o b i .
Jenness , R. 1980. Composit i o n and charact e r i s t i cs o f goat m i 1 k : rev iew 1968-1979. J. Dai r y Sc i . 63 :1605-1630.
Johnson, J.D., N. Kretchmer and F. Simoons. 1974. Lactose malabsorp- t i o n : i t s b i o l ogy and h i s t o r y . Adv. P e d i a t r i c s . 21:197-237.
Kon, S. K. 1972. M i l k and m i l k products i n human n u t r i t i o n . FA0 N u t r i t i o n a l Stud ies #27. 2nd Ed. Rome. 80 p.
Kosikowski , F. V. 1978. Cheese and Fermented M i l k Foods. 2nd Ed. Kosikowski and Associates, Brooktondal e, NY. p 568.
Kretchmer, N. 1972. Lactose and lac tase . S c i e n t i f i c American. October 1978. pp 71-78.
K u r w i j i l a , R. L. N. 1980. Low cost o p t i m i z a t i o n o f t h e f l a v o u r , con- s is tency , and keeping qual i t y o f fermented m i 1 k w i t h p a r t i c u l a r re fe rence t o consumer a c c e p t a b i l i t y i n Kenya. M. Sc. Thesis i n Food Science and Tech. U. o f Nai r o b i .
Mbugua, S. K. 1976. Study o f t h e keeping q u a l i t y o f m i l k i n t h e Kinangop p la teau and suggest ions f o r improvement. M. Sc. Thesis i n Food Science and Tech. U. o f Nai r o b i .
McCammon-Fel dman, B., P. J. Van Soest , P. Horvat h and R. E. McDowell . 1981. Feeding s t r a t e g y o f t h e goat. Co rne l l I n t e r n a t i o n a l A g r i - c u l t u r e Mimeograph #88.
M i l l e r , G. A. and P. A. Lachance. 1977. Techniques i n r a t bio-assays. In : C. E. Bodwell (Ed.) "Eva lua t ion o f p r o t e i n s f o r humans." A V I P u b l i s h i n g Co., Inc., Westport, CT. Chap. 7.
M in i s t r y o f L ives tock Development (MLD) --Kakamega D i s t r i c t . 1982. Annual Report. Republ ic o f Kenya. 39 p.
M i n i s t r y o f L i vestock Devel opment (MLD)--Nyanza D i s t r i c t . 1982. Annual Report. Republ i c of Kenya.
M i n i s t r y o f L ives tock Development. 1980. Annual Report 1979. Animal Product i o n Branch. Nai r o b i , Kenya.
M i n i s t r y o f L i vestock Devel opment . 1980. Dai r y and beef product i o n p r o j e c t s f o r sma l lho lde rs . K i l i m o House. N a i r o b i , Kenya.
Nolan, M. 1982. Dual-purpose goats i n western Kenya; a summary o f s o c i 01 o g i c a l c o n s t r a i n t s . Proceedings SR-CRSP Workshop, Nai r o b i , Kenya. March 15, 1982.
P i e t e r s , J . J . L. and R. Van Rens. 1973. Lac tose ma labsorp t ion and mi 1 k i n t 01 erance i n Kenyan school -age c h i 1 dren. T r o p i c a l and Geographical Medi c ine. 25 : 365-371.
Republ i c o f Kenya. 1978-1980. Economic rev iew o f a g r i c u l t u r e . Development P lann ing D i v i s i o n - M i n i s t ry o f A g r i c u l t u r e . Nai r o b i , Kenya. Vol . 9-12.
Sands, M. W. 1983. Role of l i v e s t o c k on s m a l l h o l d e r farms i n western Kenya: prospects f o r a dual -purpose goat. Ph.D. Thesis. Cornel 1 U n i v e r s i t y . 218 p.
Sands, M. W., H. A. F i t zhugh , R. E. McDowell and S. Chema. 1982. Mixed crop-animal systems on smal l farms i n western Kenya. SR-CRSP Tech. Report Ser ies #17.
S iegen tha le r , E. J. 1972. M i l k h a n d l i n g and p rocess ing i n warm c l i - mates. C o n t r i b u t e d chap te r i n Improvement of L i v e s t o c k Product i o n i n Warm Cl imates by R. E. McDowell. W. H. Freeman and Co., San F ranc isco . pp 601-629.
Simoons, F. J., J. D. Johnson and N. Kretchmer. 1977. Perspec t i ves on m i l k d r i n k i n g and ma labsorp t ion o f 1 actose. Pedi a t r i cs. 59 :98-109.
Snedecor, G. W. and W. C. Cochran. 1976. S t a t i s t i c a l Methods. Iowa S t a t e U. Press, Ames, Iowa. 6 t h Ed.
Staub, H. W. 1978. Problems i n e v a l u a t i n g t h e p r o t e i n n u t r i t i v e qua l - i t y o f compl ex foods. Food Techno1 ogy . December 1978. pp 57-61.
Tor res , N. and R. C. Chandan. 1981. L a t i n American w h i t e cheese--a review. J. Dai r y Sc i . 64: 552-557.
Who. 1974. Recommended i n t a k e s o f n u t r i e n t s . From Passmore, N i c o l and Rao Handbook on N u t r i t i o n a l Requi rement s. WHO Monograph Ser. #61. Tab le 1.

APPENDICES

APPENDIX 1. SURVEY FORMS
IDENTIFICATION
NAME OF RESPONDENT
DATE
ENUMERATOR
1. How o f t e n does y o u r f a m i l y consume m i l k ? ( C i r c l e answer)
1. D a i l y 2. More t h a n once a week 3. About once a week 4. Less t h a n once a week 5. Rare ly 6. Never
2. I s m i l k produced on Farm? How much? Purchased? Yes/No/Somet imes. I f purchased, where- 1. Duka 2. Market 3. Neighbor 4. O ther
I s purchased m i 1 k process by KCC? Yes/No/Somet imes
About how much i s purchased per week?
I s purchased m i 1 k f resh/sour/powdered?
I f not produced and not purchased, why not ( c i r c l e one o r more) 1. No m i l k produc ing animals on shamba 2. M i l k t o o expensive 3. Fami ly does not l i k e m i l k 4. Other
3. Who gets f i r s t p re fe rence f o r m i l k : 0. No p re fe rence 1. C h i l d r e n 2. Women 3. Men 4. Pregnant women 5. Other
4. Does anyone r e f u s e m i l k ? Yes/No
I f yes, Who? Why?

Are a1 1 m i l k products re fused o r j u s t c e r t a i n ones?
Does anyone complain o f vomi t ing, d ia r rhea , o r stomach pa in caused by d r i n k i n g m i l k ? Yes/No I f Yes, Please e x p l a i n
5. Which m i l k products a re used by your f a m i l y ? Fresh m i l k ( no t i n t e a ) Sour m i l k (Maziwa 1 a1 a) 1. More t h a n one a day 1. More t han once a day 2. D a i l y 2. D a i l y 3. About t w i c e a week 3. About t w i c e a week 4. About once. a week 4. About once a week 5. Rare ly 5. Rare ly 6. Never 6. Never
M i l k i n t e a M i l k i n vegetab les 1. More t han once a day 1. More t han once a day 2. D a i l y 2. D a i l y 3. About t w i c e a week 3. About t w i c e a week 4. About once a week 4. About once a week 5. Rare ly 5. Rare ly 6. Never 6. Never
G hee B u t t e r 1. More t han once a day n o r e t han once a day 2. D a i l y 2. D a i l y 3. About t w i c e a week 3. About t w i c e a week 4. About once a week 4. About once a week 5. Ra re l y 5. Rare ly 6. Never 6. Never
Other 1. More t h a n once day 2. D a i l y 3. About t w i c e a week 4. About once a week 5. Rare ly 6. Never
Which products are made a t home? 1. Maziwa l a l a 2. Ghee 3. B u t t e r 4. Others
6. How are products made?

Are home produced products p r e f e r r e d t o purchased ones? YesINo I f yes, which ones?
I s m i l k heated but not b o i l e d be fo re d r i n k i n g ? YesINo
I s m i l k b o i l e d b e f o r e d r i n k i n g ? YesINo
I s m i l k heated b e f o r e it i s made i n t o Maziwa l a l a ? YesINo Other p roduc ts? YesINo
I s Maziwa l a l a made i n a gourd? YesINo If yes, how l o n g can m i l k be s t o r e d i n t h e gourd b e f o r e it becomes bad?
How o f t e n must a gourd be complete ly c leaned?
Are any home produced d a i r y products so ld? YesINo Where? 1. Duka 2. Market 3. To ne ighbors 4. Other
If m i l k i s very l i m i t e d , how would y o u r f a m i l y choose t o use i t ? (Which p roduc ts would be chosen?)
Has anyone i n t h e f a m i l y ever t r i e d goat mi 1 k ? YesINo If yes, how was it prepared?

Respondent ' s Name
C l u s t e r , Household I .D.
Enumerator
Da te
1. I s t h e amount of m i l k a v a i l a b l e t o you s a t i s f a c t o r y f o r y o u r f a m i l y needs? YesINo. Comments
-
2. I f more m i l k were a v a i l a b l e t o y o u r f a m i l y , how would it be used?
3. To y o u r knowledge, d i d y o u r g r a n d p a r e n t s l a n c e s t o r s d r i n k goat m i l k ? YesINo. I f yes, how l o n g ago d i d y o u r f a m i l y s t o p d r i n k goat m i l k ?
Why?
4 . Would you be w i l l i n g t o i n c l u d e goat m i l k i n y o u r f a m i l y ' s d i e t ? YesINo. Would you be w i l l i n g t o d r i n k goat m i l k i n s t e a d of cow m i l k ? YesINo
Comments
5. Have you eve r heard any taboos o r t r a d i t i o n a l b e l i e f s ( e i t h e r good o r bad) about d r i n k i n g goat m i l k ? YesINo

FAMILY TEA PREPARATION
1. ~ o e s fami l y t a k e t e a 1. More t h a n once a day 2. Once a day 3. R a r e l y 4. Never
2. Does f a m i l y d r i n k t e a w i t h o r w i t h o u t m i l k ?
3. How i s t e a prepared? (P lease answer a t l e a s t t h e f o l l o w i n g ques- t i o n s i n your d e s c r i p t i o n o f t e a making) 1. When a r e t e a leaves added t o water and how many? 2. When i s m i l k added t o t e a and how much? (How does a person
dec ide when t h e r e i s enough mi 1 k ? ) 3. When i s sugar added and how much? 4. About how l o n g i s t h e t e a cooked?

D A I R Y PRODUCTS EVALUATION
1. Please read t h e e n t i r e sheet, i n c l u d i n g quest i o n s before commencing t h e t a s t e t e s t .
2. You w i 11 rece ive 4 d a i r y products. Each sample w i l l be marked w i t h an i d e n t i f y i n g symbol.
3. On t h i s paper, you w i l l see t h e same 4 symbols arranged i n a cer - t a i n order . PLEASE TEST 'THE SAMPLES I N THE SAME ORDER THAT APPEARS ON THIS SHEET!
,. A f t e r t a s t i n g a. sample, p lease g i ve it a score between 1 and 5. Scor ing: 1 = EXCELLENT!! (BORA! ! )
2 = GOOD (MZLIRI) 3 = FAIR (SAWA SAWA) 4 = DO NOT LIKE (SIPENDI) 5 = HATE (NACHUKIA)
SYMBOL SYMBOL SYMBOL SYMBOL
SYMBOL SYMBOL SYMBOL SYMBOL
5. I f you p r e f e r one m i l k sample t o t h e o ther , p lease s t a t e why, b r i e f l y . I f you found no d i f f e r e n c e i n preference, you may a l s o comment.
6 . If you p r e f e r one cheese sample t o t h e o ther , p lease s t a t e why, b r i e f l y . If you found no d i f f e r e n c e i n preference, you may a l s o comment .

APPENDIX 2. COWOST'rION OF A TYPICAL WHITE CHEESE
F a t , 15% Water, 51%
S a l t , 2% t o 3.9% Lactose, 1.8%
P r o t e i n , 22.9% pH, 5.3
Approximate y i e l d , 11.6 lb /100 I b , 2.2% f a t m i l k
Source: Kos i kowski , F.V. 1978. Cheese and Fermented M i 1 k Foods. F. V. Kosikowski and Assoc ia tes. Brooktondale . NY. 2nd Ed. 2nd P r i n t i n g .

APPENDIX 3. ANALYSIS OF VARIANCE ..
AVERAGE MONTHLY MILK YIELDS, 1982, SIAYA VS KAKAMEGA FARMS
Sou r c e
Required F
d.f. S.S. M.S. F .10 .05 .01
Cor rec ted t o t a l 42 27,290 Treatment 1 4,252 4,252 7.57 2.84 4.08 7.31 E r r o r 4 1 23,030 562
~ - - - - - - - - ~ - ~ - - -~ - - - - - -
AVERAGE DAILY MILK CONSUMPTION, SIAYA V S KAKAMEGA
Source
Requi red F
d.f. S .S. M.S. F .10 .05 .01
Cor rec ted t o t a1 78 16.63 Treatment 1 3.10 3.10 17.22 2.77 3.96 6.96 E r r o r 77 13.53 .18
MILK CONSUMPTION I N SIAYA, WITH OR WITHOUT COWS
Requ i red F
Source d.f. S.S. M.S. F .10 .05 .O1
Corrected t o t a l 38 5.69 Treatment 1 1.78 1.78 16.18 2.85 4.11 7.40 E r r o r 37 3.91 .ll
MILK CONSUMPTION IN KAKAMEGA, WITH OR WITHOUT COWS
Requi red F
Source d.f. S.S. M.S. F .10 .05 .O1
Cor rec ted t o t a1 39 7.85 Treatment 1 2.06 2.06 13.73 2.84 4.10 7.35 E r r o r 38 5.79 0.15

EBUSAKAMI SECONDARY SCHOOL: COW AND GOAT MILK
Source
Requi red F
d.f. S.S. M.S. F .10 .05 .O1
Corrected t o t a l 131 165.97 Treatments 1 1.49 1.49 1.21 2.75 3.92 6.85 Blocks 2 7.38 3.69 3.00 2.35* 3.07 4.79 E r r o r 128 157.10 1.23
EBUSAKAMI SECONDARY SCHOOL: COW AND GOAT CHEESE
Required F
Source d.f. S.S. M.S. F .10 .05 .01
Corrected t o t a l 131 87.88 Treatments 1 .49 .49 .83 2.75 3.92 6.85 Blocks 2 11.99 5.99 10.16 2.35* 3.07* 4.79* E r r o r 128 75.40 .59
VIGINA SECONDARY SCHOOL: GOAT AND COW MILK
Required F
Source d.f. S.S. M.S. F .10 .05 .01
Corrected t o t a l 65 115.09 Treatments 1 2.18 2.18 1.24 2.79 3.99 7.04 E r r o r 64 112.91 1.76

APPENDIX 4. FREQUENCY OF SCORES ASSIGNED TO FRESH GOAT AND COW MILK SAMPLES SUMMARIZED BY AGE. SEX. AND LOCATION OF RESPONDENTS
Kakamega S i t e I ( C l u s t e r 301)
Cow mi 1 k Goat mi 1 k
Age, years 1 2 3 4 5 1 2 3 4 5 Refusa l s
Femal e Respondents : 0 - 5 15 14 1 6 - 10 7 7 11 - 15 3 3 16 - 20 21 - 25 1 6 3 4 26 - 45 5 2 2 1 4 46 - 60 60+ 1 1 1 - 2 36 6 30 1 1 5
Ma1 e Respondents : 0 - 5 4 1 3 6 - 10 5 5 11 - 15 16 - 20 21 - 25 26 - 45 46 - 60 60+ 1 1 A1 1 10 1 9
C h i l d r e n (sex not recorded ) :
4 - 10 15 - -
Scor ing Codes: 1 = 1 i k e very much: 2 = 1 i k e ; 3 = n e i t h e r 1 i k e nor d i s l i k e : 4 = d i s l i k e ; 5 = d i s l i k e very much.

Kakamega S i t e I 1 ( C l u s t e r 302)
Cow mi lk Goat m i 1 k
Age, years 1 2 3 4 5 1 2 3 4 5 Refusals
Female Respondents : 0 - 5 2 2 1 2 1 2 2 1 2 1 6 - 10 5 3 2
11 - 15 4 3 1 16 - 20 1 1 2 1 - 25 1 1 26 - 45 5 2 1 4 3 1 46 - 60
Male Respondents: 0 - 5 1 4 4 1 1
Scoring Codes: 1 = l i k e very much; 2 = l i k e : 3 = n e i t h e r l i k e nor d i s l i k e ; 4 = d i s l i k e ; 5 = d i s l i k e very much.

Siaya S i t e I ( C l u s t e r 331)
Age, years
Cow m i 1 k Goat m i 1 k
1 2 3 4 5 1 2 3 4 5 Refusal s
Female Respondents : 0 - 5 6 6 6 - 10 4 1 3 2
11 - 15 6 3 3 16 - 20 1 1 2 21 - 25 26 - 45 2 1 1 1 2 1 1 46 - 60 2 2 1 6 0 t 2 1 1 1 A1 1 23 2 1 1 14 12 1 3
Ma1 e Respondents : 0 - 5 5 6 - 10 11 2
11 - 15 5 5 16 - 20 21 - 25 26 - 45 2 46 - 60 2
Scoring Codes: 1 = l i k e very much; 2 = l i k e : 3 = n e i t h e r l i k e nor d i s l i k e ; 4 = d i s l i k e ; 5 = d i s l i k e very much.

Siaya S i t e 11 ( C l u s t e r 332)
Cow m i 'I k Goat m i l k
Age, years 1 2 3 4 5 1 2 3 4 5 Refusals
Femal e Respondents : 0 - 5 5 4 6 - 10 5 4
11 - 15 5 1 16 - 20 2 21 - 25 2 26 - 45 5 46 - 60 3
Ma1 e Respondents : 0 - 5 7 5 2 6 - 10 6 2 2 6
11 - 15 2 1 1 2 16 - 20 2 1 1 2 2 21 - 25 1 1 26 - 45 2 1 1 2 46 - 60 60+ 1 1 A1 1 21 5 10 16 2
Scoring Codes: 1 = l i k e very much: 2 = l i k e : 3 = n e i t h e r l i k e nor d i s l i k e : 4 = d i s l i k e ; 5 = d i s l i k e very much.