
CONSULTING ENGINEERS - Plymouth · CONSULTING ENGINEERS Millbay, Plymouth Strategic Appraisal &...
36
ALAN BAXTER & ASSOCIATES ALAN BAXTER & ASSOCIATES CONSULTING ENGINEERS Millbay, Plymouth Strategic Appraisal & Preliminary Paramics Modelling Statement Version 2.0 February 2006 75 COWCROSS STREET LONDON EC1M 6EL TEL 020 7250 1555 FAX 020 7250 3022
Transcript of CONSULTING ENGINEERS - Plymouth · CONSULTING ENGINEERS Millbay, Plymouth Strategic Appraisal &...
Millbay, Plymouth
ALAN BAXTER & ASSOCIATES
ALAN BAXTER & ASSOCIATES
CONSULTING ENGINEERS
Millbay, Plymouth
Strategic Appraisal & Preliminary Paramics Modelling Statement
Version 2.0
February 2006
75 COWCROSS STREET LONDON EC1M 6EL
TEL 020 7250 1555 FAX 020 7250 3022
1
Millbay, Plymouth
ALAN BAXTER & ASSOCIATES
2
CONTENTS
1.0 Introduction & Project Context 1 2.0 Site Context & Existing Model 3 3.0 Site Context & ‘Do Minimum’ Model 7 4.0 Proposed Development – EP & LDA Masterplan 9 5.0 EP & LDA Masterplan Network Option 1 & 2 14 6.0 EP Network Variations - Options 3A & 3B 18 7.0 Conclusions 22 Appendices
A Link Flows & Count Locations 25 B Junction Layouts (Paramics model extracts 29 C Millbay Paramics Model Validation and Option 33
Testing Report compiled by SiAS Prepared by: Steve Robins Reviewed by: Malcom TurnerIssued: February 2006 (DRAFT) This report may not be issued to third parties without the prior permission of Alan Baxter and Associates. Copyright Alan Baxter & Associates 2006

Millbay, Plymouth
Figures
Figure 1. Plymouth in the context of the UK 3 Figure 2. Millbay in context of Plymouth City 4 Figure 3. Millbay in context of Plymouth City centre 5 Figure 4. Millbay cordon model 6 Figure 5. Location of traffic counts 27 Figure 6. Location of committed developments / alterations to the network 7 Figure 7. Millbay illustrative masterplan 10 Figure 8. Millbay Character Areas 10 Figure 9. Movement Framework Option 1 13 Figure 10. Movement Framework Option 2 13 Figure 11. Movement Framework Option 3A 19 Figure 12. Movement Framework Option 3B 19 Figure 13. Impact of dedicated port access / egress link 20 Figure 14. Strategic impact of diverting port traffic to the west away from the City Centre 21 Tables
Table 1. Link Flows. AM Peak 0800-0900. (Ex. Ferry arrival / departure) 26 Table 2. Link Flows. PM Peak 1700-1800. (Ex. Ferry arrival / departure) 26 Table 3. AM & PM Peak Overall Journey Times 28 Table 4. AM & PM Peak Hour Network Speeds with Ferry Sensitivity Test – Km/h 28 Table 4.1 AM & PM Peak Hour Network Speeds – Km/h 28 Table 5. Committed development / network alteration & trip generation 7 Table 6. Existing trips removed from the network. Weekday AM (0800-0900) Trip Generation 11 Table 7. Existing trips removed from the network. Weekday PM (1700-1800) Trip Generation 11 Table 8. Development trips. Weekday AM (0800-0900) Trip Generation 12 Table 9. Development Trips. Weekday PM (1700-1800) Trip Generation 12
ALAN BAXTER & ASSOCIATES 3
Millbay, Plymouth
1.0 Introduction & Project Context Project Context 1.1 This statement has been prepared by Alan Baxter & Associates on behalf of English
Partnerships (EP) and Landscape Design Associates (LDA). The scope of this statement has been agreed with Plymouth City Council (PCC) via the content of the Millbay Scoping Study and subsequent discussions.
1.2 This statement appraises and analyses four preliminary Paramics traffic modelling
options based on the quantum of development proposed by the EP / LDA development proposal. For further modelling and technical information, please refer to Appendix B, Millbay Paramics Model Validation and Option Testing Report compiled by SiAS.
1.3 The regeneration framework for Millbay is set by the ‘Millbay Regeneration Strategy’
produced by Lacey Hickie Caley and adopted by Plymouth City Council in 2003. The key elements of the regeneration framework are reflected in MBM Architects ‘Plymouth Vision’. LDA Design was commissioned to prepare the Millbay Action Plan in December 2003 by EP and partners. The purpose of the work was to translate the preceding strategic studies into a set of deliverable actions whilst at the same time aiming to deliver the ‘optimal’ solution for Millbay in terms of best practice urban regeneration. The brief was drawn up by English Partnerships, The South West of England Regional Development Agency, Plymouth City Council and the Millfields Trust.
1.4 The purpose of undertaking preliminary modelling in Paramics is to test the viability
of the Millbay development schedule and to formulate a robust movement network capable of meeting the strategic vehicular demands imposed by that schedule. It is assumed that this statement signifies the starting point from which a series of future detailed modelling exercises will evolve. On this basis, it is important that the modelling described within this statement should not be interpreted as a finality or as an exhaustive study in preparation for adoption into the Area Action Plan (AAP), or as part of a Transport Assessment (TA) in support of an outline planning application. Therefore, this statement does not meet all of the requirements for a Transport Assessment as outlined in Plymouth City Council internal guidance.
1.5 In line with PCC guidance, it is recommended that any substantial future outline
planning application be accompanied by a TA that seeks to focus on the impact of the development on all forms of transport provision. In order to create a sustainable development an integrated approach to transport should be considered; one which incorporates a balance between travel by car, foot, bicycle and public transport. This results in the obvious benefits of reduced traffic congestion and improvements to health and the environment.
Methodological Assumptions 1.6 The following primary methodological assumptions have been agreed with PCC:
1.6.1 Trips generated by LDA / EP development schedule / uses modelled in all proposed Options.
ALAN BAXTER & ASSOCIATES 1
Millbay, Plymouth
1.6.2 Scheme modelled as fully developed (projected as 2020). 1.6.3 Committed developments of Royal William Yard & Drake Circus incorporated in
proposed options. 1.6.4 Internal and combined trip adjustment applied in proposed options. 1.6.5 No adjustment allowed for potential of modal shift in proposed options. 1.6.6 No adjustment allowed for potential of peak hour spreading in proposed options. 1.6.7 Spatial arrangement of junctions allow for incorporation of pedestrian facilities. 1.6.8 Parking strategy has not been formulated. This may impact upon future trip rates. 1.6.9 A visual appraisal of existing supplanted landuses (to be removed prior to adding
development trips) has been utilised in the absence of a formal landuse survey. 1.7 The statement analyses each network option without the arrival / departure of a ferry
service and with the arrival / departure of a ferry service. The 600 vehicle capacity Pont de Aven ferry currently the largest ferry arriving/departing the Millbay ferry port during the peak AM and PM hour periods. For the purpose of generating a worst-case scenario the Pont de Aven is modelled at full capacity. During 2005, the arrival/departure of the ferry in the peak hour is an infrequent event occurring once per week in the PM and twice per week in the AM during peak season (March - November). Please note that arrival / departure times are subject to annual change.
The above methodological assumptions are discussed in further detail in later sections of this statement. Formulation of Paramics Model and Output 1.8 Operation of a ‘cordoned’ version of the Plymouth City Paramics model has been
undertaken by SiAS in partnership with Plymouth City Council (PCC). Alan Baxter & Associates have formulated each of the movement framework options and provided data / information for input into the Paramics model.
Document Structure 1.9 This statement is structured as follows:
Section 2. Describes the context of Millbay and assesses the existing network (‘Do Nothing’ model) operation at 2003 traffic levels. This section also assesses the impact of the arrival / departure of the Pont de Aven ferry during peak periods. Section 3. Describes and assesses the ‘Do Minimum’ model which incorporates the ‘Do Nothing’ model plus committed development / network changes of Royal William Yard and Drake Circus. This section also assesses the impact of the arrival / departure of the Pont de Aven ferry during peak periods. Section 4. Describes the EP / LDA masterplan principles, development schedule, traffic generation and combined / internal trip adjustment. Section 5. Describes and assesses network Options 1 & 2 developed in line with the envisaged EP / LDA development proposal. This section also assesses the impact of the arrival / departure of the Pont de Aven ferry during peak periods. Section 6. Describes and assesses network Options 3A & 3B developed in line with the envisaged EP / LDA development proposal and incorporating key aspects of the Mackay Vision for Plymouth. This section also assesses the impact of the arrival / departure of the Pont de Aven ferry during peak periods.
ALAN BAXTER & ASSOCIATES 2
Millbay, Plymouth
Section 7. Concluding section drawing together key findings, recommendations, and suggestions for further stages of work.
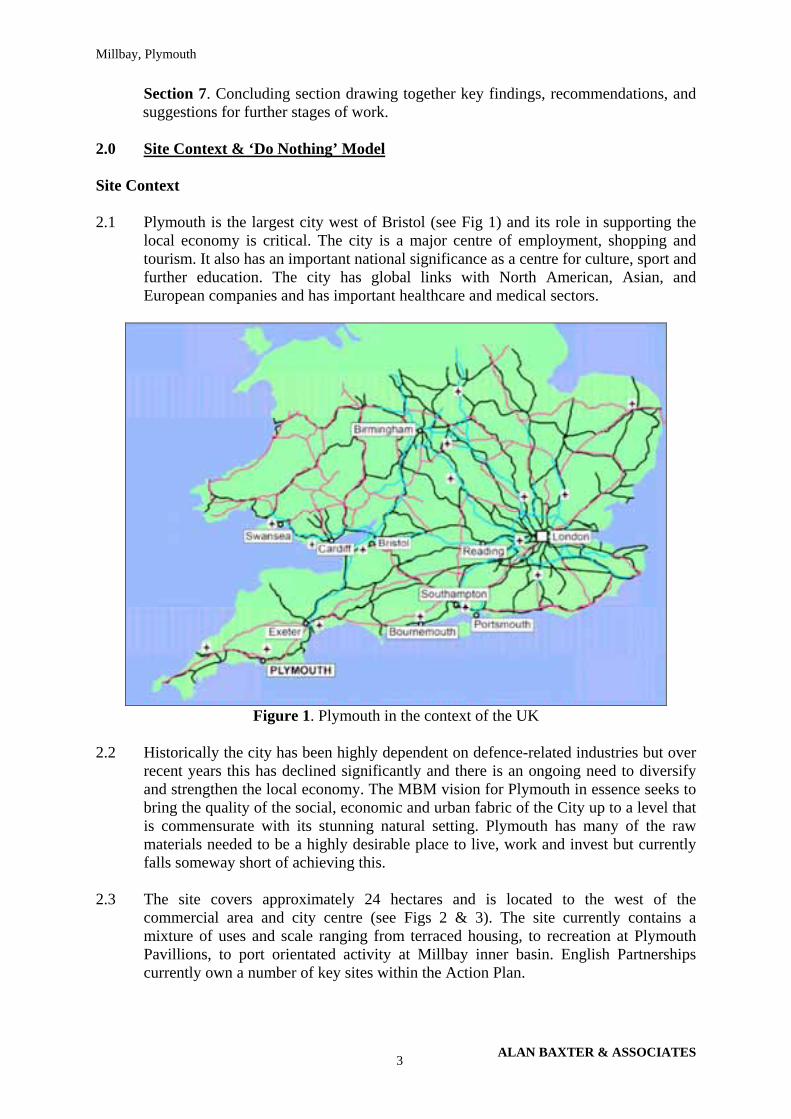
2.0 Site Context & ‘Do Nothing’ Model Site Context 2.1 Plymouth is the largest city west of Bristol (see Fig 1) and its role in supporting the
local economy is critical. The city is a major centre of employment, shopping and tourism. It also has an important national significance as a centre for culture, sport and further education. The city has global links with North American, Asian, and European companies and has important healthcare and medical sectors.
Figure 1. Plymouth in the context of the UK
2.2 Historically the city has been highly dependent on defence-related industries but over
recent years this has declined significantly and there is an ongoing need to diversify and strengthen the local economy. The MBM vision for Plymouth in essence seeks to bring the quality of the social, economic and urban fabric of the City up to a level that is commensurate with its stunning natural setting. Plymouth has many of the raw materials needed to be a highly desirable place to live, work and invest but currently falls someway short of achieving this.
2.3 The site covers approximately 24 hectares and is located to the west of the
commercial area and city centre (see Figs 2 & 3). The site currently contains a mixture of uses and scale ranging from terraced housing, to recreation at Plymouth Pavillions, to port orientated activity at Millbay inner basin. English Partnerships currently own a number of key sites within the Action Plan.
ALAN BAXTER & ASSOCIATES 3
Millbay, Plymouth
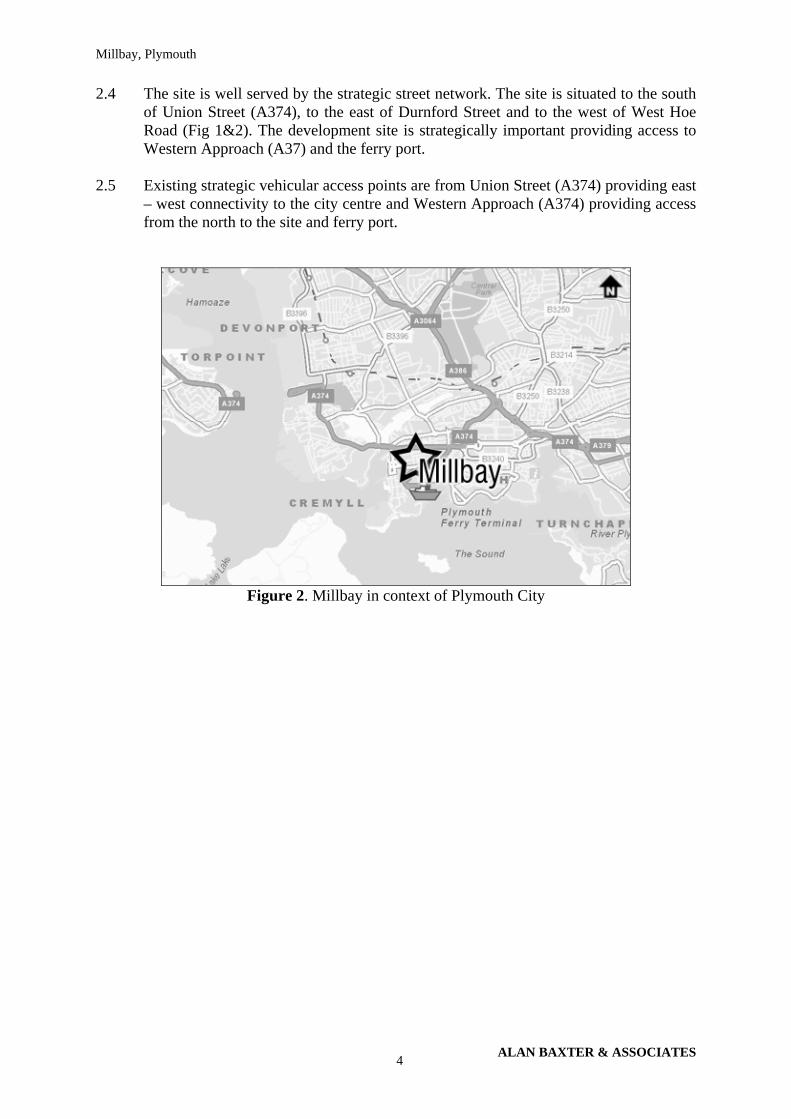
2.4 The site is well served by the strategic street network. The site is situated to the south of Union Street (A374), to the east of Durnford Street and to the west of West Hoe Road (Fig 1&2). The development site is strategically important providing access to Western Approach (A37) and the ferry port.
2.5 Existing strategic vehicular access points are from Union Street (A374) providing east
– west connectivity to the city centre and Western Approach (A374) providing access from the north to the site and ferry port.
Figure 2. Millbay in context of Plymouth City
ALAN BAXTER & ASSOCIATES 4

Millbay, Plymouth
Figure 3. Millbay in context of Plymouth City centre
2.6 Site connectivity and urban issues include a:
2.61 City centre that is disconnected from the prime asset of its waterfront 2.62 Impermeable internal network 2.63 Lack of legible routes and landmarks 2.64 Allocation of road space in favour of the private motor vehicle 2.65 Disconnection of the communities of Millbay to the south and Stonehouse to
the north 2.66 Lack of quality open space and amenities
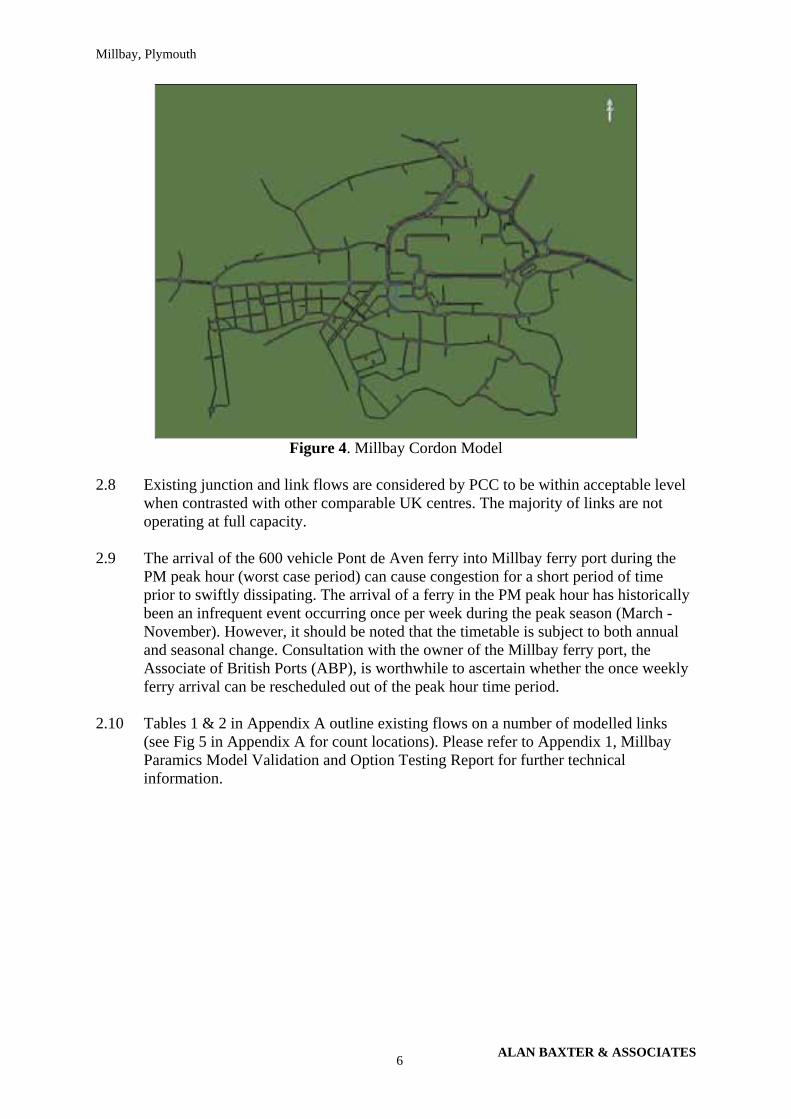
‘Do Nothing’ Model Assessment 2.7 The Millbay area Paramics model is based on the existing Plymouth Travel To Work
Area (TTWA) traffic model. The definition of the cordon boundary has been agreed with PCC in partnership with SiAS (see Fig 4). For the purpose of this statement the baseline cordon model will be referred to as the ‘Do Nothing’ model.
ALAN BAXTER & ASSOCIATES 5
Millbay, Plymouth
Figure 4. Millbay Cordon Model
2.8 Existing junction and link flows are considered by PCC to be within acceptable level
when contrasted with other comparable UK centres. The majority of links are not operating at full capacity.
2.9 The arrival of the 600 vehicle Pont de Aven ferry into Millbay ferry port during the
PM peak hour (worst case period) can cause congestion for a short period of time prior to swiftly dissipating. The arrival of a ferry in the PM peak hour has historically been an infrequent event occurring once per week during the peak season (March - November). However, it should be noted that the timetable is subject to both annual and seasonal change. Consultation with the owner of the Millbay ferry port, the Associate of British Ports (ABP), is worthwhile to ascertain whether the once weekly ferry arrival can be rescheduled out of the peak hour time period.
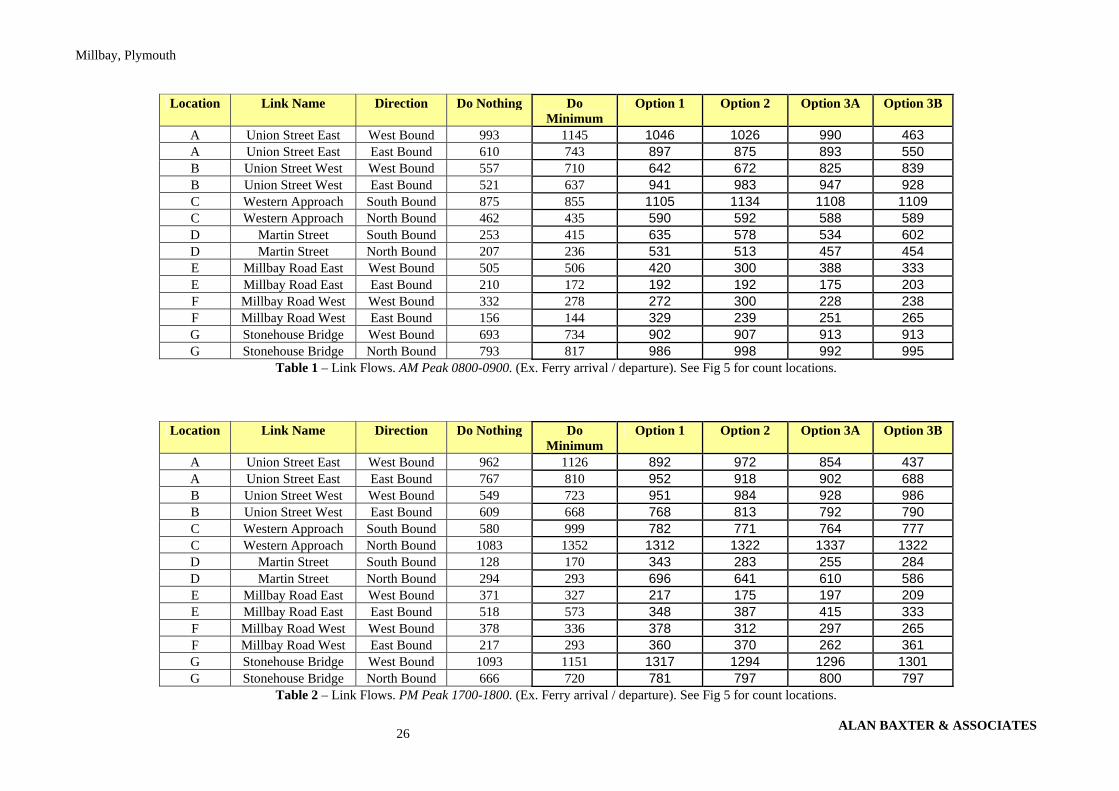
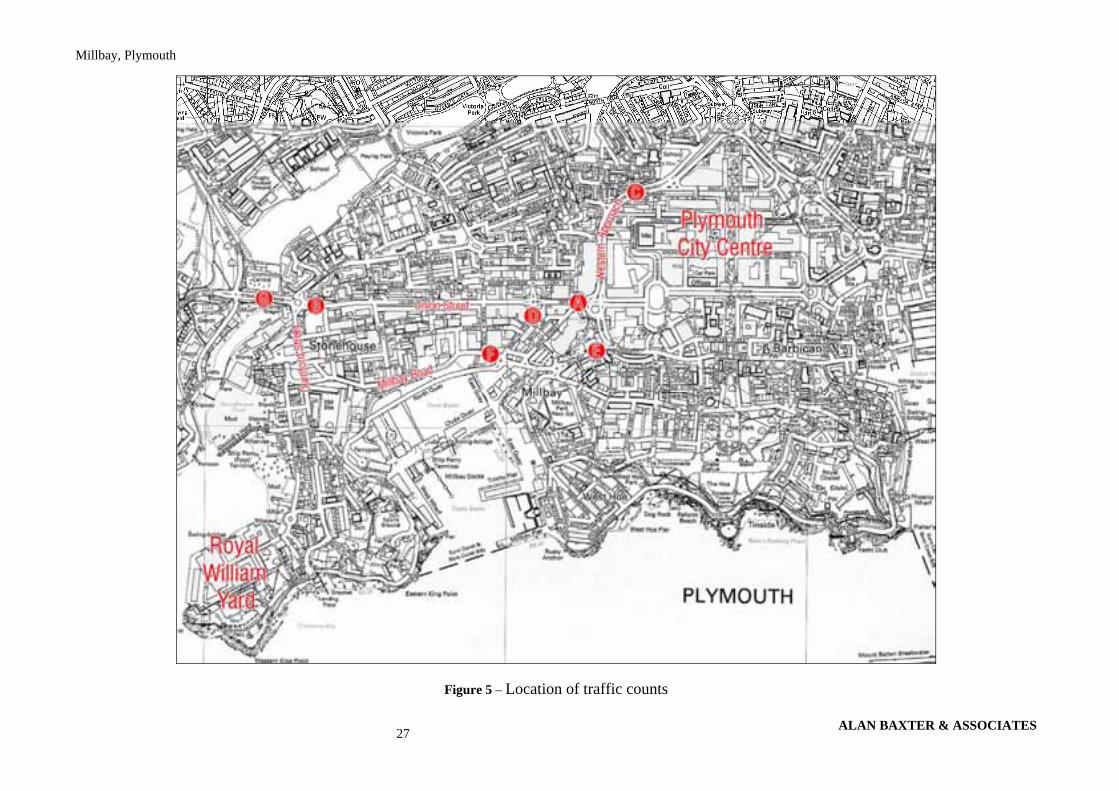
2.10 Tables 1 & 2 in Appendix A outline existing flows on a number of modelled links
(see Fig 5 in Appendix A for count locations). Please refer to Appendix 1, Millbay Paramics Model Validation and Option Testing Report for further technical information.
ALAN BAXTER & ASSOCIATES 6
Millbay, Plymouth
3.0 Do Minimum Model ‘Do Minimum’ Model Context. 3.1 A future growth scenario of zero has been agreed with Plymouth City Council to
reflect the urban context of Millbay. On this basis, the assessment year is at 2003 traffic levels.
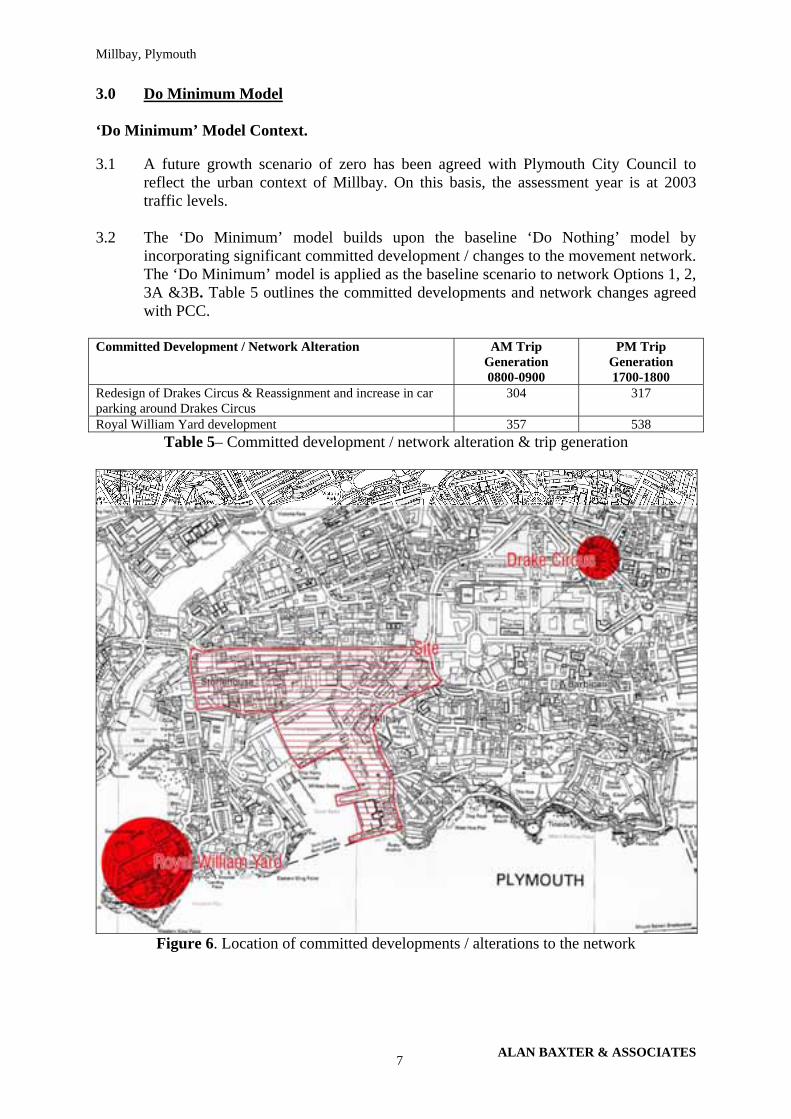
3.2 The ‘Do Minimum’ model builds upon the baseline ‘Do Nothing’ model by
incorporating significant committed development / changes to the movement network. The ‘Do Minimum’ model is applied as the baseline scenario to network Options 1, 2, 3A &3B. Table 5 outlines the committed developments and network changes agreed with PCC.
Committed Development / Network Alteration AM Trip
Generation 0800-0900
PM Trip Generation 1700-1800
Redesign of Drakes Circus & Reassignment and increase in car parking around Drakes Circus
304 317
Royal William Yard development 357 538 Table 5– Committed development / network alteration & trip generation
Figure 6. Location of committed developments / alterations to the network
ALAN BAXTER & ASSOCIATES 7
Millbay, Plymouth
‘Do Minimum’ Model Assessment. 3.3 Tables 1, 2 & 3 in Appendix A outline link flows and overall journey times on a
number of key links. Table 4 and 4.1 compare AM & PM peak hour network speeds with and without the arrival / departure of ferry services. Please refer to Figure 5 for the location of traffic counts.
3.4 Committed development / network changes increase Millbay cordon model area
network trips by 2% in the AM peak and 4% in the PM peak. This translates into an overall journey time increase in both the AM peak (11 seconds) and PM peak (28 seconds) respectively. The impact of the additional network trips quickly dissipate upon moving away from the city centre area. Please refer to Appendix B, Millbay Paramics Model Validation and Option Testing Report compiled by SiAS for further technical information and analysis.
3.5 As per the baseline scenario, the arrival of the 600 vehicle capacity Pont de Aven
ferry into Millbay ferry port during the AM and PM peak hour can cause congestion for a short period of time before swiftly dissipating. The difference between ‘do nothing’ and ‘do minimum’ scenario speeds are as follows (Table 4):
o AM peak hour Millbay cordon network speeds decrease by 2.5km/h o PM peak hour Millbay cordon network speeds decrease by 9.2km/h
(The above figures are calculated by working the difference between ‘Do Nothing’ and ‘Do Minimum’ scenarios detailed in Table 4)
The arrival of a ferry in the PM peak hour has historically been an infrequent event occurring once per week during the peak season (March - November). However, it should be noted that the timetable is subject to both annual and seasonal change. Consultation with the owner of the Millbay ferry port, the Associate of British Ports (ABP), is worthwhile to ascertain whether the once weekly ferry arrival can be rescheduled out of the peak hour time period. Please refer to Appendix B, Millbay Paramics Model Validation and Option Testing Report compiled by SiAS for further technical information and analysis.
‘Do Minimum’ Conclusions. 3.6 The impact of committed developments / changes to network upon existing junction
and link flows is to increase overall journey times and to decrease network speeds in both the AM and PM peak periods. The ‘Do Minimum’ model is considered to be operating at acceptable levels by PCC.
3.7 The impact of the arrival / departure of the Pont de Aven in the peak periods is
recognised as causing congestion for a short period of time.
ALAN BAXTER & ASSOCIATES 8
Millbay, Plymouth
4.0 Proposed Development – EP & LDA Masterplan 4.1 It is proposed that the Millbay Plan should incorporate a mix of land uses including
business, commercial, retail, leisure and residential units. More specifically, the development proposals are based on the creation of six definable character areas:
4.11 ‘Union Street’. A mixed-use strategic street to be regenerated through
redevelopment and renovation of premises. The street is envisaged to host key landmarks including a restored Palace Theatre.
4.12 ‘The Inner Waterfront’. This area provides the opportunity to create a real regional draw, a piece of stunning high quality contemporary waterfront which is significant not only within Plymouth but within the entire South West region. Activities include cafes, restaurants and shops with additional opportunities for small-scale marine related industries and craft workshops. Above these will be residential uses.
4.13 ‘The Outer Waterfront’. These streets are proposed to be an integral part of the waterfront. Public realm improvements could enhance the quality of the streets and the structure of the wall could be lowered to allow better views. Along Millbay Road there are opportunities for planting to enhance the environment of the existing and proposed housing in these areas. New development within the outer waterfront will continue the pattern of the existing housing.
4.14 ‘Stonehouse Mixed Use’. The Action Plan envisages the gradual improvement of this area to become a genuine mixed-use area. It involves recreating the original block structure and lining the north south links to Union Street with residential and office development to create real streets that feel safe and pleasant to use. Amongst these streets existing pubs and existing residential areas such as Emma Place will be protected and enhanced. The plan envisages infrastructure and environmental improvement works to rebuild the street network and enhance the environment through tree planting and provision of formal on-street parking.
4.15 ‘The Park’. The MOD playing field to the east of Millbay could be by far the most dramatic park in Plymouth. Overlooking Millbay, with good linkages down to a quality waterfront with cafes and restaurants. This should be a stunning new contemporary park for Plymouth, far more than just some grass and trees but a series of outdoor rooms, each with their own qualities and interest. Some of the 'rooms' may cater for sport or play whilst others might be intimate beautifully planted gardens.
4.16 ‘Millbay’. Like other neighborhoods in Plymouth, envisaged is a centre at the heart of this area possibly where Millbay Road intersects with the main link to the City Centre or on a new street running from the Duke of Cornwall to Martin Street. An almost equal mix of housing and commercial uses will be one of the key characteristics of the Millbay character area. Substantial numbers of housing are essential to bring life back to the area and reverse the population decline that commenced with the Abercrombie Plan. The significant commercial element in this area may comprise between 40-50% of the floor space proposed. There is a real opportunity to create, just back from the waterfront, a new high quality office environment for Plymouth. Both residential and commercial uses will be focused on the main link from the waterfront to City Centre.
The character areas and an illustrative masterplan are shown in Figures 7 & 8.
ALAN BAXTER & ASSOCIATES 9

Millbay, Plymouth
Figure 7. Millbay illustrative masterplan
Figure 8. Millbay Character Areas
ALAN BAXTER & ASSOCIATES 10
Millbay, Plymouth
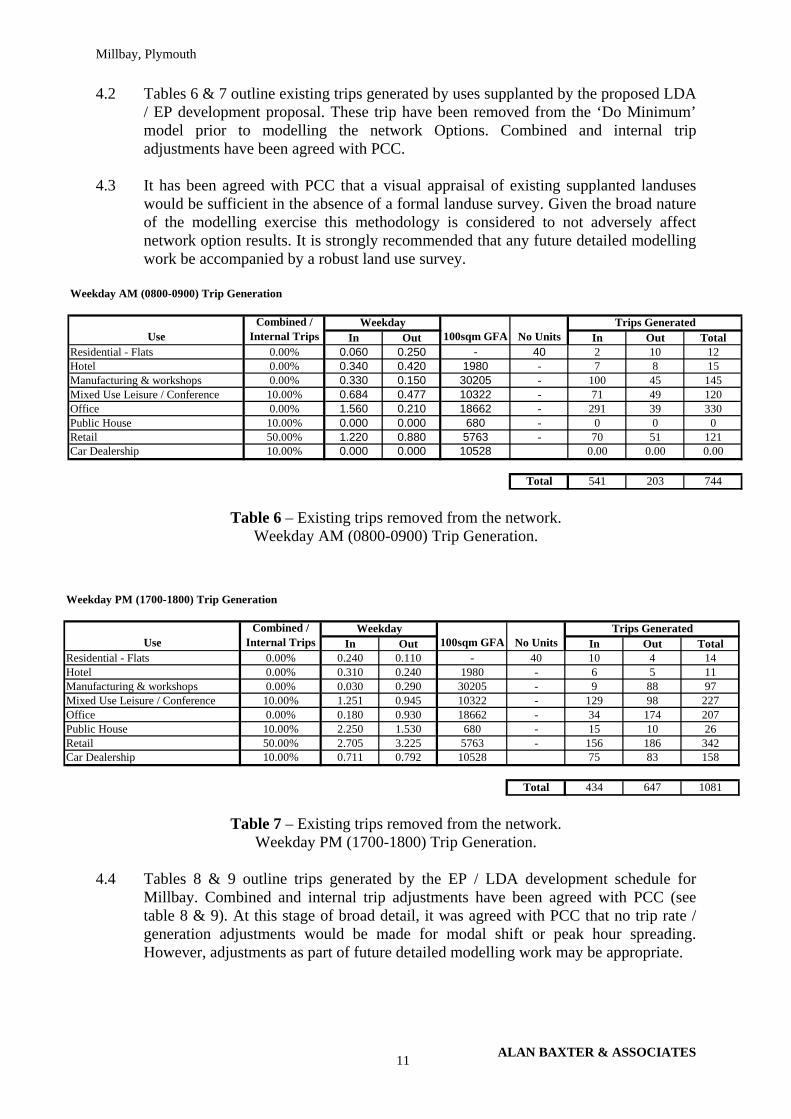
4.2 Tables 6 & 7 outline existing trips generated by uses supplanted by the proposed LDA / EP development proposal. These trip have been removed from the ‘Do Minimum’ model prior to modelling the network Options. Combined and internal trip adjustments have been agreed with PCC.
4.3 It has been agreed with PCC that a visual appraisal of existing supplanted landuses
would be sufficient in the absence of a formal landuse survey. Given the broad nature of the modelling exercise this methodology is considered to not adversely affect network option results. It is strongly recommended that any future detailed modelling work be accompanied by a robust land use survey.
Weekday AM (0800-0900) Trip Generation
In Out In Out TotalResidential - Flats 0.00% 0.060 0.250 - 40 2 10 12Hotel 0.00% 0.340 0.420 1980 - 7 8 15Manufacturing & workshops 0.00% 0.330 0.150 30205 - 100 45 145Mixed Use Leisure / Conference 10.00% 0.684 0.477 10322 - 71 49 120Office 0.00% 1.560 0.210 18662 - 291 39 330Public House 10.00% 0.000 0.000 680 - 0 0 0Retail 50.00% 1.220 0.880 5763 - 70 51 121Car Dealership 10.00% 0.000 0.000 10528 0.00 0.00 0.00
Total 541 203 744
100sqm GFA No UnitsUseWeekday Trips GeneratedCombined /
Internal Trips
Table 6 – Existing trips removed from the network. Weekday AM (0800-0900) Trip Generation.
Weekday PM (1700-1800) Trip Generation
In Out In Out TotalResidential - Flats 0.00% 0.240 0.110 - 40 10 4 14Hotel 0.00% 0.310 0.240 1980 - 6 5 11Manufacturing & workshops 0.00% 0.030 0.290 30205 - 9 88 97Mixed Use Leisure / Conference 10.00% 1.251 0.945 10322 - 129 98 227Office 0.00% 0.180 0.930 18662 - 34 174 207Public House 10.00% 2.250 1.530 680 - 15 10 26Retail 50.00% 2.705 3.225 5763 - 156 186 342Car Dealership 10.00% 0.711 0.792 10528 75 83 158
Total 434 647 1081
100sqm GFA No UnitsTrips Generated
UseCombined /
Internal Trips Weekday
Table 7 – Existing trips removed from the network.
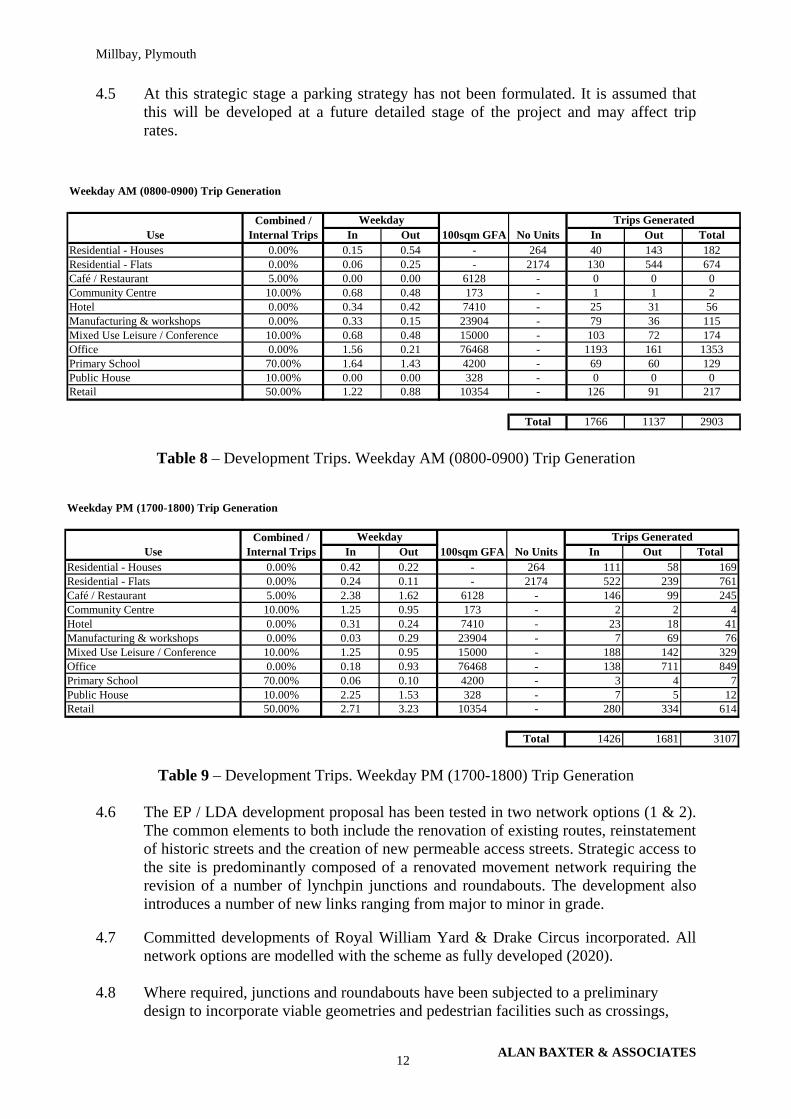
Weekday PM (1700-1800) Trip Generation. 4.4 Tables 8 & 9 outline trips generated by the EP / LDA development schedule for
Millbay. Combined and internal trip adjustments have been agreed with PCC (see table 8 & 9). At this stage of broad detail, it was agreed with PCC that no trip rate / generation adjustments would be made for modal shift or peak hour spreading. However, adjustments as part of future detailed modelling work may be appropriate.
ALAN BAXTER & ASSOCIATES 11
Millbay, Plymouth
4.5 At this strategic stage a parking strategy has not been formulated. It is assumed that this will be developed at a future detailed stage of the project and may affect trip rates.
Weekday AM (0800-0900) Trip Generation
In Out In Out TotalResidential - Houses 0.00% 0.15 0.54 - 264 40 143 182Residential - Flats 0.00% 0.06 0.25 - 2174 130 544 674Café / Restaurant 5.00% 0.00 0.00 6128 - 0 0 0Community Centre 10.00% 0.68 0.48 173 - 1 1 2Hotel 0.00% 0.34 0.42 7410 - 25 31 56Manufacturing & workshops 0.00% 0.33 0.15 23904 - 79 36 115Mixed Use Leisure / Conference 10.00% 0.68 0.48 15000 - 103 72 174Office 0.00% 1.56 0.21 76468 - 1193 161 1353Primary School 70.00% 1.64 1.43 4200 - 69 60 129Public House 10.00% 0.00 0.00 328 - 0 0 0Retail 50.00% 1.22 0.88 10354 - 126 91 217
Total 1766 1137 2903
UseWeekday Trips GeneratedCombined /
Internal Trips 100sqm GFA No Units
Table 8 – Development Trips. Weekday AM (0800-0900) Trip Generation
Weekday PM (1700-1800) Trip Generation
In Out In Out TotalResidential - Houses 0.00% 0.42 0.22 - 264 111 58 169Residential - Flats 0.00% 0.24 0.11 - 2174 522 239 761Café / Restaurant 5.00% 2.38 1.62 6128 - 146 99 245Community Centre 10.00% 1.25 0.95 173 - 2 2 4Hotel 0.00% 0.31 0.24 7410 - 23 18 41Manufacturing & workshops 0.00% 0.03 0.29 23904 - 7 69 76Mixed Use Leisure / Conference 10.00% 1.25 0.95 15000 - 188 142 329Office 0.00% 0.18 0.93 76468 - 138 711 849Primary School 70.00% 0.06 0.10 4200 - 3 4 7Public House 10.00% 2.25 1.53 328 - 7 5 12Retail 50.00% 2.71 3.23 10354 - 280 334 614
Total 1426 1681 3107
100sqm GFA No UnitsTrips Generated
UseCombined /
Internal Trips Weekday
Table 9 – Development Trips. Weekday PM (1700-1800) Trip Generation
4.6 The EP / LDA development proposal has been tested in two network options (1 & 2).
The common elements to both include the renovation of existing routes, reinstatement of historic streets and the creation of new permeable access streets. Strategic access to the site is predominantly composed of a renovated movement network requiring the revision of a number of lynchpin junctions and roundabouts. The development also introduces a number of new links ranging from major to minor in grade.
4.7 Committed developments of Royal William Yard & Drake Circus incorporated. All
network options are modelled with the scheme as fully developed (2020). 4.8 Where required, junctions and roundabouts have been subjected to a preliminary
design to incorporate viable geometries and pedestrian facilities such as crossings,
ALAN BAXTER & ASSOCIATES 12

Millbay, Plymouth
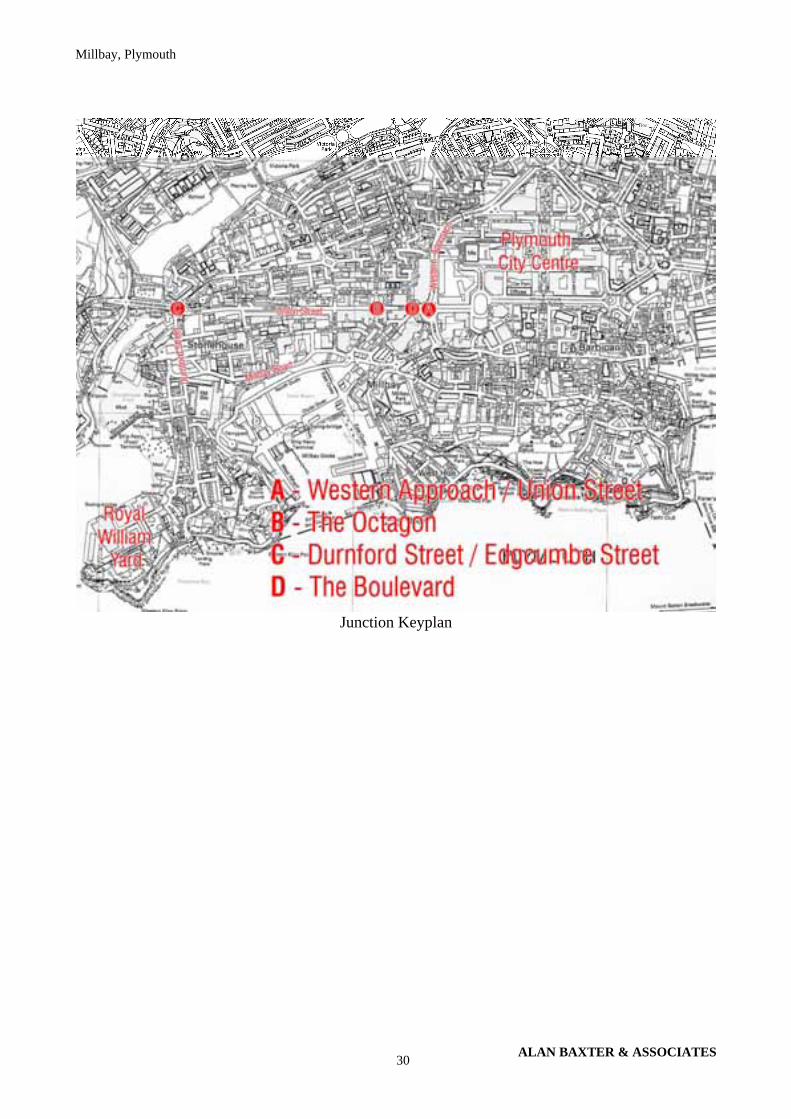
refuges, etc. As previously iterated, the modelling undertaken is a broad exercise utilising Paramics only. As such, the modelling described in this statement does not consider the detail design of junctions. It is assumed that this exercise will be undertaken at a future detailed stage of work with the use of junction specific modelling programs such as TRANSYT and OSCADY, etc. Please see Appendix B for the broad spatial form of key junctions modelled in Paramics.
ALAN BAXTER & ASSOCIATES 13

Millbay, Plymouth
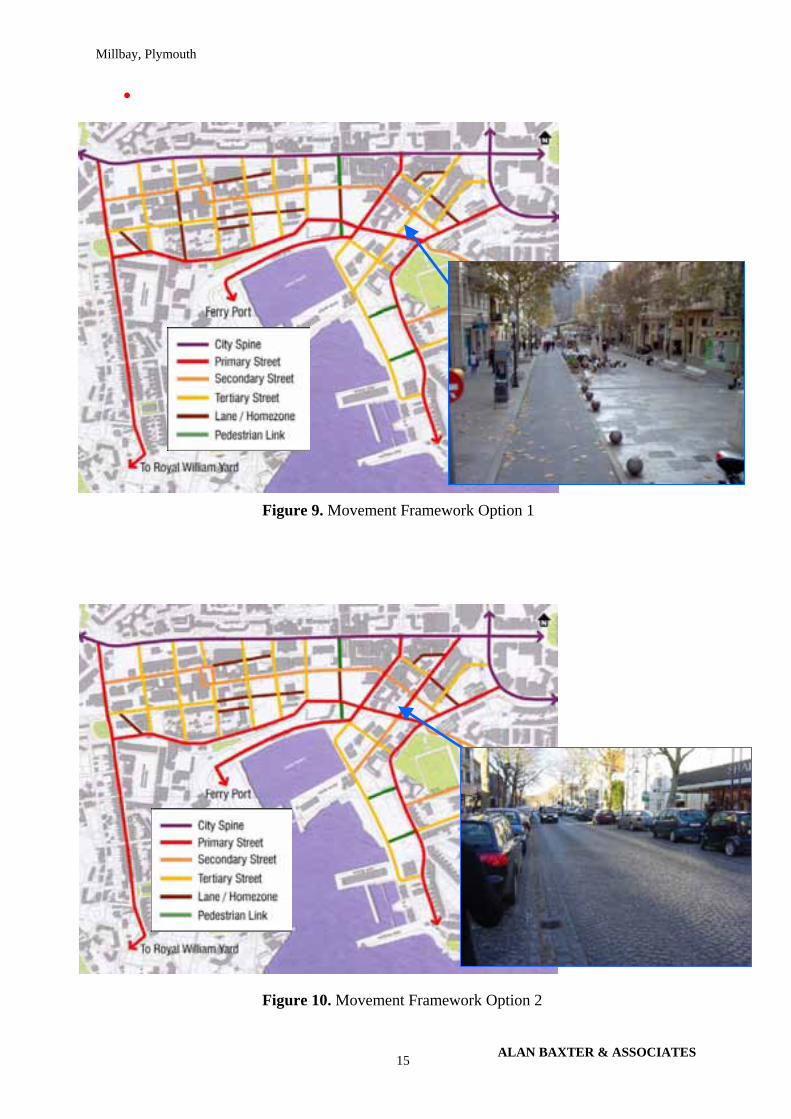
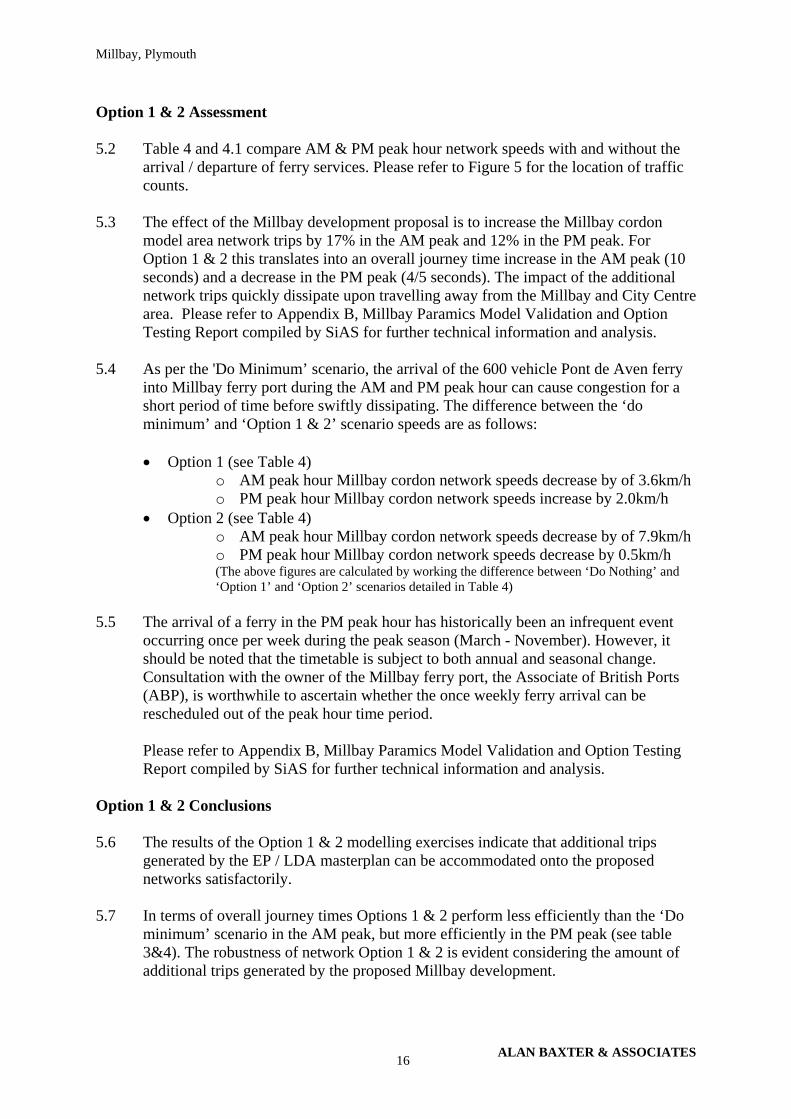
5.0 EP & LDA Masterplan Network Option 1 & 2 5.1 The common elements of Options 1 & 2 (see Fig 9 & 10) seek to:
Option 1 & 2
• Create a north – south network of permeable streets. • Convert roundabouts to junctions to reflect urban context and human scale. • Rationalise signalised junction at Western Approach/Union Street. • Create new east-west links between Martin Street and Bath Street including the
creation of a new community focus / high street. • Realign Millbay Road to promote a promenade character and address imbalance
between the vehicular and pedestrian realm. • Create of a low level pedestrian friendly link along the length of East Quay • Generally design the development to a target speed of 20mph with the intention of
introducing a 20mph speed limit to give pedestrians and cyclists greater priority. The upper echelon grade of street (Union Street, Martin Street, etc) to be suitable for a speed limit of 30mph. The lowest grade of street are to be designed as Homezones with the intention of having a speed limit of 10-15mph designated through speed orders.
The unique elements of each Option seek to: Option 1
• Create a low-grade vehicular link that is a strategic boulevard for pedestrians. The link builds upon the existing connectivity of Bath Street and re-connects the city centre with its historical waterfront.
Option 2
• Create a strategic boulevard link for both vehicles and pedestrians. The link builds upon the existing connectivity of Bath Street and re-connects the city centre with its historical waterfront.
ALAN BAXTER & ASSOCIATES 14
Millbay, Plymouth
•
Figure 9. Movement Framework Option 1
Figure 10. Movement Framework Option 2
ALAN BAXTER & ASSOCIATES 15
Millbay, Plymouth
Option 1 & 2 Assessment 5.2 Table 4 and 4.1 compare AM & PM peak hour network speeds with and without the
arrival / departure of ferry services. Please refer to Figure 5 for the location of traffic counts.
5.3 The effect of the Millbay development proposal is to increase the Millbay cordon
model area network trips by 17% in the AM peak and 12% in the PM peak. For Option 1 & 2 this translates into an overall journey time increase in the AM peak (10 seconds) and a decrease in the PM peak (4/5 seconds). The impact of the additional network trips quickly dissipate upon travelling away from the Millbay and City Centre area. Please refer to Appendix B, Millbay Paramics Model Validation and Option Testing Report compiled by SiAS for further technical information and analysis.
5.4 As per the 'Do Minimum’ scenario, the arrival of the 600 vehicle Pont de Aven ferry
into Millbay ferry port during the AM and PM peak hour can cause congestion for a short period of time before swiftly dissipating. The difference between the ‘do minimum’ and ‘Option 1 & 2’ scenario speeds are as follows:
• Option 1 (see Table 4)
o AM peak hour Millbay cordon network speeds decrease by of 3.6km/h o PM peak hour Millbay cordon network speeds increase by 2.0km/h
• Option 2 (see Table 4) o AM peak hour Millbay cordon network speeds decrease by of 7.9km/h o PM peak hour Millbay cordon network speeds decrease by 0.5km/h (The above figures are calculated by working the difference between ‘Do Nothing’ and ‘Option 1’ and ‘Option 2’ scenarios detailed in Table 4)
5.5 The arrival of a ferry in the PM peak hour has historically been an infrequent event
occurring once per week during the peak season (March - November). However, it should be noted that the timetable is subject to both annual and seasonal change. Consultation with the owner of the Millbay ferry port, the Associate of British Ports (ABP), is worthwhile to ascertain whether the once weekly ferry arrival can be rescheduled out of the peak hour time period.
Please refer to Appendix B, Millbay Paramics Model Validation and Option Testing
Report compiled by SiAS for further technical information and analysis. Option 1 & 2 Conclusions 5.6 The results of the Option 1 & 2 modelling exercises indicate that additional trips
generated by the EP / LDA masterplan can be accommodated onto the proposed networks satisfactorily.
5.7 In terms of overall journey times Options 1 & 2 perform less efficiently than the ‘Do
minimum’ scenario in the AM peak, but more efficiently in the PM peak (see table 3&4). The robustness of network Option 1 & 2 is evident considering the amount of additional trips generated by the proposed Millbay development.
ALAN BAXTER & ASSOCIATES 16

Millbay, Plymouth
5.8 The diagonal boulevard link aligned approximately along the existing Bath Street operates satisfactorily as either a minor vehicle link (Option1) or as a strategic link (Option 2).
ALAN BAXTER & ASSOCIATES 17
Millbay, Plymouth
6.0 EP Network Variations - Options 3A & 3B 6.1 The common elements of Options 3A & 3B (see Fig 11 & 12) seek to: Option 3A & 3B
• Create a north – south network of permeable streets. • Convert roundabouts to junctions. • Rationalise signalised junction at Western Approach/Union Street. • Create new east-west links between Martin Street and Bath Street including the
creation of a new community focus / high street. • Realign Millbay Road to promote a promenade character and address imbalance
between the vehicular and pedestrian realm. • Create of a low level pedestrian friendly link along the length of East Quay • Generally design the development to a target speed of 20mph with the intention of
introducing a 20mph speed limit to give pedestrians and cyclists greater priority. The upper echelon grade of street (Union Street, Martin Street, etc) to be suitable for a speed limit of 30mph. The lowest grade of street are to be designed as Homezones with the intention of having a speed limit of 10-15mph designated through speed orders.
The unique elements of each Option seek to: Option 3A
• Create a strategic boulevard link for both vehicle and pedestrians. The link builds upon the existing connectivity of Bath Street and re-connects the city centre with its historical waterfront.
• Create a dedicated link road, on the alignment of Battery Street, exclusively for access / egress to the port of Millbay. This link requires extensive cutting and supporting of Millbay Road. In urban design terms, this has significant negative impact upon the public realm and permeability of the surrounding network.
Option 3B
• Create a strategic boulevard link for both vehicle and pedestrians. The route interchanges directly into the Western Approach / Union Street junction.
• Create a dedicated link road, on the alignment of Battery Street, exclusively for access / egress to the port of Millbay. This link requires extensive cutting and supporting of Millbay Road. In urban design terms this has significant negative impact upon the public realm and permeability of the surrounding network.
ALAN BAXTER & ASSOCIATES 18

Millbay, Plymouth
Insert drawing
Figure 11. Movement Framework Option 3A
Figure 12. Movement Framework Option 3B
ALAN BAXTER & ASSOCIATES 19
Millbay, Plymouth
Option 3A & 3B Assessment 6.2 Table 4 and 4.1 compare AM & PM peak hour network speeds with and without the
arrival / departure of ferry services. Please refer to Figure 5 for the location of traffic counts.
6.3 The effect of the Millbay development is to increase network trips within the Millbay
cordon model area by 17% in the AM peak and 12% in the PM peak. For Option 3A & 3B this translates into an overall journey time increase in the AM peak of 13 / 19 seconds and a decrease in the PM peak of 6 / 0 seconds. As per Option 1 & 2, the impact arising additional network trips quickly dissipate upon travelling away from the Millbay and City centre area. Please refer Appendix B, Millbay Paramics Model Validation and Option Testing Report compiled by SiAS for further technical information and analysis.
6.4 As per the 'Do Minimum’ scenario and Options 1 & 2, the arrival of the 600 vehicle
Pont de Aven ferry into Millbay ferry port during the AM and PM peak hour can cause congestion for a short period of time before swiftly dissipating. The difference between the ‘do minimum’ and ‘Option 3A & 3B’ scenario speeds are as follows:
• Option 3A (see Table 4)
o AM peak hour Millbay cordon network speeds decrease by of 2.6km/h o PM peak hour Millbay cordon network speeds increase by 4.4km/h
• Option 3B (see Table 4) o AM peak hour Millbay cordon network speeds decrease by of 4.8km/h o PM peak hour Millbay cordon network speeds increase by 5.1km/h (The above figures are calculated by working the difference between ‘Do Nothing’ and ‘Option 3A’ and ‘Option 3B’ scenarios detailed in Table 4)
The arrival of a ferry in the PM peak hour (worst case time period) is infrequent occurring once per week during the peak season (March - November).
Option 3A & 3B Conclusions 6.5 The results of the Option 3A & 3B modelling exercises suggest that additional trips
generated by the EP / LDA masterplan can be accommodated onto the proposed network satisfactorily.
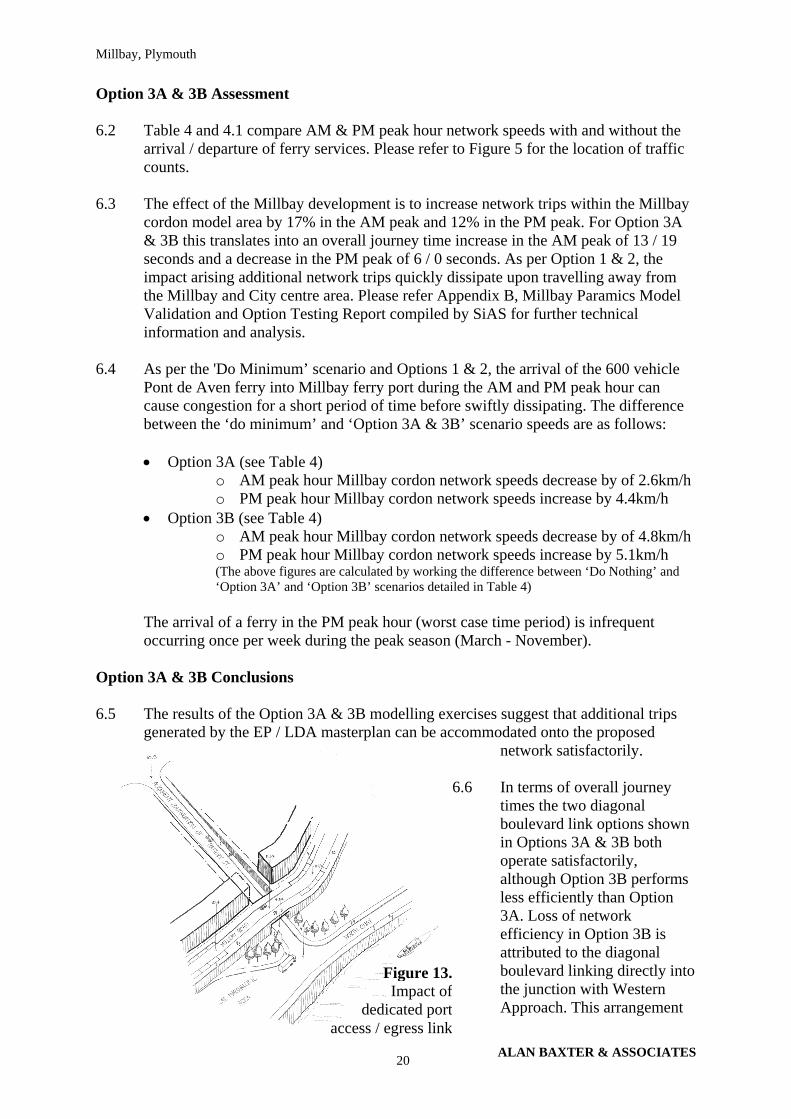
6.6 In terms of overall journey
times the two diagonal boulevard link options shown in Options 3A & 3B both operate satisfactorily, although Option 3B performs less efficiently than Option 3A. Loss of network efficiency in Option 3B is attributed to the diagonal boulevard linking directly into the junction with Western Approach. This arrangement
Figure 13.Impact of
dedicated portaccess / egress link
ALAN BAXTER & ASSOCIATES 20

Millbay, Plymouth
creates a potentially complicated five-arm junction. 6.7 In terms of overall journey times Options 3A & 3B perform less efficiently than the
‘Do minimum’ scenario in the AM peak, but more efficiently in the PM peak. Options 3A & 3B generally perform less efficiently than Options 1 & 2 (see tables 3&4).
6.8 Unsurprisingly, Options 3A & 3B perform more efficiently than Options 1 & 2 during
the arrival / departure of the ferry during the peak hour (see Table 4). This is attributed to the dedicated port access / egress on the alignment of Battery Street. In urban design terms this link has a significant negative impact upon the public realm and permeability of the surrounding network (see Fig 13). The link is also only viable if traffic is redirected away from the city centre and routes are upgraded (see Fig 14). Pursuit of dedicated port access scheme requires further strategic understanding.
Figure 14. Strategic impact of diverting port traffic to the west away from the City Centre
ALAN BAXTER & ASSOCIATES 21
Millbay, Plymouth
7.0 Conclusions 7.1 This statement has appraised the strengths and weaknesses of four preliminary
Paramics traffic modelling options based on the quantum of development proposed by the EP / LDA development proposal.
7.2 The effect of the Millbay development is to increase network trips within the Millbay
cordon model area by 17% in the AM peak and 12% in the PM peak ‘Do Nothing’ Model 7.3 Existing junction and link flows are considered to be within acceptable limits when
contrasted with other comparable UK centres. The majority of links and junctions are not operating at full capacity.
7.4 The impact of the arrival / departure of the Pont de Aven in the peak periods is
recognised as causing congestion for a short period of time. ‘Do Minimum’ Model 7.5 The impact of committed developments / changes to network upon existing junction
and link flows is to increase overall journey times and to decrease network speeds in both the AM and PM peak periods. The ‘Do Minimum’ model is considered to be operating at acceptable levels by PCC.
7.6 The impact of the arrival / departure of the Pont de Aven in the peak periods causes
congestion for a short period of time. EP & LDA Masterplan Options Overview 7.7 Analysis of the modelling exercises indicate that additional trips generated by the EP /
LDA masterplan can be accommodated onto the proposed networks satisfactorily. 7.8 In terms of overall journey times, all options perform less efficiently than the ‘Do
minimum’ scenario in the AM peak, but equal to or more efficiently in the PM peak (see table 3&4). This is testament to the permeability and robustness of the network Options considering the amount of additional trips generated by the proposed Millbay development.
7.9 Options 3A & 3B generally perform less efficiently than Options 1 & 2 (see tables
3&4). Diagonal Boulevard Link Variants 7.10 In terms of overall journey times, the three diagonal boulevard link variants all
operate satisfactorily. Furthermore, the diagonal boulevard link offers the flexibility to either be designated as a minor vehicle link (Option1) or as a strategic link (Option 2, 3A & B).
ALAN BAXTER & ASSOCIATES 22
Millbay, Plymouth
7.11 The boulevard link variation outlined in Option 3B performs the least efficiently (see
table 3). Loss of network efficiency in Option 3B is attributed to the diagonal boulevard linking directly into the junction with Western Approach. This arrangement creates a potentially complicated five-arm junction.
Arrival / Departure of Pont de Aven in Peak Periods 7.12 As per the baseline scenarios the arrival / departure of the Pont de Aven ferry at
Millbay ferry port during the AM and PM peak hour can respectively cause congestion for a short period of time before swiftly dissipating. However, it should be noted that the ferry arrival is an existing event that occurs once per week between the months of March and November (PM worst case scenario). Consultation with the owner of the Millbay ferry port, the Associate of British Ports (ABP), is recommended to ascertain whether the once weekly PM peak ferry arrival can be rescheduled out of the peak hour time period.
7.13 Unsurprisingly, Options 3A & 3B perform more efficiently than Options 1 & 2 during
the arrival / departure of the ferry during the peak hour (see Table 4). This is attributed to the dedicated port access / egress on the alignment of Battery Street. In urban design terms this link has a negative impact upon the surrounding public realm / permeability (see Fig 13). The link is also only viable if traffic is redirected away from the city centre and if strategic routes are upgraded (see Fig 14). Pursuit of dedicated port access scheme requires further understanding of strategic network capacity.
Recommendations for Further Work – Ferry Access / Egress 7.14 EP Network Variations, Options 3A & 3B propose a dedicated access / egress to the
port of Millbay. However, this link is only viable if traffic is directed away from the city centre and routed to the west of the city via Devonport. The current strategic network in the vicinity of Devonport (west) is considered to be unsuitable. Further work is needed to establish whether this strategy is viable.
Recommendations for Further Work – Future Modelling of Development Options 7.15 The purpose of undertaking preliminary modelling in Paramics was to test the
viability of the Millbay development schedule and to formulate a robust movement network capable of meeting the strategic vehicular demands imposed by that schedule.
7.16 It is assumed that this statement signifies the starting point from which a series of
future detailed modelling exercises will evolve. The land in the ownership of English Partnerhips (EP) will pass to English Cities Fund who have the intention of developing a scheme to outline planning. It is envisaged that this process will build upon the modelling outlined in this statement culminating in a Transport Assessment in line with PCC guidance. As part of this process it is recommended that the following be undertaken:
7.16.1 Internal and combined trip adjustment revisited to reflect
revised development schedule.
ALAN BAXTER & ASSOCIATES 23

Millbay, Plymouth
7.16.2 Detailed appraisal of public transport and investigation for potential of modal shift.
7.16.3 Investigation for potential of peak hour spreading in proposed options.
7.16.4 Development of parking strategy and associated impact upon trip rates.
7.16.5 Commission of formal landuse survey to ascertain uses to be supplanted by any proposed development. This allows accurate generation of trips that are to be removed from the network.
7.16.6 Further detailed consultation with the Association of British Ports (ABP) to ascertain whether the once weekly PM peak ferry arrival can be rescheduled out of the peak periods.
ALAN BAXTER & ASSOCIATES 24
Millbay, Plymouth
Appendix A
Link Flows & Count Locations
ALAN BAXTER & ASSOCIATES 25
Millb
ay, Plymouth
ALAN BAXTER & ASSOCIATES 26
Location Link Name Direction Do Nothing Do
Minimum Option 1 Option 2 Option 3A Option 3B
A Union Street East West Bound 993 1145 1046 1026 990 463A Union Street East East Bound 610 743 897 875 893 550B Union Street West West Bound 557 710 642 672 825 839B Union Street West East Bound 521 637 941 983 947 928C Western Approach South Bound 875 855 1105 1134 1108 1109C Western Approach North Bound 462 435 590 592 588 589D Martin Street South Bound 253 415 635 578 534 602D Martin Street North Bound 207 236 531 513 457 454E Millbay Road East West Bound 505 506 420 300 388 333E Millbay Road East East Bound 210 172 192 192 175 203F Millbay Road West West Bound 332 278 272 300 228 238F Millbay Road West East Bound 156 144 329 239 251 265G Stonehouse Bridge West Bound 693 734 902 907 913 913G Stonehouse Bridge North Bound 793 817 986 998 992 995
Table 1 – Link Flows. AM Peak 0800-0900. (Ex. Ferry arrival / departure). See Fig 5 for count locations.
Location Link Name Direction Do Nothing Do Minimum
Option 1 Option 2 Option 3A Option 3B
A Union Street East West Bound 962 1126 892 972 854 437A Union Street East East Bound 767 810 952 918 902 688B Union Street West West Bound 549 723 951 984 928 986B Union Street West East Bound 609 668 768 813 792 790C Western Approach South Bound 580 999 782 771 764 777C Western Approach North Bound 1083 1352 1312 1322 1337 1322D Martin Street South Bound 128 170 343 283 255 284D Martin Street North Bound 294 293 696 641 610 586E Millbay Road East West Bound 371 327 217 175 197 209E Millbay Road East East Bound 518 573 348 387 415 333F Millbay Road West West Bound 378 336 378 312 297 265F Millbay Road West East Bound 217 293 360 370 262 361G Stonehouse Bridge West Bound 1093 1151 1317 1294 1296 1301G Stonehouse Bridge North Bound 666 720 781 797 800 797
Table 2 – Link Flows. PM Peak 1700-1800. (Ex. Ferry arrival / departure). See Fig 5 for count locations.
Millbay, Plymouth
ALAN BAXTER & ASSOCIATES 27
Figure 5 – Location of traffic counts
Millbay, Plymouth
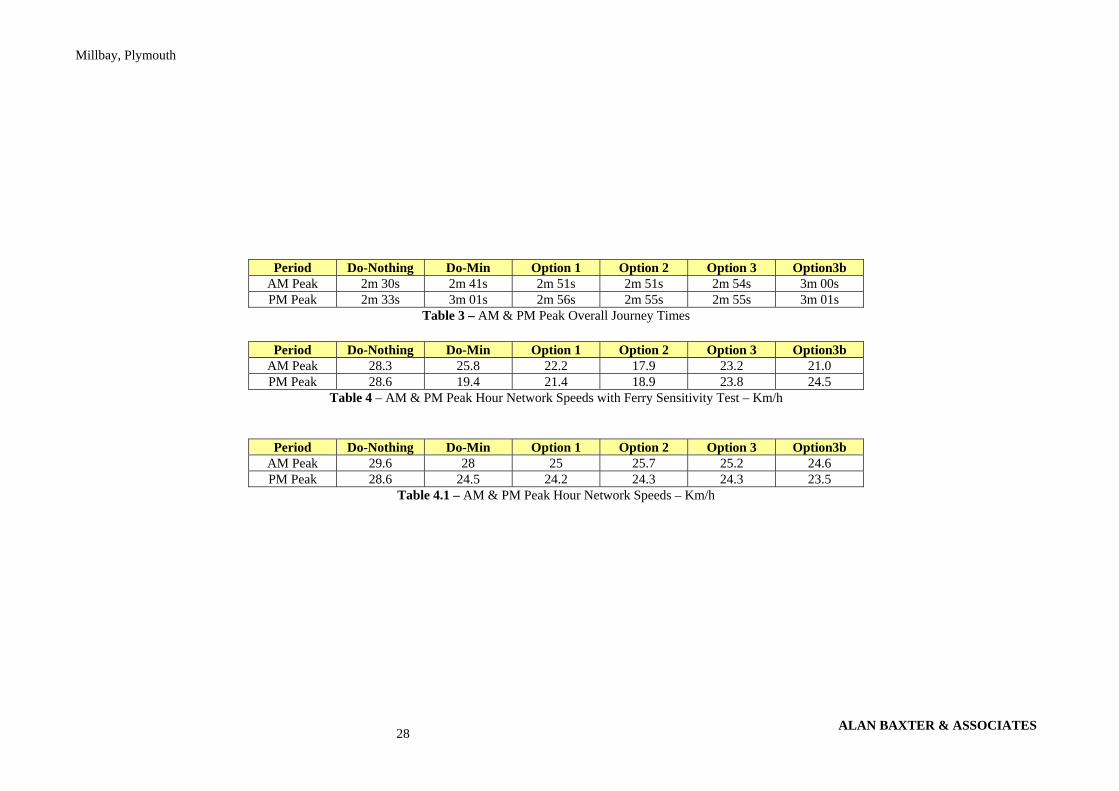
Period Do-Nothing Do-Min Option 1 Option 2 Option 3 Option3b A M Peak 2m 30s 2m 41s 2m 51s 2m 51s 2m 54s 3m 00s PM Peak 2m 33s 3m 01s 2m 56s 2m 55s 2m 55s 3m 01s
Tabl & PM erall Jo mes e 3 – AM Peak Ov urney Ti
Period Do-Nothing Do-Min Opti n 1 o Option 2 Option 3 Option3b AM Peak 28.3 25.8 22.2 17.9 23.2 21.0PM Peak 28.6 19.4 21.4 18.9 23.8 24.5
Table M r Netw s with sitivity Km/h
4 – A & PM Peak Hou ork Speed Ferry Sen Test –
Period Do-Nothing Do-Min Opti n 1 o Option 2 Option 3 Option3b
A M Peak 29.6 28 25 25.7 25.2 24.6PM Peak 28.6 24.5 24.2 24.3 24.3 23.5
Table 4.1 & PM Pea ur Network ds – Km/h – AM k
Ho Spee
ALAN BAXTER & ASSOCIATES 28
Millb
ay, Plymouth
ALAN BAXTER & ASSOCIATES 29
Appendix B
Junction Layouts (Paramics model extracts)
Millbay, Plymouth
Junction Keyplan
ALAN BAXTER & ASSOCIATES 30
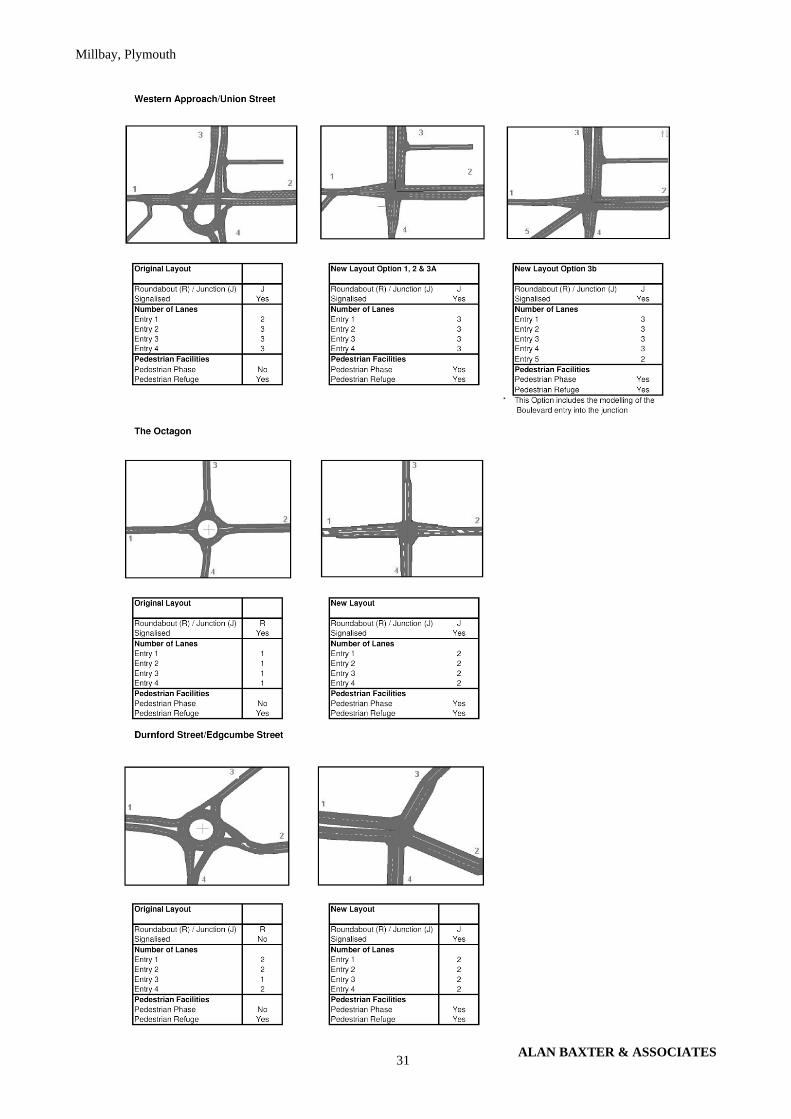
Millbay, Plymouth
ALAN BAXTER & ASSOCIATES 31

Millbay, Plymouth
ALAN BAXTER & ASSOCIATES 32
Millbay, Plymouth
Appendix C
Millbay Paramics Model Validation and Option Testing Report compiled by SiAS
ALAN BAXTER & ASSOCIATES 33