CONSTRUCTION OF OPTIMAL PORTFOLIO UNDER SHARPE … doc/2018/IJMIE_OCTOBER2018/IJMRA-14504.pdf(e.g.,...
20
International Journal of Management, IT & Engineering Vol. 8 Issue 10, October 2018, ISSN: 2249-0558 Impact Factor: 7.119 Journal Homepage: http://www.ijmra.us , Email: [email protected] Double-Blind Peer Reviewed Refereed Open Access International Journal - Included in the International Serial Directories Indexed & Listed at: Ulrich's Periodicals Directory ©, U.S.A., Open J-Gage as well as in Cabell’s Directories of Publishing Opportunities, U.S.A 114 International journal of Management, IT and Engineering http://www.ijmra.us , Email: [email protected] CONSTRUCTION OF OPTIMAL PORTFOLIO UNDER SHARPE SINGLE INDEX MODEL: A COMPARATIVE STUDY ON IT AND PHARMA SECTORS T. MALLIKHARJUNARAO * Dr. S. ANITHADEVI ** ABSTRACT Indian securities market is an exceedingly unpredictable and sensitive market where portfolio construction is exceptionally critical to get great returns. Accordingly the primary concentration of this research is to build an ideal value portfolio with the assistance of Sharpe index model. In this study, IT and PHARMA sectors have been thought about for building the ideal portfolios. Twenty companies have been selected and excess return to beta ratio has been calculated and ranked the companies based on that ratio. Ideal portfolios built for IT sector and PHARMA sector independently and thought about both the portfolios as far as portfolio return and risk. The cut-off point was ascertained in view of the most astounding worth and cut-off point should be used to calculate the proportion of money to be invested in each stocks. The outcomes of the study would be useful to investors for investing funds into IT and PHARMA sector and to choose which sector could give most elevated return at low risk. Keywords: portfolio, sharp single index model, risk premium and cut off rate. * MBA,M.Phil,(Ph.D), RESEARCH SCHOLAR, DEPARTMET OF COMMERCE AND BSINESS ADMINISTRATION, ACHARY NAGARJUNA UNIVERSITY,NAGARJUNA NAGAR,GUNTUR, ** MBA Ph.D, ASSOCIATE PROFESSOR AND HEAD, DEPARTMENT OF MANAGEMENT STUDIES, TJPS COLLEGE,GUNTUR
Transcript of CONSTRUCTION OF OPTIMAL PORTFOLIO UNDER SHARPE … doc/2018/IJMIE_OCTOBER2018/IJMRA-14504.pdf(e.g.,...
International Journal of Management, IT & Engineering Vol. 8 Issue 10, October 2018,
ISSN: 2249-0558 Impact Factor: 7.119
Journal Homepage: http://www.ijmra.us, Email: [email protected]
Double-Blind Peer Reviewed Refereed Open Access International Journal - Included in the International Serial
Directories Indexed & Listed at: Ulrich's Periodicals Directory ©, U.S.A., Open J-Gage as well as in Cabell’s
Directories of Publishing Opportunities, U.S.A
114 International journal of Management, IT and Engineering
http://www.ijmra.us, Email: [email protected]
CONSTRUCTION OF OPTIMAL PORTFOLIO UNDER
SHARPE SINGLE INDEX MODEL: A COMPARATIVE
STUDY ON IT AND PHARMA SECTORS
T. MALLIKHARJUNARAO*
Dr. S. ANITHADEVI**
ABSTRACT
Indian securities market is an exceedingly unpredictable and sensitive market where portfolio
construction is exceptionally critical to get great returns. Accordingly the primary concentration of
this research is to build an ideal value portfolio with the assistance of Sharpe index model. In this
study, IT and PHARMA sectors have been thought about for building the ideal portfolios. Twenty
companies have been selected and excess return to beta ratio has been calculated and ranked the
companies based on that ratio. Ideal portfolios built for IT sector and PHARMA sector
independently and thought about both the portfolios as far as portfolio return and risk. The cut-off
point was ascertained in view of the most astounding worth and cut-off point should be used to
calculate the proportion of money to be invested in each stocks. The outcomes of the study would
be useful to investors for investing funds into IT and PHARMA sector and to choose which sector
could give most elevated return at low risk.
Keywords: portfolio, sharp single index model, risk premium and cut off rate.
* MBA,M.Phil,(Ph.D), RESEARCH SCHOLAR, DEPARTMET OF COMMERCE AND
BSINESS ADMINISTRATION, ACHARY NAGARJUNA UNIVERSITY,NAGARJUNA
NAGAR,GUNTUR,
** MBA Ph.D, ASSOCIATE PROFESSOR AND HEAD, DEPARTMENT OF
MANAGEMENT STUDIES, TJPS COLLEGE,GUNTUR
ISSN: 2249-0558 Impact Factor: 7.119
115 International journal of Management, IT and Engineering
http://www.ijmra.us, Email: [email protected]
INTRODUCTION
Among various Investment avenues one of the most romantic Investments is equity Investment, which
results most attractive returns with tolerable risks. Equity investment involves purchase of equity shares of
different companies. Investment in one stock may result high risk. So the investor needs to select more
stocks in order to reduce risk. In the market plenty of equity shares are available for trading. Hence,
investor may face a problem of selection of stocks for his portfolio form of investment. A portfolio is a
combination of securities. Any portfolio constructed, either by an individual investor or a fund
manager is expected to meet the investor's goals. A rational investor aims at attaining maximum return
with minimum risk. It is, therefore, important to construct a portfolio using either of the two popular
approaches, namely, traditional and modern.
In the traditional approach, investor's needs in terms of income and capital appreciation are evaluated and
appropriate securities are selected to meet the needs of the investor. In the modern approach, Markowitz
model is used in selection of securities based on to the risk and return analysis. Markowitz laid
foundation for quantifying risk and his contribution is popularly known as 'Modern Portfolio Theory'. He
has provided analytical tools for analysis and selection of optimal portfolio. He won Nobel Prize for
this contribution to portfolio management in 1990. But, William Sharpe extended the work done
by Markowitz. He considered market index while analyzing the portfolio. He simplified the amount
and type of input data required to perform portfolio analysis. He made the numerous and complex
computations easy which were essential to attain the optimal portfolio. He developed the Single Index
Model to make these computations easy and construct an optimal portfolio. Till today, fund managers use
this model in portfolio analysis and construction.
LITERATURE REVIEW
Saravanan and Natarajan(2012) was concluded that returns on either individual securities or on
portfolio comprises of securities of different companies listed in Nifty 50 stocks under various sectors
are asymmetrical and heterogeneous. The optimal portfolio consists of four stocks selected out of 50
short listed scrips, giving the return of 0.116. Further it helps to elicit that return on securities of different
portfolio is independent of the systematic risk prevailing in the market.
ISSN: 2249-0558 Impact Factor: 7.119
116 International journal of Management, IT and Engineering
http://www.ijmra.us, Email: [email protected]
Mandal, Niranjan (2013) found that there is a significant difference between the total risk of the
optimal portfolio calculated under two different mechanisms found in SIM and Markowitz’s
model. The total risk of the optimal portfolio is 2.87% (in terms of SD) under SIM and the total
risk of the portfolio is found to be 1.79% (in terms of SD) in Markowitz’s model taking the
necessary input from SIM.
Sarker, Mokta Rani (2013) conducted a study to construct an optimal portfolio using Sharpe's
Single Index Model considering no short sales. The study has been conducted on individual securities listed
in Dhaka Stock Exchange, where short sales are not allowed. The monthly closing prices of one hundred
and sixty four companies listed in Dhaka Stock Exchange and share price index for the period of
July 2007 to June 2012 have been considered in this study. This method formulates a unique cut-
off point, selects stocks having excess return to beta ratio surpassing this cut-off point and
determines the percentage of investment to be made in each of selected stocks. The optimum portfolio
consists of thirty three stocks selected out of one hundred and sixty four stocks giving the return of
6.17%. From this empirical analysis to some extent, an investor can forecast individual securities
return through the market movement and can make use of it.
Ms Apurva and AChauhan(2014) said that Portfolio management is the crucial decision for
any investor. It is important to decide where to invest and how much to invest. The present study
focuses on constructing the optimal portfolio with the help of Sharpe Single Index model. Sharpe
Single index model uses various inputs such as excess return to beta ratio, unsystematic risk,
market return and variance etc to construct the optimal portfolio. In his study, portfolio is
constructed from stocks of CNX nifty. Data is collected from top ten companies of CNX nifty
based on their weights for the time period of August 2014. Out of 10 stocks, 4 stocks are selected
for investing namely State Bank of India, Tata Motors Ltd, Housing Development Finance
Corporation Ltd, Reliance Industries Ltd. Sharpe model suggest investors to invest major portion
of their money (54.14%) in State Bank of India.
J. Francis Mary and G. Rathika (2015) stated that Risk and return plays an important role in
making any investment decisions. Decision include Investment should be done or not and which
securities should be included in portfolio. Determining efficient portfolios within an asset class
ISSN: 2249-0558 Impact Factor: 7.119
117 International journal of Management, IT and Engineering
http://www.ijmra.us, Email: [email protected]
(e.g., stocks) can be achieved with the Single index (beta) model proposed by Sharpe. Sharpe's
single-index model was applied by using the monthly closing prices of 10 companies listed in
NSE and CNX PHARMA price index for the period from September 2010 to September 2014.
From the empirical analysis it can be concluded that out of 10 companies only one company is
selected for investment purpose on the basis of Cut-off point which is -0.11182.
Chintan A. Shah (2015) said that Sharpe model gives exact number of securities along with
weightage for investment, while this is not possible in CAPM model. CAPM model only suggest
different securities where investor can invest but it does not give a particular portfolio and
weightage to investment in different securities.
Dr. S Poornima and Aruna. P. Remesh (2016)have been conducted a study to construct an
optimal portfolio using Sharpe’s single index model by using risk-return analysis of automobile
and pharmaceutical sectors. This study includes ten stocks from automobile sector and ten stocks
from pharmaceutical sector. Data for a period of five years (2010-2015) had been taken for the
study. After analysing the collected data a “cut-off rate “can calculate. This cut–off rate is
considered in the construction of optimal portfolio. Every investor prefers maximum return with
a minimum risk. This study found out that Ashok Leyland having highest return and Hyundai
having lowest return.
M Sathyapriya (2016) proposed that performance of PHARMA sector is comparatively better
than INFRA sector from an analysis of four years’ asset value, from 2008 to 2012, of companies
picked from Infrastructure & Pharmaceutical sectors. In this regard, Sharpe Index Model is used,
which is regularly employed to assess the performance of mutual funds and portfolio strategies.
The stock performance of 20 companies from Infrastructure and Pharmaceuticals, 10 from each
are taken and calculated. It is found that Pharmaceutical sector performs 80% better than that of
Infrastructure sector. Performance of Infrastructure sector is comparatively poorer than Pharma
as only one company is selected for the portfolio, i.e., GMR, which constitutes just 7% of the
investment share.

ISSN: 2249-0558 Impact Factor: 7.119
118 International journal of Management, IT and Engineering
http://www.ijmra.us, Email: [email protected]
Thus, the literature survey made for the present study showed that there is enough scope for
studying the utility of Sharpe's Single Index Model under the Indian context, especially
considering the securities of companies traded through the NSE which is one of the largest stock
exchange in the world and which is considered as one of the major attractions to any investor,
either individual or institutional.
NEED FOR THE STUDY
Every investor undergoes confusion while selecting securities for his portfolio. He also faces dilemma while
deciding about the proportion of investment to be made in each security. To help investors get out of such
chaotic situations the Sharpe's Single Index model may be used to construct an optimal portfolio. This
helps the investor to find a portfolio that best suits his needs. The present study is undertaken to prove
that by applying this model an individual can construct a portfolio with maximum return for a given level
of risk.
STATEENT OF THE PROBLEM
An investor considering investment in securities is faced with the problem of choosing from among a
large number of securities and how to allocate those funds over a group of securities. The hurdle
that exists is that the investor has a problem of deciding which securities to hold and how much to
invest in each of them. Though Markowitz Model enables an investor to arrive at an optimal
portfolio, the Single index model is helpful in avoiding the difficulty of data input and time cost
consideration. Therefore, the present study is entitled, ‘Construction of optimal equity portfolio with
application of Sharpe single index model -A comparative study on IT and PHARMA sectors’.
OBJECTIVES OF THE STUDY
The following are the objectives of the study:
1) To understand the application of Sharpe's index model in order to take effective investment decisions
2) To calculate return and risks of selected stocks in the IT and PHARMA sectors
3) To calculate beta values for all selected stocks in both sectors to identify the nature of stocks
4) To construct an optimal portfolio with IT sector stocks and PHARMA sector stocks and compare
two portfolios by portfolio return and portfolio risk and select best portfolio
ISSN: 2249-0558 Impact Factor: 7.119
119 International journal of Management, IT and Engineering
http://www.ijmra.us, Email: [email protected]
SCOPE OF THE STUDY
The scope of the present study is relating to equity portfolio construction with IT stocks and
PHARMA stocks from the NSE. In this study researcher considered stocks which are included in the NSE IT
INDEX and PHARMA INDEX. Other stocks in the related sectors have not been taken for the portfolio
analysis. Present study confined to stocks listed at national stock exchange (NSE) only.
RESEARCH METHODOLOGY
The study is mainly based on secondary data. The present study had been undertaken to construct
optimal portfolios from the IT stocks and PHARMA stocks and compare the portfolio returns
and risks of two portfolios using Sharpe single index model. For this purpose, took NSE as
reference stock market. Nifty 500 index has been taken as bench mark market index for the
purpose of measuring market return and market variance. A sample of 20 Stocks in NSE’s IT
and PHARMA Indices were taken for portfolio analysis. Purposive sampling method is followed
to select stocks to compare portfolio return and risks of IT and PHARMA sectors. Monthly
closing values of stocks and market index for eight years from April 2009 to March 2017 had
been taken for calculation of mean return, risk and other data inputs for the portfolio
construction. This period is chosen to identify the performance of stocks after the world financial
crisis 2008 which affected drastically stock markets at international level. 91 days treasury bills
yields average return for same period has been used as proxy for risk-free rate sourced from
"RBI". April 1, 2017 has been taken as base date for the selection of stocks in indices. Required
data were collected from the sources of www.nseindia.com / www.moneycontrol.com. Collected
data were analysed with the help of Microsoft Excel software for the calculation of mean return,
standard deviation, variance, covariance, correlation, beta, alpha and residual variance or random
error term.
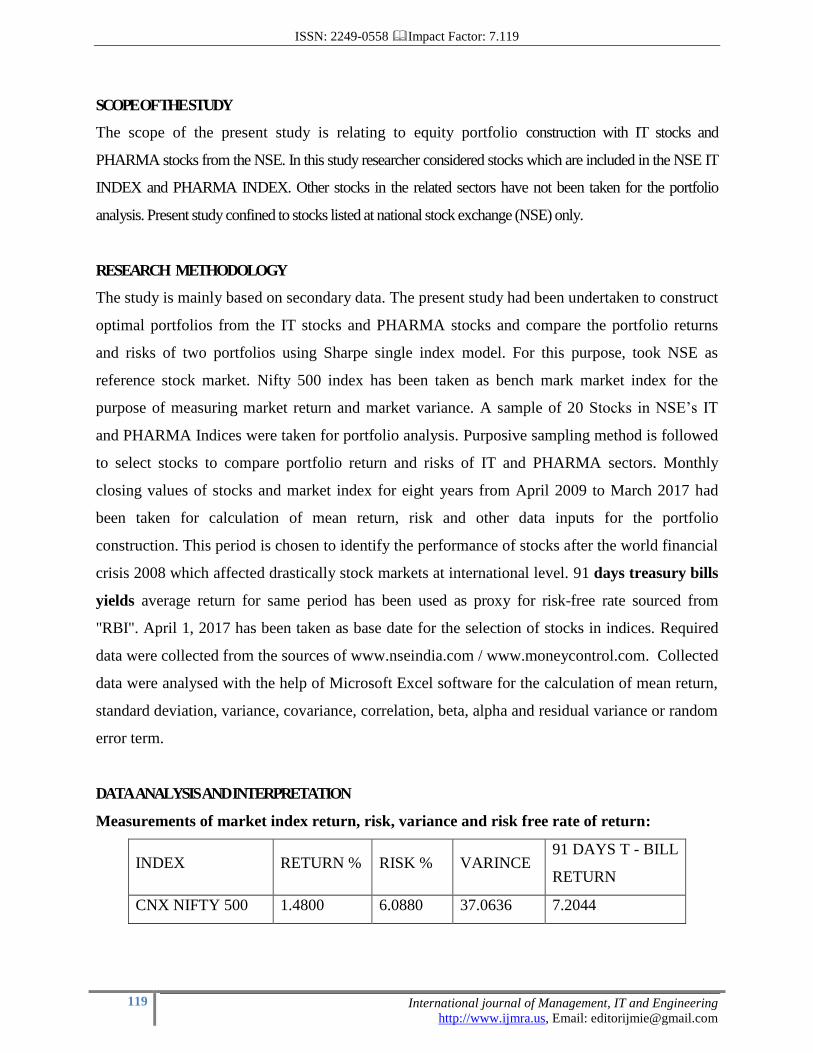
DATA ANALYSIS AND INTERPRETATION
Measurements of market index return, risk, variance and risk free rate of return:
INDEX RETURN % RISK % VARINCE 91 DAYS T - BILL
RETURN
CNX NIFTY 500 1.4800 6.0880 37.0636 7.2044
ISSN: 2249-0558 Impact Factor: 7.119
120 International journal of Management, IT and Engineering
http://www.ijmra.us, Email: [email protected]
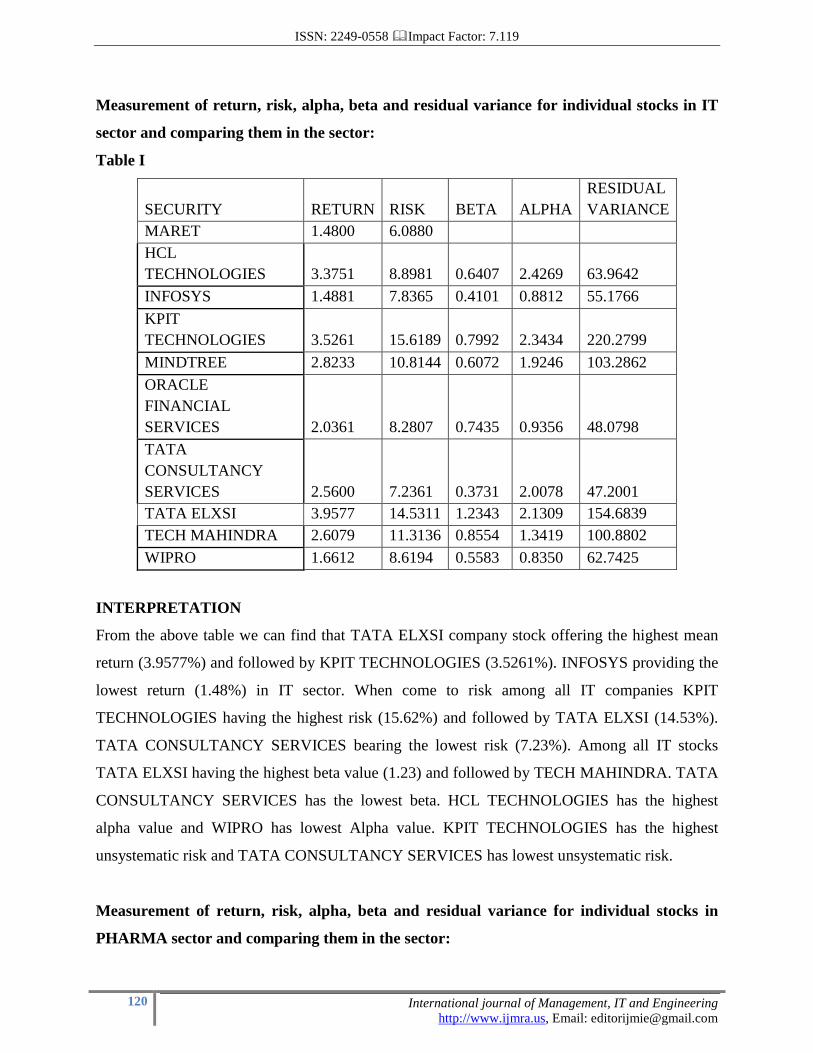
Measurement of return, risk, alpha, beta and residual variance for individual stocks in IT
sector and comparing them in the sector:
Table I
SECURITY RETURN RISK BETA ALPHA
RESIDUAL
VARIANCE
MARET 1.4800 6.0880
HCL
TECHNOLOGIES 3.3751 8.8981 0.6407 2.4269 63.9642
INFOSYS 1.4881 7.8365 0.4101 0.8812 55.1766
KPIT
TECHNOLOGIES 3.5261 15.6189 0.7992 2.3434 220.2799
MINDTREE 2.8233 10.8144 0.6072 1.9246 103.2862
ORACLE
FINANCIAL
SERVICES 2.0361 8.2807 0.7435 0.9356 48.0798
TATA
CONSULTANCY
SERVICES 2.5600 7.2361 0.3731 2.0078 47.2001
TATA ELXSI 3.9577 14.5311 1.2343 2.1309 154.6839
TECH MAHINDRA 2.6079 11.3136 0.8554 1.3419 100.8802
WIPRO 1.6612 8.6194 0.5583 0.8350 62.7425
INTERPRETATION
From the above table we can find that TATA ELXSI company stock offering the highest mean
return (3.9577%) and followed by KPIT TECHNOLOGIES (3.5261%). INFOSYS providing the
lowest return (1.48%) in IT sector. When come to risk among all IT companies KPIT
TECHNOLOGIES having the highest risk (15.62%) and followed by TATA ELXSI (14.53%).
TATA CONSULTANCY SERVICES bearing the lowest risk (7.23%). Among all IT stocks
TATA ELXSI having the highest beta value (1.23) and followed by TECH MAHINDRA. TATA
CONSULTANCY SERVICES has the lowest beta. HCL TECHNOLOGIES has the highest
alpha value and WIPRO has lowest Alpha value. KPIT TECHNOLOGIES has the highest
unsystematic risk and TATA CONSULTANCY SERVICES has lowest unsystematic risk.
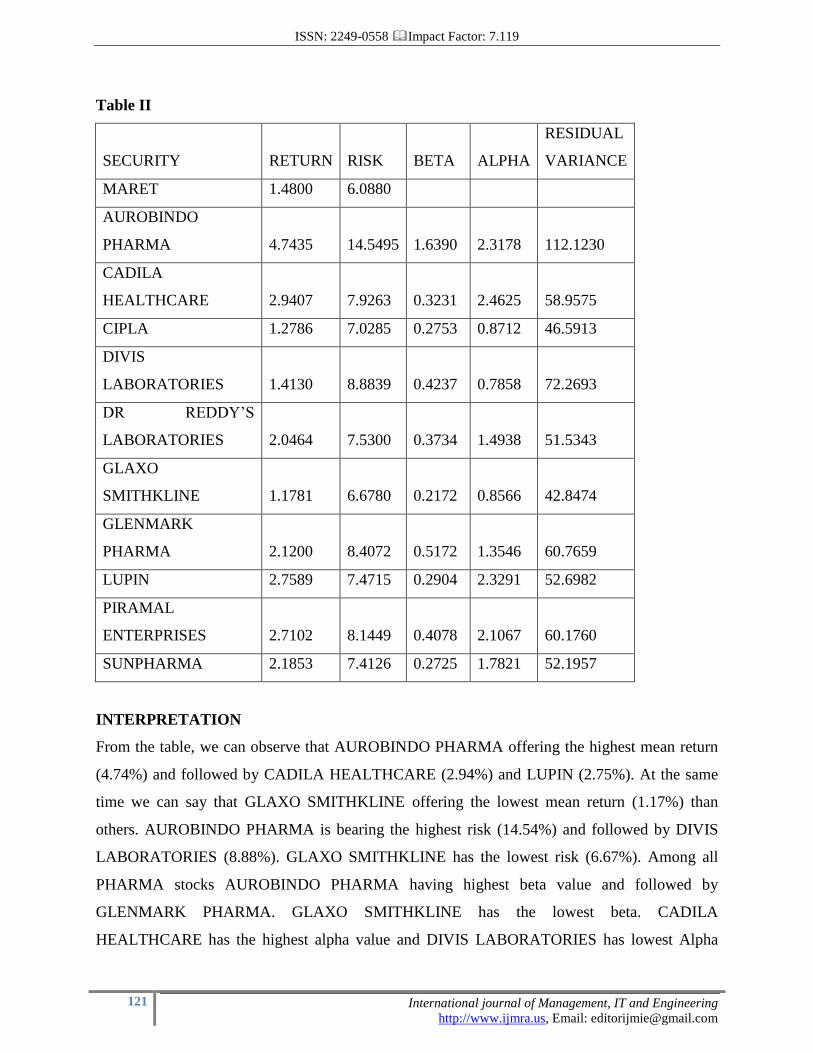
Measurement of return, risk, alpha, beta and residual variance for individual stocks in
PHARMA sector and comparing them in the sector:
ISSN: 2249-0558 Impact Factor: 7.119
121 International journal of Management, IT and Engineering
http://www.ijmra.us, Email: [email protected]
Table II
SECURITY RETURN RISK BETA ALPHA
RESIDUAL
VARIANCE
MARET 1.4800 6.0880
AUROBINDO
PHARMA 4.7435 14.5495 1.6390 2.3178 112.1230
CADILA
HEALTHCARE 2.9407 7.9263 0.3231 2.4625 58.9575
CIPLA 1.2786 7.0285 0.2753 0.8712 46.5913
DIVIS
LABORATORIES 1.4130 8.8839 0.4237 0.7858 72.2693
DR REDDY’S
LABORATORIES 2.0464 7.5300 0.3734 1.4938 51.5343
GLAXO
SMITHKLINE 1.1781 6.6780 0.2172 0.8566 42.8474
GLENMARK
PHARMA 2.1200 8.4072 0.5172 1.3546 60.7659
LUPIN 2.7589 7.4715 0.2904 2.3291 52.6982
PIRAMAL
ENTERPRISES 2.7102 8.1449 0.4078 2.1067 60.1760
SUNPHARMA 2.1853 7.4126 0.2725 1.7821 52.1957
INTERPRETATION
From the table, we can observe that AUROBINDO PHARMA offering the highest mean return
(4.74%) and followed by CADILA HEALTHCARE (2.94%) and LUPIN (2.75%). At the same
time we can say that GLAXO SMITHKLINE offering the lowest mean return (1.17%) than
others. AUROBINDO PHARMA is bearing the highest risk (14.54%) and followed by DIVIS
LABORATORIES (8.88%). GLAXO SMITHKLINE has the lowest risk (6.67%). Among all
PHARMA stocks AUROBINDO PHARMA having highest beta value and followed by
GLENMARK PHARMA. GLAXO SMITHKLINE has the lowest beta. CADILA
HEALTHCARE has the highest alpha value and DIVIS LABORATORIES has lowest Alpha
ISSN: 2249-0558 Impact Factor: 7.119
122 International journal of Management, IT and Engineering
http://www.ijmra.us, Email: [email protected]
value. AUROBINDO PHARMA has the highest unsystematic risk and GLAXO SMITHKLINE
has lowest unsystematic risk.
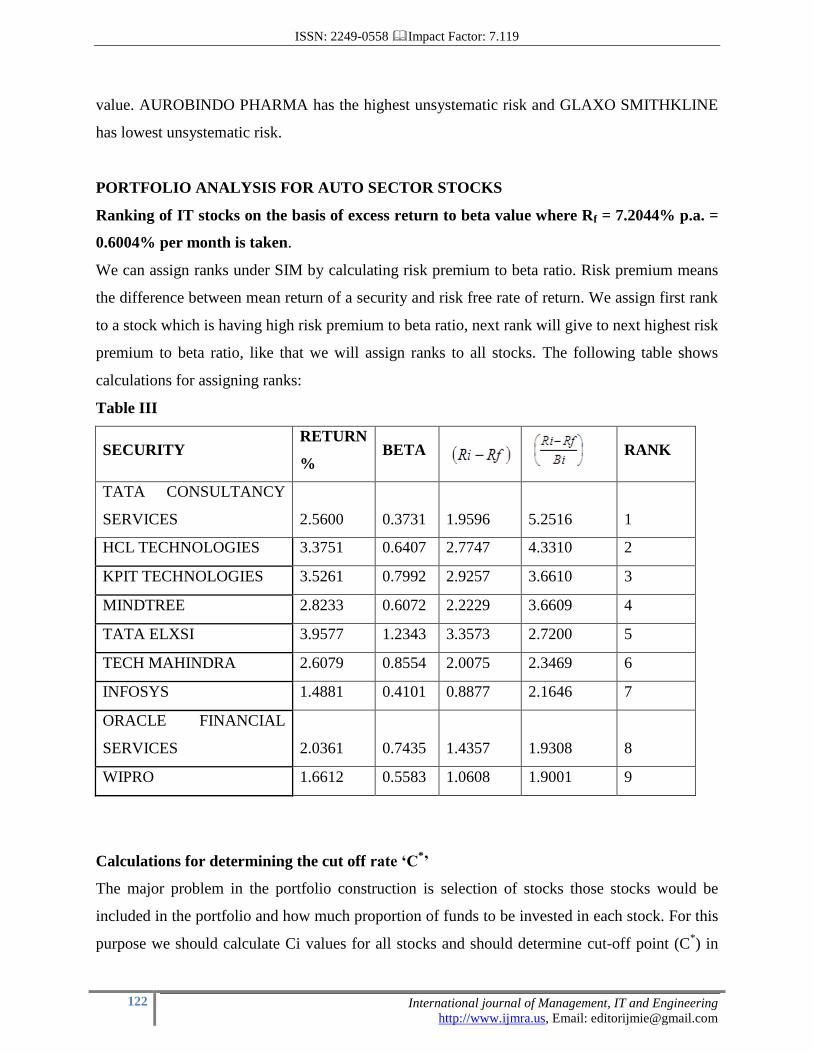
PORTFOLIO ANALYSIS FOR AUTO SECTOR STOCKS
Ranking of IT stocks on the basis of excess return to beta value where Rf = 7.2044% p.a. =
0.6004% per month is taken.
We can assign ranks under SIM by calculating risk premium to beta ratio. Risk premium means
the difference between mean return of a security and risk free rate of return. We assign first rank
to a stock which is having high risk premium to beta ratio, next rank will give to next highest risk
premium to beta ratio, like that we will assign ranks to all stocks. The following table shows
calculations for assigning ranks:
Table III
SECURITY RETURN
% BETA
RANK
TATA CONSULTANCY
SERVICES 2.5600 0.3731 1.9596 5.2516 1
HCL TECHNOLOGIES 3.3751 0.6407 2.7747 4.3310 2
KPIT TECHNOLOGIES 3.5261 0.7992 2.9257 3.6610 3
MINDTREE 2.8233 0.6072 2.2229 3.6609 4
TATA ELXSI 3.9577 1.2343 3.3573 2.7200 5
TECH MAHINDRA 2.6079 0.8554 2.0075 2.3469 6
INFOSYS 1.4881 0.4101 0.8877 2.1646 7
ORACLE FINANCIAL
SERVICES 2.0361 0.7435 1.4357 1.9308 8
WIPRO 1.6612 0.5583 1.0608 1.9001 9
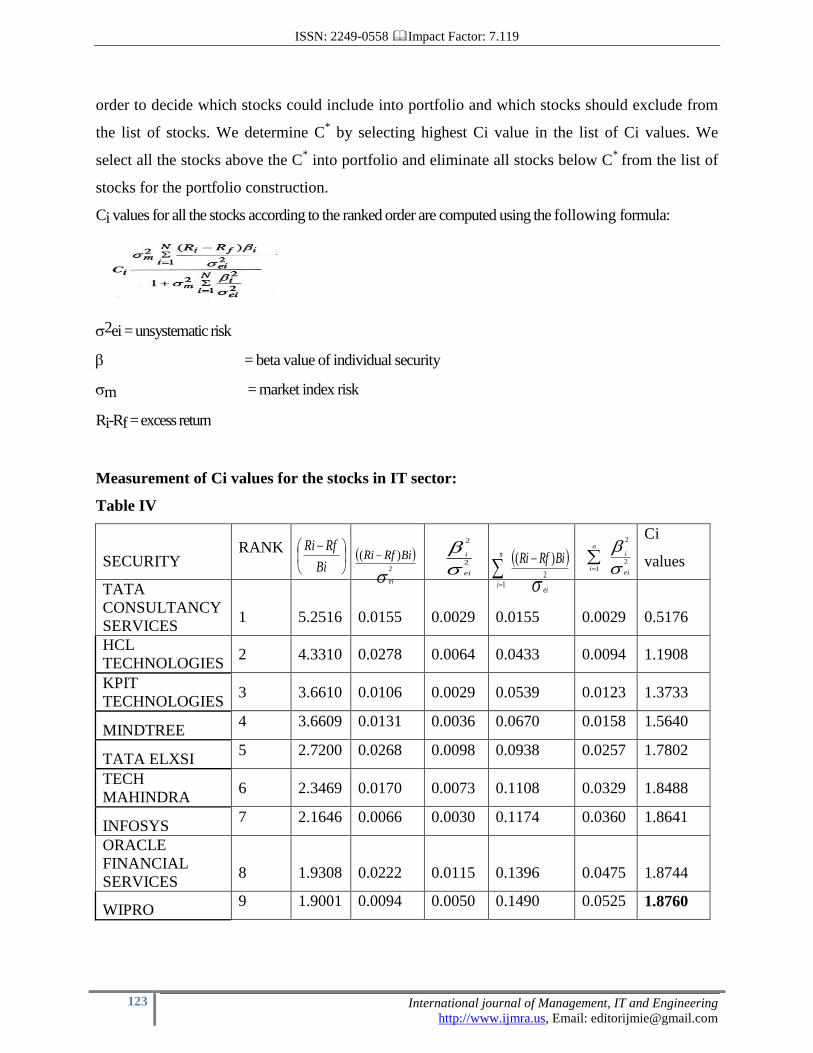
Calculations for determining the cut off rate ‘C*’
The major problem in the portfolio construction is selection of stocks those stocks would be
included in the portfolio and how much proportion of funds to be invested in each stock. For this
purpose we should calculate Ci values for all stocks and should determine cut-off point (C*) in
ISSN: 2249-0558 Impact Factor: 7.119
123 International journal of Management, IT and Engineering
http://www.ijmra.us, Email: [email protected]
order to decide which stocks could include into portfolio and which stocks should exclude from
the list of stocks. We determine C* by selecting highest Ci value in the list of Ci values. We
select all the stocks above the C* into portfolio and eliminate all stocks below C
* from the list of
stocks for the portfolio construction.
Ci values for all the stocks according to the ranked order are computed using the following formula:
2ei = unsystematic risk
= beta value of individual security
m = market index risk
Ri-Rf = excess return
Measurement of Ci values for the stocks in IT sector:
Table IV
SECURITY RANK
Ci
values
TATA
CONSULTANCY
SERVICES 1 5.2516 0.0155 0.0029 0.0155 0.0029 0.5176
HCL
TECHNOLOGIES 2 4.3310 0.0278 0.0064 0.0433 0.0094 1.1908
KPIT
TECHNOLOGIES 3 3.6610 0.0106 0.0029 0.0539 0.0123 1.3733
MINDTREE 4 3.6609 0.0131 0.0036 0.0670 0.0158 1.5640
TATA ELXSI 5 2.7200 0.0268 0.0098 0.0938 0.0257 1.7802
TECH
MAHINDRA 6 2.3469 0.0170 0.0073 0.1108 0.0329 1.8488
INFOSYS 7 2.1646 0.0066 0.0030 0.1174 0.0360 1.8641
ORACLE
FINANCIAL
SERVICES 8 1.9308 0.0222 0.0115 0.1396 0.0475 1.8744
WIPRO 9 1.9001 0.0094 0.0050 0.1490 0.0525 1.8760
Bi
RfRi
2
)(
ei
BiRfRi
2
2
ei
i
2
1
)(
ei
n
i
BiRfRi
2
2
1ei
in
i
ISSN: 2249-0558 Impact Factor: 7.119
124 International journal of Management, IT and Engineering
http://www.ijmra.us, Email: [email protected]
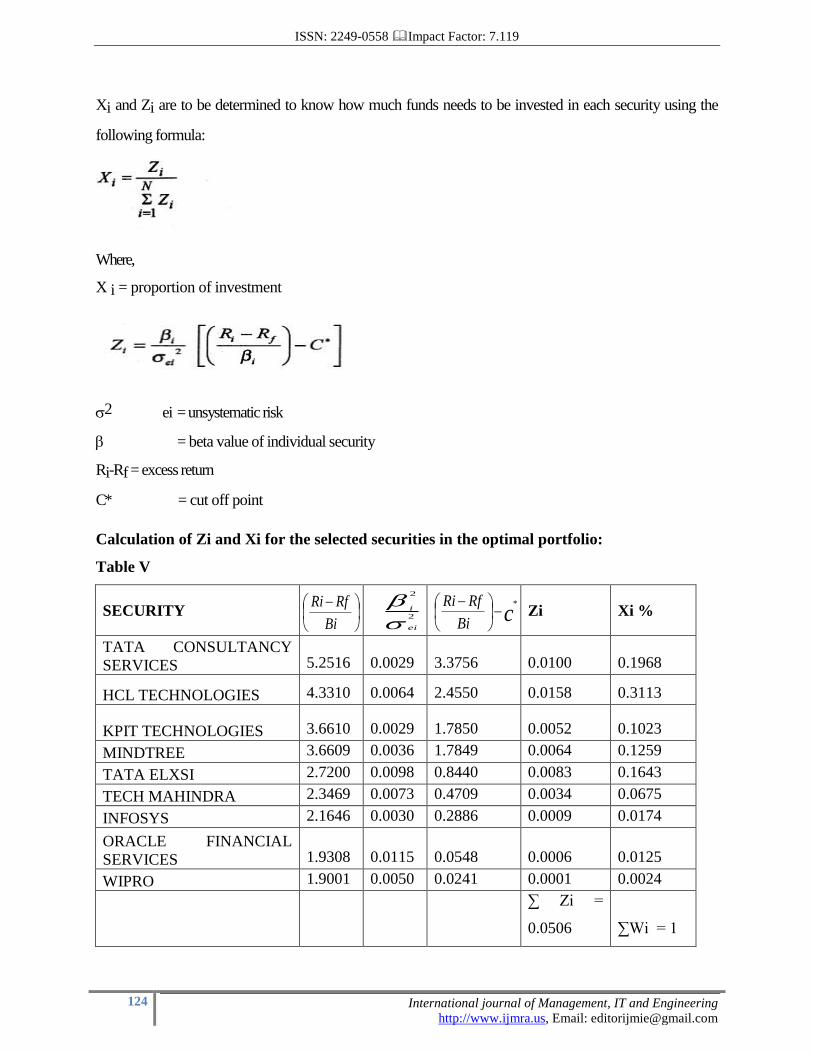
Xi and Zi are to be determined to know how much funds needs to be invested in each security using the
following formula:
Where,
X i = proportion of investment
2 ei = unsystematic risk
= beta value of individual security
Ri-Rf = excess return
C* = cut off point
Calculation of Zi and Xi for the selected securities in the optimal portfolio:
Table V
SECURITY
Zi Xi %
TATA CONSULTANCY
SERVICES 5.2516 0.0029 3.3756 0.0100 0.1968
HCL TECHNOLOGIES 4.3310 0.0064 2.4550 0.0158 0.3113
KPIT TECHNOLOGIES 3.6610 0.0029 1.7850 0.0052 0.1023
MINDTREE 3.6609 0.0036 1.7849 0.0064 0.1259
TATA ELXSI 2.7200 0.0098 0.8440 0.0083 0.1643
TECH MAHINDRA 2.3469 0.0073 0.4709 0.0034 0.0675
INFOSYS 2.1646 0.0030 0.2886 0.0009 0.0174
ORACLE FINANCIAL
SERVICES 1.9308 0.0115 0.0548 0.0006 0.0125
WIPRO 1.9001 0.0050 0.0241 0.0001 0.0024
∑ Zi =
0.0506 ∑Wi = 1
Bi
RfRi
2
2
ei
i cBi
RfRi *
ISSN: 2249-0558 Impact Factor: 7.119
125 International journal of Management, IT and Engineering
http://www.ijmra.us, Email: [email protected]
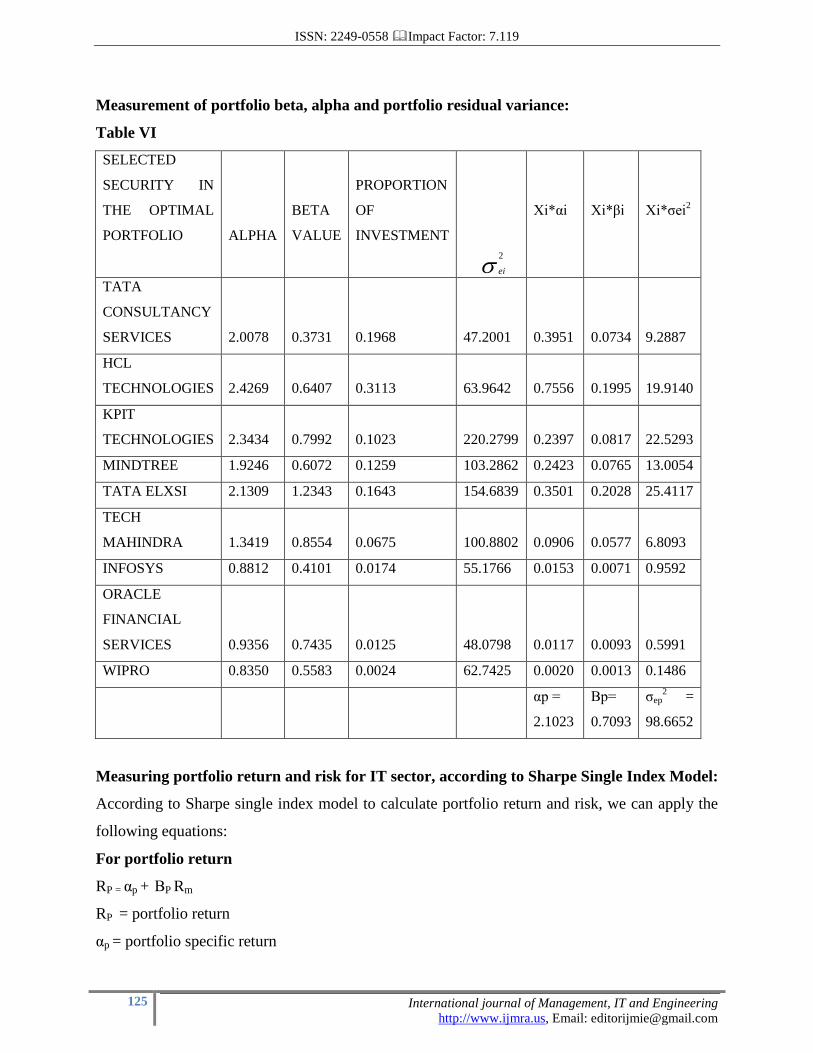
Measurement of portfolio beta, alpha and portfolio residual variance:
Table VI
SELECTED
SECURITY IN
THE OPTIMAL
PORTFOLIO
ALPHA
BETA
VALUE
PROPORTION
OF
INVESTMENT
Xi*αi Xi*βi Xi*σei2
TATA
CONSULTANCY
SERVICES 2.0078 0.3731 0.1968 47.2001 0.3951 0.0734 9.2887
HCL
TECHNOLOGIES 2.4269 0.6407 0.3113 63.9642 0.7556 0.1995 19.9140
KPIT
TECHNOLOGIES 2.3434 0.7992 0.1023 220.2799 0.2397 0.0817 22.5293
MINDTREE 1.9246 0.6072 0.1259 103.2862 0.2423 0.0765 13.0054
TATA ELXSI 2.1309 1.2343 0.1643 154.6839 0.3501 0.2028 25.4117
TECH
MAHINDRA 1.3419 0.8554 0.0675 100.8802 0.0906 0.0577 6.8093
INFOSYS 0.8812 0.4101 0.0174 55.1766 0.0153 0.0071 0.9592
ORACLE
FINANCIAL
SERVICES 0.9356 0.7435 0.0125 48.0798 0.0117 0.0093 0.5991
WIPRO 0.8350 0.5583 0.0024 62.7425 0.0020 0.0013 0.1486
αp =
2.1023
Βp=
0.7093
σep2 =
98.6652
Measuring portfolio return and risk for IT sector, according to Sharpe Single Index Model:
According to Sharpe single index model to calculate portfolio return and risk, we can apply the
following equations:
For portfolio return
RP = αp + ΒP Rm
RP = portfolio return
αp = portfolio specific return
2
ei
ISSN: 2249-0558 Impact Factor: 7.119
126 International journal of Management, IT and Engineering
http://www.ijmra.us, Email: [email protected]
ΒP = beta of the portfolio
Rm = market return
For portfolio variance
σp2 = ΒP
2 σm
2 + σep
2
σp2 = portfolio variance
σm2 = market variance
σep2 = portfolio residual variance
Portfolio risk = σp
σp = √ σp2
By substituting the above inputs we can measure the portfolio return and risk:
Portfolio return
RP = 2.1023+ (0.7093* 1.4800)
RP = 3.1520 %
Portfolio variance
σp2 = (0.7093)
2 37.0636+ 98.6652
σp2 = 18.6471 + 98.6652
σp2 = 117.3123
σp = 10.8311 %
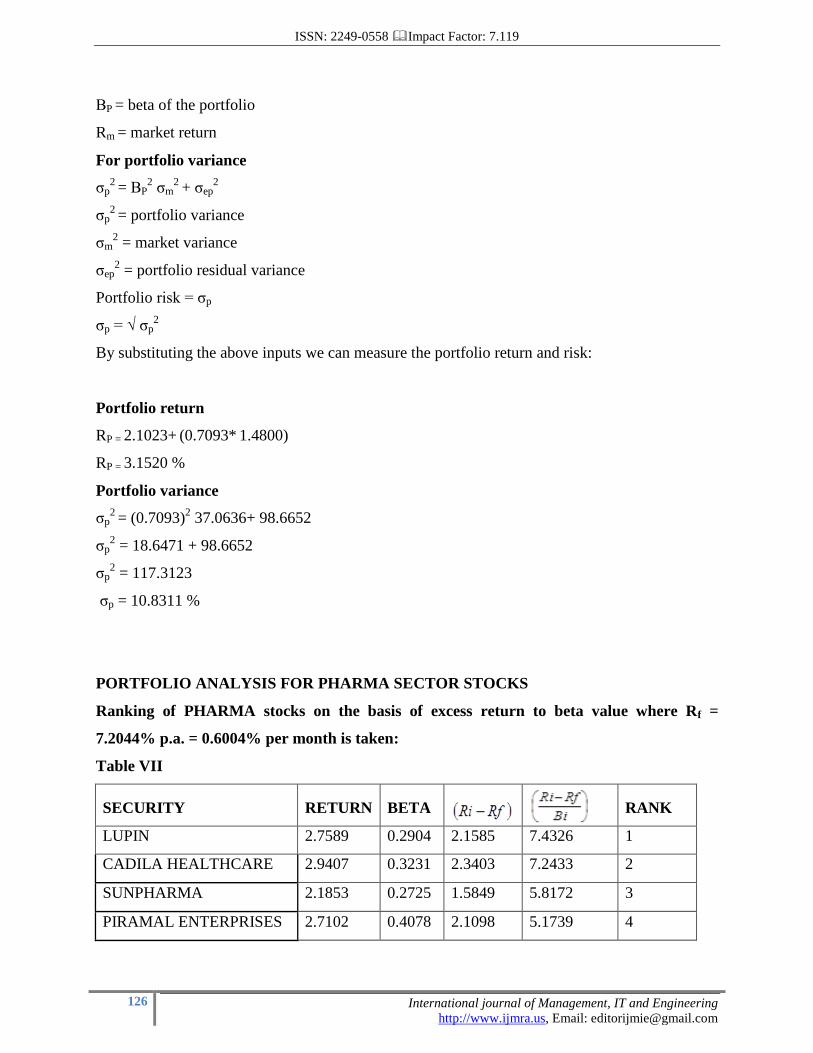
PORTFOLIO ANALYSIS FOR PHARMA SECTOR STOCKS
Ranking of PHARMA stocks on the basis of excess return to beta value where Rf =
7.2044% p.a. = 0.6004% per month is taken:
Table VII
SECURITY RETURN BETA
RANK
LUPIN 2.7589 0.2904 2.1585 7.4326 1
CADILA HEALTHCARE 2.9407 0.3231 2.3403 7.2433 2
SUNPHARMA 2.1853 0.2725 1.5849 5.8172 3
PIRAMAL ENTERPRISES 2.7102 0.4078 2.1098 5.1739 4
ISSN: 2249-0558 Impact Factor: 7.119
127 International journal of Management, IT and Engineering
http://www.ijmra.us, Email: [email protected]
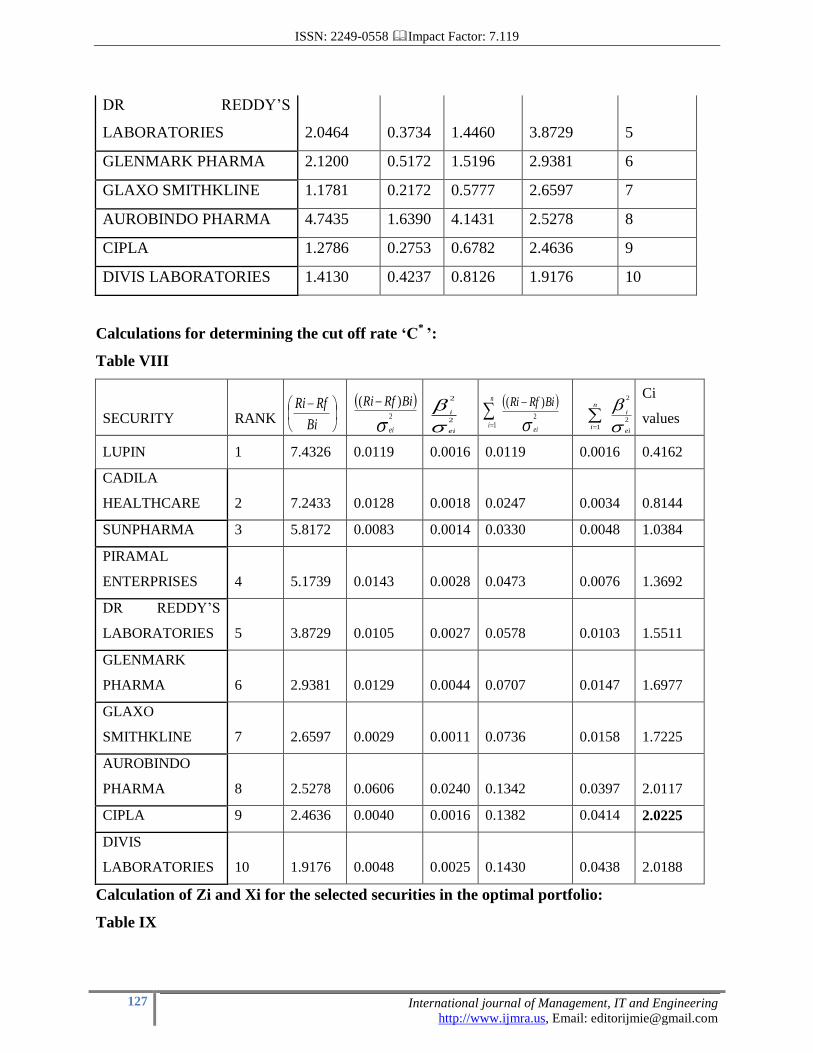
DR REDDY’S
LABORATORIES 2.0464 0.3734 1.4460 3.8729 5
GLENMARK PHARMA 2.1200 0.5172 1.5196 2.9381 6
GLAXO SMITHKLINE 1.1781 0.2172 0.5777 2.6597 7
AUROBINDO PHARMA 4.7435 1.6390 4.1431 2.5278 8
CIPLA 1.2786 0.2753 0.6782 2.4636 9
DIVIS LABORATORIES 1.4130 0.4237 0.8126 1.9176 10
Calculations for determining the cut off rate ‘C*
’:
Table VIII
SECURITY RANK
Ci
values
LUPIN 1 7.4326 0.0119 0.0016 0.0119 0.0016 0.4162
CADILA
HEALTHCARE 2 7.2433 0.0128 0.0018 0.0247 0.0034 0.8144
SUNPHARMA 3 5.8172 0.0083 0.0014 0.0330 0.0048 1.0384
PIRAMAL
ENTERPRISES 4 5.1739 0.0143 0.0028 0.0473 0.0076 1.3692
DR REDDY’S
LABORATORIES 5 3.8729 0.0105 0.0027 0.0578 0.0103 1.5511
GLENMARK
PHARMA 6 2.9381 0.0129 0.0044 0.0707 0.0147 1.6977
GLAXO
SMITHKLINE 7 2.6597 0.0029 0.0011 0.0736 0.0158 1.7225
AUROBINDO
PHARMA 8 2.5278 0.0606 0.0240 0.1342 0.0397 2.0117
CIPLA 9 2.4636 0.0040 0.0016 0.1382 0.0414 2.0225
DIVIS
LABORATORIES 10 1.9176 0.0048 0.0025 0.1430 0.0438 2.0188
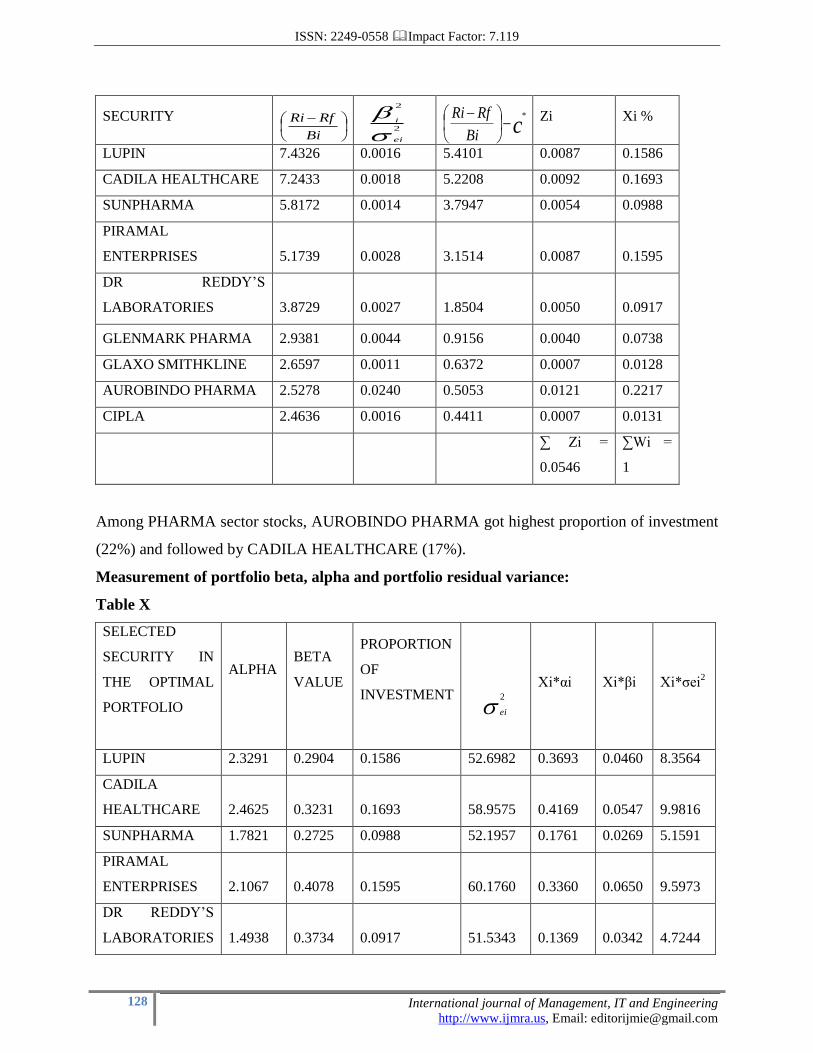
Calculation of Zi and Xi for the selected securities in the optimal portfolio:
Table IX
Bi
RfRi
2
)(
ei
BiRfRi
2
2
ei
i
2
1
)(
ei
n
i
BiRfRi
2
2
1ei
in
i
ISSN: 2249-0558 Impact Factor: 7.119
128 International journal of Management, IT and Engineering
http://www.ijmra.us, Email: [email protected]
SECURITY
Zi Xi %
LUPIN 7.4326 0.0016 5.4101 0.0087 0.1586
CADILA HEALTHCARE 7.2433 0.0018 5.2208 0.0092 0.1693
SUNPHARMA 5.8172 0.0014 3.7947 0.0054 0.0988
PIRAMAL
ENTERPRISES 5.1739 0.0028 3.1514 0.0087 0.1595
DR REDDY’S
LABORATORIES 3.8729 0.0027 1.8504 0.0050 0.0917
GLENMARK PHARMA 2.9381 0.0044 0.9156 0.0040 0.0738
GLAXO SMITHKLINE 2.6597 0.0011 0.6372 0.0007 0.0128
AUROBINDO PHARMA 2.5278 0.0240 0.5053 0.0121 0.2217
CIPLA 2.4636 0.0016 0.4411 0.0007 0.0131
∑ Zi =
0.0546
∑Wi =
1
Among PHARMA sector stocks, AUROBINDO PHARMA got highest proportion of investment
(22%) and followed by CADILA HEALTHCARE (17%).
Measurement of portfolio beta, alpha and portfolio residual variance:
Table X
SELECTED
SECURITY IN
THE OPTIMAL
PORTFOLIO
ALPHA
BETA
VALUE
PROPORTION
OF
INVESTMENT
Xi*αi Xi*βi Xi*σei2
LUPIN 2.3291 0.2904 0.1586 52.6982 0.3693 0.0460 8.3564
CADILA
HEALTHCARE 2.4625 0.3231 0.1693 58.9575 0.4169 0.0547 9.9816
SUNPHARMA 1.7821 0.2725 0.0988 52.1957 0.1761 0.0269 5.1591
PIRAMAL
ENTERPRISES 2.1067 0.4078 0.1595 60.1760 0.3360 0.0650 9.5973
DR REDDY’S
LABORATORIES 1.4938 0.3734 0.0917 51.5343 0.1369 0.0342 4.7244
Bi
RfRi
2
2
ei
i cBi
RfRi *
2
ei
ISSN: 2249-0558 Impact Factor: 7.119
129 International journal of Management, IT and Engineering
http://www.ijmra.us, Email: [email protected]
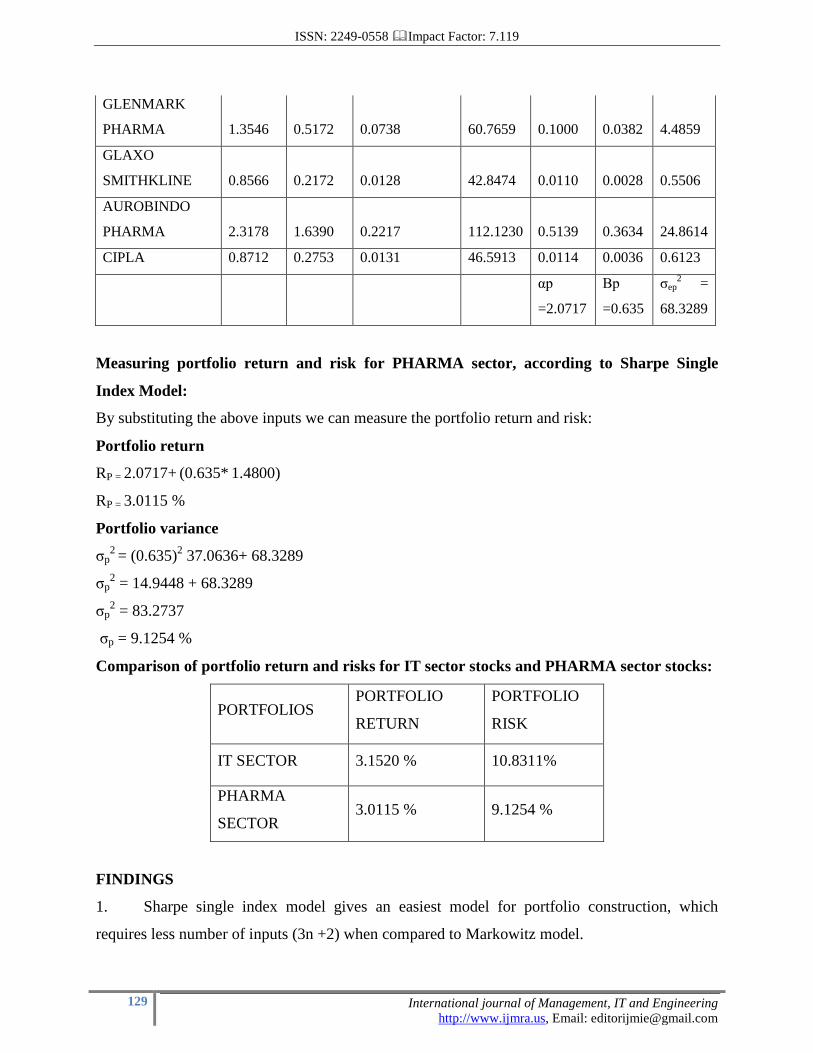
GLENMARK
PHARMA 1.3546 0.5172 0.0738 60.7659 0.1000 0.0382 4.4859
GLAXO
SMITHKLINE 0.8566 0.2172 0.0128 42.8474 0.0110 0.0028 0.5506
AUROBINDO
PHARMA 2.3178 1.6390 0.2217 112.1230 0.5139 0.3634 24.8614
CIPLA 0.8712 0.2753 0.0131 46.5913 0.0114 0.0036 0.6123
αp
=2.0717
Βp
=0.635
σep2 =
68.3289
Measuring portfolio return and risk for PHARMA sector, according to Sharpe Single
Index Model:
By substituting the above inputs we can measure the portfolio return and risk:
Portfolio return
RP = 2.0717+ (0.635* 1.4800)
RP = 3.0115 %
Portfolio variance
σp2 = (0.635)
2 37.0636+ 68.3289
σp2 = 14.9448 + 68.3289
σp2 = 83.2737
σp = 9.1254 %
Comparison of portfolio return and risks for IT sector stocks and PHARMA sector stocks:
PORTFOLIOS PORTFOLIO
RETURN
PORTFOLIO
RISK
IT SECTOR 3.1520 % 10.8311%
PHARMA
SECTOR 3.0115 % 9.1254 %
FINDINGS
1. Sharpe single index model gives an easiest model for portfolio construction, which
requires less number of inputs (3n +2) when compared to Markowitz model.
ISSN: 2249-0558 Impact Factor: 7.119
130 International journal of Management, IT and Engineering
http://www.ijmra.us, Email: [email protected]
2. From the study it was found that IT sector stocks offering slightly higher returns than the
PHARMA sector stocks and also they were bearing high risks.
3. In the IT sector TATA ELEXI offering highest mean return and INFOSYS having lowest
mean return. KPIT TECHNOLOGIES bearing highest risk and TCS bearing lowest risk.
4. In the PHARMA sector AUROBINDO PHARMA is offering the highest mean return and
GLAXO SMITHKLINE having lowest mean return. AUROBINDO PHARMA bearing the
highest risk and GLAXO SMITHKLINE bearing lowest risk.
5. Except TATA ELEXI all IT stocks listed as defensive stocks and Except AUROBINDO
PHARMA all PHARMA stocks listed as defensive stocks.
6. In the IT sector HCL TECHNOLOGIES has the highest ALPHA value and WIPRO
having lowest ALPHA value.
7. In the PHARMA sector CADILA has the highest ALPHA value and DIVIS
LABORATORIES having lowest ALPHA value.
8. In the IT sector KPIT TECHNOLOGIES having the highest unsystematic risk and TCS
having lowest unsystematic risk.
9. In the PHARMA sector AUROBINDO PHARMA having the highest unsystematic risk
and GLAXO SMITHKLINE having lowest unsystematic risk.
10. In the list of IT stocks all 9 stocks are included in optimal portfolio due to Ci values of all
stocks are met cut-off criteria.
11. In the list of PHARMA stocks except DIVIS LABORATORIES all stocks are included in
optimal portfolio.
12. Portfolio with IT sector stocks providing the highest return (3.1520 %) and risk
(10.8311%) when compared to portfolio with PHARMA sector stocks which consists portfolio
return (3.0115 %) and portfolio risk (9.1254 %).
RECOMENDATIONS
So far it is clear that the construction of optimal portfolio by using Sharpe’s Single Index Model
is easier and more comfortable than any other portfolio models. Thus two optimal portfolios are
constructed by selecting nineteen companies, 9 companies from IT sector which are constituents

ISSN: 2249-0558 Impact Factor: 7.119
131 International journal of Management, IT and Engineering
http://www.ijmra.us, Email: [email protected]
of NIFTY IT INDEX listed in NSE and 10 companies from PHARMA sector which are
constituents of NIFTY PHARMA INDEX listed in NSE. After calculating the “cut-off “Values
for the IT sector sample companies out of 9 companies, nine were selected for the optimal
portfolio construction, they are TATA CONSULTANCY SERVICES, HCL TECHNOLOGIES,
KPIT TECHNOLOGIES, MINDTREE, TATA ELXSI TECH MAHINDRA, INFOSYS,
ORACLE FINANCIAL SERVICES and WIPRO. In the sample of PHARMA sector companies,
nine were selected out of 10 companies for the optimal portfolio construction. They are LUPIN,
CADILA HEALTHCARE, SUNPHARMA, PIRAMAL ENTERPRISES, DR REDDY’S
LABORATORIES, GLENMARK PHARMA, GLAXO SMITHKLINE, AUROBINDO
PHARMA and CIPLA. In the two portfolios, portfolio with IT sector companies offering slightly
higher return (3.15%) and bearing the highest risk (10.83%). Portfolio with PHARMA sector
companies offering return to (3.01%) and bearing the lowest risk (9.1254%). From the above
remarks it can be concluded that both sectors offering more or less same return but PHARMA
sector portfolio having less risk when compared to IT sector. Here can suggest to the individual
investors and portfolio managers to take investment decisions to invest in PHARMA stocks for
moderate expected return and risk, than the IT sector stocks. This study helps the investors to
minimize their investment risk and maximize the return to their investment. It can be suggested
to risk aversors to invest in portfolio with PHARMA stocks.
Investing in individual securities is associated with high risk, where as investing in a portfolio of
securities helped to spread the risk of many securities and thus reducing overall risk involved.
Portfolios, which are combinations of securities, tend to spread risk over many securities and
thus help to reduce the overall risk involved. This method of construction of optimal portfolio is
very effective and convenient as revision of the optimal portfolio can be an ongoing exercise.
The existence of a cut-off rate is also extremely useful because the newest securities that have an
excess return-to beta ratio to the cut-off rate can be included in the optimal portfolio.
SCOPE FOR THE FORTHER RESEARCH
The present study has been taken on the topic of construction of optimal portfolios with the IT
sector and PHARMA sector stocks. Here there is a scope for the further research that is to
construct and Compare optimal port folios with other sectoral stocks like public sector banks and
ISSN: 2249-0558 Impact Factor: 7.119
132 International journal of Management, IT and Engineering
http://www.ijmra.us, Email: [email protected]
private sector banks and metals and media. There is further scope to study on construction of
diversified optimal portfolio with stocks of different sectors. In this paper the researcher used
the Sharpe single index model for optimal portfolio construction. So here there is possibility to
study on optimal portfolio construction with the capital asset pricing model.
CONCLSION
Thus this study helps the investors to minimize their overall risk and maximize the return of their
investment over any period of time. The optimal portfolio thus developed proved to be the best
investment option in NSE, but the daily market fluctuation based on international financial
queues and emotions resulted in security price fluctuations beyond the predicted risk levels.
LIMITATIONS OF THE STUDY
The limitations of the present study are:
The study uses monthly closing prices of stocks instead of daily closing prices of stocks.
Only 20 companies had been selected for conducting this study 10 from IT sector and 10 from
PHARMA sector. Among twenty companies, one company has excluded from the analysis due to
insufficient data.
The results of the study may not be universally applicable. The study was conducted in Indian
context only.
Here was taken few IT and PHARMA stocks for portfolio analysis out of all listed IT and
PHARMA companies.
BIBILIOGRAPHY
BOOKS:
1. Punithavathy pandian, Security Analysis Portfolio Management, Second edition, VIKAS
publishing house Pvt Ltd.
2. V.K Bhalla, Investment Management, 14th
edition, S. CHAND Company Ltd.
3. Prasnna Chandra, Investment Analysis and Portfolio Management, 3rd
edition, TATA
Mc Graw – Hill.
4. S.Kevin, Security Analysis and Portfolio Management, Eastern economy edition,
Prentice hall of India.
ISSN: 2249-0558 Impact Factor: 7.119
133 International journal of Management, IT and Engineering
http://www.ijmra.us, Email: [email protected]
JOURNALS:
1. Chintan A. Shah, Construction of Optimal Portfolio Using Sharpe Index Model & Camp for
BSE Top 15 Securities, IJRAR- International Journal of Research and Analytical Reviews,
VOLUME 2, ISSUE 2, APRIL - JUNE 2015, pp. 168-178.
2. Dr. Niranjan Mandal, (2013), “Optimal Portfolio Construction by using Sharpe's Single Index Model ",
the journal of institute of public enterprise, Volume-36, No 1&2, pp: 21-44.
3. Dr. S Poornima and Aruna. P. Remesh, Construction of Optimal Portfolio using Sharpe’s
Single Index Model: A Study with Reference to Automobiles and Pharmaceutical Sector,
International Journal of Advance Research in Computer Science and Management Studies,
Volume 4, Issue 3, March 2016, pp. 159-163.
4. J. Francis Mary and G. Rathika, the single index model and the construction of optimal
portfolio with CNX PHARMA scrip, International Journal of Management (IJM), ISSN 0976 –
6502(Print), ISSN 0976 - 6510(Online), Volume 6, Issue 1, January (2015), pp. 87-96.
5. Ms Apurva and A Chauhan, A Study on Usage of Sharpe’s Single Index Model In Portfolio
Construction With Reference To Cnx Nifty, GJRA - GLOBAL JOURNAL FOR RESEARCH
ANALYSIS, Volume-3, Issue-10, Oct-2014 • ISSN No 2277 – 8160, pp. 92-94.
6. Saravanan, A &Natarahan, P 2012, 'Optimal Portfolio Construction with Nifty Stocks',
Advances In Management, Vol. 5(8) Aug., pp. 4-53.
7. Sarker, Mokta Rani (2013), " Optimal Portfolio Construction: Evidence from Dhaka Stock Exchange
, Bangladesh", World Journal of Social Sciences, 3 (6), pp: 75-87.
WEBSITES:
www.nseindia.com
www.moneycontrol.com
www.rbi.com