Construction industry report - WorkSafe Queensland · for all accepted claims in Queensland...
80
Construction industry report PN11424 Construction industry report Information and Evaluation Unit, WHSQ Published February 2013
Transcript of Construction industry report - WorkSafe Queensland · for all accepted claims in Queensland...
Construction industry report PN11424
Construction industry report
Information and Evaluation Unit, WHSQ
Published February 2013
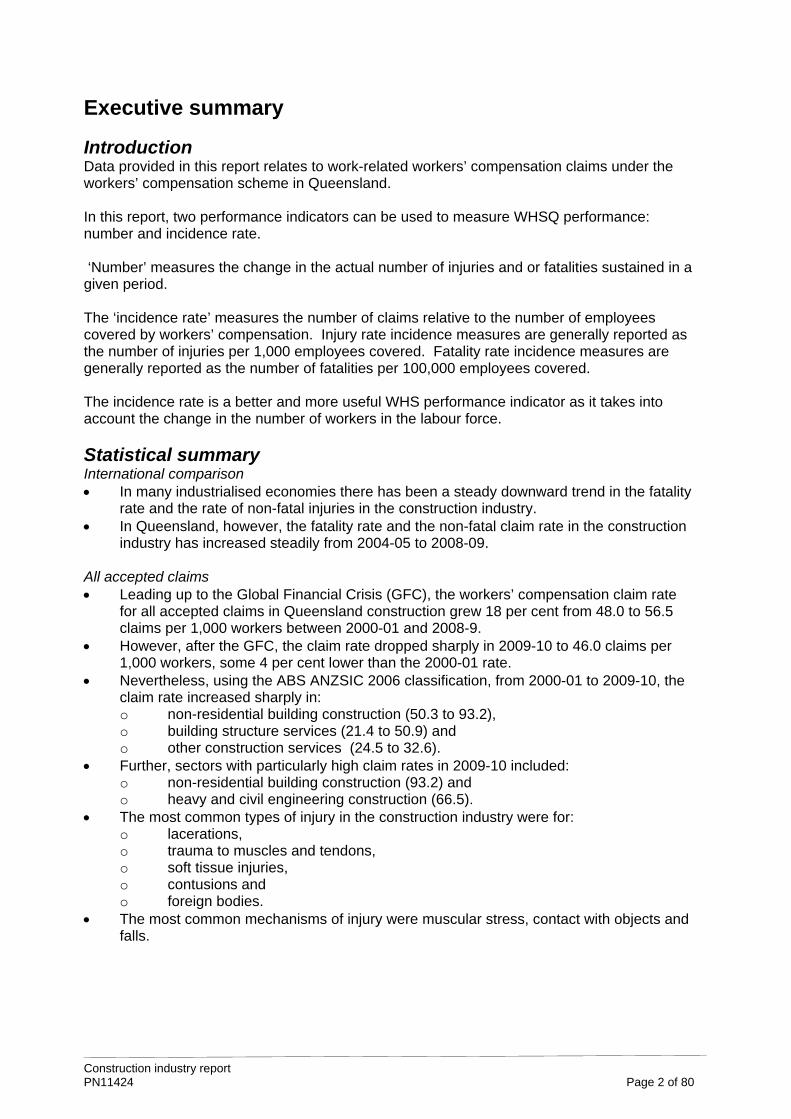
Executive summary
Introduction Data provided in this report relates to work-related workers’ compensation claims under the workers’ compensation scheme in Queensland. In this report, two performance indicators can be used to measure WHSQ performance: number and incidence rate. ‘Number’ measures the change in the actual number of injuries and or fatalities sustained in a given period. The ‘incidence rate’ measures the number of claims relative to the number of employees covered by workers’ compensation. Injury rate incidence measures are generally reported as the number of injuries per 1,000 employees covered. Fatality rate incidence measures are generally reported as the number of fatalities per 100,000 employees covered. The incidence rate is a better and more useful WHS performance indicator as it takes into account the change in the number of workers in the labour force.
Statistical summary International comparison In many industrialised economies there has been a steady downward trend in the fatality
rate and the rate of non-fatal injuries in the construction industry. In Queensland, however, the fatality rate and the non-fatal claim rate in the construction
industry has increased steadily from 2004-05 to 2008-09. All accepted claims Leading up to the Global Financial Crisis (GFC), the workers’ compensation claim rate
for all accepted claims in Queensland construction grew 18 per cent from 48.0 to 56.5 claims per 1,000 workers between 2000-01 and 2008-9.
However, after the GFC, the claim rate dropped sharply in 2009-10 to 46.0 claims per 1,000 workers, some 4 per cent lower than the 2000-01 rate.
Nevertheless, using the ABS ANZSIC 2006 classification, from 2000-01 to 2009-10, the claim rate increased sharply in: o non-residential building construction (50.3 to 93.2), o building structure services (21.4 to 50.9) and o other construction services (24.5 to 32.6).
Further, sectors with particularly high claim rates in 2009-10 included: o non-residential building construction (93.2) and o heavy and civil engineering construction (66.5).
The most common types of injury in the construction industry were for: o lacerations, o trauma to muscles and tendons, o soft tissue injuries, o contusions and o foreign bodies.
The most common mechanisms of injury were muscular stress, contact with objects and falls.
Construction industry report PN11424 Page 2 of 80
Comparing serious claims (seven days or more off work) in Queensland with the rest of Australia The serious claim rate declined slightly at five per cent in Queensland from 2000-01 to
2008-09. In contrast, the claim rate in the rest of Australia declined by 36 per cent over the period.
Using the ABS ANZSIC 1993 classification, the sectors with the highest claim rate in Queensland were: o other construction services (53.0) and o building structure services (38.6) and o site preparation services (38.1).
The data shows that there is a similar pattern of injury in construction in Queensland and the rest of Australia. However, Queensland tends to have a higher proportion of less serious strains and sprains and a slightly lower proportion of more serious musculoskeletal-related disorders. However, this may be due to the short tail nature of the Queensland workers’ compensation scheme.
Harm index The harm index measures the average value of workers’ compensation claims by
industry sectors and for Queensland as a whole. The harm index values range from $6 per worker for libraries to $5,707 per workers for sheet metal product manufacture.
The harm index value for construction sectors are clustered around the state average of $420: o $610 site preparation services, o $537 non-building construction, o $471 building structure services, o $410 other construction services, o $334 building construction, o $290 building completion services and o $255 installation trade services.
Fatalities – sum of years 2005-06 to 2008-09 The average fatality rate for SWA compensated claims in Queensland (5.2 per 100,000)
was higher than the rest of Australia (4.7 per 100,000). Based on the ABS ANZSIC 1993 classification, non-building construction had the
highest fatality claim rate in both Queensland (14.7 per 100,000) and the rest of Australia (13.6 per 100,000).
Fatalities due to a fall from a height is considerably more prevalent in Queensland (1.6 per 100,000) than the rest of Australia (0.8 per 100,000).
Detailed analysis Occupations – 2 digit level Tradespersons recorded the most number of claims (1,896 claims in 2008-09). However - aside from clerks - labourers (34.3) and intermediate and transport workers
(24.9) had the highest claim rate plus the biggest negative claim rate gap between Queensland and the rest of Australia.
Occupations – 3 digit level In 2006-07, the claim rate in some Queensland occupations was much higher than the
claim rate in the rest of Australia: o construction and plumbers assistants (88.0 versus 32.0), o concreters (51.8 versus 39.3), o structural steel construction workers (63.9 versus 44.2) and o bricklayers (69.2 versus 36.4).
Construction industry report PN11424 Page 3 of 80
Sectors with consistent poor performance The ‘building structure services’ sector was the only sector to record an above average:
o growth in number of claims, o claim rate growth and o harm index measure.
Explaining the high claim rate in Queensland Strong growth in employment Queensland construction Queensland construction experienced particularly strong growth in employment 2000-01
to 2008-09, compared to other states in Australia. Strong employment growth was outstripped by growth in claims to 2008-09. This strong demand for labour is reflected, in part, in the strong growth in full-time rather
than part-time employment in Queensland compared to the rest of the country. However, post the GFC, employment and workers’ compensation claims dropped
sharply. It is possible that workers’ compensation claim rate may ease further in the short term if
construction employment in Queensland continues to decline. Age profile From 2000-01 to 2009-10, there was an influx of younger and older workers into the
construction industry. This change in the age profile is not likely to have affected the overall industry claim rate because the higher claim rate of younger workers is likely to have been offset by the lower claim rate for older workers.
However, over the period the claim rate for younger workers to 34 years of age increased quite markedly. This finding highlights the need to target safety programs at younger workers in construction.
Occupational structure The growth in the claim rate in construction in Queensland in recent years may have
been due to an influx of unskilled workers into the industry. Compared to the rest of the country in 2009-10, Queensland had a lower proportion of
the construction workforce engaged as technical and tradespersons and a higher proportion engaged as general labourers.
From 2000-01 to 2008-09, the proportion of workers engaged in technical and trades jobs in Queensland declined by 5 percentage points.
In contrast, labourers’ share of Queensland construction employment increased 4 percentage points.
Duration of employment The building boom in Queensland attracted new labour into the industry. As a result,
there was a decline in the average experience level of workers in the Queensland construction industry.
Over the period 2004 to 2010, the proportion of new entrants (with less than two years work experience) was consistently higher in Queensland construction than the rest of Australia from 2004 to 2010.
Conversely, compared to the rest of Australia, Queensland had a lower proportion of workers with more than five years work experience for the period 2004 to 2010.
Educational qualifications Census 2006 data suggests that a slightly higher proportion of construction workers in
Queensland have no post school qualification compared to the rest of Australia. Similarly, a slightly lower proportion of Queensland construction workers have diploma
or superior qualification compared to the rest of Australia.
Construction industry report PN11424 Page 4 of 80

Construction industry report PN11424 Page 5 of 80
Ensuring a suitably qualified and trained construction workforce is an important element in ensuring safety standards in Queensland construction workplaces.
Injury rates and the economic cycle A number of studies have shown that workers’ compensation claims rates are
associated with economic cycles.1 Claim rates tend to increase during the upswing due to: o the more intensive use of labour; o short cutting of safety procedures and training; o a higher proportion of less experienced new hires; o less worker fear of filing compensation claims; o overuse of machinery, without proper maintenance; and o the use of outdated or unsafe plant.
Conversely, claim rates tend to drop during recessions as:
o the less experienced workers are the first to be laid off; o the least safe plant is taken out of services; o the pace of work is slower; and o there is more time available for rest breaks, training and observance of safety rules.
CISR data From 2004-05 to 2009-10, the overwhelming majority of notices and verbal directions
were issued in: o house construction, o non-residential building construction and o residential building construction n.e.c.
Over the period 2004-05 to 2009-10, there was a decline in improvement notices (seven per cent) and no change in the number of verbal directions. Infringement notices increased two per cent and prohibition notices increased 31 per cent.
Failure to provide effective fall protection measures was the most common reason for inspectors issuing infringement notices, prohibition notices and verbal directions.
The most common categories for improvement notices issued were for workplace (electrical) installations, plant (guarding and maintenance), and construction plans and work method statements.
Notices and verbal directions pertaining to MSDs were rare. In terms of activities from 2005-06 to 2009-10, there was a dramatic growth of advisories
(170%) and a more moderate growth in event/investigations (23%) and assessment (31%).
1 Asfaw A., Pana-Cryan R. and Rosa R. (2011) ‘The Business Cycle and the Incidence of Workplace Injuries: Evidence from the U.S.A.’, Journal of Safety Research, 42: 1-8. Institute for Work and Health (2009) Workers’ Compensation and the Business Cycle – Issue Briefing, Institute for Work and Health, March, Toronto. WorkCover New South Wales (2009) Impact of the Economic Cycle on WorkCover’s Operations, WorkCover New South Wales, Sydney. Davies R. and Jones P. (2005) Trends and Context to Rates of Workplace Injury, prepared by Warwick Institute for Employment Research for the Health and Safety Executive.
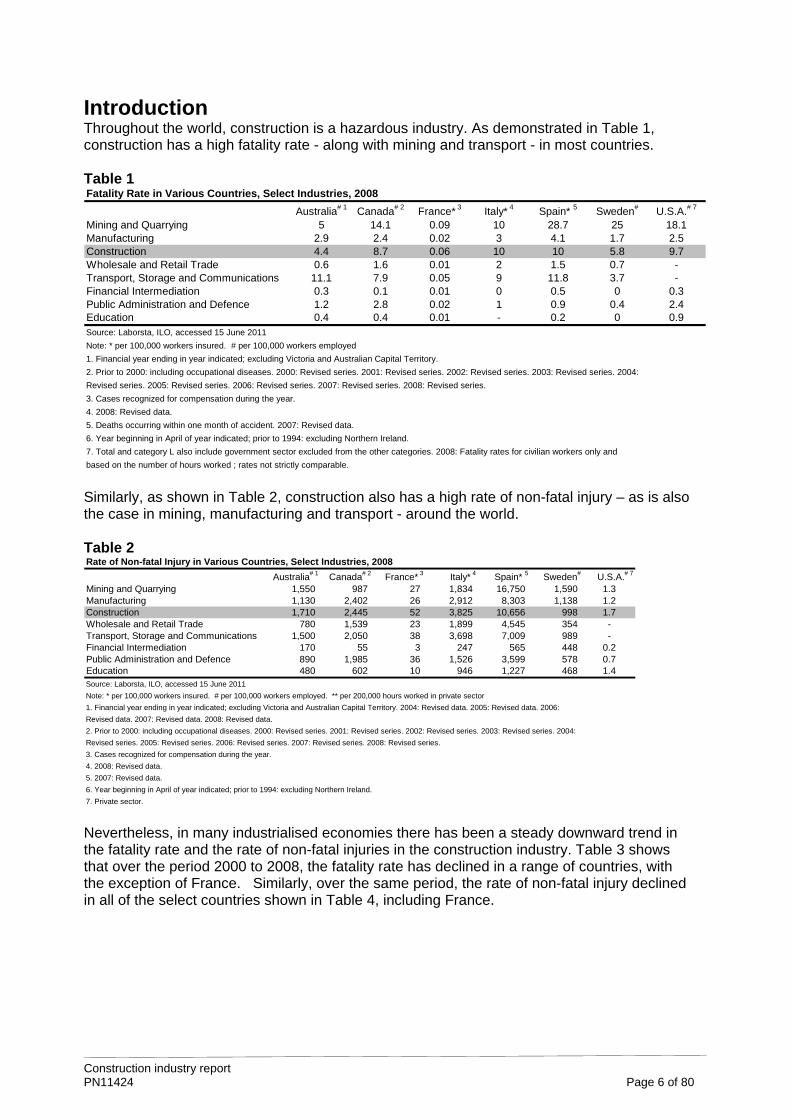
Introduction Throughout the world, construction is a hazardous industry. As demonstrated in Table 1, construction has a high fatality rate - along with mining and transport - in most countries. Table 1 Fatality Rate in Various Countries, Select Industries, 2008
Australia# 1 Canada# 2 France* 3 Italy* 4 Spain* 5 Sweden# U.S.A.# 7
Mining and Quarrying 5 14.1 0.09 10 28.7 25 18.1Manufacturing 2.9 2.4 0.02 3 4.1 1.7 2.5Construction 4.4 8.7 0.06 10 10 5.8 9.7Wholesale and Retail Trade 0.6 1.6 0.01 2 1.5 0.7 -Transport, Storage and Communications 11.1 7.9 0.05 9 11.8 3.7 -Financial Intermediation 0.3 0.1 0.01 0 0.5 0 0.3Public Administration and Defence 1.2 2.8 0.02 1 0.9 0.4 2.4Education 0.4 0.4 0.01 - 0.2 0 0.9Source: Laborsta, ILO, accessed 15 June 2011
Note: * per 100,000 workers insured. # per 100,000 workers employed
1. Financial year ending in year indicated; excluding Victoria and Australian Capital Territory.
2. Prior to 2000: including occupational diseases. 2000: Revised series. 2001: Revised series. 2002: Revised series. 2003: Revised series. 2004:
Revised series. 2005: Revised series. 2006: Revised series. 2007: Revised series. 2008: Revised series.
3. Cases recognized for compensation during the year.
4. 2008: Revised data.
5. Deaths occurring within one month of accident. 2007: Revised data.
6. Year beginning in April of year indicated; prior to 1994: excluding Northern Ireland.
7. Total and category L also include government sector excluded from the other categories. 2008: Fatality rates for civilian workers only and
based on the number of hours worked ; rates not strictly comparable. Similarly, as shown in Table 2, construction also has a high rate of non-fatal injury – as is also the case in mining, manufacturing and transport - around the world. Table 2 Rate of Non-fatal Injury in Various Countries, Select Industries, 2008
Australia# 1 Canada# 2 France* 3 Italy* 4 Spain* 5 Sweden# U.S.A.# 7
Mining and Quarrying 1,550 987 27 1,834 16,750 1,590 1.3Manufacturing 1,130 2,402 26 2,912 8,303 1,138 1.2Construction 1,710 2,445 52 3,825 10,656 998 1.7Wholesale and Retail Trade 780 1,539 23 1,899 4,545 354 -Transport, Storage and Communications 1,500 2,050 38 3,698 7,009 989 -Financial Intermediation 170 55 3 247 565 448 0.2Public Administration and Defence 890 1,985 36 1,526 3,599 578 0.7Education 480 602 10 946 1,227 468 1.4Source: Laborsta, ILO, accessed 15 June 2011
Note: * per 100,000 workers insured. # per 100,000 workers employed. ** per 200,000 hours worked in private sector
1. Financial year ending in year indicated; excluding Victoria and Australian Capital Territory. 2004: Revised data. 2005: Revised data. 2006:
Revised data. 2007: Revised data. 2008: Revised data.
2. Prior to 2000: including occupational diseases. 2000: Revised series. 2001: Revised series. 2002: Revised series. 2003: Revised series. 2004:
Revised series. 2005: Revised series. 2006: Revised series. 2007: Revised series. 2008: Revised series.
3. Cases recognized for compensation during the year.
4. 2008: Revised data.
5. 2007: Revised data.
6. Year beginning in April of year indicated; prior to 1994: excluding Northern Ireland.
7. Private sector. Nevertheless, in many industrialised economies there has been a steady downward trend in the fatality rate and the rate of non-fatal injuries in the construction industry. Table 3 shows that over the period 2000 to 2008, the fatality rate has declined in a range of countries, with the exception of France. Similarly, over the same period, the rate of non-fatal injury declined in all of the select countries shown in Table 4, including France.
Construction industry report PN11424 Page 6 of 80
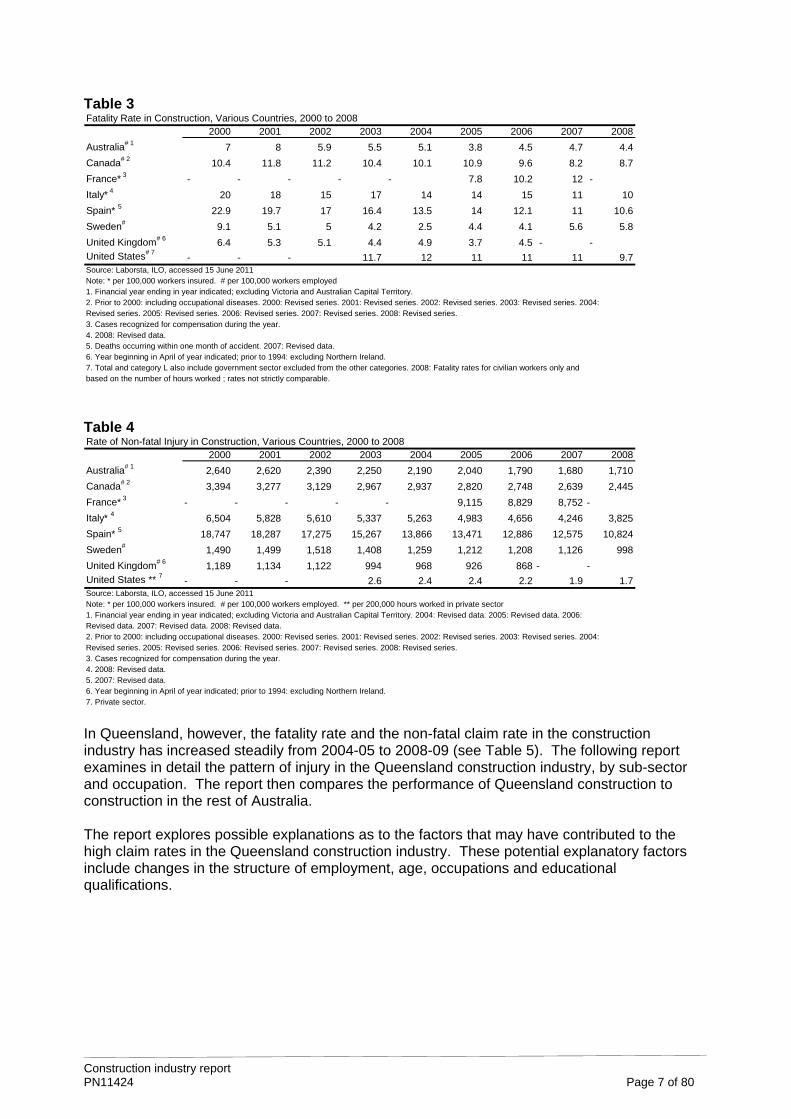
Table 3 Fatality Rate in Construction, Various Countries, 2000 to 2008
2000 2001 2002 2003 2004 2005 2006 2007 2008
Australia# 1 7 8 5.9 5.5 5.1 3.8 4.5 4.7 4.4
Canada# 2 10.4 11.8 11.2 10.4 10.1 10.9 9.6 8.2 8.7
France* 3 - - - - - 7.8 10.2 12 -
Italy* 4 20 18 15 17 14 14 15 11 10
Spain* 5 22.9 19.7 17 16.4 13.5 14 12.1 11 10.6
Sweden# 9.1 5.1 5 4.2 2.5 4.4 4.1 5.6 5.8
United Kingdom# 6 6.4 5.3 5.1 4.4 4.9 3.7 4.5 - - United States# 7
- - - 11.7 12 11 11 11 9.7Source: Laborsta, ILO, accessed 15 June 2011Note: * per 100,000 workers insured. # per 100,000 workers employed1. Financial year ending in year indicated; excluding Victoria and Australian Capital Territory. 2. Prior to 2000: including occupational diseases. 2000: Revised series. 2001: Revised series. 2002: Revised series. 2003: Revised series. 2004: Revised series. 2005: Revised series. 2006: Revised series. 2007: Revised series. 2008: Revised series. 3. Cases recognized for compensation during the year. 4. 2008: Revised data. 5. Deaths occurring within one month of accident. 2007: Revised data. 6. Year beginning in April of year indicated; prior to 1994: excluding Northern Ireland. 7. Total and category L also include government sector excluded from the other categories. 2008: Fatality rates for civilian workers only and based on the number of hours worked ; rates not strictly comparable. Table 4 Rate of Non-fatal Injury in Construction, Various Countries, 2000 to 2008
2000 2001 2002 2003 2004 2005 2006 2007 2008
Australia# 1 2,640 2,620 2,390 2,250 2,190 2,040 1,790 1,680 1,710
Canada# 2 3,394 3,277 3,129 2,967 2,937 2,820 2,748 2,639 2,445
France* 3 - - - - - 9,115 8,829 8,752 -
Italy* 4 6,504 5,828 5,610 5,337 5,263 4,983 4,656 4,246 3,825
Spain* 5 18,747 18,287 17,275 15,267 13,866 13,471 12,886 12,575 10,824
Sweden# 1,490 1,499 1,518 1,408 1,259 1,212 1,208 1,126 998
United Kingdom# 6 1,189 1,134 1,122 994 968 926 868 - -United States ** 7 - - - 2.6 2.4 2.4 2.2 1.9 1.7Source: Laborsta, ILO, accessed 15 June 2011Note: * per 100,000 workers insured. # per 100,000 workers employed. ** per 200,000 hours worked in private sector1. Financial year ending in year indicated; excluding Victoria and Australian Capital Territory. 2004: Revised data. 2005: Revised data. 2006: Revised data. 2007: Revised data. 2008: Revised data. 2. Prior to 2000: including occupational diseases. 2000: Revised series. 2001: Revised series. 2002: Revised series. 2003: Revised series. 2004: Revised series. 2005: Revised series. 2006: Revised series. 2007: Revised series. 2008: Revised series. 3. Cases recognized for compensation during the year. 4. 2008: Revised data. 5. 2007: Revised data. 6. Year beginning in April of year indicated; prior to 1994: excluding Northern Ireland. 7. Private sector. In Queensland, however, the fatality rate and the non-fatal claim rate in the construction industry has increased steadily from 2004-05 to 2008-09 (see Table 5). The following report examines in detail the pattern of injury in the Queensland construction industry, by sub-sector and occupation. The report then compares the performance of Queensland construction to construction in the rest of Australia. The report explores possible explanations as to the factors that may have contributed to the high claim rates in the Queensland construction industry. These potential explanatory factors include changes in the structure of employment, age, occupations and educational qualifications.
Construction industry report PN11424 Page 7 of 80
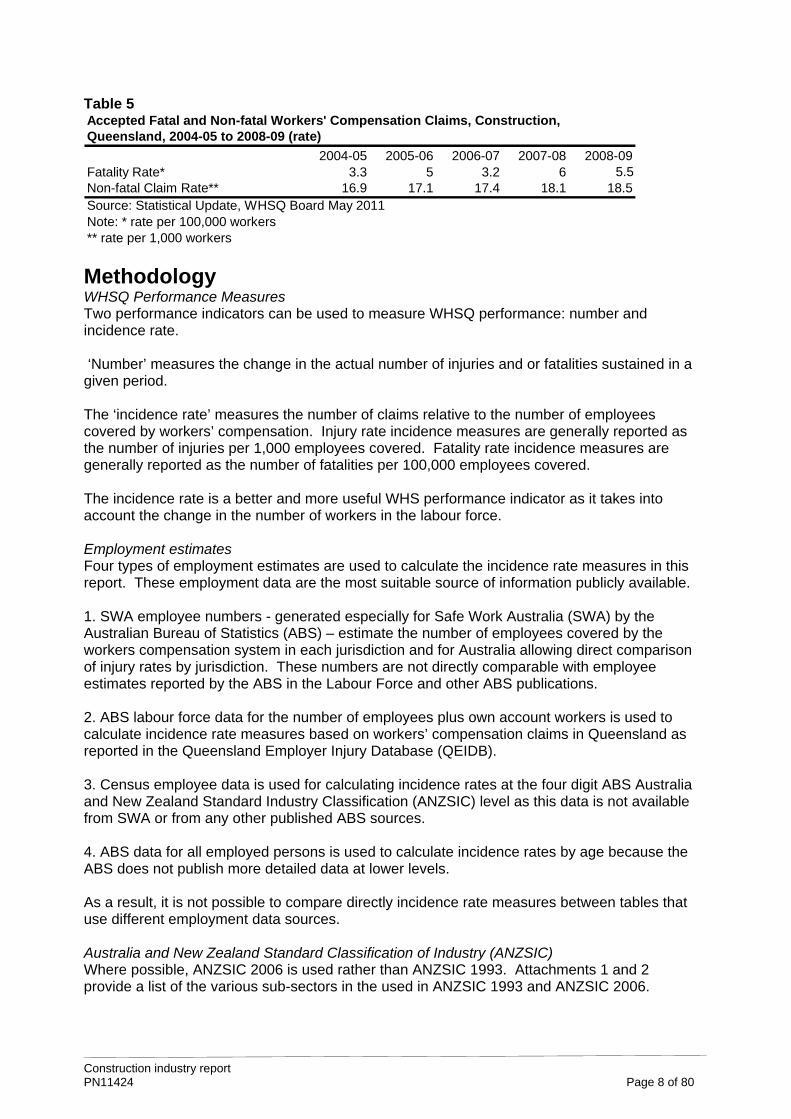
Table 5 Accepted Fatal and Non-fatal Workers' Compensation Claims, Construction, Queensland, 2004-05 to 2008-09 (rate)
2004-05 2005-06 2006-07 2007-08 2008-09Fatality Rate* 3.3 5 3.2 6 5.5Non-fatal Claim Rate** 16.9 17.1 17.4 18.1 18.5Source: Statistical Update, WHSQ Board May 2011Note: * rate per 100,000 workers** rate per 1,000 workers
Methodology WHSQ Performance Measures Two performance indicators can be used to measure WHSQ performance: number and incidence rate. ‘Number’ measures the change in the actual number of injuries and or fatalities sustained in a given period. The ‘incidence rate’ measures the number of claims relative to the number of employees covered by workers’ compensation. Injury rate incidence measures are generally reported as the number of injuries per 1,000 employees covered. Fatality rate incidence measures are generally reported as the number of fatalities per 100,000 employees covered. The incidence rate is a better and more useful WHS performance indicator as it takes into account the change in the number of workers in the labour force. Employment estimates Four types of employment estimates are used to calculate the incidence rate measures in this report. These employment data are the most suitable source of information publicly available. 1. SWA employee numbers - generated especially for Safe Work Australia (SWA) by the Australian Bureau of Statistics (ABS) – estimate the number of employees covered by the workers compensation system in each jurisdiction and for Australia allowing direct comparison of injury rates by jurisdiction. These numbers are not directly comparable with employee estimates reported by the ABS in the Labour Force and other ABS publications. 2. ABS labour force data for the number of employees plus own account workers is used to calculate incidence rate measures based on workers’ compensation claims in Queensland as reported in the Queensland Employer Injury Database (QEIDB). 3. Census employee data is used for calculating incidence rates at the four digit ABS Australia and New Zealand Standard Industry Classification (ANZSIC) level as this data is not available from SWA or from any other published ABS sources. 4. ABS data for all employed persons is used to calculate incidence rates by age because the ABS does not publish more detailed data at lower levels. As a result, it is not possible to compare directly incidence rate measures between tables that use different employment data sources. Australia and New Zealand Standard Classification of Industry (ANZSIC) Where possible, ANZSIC 2006 is used rather than ANZSIC 1993. Attachments 1 and 2 provide a list of the various sub-sectors in the used in ANZSIC 1993 and ANZSIC 2006.
Construction industry report PN11424 Page 8 of 80

Construction industry report PN11424 Page 9 of 80
Construction claims 2000-01 to 2008-09 Workers compensation claims – QEIDB data Table 6 contains data on the number of all accepted non-fatal claims in construction sectors in Queensland 2000-01 to 2009-10. As can be seen, claims increased strongly from 2000-01 to 2008-09 (116 per cent). In 2009-10, however, claims dropped markedly. As a result, over the period 2000-01 to 2009-10, claim increased at 69 per cent rather than 116 per cent. At the three digit ANZSIC 2006 level, the growth rate was especially high in: non-residential building construction (185%), land development and site preparation services (108%), building structure services (204%) and other construction services (208%). At the four digit ANZSIC 2006 level, the following sub-sectors exhibited a growth in claims double the industry average: non-residential building construction (185%), concreting services (193%), bricklaying services (151%), roofing services (183%), structural steel erections services (419%), plumbing services (129%), fire and security system services (143%), construction services n.e.c. (356%). Note that all sub-sectors in ‘building structure service’ sector experienced double the growth in claims of the industry as a whole.
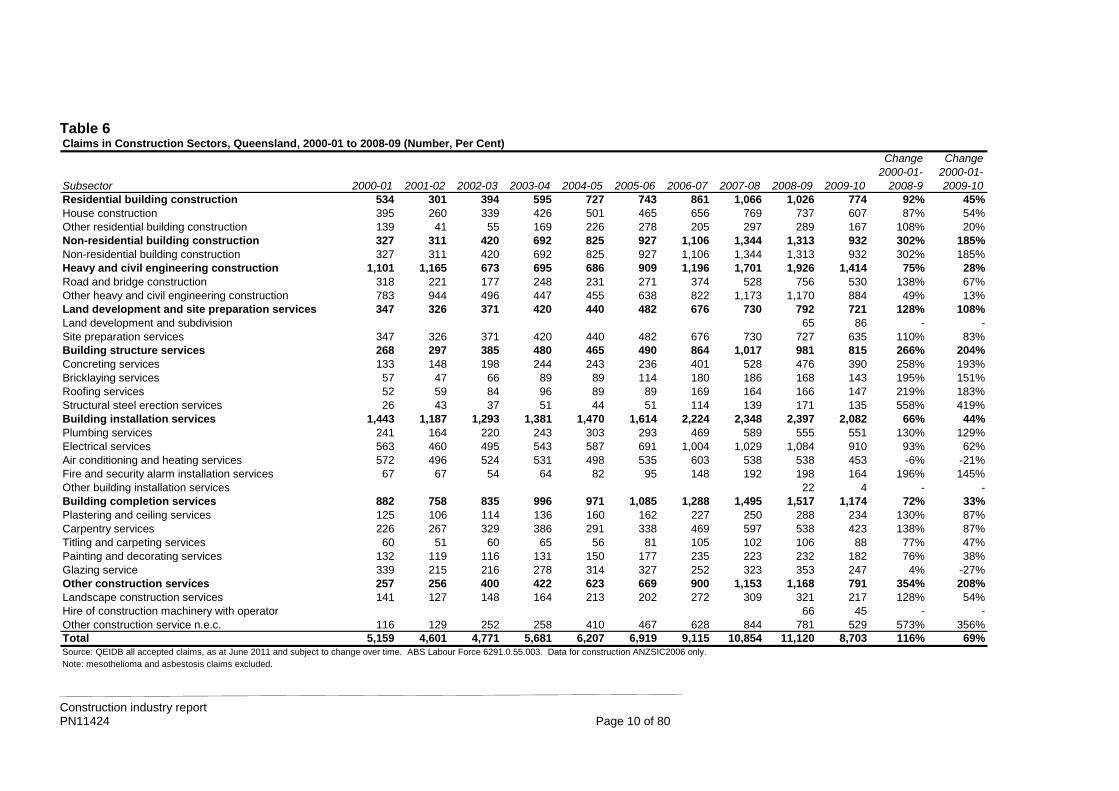
Table 6 Claims in Construction Sectors, Queensland, 2000-01 to 2008-09 (Number, Per Cent)
Change Change 2000-01- 2000-01-
Subsector 2000-01 2001-02 2002-03 2003-04 2004-05 2005-06 2006-07 2007-08 2008-09 2009-10 2008-9 2009-10Residential building construction 534 301 394 595 727 743 861 1,066 1,026 774 92% 45%House construction 395 260 339 426 501 465 656 769 737 607 87% 54%Other residential building construction 139 41 55 169 226 278 205 297 289 167 108% 20%Non-residential building construction 327 311 420 692 825 927 1,106 1,344 1,313 932 302% 185%Non-residential building construction 327 311 420 692 825 927 1,106 1,344 1,313 932 302% 185%Heavy and civil engineering construction 1,101 1,165 673 695 686 909 1,196 1,701 1,926 1,414 75% 28%Road and bridge construction 318 221 177 248 231 271 374 528 756 530 138% 67%Other heavy and civil engineering construction 783 944 496 447 455 638 822 1,173 1,170 884 49% 13%Land development and site preparation services 347 326 371 420 440 482 676 730 792 721 128% 108%Land development and subdivision 65 86 - -Site preparation services 347 326 371 420 440 482 676 730 727 635 110% 83%Building structure services 268 297 385 480 465 490 864 1,017 981 815 266% 204%Concreting services 133 148 198 244 243 236 401 528 476 390 258% 193%Bricklaying services 57 47 66 89 89 114 180 186 168 143 195% 151%Roofing services 52 59 84 96 89 89 169 164 166 147 219% 183%Structural steel erection services 26 43 37 51 44 51 114 139 171 135 558% 419%Building installation services 1,443 1,187 1,293 1,381 1,470 1,614 2,224 2,348 2,397 2,082 66% 44%Plumbing services 241 164 220 243 303 293 469 589 555 551 130% 129%Electrical services 563 460 495 543 587 691 1,004 1,029 1,084 910 93% 62%Air conditioning and heating services 572 496 524 531 498 535 603 538 538 453 -6% -21%Fire and security alarm installation services 67 67 54 64 82 95 148 192 198 164 196% 145%Other building installation services 22 4 - -Building completion services 882 758 835 996 971 1,085 1,288 1,495 1,517 1,174 72% 33%Plastering and ceiling services 125 106 114 136 160 162 227 250 288 234 130% 87%Carpentry services 226 267 329 386 291 338 469 597 538 423 138% 87%Titling and carpeting services 60 51 60 65 56 81 105 102 106 88 77% 47%Painting and decorating services 132 119 116 131 150 177 235 223 232 182 76% 38%Glazing service 339 215 216 278 314 327 252 323 353 247 4% -27%Other construction services 257 256 400 422 623 669 900 1,153 1,168 791 354% 208%Landscape construction services 141 127 148 164 213 202 272 309 321 217 128% 54%Hire of construction machinery with operator 66 45 - -Other construction service n.e.c. 116 129 252 258 410 467 628 844 781 529 573% 356%Total 5,159 4,601 4,771 5,681 6,207 6,919 9,115 10,854 11,120 8,703 116% 69%Source: QEIDB all accepted claims, as at June 2011 and subject to change over time. ABS Labour Force 6291.0.55.003. Data for construction ANZSIC2006 only.Note: mesothelioma and asbestosis claims excluded.
Construction industry report PN11424 Page 10 of 80
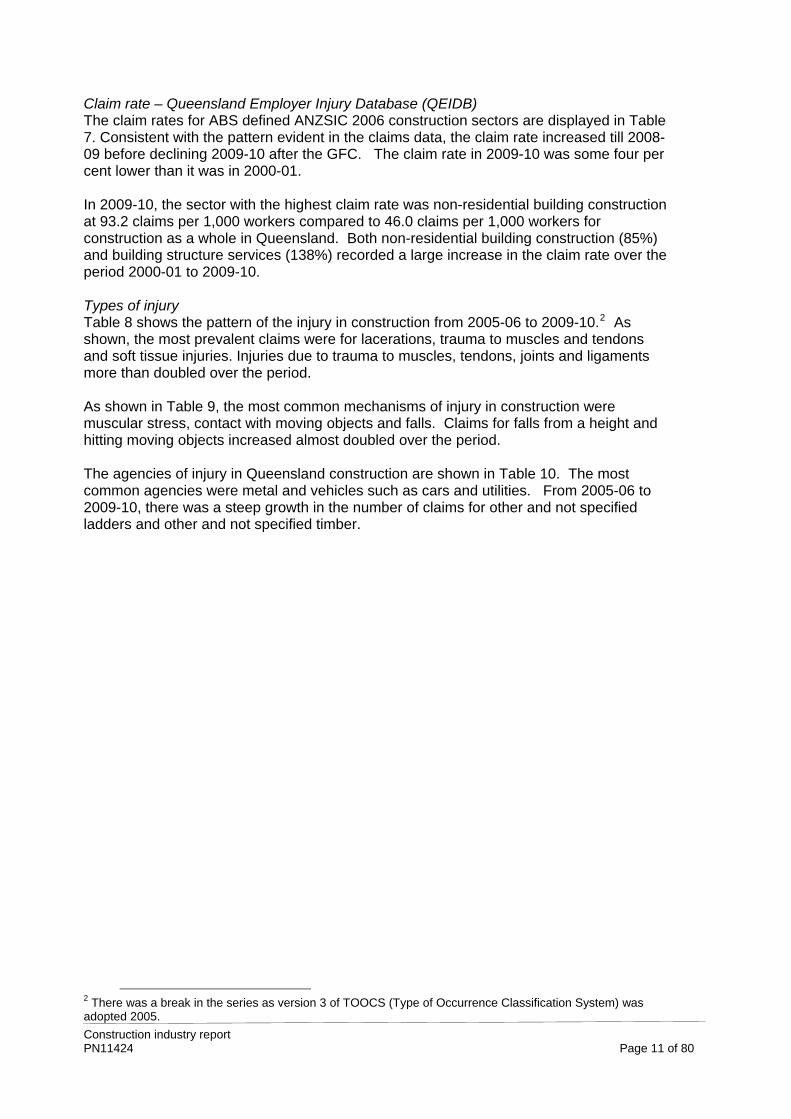
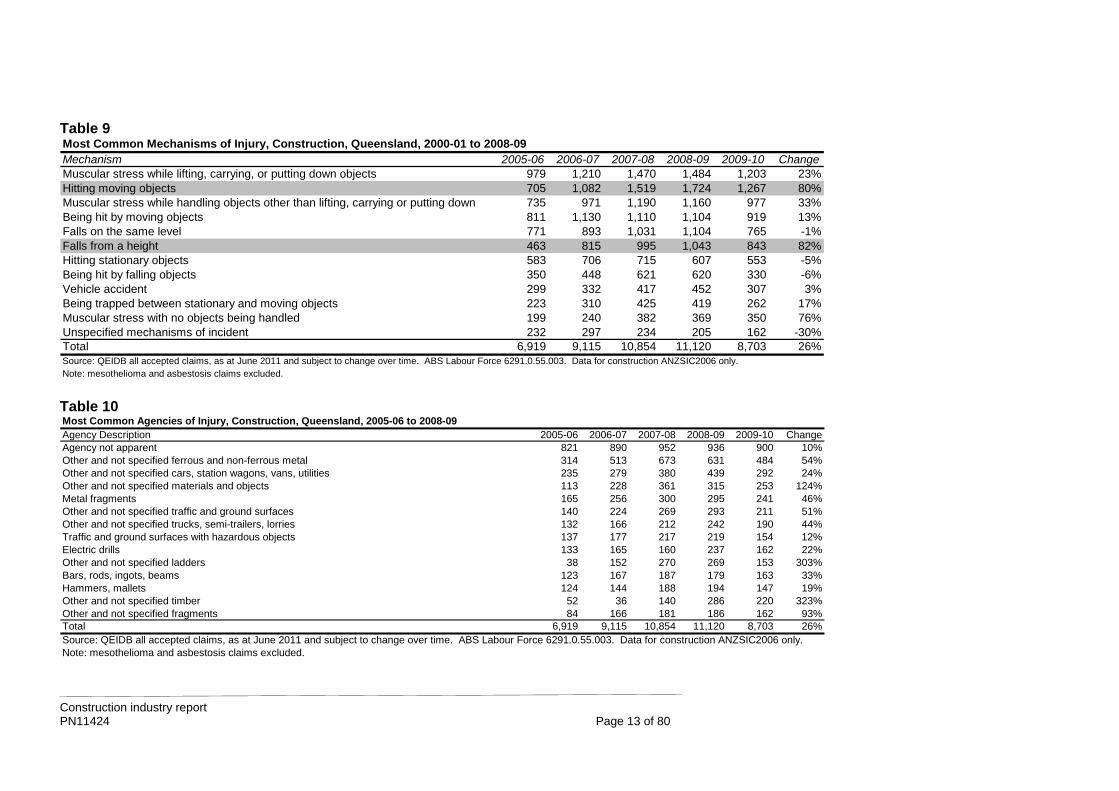
Claim rate – Queensland Employer Injury Database (QEIDB) The claim rates for ABS defined ANZSIC 2006 construction sectors are displayed in Table 7. Consistent with the pattern evident in the claims data, the claim rate increased till 2008-09 before declining 2009-10 after the GFC. The claim rate in 2009-10 was some four per cent lower than it was in 2000-01. In 2009-10, the sector with the highest claim rate was non-residential building construction at 93.2 claims per 1,000 workers compared to 46.0 claims per 1,000 workers for construction as a whole in Queensland. Both non-residential building construction (85%) and building structure services (138%) recorded a large increase in the claim rate over the period 2000-01 to 2009-10. Types of injury Table 8 shows the pattern of the injury in construction from 2005-06 to 2009-10.2 As shown, the most prevalent claims were for lacerations, trauma to muscles and tendons and soft tissue injuries. Injuries due to trauma to muscles, tendons, joints and ligaments more than doubled over the period. As shown in Table 9, the most common mechanisms of injury in construction were muscular stress, contact with moving objects and falls. Claims for falls from a height and hitting moving objects increased almost doubled over the period. The agencies of injury in Queensland construction are shown in Table 10. The most common agencies were metal and vehicles such as cars and utilities. From 2005-06 to 2009-10, there was a steep growth in the number of claims for other and not specified ladders and other and not specified timber.
2 There was a break in the series as version 3 of TOOCS (Type of Occurrence Classification System) was adopted 2005.
Construction industry report PN11424 Page 11 of 80
Table 7 Claim Rate Construction Sectors, Queensland, 2000-01 to 2008-09 (Rate Per 1,000, Per Cent)
Change Change 2000-01 to 2000-01 to
Sector 2000-01 2001-02 2002-03 2003-04 2004-05 2005-06 2006-07 2007-08 2008-09 2009-10 2008-9 2009-10Residential building construction 47.5 24.6 30.9 48.6 59.3 45.7 40.5 46.9 60.4 37.3 27% -21%Non-residential building construction 50.3 44.4 56.0 98.9 117.9 97.6 116.4 131.1 154.5 93.2 207% 85%Heavy and civil engineering construction 67.8 77.7 57.3 54.5 49.0 82.6 57.0 88.4 95.1 66.5 40% -2%Land development and site preparation services 55.5 56.7 47.9 48.0 45.1 56.7 58.8 52.1 68.9 48.1 24% -13%Building structure services 21.4 25.8 30.2 31.0 24.2 26.1 41.1 48.4 43.6 50.9 103% 138%Building installation services 72.2 51.6 50.7 46.8 46.7 41.9 51.4 52.5 48.9 48.1 -32% -33%Building completion services 36.4 32.3 33.4 31.6 22.7 28.2 32.4 35.4 33.7 30.3 -7% -17%Other construction services 24.5 29.3 30.2 25.6 40.9 37.2 48.6 67.8 50.8 32.6 107% 33%Total 48.0 43.1 41.0 42.5 40.9 43.5 49.1 56.8 56.5 46.0 18% -4%Source: QEIDB all accepted claims, as at June 2011 and subject to change over time. ABS Labour Force 6291.0.55.003. Data for construction ANZSIC2006 only.Note: mesothelioma and asbestosis claims excluded. Employment data excludes non-defined industry sectors 300, 320 and E00. Table 8 Most Comon Types of Injuries, Construction, Queensland, 2005-06 to 2008-09 (Number, Per Cent)Injury Description 2005-06 2006-07 2007-08 2008-09 2009-10 ChangeLaceration or open wound not involving traumatic amputation 1,452 2,036 2,403 2,525 1,986 37%Trauma to muscles and tendons, unspecified 669 1,361 1,361 1,314 1,031 54%Soft tissue injuries due to trauma or unknown mechanisms with insufficient information to code elsewhere 534 834 1,169 1,215 631 18%Contusion, bruising and superficial crushing 502 522 635 688 565 13%Foreign body on external eye, in ear or nose or in respiratory, digestive or reproductive tract 406 582 669 666 507 25%Other fractures, not elsewhere classified 473 593 653 616 473 0%Trauma to joints and ligaments, unspecified 246 442 723 813 646 163%Trauma to joints and ligaments, not elsewhere classified 231 473 658 616 586 154%Trauma to muscles 386 323 419 419 346 -10%Hernias 128 162 173 164 159 24%Trauma to muscles and tendons, not elsewhere classified 141 130 144 144 179 27%Total 6,919 9,115 10,854 11,120 8,703 26%Source: QEIDB all accepted claims, as at June 2011 and subject to change over time. ABS Labour Force 6291.0.55.003. Data for construction ANZSIC2006 only.Note: mesothelioma and asbestosis claims excluded.
Construction industry report PN11424 Page 12 of 80
Construction industry report PN11424 Page 13 of 80
Table 9 Most Common Mechanisms of Injury, Construction, Queensland, 2000-01 to 2008-09Mechanism 2005-06 2006-07 2007-08 2008-09 2009-10 ChangeMuscular stress while lifting, carrying, or putting down objects 979 1,210 1,470 1,484 1,203 23%Hitting moving objects 705 1,082 1,519 1,724 1,267 80%Muscular stress while handling objects other than lifting, carrying or putting down 735 971 1,190 1,160 977 33%Being hit by moving objects 811 1,130 1,110 1,104 919 13%Falls on the same level 771 893 1,031 1,104 765 -1%Falls from a height 463 815 995 1,043 843 82%Hitting stationary objects 583 706 715 607 553 -5%Being hit by falling objects 350 448 621 620 330 -6%Vehicle accident 299 332 417 452 307 3%Being trapped between stationary and moving objects 223 310 425 419 262 17%Muscular stress with no objects being handled 199 240 382 369 350 76%Unspecified mechanisms of incident 232 297 234 205 162 -30%Total 6,919 9,115 10,854 11,120 8,703 26%Source: QEIDB all accepted claims, as at June 2011 and subject to change over time. ABS Labour Force 6291.0.55.003. Data for construction ANZSIC2006 only.Note: mesothelioma and asbestosis claims excluded. Table 10 Most Common Agencies of Injury, Construction, Queensland, 2005-06 to 2008-09Agency Description 2005-06 2006-07 2007-08 2008-09 2009-10 ChangeAgency not apparent 821 890 952 936 900 10%Other and not specified ferrous and non-ferrous metal 314 513 673 631 484 54%Other and not specified cars, station wagons, vans, utilities 235 279 380 439 292 24%Other and not specified materials and objects 113 228 361 315 253 124%Metal fragments 165 256 300 295 241 46%Other and not specified traffic and ground surfaces 140 224 269 293 211 51%Other and not specified trucks, semi-trailers, lorries 132 166 212 242 190 44%Traffic and ground surfaces with hazardous objects 137 177 217 219 154 12%Electric drills 133 165 160 237 162 22%Other and not specified ladders 38 152 270 269 153 303%Bars, rods, ingots, beams 123 167 187 179 163 33%Hammers, mallets 124 144 188 194 147 19%Other and not specified timber 52 36 140 286 220 323%Other and not specified fragments 84 166 181 186 162 93%Total 6,919 9,115 10,854 11,120 8,703 26%Source: QEIDB all accepted claims, as at June 2011 and subject to change over time. ABS Labour Force 6291.0.55.003. Data for construction ANZSIC2006 only.Note: mesothelioma and asbestosis claims excluded.
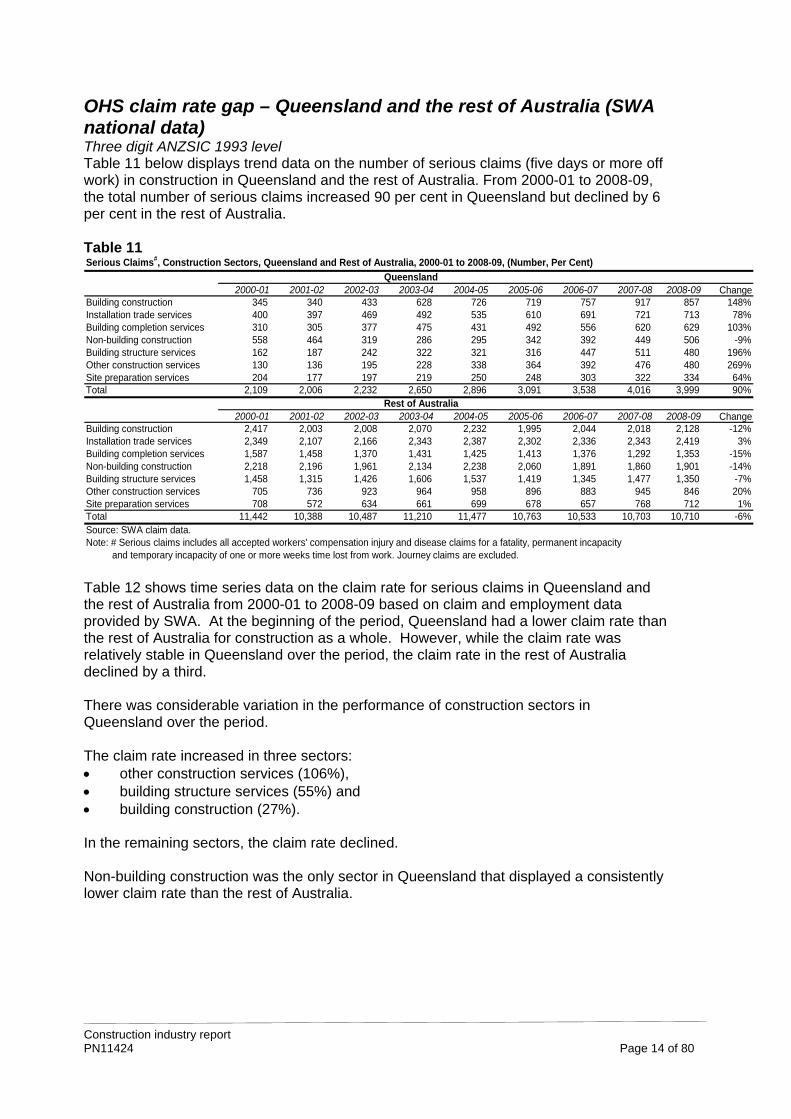
OHS claim rate gap – Queensland and the rest of Australia (SWA national data) Three digit ANZSIC 1993 level Table 11 below displays trend data on the number of serious claims (five days or more off work) in construction in Queensland and the rest of Australia. From 2000-01 to 2008-09, the total number of serious claims increased 90 per cent in Queensland but declined by 6 per cent in the rest of Australia. Table 11 Serious Claims#, Construction Sectors, Queensland and Rest of Australia, 2000-01 to 2008-09, (Number, Per Cent)
Queensland 2000-01 2001-02 2002-03 2003-04 2004-05 2005-06 2006-07 2007-08 2008-09 Change
Building construction 345 340 433 628 726 719 757 917 857 148%Installation trade services 400 397 469 492 535 610 691 721 713 78%Building completion services 310 305 377 475 431 492 556 620 629 103%Non-building construction 558 464 319 286 295 342 392 449 506 -9%Building structure services 162 187 242 322 321 316 447 511 480 196%Other construction services 130 136 195 228 338 364 392 476 480 269%Site preparation services 204 177 197 219 250 248 303 322 334 64%Total 2,109 2,006 2,232 2,650 2,896 3,091 3,538 4,016 3,999 90%
Rest of Australia 2000-01 2001-02 2002-03 2003-04 2004-05 2005-06 2006-07 2007-08 2008-09 Change
Building construction 2,417 2,003 2,008 2,070 2,232 1,995 2,044 2,018 2,128 -12%Installation trade services 2,349 2,107 2,166 2,343 2,387 2,302 2,336 2,343 2,419 3%Building completion services 1,587 1,458 1,370 1,431 1,425 1,413 1,376 1,292 1,353 -15%Non-building construction 2,218 2,196 1,961 2,134 2,238 2,060 1,891 1,860 1,901 -14%Building structure services 1,458 1,315 1,426 1,606 1,537 1,419 1,345 1,477 1,350 -7%Other construction services 705 736 923 964 958 896 883 945 846 20%Site preparation services 708 572 634 661 699 678 657 768 712 1%Total 11,442 10,388 10,487 11,210 11,477 10,763 10,533 10,703 10,710 -6%Source: SWA claim data.Note: # Serious claims includes all accepted workers' compensation injury and disease claims for a fatality, permanent incapacity and temporary incapacity of one or more weeks time lost from work. Journey claims are excluded. Table 12 shows time series data on the claim rate for serious claims in Queensland and the rest of Australia from 2000-01 to 2008-09 based on claim and employment data provided by SWA. At the beginning of the period, Queensland had a lower claim rate than the rest of Australia for construction as a whole. However, while the claim rate was relatively stable in Queensland over the period, the claim rate in the rest of Australia declined by a third. There was considerable variation in the performance of construction sectors in Queensland over the period. The claim rate increased in three sectors: other construction services (106%), building structure services (55%) and building construction (27%). In the remaining sectors, the claim rate declined. Non-building construction was the only sector in Queensland that displayed a consistently lower claim rate than the rest of Australia.
Construction industry report PN11424 Page 14 of 80
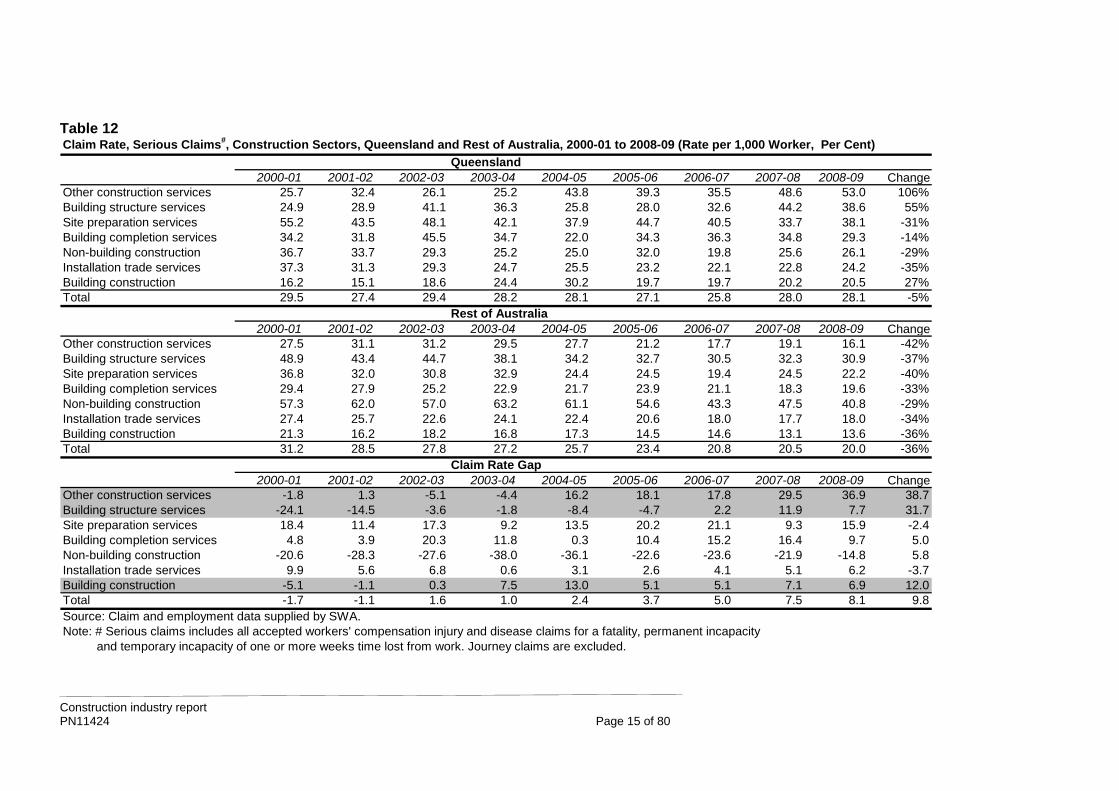
Table 12 Claim Rate, Serious Claims#, Construction Sectors, Queensland and Rest of Australia, 2000-01 to 2008-09 (Rate per 1,000 Worker, Per Cent)
Queensland 2000-01 2001-02 2002-03 2003-04 2004-05 2005-06 2006-07 2007-08 2008-09 Change
Other construction services 25.7 32.4 26.1 25.2 43.8 39.3 35.5 48.6 53.0 106%Building structure services 24.9 28.9 41.1 36.3 25.8 28.0 32.6 44.2 38.6 55%Site preparation services 55.2 43.5 48.1 42.1 37.9 44.7 40.5 33.7 38.1 -31%Building completion services 34.2 31.8 45.5 34.7 22.0 34.3 36.3 34.8 29.3 -14%Non-building construction 36.7 33.7 29.3 25.2 25.0 32.0 19.8 25.6 26.1 -29%Installation trade services 37.3 31.3 29.3 24.7 25.5 23.2 22.1 22.8 24.2 -35%Building construction 16.2 15.1 18.6 24.4 30.2 19.7 19.7 20.2 20.5 27%Total 29.5 27.4 29.4 28.2 28.1 27.1 25.8 28.0 28.1 -5%
Rest of Australia 2000-01 2001-02 2002-03 2003-04 2004-05 2005-06 2006-07 2007-08 2008-09 Change
Other construction services 27.5 31.1 31.2 29.5 27.7 21.2 17.7 19.1 16.1 -42%Building structure services 48.9 43.4 44.7 38.1 34.2 32.7 30.5 32.3 30.9 -37%Site preparation services 36.8 32.0 30.8 32.9 24.4 24.5 19.4 24.5 22.2 -40%Building completion services 29.4 27.9 25.2 22.9 21.7 23.9 21.1 18.3 19.6 -33%Non-building construction 57.3 62.0 57.0 63.2 61.1 54.6 43.3 47.5 40.8 -29%Installation trade services 27.4 25.7 22.6 24.1 22.4 20.6 18.0 17.7 18.0 -34%Building construction 21.3 16.2 18.2 16.8 17.3 14.5 14.6 13.1 13.6 -36%Total 31.2 28.5 27.8 27.2 25.7 23.4 20.8 20.5 20.0 -36%
Claim Rate Gap2000-01 2001-02 2002-03 2003-04 2004-05 2005-06 2006-07 2007-08 2008-09 Change
Other construction services -1.8 1.3 -5.1 -4.4 16.2 18.1 17.8 29.5 36.9 38.7Building structure services -24.1 -14.5 -3.6 -1.8 -8.4 -4.7 2.2 11.9 7.7 31.7Site preparation services 18.4 11.4 17.3 9.2 13.5 20.2 21.1 9.3 15.9 -2.4Building completion services 4.8 3.9 20.3 11.8 0.3 10.4 15.2 16.4 9.7 5.0Non-building construction -20.6 -28.3 -27.6 -38.0 -36.1 -22.6 -23.6 -21.9 -14.8 5.8Installation trade services 9.9 5.6 6.8 0.6 3.1 2.6 4.1 5.1 6.2 -3.7Building construction -5.1 -1.1 0.3 7.5 13.0 5.1 5.1 7.1 6.9 12.0Total -1.7 -1.1 1.6 1.0 2.4 3.7 5.0 7.5 8.1 9.8Source: Claim and employment data supplied by SWA. Note: # Serious claims includes all accepted workers' compensation injury and disease claims for a fatality, permanent incapacity and temporary incapacity of one or more weeks time lost from work. Journey claims are excluded.
Construction industry report PN11424 Page 15 of 80
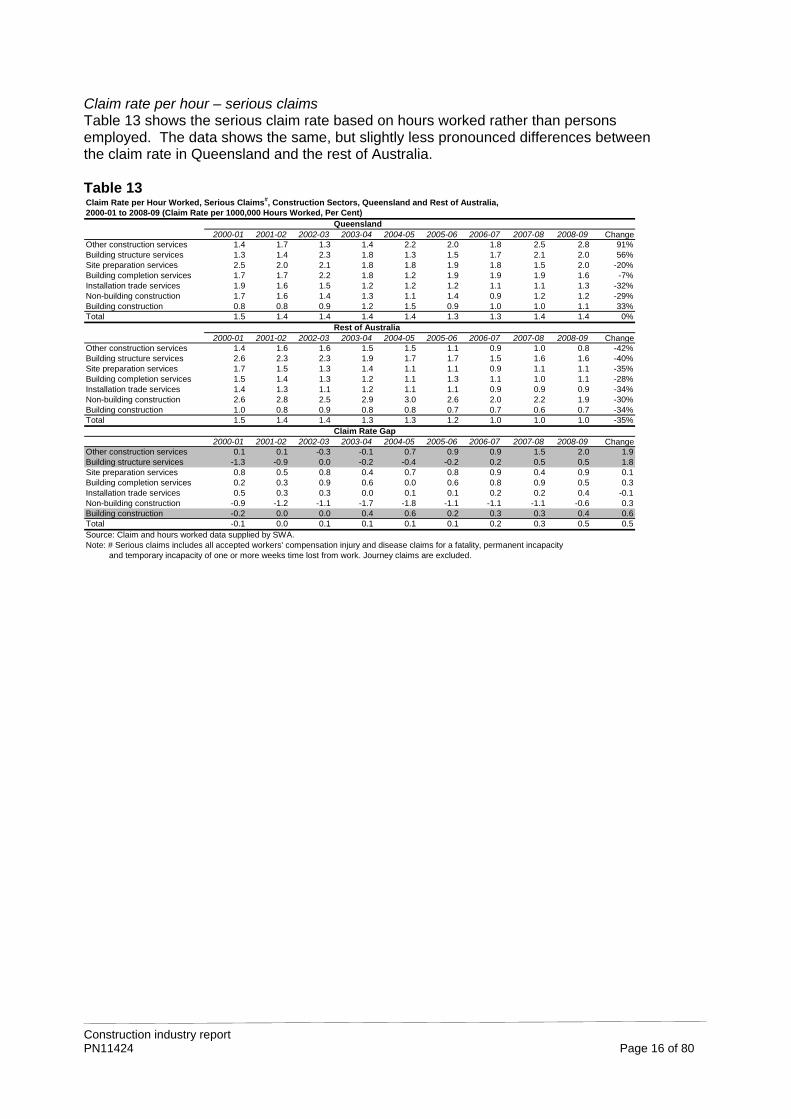
Claim rate per hour – serious claims Table 13 shows the serious claim rate based on hours worked rather than persons employed. The data shows the same, but slightly less pronounced differences between the claim rate in Queensland and the rest of Australia. Table 13 Claim Rate per Hour Worked, Serious Claims#, Construction Sectors, Queensland and Rest of Australia, 2000-01 to 2008-09 (Claim Rate per 1000,000 Hours Worked, Per Cent)
Queensland 2000-01 2001-02 2002-03 2003-04 2004-05 2005-06 2006-07 2007-08 2008-09 Change
Other construction services 1.4 1.7 1.3 1.4 2.2 2.0 1.8 2.5 2.8 91%Building structure services 1.3 1.4 2.3 1.8 1.3 1.5 1.7 2.1 2.0 56%Site preparation services 2.5 2.0 2.1 1.8 1.8 1.9 1.8 1.5 2.0 -20%Building completion services 1.7 1.7 2.2 1.8 1.2 1.9 1.9 1.9 1.6 -7%Installation trade services 1.9 1.6 1.5 1.2 1.2 1.2 1.1 1.1 1.3 -32%Non-building construction 1.7 1.6 1.4 1.3 1.1 1.4 0.9 1.2 1.2 -29%Building construction 0.8 0.8 0.9 1.2 1.5 0.9 1.0 1.0 1.1 33%Total 1.5 1.4 1.4 1.4 1.4 1.3 1.3 1.4 1.4 0%
Rest of Australia 2000-01 2001-02 2002-03 2003-04 2004-05 2005-06 2006-07 2007-08 2008-09 Change
Other construction services 1.4 1.6 1.6 1.5 1.5 1.1 0.9 1.0 0.8 -42%Building structure services 2.6 2.3 2.3 1.9 1.7 1.7 1.5 1.6 1.6 -40%Site preparation services 1.7 1.5 1.3 1.4 1.1 1.1 0.9 1.1 1.1 -35%Building completion services 1.5 1.4 1.3 1.2 1.1 1.3 1.1 1.0 1.1 -28%Installation trade services 1.4 1.3 1.1 1.2 1.1 1.1 0.9 0.9 0.9 -34%Non-building construction 2.6 2.8 2.5 2.9 3.0 2.6 2.0 2.2 1.9 -30%Building construction 1.0 0.8 0.9 0.8 0.8 0.7 0.7 0.6 0.7 -34%Total 1.5 1.4 1.4 1.3 1.3 1.2 1.0 1.0 1.0 -35%
Claim Rate Gap2000-01 2001-02 2002-03 2003-04 2004-05 2005-06 2006-07 2007-08 2008-09 Change
Other construction services 0.1 0.1 -0.3 -0.1 0.7 0.9 0.9 1.5 2.0 1.9Building structure services -1.3 -0.9 0.0 -0.2 -0.4 -0.2 0.2 0.5 0.5 1.8Site preparation services 0.8 0.5 0.8 0.4 0.7 0.8 0.9 0.4 0.9 0.1Building completion services 0.2 0.3 0.9 0.6 0.0 0.6 0.8 0.9 0.5 0.3Installation trade services 0.5 0.3 0.3 0.0 0.1 0.1 0.2 0.2 0.4 -0.1Non-building construction -0.9 -1.2 -1.1 -1.7 -1.8 -1.1 -1.1 -1.1 -0.6 0.3Building construction -0.2 0.0 0.0 0.4 0.6 0.2 0.3 0.3 0.4 0.6Total -0.1 0.0 0.1 0.1 0.1 0.1 0.2 0.3 0.5 0.5Source: Claim and hours worked data supplied by SWA. Note: # Serious claims includes all accepted workers' compensation injury and disease claims for a fatality, permanent incapacity and temporary incapacity of one or more weeks time lost from work. Journey claims are excluded.
Construction industry report PN11424 Page 16 of 80
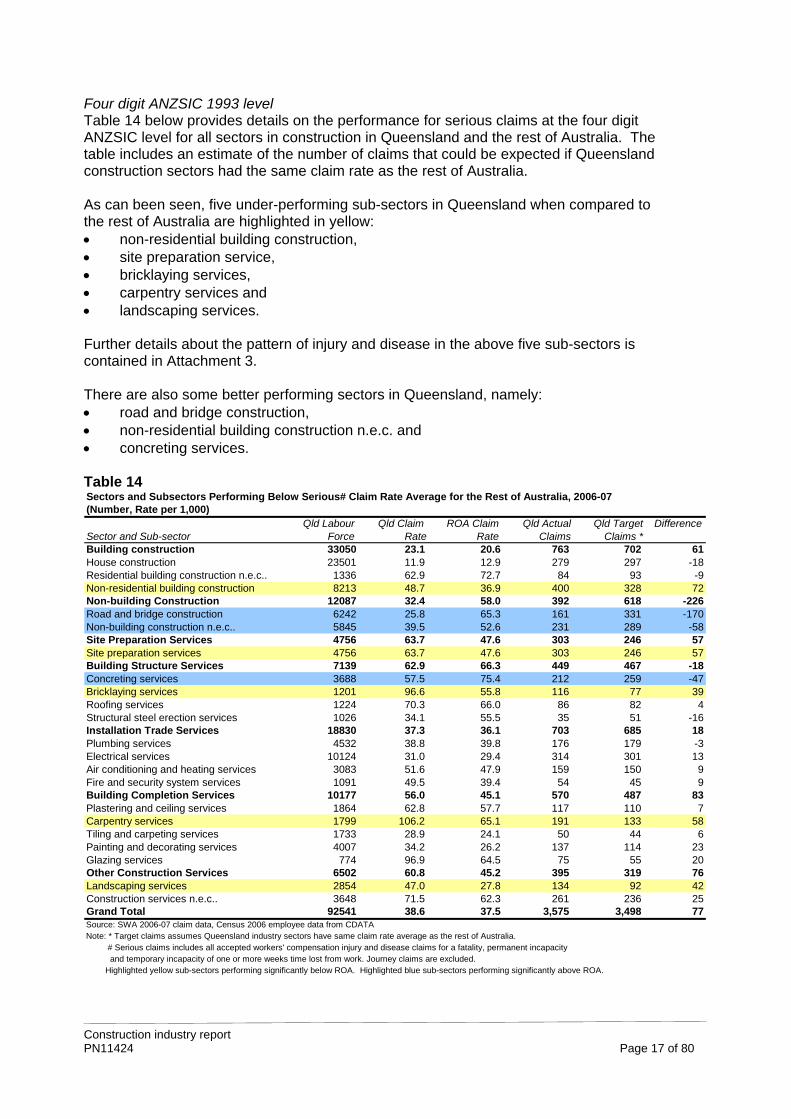
Four digit ANZSIC 1993 level Table 14 below provides details on the performance for serious claims at the four digit ANZSIC level for all sectors in construction in Queensland and the rest of Australia. The table includes an estimate of the number of claims that could be expected if Queensland construction sectors had the same claim rate as the rest of Australia. As can been seen, five under-performing sub-sectors in Queensland when compared to the rest of Australia are highlighted in yellow: non-residential building construction, site preparation service, bricklaying services, carpentry services and landscaping services. Further details about the pattern of injury and disease in the above five sub-sectors is contained in Attachment 3. There are also some better performing sectors in Queensland, namely: road and bridge construction, non-residential building construction n.e.c. and concreting services. Table 14 Sectors and Subsectors Performing Below Serious# Claim Rate Average for the Rest of Australia, 2006-07(Number, Rate per 1,000)
Qld Labour Qld Claim ROA Claim Qld Actual Qld Target DifferenceSector and Sub-sector Force Rate Rate Claims Claims *Building construction 33050 23.1 20.6 763 702 61House construction 23501 11.9 12.9 279 297 -18Residential building construction n.e.c.. 1336 62.9 72.7 84 93 -9Non-residential building construction 8213 48.7 36.9 400 328 72Non-building Construction 12087 32.4 58.0 392 618 -226Road and bridge construction 6242 25.8 65.3 161 331 -170Non-building construction n.e.c.. 5845 39.5 52.6 231 289 -58Site Preparation Services 4756 63.7 47.6 303 246 57Site preparation services 4756 63.7 47.6 303 246 57Building Structure Services 7139 62.9 66.3 449 467 -18Concreting services 3688 57.5 75.4 212 259 -47Bricklaying services 1201 96.6 55.8 116 77 39Roofing services 1224 70.3 66.0 86 82 4Structural steel erection services 1026 34.1 55.5 35 51 -16Installation Trade Services 18830 37.3 36.1 703 685 18Plumbing services 4532 38.8 39.8 176 179 -3Electrical services 10124 31.0 29.4 314 301 13Air conditioning and heating services 3083 51.6 47.9 159 150 9Fire and security system services 1091 49.5 39.4 54 45 9Building Completion Services 10177 56.0 45.1 570 487 83Plastering and ceiling services 1864 62.8 57.7 117 110 7Carpentry services 1799 106.2 65.1 191 133 58Tiling and carpeting services 1733 28.9 24.1 50 44 6Painting and decorating services 4007 34.2 26.2 137 114 23Glazing services 774 96.9 64.5 75 55 20Other Construction Services 6502 60.8 45.2 395 319 76Landscaping services 2854 47.0 27.8 134 92 42Construction services n.e.c.. 3648 71.5 62.3 261 236 25Grand Total 92541 38.6 37.5 3,575 3,498 77Source: SWA 2006-07 claim data, Census 2006 employee data from CDATANote: * Target claims assumes Queensland industry sectors have same claim rate average as the rest of Australia. # Serious claims includes all accepted workers' compensation injury and disease claims for a fatality, permanent incapacity and temporary incapacity of one or more weeks time lost from work. Journey claims are excluded. Highlighted yellow sub-sectors performing significantly below ROA. Highlighted blue sub-sectors performing significantly above ROA.
Construction industry report PN11424 Page 17 of 80
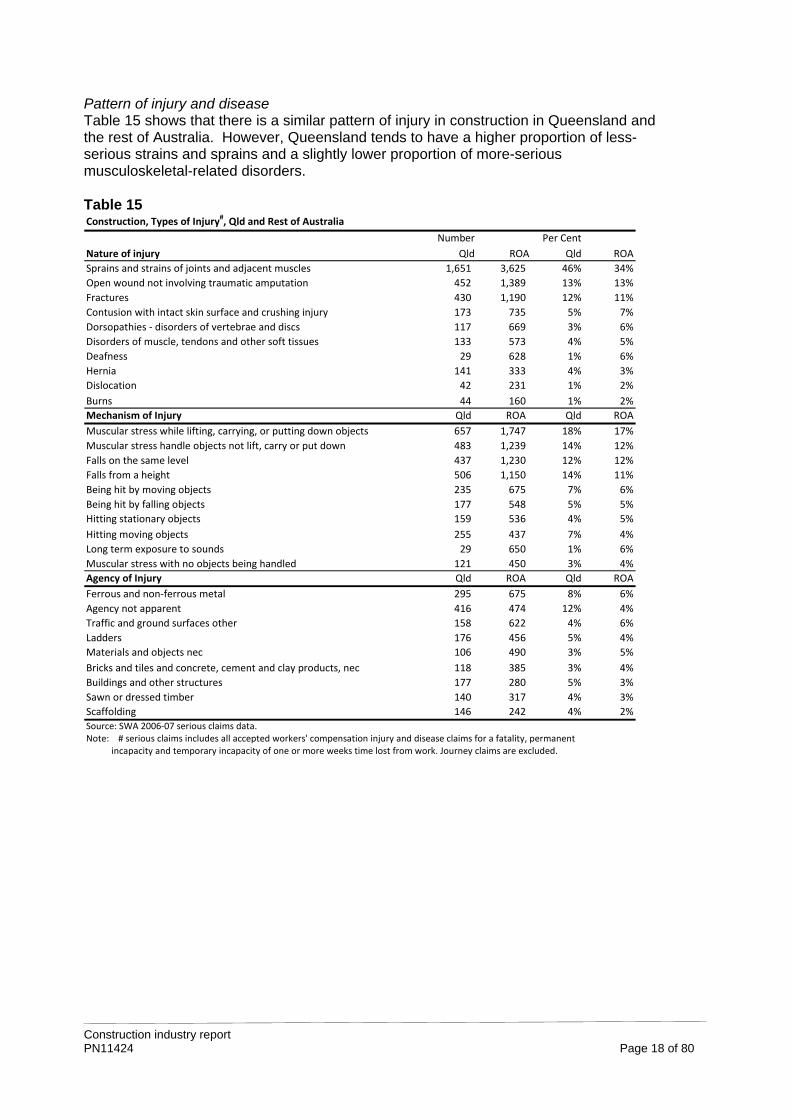
Pattern of injury and disease Table 15 shows that there is a similar pattern of injury in construction in Queensland and the rest of Australia. However, Queensland tends to have a higher proportion of less-serious strains and sprains and a slightly lower proportion of more-serious musculoskeletal-related disorders. Table 15 Construction, Types of Injury#, Qld and Rest of Australia
Number Per Cent
Nature of injury Qld ROA Qld ROA
Sprains and strains of joints and adjacent muscles 1,651 3,625 46% 34%
Open wound not involving traumatic amputation 452 1,389 13% 13%
Fractures 430 1,190 12% 11%
Contusion with intact skin surface and crushing injury 173 735 5% 7%
Dorsopathies ‐ disorders of vertebrae and discs 117 669 3% 6%
Disorders of muscle, tendons and other soft tissues 133 573 4% 5%
Deafness 29 628 1% 6%
Hernia 141 333 4% 3%
Dislocation 42 231 1% 2%
Burns 44 160 1% 2%
Mechanism of Injury Qld ROA Qld ROA
Muscular stress while lifting, carrying, or putting down objects 657 1,747 18% 17%
Muscular stress handle objects not lift, carry or put down 483 1,239 14% 12%
Falls on the same level 437 1,230 12% 12%
Falls from a height 506 1,150 14% 11%
Being hit by moving objects 235 675 7% 6%
Being hit by falling objects 177 548 5% 5%
Hitting stationary objects 159 536 4% 5%
Hitting moving objects 255 437 7% 4%
Long term exposure to sounds 29 650 1% 6%
Muscular stress with no objects being handled 121 450 3% 4%
Agency of Injury Qld ROA Qld ROA
Ferrous and non‐ferrous metal 295 675 8% 6%
Agency not apparent 416 474 12% 4%
Traffic and ground surfaces other 158 622 4% 6%
Ladders 176 456 5% 4%
Materials and objects nec 106 490 3% 5%
Bricks and tiles and concrete, cement and clay products, nec 118 385 3% 4%
Buildings and other structures 177 280 5% 3%
Sawn or dressed timber 140 317 4% 3%
Scaffolding 146 242 4% 2%
Source: SWA 2006‐07 serious claims data.Note: # serious claims includes all accepted workers' compensation injury and disease claims for a fatality, permanent incapacity and temporary incapacity of one or more weeks time lost from work. Journey claims are excluded.
Construction industry report PN11424 Page 18 of 80
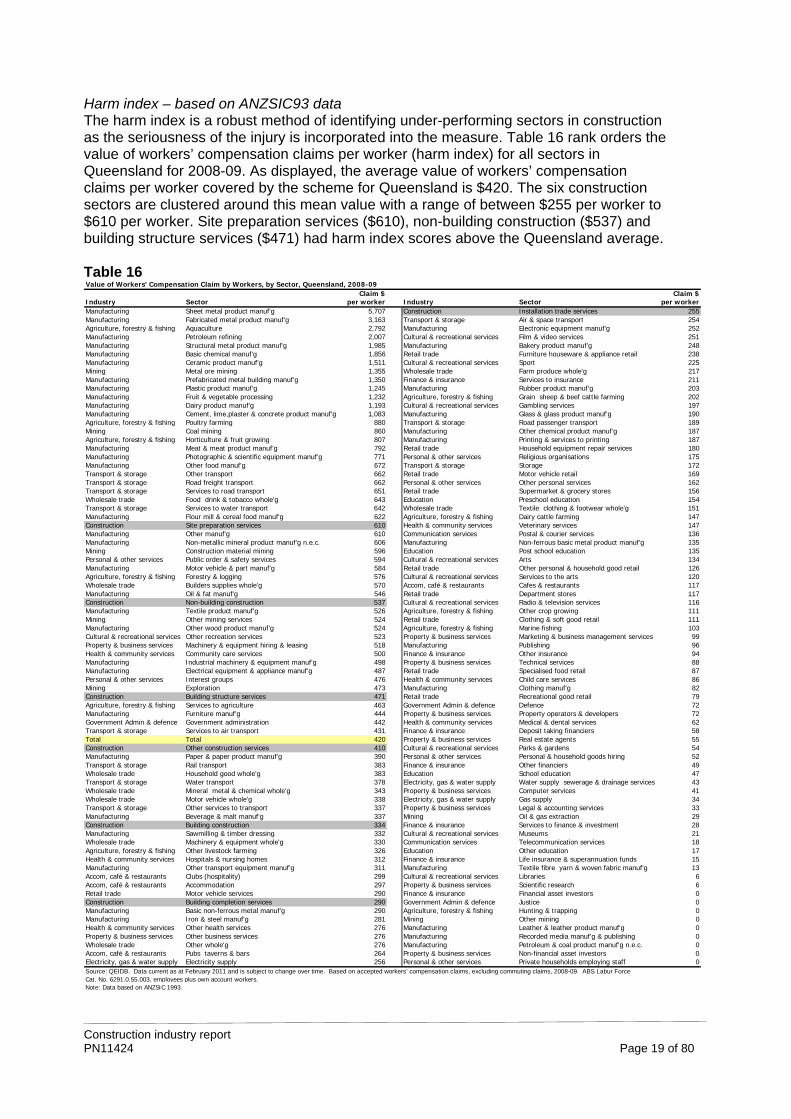
Harm index – based on ANZSIC93 data The harm index is a robust method of identifying under-performing sectors in construction as the seriousness of the injury is incorporated into the measure. Table 16 rank orders the value of workers’ compensation claims per worker (harm index) for all sectors in Queensland for 2008-09. As displayed, the average value of workers’ compensation claims per worker covered by the scheme for Queensland is $420. The six construction sectors are clustered around this mean value with a range of between $255 per worker to $610 per worker. Site preparation services ($610), non-building construction ($537) and building structure services ($471) had harm index scores above the Queensland average. Table 16 Value of Workers' Compensation Claim by Workers, by Sector, Queensland, 2008-09
Claim $ Claim $Industry Sector per worker Industry Sector per workerManufacturing Sheet metal product manuf'g 5,707 Construction Installation trade services 255Manufacturing Fabricated metal product manuf'g 3,163 Transport & storage Air & space transport 254Agriculture, forestry & fishing Aquaculture 2,792 Manufacturing Electronic equipment manuf'g 252Manufacturing Petroleum refining 2,007 Cultural & recreational services Film & video services 251Manufacturing Structural metal product manuf'g 1,985 Manufacturing Bakery product manuf'g 248Manufacturing Basic chemical manuf'g 1,856 Retail trade Furniture houseware & appliance retail 238Manufacturing Ceramic product manuf'g 1,511 Cultural & recreational services Sport 225Mining Metal ore mining 1,355 Wholesale trade Farm produce whole'g 217Manufacturing Prefabricated metal building manuf'g 1,350 Finance & insurance Services to insurance 211Manufacturing Plastic product manuf'g 1,245 Manufacturing Rubber product manuf'g 203Manufacturing Fruit & vegetable processing 1,232 Agriculture, forestry & fishing Grain sheep & beef cattle farming 202Manufacturing Dairy product manuf'g 1,193 Cultural & recreational services Gambling services 197Manufacturing Cement, lime,plaster & concrete product manuf'g 1,083 Manufacturing Glass & glass product manuf'g 190Agriculture, forestry & fishing Poultry farming 880 Transport & storage Road passenger transport 189Mining Coal mining 860 Manufacturing Other chemical product manuf'g 187Agriculture, forestry & fishing Horticulture & fruit growing 807 Manufacturing Printing & services to printing 187Manufacturing Meat & meat product manuf'g 792 Retail trade Household equipment repair services 180Manufacturing Photographic & scientific equipment manuf'g 771 Personal & other services Religious organisations 175Manufacturing Other food manuf'g 672 Transport & storage Storage 172Transport & storage Other transport 662 Retail trade Motor vehicle retail 169Transport & storage Road freight transport 662 Personal & other services Other personal services 162Transport & storage Services to road transport 651 Retail trade Supermarket & grocery stores 156Wholesale trade Food drink & tobacco whole'g 643 Education Preschool education 154Transport & storage Services to water transport 642 Wholesale trade Textile clothing & footwear whole'g 151Manufacturing Flour mill & cereal food manuf'g 622 Agriculture, forestry & fishing Dairy cattle farming 147Construction Site preparation services 610 Health & community services Veterinary services 147Manufacturing Other manuf'g 610 Communication services Postal & courier services 136Manufacturing Non-metallic mineral product manuf'g n.e.c. 606 Manufacturing Non-ferrous basic metal product manuf'g 135Mining Construction material mining 596 Education Post school education 135Personal & other services Public order & safety services 594 Cultural & recreational services Arts 134Manufacturing Motor vehicle & part manuf'g 584 Retail trade Other personal & household good retail 126Agriculture, forestry & fishing Forestry & logging 576 Cultural & recreational services Services to the arts 120Wholesale trade Builders supplies whole'g 570 Accom, café & restaurants Cafes & restaurants 117Manufacturing Oil & fat manuf'g 546 Retail trade Department stores 117Construction Non-building construction 537 Cultural & recreational services Radio & television services 116Manufacturing Textile product manuf'g 526 Agriculture, forestry & fishing Other crop growing 111Mining Other mining services 524 Retail trade Clothing & soft good retail 111Manufacturing Other wood product manuf'g 524 Agriculture, forestry & fishing Marine fishing 103Cultural & recreational services Other recreation services 523 Property & business services Marketing & business management services 9Property & business services Machinery & equipment hiring & leasing 518 Manufacturing Publishing 96Health & community services Community care services 500 Finance & insurance Other insurance 94Manufacturing Industrial machinery & equipment manuf'g 498 Property & business services Technical services 88Manufacturing Electrical equipment & appliance manuf'g 487 Retail trade Specialised food retail 87Personal & other services Interest groups 476 Health & community services Child care services 86Mining Exploration 473 Manufacturing Clothing manuf'g 82Construction Building structure services 471 Retail trade Recreational good retail 79
9
Agriculture, forestry & fishing Services to agriculture 463 Government Admin & defence Defence 72Manufacturing Furniture manuf'g 444 Property & business services Property operators & developers 72Government Admin & defence Government administration 442 Health & community services Medical & dental services 62Transport & storage Services to air transport 431 Finance & insurance Deposit taking financiers 58Total Total 420 Property & business services Real estate agents 55Construction Other construction services 410 Cultural & recreational services Parks & gardens 54Manufacturing Paper & paper product manuf'g 390 Personal & other services Personal & household goods hiring 52Transport & storage Rail transport 383 Finance & insurance Other financiers 49Wholesale trade Household good whole'g 383 Education School education 47Transport & storage Water transport 378 Electricity, gas & water supply Water supply sewerage & drainage services 43Wholesale trade Mineral metal & chemical whole'g 343 Property & business services Computer services 41Wholesale trade Motor vehicle whole'g 338 Electricity, gas & water supply Gas supply 34Transport & storage Other services to transport 337 Property & business services Legal & accounting services 33Manufacturing Beverage & malt manuf'g 337 Mining Oil & gas extraction 29Construction Building construction 334 Finance & insurance Services to finance & investment 28Manufacturing Sawmilling & timber dressing 332 Cultural & recreational services Museums 21Wholesale trade Machinery & equipment whole'g 330 Communication services Telecommunication services 18Agriculture, forestry & fishing Other livestock farming 326 Education Other education 17Health & community services Hospitals & nursing homes 312 Finance & insurance Life insurance & superannuation funds 15Manufacturing Other transport equipment manuf'g 311 Manufacturing Textile fibre yarn & woven fabric manuf'g 13Accom, café & restaurants Clubs (hospitality) 299 Cultural & recreational services Libraries 6Accom, café & restaurants Accommodation 297 Property & business services Scientific research 6Retail trade Motor vehicle services 290 Finance & insurance Financial asset investors 0Construction Building completion services 290 Government Admin & defence Justice 0Manufacturing Basic non-ferrous metal manuf'g 290 Agriculture, forestry & fishing Hunting & trapping 0Manufacturing Iron & steel manuf'g 281 Mining Other mining 0Health & community services Other health services 276 Manufacturing Leather & leather product manuf'g 0Property & business services Other business services 276 Manufacturing Recorded media manuf'g & publishing 0Wholesale trade Other whole'g 276 Manufacturing Petroleum & coal product manuf'g n.e.c. 0Accom, café & restaurants Pubs taverns & bars 264 Property & business services Non-financial asset investors 0Electricity, gas & water supply Electricity supply 256 Personal & other services Private households employing staff 0Source: QEIDB. Data current as at February 2011 and is subject to change over time. Based on accepted workers’ compensation claims, excluding commuting claims, 2008-09. ABS Labur ForceCat. No. 6291.0.55.003, employees plus own account workers.Note: Data based on ANZSIC 1993.
Construction industry report PN11424 Page 19 of 80
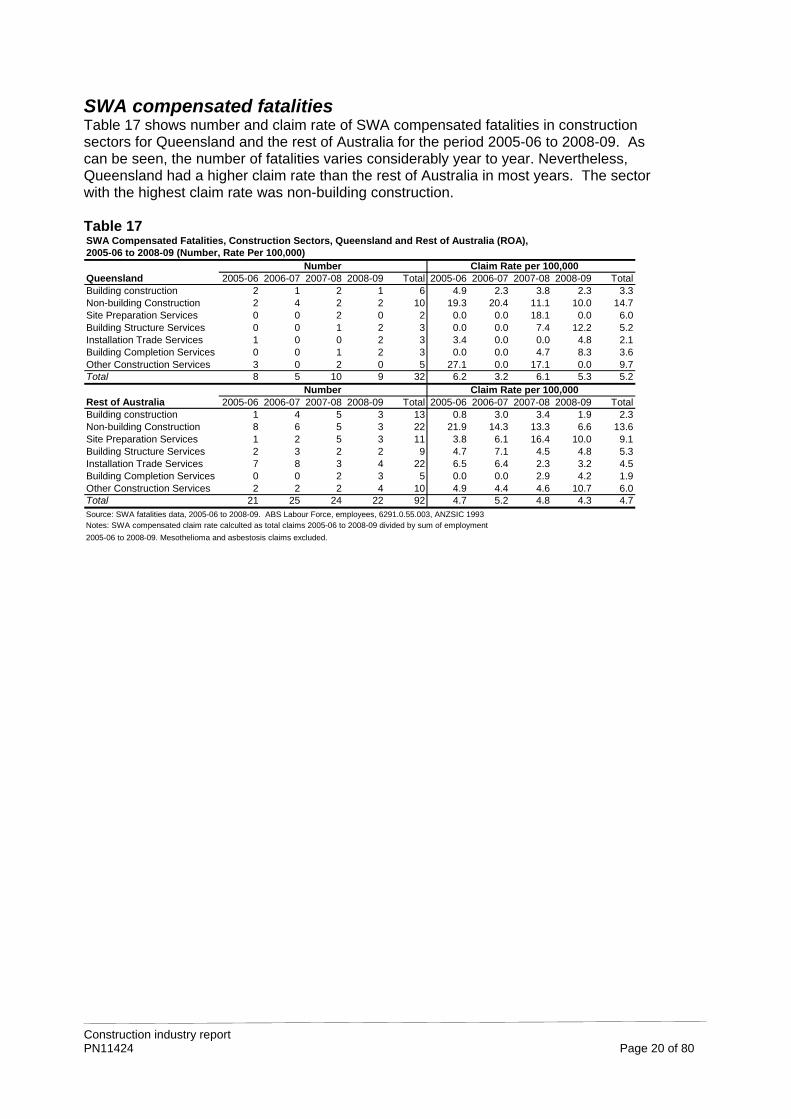
SWA compensated fatalities Table 17 shows number and claim rate of SWA compensated fatalities in construction sectors for Queensland and the rest of Australia for the period 2005-06 to 2008-09. As can be seen, the number of fatalities varies considerably year to year. Nevertheless, Queensland had a higher claim rate than the rest of Australia in most years. The sector with the highest claim rate was non-building construction. Table 17 SWA Compensated Fatalities, Construction Sectors, Queensland and Rest of Australia (ROA), 2005-06 to 2008-09 (Number, Rate Per 100,000)
Number Claim Rate per 100,000Queensland 2005-06 2006-07 2007-08 2008-09 Total 2005-06 2006-07 2007-08 2008-09 TotalBuilding construction 2 1 2 1 6 4.9 2.3 3.8 2.3Non-building Construction 2 4 2 2 10 19.3 20.4 11.1 10.0 1Site Preparation Services 0 0 2 0 2 0.0 0.0 18.1 0.0Building Structure Services 0 0 1 2 3 0.0 0.0 7.4 12.2Installation Trade Services 1 0 0 2 3 3.4 0.0 0.0 4.8Building Completion Services 0 0 1 2 3 0.0 0.0 4.7 8.3Other Construction Services 3 0 2 0 5 27.1 0.0 17.1 0.0Total 8 5 10 9 32 6.2 3.2 6.1 5.3 5
Number Claim Rate per 100,000Rest of Australia 2005-06 2006-07 2007-08 2008-09 Total 2005-06 2006-07 2007-08 2008-09 TotalBuilding construction 1 4 5 3 13 0.8 3.0 3.4 1.9Non-building Construction 8 6 5 3 22 21.9 14.3 13.3 6.6 1Site Preparation Services 1 2 5 3 11 3.8 6.1 16.4 10.0Building Structure Services 2 3 2 2 9 4.7 7.1 4.5 4.8Installation Trade Services 7 8 3 4 22 6.5 6.4 2.3 3.2Building Completion Services 0 0 2 3 5 0.0 0.0 2.9 4.2Other Construction Services 2 2 2 4 10 4.9 4.4 4.6 10.7Total 21 25 24 22 92 4.7 5.2 4.8 4.3 4.7Source: SWA fatalities data, 2005-06 to 2008-09. ABS Labour Force, employees, 6291.0.55.003, ANZSIC 1993Notes: SWA compensated claim rate calculted as total claims 2005-06 to 2008-09 divided by sum of employment
2005-06 to 2008-09. Mesothelioma and asbestosis claims excluded.
3.34.76.05.22.13.69.7.2
2.33.69.15.34.51.96.0
Construction industry report PN11424 Page 20 of 80
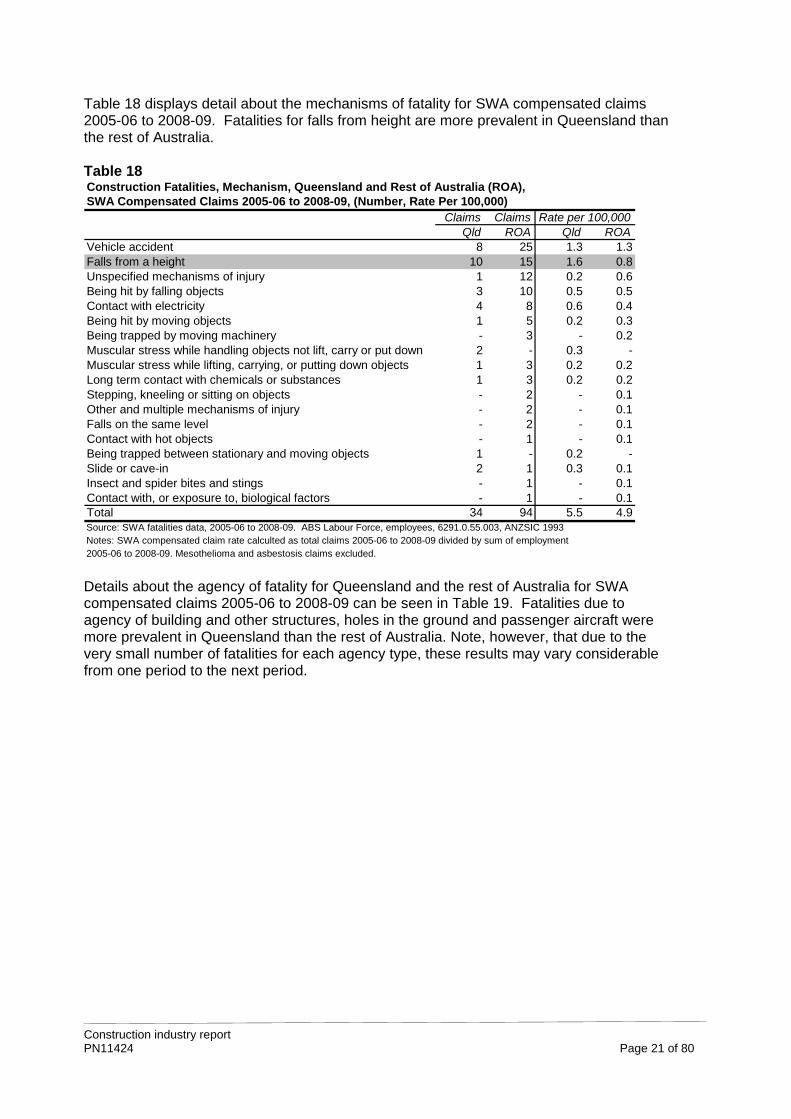
Table 18 displays detail about the mechanisms of fatality for SWA compensated claims 2005-06 to 2008-09. Fatalities for falls from height are more prevalent in Queensland than the rest of Australia. Table 18 Construction Fatalities, Mechanism, Queensland and Rest of Australia (ROA), SWA Compensated Claims 2005-06 to 2008-09, (Number, Rate Per 100,000)
Claims Claims Rate per 100,000Qld ROA Qld ROA
Vehicle accident 8 25 1.3 1.3Falls from a height 10 15 1.6 0.8Unspecified mechanisms of injury 1 12 0.2 0.6Being hit by falling objects 3 10 0.5 0.5Contact with electricity 4 8 0.6 0.4Being hit by moving objects 1 5 0.2 0.3Being trapped by moving machinery - 3 - 0.2Muscular stress while handling objects not lift, carry or put down 2 - 0.3 -Muscular stress while lifting, carrying, or putting down objects 1 3 0.2 0.2Long term contact with chemicals or substances 1 3 0.2 0.2Stepping, kneeling or sitting on objects - 2 - 0.1Other and multiple mechanisms of injury - 2 - 0.1Falls on the same level - 2 - 0.1Contact with hot objects - 1 - 0.1Being trapped between stationary and moving objects 1 - 0.2 -Slide or cave-in 2 1 0.3 0.1Insect and spider bites and stings - 1 - 0.1Contact with, or exposure to, biological factors - 1 - 0.1Total 34 94 5.5 4.9Source: SWA fatalities data, 2005-06 to 2008-09. ABS Labour Force, employees, 6291.0.55.003, ANZSIC 1993Notes: SWA compensated claim rate calculted as total claims 2005-06 to 2008-09 divided by sum of employment 2005-06 to 2008-09. Mesothelioma and asbestosis claims excluded. Details about the agency of fatality for Queensland and the rest of Australia for SWA compensated claims 2005-06 to 2008-09 can be seen in Table 19. Fatalities due to agency of building and other structures, holes in the ground and passenger aircraft were more prevalent in Queensland than the rest of Australia. Note, however, that due to the very small number of fatalities for each agency type, these results may vary considerable from one period to the next period.
Construction industry report PN11424 Page 21 of 80
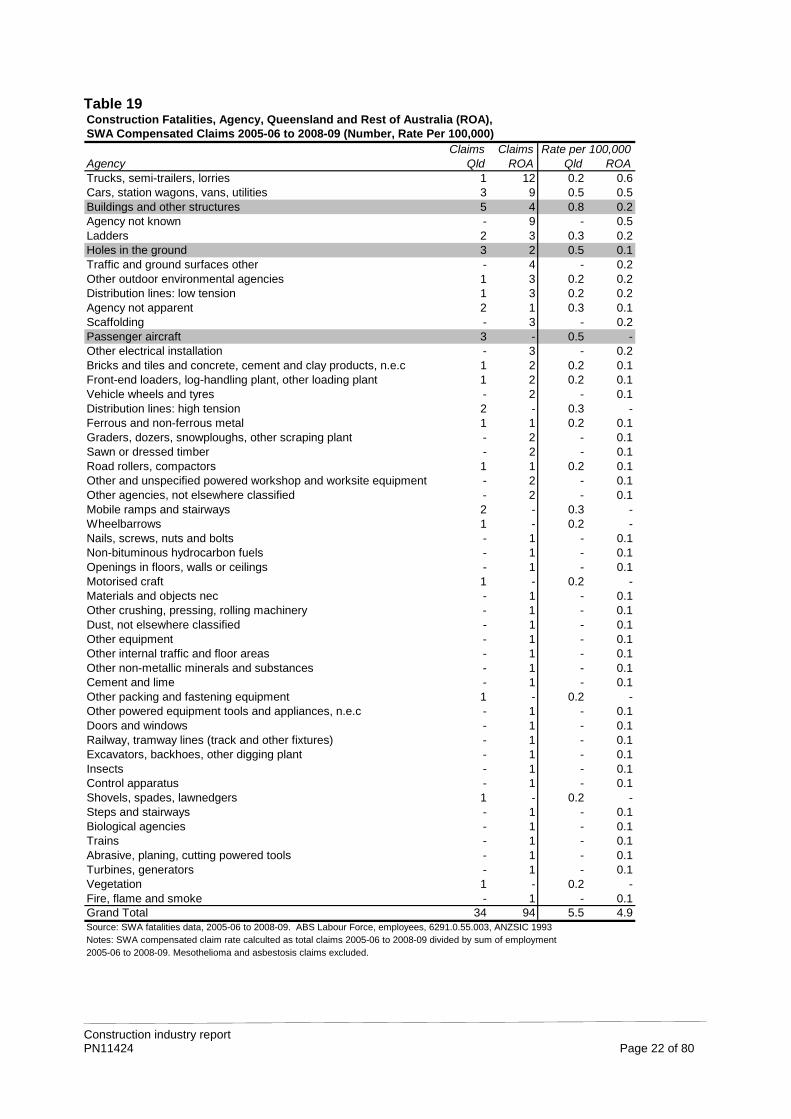
Table 19 Construction Fatalities, Agency, Queensland and Rest of Australia (ROA),SWA Compensated Claims 2005-06 to 2008-09 (Number, Rate Per 100,000)
Claims Claims Rate per 100,000Agency Qld ROA Qld ROATrucks, semi-trailers, lorries 1 12 0.2 0.6Cars, station wagons, vans, utilities 3 9 0.5 0.5Buildings and other structures 5 4 0.8 0.2Agency not known - 9 - 0.5Ladders 2 3 0.3 0.2Holes in the ground 3 2 0.5 0.1Traffic and ground surfaces other - 4 - 0.2Other outdoor environmental agencies 1 3 0.2 0.2Distribution lines: low tension 1 3 0.2 0.2Agency not apparent 2 1 0.3 0.1Scaffolding - 3 - 0.2Passenger aircraft 3 - 0.5 -Other electrical installation - 3 - 0.2Bricks and tiles and concrete, cement and clay products, n.e.c 1 2 0.2 0.1Front-end loaders, log-handling plant, other loading plant 1 2 0.2 0.1Vehicle wheels and tyres - 2 - 0.1Distribution lines: high tension 2 - 0.3 -Ferrous and non-ferrous metal 1 1 0.2 0.1Graders, dozers, snowploughs, other scraping plant - 2 - 0.1Sawn or dressed timber - 2 - 0.1Road rollers, compactors 1 1 0.2 0.1Other and unspecified powered workshop and worksite equipment - 2 - 0.1Other agencies, not elsewhere classified - 2 - 0.1Mobile ramps and stairways 2 - 0.3 -Wheelbarrows 1 - 0.2 -Nails, screws, nuts and bolts - 1 - 0.1Non-bituminous hydrocarbon fuels - 1 - 0.1Openings in floors, walls or ceilings - 1 - 0.1Motorised craft 1 - 0.2 -Materials and objects nec - 1 - 0.1Other crushing, pressing, rolling machinery - 1 - 0.1Dust, not elsewhere classified - 1 - 0.1Other equipment - 1 - 0.1Other internal traffic and floor areas - 1 - 0.1Other non-metallic minerals and substances - 1 - 0.1Cement and lime - 1 - 0.1Other packing and fastening equipment 1 - 0.2 -Other powered equipment tools and appliances, n.e.c - 1 - 0.1Doors and windows - 1 - 0.1Railway, tramway lines (track and other fixtures) - 1 - 0.1Excavators, backhoes, other digging plant - 1 - 0.1Insects - 1 - 0.1Control apparatus - 1 - 0.1Shovels, spades, lawnedgers 1 - 0.2 -Steps and stairways - 1 - 0.1Biological agencies - 1 - 0.1Trains - 1 - 0.1Abrasive, planing, cutting powered tools - 1 - 0.1Turbines, generators - 1 - 0.1Vegetation 1 - 0.2 -Fire, flame and smoke - 1 - 0.1Grand Total 34 94 5.5 4.9Source: SWA fatalities data, 2005-06 to 2008-09. ABS Labour Force, employees, 6291.0.55.003, ANZSIC 1993Notes: SWA compensated claim rate calculted as total claims 2005-06 to 2008-09 divided by sum of employment 2005-06 to 2008-09. Mesothelioma and asbestosis claims excluded.
Construction industry report PN11424 Page 22 of 80
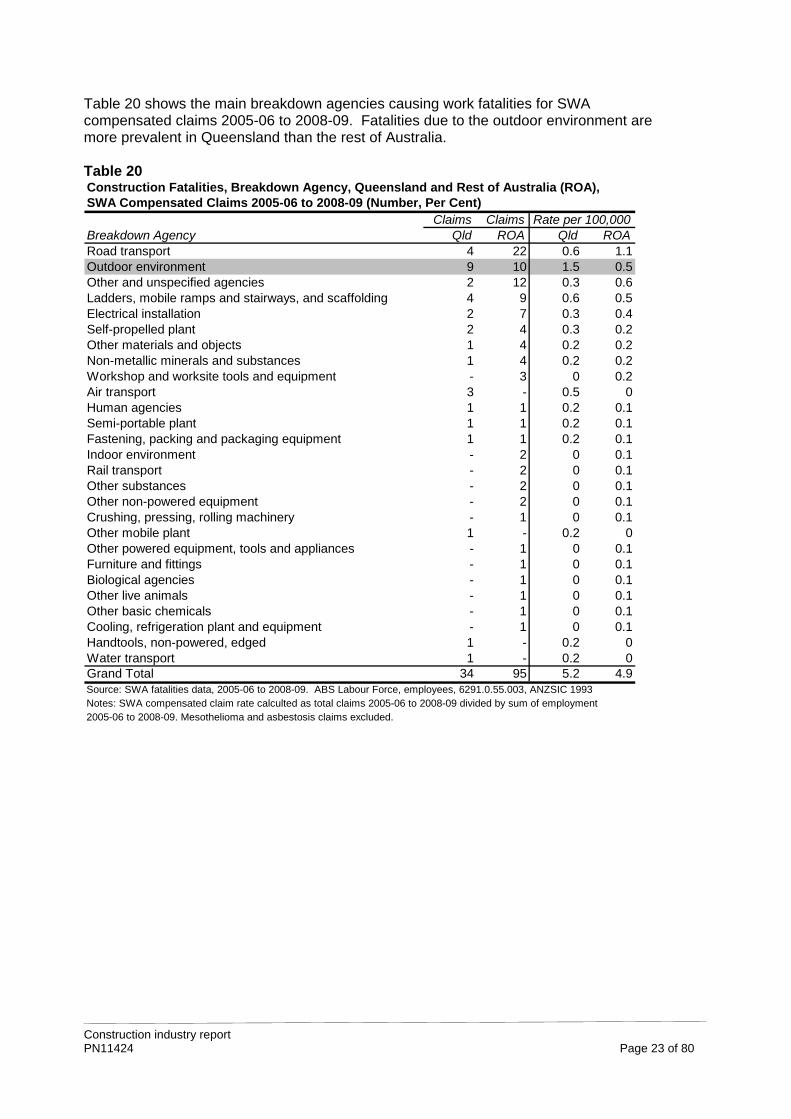
Table 20 shows the main breakdown agencies causing work fatalities for SWA compensated claims 2005-06 to 2008-09. Fatalities due to the outdoor environment are more prevalent in Queensland than the rest of Australia. Table 20 Construction Fatalities, Breakdown Agency, Queensland and Rest of Australia (ROA), SWA Compensated Claims 2005-06 to 2008-09 (Number, Per Cent)
Claims Claims Rate per 100,000Breakdown Agency Qld ROA Qld ROARoad transport 4 22 0.6 1.1Outdoor environment 9 10 1.5 0.5Other and unspecified agencies 2 12 0.3 0.6Ladders, mobile ramps and stairways, and scaffolding 4 9 0.6 0.5Electrical installation 2 7 0.3 0.4Self-propelled plant 2 4 0.3 0.2Other materials and objects 1 4 0.2 0.2Non-metallic minerals and substances 1 4 0.2 0.2Workshop and worksite tools and equipment - 3 0 0.2Air transport 3 - 0.5 0Human agencies 1 1 0.2 0.1Semi-portable plant 1 1 0.2 0.1Fastening, packing and packaging equipment 1 1 0.2 0.1Indoor environment - 2 0 0.1Rail transport - 2 0 0.1Other substances - 2 0 0.1Other non-powered equipment - 2 0 0.1Crushing, pressing, rolling machinery - 1 0 0.1Other mobile plant 1 - 0.2 0Other powered equipment, tools and appliances - 1 0 0.1Furniture and fittings - 1 0 0.1Biological agencies - 1 0 0.1Other live animals - 1 0 0.1Other basic chemicals - 1 0 0.1Cooling, refrigeration plant and equipment - 1 0 0.1Handtools, non-powered, edged 1 - 0.2 0Water transport 1 - 0.2 0Grand Total 34 95 5.2 4.9Source: SWA fatalities data, 2005-06 to 2008-09. ABS Labour Force, employees, 6291.0.55.003, ANZSIC 1993Notes: SWA compensated claim rate calculted as total claims 2005-06 to 2008-09 divided by sum of employment 2005-06 to 2008-09. Mesothelioma and asbestosis claims excluded.
Construction industry report PN11424 Page 23 of 80
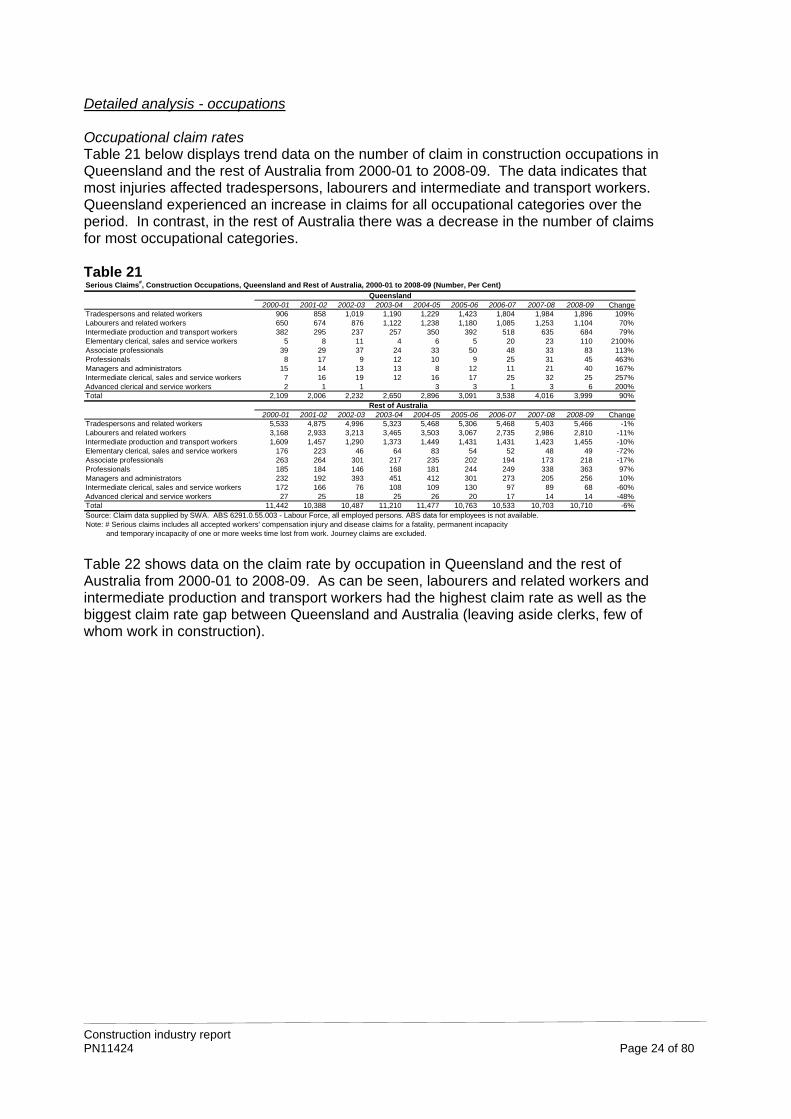
Detailed analysis - occupations Occupational claim rates Table 21 below displays trend data on the number of claim in construction occupations in Queensland and the rest of Australia from 2000-01 to 2008-09. The data indicates that most injuries affected tradespersons, labourers and intermediate and transport workers. Queensland experienced an increase in claims for all occupational categories over the period. In contrast, in the rest of Australia there was a decrease in the number of claims for most occupational categories. Table 21 Serious Claims#, Construction Occupations, Queensland and Rest of Australia, 2000-01 to 2008-09 (Number, Per Cent)
Queensland 2000-01 2001-02 2002-03 2003-04 2004-05 2005-06 2006-07 2007-08 2008-09 Change
Tradespersons and related workers 906 858 1,019 1,190 1,229 1,423 1,804 1,984 1,896 109%Labourers and related workers 650 674 876 1,122 1,238 1,180 1,085 1,253 1,104 70%Intermediate production and transport workers 382 295 237 257 350 392 518 635 684 79%Elementary clerical, sales and service workers 5 8 11 4 6 5 20 23 110 2100%Associate professionals 39 29 37 24 33 50 48 33 83 113%Professionals 8 17 9 12 10 9 25 31 45 463%Managers and administrators 15 14 13 13 8 12 11 21 40 167%Intermediate clerical, sales and service workers 7 16 19 12 16 17 25 32 25 257%Advanced clerical and service workers 2 1 1 3 3 1 3 6 200%Total 2,109 2,006 2,232 2,650 2,896 3,091 3,538 4,016 3,999 90%
Rest of Australia 2000-01 2001-02 2002-03 2003-04 2004-05 2005-06 2006-07 2007-08 2008-09 Change
Tradespersons and related workers 5,533 4,875 4,996 5,323 5,468 5,306 5,468 5,403 5,466 -1%Labourers and related workers 3,168 2,933 3,213 3,465 3,503 3,067 2,735 2,986 2,810 -11%Intermediate production and transport workers 1,609 1,457 1,290 1,373 1,449 1,431 1,431 1,423 1,455 -10%Elementary clerical, sales and service workers 176 223 46 64 83 54 52 48 49 -72%Associate professionals 263 264 301 217 235 202 194 173 218 -17%Professionals 185 184 146 168 181 244 249 338 363 97%Managers and administrators 232 192 393 451 412 301 273 205 256 10%Intermediate clerical, sales and service workers 172 166 76 108 109 130 97 89 68 -60%Advanced clerical and service workers 27 25 18 25 26 20 17 14 14 -48%Total 11,442 10,388 10,487 11,210 11,477 10,763 10,533 10,703 10,710 -6%Source: Claim data supplied by SWA. ABS 6291.0.55.003 - Labour Force, all employed persons. ABS data for employees is not available.Note: # Serious claims includes all accepted workers' compensation injury and disease claims for a fatality, permanent incapacity and temporary incapacity of one or more weeks time lost from work. Journey claims are excluded. Table 22 shows data on the claim rate by occupation in Queensland and the rest of Australia from 2000-01 to 2008-09. As can be seen, labourers and related workers and intermediate production and transport workers had the highest claim rate as well as the biggest claim rate gap between Queensland and Australia (leaving aside clerks, few of whom work in construction).
Construction industry report PN11424 Page 24 of 80
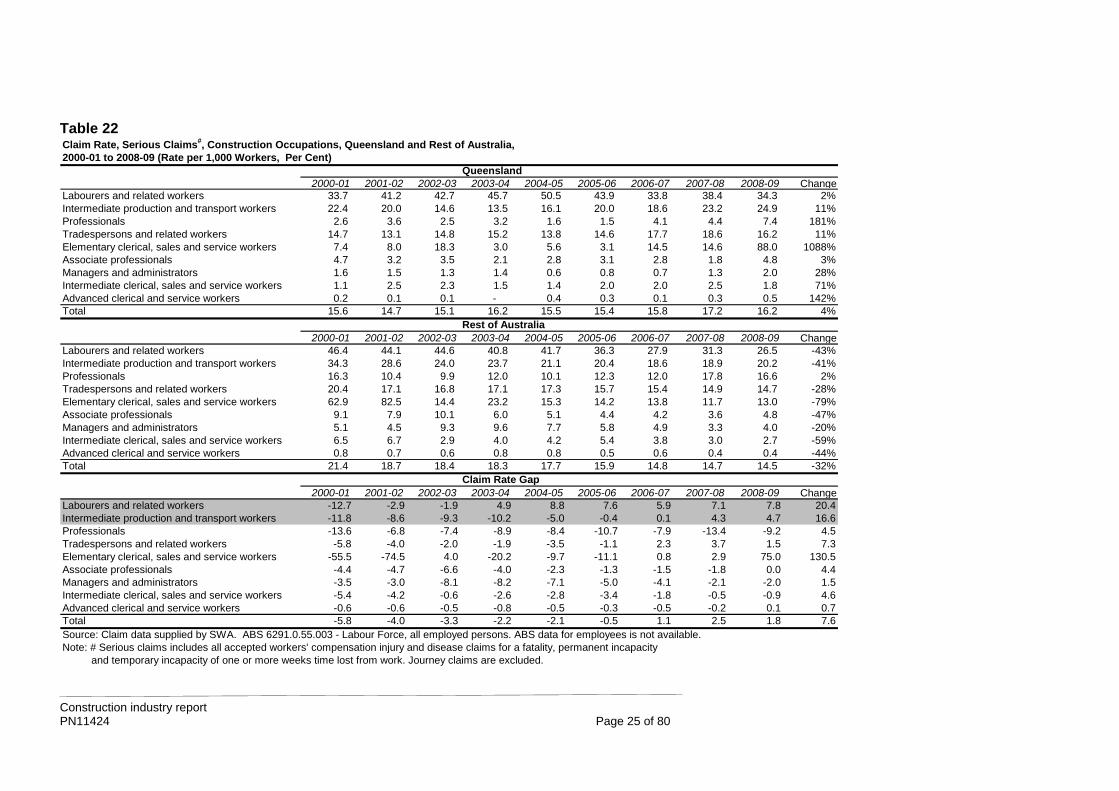
Table 22 Claim Rate, Serious Claims#, Construction Occupations, Queensland and Rest of Australia, 2000-01 to 2008-09 (Rate per 1,000 Workers, Per Cent)
Queensland 2000-01 2001-02 2002-03 2003-04 2004-05 2005-06 2006-07 2007-08 2008-09 Change
Labourers and related workers 33.7 41.2 42.7 45.7 50.5 43.9 33.8 38.4 34.3 2%Intermediate production and transport workers 22.4 20.0 14.6 13.5 16.1 20.0 18.6 23.2 24.9 11%Professionals 2.6 3.6 2.5 3.2 1.6 1.5 4.1 4.4 7.4 181%Tradespersons and related workers 14.7 13.1 14.8 15.2 13.8 14.6 17.7 18.6 16.2 11%Elementary clerical, sales and service workers 7.4 8.0 18.3 3.0 5.6 3.1 14.5 14.6 88.0 1088%Associate professionals 4.7 3.2 3.5 2.1 2.8 3.1 2.8 1.8 4.8 3%Managers and administrators 1.6 1.5 1.3 1.4 0.6 0.8 0.7 1.3 2.0 28%Intermediate clerical, sales and service workers 1.1 2.5 2.3 1.5 1.4 2.0 2.0 2.5 1.8 71%Advanced clerical and service workers 0.2 0.1 0.1 - 0.4 0.3 0.1 0.3 0.5 142%Total 15.6 14.7 15.1 16.2 15.5 15.4 15.8 17.2 16.2 4%
Rest of Australia 2000-01 2001-02 2002-03 2003-04 2004-05 2005-06 2006-07 2007-08 2008-09 Change
Labourers and related workers 46.4 44.1 44.6 40.8 41.7 36.3 27.9 31.3 26.5 -43%Intermediate production and transport workers 34.3 28.6 24.0 23.7 21.1 20.4 18.6 18.9 20.2 -41%Professionals 16.3 10.4 9.9 12.0 10.1 12.3 12.0 17.8 16.6 2%Tradespersons and related workers 20.4 17.1 16.8 17.1 17.3 15.7 15.4 14.9 14.7 -28%Elementary clerical, sales and service workers 62.9 82.5 14.4 23.2 15.3 14.2 13.8 11.7 13.0 -79%Associate professionals 9.1 7.9 10.1 6.0 5.1 4.4 4.2 3.6 4.8 -47%Managers and administrators 5.1 4.5 9.3 9.6 7.7 5.8 4.9 3.3 4.0 -20%Intermediate clerical, sales and service workers 6.5 6.7 2.9 4.0 4.2 5.4 3.8 3.0 2.7 -59%Advanced clerical and service workers 0.8 0.7 0.6 0.8 0.8 0.5 0.6 0.4 0.4 -44%Total 21.4 18.7 18.4 18.3 17.7 15.9 14.8 14.7 14.5 -32%
Claim Rate Gap2000-01 2001-02 2002-03 2003-04 2004-05 2005-06 2006-07 2007-08 2008-09 Change
Labourers and related workers -12.7 -2.9 -1.9 4.9 8.8 7.6 5.9 7.1 7.8 20.4Intermediate production and transport workers -11.8 -8.6 -9.3 -10.2 -5.0 -0.4 0.1 4.3 4.7 16.6Professionals -13.6 -6.8 -7.4 -8.9 -8.4 -10.7 -7.9 -13.4 -9.2 4.5Tradespersons and related workers -5.8 -4.0 -2.0 -1.9 -3.5 -1.1 2.3 3.7 1.5 7.3Elementary clerical, sales and service workers -55.5 -74.5 4.0 -20.2 -9.7 -11.1 0.8 2.9 75.0 130.5Associate professionals -4.4 -4.7 -6.6 -4.0 -2.3 -1.3 -1.5 -1.8 0.0 4.4Managers and administrators -3.5 -3.0 -8.1 -8.2 -7.1 -5.0 -4.1 -2.1 -2.0 1.5Intermediate clerical, sales and service workers -5.4 -4.2 -0.6 -2.6 -2.8 -3.4 -1.8 -0.5 -0.9 4.6Advanced clerical and service workers -0.6 -0.6 -0.5 -0.8 -0.5 -0.3 -0.5 -0.2 0.1 0.7Total -5.8 -4.0 -3.3 -2.2 -2.1 -0.5 1.1 2.5 1.8 7.6Source: Claim data supplied by SWA. ABS 6291.0.55.003 - Labour Force, all employed persons. ABS data for employees is not available.Note: # Serious claims includes all accepted workers' compensation injury and disease claims for a fatality, permanent incapacity and temporary incapacity of one or more weeks time lost from work. Journey claims are excluded.
Construction industry report PN11424 Page 25 of 80
Three digit ASCO level Table 23 shows details about claims, employment and the claim rate for select construction occupations in Queensland and the rest of Australia of 2006-07 based on the ABS Australian Standard Classification of Occupations (ASCO) at the three digit level. The occupations recording the highest number of claims were: carpentry and joinery tradespersons (475 in Qld and 1,243 in ROA), other miscellaneous labourers and related workers (206 in Qld and 857 in ROA), plumbers (188 in Qld and 795 in ROA), electricians (239 in Qld and 691 in ROA), construction and plumbers assistants (571 in Qld and 564 in ROA), other miscellaneous tradespersons and related workers (31 in Qld and 471 in ROA)
and concreters (188 in Qld and 338 in ROA). There are several Queensland occupations with a high claim rate, compared to the rest of Australia: construction and plumbers assistants (88.0 versus 32.0), concreters (51.8 versus 39.3), structural steel construction workers (63.9 versus 44.2) and bricklayers (69.2 versus 36.4).
Construction industry report PN11424 Page 26 of 80
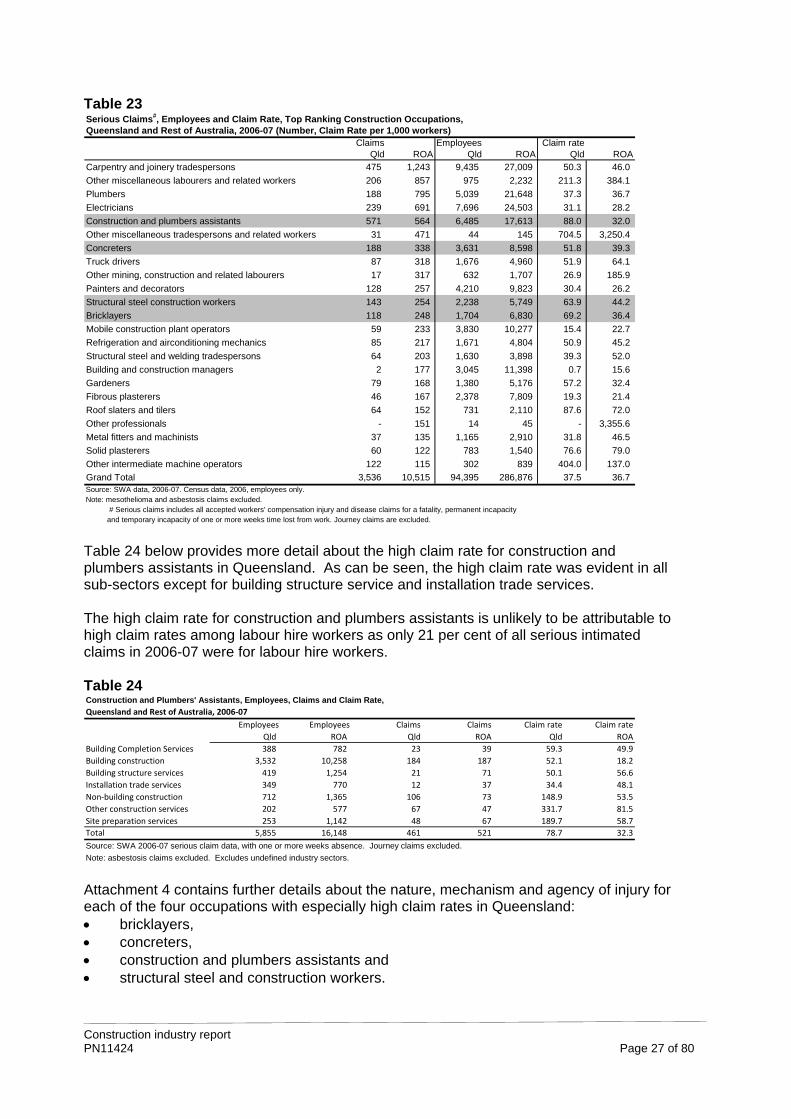
Table 23 Serious Claims#, Employees and Claim Rate, Top Ranking Construction Occupations, Queensland and Rest of Australia, 2006-07 (Number, Claim Rate per 1,000 workers)
Claims Employees Claim rateQld ROA Qld ROA Qld ROA
Carpentry and joinery tradespersons 475 1,243 9,435 27,009 50.3 46.0
Other miscellaneous labourers and related workers 206 857 975 2,232 211.3 384.1
Plumbers 188 795 5,039 21,648 37.3 36.7
Electricians 239 691 7,696 24,503 31.1 28.2
Construction and plumbers assistants 571 564 6,485 17,613 88.0 32.0
Other miscellaneous tradespersons and related workers 31 471 44 145 704.5 3,250.4
Concreters 188 338 3,631 8,598 51.8 39.3
Truck drivers 87 318 1,676 4,960 51.9 64.1
Other mining, construction and related labourers 17 317 632 1,707 26.9 185.9
Painters and decorators 128 257 4,210 9,823 30.4 26.2
Structural steel construction workers 143 254 2,238 5,749 63.9 44.2
Bricklayers 118 248 1,704 6,830 69.2 36.4
Mobile construction plant operators 59 233 3,830 10,277 15.4 22.7
Refrigeration and airconditioning mechanics 85 217 1,671 4,804 50.9 45.2
Structural steel and welding tradespersons 64 203 1,630 3,898 39.3 52.0
Building and construction managers 2 177 3,045 11,398 0.7 15.6
Gardeners 79 168 1,380 5,176 57.2 32.4
Fibrous plasterers 46 167 2,378 7,809 19.3 21.4
Roof slaters and tilers 64 152 731 2,110 87.6 72.0
Other professionals - 151 14 45 - 3,355.6
Metal fitters and machinists 37 135 1,165 2,910 31.8 46.5
Solid plasterers 60 122 783 1,540 76.6 79.0
Other intermediate machine operators 122 115 302 839 404.0 137.0
Grand Total 3,536 10,515 94,395 286,876 37.5 36.7 Source: SWA data, 2006-07. Census data, 2006, employees only.Note: mesothelioma and asbestosis claims excluded. # Serious claims includes all accepted workers' compensation injury and disease claims for a fatality, permanent incapacity and temporary incapacity of one or more weeks time lost from work. Journey claims are excluded. Table 24 below provides more detail about the high claim rate for construction and plumbers assistants in Queensland. As can be seen, the high claim rate was evident in all sub-sectors except for building structure service and installation trade services. The high claim rate for construction and plumbers assistants is unlikely to be attributable to high claim rates among labour hire workers as only 21 per cent of all serious intimated claims in 2006-07 were for labour hire workers. Table 24 Construction and Plumbers' Assistants, Employees, Claims and Claim Rate,
Queensland and Rest of Australia, 2006‐07
Employees Employees Claims Claims Claim rate Claim rate
Qld ROA Qld ROA Qld R
Building Completion Services 388 782 23 39 59.3 49.9
Building construction 3,532 10,258 184 187 52.1 18.2
Building structure services 419 1,254 21 71 50.1 56.6
Installation trade services 349 770 12 37 34.4 48.1
Non‐building construction 712 1,365 106 73 148.9 53.5
Other construction services 202 577 67 47 331.7 81.5
Site preparation services 253 1,142 48 67 189.7 58.7
Total 5,855 16,148 461 521 78.7 32.3
Source: SWA 2006-07 serious claim data, with one or more weeks absence. Journey claims excluded.
Note: asbestosis claims excluded. Excludes undefined industry sectors.
OA
Attachment 4 contains further details about the nature, mechanism and agency of injury for each of the four occupations with especially high claim rates in Queensland: bricklayers, concreters, construction and plumbers assistants and structural steel and construction workers.
Construction industry report PN11424 Page 27 of 80
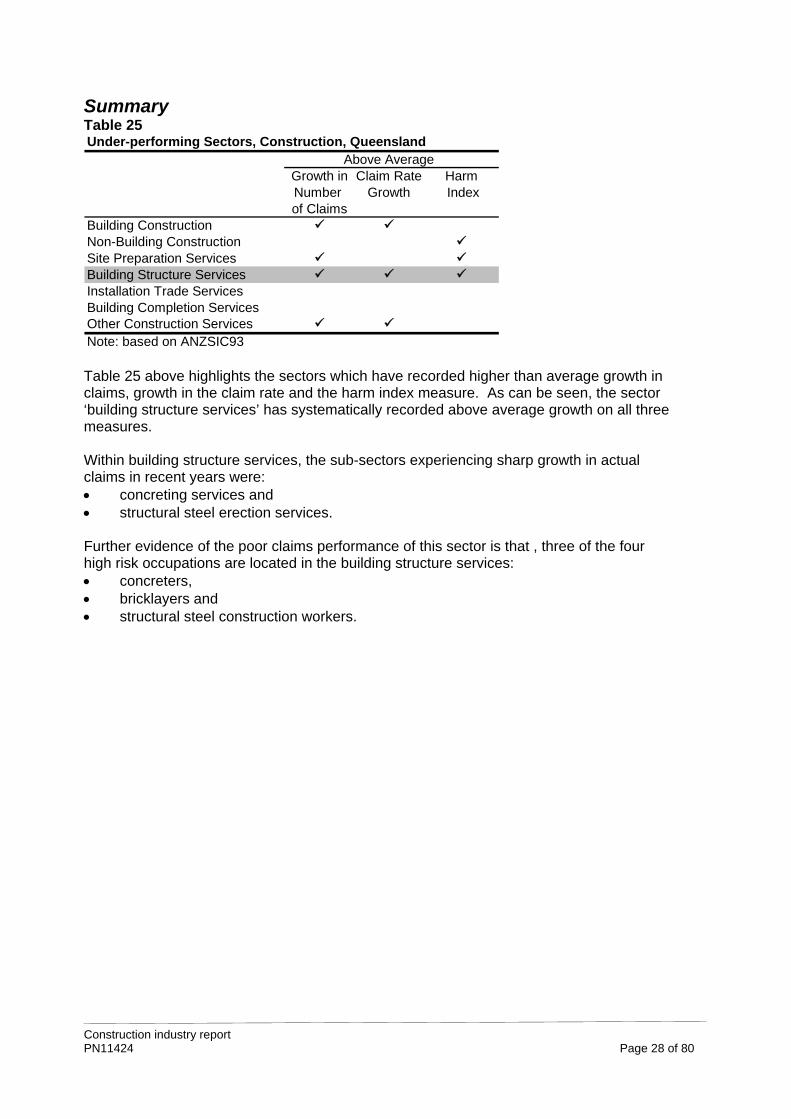
Summary Table 25 Under-performing Sectors, Construction, Queensland
Above AverageGrowth in Claim Rate HarmNumber Growth Indexof Claims
Building Construction Non-Building Construction Site Preparation Services Building Structure Services Installation Trade ServicesBuilding Completion ServicesOther Construction Services Note: based on ANZSIC93 Table 25 above highlights the sectors which have recorded higher than average growth in claims, growth in the claim rate and the harm index measure. As can be seen, the sector ‘building structure services’ has systematically recorded above average growth on all three measures. Within building structure services, the sub-sectors experiencing sharp growth in actual claims in recent years were: concreting services and structural steel erection services. Further evidence of the poor claims performance of this sector is that , three of the four high risk occupations are located in the building structure services: concreters, bricklayers and structural steel construction workers.
Construction industry report PN11424 Page 28 of 80
Explaining the high claim rate in Queensland construction
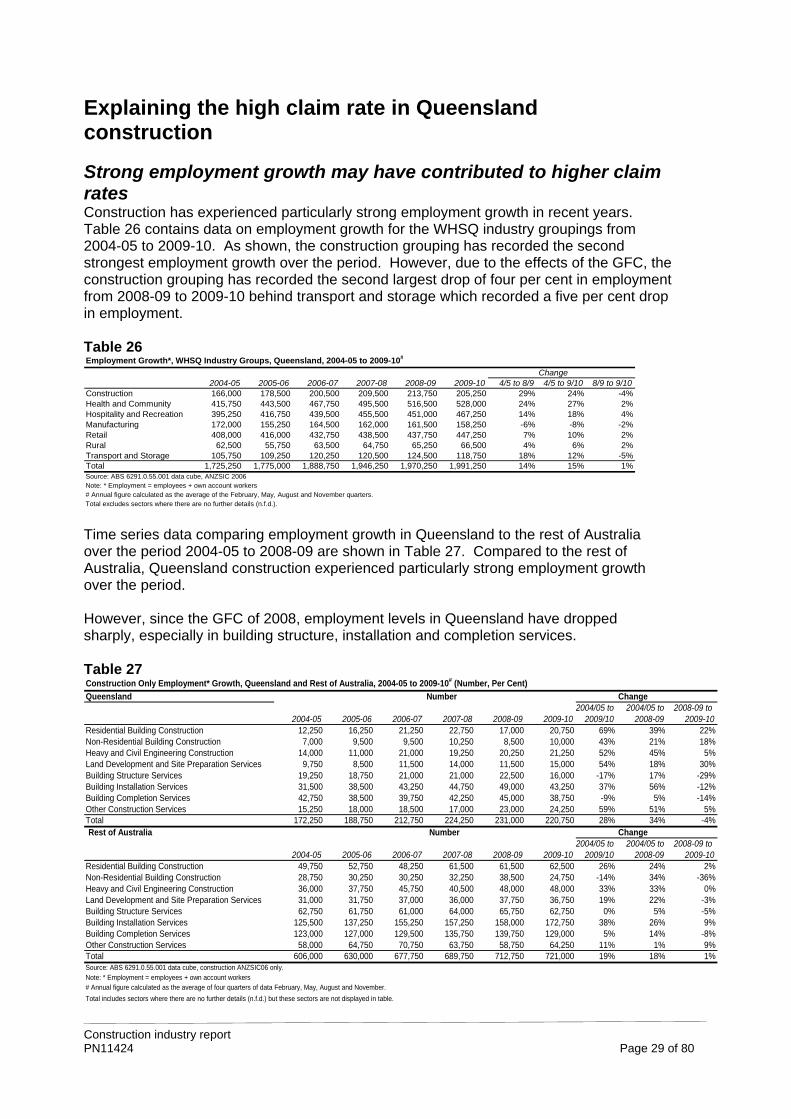
Strong employment growth may have contributed to higher claim rates Construction has experienced particularly strong employment growth in recent years. Table 26 contains data on employment growth for the WHSQ industry groupings from 2004-05 to 2009-10. As shown, the construction grouping has recorded the second strongest employment growth over the period. However, due to the effects of the GFC, the construction grouping has recorded the second largest drop of four per cent in employment from 2008-09 to 2009-10 behind transport and storage which recorded a five per cent drop in employment. Table 26 Employment Growth*, WHSQ Industry Groups, Queensland, 2004-05 to 2009-10#
Change2004-05 2005-06 2006-07 2007-08 2008-09 2009-10 4/5 to 8/9 4/5 to 9/10 8/9 to 9/10
Construction 166,000 178,500 200,500 209,500 213,750 205,250 29% 24% -4%Health and Community 415,750 443,500 467,750 495,500 516,500 528,000 24% 27% 2%Hospitality and Recreation 395,250 416,750 439,500 455,500 451,000 467,250 14% 18% 4%Manufacturing 172,000 155,250 164,500 162,000 161,500 158,250 -6% -8% -2%Retail 408,000 416,000 432,750 438,500 437,750 447,250 7% 10% 2%Rural 62,500 55,750 63,500 64,750 65,250 66,500 4% 6% 2%Transport and Storage 105,750 109,250 120,250 120,500 124,500 118,750 18% 12% -5%Total 1,725,250 1,775,000 1,888,750 1,946,250 1,970,250 1,991,250 14% 15% 1%Source: ABS 6291.0.55.001 data cube, ANZSIC 2006 Note: * Employment = employees + own account workers# Annual figure calculated as the average of the February, May, August and November quarters. Total excludes sectors where there are no further details (n.f.d.). Time series data comparing employment growth in Queensland to the rest of Australia over the period 2004-05 to 2008-09 are shown in Table 27. Compared to the rest of Australia, Queensland construction experienced particularly strong employment growth over the period. However, since the GFC of 2008, employment levels in Queensland have dropped sharply, especially in building structure, installation and completion services. Table 27 Construction Only Employment* Growth, Queensland and Rest of Australia, 2004-05 to 2009-10# (Number, Per Cent)
Queensland Number Change2004/05 to 2004/05 to 2008-09 to
2004-05 2005-06 2006-07 2007-08 2008-09 2009-10 2009/10 2008-09 2009-10Residential Building Construction 12,250 16,250 21,250 22,750 17,000 20,750 69% 39% 22%Non-Residential Building Construction 7,000 9,500 9,500 10,250 8,500 10,000 43% 21% 18%Heavy and Civil Engineering Construction 14,000 11,000 21,000 19,250 20,250 21,250 52% 45% 5%Land Development and Site Preparation Services 9,750 8,500 11,500 14,000 11,500 15,000 54% 18% 30%Building Structure Services 19,250 18,750 21,000 21,000 22,500 16,000 -17% 17% -29%Building Installation Services 31,500 38,500 43,250 44,750 49,000 43,250 37% 56% -12%Building Completion Services 42,750 38,500 39,750 42,250 45,000 38,750 -9% 5% -14%Other Construction Services 15,250 18,000 18,500 17,000 23,000 24,250 59% 51% 5%Total 172,250 188,750 212,750 224,250 231,000 220,750 28% 34% -4%Rest of Australia Number Change
2004/05 to 2004/05 to 2008-09 to 2004-05 2005-06 2006-07 2007-08 2008-09 2009-10 2009/10 2008-09 2009-10
Residential Building Construction 49,750 52,750 48,250 61,500 61,500 62,500 26% 24% 2%Non-Residential Building Construction 28,750 30,250 30,250 32,250 38,500 24,750 -14% 34% -36%Heavy and Civil Engineering Construction 36,000 37,750 45,750 40,500 48,000 48,000 33% 33% 0%Land Development and Site Preparation Services 31,000 31,750 37,000 36,000 37,750 36,750 19% 22% -3%Building Structure Services 62,750 61,750 61,000 64,000 65,750 62,750 0% 5% -5%Building Installation Services 125,500 137,250 155,250 157,250 158,000 172,750 38% 26% 9%Building Completion Services 123,000 127,000 129,500 135,750 139,750 129,000 5% 14% -8%Other Construction Services 58,000 64,750 70,750 63,750 58,750 64,250 11% 1% 9%Total 606,000 630,000 677,750 689,750 712,750 721,000 19% 18% 1%Source: ABS 6291.0.55.001 data cube, construction ANZSIC06 only. Note: * Employment = employees + own account workers# Annual figure calculated as the average of four quarters of data February, May, August and November.
Total includes sectors where there are no further details (n.f.d.) but these sectors are not displayed in table.
Construction industry report PN11424 Page 29 of 80
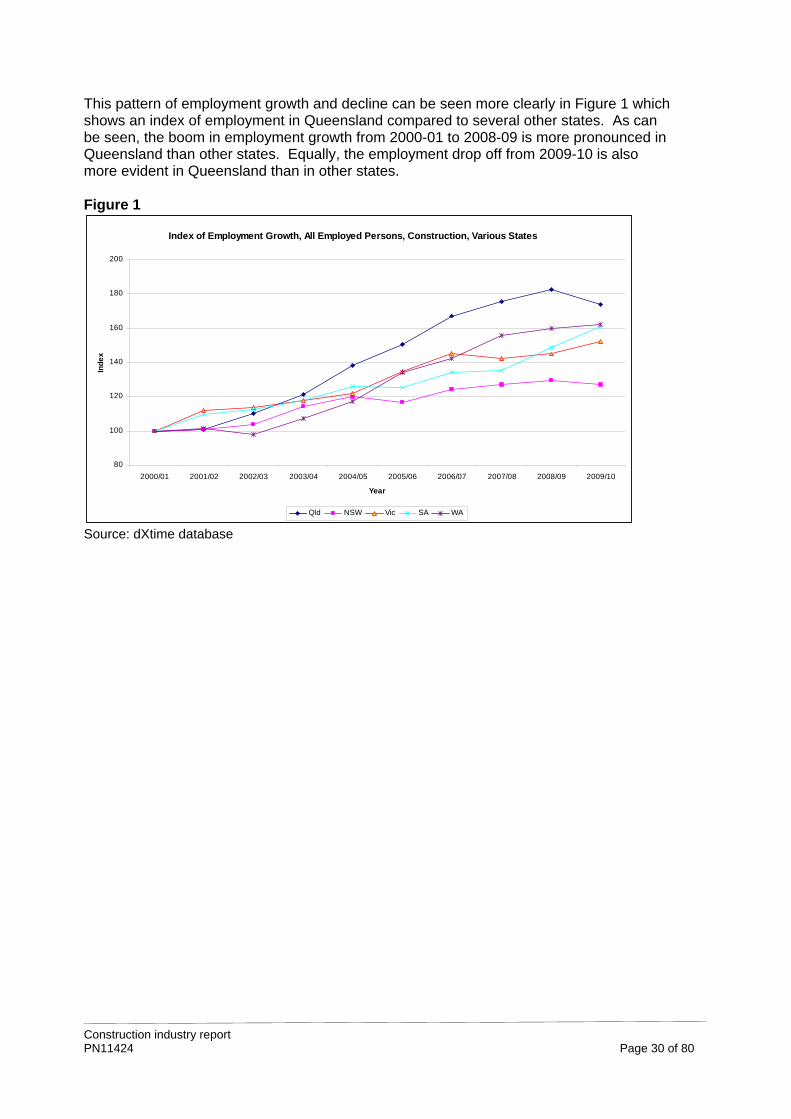
This pattern of employment growth and decline can be seen more clearly in Figure 1 which shows an index of employment in Queensland compared to several other states. As can be seen, the boom in employment growth from 2000-01 to 2008-09 is more pronounced in Queensland than other states. Equally, the employment drop off from 2009-10 is also more evident in Queensland than in other states. Figure 1
Index of Employment Growth, All Employed Persons, Construction, Various States
80
100
120
140
160
180
200
2000/01 2001/02 2002/03 2003/04 2004/05 2005/06 2006/07 2007/08 2008/09 2009/10
Year
Ind
ex
Qld NSW Vic SA WA
Source: dXtime database
Construction industry report PN11424 Page 30 of 80
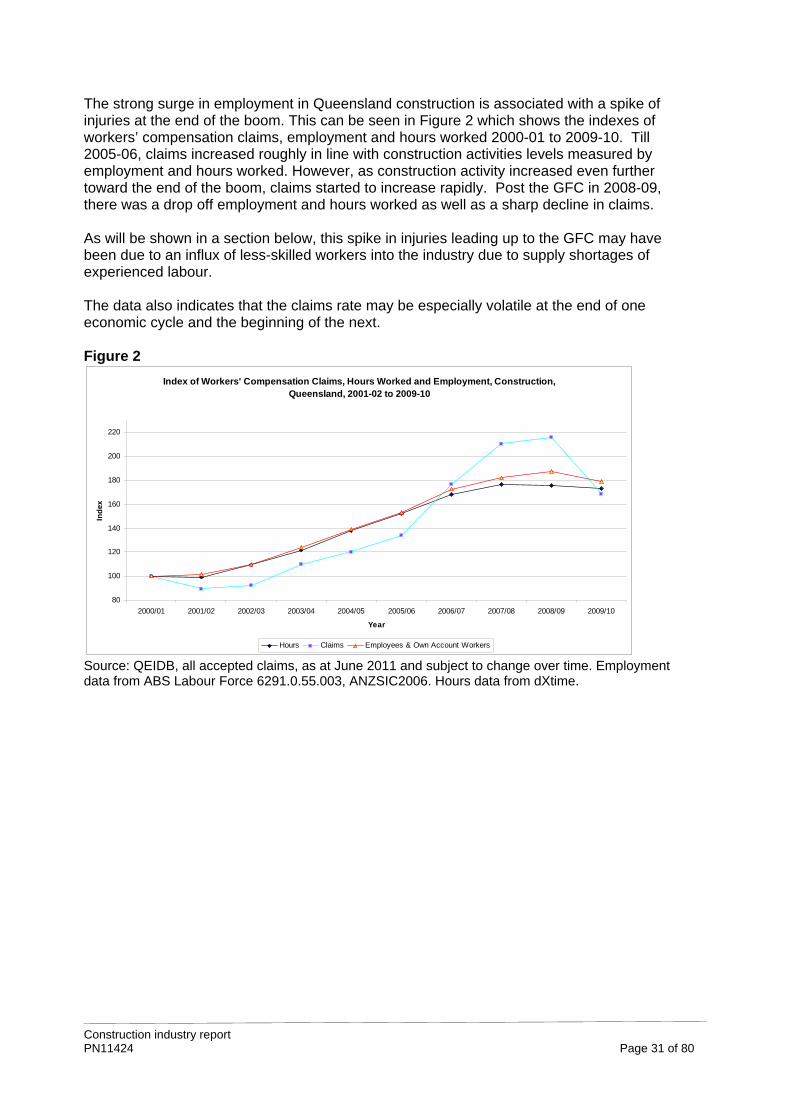
The strong surge in employment in Queensland construction is associated with a spike of injuries at the end of the boom. This can be seen in Figure 2 which shows the indexes of workers’ compensation claims, employment and hours worked 2000-01 to 2009-10. Till 2005-06, claims increased roughly in line with construction activities levels measured by employment and hours worked. However, as construction activity increased even further toward the end of the boom, claims started to increase rapidly. Post the GFC in 2008-09, there was a drop off employment and hours worked as well as a sharp decline in claims. As will be shown in a section below, this spike in injuries leading up to the GFC may have been due to an influx of less-skilled workers into the industry due to supply shortages of experienced labour. The data also indicates that the claims rate may be especially volatile at the end of one economic cycle and the beginning of the next. Figure 2
Index of Workers' Compensation Claims, Hours Worked and Employment, Construction, Queensland, 2001-02 to 2009-10
80
100
120
140
160
180
200
220
2000/01 2001/02 2002/03 2003/04 2004/05 2005/06 2006/07 2007/08 2008/09 2009/10
Year
Ind
ex
Hours Claims Employees & Own Account Workers
Source: QEIDB, all accepted claims, as at June 2011 and subject to change over time. Employment data from ABS Labour Force 6291.0.55.003, ANZSIC2006. Hours data from dXtime.
Construction industry report PN11424 Page 31 of 80
Declining employment in construction may lead to a further decline in the claim rate Given the preceding discussion, it is possible that workers’ compensation claim rate may ease further in the short term if construction employment in Queensland continues to decline. Construction activity in Queensland declined 3.5 per cent in 2009-10 due to reduced activity in residential building construction (-4.1 per cent) and engineering construction (-5.2 per cent) (NIEIR, 2011).3 Queensland construction activity is expected to decline 1.4 per cent in 2010-11 before increasing 3.3 per cent in 2011-12. Private dwelling construction at the end of 2010 was 11 per cent below the level of a year earlier and 28 per cent below the pre-GFC peak in the third quarter in 2008. The National Institute of Economic and Industry Research (NIEIR) forecast that residential construction activity will decline 3.0 per cent for 2010-11 and rise 3.7 per cent in 2011-12. In the non-residential sector, activity increased by 2.3 per cent in 2009-10 due to public stimulus measures such as the $16.2 billion Building the Education Revolution (BER) program. In 2009-10, public non-residential activity increased by 79 per cent whereas private sector building activity declined by 27 per cent. The effect of the public sector stimulus is forecast to increase non-residential activity 4.9 per cent in 2010-11 before declining 13.8 per cent in 2011-12 as the stimulus measures are wound back. Engineering construction work declined 5.2 per cent in 2009-10 is forecast to decline 2.7 per cent in 20010-11 and decline further by 0.5 per cent in 2011-12.
3 National Institute of Economic and Industry Research (2011) Queensland and Queensland Region Construction Activity: Quarterly Projection Update – March Quarter 2011, report prepared for the Queensland Department of Public Works, April 2011.
Construction industry report PN11424 Page 32 of 80
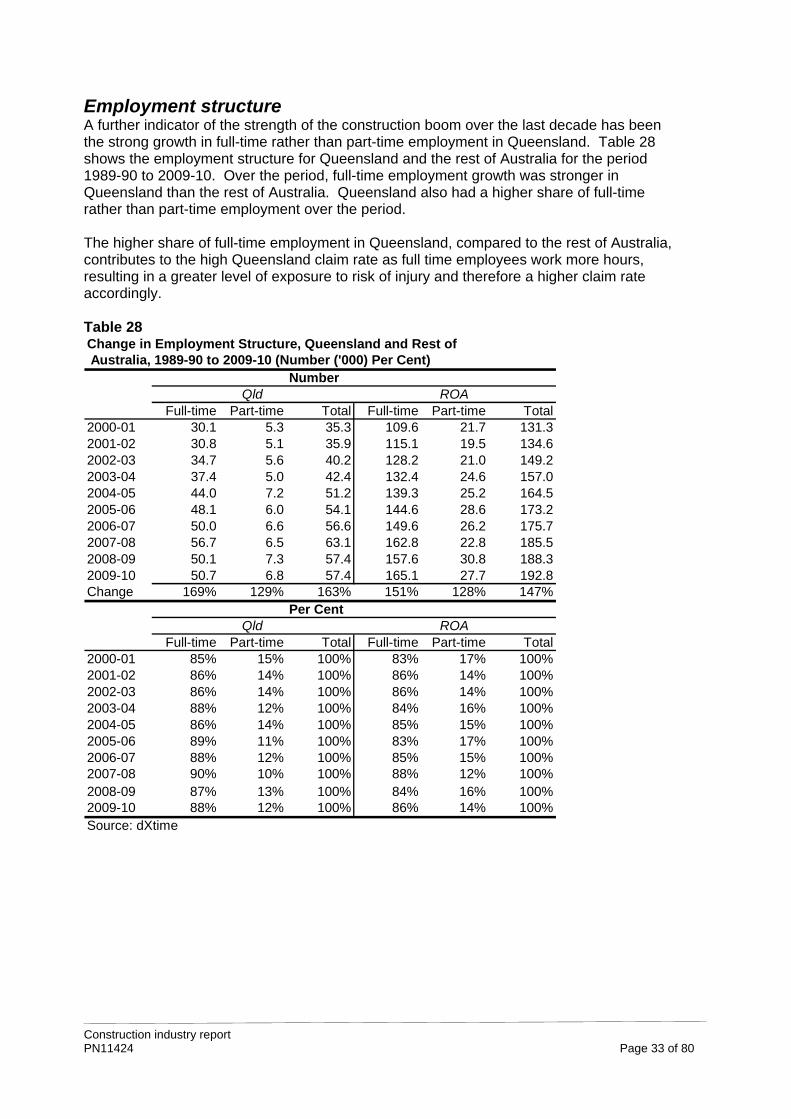
Employment structure A further indicator of the strength of the construction boom over the last decade has been the strong growth in full-time rather than part-time employment in Queensland. Table 28 shows the employment structure for Queensland and the rest of Australia for the period 1989-90 to 2009-10. Over the period, full-time employment growth was stronger in Queensland than the rest of Australia. Queensland also had a higher share of full-time rather than part-time employment over the period. The higher share of full-time employment in Queensland, compared to the rest of Australia, contributes to the high Queensland claim rate as full time employees work more hours, resulting in a greater level of exposure to risk of injury and therefore a higher claim rate accordingly. Table 28 Change in Employment Structure, Queensland and Rest of Australia, 1989-90 to 2009-10 (Number ('000) Per Cent)
NumberQld ROA
Full-time Part-time Total Full-time Part-time Total2000-01 30.1 5.3 35.3 109.6 21.7 131.32001-02 30.8 5.1 35.9 115.1 19.5 134.62002-03 34.7 5.6 40.2 128.2 21.0 149.22003-04 37.4 5.0 42.4 132.4 24.6 157.02004-05 44.0 7.2 51.2 139.3 25.2 164.52005-06 48.1 6.0 54.1 144.6 28.6 173.22006-07 50.0 6.6 56.6 149.6 26.2 175.72007-08 56.7 6.5 63.1 162.8 22.8 185.52008-09 50.1 7.3 57.4 157.6 30.8 188.32009-10 50.7 6.8 57.4 165.1 27.7 192.8Change 169% 129% 163% 151% 128% 147%
Per CentQld ROA
Full-time Part-time Total Full-time Part-time Total2000-01 85% 15% 100% 83% 17% 100%2001-02 86% 14% 100% 86% 14% 100%2002-03 86% 14% 100% 86% 14% 100%2003-04 88% 12% 100% 84% 16% 100%2004-05 86% 14% 100% 85% 15% 100%2005-06 89% 11% 100% 83% 17% 100%2006-07 88% 12% 100% 85% 15% 100%2007-08 90% 10% 100% 88% 12% 100%2008-09 87% 13% 100% 84% 16% 100%2009-10 88% 12% 100% 86% 14% 100%Source: dXtime
Construction industry report PN11424 Page 33 of 80
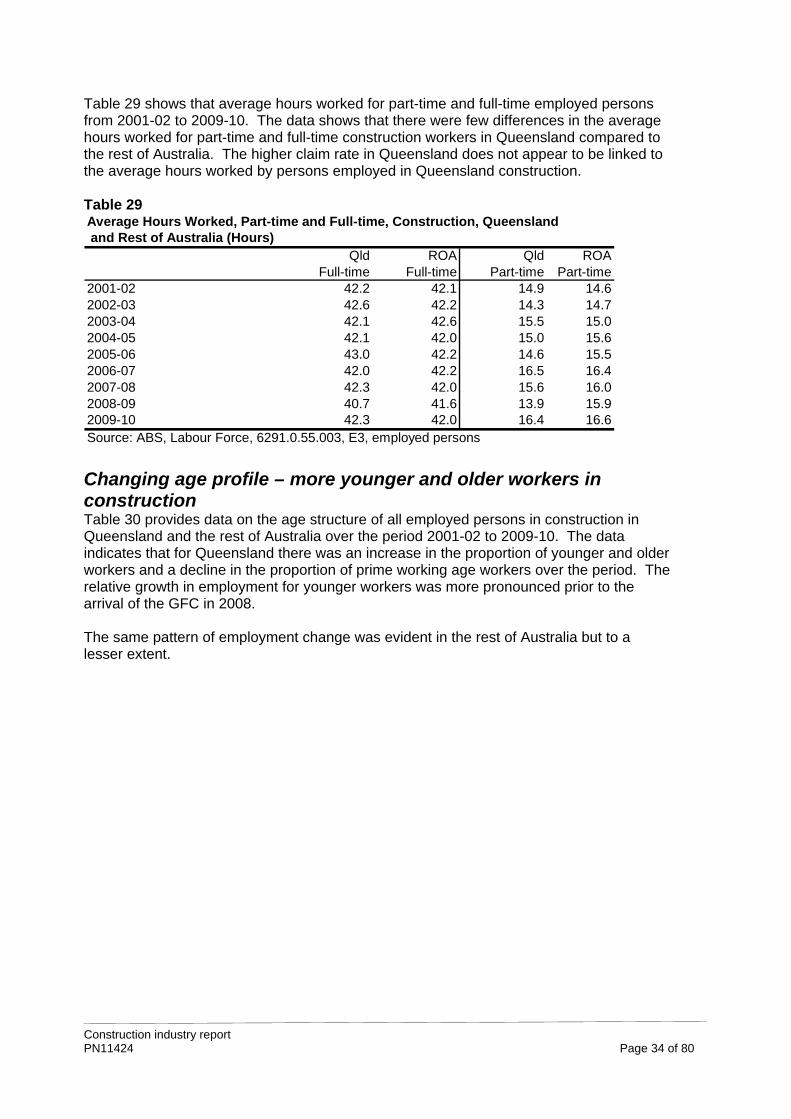
Table 29 shows that average hours worked for part-time and full-time employed persons from 2001-02 to 2009-10. The data shows that there were few differences in the average hours worked for part-time and full-time construction workers in Queensland compared to the rest of Australia. The higher claim rate in Queensland does not appear to be linked to the average hours worked by persons employed in Queensland construction. Table 29 Average Hours Worked, Part-time and Full-time, Construction, Queensland and Rest of Australia (Hours)
Qld ROA Qld ROAFull-time Full-time Part-time Part-time
2001-02 42.2 42.1 14.9 14.62002-03 42.6 42.2 14.3 14.72003-04 42.1 42.6 15.5 15.02004-05 42.1 42.0 15.0 15.62005-06 43.0 42.2 14.6 15.52006-07 42.0 42.2 16.5 16.42007-08 42.3 42.0 15.6 16.02008-09 40.7 41.6 13.9 15.92009-10 42.3 42.0 16.4 16.6Source: ABS, Labour Force, 6291.0.55.003, E3, employed persons Changing age profile – more younger and older workers in construction Table 30 provides data on the age structure of all employed persons in construction in Queensland and the rest of Australia over the period 2001-02 to 2009-10. The data indicates that for Queensland there was an increase in the proportion of younger and older workers and a decline in the proportion of prime working age workers over the period. The relative growth in employment for younger workers was more pronounced prior to the arrival of the GFC in 2008. The same pattern of employment change was evident in the rest of Australia but to a lesser extent.
Construction industry report PN11424 Page 34 of 80
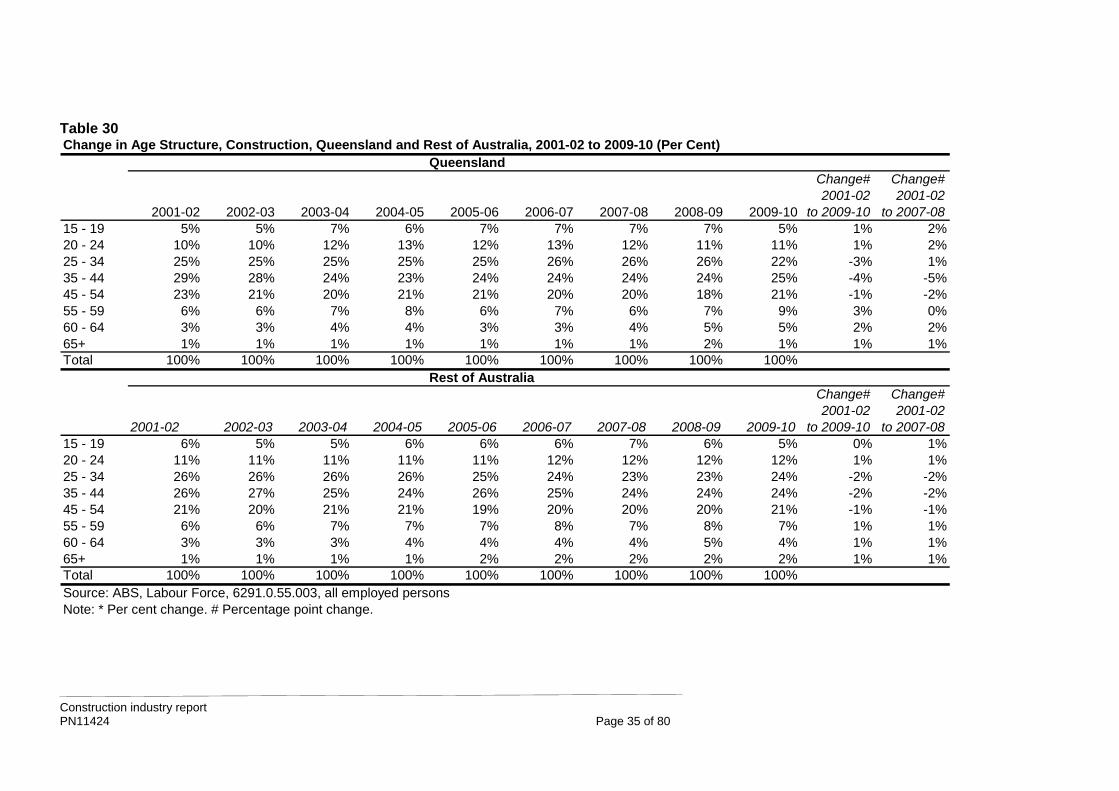
Table 30 Change in Age Structure, Construction, Queensland and Rest of Australia, 2001-02 to 2009-10 (Per Cent)
QueenslandChange# Change#2001-02 2001-02
2001-02 2002-03 2003-04 2004-05 2005-06 2006-07 2007-08 2008-09 2009-10 to 2009-10 to 2007-0815 - 19 5% 5% 7% 6% 7% 7% 7% 7% 5% 1% 2%20 - 24 10% 10% 12% 13% 12% 13% 12% 11% 11% 1% 2%25 - 34 25% 25% 25% 25% 25% 26% 26% 26% 22% -3% 1%35 - 44 29% 28% 24% 23% 24% 24% 24% 24% 25% -4% -5%45 - 54 23% 21% 20% 21% 21% 20% 20% 18% 21% -1% -2%55 - 59 6% 6% 7% 8% 6% 7% 6% 7% 9% 3% 0%60 - 64 3% 3% 4% 4% 3% 3% 4% 5% 5% 2% 2%65+ 1% 1% 1% 1% 1% 1% 1% 2% 1% 1% 1%Total 100% 100% 100% 100% 100% 100% 100% 100% 100%
Rest of Australia Change# Change#2001-02 2001-02
2001-02 2002-03 2003-04 2004-05 2005-06 2006-07 2007-08 2008-09 2009-10 to 2009-10 to 2007-0815 - 19 6% 5% 5% 6% 6% 6% 7% 6% 5% 0% 1%20 - 24 11% 11% 11% 11% 11% 12% 12% 12% 12% 1% 1%25 - 34 26% 26% 26% 26% 25% 24% 23% 23% 24% -2% -2%35 - 44 26% 27% 25% 24% 26% 25% 24% 24% 24% -2% -2%45 - 54 21% 20% 21% 21% 19% 20% 20% 20% 21% -1% -1%55 - 59 6% 6% 7% 7% 7% 8% 7% 8% 7% 1% 1%60 - 64 3% 3% 3% 4% 4% 4% 4% 5% 4% 1% 1%65+ 1% 1% 1% 1% 2% 2% 2% 2% 2% 1% 1%Total 100% 100% 100% 100% 100% 100% 100% 100% 100%Source: ABS, Labour Force, 6291.0.55.003, all employed personsNote: * Per cent change. # Percentage point change.
Construction industry report PN11424 Page 35 of 80

Claim rate by age The growth of younger and older workers in Queensland construction is not likely to have affected significantly the growth in the industry claim rate over recent years due to two contradictory effects. On the one hand, young workers in construction tend to have a higher claim rate than older workers (see Tables 31 and 32). This is particularly evident for the 20 to 24 year age group. The growth in the proportion of young workers is therefore likely to have contributed to an increase in the industry claim rate. Conversely, older workers are less likely to be injured at work. Consequently, the growth in older workers is likely to have reduced the industry claim rate. Overall, the industry claim rate is not likely to have been influenced significantly by the growth in the proportion of older and younger workers over the period. Table 31 shows data based on the workplace where the incident occurred. Table 32 shows data based on the employer’s industry. Both tables show the same pattern. It is also noteworthy that over the period the claim rate for younger workers to 34 years of age increased quite markedly. These data highlights the importance of paying special attention to the safety of younger workers because as their share of employment increases, so too does their likelihood of getting injured.
Construction industry report PN11424 Page 36 of 80
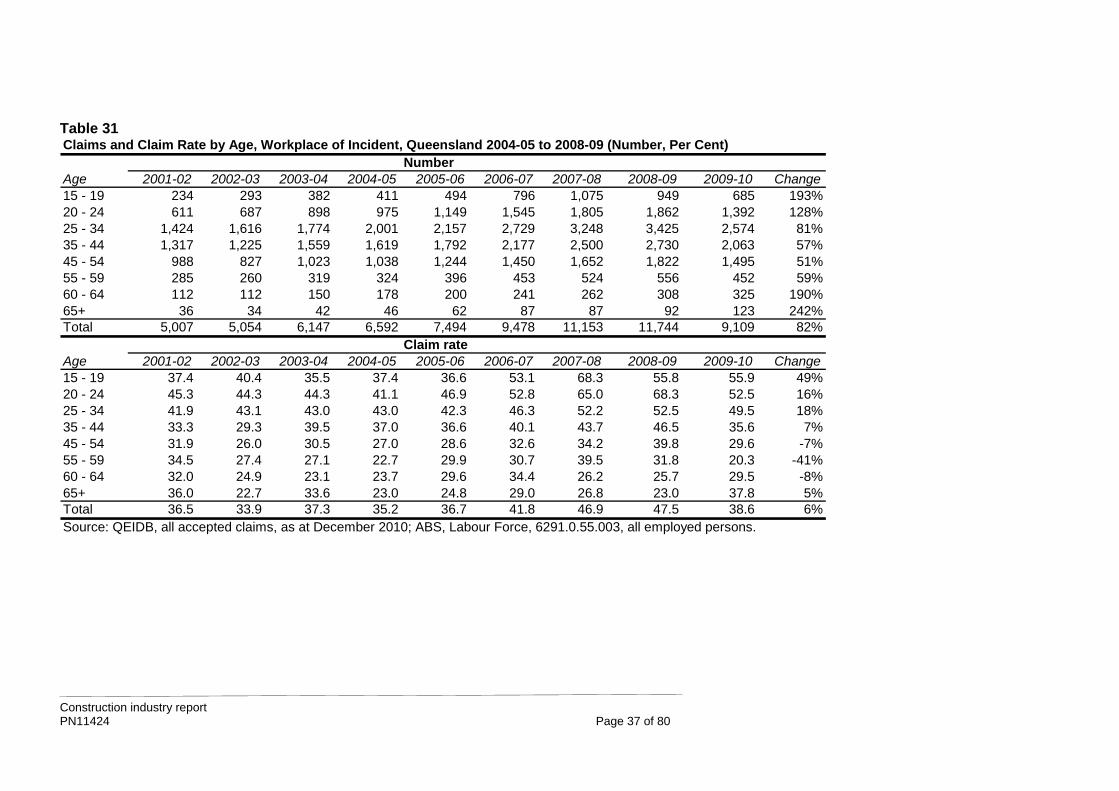
Table 31 Claims and Claim Rate by Age, Workplace of Incident, Queensland 2004-05 to 2008-09 (Number, Per Cent)
NumberAge 2001-02 2002-03 2003-04 2004-05 2005-06 2006-07 2007-08 2008-09 2009-10 Change15 - 19 234 293 382 411 494 796 1,075 949 685 193%20 - 24 611 687 898 975 1,149 1,545 1,805 1,862 1,392 128%25 - 34 1,424 1,616 1,774 2,001 2,157 2,729 3,248 3,425 2,574 81%35 - 44 1,317 1,225 1,559 1,619 1,792 2,177 2,500 2,730 2,063 57%45 - 54 988 827 1,023 1,038 1,244 1,450 1,652 1,822 1,495 51%55 - 59 285 260 319 324 396 453 524 556 452 59%60 - 64 112 112 150 178 200 241 262 308 325 190%65+ 36 34 42 46 62 87 87 92 123 242%Total 5,007 5,054 6,147 6,592 7,494 9,478 11,153 11,744 9,109 82%
Claim rateAge 2001-02 2002-03 2003-04 2004-05 2005-06 2006-07 2007-08 2008-09 2009-10 Change15 - 19 37.4 40.4 35.5 37.4 36.6 53.1 68.3 55.8 55.9 49%20 - 24 45.3 44.3 44.3 41.1 46.9 52.8 65.0 68.3 52.5 16%25 - 34 41.9 43.1 43.0 43.0 42.3 46.3 52.2 52.5 49.5 18%35 - 44 33.3 29.3 39.5 37.0 36.6 40.1 43.7 46.5 35.6 7%45 - 54 31.9 26.0 30.5 27.0 28.6 32.6 34.2 39.8 29.6 -7%55 - 59 34.5 27.4 27.1 22.7 29.9 30.7 39.5 31.8 20.3 -41%60 - 64 32.0 24.9 23.1 23.7 29.6 34.4 26.2 25.7 29.5 -8%65+ 36.0 22.7 33.6 23.0 24.8 29.0 26.8 23.0 37.8 5%Total 36.5 33.9 37.3 35.2 36.7 41.8 46.9 47.5 38.6 6%Source: QEIDB, all accepted claims, as at December 2010; ABS, Labour Force, 6291.0.55.003, all employed persons.
Construction industry report PN11424 Page 37 of 80
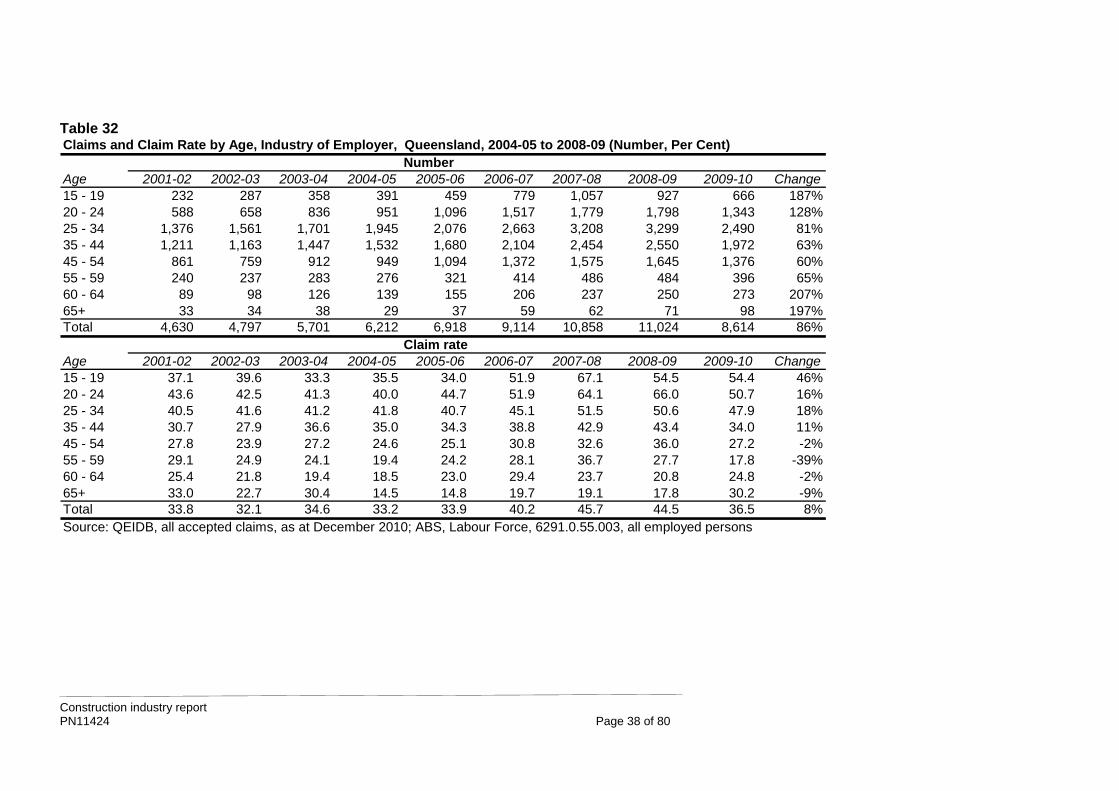
Construction industry report PN11424 Page 38 of 80
Table 32 Claims and Claim Rate by Age, Industry of Employer, Queensland, 2004-05 to 2008-09 (Number, Per Cent)
NumberAge 2001-02 2002-03 2003-04 2004-05 2005-06 2006-07 2007-08 2008-09 2009-10 Change15 - 19 232 287 358 391 459 779 1,057 927 666 187%20 - 24 588 658 836 951 1,096 1,517 1,779 1,798 1,343 128%25 - 34 1,376 1,561 1,701 1,945 2,076 2,663 3,208 3,299 2,490 81%35 - 44 1,211 1,163 1,447 1,532 1,680 2,104 2,454 2,550 1,972 63%45 - 54 861 759 912 949 1,094 1,372 1,575 1,645 1,376 60%55 - 59 240 237 283 276 321 414 486 484 396 65%60 - 64 89 98 126 139 155 206 237 250 273 207%65+ 33 34 38 29 37 59 62 71 98 197%Total 4,630 4,797 5,701 6,212 6,918 9,114 10,858 11,024 8,614 86%
Claim rateAge 2001-02 2002-03 2003-04 2004-05 2005-06 2006-07 2007-08 2008-09 2009-10 Change15 - 19 37.1 39.6 33.3 35.5 34.0 51.9 67.1 54.5 54.4 46%20 - 24 43.6 42.5 41.3 40.0 44.7 51.9 64.1 66.0 50.7 16%25 - 34 40.5 41.6 41.2 41.8 40.7 45.1 51.5 50.6 47.9 18%35 - 44 30.7 27.9 36.6 35.0 34.3 38.8 42.9 43.4 34.0 11%45 - 54 27.8 23.9 27.2 24.6 25.1 30.8 32.6 36.0 27.2 -2%55 - 59 29.1 24.9 24.1 19.4 24.2 28.1 36.7 27.7 17.8 -39%60 - 64 25.4 21.8 19.4 18.5 23.0 29.4 23.7 20.8 24.8 -2%65+ 33.0 22.7 30.4 14.5 14.8 19.7 19.1 17.8 30.2 -9%Total 33.8 32.1 34.6 33.2 33.9 40.2 45.7 44.5 36.5 8%Source: QEIDB, all accepted claims, as at December 2010; ABS, Labour Force, 6291.0.55.003, all employed persons
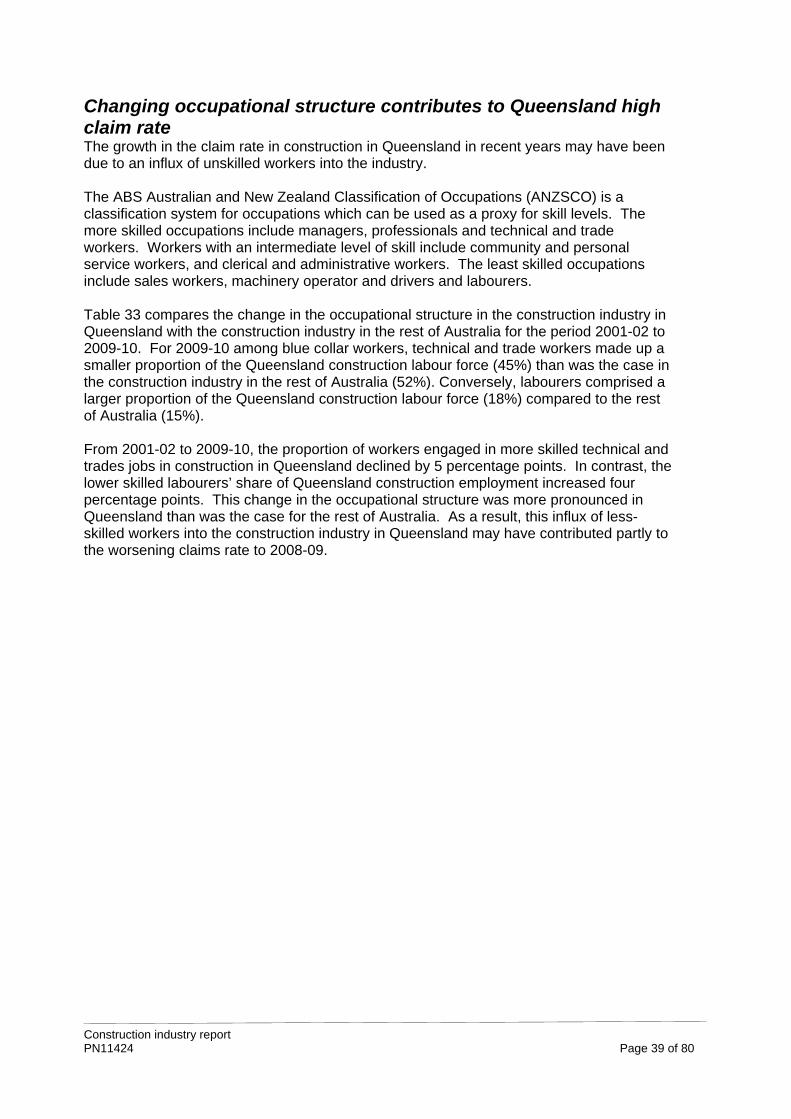
Changing occupational structure contributes to Queensland high claim rate The growth in the claim rate in construction in Queensland in recent years may have been due to an influx of unskilled workers into the industry. The ABS Australian and New Zealand Classification of Occupations (ANZSCO) is a classification system for occupations which can be used as a proxy for skill levels. The more skilled occupations include managers, professionals and technical and trade workers. Workers with an intermediate level of skill include community and personal service workers, and clerical and administrative workers. The least skilled occupations include sales workers, machinery operator and drivers and labourers. Table 33 compares the change in the occupational structure in the construction industry in Queensland with the construction industry in the rest of Australia for the period 2001-02 to 2009-10. For 2009-10 among blue collar workers, technical and trade workers made up a smaller proportion of the Queensland construction labour force (45%) than was the case in the construction industry in the rest of Australia (52%). Conversely, labourers comprised a larger proportion of the Queensland construction labour force (18%) compared to the rest of Australia (15%). From 2001-02 to 2009-10, the proportion of workers engaged in more skilled technical and trades jobs in construction in Queensland declined by 5 percentage points. In contrast, the lower skilled labourers’ share of Queensland construction employment increased four percentage points. This change in the occupational structure was more pronounced in Queensland than was the case for the rest of Australia. As a result, this influx of less-skilled workers into the construction industry in Queensland may have contributed partly to the worsening claims rate to 2008-09.
Construction industry report PN11424 Page 39 of 80
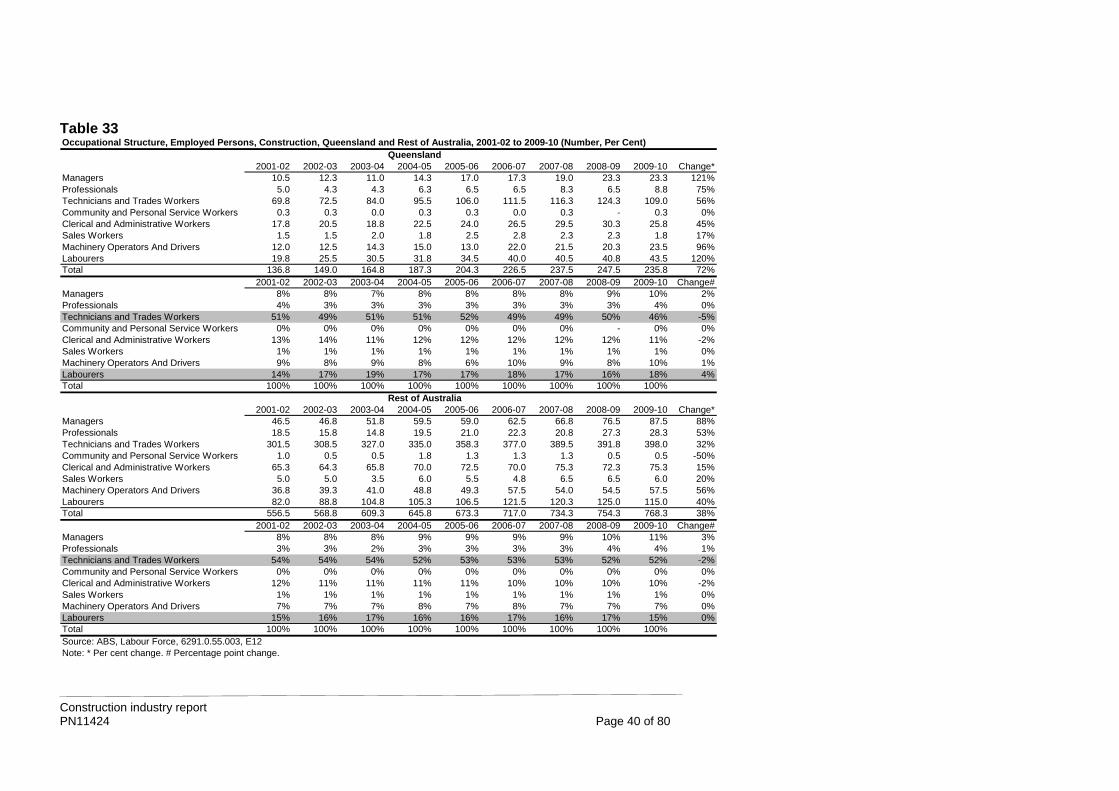
Table 33 Occupational Structure, Employed Persons, Construction, Queensland and Rest of Australia, 2001-02 to 2009-10 (Number, Per Cent)
Queensland 2001-02 2002-03 2003-04 2004-05 2005-06 2006-07 2007-08 2008-09 2009-10 Change*
Managers 10.5 12.3 11.0 14.3 17.0 17.3 19.0 23.3 23.3 121%Professionals 5.0 4.3 4.3 6.3 6.5 6.5 8.3 6.5 8.8 75%Technicians and Trades Workers 69.8 72.5 84.0 95.5 106.0 111.5 116.3 124.3 109.0 56%Community and Personal Service Workers 0.3 0.3 0.0 0.3 0.3 0.0 0.3 - 0.3 0%Clerical and Administrative Workers 17.8 20.5 18.8 22.5 24.0 26.5 29.5 30.3 25.8 45%Sales Workers 1.5 1.5 2.0 1.8 2.5 2.8 2.3 2.3 1.8 17%Machinery Operators And Drivers 12.0 12.5 14.3 15.0 13.0 22.0 21.5 20.3 23.5 96%Labourers 19.8 25.5 30.5 31.8 34.5 40.0 40.5 40.8 43.5 120%Total 136.8 149.0 164.8 187.3 204.3 226.5 237.5 247.5 235.8 72%
2001-02 2002-03 2003-04 2004-05 2005-06 2006-07 2007-08 2008-09 2009-10 Change#Managers 8% 8% 7% 8% 8% 8% 8% 9% 10% 2%Professionals 4% 3% 3% 3% 3% 3% 3% 3% 4% 0%Technicians and Trades Workers 51% 49% 51% 51% 52% 49% 49% 50% 46% -5%Community and Personal Service Workers 0% 0% 0% 0% 0% 0% 0% - 0% 0%Clerical and Administrative Workers 13% 14% 11% 12% 12% 12% 12% 12% 11% -2%Sales Workers 1% 1% 1% 1% 1% 1% 1% 1% 1% 0%Machinery Operators And Drivers 9% 8% 9% 8% 6% 10% 9% 8% 10% 1%Labourers 14% 17% 19% 17% 17% 18% 17% 16% 18% 4%Total 100% 100% 100% 100% 100% 100% 100% 100% 100%
Rest of Australia 2001-02 2002-03 2003-04 2004-05 2005-06 2006-07 2007-08 2008-09 2009-10 Change*
Managers 46.5 46.8 51.8 59.5 59.0 62.5 66.8 76.5 87.5 88%Professionals 18.5 15.8 14.8 19.5 21.0 22.3 20.8 27.3 28.3 53%Technicians and Trades Workers 301.5 308.5 327.0 335.0 358.3 377.0 389.5 391.8 398.0 32%Community and Personal Service Workers 1.0 0.5 0.5 1.8 1.3 1.3 1.3 0.5 0.5 -50%Clerical and Administrative Workers 65.3 64.3 65.8 70.0 72.5 70.0 75.3 72.3 75.3 15%Sales Workers 5.0 5.0 3.5 6.0 5.5 4.8 6.5 6.5 6.0 20%Machinery Operators And Drivers 36.8 39.3 41.0 48.8 49.3 57.5 54.0 54.5 57.5 56%Labourers 82.0 88.8 104.8 105.3 106.5 121.5 120.3 125.0 115.0 40%Total 556.5 568.8 609.3 645.8 673.3 717.0 734.3 754.3 768.3 38%
2001-02 2002-03 2003-04 2004-05 2005-06 2006-07 2007-08 2008-09 2009-10 Change#Managers 8% 8% 8% 9% 9% 9% 9% 10% 11% 3%Professionals 3% 3% 2% 3% 3% 3% 3% 4% 4% 1%Technicians and Trades Workers 54% 54% 54% 52% 53% 53% 53% 52% 52% -2%Community and Personal Service Workers 0% 0% 0% 0% 0% 0% 0% 0% 0% 0%Clerical and Administrative Workers 12% 11% 11% 11% 11% 10% 10% 10% 10% -2%Sales Workers 1% 1% 1% 1% 1% 1% 1% 1% 1% 0%Machinery Operators And Drivers 7% 7% 7% 8% 7% 8% 7% 7% 7% 0%Labourers 15% 16% 17% 16% 16% 17% 16% 17% 15% 0%Total 100% 100% 100% 100% 100% 100% 100% 100% 100%Source: ABS, Labour Force, 6291.0.55.003, E12Note: * Per cent change. # Percentage point change.
Construction industry report PN11424 Page 40 of 80
Duration of employment Further evidence of decline in the level of experience of construction workers in Queensland compared to the rest of Australia can be seen in Table 34. As shown, from 2001 to 2004, the proportion of recent entrants (with less than two years experience) in the construction industry grew from 39 to 53 per cent in Queensland and from 41 to 46 per cent in the rest of Australia. Conversely, the proportion of experienced workers with five or more years of work duration declined from 39 to 30 per cent in Queensland and 30 to 34 per cent in the rest of Australia. As can be seen in Table 34, the proportion of new entrants was consistently higher in Queensland construction than the rest of Australia from 2004 to 2010. Conversely, compared to the rest of Australia, Queensland had a lower proportion of workers with more than five years work experience for each year 2004 to 2010 shown in Table 34. Table 34 Duration of Employment, Construction, Qld and Rest of Australia, 2001 to 2010 (per cent)
Queensland Rest of Australia<2 years 2-5 years 5+ years <2 years 2-5 years 5+ years
2001 39% 61% 39% 41% 61% 39%2004 53% 70% 30% 46% 66% 34%2006 53% 69% 31% 43% 62% 38%2007 49% 68% 32% 43% 63% 37%2008 48% 66% 34% 42% 61% 39%2009 46% 65% 35% 40% 61% 39%2010 44% 69% 31% 42% 63% 37%
Source: ABS, 63590, Forms of EmploymentNote: Qld data has a relative standard error of 25% to 50% and should be used with caution
Educational qualifications Table 35 compares the formal post-school educational qualification of construction workers in Queensland and the rest of Australia using census 2006 data. Census data suggests that a slightly higher proportion of construction workers in Queensland have no post school qualification compared to the rest of Australia. Similarly, a lower proportion of Queensland construction workers have diploma or better qualification compared to the rest of Australia. It will interesting to see if this slight education gap between construction workers in Queensland and the rest of Australia has widened or narrowed in the 2011 census.
Construction industry report PN11424 Page 41 of 80
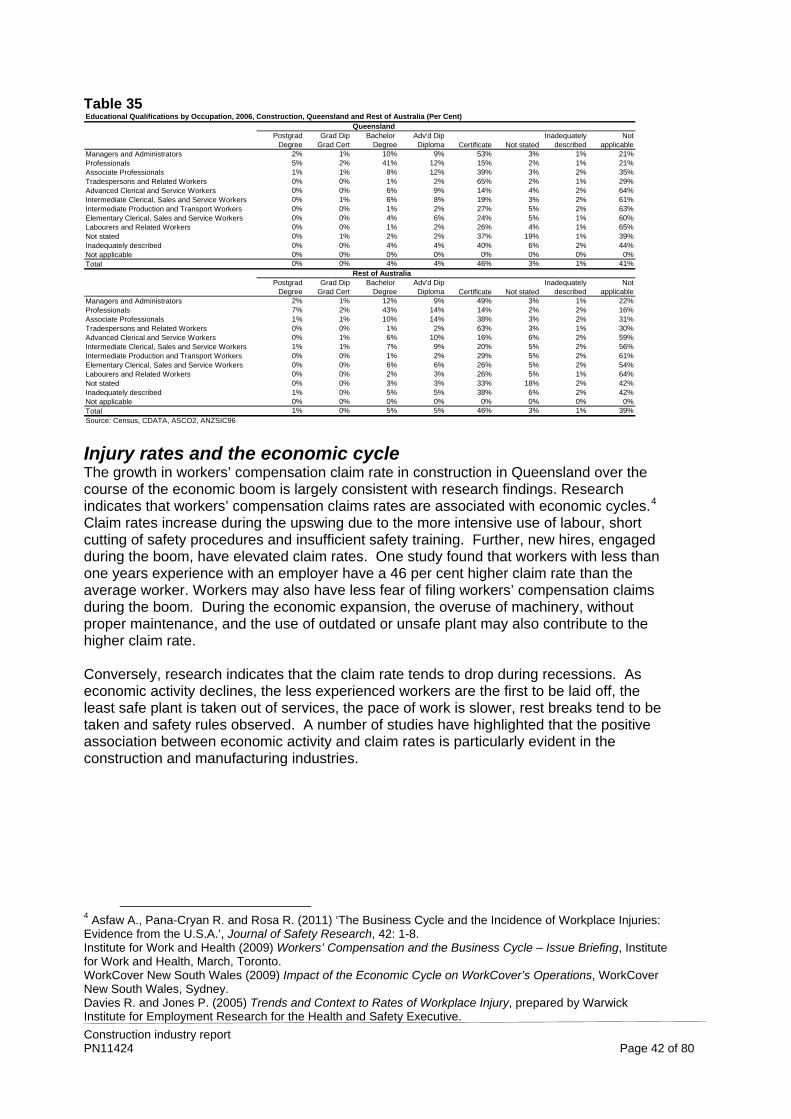
Table 35 Educational Qualifications by Occupation, 2006, Construction, Queensland and Rest of Australia (Per Cent)
Queensland Postgrad Grad Dip Bachelor Adv'd Dip Inadequately Not Degree Grad Cert Degree Diploma Certificate Not stated described applicable
Managers and Administrators 2% 1% 10% 9% 53% 3% 1% 21%Professionals 5% 2% 41% 12% 15% 2% 1% 21%Associate Professionals 1% 1% 8% 12% 39% 3% 2% 35%Tradespersons and Related Workers 0% 0% 1% 2% 65% 2% 1% 29%Advanced Clerical and Service Workers 0% 0% 6% 9% 14% 4% 2% 64%Intermediate Clerical, Sales and Service Workers 0% 1% 6% 8% 19% 3% 2% 61%Intermediate Production and Transport Workers 0% 0% 1% 2% 27% 5% 2% 63%Elementary Clerical, Sales and Service Workers 0% 0% 4% 6% 24% 5% 1% 60%Labourers and Related Workers 0% 0% 1% 2% 26% 4% 1% 65%Not stated 0% 1% 2% 2% 37% 19% 1% 39%Inadequately described 0% 0% 4% 4% 40% 6% 2% 44%Not applicable 0% 0% 0% 0% 0% 0% 0% 0%Total 0% 0% 4% 4% 46% 3% 1% 41%
Rest of Australia Postgrad Grad Dip Bachelor Adv'd Dip Inadequately Not Degree Grad Cert Degree Diploma Certificate Not stated described applicable
Managers and Administrators 2% 1% 12% 9% 49% 3% 1% 22%Professionals 7% 2% 43% 14% 14% 2% 2% 16%Associate Professionals 1% 1% 10% 14% 38% 3% 2% 31%Tradespersons and Related Workers 0% 0% 1% 2% 63% 3% 1% 30%Advanced Clerical and Service Workers 0% 1% 6% 10% 16% 6% 2% 59%Intermediate Clerical, Sales and Service Workers 1% 1% 7% 9% 20% 5% 2% 56%Intermediate Production and Transport Workers 0% 0% 1% 2% 29% 5% 2% 61%Elementary Clerical, Sales and Service Workers 0% 0% 6% 6% 26% 5% 2% 54%Labourers and Related Workers 0% 0% 2% 3% 26% 5% 1% 64%Not stated 0% 0% 3% 3% 33% 18% 2% 42%Inadequately described 1% 0% 5% 5% 38% 6% 2% 42%Not applicable 0% 0% 0% 0% 0% 0% 0% 0%Total 1% 0% 5% 5% 46% 3% 1% 39%Source: Census, CDATA, ASCO2, ANZSIC96
Injury rates and the economic cycle The growth in workers’ compensation claim rate in construction in Queensland over the course of the economic boom is largely consistent with research findings. Research indicates that workers’ compensation claims rates are associated with economic cycles.4 Claim rates increase during the upswing due to the more intensive use of labour, short cutting of safety procedures and insufficient safety training. Further, new hires, engaged during the boom, have elevated claim rates. One study found that workers with less than one years experience with an employer have a 46 per cent higher claim rate than the average worker. Workers may also have less fear of filing workers’ compensation claims during the boom. During the economic expansion, the overuse of machinery, without proper maintenance, and the use of outdated or unsafe plant may also contribute to the higher claim rate. Conversely, research indicates that the claim rate tends to drop during recessions. As economic activity declines, the less experienced workers are the first to be laid off, the least safe plant is taken out of services, the pace of work is slower, rest breaks tend to be taken and safety rules observed. A number of studies have highlighted that the positive association between economic activity and claim rates is particularly evident in the construction and manufacturing industries.
4 Asfaw A., Pana-Cryan R. and Rosa R. (2011) ‘The Business Cycle and the Incidence of Workplace Injuries: Evidence from the U.S.A.’, Journal of Safety Research, 42: 1-8. Institute for Work and Health (2009) Workers’ Compensation and the Business Cycle – Issue Briefing, Institute for Work and Health, March, Toronto. WorkCover New South Wales (2009) Impact of the Economic Cycle on WorkCover’s Operations, WorkCover New South Wales, Sydney. Davies R. and Jones P. (2005) Trends and Context to Rates of Workplace Injury, prepared by Warwick Institute for Employment Research for the Health and Safety Executive. Construction industry report PN11424 Page 42 of 80
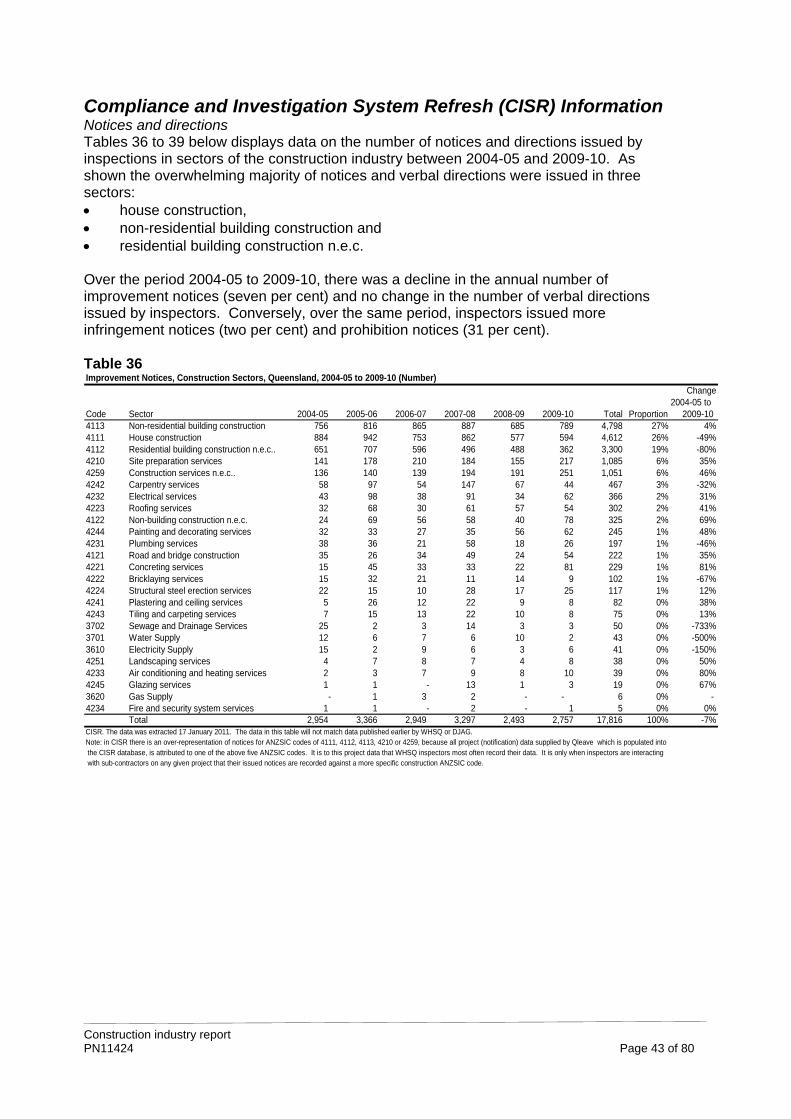
Compliance and Investigation System Refresh (CISR) Information Notices and directions Tables 36 to 39 below displays data on the number of notices and directions issued by inspections in sectors of the construction industry between 2004-05 and 2009-10. As shown the overwhelming majority of notices and verbal directions were issued in three sectors: house construction, non-residential building construction and residential building construction n.e.c. Over the period 2004-05 to 2009-10, there was a decline in the annual number of improvement notices (seven per cent) and no change in the number of verbal directions issued by inspectors. Conversely, over the same period, inspectors issued more infringement notices (two per cent) and prohibition notices (31 per cent). Table 36 Improvement Notices, Construction Sectors, Queensland, 2004-05 to 2009-10 (Number)
Change2004-05 to
Code Sector 2004-05 2005-06 2006-07 2007-08 2008-09 2009-10 Total Proportion 2009-104113 Non-residential building construction 756 816 865 887 685 789 4,798 27% 4%4111 House construction 884 942 753 862 577 594 4,612 26% -49%4112 Residential building construction n.e.c.. 651 707 596 496 488 362 3,300 19% -80%4210 Site preparation services 141 178 210 184 155 217 1,085 6% 35%4259 Construction services n.e.c.. 136 140 139 194 191 251 1,051 6% 46%4242 Carpentry services 58 97 54 147 67 44 467 3% -32%4232 Electrical services 43 98 38 91 34 62 366 2% 31%4223 Roofing services 32 68 30 61 57 54 302 2% 41%4122 Non-building construction n.e.c. 24 69 56 58 40 78 325 2% 69%4244 Painting and decorating services 32 33 27 35 56 62 245 1% 48%4231 Plumbing services 38 36 21 58 18 26 197 1% -46%4121 Road and bridge construction 35 26 34 49 24 54 222 1% 35%4221 Concreting services 15 45 33 33 22 81 229 1% 81%4222 Bricklaying services 15 32 21 11 14 9 102 1% -67%4224 Structural steel erection services 22 15 10 28 17 25 117 1% 12%4241 Plastering and ceiling services 5 26 12 22 9 8 82 0% 38%4243 Tiling and carpeting services 7 15 13 22 10 8 75 0% 13%3702 Sewage and Drainage Services 25 2 3 14 3 3 50 0% -733%3701 Water Supply 12 6 7 6 10 2 43 0% -500%3610 Electricity Supply 15 2 9 6 3 6 41 0% -150%4251 Landscaping services 4 7 8 7 4 8 38 0% 50%4233 Air conditioning and heating services 2 3 7 9 8 10 39 0% 80%4245 Glazing services 1 1 - 13 1 3 19 0% 67%3620 Gas Supply - 1 3 2 - - 6 0% - 4234 Fire and security system services 1 1 - 2 - 1 5 0% 0%
Total 2,954 3,366 2,949 3,297 2,493 2,757 17,816 100% -7%CISR. The data was extracted 17 January 2011. The data in this table will not match data published earlier by WHSQ or DJAG. Note: in CISR there is an over-representation of notices for ANZSIC codes of 4111, 4112, 4113, 4210 or 4259, because all project (notification) data supplied by Qleave which is populated into the CISR database, is attributed to one of the above five ANZSIC codes. It is to this project data that WHSQ inspectors most often record their data. It is only when inspectors are interacting with sub-contractors on any given project that their issued notices are recorded against a more specific construction ANZSIC code.
Construction industry report PN11424 Page 43 of 80
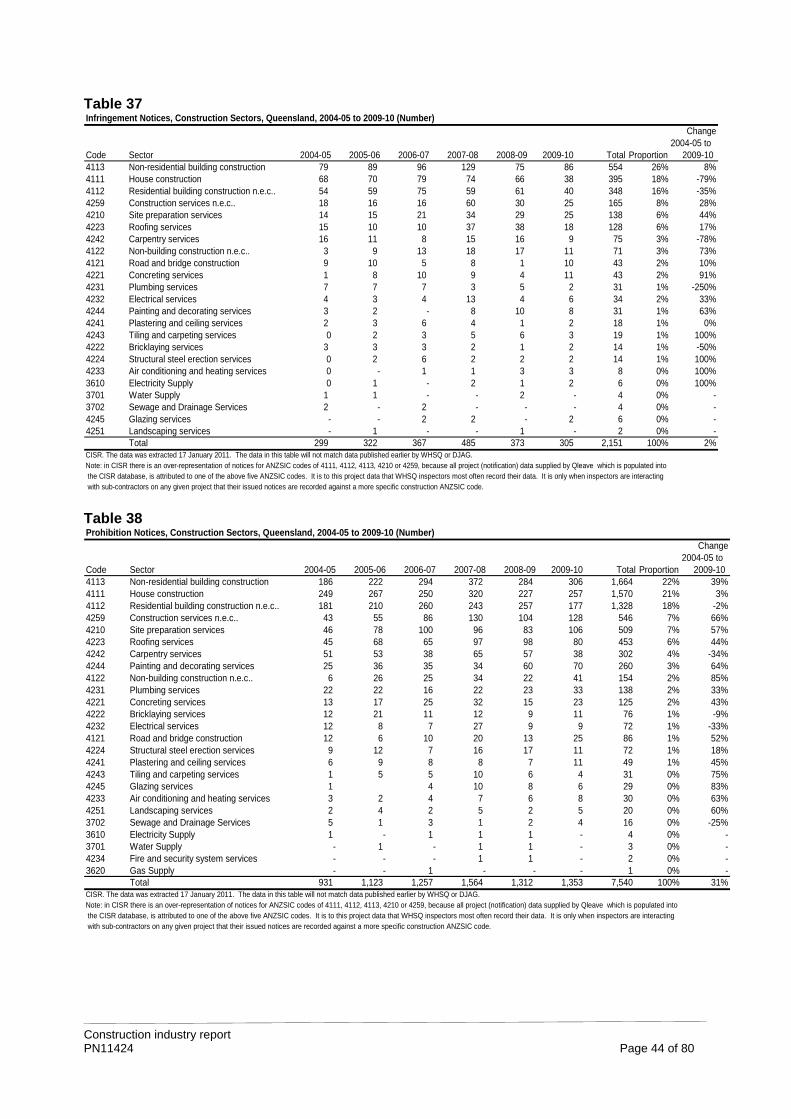
Table 37 Infringement Notices, Construction Sectors, Queensland, 2004-05 to 2009-10 (Number)
Change 2004-05 to Code Sector 2004-05 2005-06 2006-07 2007-08 2008-09 2009-10 Total Proportion 2009-104113 Non-residential building construction 79 89 96 129 75 86 554 26% 8%4111 House construction 68 70 79 74 66 38 395 18% -79%4112 Residential building construction n.e.c.. 54 59 75 59 61 40 348 16% -35%4259 Construction services n.e.c.. 18 16 16 60 30 25 165 8% 28%4210 Site preparation services 14 15 21 34 29 25 138 6% 44%4223 Roofing services 15 10 10 37 38 18 128 6% 17%4242 Carpentry services 16 11 8 15 16 9 75 3% -78%4122 Non-building construction n.e.c.. 3 9 13 18 17 11 71 3% 73%4121 Road and bridge construction 9 10 5 8 1 10 43 2% 10%4221 Concreting services 1 8 10 9 4 11 43 2% 91%4231 Plumbing services 7 7 7 3 5 2 31 1% -250%4232 Electrical services 4 3 4 13 4 6 34 2% 33%4244 Painting and decorating services 3 2 - 8 10 8 31 1% 63%4241 Plastering and ceiling services 2 3 6 4 1 2 18 1% 0%4243 Tiling and carpeting services 0 2 3 5 6 3 19 1% 100%4222 Bricklaying services 3 3 3 2 1 2 14 1% -50%4224 Structural steel erection services 0 2 6 2 2 2 14 1% 100%4233 Air conditioning and heating services 0 - 1 1 3 3 8 0% 100%3610 Electricity Supply 0 1 - 2 1 2 6 0% 100%3701 Water Supply 1 1 - - 2 - 4 0% -3702 Sewage and Drainage Services 2 - 2 - - - 4 0% -4245 Glazing services - - 2 2 - 2 6 0% -4251 Landscaping services - 1 - - 1 - 2 0% -
Total 299 322 367 485 373 305 2,151 100% 2%CISR. The data was extracted 17 January 2011. The data in this table will not match data published earlier by WHSQ or DJAG. Note: in CISR there is an over-representation of notices for ANZSIC codes of 4111, 4112, 4113, 4210 or 4259, because all project (notification) data supplied by Qleave which is populated into the CISR database, is attributed to one of the above five ANZSIC codes. It is to this project data that WHSQ inspectors most often record their data. It is only when inspectors are interacting with sub-contractors on any given project that their issued notices are recorded against a more specific construction ANZSIC code. Table 38 Prohibition Notices, Construction Sectors, Queensland, 2004-05 to 2009-10 (Number)
Change2004-05 to
Code Sector 2004-05 2005-06 2006-07 2007-08 2008-09 2009-10 Total Proportion 2009-104113 Non-residential building construction 186 222 294 372 284 306 1,664 22% 39%4111 House construction 249 267 250 320 227 257 1,570 21% 3%4112 Residential building construction n.e.c.. 181 210 260 243 257 177 1,328 18% -2%4259 Construction services n.e.c.. 43 55 86 130 104 128 546 7% 66%4210 Site preparation services 46 78 100 96 83 106 509 7% 57%4223 Roofing services 45 68 65 97 98 80 453 6% 44%4242 Carpentry services 51 53 38 65 57 38 302 4% -34%4244 Painting and decorating services 25 36 35 34 60 70 260 3% 64%4122 Non-building construction n.e.c.. 6 26 25 34 22 41 154 2% 85%4231 Plumbing services 22 22 16 22 23 33 138 2% 33%4221 Concreting services 13 17 25 32 15 23 125 2% 43%4222 Bricklaying services 12 21 11 12 9 11 76 1% -9%4232 Electrical services 12 8 7 27 9 9 72 1% -33%4121 Road and bridge construction 12 6 10 20 13 25 86 1% 52%4224 Structural steel erection services 9 12 7 16 17 11 72 1% 18%4241 Plastering and ceiling services 6 9 8 8 7 11 49 1% 45%4243 Tiling and carpeting services 1 5 5 10 6 4 31 0% 75%4245 Glazing services 1 4 10 8 6 29 0% 83%4233 Air conditioning and heating services 3 2 4 7 6 8 30 0% 63%4251 Landscaping services 2 4 2 5 2 5 20 0% 60%3702 Sewage and Drainage Services 5 1 3 1 2 4 16 0% -25%3610 Electricity Supply 1 - 1 1 1 - 4 0% -3701 Water Supply - 1 - 1 1 - 3 0% -4234 Fire and security system services - - - 1 1 - 2 0% -3620 Gas Supply - - 1 - - - 1 0% -
Total 931 1,123 1,257 1,564 1,312 1,353 7,540 100% 31%CISR. The data was extracted 17 January 2011. The data in this table will not match data published earlier by WHSQ or DJAG. Note: in CISR there is an over-representation of notices for ANZSIC codes of 4111, 4112, 4113, 4210 or 4259, because all project (notification) data supplied by Qleave which is populated into the CISR database, is attributed to one of the above five ANZSIC codes. It is to this project data that WHSQ inspectors most often record their data. It is only when inspectors are interacting with sub-contractors on any given project that their issued notices are recorded against a more specific construction ANZSIC code.
Construction industry report PN11424 Page 44 of 80
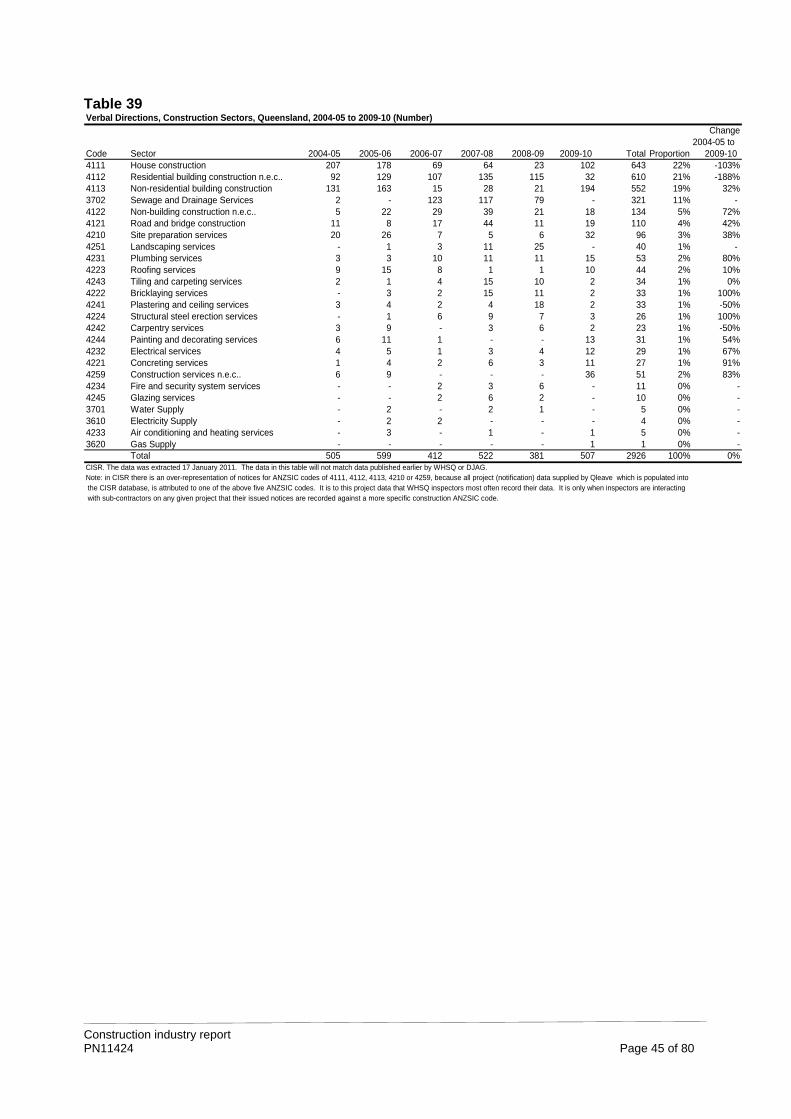
Table 39 Verbal Directions, Construction Sectors, Queensland, 2004-05 to 2009-10 (Number)
Change2004-05 to
Code Sector 2004-05 2005-06 2006-07 2007-08 2008-09 2009-10 Total Proportion 2009-104111 House construction 207 178 69 64 23 102 643 22% -103%4112 Residential building construction n.e.c.. 92 129 107 135 115 32 610 21% -188%4113 Non-residential building construction 131 163 15 28 21 194 552 19% 32%3702 Sewage and Drainage Services 2 - 123 117 79 - 321 11% - 4122 Non-building construction n.e.c.. 5 22 29 39 21 18 134 5% 72%4121 Road and bridge construction 11 8 17 44 11 19 110 4% 42%4210 Site preparation services 20 26 7 5 6 32 96 3%4251 Landscaping services - 1 3 11 25 - 40 1% - 4231 Plumbing services 3 3 10 11 11 15 53 2% 80%4223 Roofing services 9 15 8 1 1 10 44 2%4243 Tiling and carpeting services 2 1 4 15 10 2 34 1% 0%4222 Bricklaying services - 3 2 15 11 2 33 1% 100%4241 Plastering and ceiling services 3 4 2 4 18 2 33 1% -4224 Structural steel erection services - 1 6 9 7 3 26 1% 100%4242 Carpentry services 3 9 - 3 6 2 23 1% -50%4244 Painting and decorating services 6 11 1 - - 13 31 1% 54%4232 Electrical services 4 5 1 3 4 12 29 1%4221 Concreting services 1 4 2 6 3 11 27 1%4259 Construction services n.e.c.. 6 9 - - - 36 51 2% 83%4234 Fire and security system services - - 2 3 6 - 11 0% -4245 Glazing services - - 2 6 2 - 10 0% -3701 Water Supply - 2 - 2 1 - 5 0% -3610 Electricity Supply - 2 2 - - - 4 0% -4233 Air conditioning and heating services - 3 - 1 - 1 5 0% -3620 Gas Supply - - - - - 1 1 0%
Total 505 599 412 522 381 507 2926 100% 0%CISR. The data was extracted 17 January 2011. The data in this table will not match data published earlier by WHSQ or DJAG. Note: in CISR there is an over-representation of notices for ANZSIC codes of 4111, 4112, 4113, 4210 or 4259, because all project (notification) data supplied by Qleave which is populated into the CISR database, is attributed to one of the above five ANZSIC codes. It is to this project data that WHSQ inspectors most often record their data. It is only when inspectors are interacting with sub-contractors on any given project that their issued notices are recorded against a more specific construction ANZSIC code.
38%
10%
50%
67%91%
-
Construction industry report PN11424 Page 45 of 80
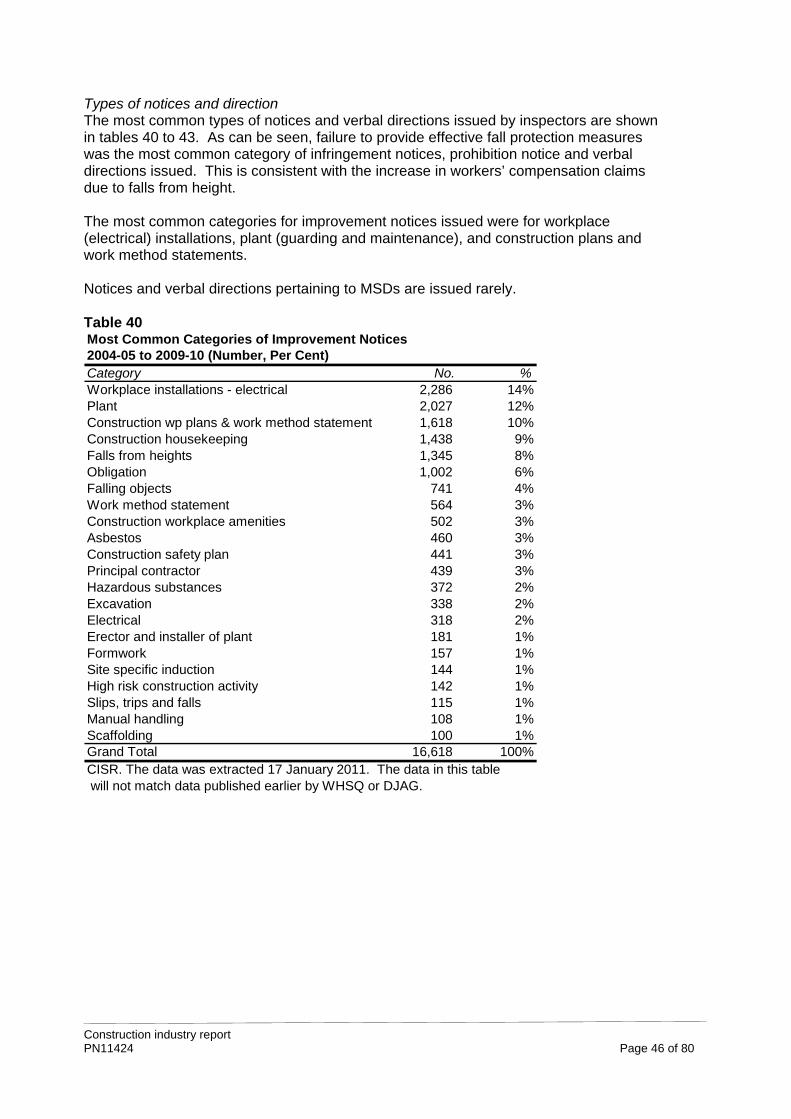
Types of notices and direction The most common types of notices and verbal directions issued by inspectors are shown in tables 40 to 43. As can be seen, failure to provide effective fall protection measures was the most common category of infringement notices, prohibition notice and verbal directions issued. This is consistent with the increase in workers’ compensation claims due to falls from height. The most common categories for improvement notices issued were for workplace (electrical) installations, plant (guarding and maintenance), and construction plans and work method statements. Notices and verbal directions pertaining to MSDs are issued rarely. Table 40 Most Common Categories of Improvement Notices 2004-05 to 2009-10 (Number, Per Cent)Category No. %Workplace installations - electrical 2,286 14%Plant 2,027 12%Construction wp plans & work method statement 1,618 10%Construction housekeeping 1,438 9%Falls from heights 1,345 8%Obligation 1,002 6%Falling objects 741 4%Work method statement 564 3%Construction workplace amenities 502 3%Asbestos 460 3%Construction safety plan 441 3%Principal contractor 439 3%Hazardous substances 372 2%Excavation 338 2%Electrical 318 2%Erector and installer of plant 181 1%Formwork 157 1%Site specific induction 144 1%High risk construction activity 142 1%Slips, trips and falls 115 1%Manual handling 108 1%Scaffolding 100 1%Grand Total 16,618 100%CISR. The data was extracted 17 January 2011. The data in this table will not match data published earlier by WHSQ or DJAG.
Construction industry report PN11424 Page 46 of 80
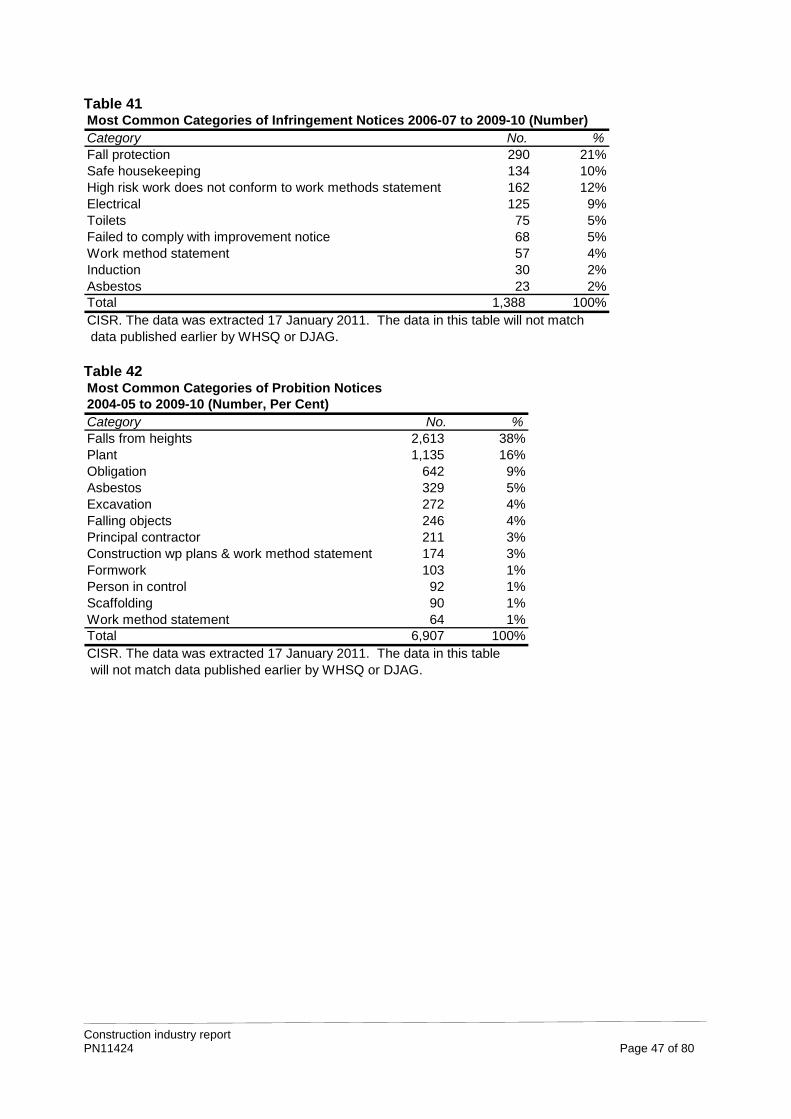
Table 41 Most Common Categories of Infringement Notices 2006-07 to 2009-10 (Number)Category No. %Fall protection 290 21%Safe housekeeping 134 10%High risk work does not conform to work methods statement 162 12%Electrical 125 9%Toilets 75 5%Failed to comply with improvement notice 68 5%Work method statement 57 4%Induction 30 2%Asbestos 23 2%Total 1,388 100%CISR. The data was extracted 17 January 2011. The data in this table will not match data published earlier by WHSQ or DJAG. Table 42 Most Common Categories of Probition Notices 2004-05 to 2009-10 (Number, Per Cent)Category No. %Falls from heights 2,613 38%Plant 1,135 16%Obligation 642 9%Asbestos 329 5%Excavation 272 4%Falling objects 246 4%Principal contractor 211 3%Construction wp plans & work method statement 174 3%Formwork 103 1%Person in control 92 1%Scaffolding 90 1%Work method statement 64 1%Total 6,907 100%CISR. The data was extracted 17 January 2011. The data in this table will not match data published earlier by WHSQ or DJAG.
Construction industry report PN11424 Page 47 of 80
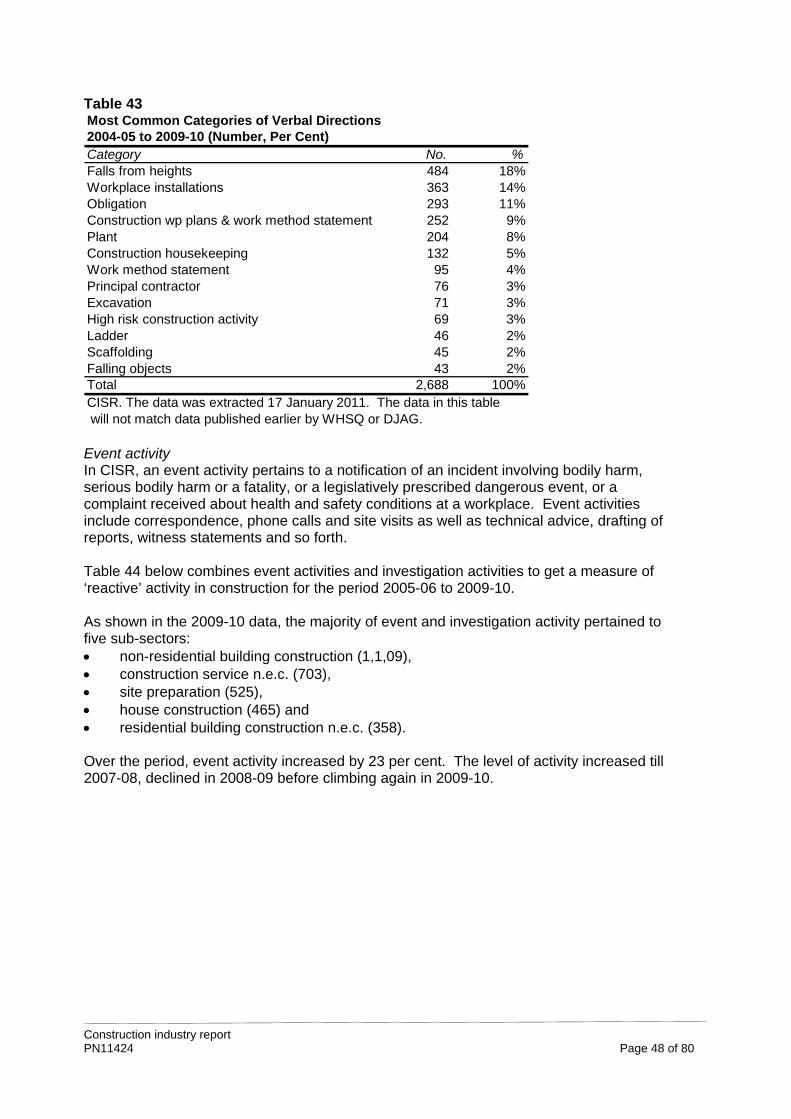
Table 43 Most Common Categories of Verbal Directions 2004-05 to 2009-10 (Number, Per Cent)Category No. %Falls from heights 484 18%Workplace installations 363 14%Obligation 293 11%Construction wp plans & work method statement 252 9%Plant 204 8%Construction housekeeping 132 5%Work method statement 95 4%Principal contractor 76 3%Excavation 71 3%High risk construction activity 69 3%Ladder 46 2%Scaffolding 45 2%Falling objects 43 2%Total 2,688 100%CISR. The data was extracted 17 January 2011. The data in this table will not match data published earlier by WHSQ or DJAG. Event activity In CISR, an event activity pertains to a notification of an incident involving bodily harm, serious bodily harm or a fatality, or a legislatively prescribed dangerous event, or a complaint received about health and safety conditions at a workplace. Event activities include correspondence, phone calls and site visits as well as technical advice, drafting of reports, witness statements and so forth. Table 44 below combines event activities and investigation activities to get a measure of ‘reactive’ activity in construction for the period 2005-06 to 2009-10. As shown in the 2009-10 data, the majority of event and investigation activity pertained to five sub-sectors: non-residential building construction (1,1,09), construction service n.e.c. (703), site preparation (525), house construction (465) and residential building construction n.e.c. (358). Over the period, event activity increased by 23 per cent. The level of activity increased till 2007-08, declined in 2008-09 before climbing again in 2009-10. Construction industry report PN11424 Page 48 of 80
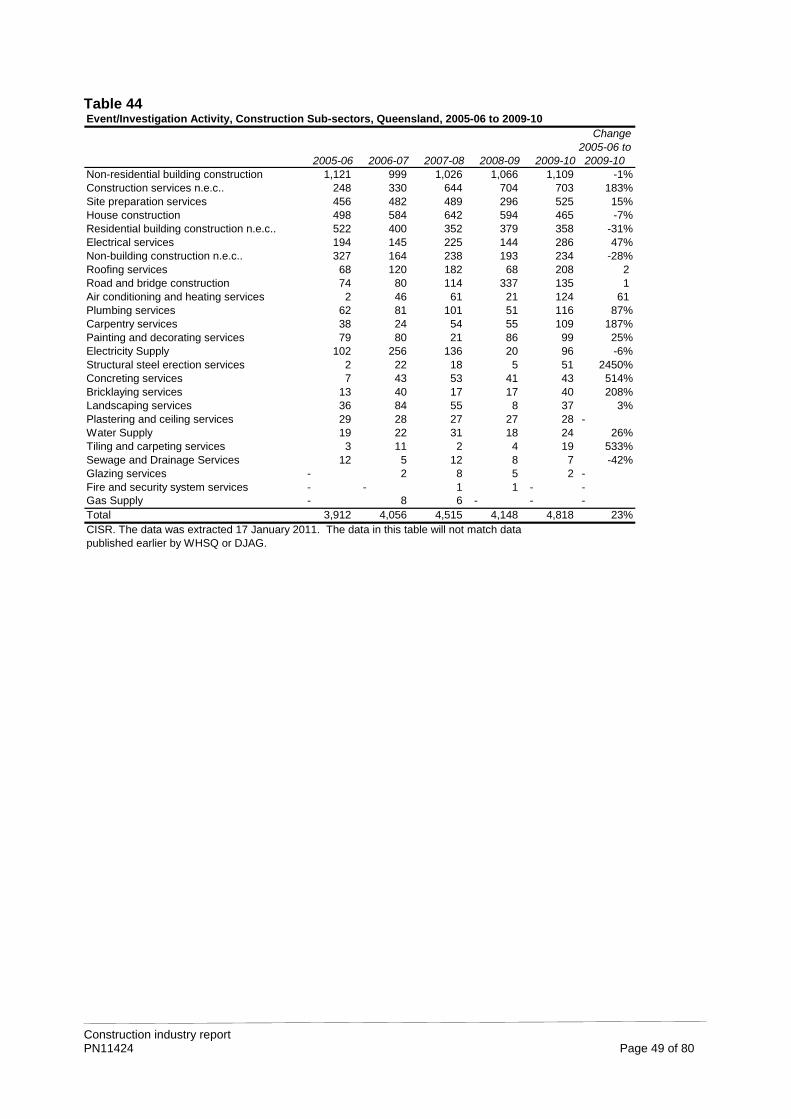
Table 44 Event/Investigation Activity, Construction Sub-sectors, Queensland, 2005-06 to 2009-10
Change2005-06 to
2005-06 2006-07 2007-08 2008-09 2009-10 2009-10Non-residential building construction 1,121 999 1,026 1,066 1,109 -1%Construction services n.e.c.. 248 330 644 704 703 183%Site preparation services 456 482 489 296 525 15%House construction 498 584 642 594 465 -7%Residential building construction n.e.c.. 522 400 352 379 358 -31%Electrical services 194 145 225 144 286 47%Non-building construction n.e.c.. 327 164 238 193 234 -28%Roofing services 68 120 182 68 208 2 Road and bridge construction 74 80 114 337 135 1 Air conditioning and heating services 2 46 61 21 124 61 Plumbing services 62 81 101 51 116 87%Carpentry services 38 24 54 55 109 187%Painting and decorating services 79 80 21 86 99 25%Electricity Supply 102 256 136 20 96 -6%Structural steel erection services 2 22 18 5 51 2450%Concreting services 7 43 53 41 43 514%Bricklaying services 13 40 17 17 40 208%Landscaping services 36 84 55 8 37 3%Plastering and ceiling services 29 28 27 27 28 -Water Supply 19 22 31 18 24 26%Tiling and carpeting services 3 11 2 4 19 533%Sewage and Drainage Services 12 5 12 8 7 -42%Glazing services - 2 8 5 2 -Fire and security system services - - 1 1 - -Gas Supply - 8 6 - - -Total 3,912 4,056 4,515 4,148 4,818 23%CISR. The data was extracted 17 January 2011. The data in this table will not match data published earlier by WHSQ or DJAG.
Construction industry report PN11424 Page 49 of 80
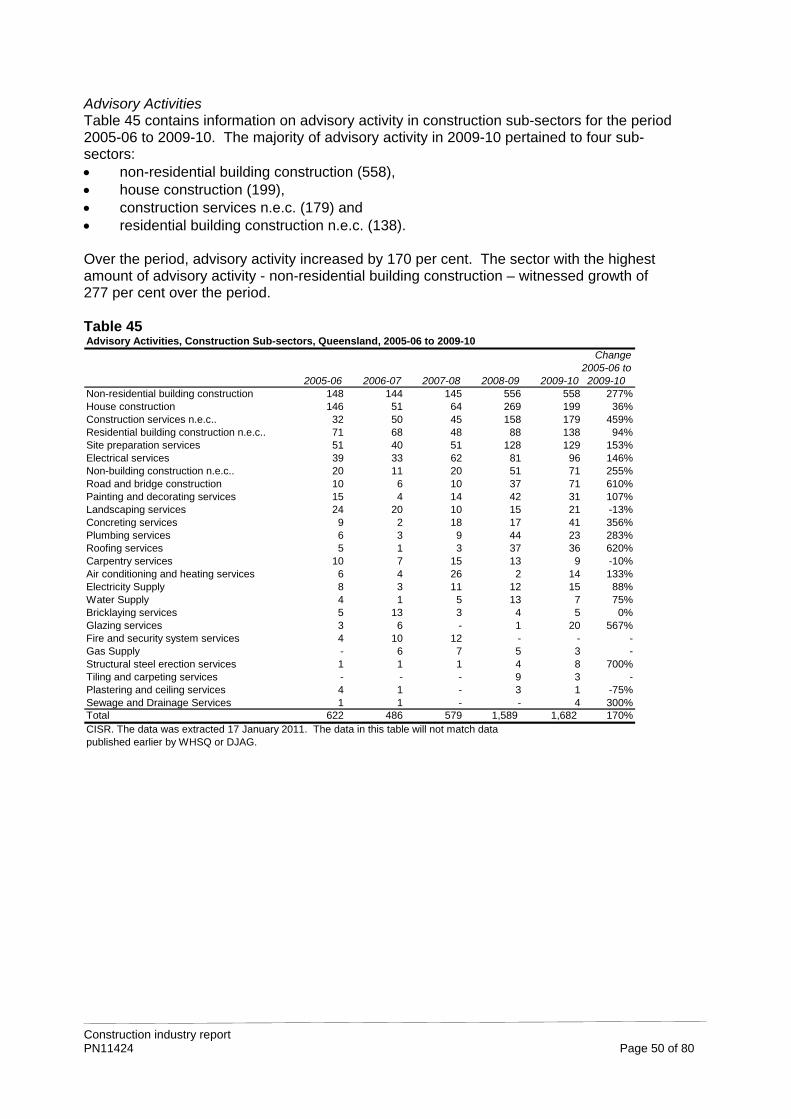
Advisory Activities Table 45 contains information on advisory activity in construction sub-sectors for the period 2005-06 to 2009-10. The majority of advisory activity in 2009-10 pertained to four sub-sectors: non-residential building construction (558), house construction (199), construction services n.e.c. (179) and residential building construction n.e.c. (138). Over the period, advisory activity increased by 170 per cent. The sector with the highest amount of advisory activity - non-residential building construction – witnessed growth of 277 per cent over the period. Table 45 Advisory Activities, Construction Sub-sectors, Queensland, 2005-06 to 2009-10
Change2005-06 to
2005-06 2006-07 2007-08 2008-09 2009-10 2009-10Non-residential building construction 148 144 145 556 558 277%House construction 146 51 64 269 199 36%Construction services n.e.c.. 32 50 45 158 179 459%Residential building construction n.e.c.. 71 68 48 88 138 94%Site preparation services 51 40 51 128 129 153%Electrical services 39 33 62 81 96 146%Non-building construction n.e.c.. 20 11 20 51 71 255%Road and bridge construction 10 6 10 37 71 610%Painting and decorating services 15 4 14 42 31 107%Landscaping services 24 20 10 15 21 -13%Concreting services 9 2 18 17 41 356%Plumbing services 6 3 9 44 23 283%Roofing services 5 1 3 37 36 620%Carpentry services 10 7 15 13 9 -10%Air conditioning and heating services 6 4 26 2 14 133%Electricity Supply 8 3 11 12 15 88%Water Supply 4 1 5 13 7 75%Bricklaying services 5 13 3 4 5 0%Glazing services 3 6 - 1 20 567%Fire and security system services 4 10 12 - - -Gas Supply - 6 7 5 3Structural steel erection services 1 1 1 4 8 700%Tiling and carpeting services - - - 9 3 -Plastering and ceiling services 4 1 - 3 1 -75%Sewage and Drainage Services 1 1 - - 4 300%Total 622 486 579 1,589 1,682 170%CISR. The data was extracted 17 January 2011. The data in this table will not match data published earlier by WHSQ or DJAG.
-
Construction industry report PN11424 Page 50 of 80
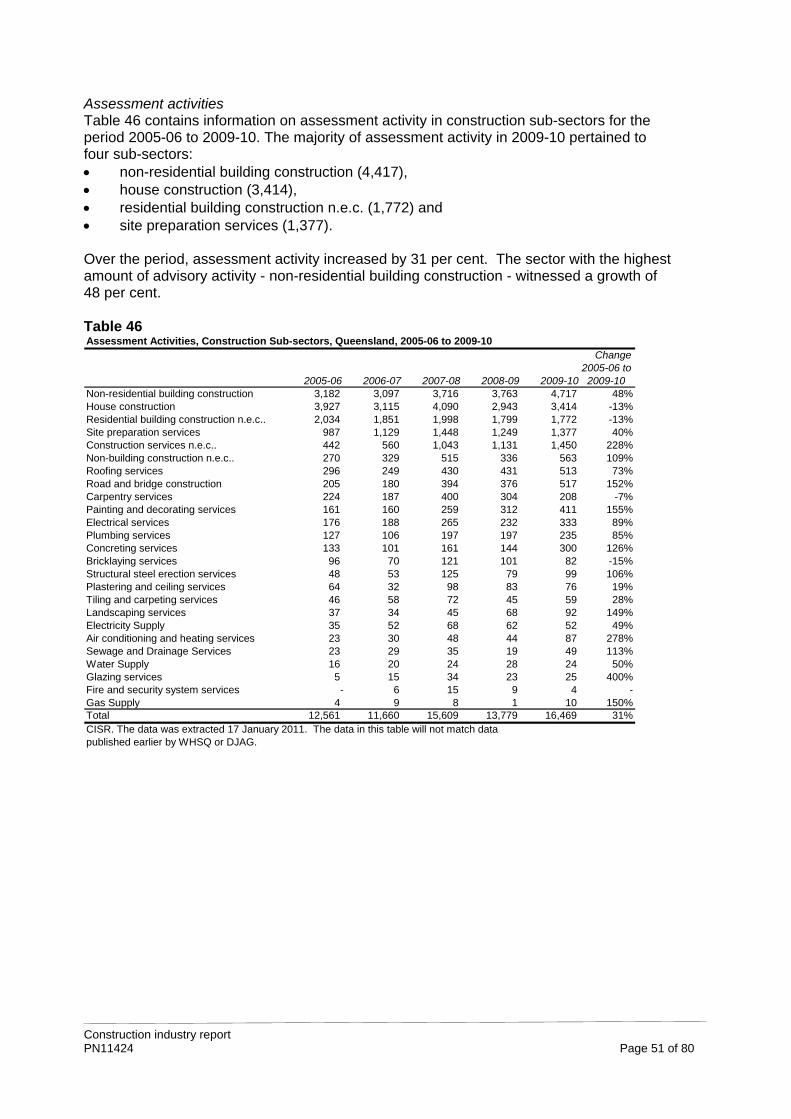
Assessment activities Table 46 contains information on assessment activity in construction sub-sectors for the period 2005-06 to 2009-10. The majority of assessment activity in 2009-10 pertained to four sub-sectors: non-residential building construction (4,417), house construction (3,414), residential building construction n.e.c. (1,772) and site preparation services (1,377). Over the period, assessment activity increased by 31 per cent. The sector with the highest amount of advisory activity - non-residential building construction - witnessed a growth of 48 per cent. Table 46 Assessment Activities, Construction Sub-sectors, Queensland, 2005-06 to 2009-10
Change2005-06 to
2005-06 2006-07 2007-08 2008-09 2009-10 2009-10Non-residential building construction 3,182 3,097 3,716 3,763 4,717 48%House construction 3,927 3,115 4,090 2,943 3,414 -13%Residential building construction n.e.c.. 2,034 1,851 1,998 1,799 1,772 -13%Site preparation services 987 1,129 1,448 1,249 1,377 40%Construction services n.e.c.. 442 560 1,043 1,131 1,450 228%Non-building construction n.e.c.. 270 329 515 336 563 109%Roofing services 296 249 430 431 513 73%Road and bridge construction 205 180 394 376 517 152%Carpentry services 224 187 400 304 208 -7%Painting and decorating services 161 160 259 312 411 155%Electrical services 176 188 265 232 333 89%Plumbing services 127 106 197 197 235 85%Concreting services 133 101 161 144 300 126%Bricklaying services 96 70 121 101 82 -15%Structural steel erection services 48 53 125 79 99 106%Plastering and ceiling services 64 32 98 83 76 19%Tiling and carpeting services 46 58 72 45 59 28%Landscaping services 37 34 45 68 92 149%Electricity Supply 35 52 68 62 52 49%Air conditioning and heating services 23 30 48 44 87 278%Sewage and Drainage Services 23 29 35 19 49 113%Water Supply 16 20 24 28 24 50%Glazing services 5 15 34 23 25 400%Fire and security system services - 6 15 9 4 -Gas Supply 4 9 8 1 10 150%Total 12,561 11,660 15,609 13,779 16,469 31%CISR. The data was extracted 17 January 2011. The data in this table will not match data published earlier by WHSQ or DJAG.
Construction industry report PN11424 Page 51 of 80
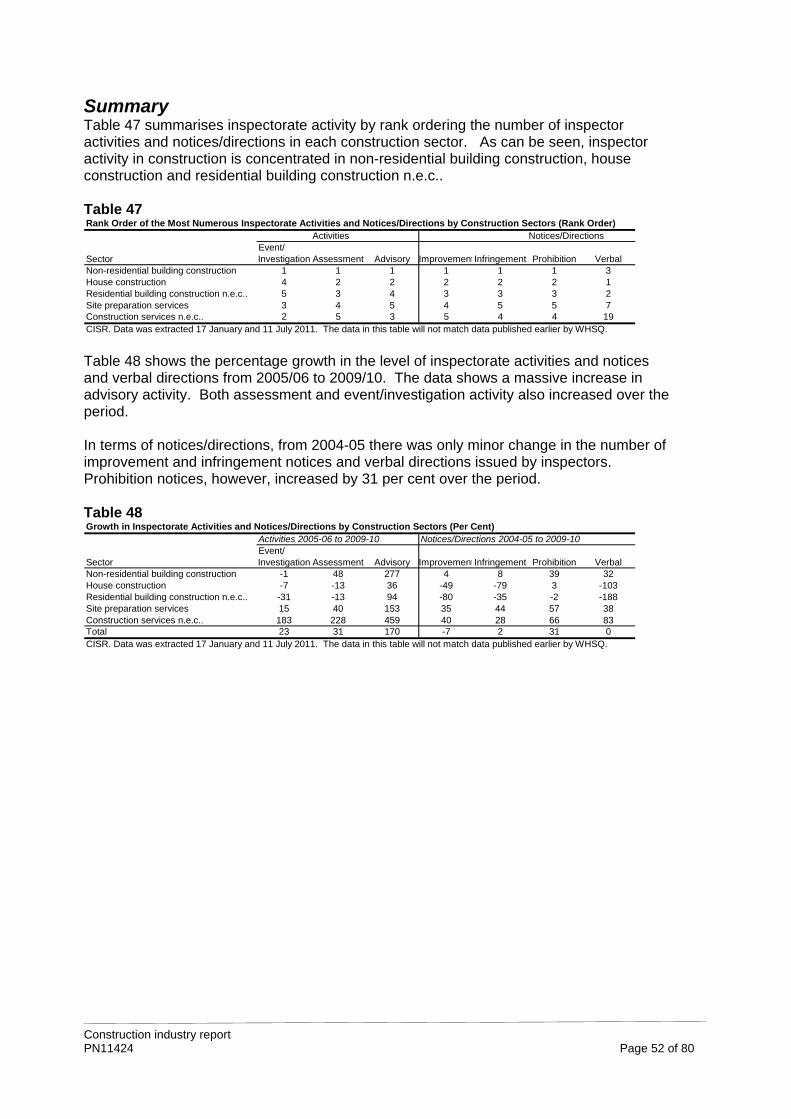
Summary Table 47 summarises inspectorate activity by rank ordering the number of inspector activities and notices/directions in each construction sector. As can be seen, inspector activity in construction is concentrated in non-residential building construction, house construction and residential building construction n.e.c.. Table 47 Rank Order of the Most Numerous Inspectorate Activities and Notices/Directions by Construction Sectors (Rank Order)
Activities Notices/DirectionsEvent/
Sector Investigation Assessment Advisory ImprovementInfringement Prohibition VerbalNon-residential building construction 1 1 1 1 1 1 3House construction 4 2 2 2 2 2 1Residential building construction n.e.c.. 5 3 4 3 3 3 2Site preparation services 3 4 5 4 5 5 7Construction services n.e.c.. 2 5 3 5 4 4 19CISR. Data was extracted 17 January and 11 July 2011. The data in this table will not match data published earlier by WHSQ. Table 48 shows the percentage growth in the level of inspectorate activities and notices and verbal directions from 2005/06 to 2009/10. The data shows a massive increase in advisory activity. Both assessment and event/investigation activity also increased over the period. In terms of notices/directions, from 2004-05 there was only minor change in the number of improvement and infringement notices and verbal directions issued by inspectors. Prohibition notices, however, increased by 31 per cent over the period. Table 48 Growth in Inspectorate Activities and Notices/Directions by Construction Sectors (Per Cent)
Activities 2005-06 to 2009-10 Notices/Directions 2004-05 to 2009-10Event/
Sector Investigation Assessment Advisory ImprovementInfringement Prohibition VerbalNon-residential building construction -1 48 277 4 8 39 32House construction -7 -13 36 -49 -79 3 -103Residential building construction n.e.c.. -31 -13 94 -80 -35 -2 -188Site preparation services 15 40 153 35 44 57 38Construction services n.e.c.. 183 228 459 40 28 66 83Total 23 31 170 -7 2 31 0CISR. Data was extracted 17 January and 11 July 2011. The data in this table will not match data published earlier by WHSQ.
Construction industry report PN11424 Page 52 of 80
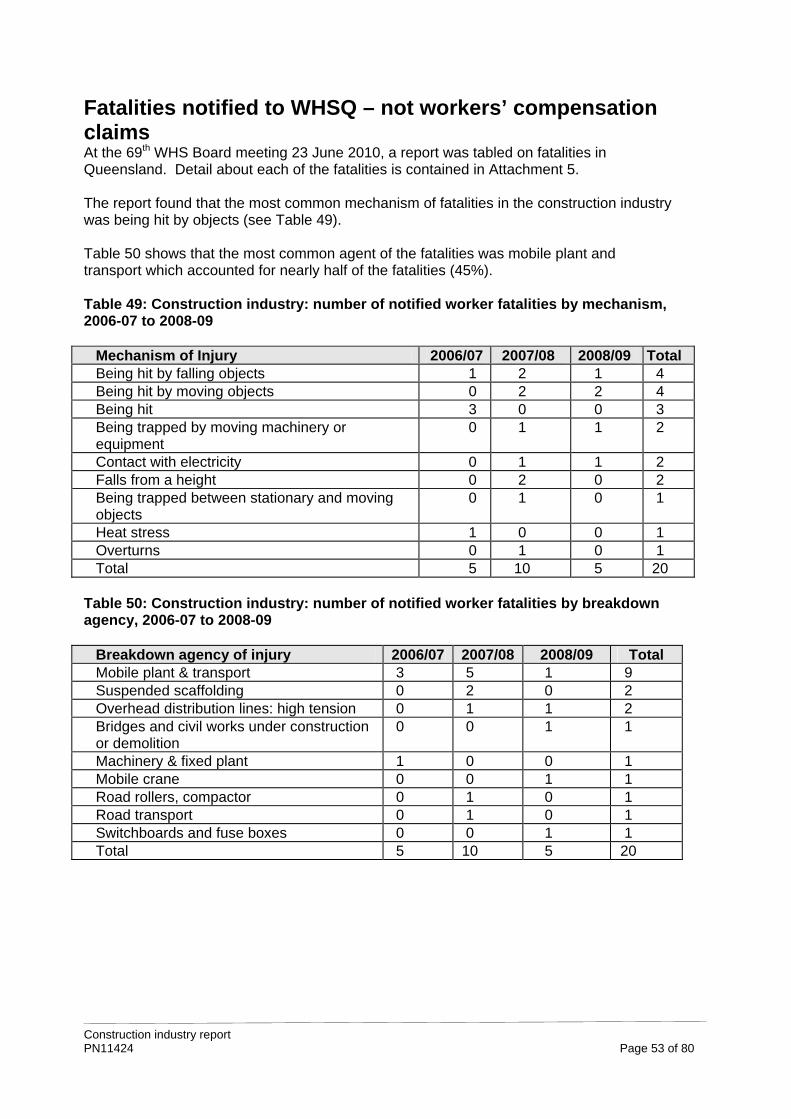
Fatalities notified to WHSQ – not workers’ compensation claims At the 69th WHS Board meeting 23 June 2010, a report was tabled on fatalities in Queensland. Detail about each of the fatalities is contained in Attachment 5. The report found that the most common mechanism of fatalities in the construction industry was being hit by objects (see Table 49). Table 50 shows that the most common agent of the fatalities was mobile plant and transport which accounted for nearly half of the fatalities (45%).
Table 49: Construction industry: number of notified worker fatalities by mechanism, 2006-07 to 2008-09
Mechanism of Injury 2006/07 2007/08 2008/09 Total Being hit by falling objects 1 2 1 4 Being hit by moving objects 0 2 2 4 Being hit 3 0 0 3 Being trapped by moving machinery or equipment
0 1 1 2
Contact with electricity 0 1 1 2 Falls from a height 0 2 0 2 Being trapped between stationary and moving objects
0 1 0 1
Heat stress 1 0 0 1 Overturns 0 1 0 1 Total 5 10 5 20
Table 50: Construction industry: number of notified worker fatalities by breakdown agency, 2006-07 to 2008-09
Breakdown agency of injury 2006/07 2007/08 2008/09 Total Mobile plant & transport 3 5 1 9 Suspended scaffolding 0 2 0 2 Overhead distribution lines: high tension 0 1 1 2 Bridges and civil works under construction or demolition
0 0 1 1
Machinery & fixed plant 1 0 0 1 Mobile crane 0 0 1 1 Road rollers, compactor 0 1 0 1 Road transport 0 1 0 1 Switchboards and fuse boxes 0 0 1 1 Total 5 10 5 20
Construction industry report PN11424 Page 53 of 80
ATTACHMENT 1 ANZSIC 1993 The construction industry According to the Australian Bureau of Statistics (ANZSIC 1993), the building and construction industry can be broken into the following sectors: 41 General Construction 411 Building Construction
o House construction o Residential Building Construction n.e.c. (flats, apartments etc) o Non-Residential Building Construction (commercial buildings, hotel, hospitals etc.)
412 Non-Building Construction o Road and Bridge Construction o Non-Building Construction n.e.c. (railways, dams, water supply, etc)
42 Construction Trade Services 421 Site Preparation Services
o Site Preparation Services (earthmoving, excavation, etc) 422 Building Structure Services
o Concreting Services o Bricklaying Services o Roofing services o Structural Steel Erection Services
423 Installation Trade Services o Plumbing services o Electrical services o Air Conditioning and Heating Services o Fire and Security System Services
424 Building Completion Services o Plastering and Ceiling Services o Carpentry services o Tiling and carpeting services o Painting and decorating services o Glazing services
425 Other Construction Services o Landscaping Services o Construction Services n.e.c.
A more detailed description of these sectors is shown below:
Construction industry report PN11424 Page 54 of 80

411 Building Construction 4111 House Construction This class consists of units mainly engaged in the construction of houses (except semi-detached houses) or in carrying out alterations, additions or renovation or general repairs to houses, or in organising or managing these activities as the prime contractor. Primary Activities House construction, alteration, renovation or general repair; Houses, prefabricated, assembly, erection or installation (on-site) 4112 Residential Building Construction n.e.c. This class consists of units mainly engaged in the construction of residential buildings (except houses), or in carrying out alterations, additions or renovation or general repairs to such buildings, or in organising or managing these activities. Primary Activities Apartments construction; Duplex houses construction; Flats construction; High-rise flats construction; Home units construction; Repair (general) or renovation of residential buildings n.e.c.; Semi-detached houses construction 4113 Non-Residential Building Construction This class consists of units mainly engaged in the construction of non-residential buildings such as hotels, motels, hostels, hospitals, prisons, or other institutional buildings, in carrying out alterations, additions or renovation or general repairs to such buildings, or in organising or managing their construction. Primary Activities Commercial buildings construction; Hotels construction; Industrial buildings construction; Institutional buildings construction; Prefabricated non-residential buildings assembly, erection or installation (on-site; except sheds, garages or carports); Religious buildings construction; Repair (general) or renovation of non-residential buildings 412 Non-Building Construction 4121 Road and Bridge Construction This class consists of units mainly engaged in the construction or general repair of roads, bridges, aerodrome runways or parking lots, or in organising or managing their construction. The quarrying of earth, soil or filling or other construction materials carried out in conjunction with road or bridge construction by the same unit is included in this class. Primary Activities Aerodrome runway construction; Asphalt surfacing; Bridges construction (incl. construction from prefabricated components); Elevated highways construction; Overpasses construction; Parking lot construction (except buildings); Repair or maintenance of roads or bridges; Road construction or sealing; Road sub-base or fill quarrying (in conjunction with road construction); Viaducts construction 4122 Non-Building Construction n.e.c. This class consists of units mainly engaged in the construction of railway permanent way, dams, irrigation systems, harbour or river works, water or gas supply systems, oil refineries (except buildings), pipelines or construction projects n.e.c., in the on-site assembly of boilers, furnaces or heavy electrical machinery from prefabricated components, or in the general repair of such structures, machinery or equipment.
Construction industry report PN11424 Page 55 of 80
Primary Activities Boilers construction (on-site assembly from prefabricated components); Bowling greens construction; Breakwaters construction; Cable laying; Canals construction; Dams construction; Distribution lines, electricity or communication, construction; Dredging (harbours or rivers); Electrical machinery, heavy, installation (on-site assembly); Flood control systems construction; Furnaces construction (for industrial plants from prefabricated components); Golf courses construction; Harbour works construction (except buildings); Irrigation systems construction; Jetties construction; Kilns construction; Lake construction; Mine site construction n.e.c.; Oil refineries construction (except buildings); Pile driving; Pipelines construction; Railway permanent way construction; River works construction; Sewage treatment plants construction; Sewage or stormwater drainage systems construction; Sports fields construction; Swimming pools, below ground concrete or fibreglass, construction; Television or radio transmitting towers construction; Tunnels construction; Water tank construction (except of structural steel) 421 Site Preparation Services 4210 Site Preparation Services This class consists of units mainly engaged in earthmoving work such as levelling of construction sites, excavation of foundations, trench digging or removal of overburden from mine sites. This class also includes units mainly engaged in hiring earthmoving plant with operators. Primary Activities Demolition of buildings or other structures; Earthmoving; Excavation; Explosives laying; Ground de-watering; Hiring earthmoving plant (with operators); Land clearing (except rural); Levelling (construction sites); Mine site preparation; Removal of overburden; Trench digging 422 Building Structure Services 4221 Concreting Services This class consists of units mainly engaged in concreting work, concrete pouring or other concrete work on construction projects. Primary Activities Concrete pumping; Concrete work on construction projects; Footpaths, concrete, construction; Foundations, concrete, construction; Kerb and guttering, concrete, construction; Repair of kerbs, gutters or other concrete structural products 4222 Bricklaying Services This class consists of units mainly engaged in bricklaying or concrete block laying. Primary Activities Bricklaying; Concrete block laying; Repair of brickwork; Stonework on construction projects 4223 Roofing Services This class consists of units mainly engaged in roof tiling. Primary Activities Roof tiling; Metal roof fixing; Roofing materials installation n.e.c
Construction industry report PN11424 Page 56 of 80
4224 Structural Steel Erection Services This class consists of units mainly engaged in the erection (including on-site fabrication) of metal silos, storage tanks or structural steel components for buildings or other structures such as bridges, overhead cranes or electricity transmission towers. Primary Activities Reinforcing steel erection; Silos, metal, erection; Storage tanks, metal, erection; Structural steel erection; Trusses or joists, steel, erection; Welding work on construction projects 423 Installation Trade Services 4231 Plumbing Services This class consists of units mainly engaged in plumbing or draining (except sewage or stormwater drains construction) or septic tank installation. Plumbing work arising from the installation of appliances is included in this class. Primary Activities Drains construction, cleaning or repairing (except sewerage or stormwater drains); Gas appliance repair; Gas plumbing; Guttering, roof, installation or repair; Hot water systems installation; Plumbing (except marine); Repair of installed plumbing; Septic tank installation; Solar hot water systems installation 4232 Electrical Services This class consists of units mainly engaged in the installation of electrical wiring or fittings in buildings or other construction projects. Electrical work arising from the installation of appliances is included in this class. Primary Activities Closed circuit video surveillance systems installation; Domestic exhaust fans installation; Electric light or power installation; Electric wiring installation on construction projects; Electrical work on construction projects; Repair or maintenance of electrical wiring (except of electricity transmission or distribution lines) 4233 Air Conditioning and Heating Services This class consists of units mainly engaged in the installation of household, industrial or commercial heating, refrigeration or air conditioning equipment, or in the installation of air conditioning duct work. Primary Activities Air conditioning duct work installation; Air conditioning equipment installation (except motor vehicle air conditioning equipment); Coolroom refrigerator installation; Freezer room construction; Heating equipment installation (except industrial furnaces); Oil heaters installation; Refrigeration equipment installation; Temperature controlled structures installation; Ventilation equipment installation n.e.c. 4234 Fire and Security System Services This class consists of units mainly engaged in installing fire protection, detection and control systems, and in installing security systems. Primary Activities Alarm system, fire, installation; Fire sprinklers, installation; Security systems, installation; Smoke detectors, installation
Construction industry report PN11424 Page 57 of 80
424 Building Completion Services 4241 Plastering and Ceiling Services This class consists of units mainly engaged in plastering, plaster fixing or finishing. Primary Activities Cement rendering of buildings; Decorative plaster finishing; Fibrous plaster fixing or finishing; Plasterboard fixing or finishing; Plaster work on construction projects 4242 Carpentry Services This class consists of units mainly engaged in carpentry work or the fixing of wooden formwork on construction projects. Primary Activities Carpentry work on construction projects; Flooring, wooden, fixing; Formwork, wooden, fixing; Joinery work on construction projects (on-site fabrication only); Roof trusses, wooden, fixing 4243 Tiling and Carpeting Services This class consists of units mainly engaged in laying or setting wall or floor tiles. Primary Activities Carpet or carpet tile laying; Floor sanding; Floor tiling (using ceramic, concrete or cut stone tiles); Floor coverings laying n.e.c.; Linoleum or linotile fixing; Mosaic work on construction projects; Slate flooring installation; Terrazzo laying; Wall tiling (using ceramic, concrete or cut stone tiles) 4244 Painting and Decorating Services This class consists of units mainly engaged in painting, decorating or wall papering houses or other structures. Primary Activities House painting; Painting of buildings or other structures; Paper hanging; Spray painting of buildings or other structures; Wall papering 4245 Glazing Services This class consists of units mainly engaged in glazing, including glass installation and repair work. Primary Activities Glazing; Window curtain wall installation; Window installation; Window insulation fixing; Window frame installation 425 Other Construction Services 4251 Landscaping Services This class consists of units mainly engaged in constructing landscapes, including landforming, provision of retaining walls and paths, garden drainage control and garden watering systems, garden features and planting. Initial planting by the same unit is included.
Construction industry report PN11424 Page 58 of 80
Primary Activities Fence construction (except agricultural); Garden and streetscape planting; Garden design implementation; Garden drainage systems installation (except agricultural); Garden sprinkler systems installation (except irrigation systems); Landscape construction; Lawn construction; Rockery work 4259 Construction Services n.e.c. This class consists of units mainly engaged in special trade contract work n.e.c. Primary Activities Awnings installation or repair; Blinds installation or repair; Cladding, metal wall or roof, fixing (to buildings); Flywire screens, shutters or blinds installation; Insulation materials installation; Petrol bowsers installation; Sand or other abrasive blasting of building exteriors; Scaffolding construction; Steam-cleaning of building exteriors; Waterproofing of buildings
Construction industry report PN11424 Page 59 of 80
ATTACHMENT 2 ANZSIC 2006 Construction industry
Construction 30 Building Construction
301 Residential Building Construction
3011 House Construction
3019 Other Residential Building Construction
302 Non-Residential Building Construction
3020 Non-Residential Building Construction
31 Heavy and Civil Engineering Construction
310 Heavy and Civil Engineering Construction
3101 Road and Bridge Construction
3109 Other Heavy and Civil Engineering Construction
32 Construction Services
321 Land Development and Site Preparation Services
3211 Land Development and Subdivision
3212 Site Preparation Services
322 Building Structure Services
3221 Concreting Services
3222 Bricklaying Services
3223 Roofing Services
3224 Structural Steel Erection Services
323 Building Installation Services
3231 Plumbing Services
3232 Electrical Services
3233 Air Conditioning and Heating Services
3234 Fire and Security Alarm Installation Services
3239 Other Building Installation Services
324 Building Completion Services
3241 Plastering and Ceiling Services
3242 Carpentry Services
3243 Tiling and Carpeting Services
3244 Painting and Decorating Services
3245 Glazing Services
329 Other Construction Services
3291 Landscape Construction Services
3292 Hire of Construction Machinery with Operator
3299 Other Construction Services n.e.c.
Construction industry report PN11424 Page 60 of 80
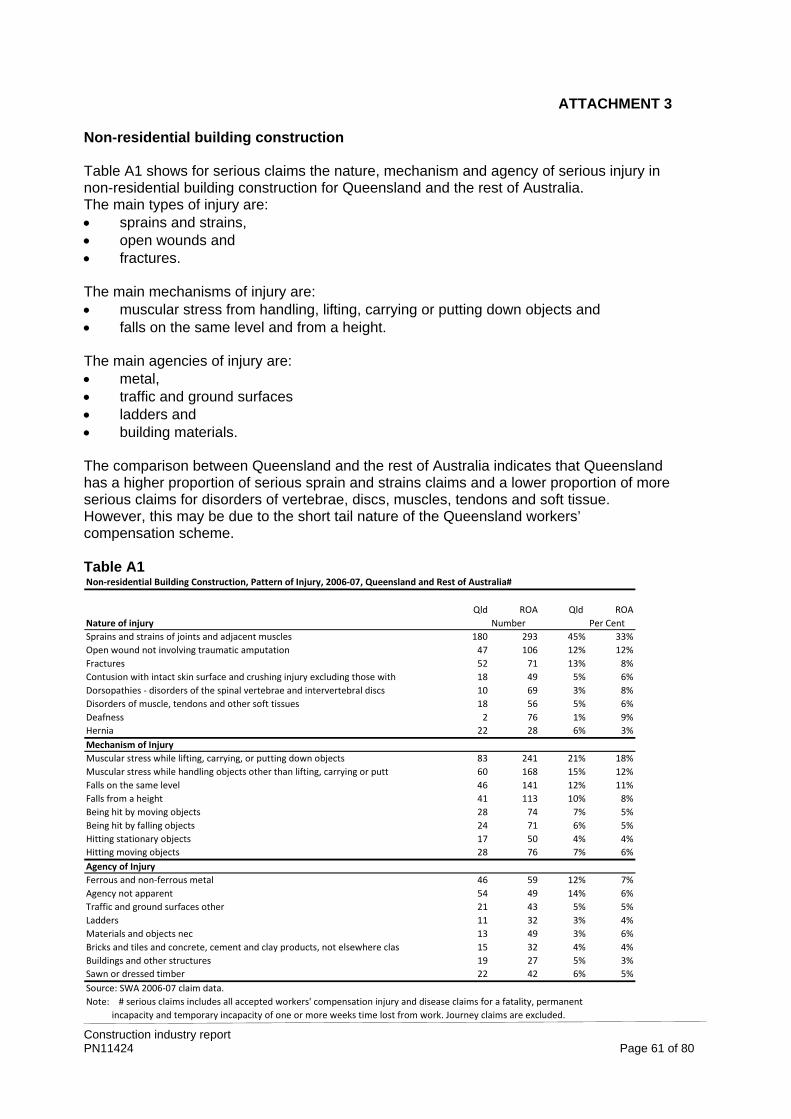
ATTACHMENT 3 Non-residential building construction Table A1 shows for serious claims the nature, mechanism and agency of serious injury in non-residential building construction for Queensland and the rest of Australia. The main types of injury are: sprains and strains, open wounds and fractures. The main mechanisms of injury are: muscular stress from handling, lifting, carrying or putting down objects and falls on the same level and from a height. The main agencies of injury are: metal, traffic and ground surfaces ladders and building materials. The comparison between Queensland and the rest of Australia indicates that Queensland has a higher proportion of serious sprain and strains claims and a lower proportion of more serious claims for disorders of vertebrae, discs, muscles, tendons and soft tissue. However, this may be due to the short tail nature of the Queensland workers’ compensation scheme. Table A1 Non‐residential Building Construction, Pattern of Injury, 2006‐07, Queensland and Rest of Australia#
Qld ROA Qld ROA
Nature of injury Number Per Cent
Sprains and strains of joints and adjacent muscles 180 293 45% 33%
Open wound not involving traumatic amputation 47 106 12% 12%
Fractures 52 71 13% 8%
Contusion with intact skin surface and crushing injury excluding those with 18 49 5% 6%
Dorsopathies ‐ disorders of the spinal vertebrae and intervertebral discs 10 69 3% 8%
Disorders of muscle, tendons and other soft tissues 18 56 5% 6%
Deafness 2 76 1% 9%
Hernia 22 28 6% 3%
Mechanism of Injury
Muscular stress while lifting, carrying, or putting down objects 83 241 21% 18%
Muscular stress while handling objects other than lifting, carrying or putt 60 168 15% 12%
Falls on the same level 46 141 12% 11%
Falls from a height 41 113 10% 8%
Being hit by moving objects 28 74 7% 5%
Being hit by falling objects 24 71 6% 5%
Hitting stationary objects 17 50 4% 4%
Hitting moving objects 28 76 7% 6%
Agency of Injury
Ferrous and non‐ferrous metal 46 59 12% 7%
Agency not apparent 54 49 14% 6%
Traffic and ground surfaces other 21 43 5% 5%
Ladders 11 32 3% 4%
Materials and objects nec 13 49 3% 6%
Bricks and tiles and concrete, cement and clay products, not elsewhere clas 15 32 4% 4%
Buildings and other structures 19 27 5% 3%
Sawn or dressed timber 22 42 6% 5%
Source: SWA 2006‐07 claim data.
Note: # serious claims includes all accepted workers' compensation injury and disease claims for a fatality, permanent
incapacity and temporary incapacity of one or more weeks time lost from work. Journey claims are excluded.
Construction industry report PN11424 Page 61 of 80
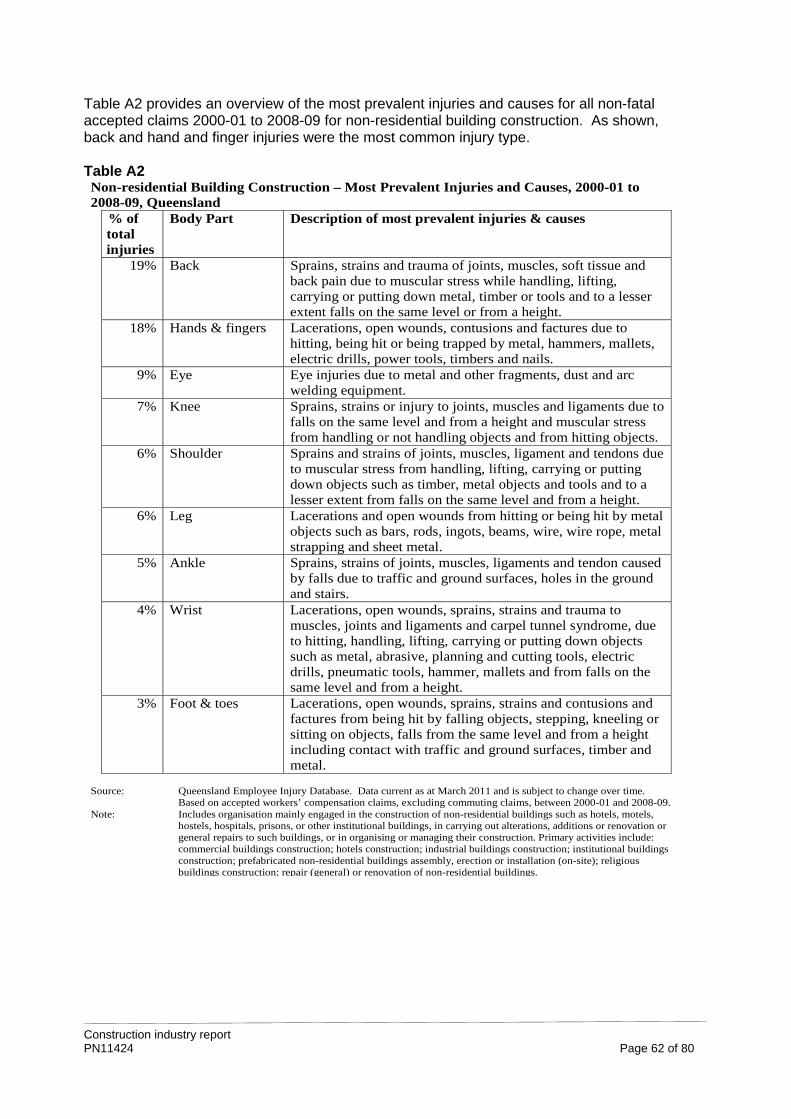
Table A2 provides an overview of the most prevalent injuries and causes for all non-fatal accepted claims 2000-01 to 2008-09 for non-residential building construction. As shown, back and hand and finger injuries were the most common injury type. Table A2 Non-residential Building Construction – Most Prevalent Injuries and Causes, 2000-01 to 2008-09, Queensland
% of total injuries
Body Part Description of most prevalent injuries & causes
19% Back Sprains, strains and trauma of joints, muscles, soft tissue and back pain due to muscular stress while handling, lifting, carrying or putting down metal, timber or tools and to a lesser extent falls on the same level or from a height.
18% Hands & fingers Lacerations, open wounds, contusions and factures due to hitting, being hit or being trapped by metal, hammers, mallets, electric drills, power tools, timbers and nails.
9% Eye Eye injuries due to metal and other fragments, dust and arc welding equipment.
7% Knee Sprains, strains or injury to joints, muscles and ligaments due to falls on the same level and from a height and muscular stress from handling or not handling objects and from hitting objects.
6% Shoulder Sprains and strains of joints, muscles, ligament and tendons due to muscular stress from handling, lifting, carrying or putting down objects such as timber, metal objects and tools and to a lesser extent from falls on the same level and from a height.
6% Leg Lacerations and open wounds from hitting or being hit by metal objects such as bars, rods, ingots, beams, wire, wire rope, metal strapping and sheet metal.
5% Ankle Sprains, strains of joints, muscles, ligaments and tendon caused by falls due to traffic and ground surfaces, holes in the ground and stairs.
4% Wrist Lacerations, open wounds, sprains, strains and trauma to muscles, joints and ligaments and carpel tunnel syndrome, due to hitting, handling, lifting, carrying or putting down objects such as metal, abrasive, planning and cutting tools, electric drills, pneumatic tools, hammer, mallets and from falls on the same level and from a height.
3% Foot & toes Lacerations, open wounds, sprains, strains and contusions and factures from being hit by falling objects, stepping, kneeling or sitting on objects, falls from the same level and from a height including contact with traffic and ground surfaces, timber and metal.
Source: Queensland Employee Injury Database. Data current as at March 2011 and is subject to change over time.
Based on accepted workers’ compensation claims, excluding commuting claims, between 2000-01 and 2008-09. Note: Includes organisation mainly engaged in the construction of non-residential buildings such as hotels, motels,
hostels, hospitals, prisons, or other institutional buildings, in carrying out alterations, additions or renovation or general repairs to such buildings, or in organising or managing their construction. Primary activities include: commercial buildings construction; hotels construction; industrial buildings construction; institutional buildings construction; prefabricated non-residential buildings assembly, erection or installation (on-site); religious buildings construction; repair (general) or renovation of non-residential buildings.
Construction industry report PN11424 Page 62 of 80
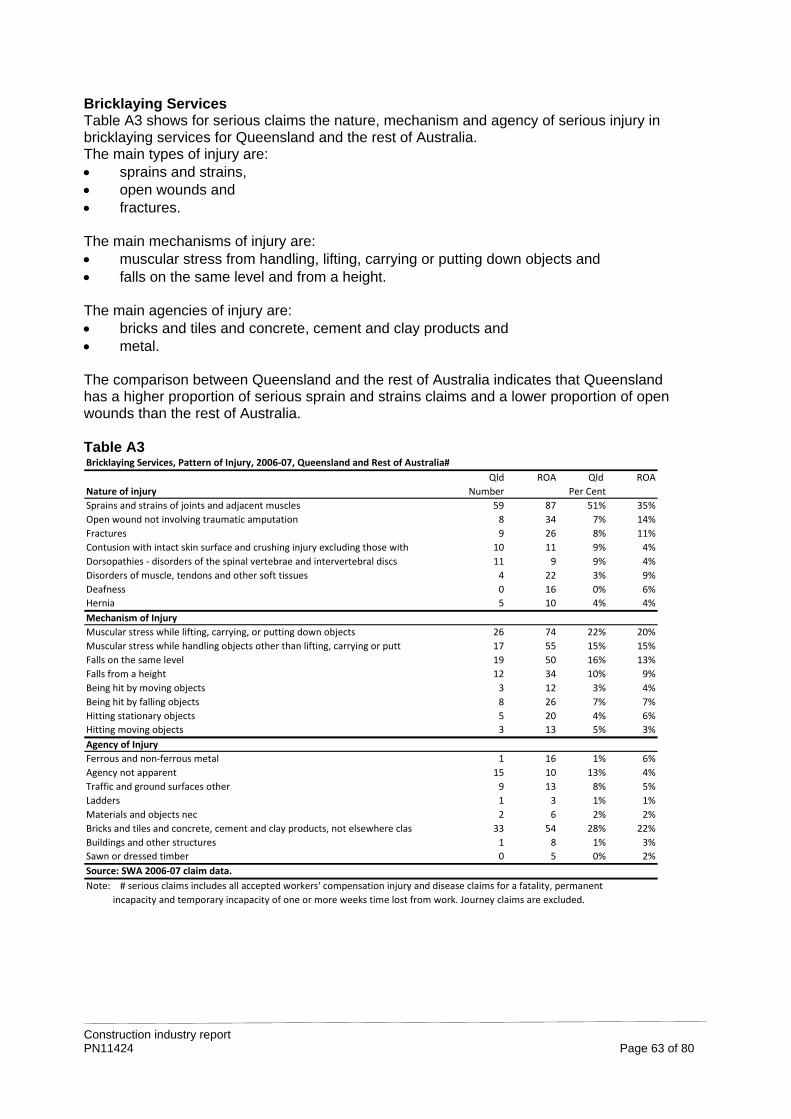
Bricklaying Services Table A3 shows for serious claims the nature, mechanism and agency of serious injury in bricklaying services for Queensland and the rest of Australia. The main types of injury are: sprains and strains, open wounds and fractures. The main mechanisms of injury are: muscular stress from handling, lifting, carrying or putting down objects and falls on the same level and from a height. The main agencies of injury are: bricks and tiles and concrete, cement and clay products and metal. The comparison between Queensland and the rest of Australia indicates that Queensland has a higher proportion of serious sprain and strains claims and a lower proportion of open wounds than the rest of Australia. Table A3 Bricklaying Services, Pattern of Injury, 2006‐07, Queensland and Rest of Australia#
Qld ROA Qld ROA
Nature of injury Number Per Cent
Sprains and strains of joints and adjacent muscles 59 87 51% 35%
Open wound not involving traumatic amputation 8 34 7% 14%
Fractures 9 26 8% 11%
Contusion with intact skin surface and crushing injury excluding those with 10 11 9% 4%
Dorsopathies ‐ disorders of the spinal vertebrae and intervertebral discs 11 9 9% 4%
Disorders of muscle, tendons and other soft tissues 4 22 3% 9%
Deafness 0 16 0%
Hernia 5 10 4%
Mechanism of Injury
Muscular stress while lifting, carrying, or putting down objects 26 74 22% 20%
Muscular stress while handling objects other than lifting, carrying or putt 17 55 15% 15%
Falls on the same level 19 50 16% 13%
Falls from a height 12 34 10% 9%
Being hit by moving objects 3 12 3% 4%
Being hit by falling objects 8 26 7% 7%
Hitting stationary objects 5 20 4% 6%
Hitting moving objects 3 13 5% 3%
Agency of Injury
Ferrous and non‐ferrous metal 1 16 1% 6%
Agency not apparent 15 10 13% 4%
Traffic and ground surfaces other 9 13 8% 5%
Ladders 1 3 1% 1%
Materials and objects nec 2 6 2% 2%
Bricks and tiles and concrete, cement and clay products, not elsewhere clas 33 54 28% 22%
Buildings and other structures 1 8 1% 3%
Sawn or dressed timber 0 5 0% 2%
Source: SWA 2006‐07 claim data.
Note: # serious claims includes all accepted workers' compensation injury and disease claims for a fatality, permanent
incapacity and temporary incapacity of one or more weeks time lost from work. Journey claims are excluded.
6%
4%
Construction industry report PN11424 Page 63 of 80
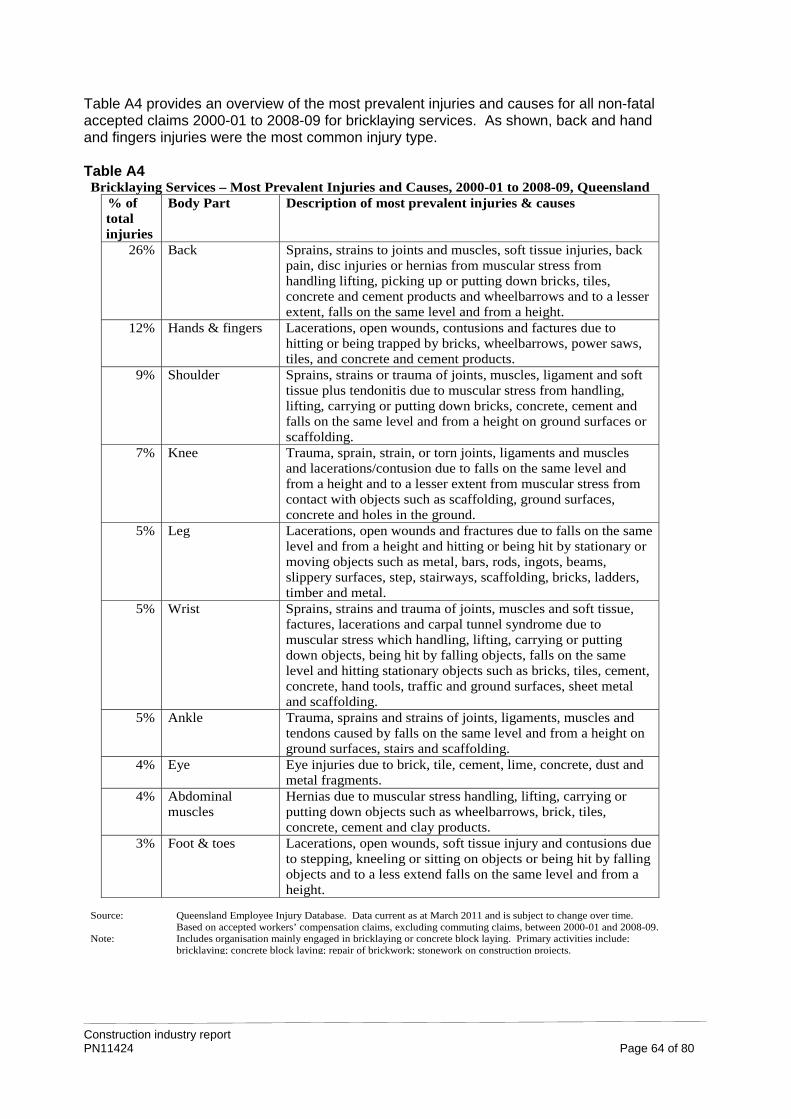
Table A4 provides an overview of the most prevalent injuries and causes for all non-fatal accepted claims 2000-01 to 2008-09 for bricklaying services. As shown, back and hand and fingers injuries were the most common injury type. Table A4 Bricklaying Services – Most Prevalent Injuries and Causes, 2000-01 to 2008-09, Queensland
% of total injuries
Body Part Description of most prevalent injuries & causes
26% Back Sprains, strains to joints and muscles, soft tissue injuries, back pain, disc injuries or hernias from muscular stress from handling lifting, picking up or putting down bricks, tiles, concrete and cement products and wheelbarrows and to a lesser extent, falls on the same level and from a height.
12% Hands & fingers Lacerations, open wounds, contusions and factures due to hitting or being trapped by bricks, wheelbarrows, power saws, tiles, and concrete and cement products.
9% Shoulder Sprains, strains or trauma of joints, muscles, ligament and soft tissue plus tendonitis due to muscular stress from handling, lifting, carrying or putting down bricks, concrete, cement and falls on the same level and from a height on ground surfaces or scaffolding.
7% Knee Trauma, sprain, strain, or torn joints, ligaments and muscles and lacerations/contusion due to falls on the same level and from a height and to a lesser extent from muscular stress from contact with objects such as scaffolding, ground surfaces, concrete and holes in the ground.
5% Leg Lacerations, open wounds and fractures due to falls on the same level and from a height and hitting or being hit by stationary or moving objects such as metal, bars, rods, ingots, beams, slippery surfaces, step, stairways, scaffolding, bricks, ladders, timber and metal.
5% Wrist Sprains, strains and trauma of joints, muscles and soft tissue, factures, lacerations and carpal tunnel syndrome due to muscular stress which handling, lifting, carrying or putting down objects, being hit by falling objects, falls on the same level and hitting stationary objects such as bricks, tiles, cement, concrete, hand tools, traffic and ground surfaces, sheet metal and scaffolding.
5% Ankle Trauma, sprains and strains of joints, ligaments, muscles and tendons caused by falls on the same level and from a height on ground surfaces, stairs and scaffolding.
4% Eye Eye injuries due to brick, tile, cement, lime, concrete, dust and metal fragments.
4% Abdominal muscles
Hernias due to muscular stress handling, lifting, carrying or putting down objects such as wheelbarrows, brick, tiles, concrete, cement and clay products.
3% Foot & toes Lacerations, open wounds, soft tissue injury and contusions due to stepping, kneeling or sitting on objects or being hit by falling objects and to a less extend falls on the same level and from a height.
Source: Queensland Employee Injury Database. Data current as at March 2011 and is subject to change over time.
Based on accepted workers’ compensation claims, excluding commuting claims, between 2000-01 and 2008-09. Note: Includes organisation mainly engaged in bricklaying or concrete block laying. Primary activities include:
bricklaying; concrete block laying; repair of brickwork; stonework on construction projects.
Construction industry report PN11424 Page 64 of 80
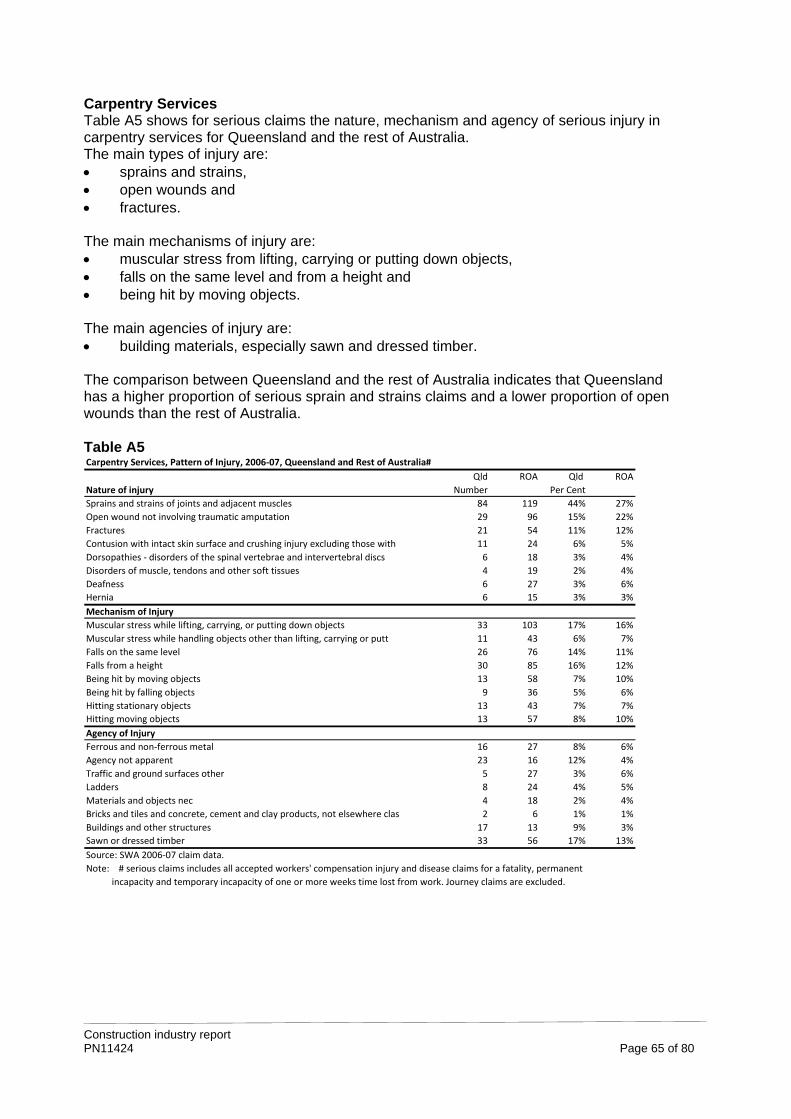
Carpentry Services Table A5 shows for serious claims the nature, mechanism and agency of serious injury in carpentry services for Queensland and the rest of Australia. The main types of injury are: sprains and strains, open wounds and fractures. The main mechanisms of injury are: muscular stress from lifting, carrying or putting down objects, falls on the same level and from a height and being hit by moving objects. The main agencies of injury are: building materials, especially sawn and dressed timber. The comparison between Queensland and the rest of Australia indicates that Queensland has a higher proportion of serious sprain and strains claims and a lower proportion of open wounds than the rest of Australia. Table A5 Carpentry Services, Pattern of Injury, 2006‐07, Queensland and Rest of Australia#
Qld ROA Qld ROA
Nature of injury Number Per Cent
Sprains and strains of joints and adjacent muscles 84 119 44% 27%
Open wound not involving traumatic amputation 29 96 15% 22%
Fractures 21 54 11% 12%
Contusion with intact skin surface and crushing injury excluding those with 11 24 6% 5%
Dorsopathies ‐ disorders of the spinal vertebrae and intervertebral discs 6 18 3% 4%
Disorders of muscle, tendons and other soft tissues 4 19 2% 4%
Deafness 6 27 3%
Hernia 6 15 3%
Mechanism of Injury
Muscular stress while lifting, carrying, or putting down objects 33 103 17% 16%
Muscular stress while handling objects other than lifting, carrying or putt 11 43 6% 7%
Falls on the same level 26 76 14% 11%
Falls from a height 30 85 16% 12%
Being hit by moving objects 13 58 7% 10%
Being hit by falling objects 9 36 5% 6%
Hitting stationary objects 13 43 7% 7%
Hitting moving objects 13 57 8% 10%
Agency of Injury
Ferrous and non‐ferrous metal 16 27 8% 6%
Agency not apparent 23 16 12% 4%
Traffic and ground surfaces other 5 27 3% 6%
Ladders 8 24 4%
Materials and objects nec 4 18 2% 4%
Bricks and tiles and concrete, cement and clay products, not elsewhere clas 2 6 1% 1%
Buildings and other structures 17 13 9% 3%
Sawn or dressed timber 33 56 17% 13%
Source: SWA 2006‐07 claim data.
Note: # serious claims includes all accepted workers' compensation injury and disease claims for a fatality, permanent
incapacity and temporary incapacity of one or more weeks time lost from work. Journey claims are excluded.
6%
3%
5%
Construction industry report PN11424 Page 65 of 80
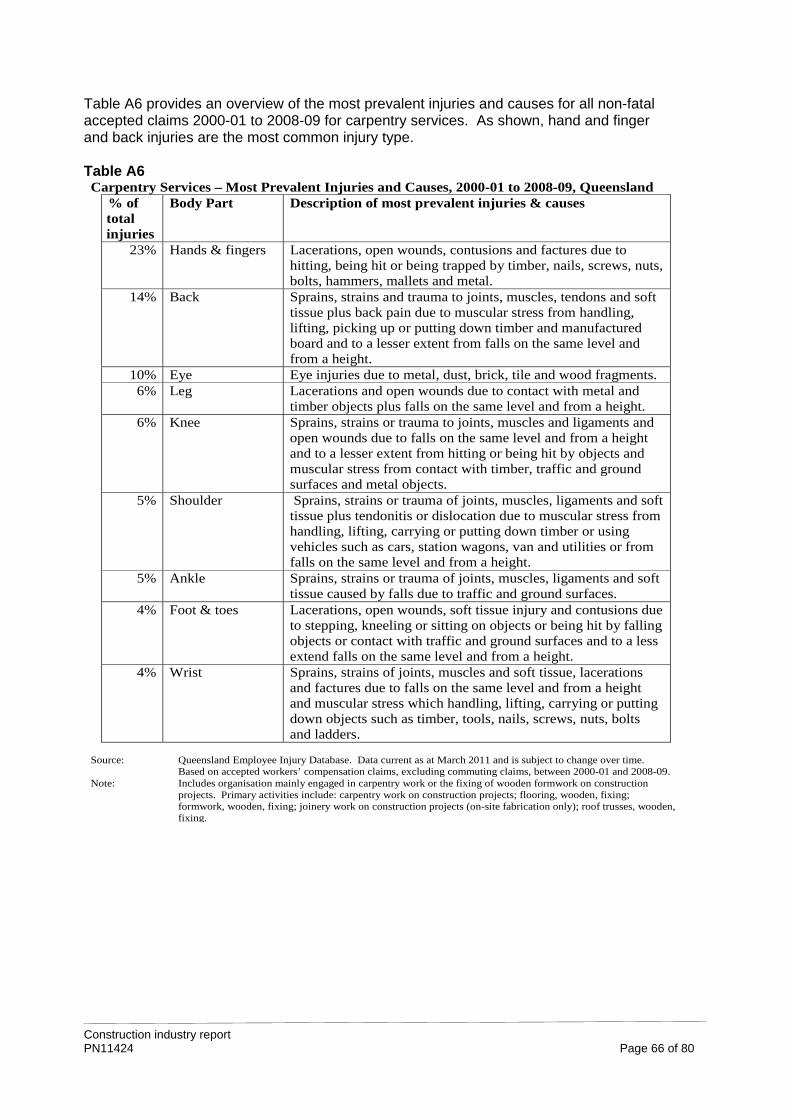
Table A6 provides an overview of the most prevalent injuries and causes for all non-fatal accepted claims 2000-01 to 2008-09 for carpentry services. As shown, hand and finger and back injuries are the most common injury type. Table A6 Carpentry Services – Most Prevalent Injuries and Causes, 2000-01 to 2008-09, Queensland
% of total injuries
Body Part Description of most prevalent injuries & causes
23% Hands & fingers Lacerations, open wounds, contusions and factures due to hitting, being hit or being trapped by timber, nails, screws, nuts, bolts, hammers, mallets and metal.
14% Back Sprains, strains and trauma to joints, muscles, tendons and soft tissue plus back pain due to muscular stress from handling, lifting, picking up or putting down timber and manufactured board and to a lesser extent from falls on the same level and from a height.
10% Eye Eye injuries due to metal, dust, brick, tile and wood fragments. 6% Leg Lacerations and open wounds due to contact with metal and
timber objects plus falls on the same level and from a height. 6% Knee Sprains, strains or trauma to joints, muscles and ligaments and
open wounds due to falls on the same level and from a height and to a lesser extent from hitting or being hit by objects and muscular stress from contact with timber, traffic and ground surfaces and metal objects.
5% Shoulder Sprains, strains or trauma of joints, muscles, ligaments and soft tissue plus tendonitis or dislocation due to muscular stress from handling, lifting, carrying or putting down timber or using vehicles such as cars, station wagons, van and utilities or from falls on the same level and from a height.
5% Ankle Sprains, strains or trauma of joints, muscles, ligaments and soft tissue caused by falls due to traffic and ground surfaces.
4% Foot & toes Lacerations, open wounds, soft tissue injury and contusions due to stepping, kneeling or sitting on objects or being hit by falling objects or contact with traffic and ground surfaces and to a less extend falls on the same level and from a height.
4% Wrist Sprains, strains of joints, muscles and soft tissue, lacerations and factures due to falls on the same level and from a height and muscular stress which handling, lifting, carrying or putting down objects such as timber, tools, nails, screws, nuts, bolts and ladders.
Source: Queensland Employee Injury Database. Data current as at March 2011 and is subject to change over time.
Based on accepted workers’ compensation claims, excluding commuting claims, between 2000-01 and 2008-09. Note: Includes organisation mainly engaged in carpentry work or the fixing of wooden formwork on construction
projects. Primary activities include: carpentry work on construction projects; flooring, wooden, fixing; formwork, wooden, fixing; joinery work on construction projects (on-site fabrication only); roof trusses, wooden, fixing.
Construction industry report PN11424 Page 66 of 80
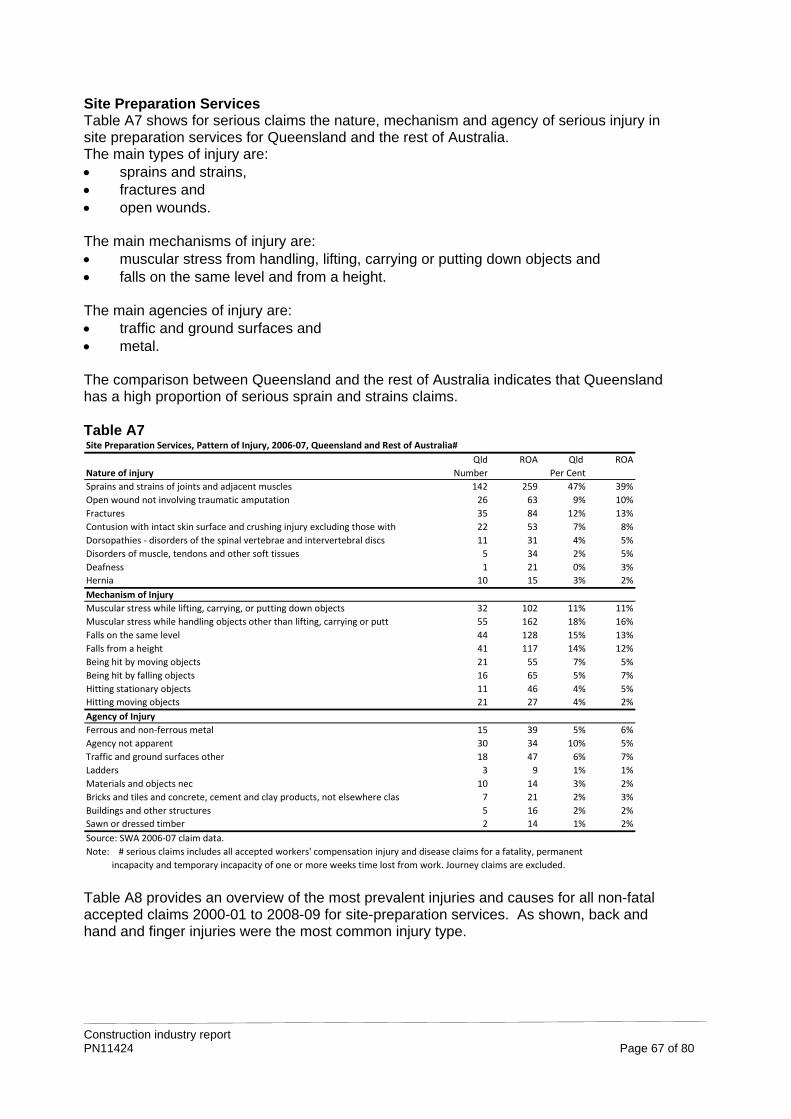
Site Preparation Services Table A7 shows for serious claims the nature, mechanism and agency of serious injury in site preparation services for Queensland and the rest of Australia. The main types of injury are: sprains and strains, fractures and open wounds. The main mechanisms of injury are: muscular stress from handling, lifting, carrying or putting down objects and falls on the same level and from a height. The main agencies of injury are: traffic and ground surfaces and metal. The comparison between Queensland and the rest of Australia indicates that Queensland has a high proportion of serious sprain and strains claims. Table A7 Site Preparation Services, Pattern of Injury, 2006‐07, Queensland and Rest of Australia#
Qld ROA Qld ROA
Nature of injury Number Per Cent
Sprains and strains of joints and adjacent muscles 142 259 47% 39%
Open wound not involving traumatic amputation 26 63 9% 10%
Fractures 35 84 12% 13%
Contusion with intact skin surface and crushing injury excluding those with 22 53 7% 8%
Dorsopathies ‐ disorders of the spinal vertebrae and intervertebral discs 11 31 4% 5%
Disorders of muscle, tendons and other soft tissues 5 34 2% 5%
Deafness 1 21 0%
Hernia 10 15 3% 2%
Mechanism of Injury
Muscular stress while lifting, carrying, or putting down objects 32 102 11% 11%
Muscular stress while handling objects other than lifting, carrying or putt 55 162 18% 16%
Falls on the same level 44 128 15% 13%
Falls from a height 41 117 14% 12%
Being hit by moving objects 21 55 7% 5%
Being hit by falling objects 16 65 5% 7%
Hitting stationary objects 11 46 4% 5%
Hitting moving objects 21 27 4% 2%
Agency of Injury
Ferrous and non‐ferrous metal 15 39 5% 6%
Agency not apparent 30 34 10% 5%
Traffic and ground surfaces other 18 47 6% 7%
Ladders 3 9 1% 1%
Materials and objects nec 10 14 3% 2%
Bricks and tiles and concrete, cement and clay products, not elsewhere clas 7 21 2% 3%
Buildings and other structures 5 16 2% 2%
Sawn or dressed timber 2 14 1% 2%
Source: SWA 2006‐07 claim data.
Note: # serious claims includes all accepted workers' compensation injury and disease claims for a fatality, permanent
incapacity and temporary incapacity of one or more weeks time lost from work. Journey claims are excluded.
3%
Table A8 provides an overview of the most prevalent injuries and causes for all non-fatal accepted claims 2000-01 to 2008-09 for site-preparation services. As shown, back and hand and finger injuries were the most common injury type.
Construction industry report PN11424 Page 67 of 80
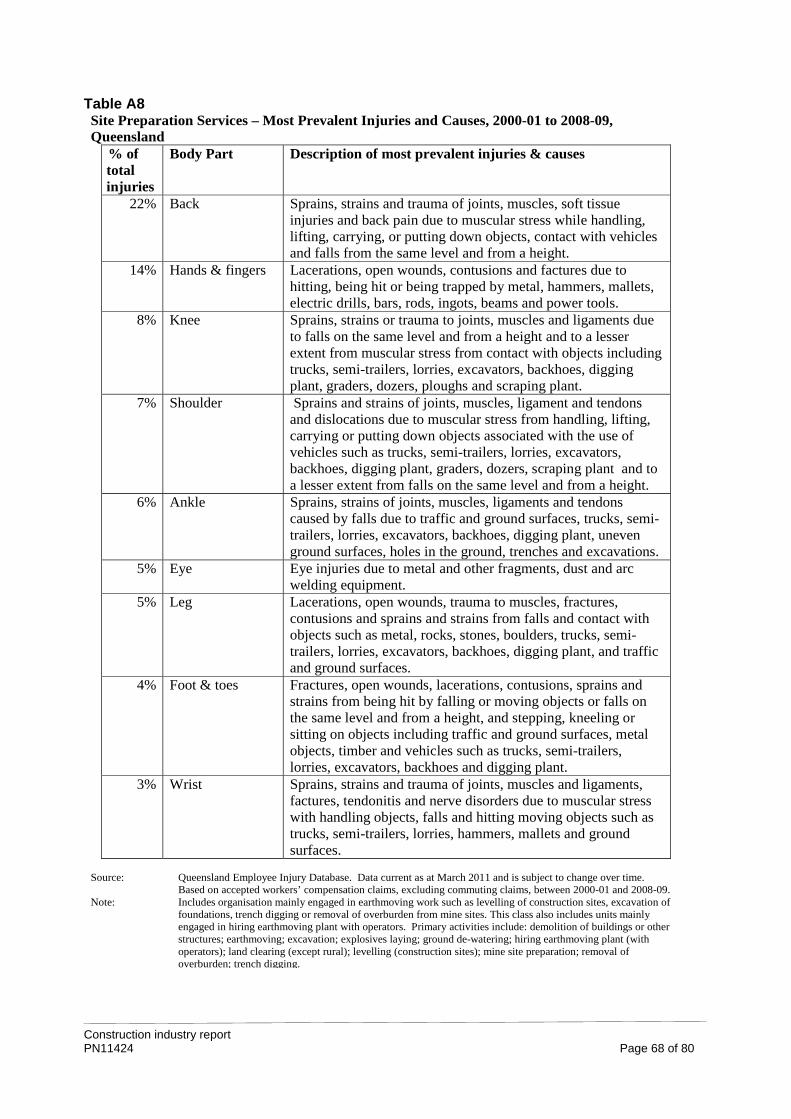
Table A8 Site Preparation Services – Most Prevalent Injuries and Causes, 2000-01 to 2008-09, Queensland
% of total injuries
Body Part Description of most prevalent injuries & causes
22% Back Sprains, strains and trauma of joints, muscles, soft tissue injuries and back pain due to muscular stress while handling, lifting, carrying, or putting down objects, contact with vehicles and falls from the same level and from a height.
14% Hands & fingers Lacerations, open wounds, contusions and factures due to hitting, being hit or being trapped by metal, hammers, mallets, electric drills, bars, rods, ingots, beams and power tools.
8% Knee Sprains, strains or trauma to joints, muscles and ligaments due to falls on the same level and from a height and to a lesser extent from muscular stress from contact with objects including trucks, semi-trailers, lorries, excavators, backhoes, digging plant, graders, dozers, ploughs and scraping plant.
7% Shoulder Sprains and strains of joints, muscles, ligament and tendons and dislocations due to muscular stress from handling, lifting, carrying or putting down objects associated with the use of vehicles such as trucks, semi-trailers, lorries, excavators, backhoes, digging plant, graders, dozers, scraping plant and to a lesser extent from falls on the same level and from a height.
6% Ankle Sprains, strains of joints, muscles, ligaments and tendons caused by falls due to traffic and ground surfaces, trucks, semi-trailers, lorries, excavators, backhoes, digging plant, uneven ground surfaces, holes in the ground, trenches and excavations.
5% Eye Eye injuries due to metal and other fragments, dust and arc welding equipment.
5% Leg Lacerations, open wounds, trauma to muscles, fractures, contusions and sprains and strains from falls and contact with objects such as metal, rocks, stones, boulders, trucks, semi-trailers, lorries, excavators, backhoes, digging plant, and traffic and ground surfaces.
4% Foot & toes Fractures, open wounds, lacerations, contusions, sprains and strains from being hit by falling or moving objects or falls on the same level and from a height, and stepping, kneeling or sitting on objects including traffic and ground surfaces, metal objects, timber and vehicles such as trucks, semi-trailers, lorries, excavators, backhoes and digging plant.
3% Wrist Sprains, strains and trauma of joints, muscles and ligaments, factures, tendonitis and nerve disorders due to muscular stress with handling objects, falls and hitting moving objects such as trucks, semi-trailers, lorries, hammers, mallets and ground surfaces.
Source: Queensland Employee Injury Database. Data current as at March 2011 and is subject to change over time.
Based on accepted workers’ compensation claims, excluding commuting claims, between 2000-01 and 2008-09. Note: Includes organisation mainly engaged in earthmoving work such as levelling of construction sites, excavation of
foundations, trench digging or removal of overburden from mine sites. This class also includes units mainly engaged in hiring earthmoving plant with operators. Primary activities include: demolition of buildings or other structures; earthmoving; excavation; explosives laying; ground de-watering; hiring earthmoving plant (with operators); land clearing (except rural); levelling (construction sites); mine site preparation; removal of overburden; trench digging.
Construction industry report PN11424 Page 68 of 80
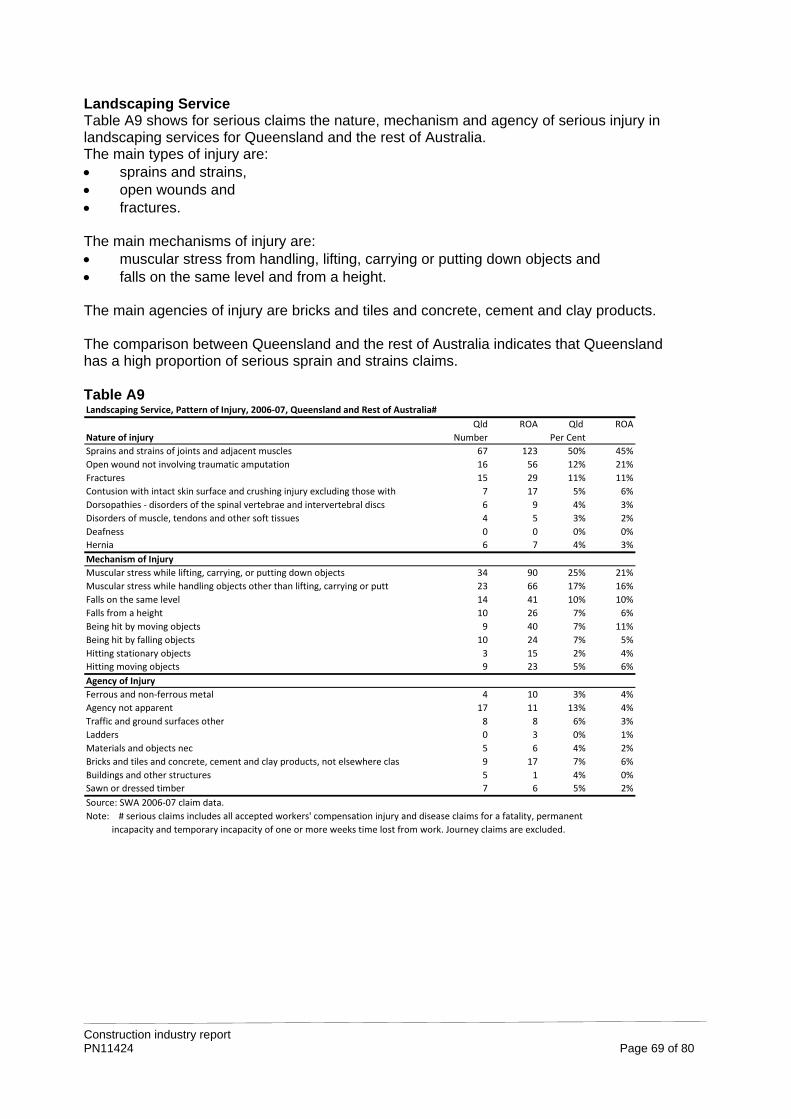
Landscaping Service Table A9 shows for serious claims the nature, mechanism and agency of serious injury in landscaping services for Queensland and the rest of Australia. The main types of injury are: sprains and strains, open wounds and fractures. The main mechanisms of injury are: muscular stress from handling, lifting, carrying or putting down objects and falls on the same level and from a height. The main agencies of injury are bricks and tiles and concrete, cement and clay products. The comparison between Queensland and the rest of Australia indicates that Queensland has a high proportion of serious sprain and strains claims. Table A9 Landscaping Service, Pattern of Injury, 2006‐07, Queensland and Rest of Australia#
Qld ROA Qld ROA
Nature of injury Number Per Cent
Sprains and strains of joints and adjacent muscles 67 123 50% 45%
Open wound not involving traumatic amputation 16 56 12% 21%
Fractures 15 29 11% 11%
Contusion with intact skin surface and crushing injury excluding those with 7 17 5% 6%
Dorsopathies ‐ disorders of the spinal vertebrae and intervertebral discs 6 9 4% 3%
Disorders of muscle, tendons and other soft tissues 4 5 3% 2%
Deafness 0 0 0% 0%
Hernia 6 7 4% 3%
Mechanism of Injury
Muscular stress while lifting, carrying, or putting down objects 34 90 25% 21%
Muscular stress while handling objects other than lifting, carrying or putt 23 66 17% 16%
Falls on the same level 14 41 10% 10%
Falls from a height 10 26 7% 6%
Being hit by moving objects 9 40 7% 11%
Being hit by falling objects 10 24 7% 5%
Hitting stationary objects 3 15 2% 4%
Hitting moving objects 9 23 5% 6%
Agency of Injury
Ferrous and non‐ferrous metal 4 10 3% 4%
Agency not apparent 17 11 13% 4%
Traffic and ground surfaces other 8 8 6% 3%
Ladders 0 3 0% 1%
Materials and objects nec 5 6 4% 2%
Bricks and tiles and concrete, cement and clay products, not elsewhere clas 9 17 7% 6%
Buildings and other structures 5 1 4% 0%
Sawn or dressed timber 7 6 5% 2%
Source: SWA 2006‐07 claim data.
Note: # serious claims includes all accepted workers' compensation injury and disease claims for a fatality, permanent
incapacity and temporary incapacity of one or more weeks time lost from work. Journey claims are excluded.
Construction industry report PN11424 Page 69 of 80
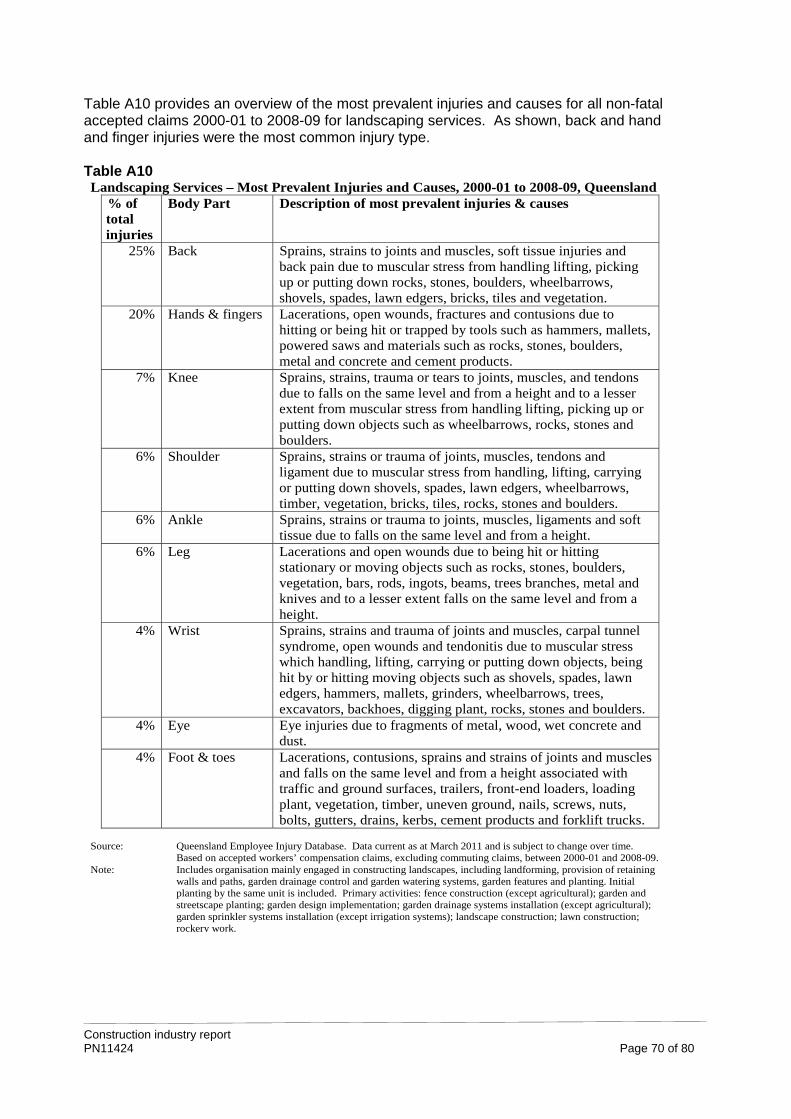
Table A10 provides an overview of the most prevalent injuries and causes for all non-fatal accepted claims 2000-01 to 2008-09 for landscaping services. As shown, back and hand and finger injuries were the most common injury type. Table A10 Landscaping Services – Most Prevalent Injuries and Causes, 2000-01 to 2008-09, Queensland
% of total injuries
Body Part Description of most prevalent injuries & causes
25% Back Sprains, strains to joints and muscles, soft tissue injuries and back pain due to muscular stress from handling lifting, picking up or putting down rocks, stones, boulders, wheelbarrows, shovels, spades, lawn edgers, bricks, tiles and vegetation.
20% Hands & fingers Lacerations, open wounds, fractures and contusions due to hitting or being hit or trapped by tools such as hammers, mallets, powered saws and materials such as rocks, stones, boulders, metal and concrete and cement products.
7% Knee Sprains, strains, trauma or tears to joints, muscles, and tendons due to falls on the same level and from a height and to a lesser extent from muscular stress from handling lifting, picking up or putting down objects such as wheelbarrows, rocks, stones and boulders.
6% Shoulder Sprains, strains or trauma of joints, muscles, tendons and ligament due to muscular stress from handling, lifting, carrying or putting down shovels, spades, lawn edgers, wheelbarrows, timber, vegetation, bricks, tiles, rocks, stones and boulders.
6% Ankle Sprains, strains or trauma to joints, muscles, ligaments and soft tissue due to falls on the same level and from a height.
6% Leg Lacerations and open wounds due to being hit or hitting stationary or moving objects such as rocks, stones, boulders, vegetation, bars, rods, ingots, beams, trees branches, metal and knives and to a lesser extent falls on the same level and from a height.
4% Wrist Sprains, strains and trauma of joints and muscles, carpal tunnel syndrome, open wounds and tendonitis due to muscular stress which handling, lifting, carrying or putting down objects, being hit by or hitting moving objects such as shovels, spades, lawn edgers, hammers, mallets, grinders, wheelbarrows, trees, excavators, backhoes, digging plant, rocks, stones and boulders.
4% Eye Eye injuries due to fragments of metal, wood, wet concrete and dust.
4% Foot & toes Lacerations, contusions, sprains and strains of joints and muscles and falls on the same level and from a height associated with traffic and ground surfaces, trailers, front-end loaders, loading plant, vegetation, timber, uneven ground, nails, screws, nuts, bolts, gutters, drains, kerbs, cement products and forklift trucks.
Source: Queensland Employee Injury Database. Data current as at March 2011 and is subject to change over time.
Based on accepted workers’ compensation claims, excluding commuting claims, between 2000-01 and 2008-09. Note: Includes organisation mainly engaged in constructing landscapes, including landforming, provision of retaining
walls and paths, garden drainage control and garden watering systems, garden features and planting. Initial planting by the same unit is included. Primary activities: fence construction (except agricultural); garden and streetscape planting; garden design implementation; garden drainage systems installation (except agricultural); garden sprinkler systems installation (except irrigation systems); landscape construction; lawn construction; rockery work.
Construction industry report PN11424 Page 70 of 80
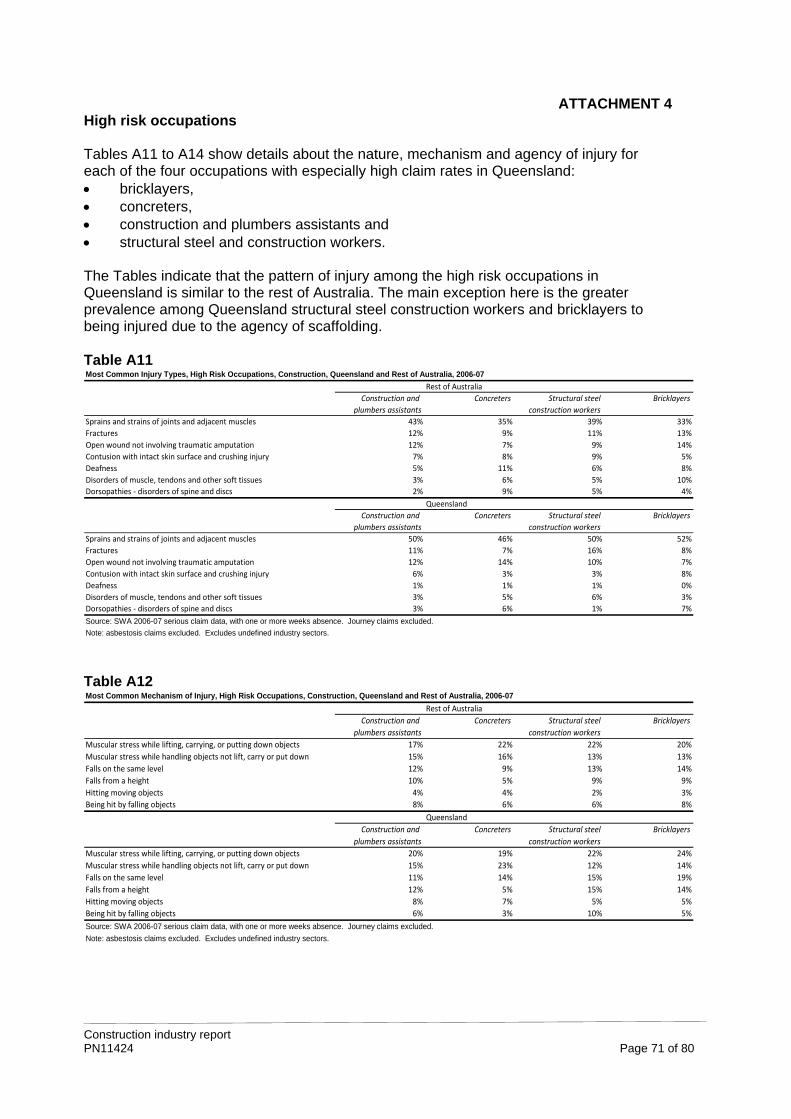
ATTACHMENT 4 High risk occupations Tables A11 to A14 show details about the nature, mechanism and agency of injury for each of the four occupations with especially high claim rates in Queensland: bricklayers, concreters, construction and plumbers assistants and structural steel and construction workers. The Tables indicate that the pattern of injury among the high risk occupations in Queensland is similar to the rest of Australia. The main exception here is the greater prevalence among Queensland structural steel construction workers and bricklayers to being injured due to the agency of scaffolding. Table A11 Most Common Injury Types, High Risk Occupations, Construction, Queensland and Rest of Australia, 2006-07
Rest of Australia
Construction and Concreters Structural steel Bricklayers
plumbers assistants construction workers
Sprains and strains of joints and adjacent muscles 43% 35% 39% 33%
Fractures 12% 9% 11% 13%
Open wound not involving traumatic amputation 12% 7% 9% 14%
Contusion with intact skin surface and crushing injury 7% 8% 9% 5%
Deafness 5% 11% 6% 8%
Disorders of muscle, tendons and other soft tissues 3% 6% 5%
Dorsopathies ‐ disorders of spine and discs 2% 9% 5%
Queensland
Construction and Concreters Structural steel Bricklayers
10%
4%
plumbers assistants construction workers
Sprains and strains of joints and adjacent muscles 50% 46% 50% 52%
Fractures 11% 7% 16% 8%
Open wound not involving traumatic amputation 12% 14% 10% 7%
Contusion with intact skin surface and crushing injury 6% 3% 3% 8%
Deafness 1% 1% 1% 0%
Disorders of muscle, tendons and other soft tissues 3% 5% 6%
Dorsopathies ‐ disorders of spine and discs 3% 6% 1%
Source: SWA 2006-07 serious claim data, with one or more weeks absence. Journey claims excluded.
Note: asbestosis claims excluded. Excludes undefined industry sectors.
3%
7%
Table A12 Most Common Mechanism of Injury, High Risk Occupations, Construction, Queensland and Rest of Australia, 2006-07
Rest of Australia
Construction and Concreters Structural steel Bricklayers
plumbers assistants construction workers
Muscular stress while lifting, carrying, or putting down objects 17% 22% 22% 20%
Muscular stress while handling objects not lift, carry or put down 15% 16% 13% 13%
Falls on the same level 12% 9% 13% 14%
Falls from a height 10% 5% 9% 9%
Hitting moving objects 4% 4% 2%
Being hit by falling objects 8% 6% 6%
Queensland
Construction and Concreters Structural steel Bricklayers
3%
8%
plumbers assistants construction workers
Muscular stress while lifting, carrying, or putting down objects 20% 19% 22% 24%
Muscular stress while handling objects not lift, carry or put down 15% 23% 12% 14%
Falls on the same level 11% 14% 15% 19%
Falls from a height 12% 5% 15% 14%
Hitting moving objects 8% 7% 5%
Being hit by falling objects 6% 3% 10% 5%
Source: SWA 2006-07 serious claim data, with one or more weeks absence. Journey claims excluded.
Note: asbestosis claims excluded. Excludes undefined industry sectors.
5%
Construction industry report PN11424 Page 71 of 80
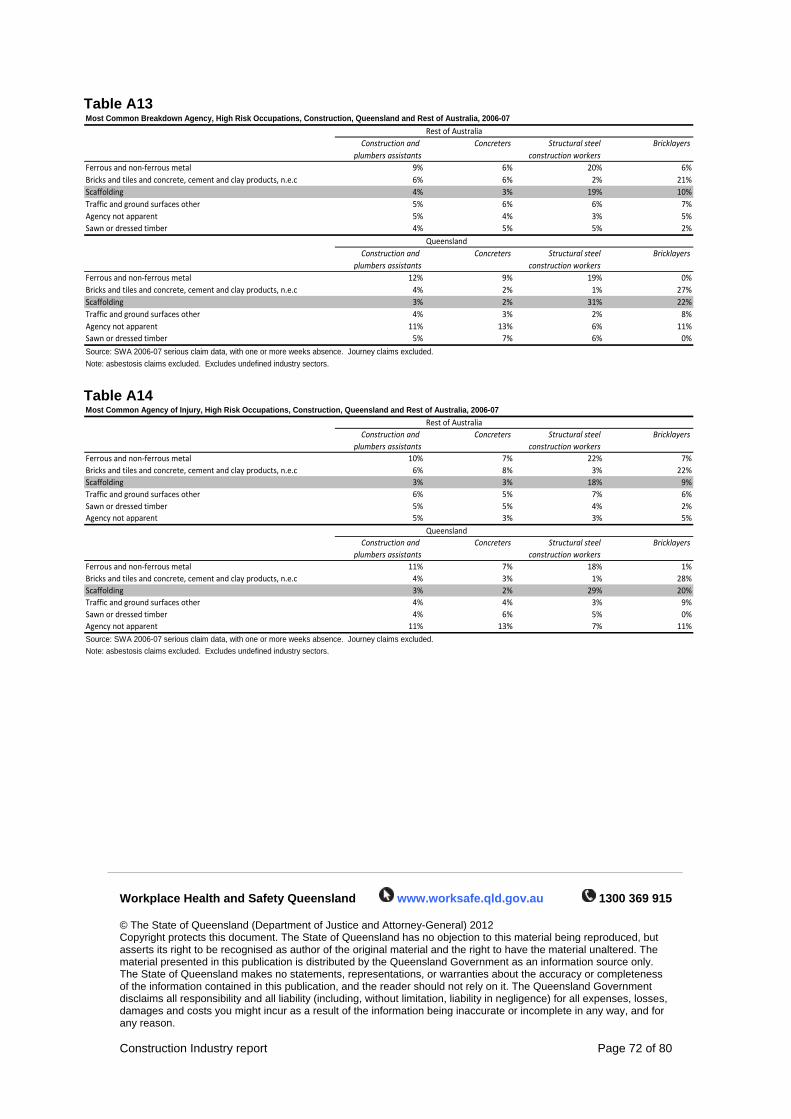
Table A13 Most Common Breakdown Agency, High Risk Occupations, Construction, Queensland and Rest of Australia, 2006-07
Rest of Australia
Construction and Concreters Structural steel Bricklayers
plumbers assistants construction workers
Ferrous and non‐ferrous metal 9% 6% 20% 6%
Bricks and tiles and concrete, cement and clay products, n.e.c 6% 6% 2%
Scaffolding 4% 3% 19% 10%
Traffic and ground surfaces other 5% 6% 6%
Agency not apparent 5% 4% 3% 5%
Sawn or dressed timber 4% 5% 5% 2%
Queensland
Construction and Concreters Structural steel Bricklayers
21%
7%
plumbers assistants construction workers
Ferrous and non‐ferrous metal 12% 9% 19% 0%
Bricks and tiles and concrete, cement and clay products, n.e.c 4% 2% 1%
Scaffolding 3% 2% 31% 22%
Traffic and ground surfaces other 4% 3% 2%
Agency not apparent 11% 13% 6% 11%
Sawn or dressed timber 5% 7% 6% 0%
Source: SWA 2006-07 serious claim data, with one or more weeks absence. Journey claims excluded.
Note: asbestosis claims excluded. Excludes undefined industry sectors.
27%
8%
Table A14 Most Common Agency of Injury, High Risk Occupations, Construction, Queensland and Rest of Australia, 2006-07
Rest of Australia
Construction and Concreters Structural steel Bricklayers
plumbers assistants construction workers
Ferrous and non‐ferrous metal 10% 7% 22% 7%
Bricks and tiles and concrete, cement and clay products, n.e.c 6% 8% 3%
Scaffolding 3% 3% 18% 9%
Traffic and ground surfaces other 6% 5% 7%
Sawn or dressed timber 5% 5% 4% 2%
Agency not apparent 5% 3% 3% 5%
Queensland
Construction and Concreters Structural steel Bricklayers
22%
6%
plumbers assistants construction workers
Ferrous and non‐ferrous metal 11% 7% 18% 1%
Bricks and tiles and concrete, cement and clay products, n.e.c 4% 3% 1%
Scaffolding 3% 2% 29% 20%
Traffic and ground surfaces other 4% 4% 3%
Sawn or dressed timber 4% 6% 5% 0%
Agency not apparent 11% 13% 7% 11%
Source: SWA 2006-07 serious claim data, with one or more weeks absence. Journey claims excluded.
Note: asbestosis claims excluded. Excludes undefined industry sectors.
28%
9%
Workplace Health and Safety Queensland www.worksafe.qld.gov.au 1300 369 915 © The State of Queensland (Department of Justice and Attorney-General) 2012 Copyright protects this document. The State of Queensland has no objection to this material being reproduced, but asserts its right to be recognised as author of the original material and the right to have the material unaltered. The material presented in this publication is distributed by the Queensland Government as an information source only. The State of Queensland makes no statements, representations, or warranties about the accuracy or completeness of the information contained in this publication, and the reader should not rely on it. The Queensland Government disclaims all responsibility and all liability (including, without limitation, liability in negligence) for all expenses, losses, damages and costs you might incur as a result of the information being inaccurate or incomplete in any way, and for any reason. Construction Industry report Page 72 of 80
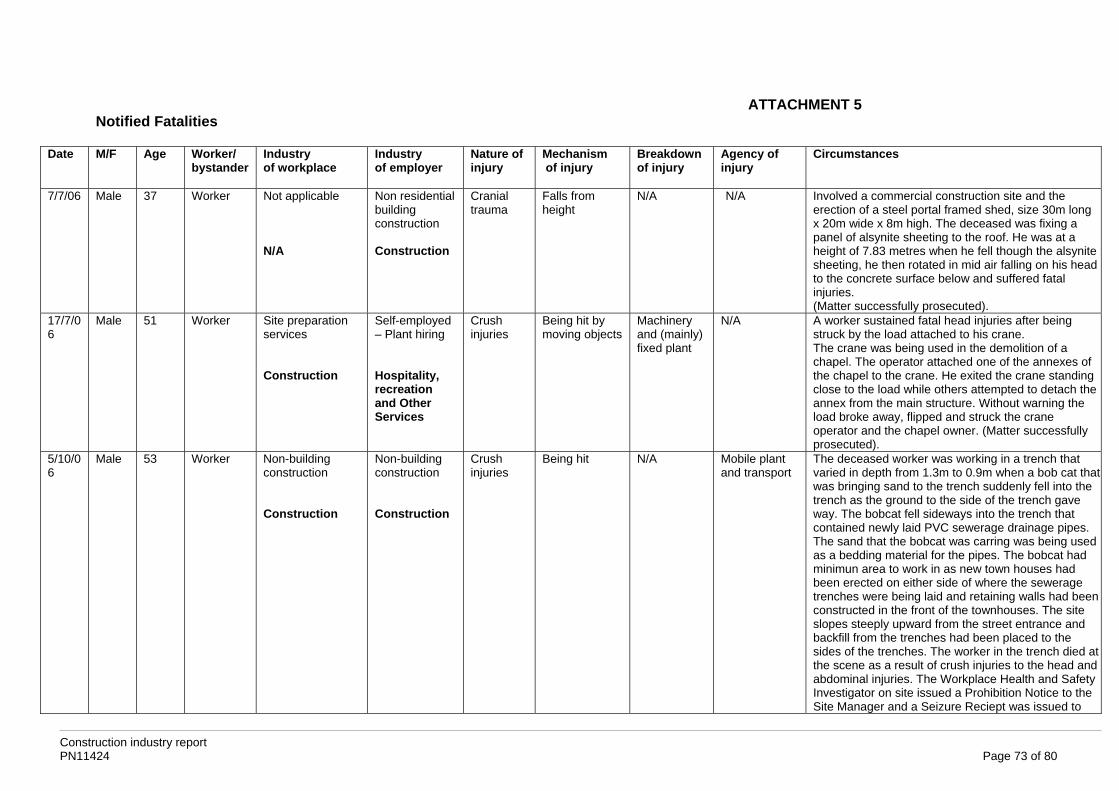
ATTACHMENT 5 Notified Fatalities
Date M/F Age Worker/ bystander
Industry of workplace
Industry of employer
Nature of injury
Mechanism of injury
Breakdown of injury
Agency of injury
Circumstances
7/7/06 Male 37 Worker Not applicable N/A
Non residential building construction Construction
Cranial trauma
Falls from height
N/A N/A Involved a commercial construction site and the erection of a steel portal framed shed, size 30m long x 20m wide x 8m high. The deceased was fixing a panel of alsynite sheeting to the roof. He was at a height of 7.83 metres when he fell though the alsynite sheeting, he then rotated in mid air falling on his head to the concrete surface below and suffered fatal injuries. (Matter successfully prosecuted).
17/7/06
Male 51 Worker Site preparation services Construction
Self-employed – Plant hiring Hospitality, recreation and Other Services
Crush injuries
Being hit by moving objects
Machinery and (mainly) fixed plant
N/A A worker sustained fatal head injuries after being struck by the load attached to his crane. The crane was being used in the demolition of a chapel. The operator attached one of the annexes of the chapel to the crane. He exited the crane standing close to the load while others attempted to detach the annex from the main structure. Without warning the load broke away, flipped and struck the crane operator and the chapel owner. (Matter successfully prosecuted).
5/10/06
Male 53 Worker Non-building construction Construction
Non-building construction Construction
Crush injuries
Being hit N/A Mobile plant and transport
The deceased worker was working in a trench that varied in depth from 1.3m to 0.9m when a bob cat that was bringing sand to the trench suddenly fell into the trench as the ground to the side of the trench gave way. The bobcat fell sideways into the trench that contained newly laid PVC sewerage drainage pipes. The sand that the bobcat was carring was being used as a bedding material for the pipes. The bobcat had minimun area to work in as new town houses had been erected on either side of where the sewerage trenches were being laid and retaining walls had been constructed in the front of the townhouses. The site slopes steeply upward from the street entrance and backfill from the trenches had been placed to the sides of the trenches. The worker in the trench died at the scene as a result of crush injuries to the head and abdominal injuries. The Workplace Health and Safety Investigator on site issued a Prohibition Notice to the Site Manager and a Seizure Reciept was issued to
Construction industry report PN11424 Page 73 of 80
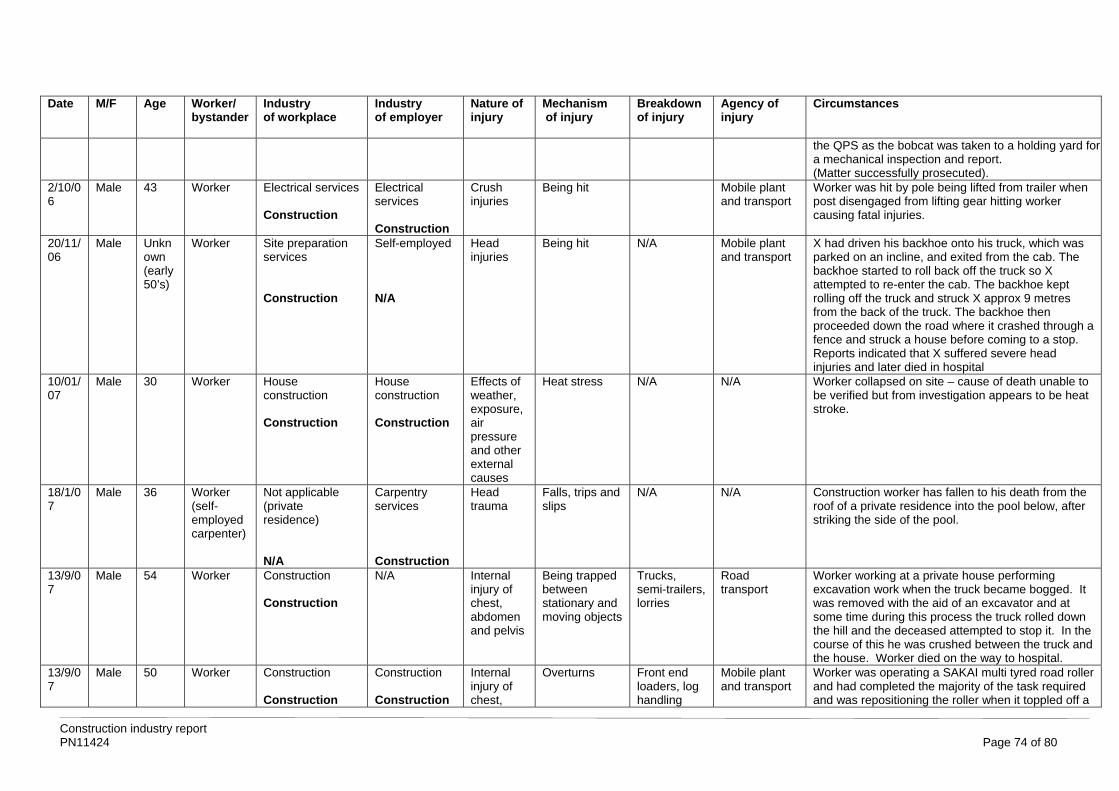
Date M/F Age Worker/ bystander
Industry of workplace
Industry of employer
Nature of injury
Mechanism of injury
Breakdown of injury
Agency of injury
Circumstances
the QPS as the bobcat was taken to a holding yard for a mechanical inspection and report. (Matter successfully prosecuted).
2/10/06
Male 43 Worker Electrical services Construction
Electrical services Construction
Crush injuries
Being hit Mobile plant and transport
Worker was hit by pole being lifted from trailer when post disengaged from lifting gear hitting worker causing fatal injuries.
20/11/06
Male Unknown (early 50’s)
Worker Site preparation services Construction
Self-employed N/A
Head injuries
Being hit N/A Mobile plant and transport
X had driven his backhoe onto his truck, which was parked on an incline, and exited from the cab. The backhoe started to roll back off the truck so X attempted to re-enter the cab. The backhoe kept rolling off the truck and struck X approx 9 metres from the back of the truck. The backhoe then proceeded down the road where it crashed through a fence and struck a house before coming to a stop. Reports indicated that X suffered severe head injuries and later died in hospital
10/01/07
Male 30 Worker House construction Construction
House construction Construction
Effects of weather, exposure, air pressure and other external causes
Heat stress N/A N/A Worker collapsed on site – cause of death unable to be verified but from investigation appears to be heat stroke.
18/1/07
Male 36 Worker (self-employed carpenter)
Not applicable (private residence) N/A
Carpentry services Construction
Head trauma
Falls, trips and slips
N/A N/A Construction worker has fallen to his death from the roof of a private residence into the pool below, after striking the side of the pool.
13/9/07
Male 54 Worker Construction Construction
N/A Internal injury of chest, abdomen and pelvis
Being trapped between stationary and moving objects
Trucks, semi-trailers, lorries
Road transport
Worker working at a private house performing excavation work when the truck became bogged. It was removed with the aid of an excavator and at some time during this process the truck rolled down the hill and the deceased attempted to stop it. In the course of this he was crushed between the truck and the house. Worker died on the way to hospital.
13/9/07
Male 50 Worker Construction Construction
Construction Construction
Internal injury of chest,
Overturns Front end loaders, log handling
Mobile plant and transport
Worker was operating a SAKAI multi tyred road roller and had completed the majority of the task required and was repositioning the roller when it toppled off a
Construction industry report PN11424 Page 74 of 80
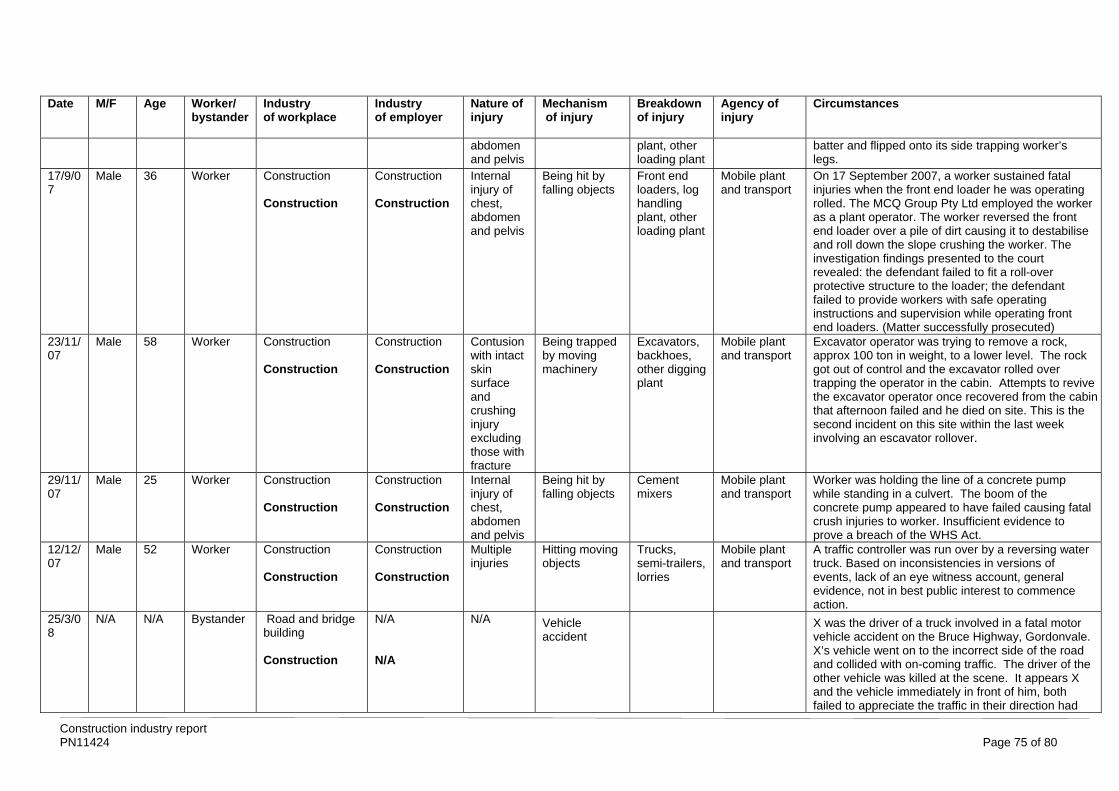
Date M/F Age Worker/ bystander
Industry of workplace
Industry of employer
Nature of injury
Mechanism of injury
Breakdown of injury
Agency of injury
Circumstances
abdomen and pelvis
plant, other loading plant
batter and flipped onto its side trapping worker’s legs.
17/9/07
Male 36 Worker Construction Construction
Construction Construction
Internal injury of chest, abdomen and pelvis
Being hit by falling objects
Front end loaders, log handling plant, other loading plant
Mobile plant and transport
On 17 September 2007, a worker sustained fatal injuries when the front end loader he was operating rolled. The MCQ Group Pty Ltd employed the worker as a plant operator. The worker reversed the front end loader over a pile of dirt causing it to destabilise and roll down the slope crushing the worker. The investigation findings presented to the court revealed: the defendant failed to fit a roll-over protective structure to the loader; the defendant failed to provide workers with safe operating instructions and supervision while operating front end loaders. (Matter successfully prosecuted)
23/11/07
Male 58 Worker Construction Construction
Construction Construction
Contusion with intact skin surface and crushing injury excluding those with fracture
Being trapped by moving machinery
Excavators, backhoes, other digging plant
Mobile plant and transport
Excavator operator was trying to remove a rock, approx 100 ton in weight, to a lower level. The rock got out of control and the excavator rolled over trapping the operator in the cabin. Attempts to revive the excavator operator once recovered from the cabin that afternoon failed and he died on site. This is the second incident on this site within the last week involving an escavator rollover.
29/11/07
Male 25 Worker Construction Construction
Construction Construction
Internal injury of chest, abdomen and pelvis
Being hit by falling objects
Cement mixers
Mobile plant and transport
Worker was holding the line of a concrete pump while standing in a culvert. The boom of the concrete pump appeared to have failed causing fatal crush injuries to worker. Insufficient evidence to prove a breach of the WHS Act.
12/12/07
Male 52 Worker Construction Construction
Construction Construction
Multiple injuries
Hitting moving objects
Trucks, semi-trailers, lorries
Mobile plant and transport
A traffic controller was run over by a reversing water truck. Based on inconsistencies in versions of events, lack of an eye witness account, general evidence, not in best public interest to commence action.
25/3/08
N/A N/A Bystander Road and bridge building Construction
N/A N/A
N/A Vehicle accident
X was the driver of a truck involved in a fatal motor vehicle accident on the Bruce Highway, Gordonvale. X’s vehicle went on to the incorrect side of the road and collided with on-coming traffic. The driver of the other vehicle was killed at the scene. It appears X and the vehicle immediately in front of him, both failed to appreciate the traffic in their direction had
Construction industry report PN11424 Page 75 of 80
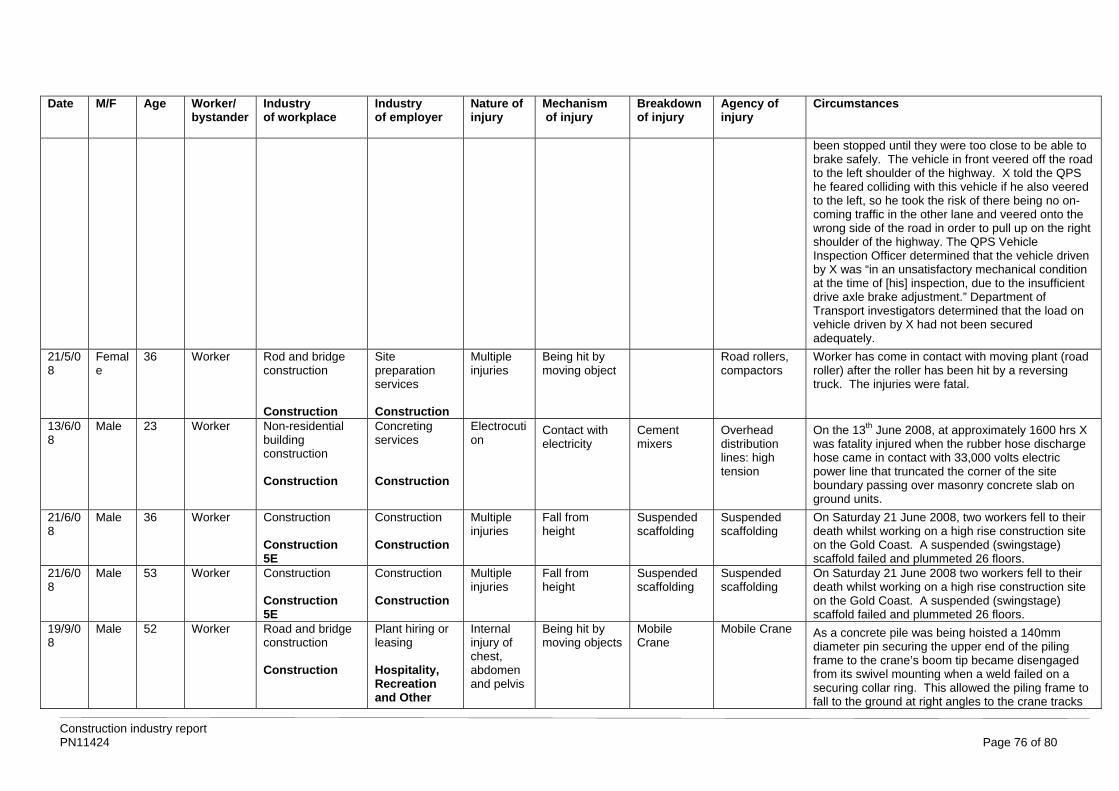
Date M/F Age Worker/ bystander
Industry of workplace
Industry of employer
Nature of injury
Mechanism of injury
Breakdown of injury
Agency of injury
Circumstances
been stopped until they were too close to be able to brake safely. The vehicle in front veered off the road to the left shoulder of the highway. X told the QPS he feared colliding with this vehicle if he also veered to the left, so he took the risk of there being no on-coming traffic in the other lane and veered onto the wrong side of the road in order to pull up on the right shoulder of the highway. The QPS Vehicle Inspection Officer determined that the vehicle driven by X was “in an unsatisfactory mechanical condition at the time of [his] inspection, due to the insufficient drive axle brake adjustment.” Department of Transport investigators determined that the load on vehicle driven by X had not been secured adequately.
21/5/08
Female
36 Worker Rod and bridge construction Construction
Site preparation services Construction
Multiple injuries
Being hit by moving object
Road rollers, compactors
Worker has come in contact with moving plant (road roller) after the roller has been hit by a reversing truck. The injuries were fatal.
13/6/08
Male 23 Worker Non-residential building construction Construction
Concreting services Construction
Electrocution
Contact with electricity
Cement mixers
Overhead distribution lines: high tension
On the 13th June 2008, at approximately 1600 hrs X was fatality injured when the rubber hose discharge hose came in contact with 33,000 volts electric power line that truncated the corner of the site boundary passing over masonry concrete slab on ground units.
21/6/08
Male 36 Worker Construction Construction 5E
Construction Construction
Multiple injuries
Fall from height
Suspended scaffolding
Suspended scaffolding
On Saturday 21 June 2008, two workers fell to their death whilst working on a high rise construction site on the Gold Coast. A suspended (swingstage) scaffold failed and plummeted 26 floors.
21/6/08
Male 53 Worker Construction Construction 5E
Construction Construction
Multiple injuries
Fall from height
Suspended scaffolding
Suspended scaffolding
On Saturday 21 June 2008 two workers fell to their death whilst working on a high rise construction site on the Gold Coast. A suspended (swingstage) scaffold failed and plummeted 26 floors.
19/9/08
Male 52 Worker Road and bridge construction Construction
Plant hiring or leasing Hospitality, Recreation and Other
Internal injury of chest, abdomen and pelvis
Being hit by moving objects
Mobile Crane
Mobile Crane As a concrete pile was being hoisted a 140mm diameter pin securing the upper end of the piling frame to the crane’s boom tip became disengaged from its swivel mounting when a weld failed on a securing collar ring. This allowed the piling frame to fall to the ground at right angles to the crane tracks
Construction industry report PN11424 Page 76 of 80
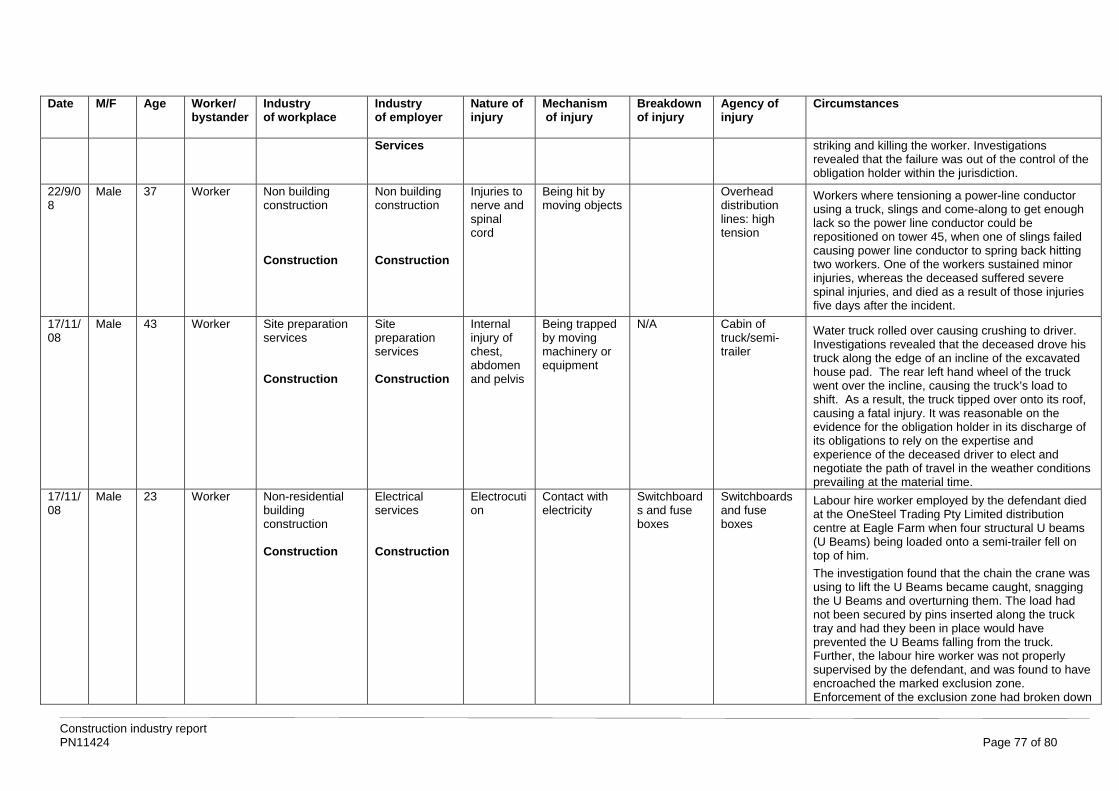
Date M/F Age Worker/ bystander
Industry of workplace
Industry of employer
Nature of injury
Mechanism of injury
Breakdown of injury
Agency of injury
Circumstances
Services
striking and killing the worker. Investigations revealed that the failure was out of the control of the obligation holder within the jurisdiction.
22/9/08
Male 37 Worker Non building construction Construction
Non building construction Construction
Injuries to nerve and spinal cord
Being hit by moving objects
Overhead distribution lines: high tension
Workers where tensioning a power-line conductor using a truck, slings and come-along to get enough lack so the power line conductor could be repositioned on tower 45, when one of slings failed causing power line conductor to spring back hitting two workers. One of the workers sustained minor injuries, whereas the deceased suffered severe spinal injuries, and died as a result of those injuries five days after the incident.
17/11/08
Male 43 Worker Site preparation services Construction
Site preparation services Construction
Internal injury of chest, abdomen and pelvis
Being trapped by moving machinery or equipment
N/A Cabin of truck/semi-trailer
Water truck rolled over causing crushing to driver. Investigations revealed that the deceased drove his truck along the edge of an incline of the excavated house pad. The rear left hand wheel of the truck went over the incline, causing the truck’s load to shift. As a result, the truck tipped over onto its roof, causing a fatal injury. It was reasonable on the evidence for the obligation holder in its discharge of its obligations to rely on the expertise and experience of the deceased driver to elect and negotiate the path of travel in the weather conditions prevailing at the material time.
17/11/08
Male 23 Worker Non-residential building construction Construction
Electrical services Construction
Electrocution
Contact with electricity
Switchboards and fuse boxes
Switchboards and fuse boxes
Labour hire worker employed by the defendant died at the OneSteel Trading Pty Limited distribution centre at Eagle Farm when four structural U beams (U Beams) being loaded onto a semi-trailer fell on top of him.
The investigation found that the chain the crane was using to lift the U Beams became caught, snagging the U Beams and overturning them. The load had not been secured by pins inserted along the truck tray and had they been in place would have prevented the U Beams falling from the truck. Further, the labour hire worker was not properly supervised by the defendant, and was found to have encroached the marked exclusion zone. Enforcement of the exclusion zone had broken down
Construction industry report PN11424 Page 77 of 80
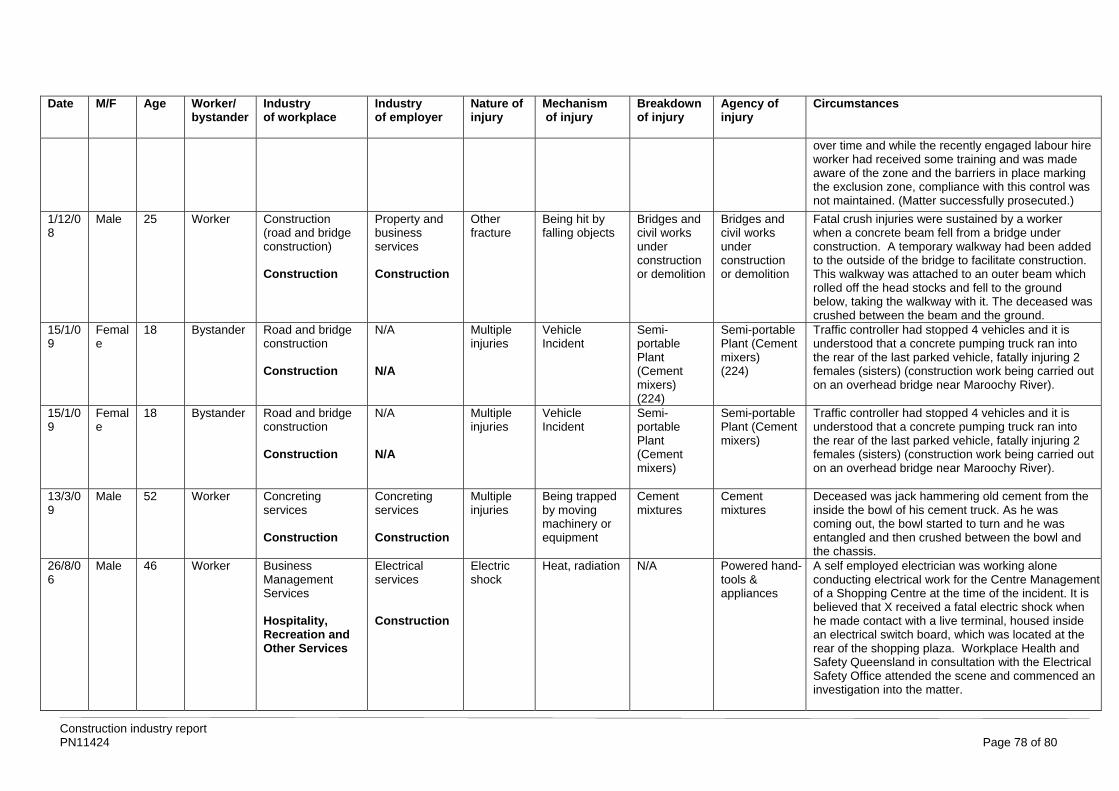
Date M/F Age Worker/ bystander
Industry of workplace
Industry of employer
Nature of injury
Mechanism of injury
Breakdown of injury
Agency of injury
Circumstances
over time and while the recently engaged labour hire worker had received some training and was made aware of the zone and the barriers in place marking the exclusion zone, compliance with this control was not maintained. (Matter successfully prosecuted.)
1/12/08
Male 25 Worker Construction (road and bridge construction) Construction
Property and business services Construction
Other fracture
Being hit by falling objects
Bridges and civil works under construction or demolition
Bridges and civil works under construction or demolition
Fatal crush injuries were sustained by a worker when a concrete beam fell from a bridge under construction. A temporary walkway had been added to the outside of the bridge to facilitate construction. This walkway was attached to an outer beam which rolled off the head stocks and fell to the ground below, taking the walkway with it. The deceased was crushed between the beam and the ground.
15/1/09
Female
18 Bystander Road and bridge construction Construction
N/A N/A
Multiple injuries
Vehicle Incident
Semi-portable Plant (Cement mixers) (224)
Semi-portable Plant (Cement mixers) (224)
Traffic controller had stopped 4 vehicles and it is understood that a concrete pumping truck ran into the rear of the last parked vehicle, fatally injuring 2 females (sisters) (construction work being carried out on an overhead bridge near Maroochy River).
15/1/09
Female
18 Bystander Road and bridge construction Construction
N/A N/A
Multiple injuries
Vehicle Incident
Semi-portable Plant (Cement mixers)
Semi-portable Plant (Cement mixers)
Traffic controller had stopped 4 vehicles and it is understood that a concrete pumping truck ran into the rear of the last parked vehicle, fatally injuring 2 females (sisters) (construction work being carried out on an overhead bridge near Maroochy River).
13/3/09
Male 52 Worker Concreting services Construction
Concreting services Construction
Multiple injuries
Being trapped by moving machinery or equipment
Cement mixtures
Cement mixtures
Deceased was jack hammering old cement from the inside the bowl of his cement truck. As he was coming out, the bowl started to turn and he was entangled and then crushed between the bowl and the chassis.
26/8/06
Male 46 Worker Business Management Services Hospitality, Recreation and Other Services
Electrical services Construction
Electric shock
Heat, radiation N/A Powered hand-tools & appliances
A self employed electrician was working alone conducting electrical work for the Centre Management of a Shopping Centre at the time of the incident. It is believed that X received a fatal electric shock when he made contact with a live terminal, housed inside an electrical switch board, which was located at the rear of the shopping plaza. Workplace Health and Safety Queensland in consultation with the Electrical Safety Office attended the scene and commenced an investigation into the matter.
Construction industry report PN11424 Page 78 of 80
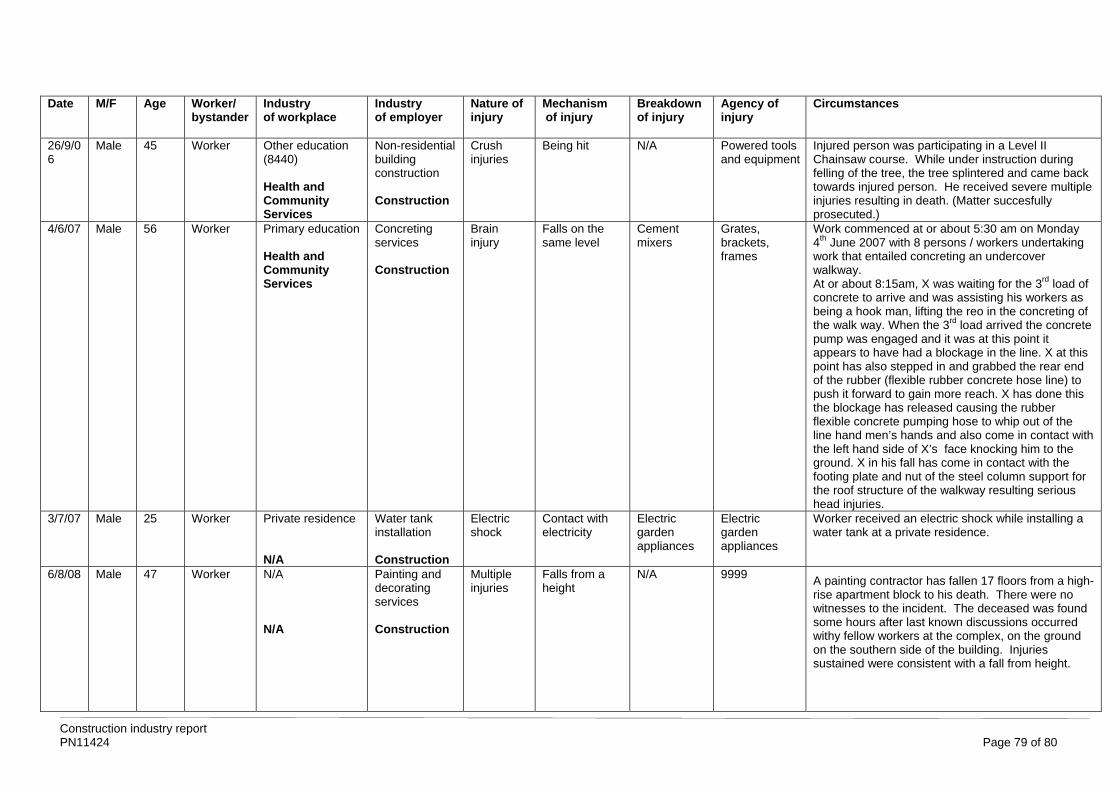
Date M/F Age Worker/ bystander
Industry of workplace
Industry of employer
Nature of injury
Mechanism of injury
Breakdown of injury
Agency of injury
Circumstances
26/9/06
Male 45 Worker Other education (8440) Health and Community Services
Non-residential building construction Construction
Crush injuries
Being hit N/A Powered tools and equipment
Injured person was participating in a Level II Chainsaw course. While under instruction during felling of the tree, the tree splintered and came back towards injured person. He received severe multiple injuries resulting in death. (Matter succesfully prosecuted.)
4/6/07 Male 56 Worker Primary education Health and Community Services
Concreting services Construction
Brain injury
Falls on the same level
Cement mixers
Grates, brackets, frames
Work commenced at or about 5:30 am on Monday 4th June 2007 with 8 persons / workers undertaking work that entailed concreting an undercover walkway. At or about 8:15am, X was waiting for the 3rd load of concrete to arrive and was assisting his workers as being a hook man, lifting the reo in the concreting of the walk way. When the 3rd load arrived the concrete pump was engaged and it was at this point it appears to have had a blockage in the line. X at this point has also stepped in and grabbed the rear end of the rubber (flexible rubber concrete hose line) to push it forward to gain more reach. X has done this the blockage has released causing the rubber flexible concrete pumping hose to whip out of the line hand men’s hands and also come in contact with the left hand side of X’s face knocking him to the ground. X in his fall has come in contact with the footing plate and nut of the steel column support for the roof structure of the walkway resulting serious head injuries.
3/7/07 Male 25 Worker Private residence N/A
Water tank installation Construction
Electric shock
Contact with electricity
Electric garden appliances
Electric garden appliances
Worker received an electric shock while installing a water tank at a private residence.
6/8/08 Male 47 Worker N/A N/A
Painting and decorating services Construction
Multiple injuries
Falls from a height
N/A 9999 A painting contractor has fallen 17 floors from a high-rise apartment block to his death. There were no witnesses to the incident. The deceased was found some hours after last known discussions occurred withy fellow workers at the complex, on the ground on the southern side of the building. Injuries sustained were consistent with a fall from height.
Construction industry report PN11424 Page 79 of 80
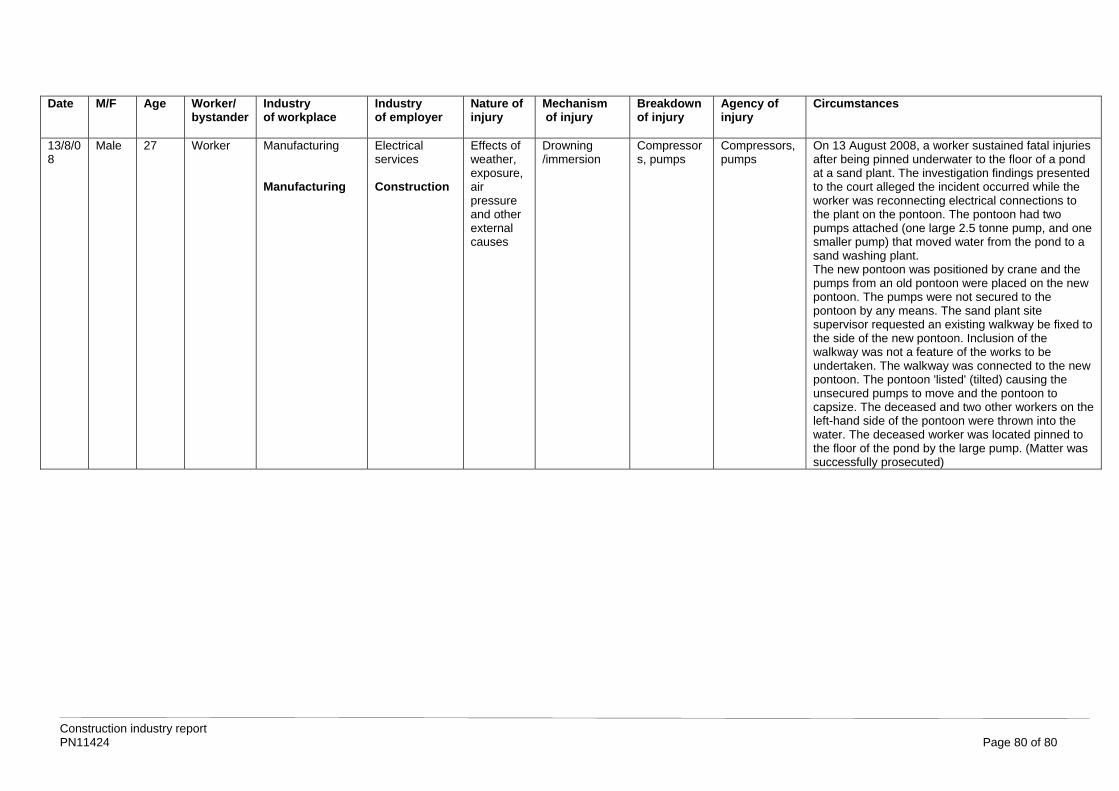
Construction industry report PN11424 Page 80 of 80
Date M/F Age Worker/ bystander
Industry of workplace
Industry of employer
Nature of injury
Mechanism of injury
Breakdown of injury
Agency of injury
Circumstances
13/8/08
Male 27 Worker Manufacturing Manufacturing
Electrical services Construction
Effects of weather, exposure, air pressure and other external causes
Drowning /immersion
Compressors, pumps
Compressors, pumps
On 13 August 2008, a worker sustained fatal injuries after being pinned underwater to the floor of a pond at a sand plant. The investigation findings presented to the court alleged the incident occurred while the worker was reconnecting electrical connections to the plant on the pontoon. The pontoon had two pumps attached (one large 2.5 tonne pump, and one smaller pump) that moved water from the pond to a sand washing plant. The new pontoon was positioned by crane and the pumps from an old pontoon were placed on the new pontoon. The pumps were not secured to the pontoon by any means. The sand plant site supervisor requested an existing walkway be fixed to the side of the new pontoon. Inclusion of the walkway was not a feature of the works to be undertaken. The walkway was connected to the new pontoon. The pontoon 'listed' (tilted) causing the unsecured pumps to move and the pontoon to capsize. The deceased and two other workers on the left-hand side of the pontoon were thrown into the water. The deceased worker was located pinned to the floor of the pond by the large pump. (Matter was successfully prosecuted)