
CONSTRAINTS TO ADOPTION OF CONSERVATION …...ANGONIA HIGHLANDS OF MOZAMBIQUE: PERSPECTIVES FROM...
112
CONSTRAINTS TO ADOPTION OF CONSERVATION AGRICULTURE IN THE ANGONIA HIGHLANDS OF MOZAMBIQUE: PERSPECTIVES FROM SMALLHOLDER HAND-HOE FARMERS By: Philip Paul Grabowski A THESIS Submitted to Michigan State University in partial fulfillment of the requirements for the degree of MASTER OF SCIENCE Community, Agriculture, Recreation and Resource Studies 2011
Transcript of CONSTRAINTS TO ADOPTION OF CONSERVATION …...ANGONIA HIGHLANDS OF MOZAMBIQUE: PERSPECTIVES FROM...
CONSTRAINTS TO ADOPTION OF CONSERVATION AGRICULTURE IN THE
ANGONIA HIGHLANDS OF MOZAMBIQUE:
PERSPECTIVES FROM SMALLHOLDER HAND-HOE FARMERS
By:
Philip Paul Grabowski
A THESIS
Submitted to
Michigan State University
in partial fulfillment of the requirements
for the degree of
MASTER OF SCIENCE
Community, Agriculture, Recreation and Resource Studies
2011
ABSTRACT
CONSTRAINTS TO ADOPTION OF CONSERVATION AGRICULTURE IN THE
ANGONIA HIGHLANDS OF MOZAMBIQUE:
PERSPECTIVES FROM SMALLHOLDER HAND-HOE FARMERS
By:
Philip Paul Grabowski
Conservation agriculture (CA) is a set of practices widely promoted to increase
productivity while conserving soil through reduced tillage, mulching and crop rotation. I explore
the constraints to CA adoption through in-depth interviews with 18 CA farmers, four dis-
adopters and 11 non-adopters in one community where two NGOs have been promoting CA.
One NGO promotes the basin method with compost production while the other promotes direct
seeding with herbicide use. Though the farmers described many benefits in using CA there was
little sign of adoption beyond the plots where NGOs provided inputs.
Most farmers were adamant that CA could perform better than conventional agriculture
only if they applied fertilizer (or large quantities of compost). This constraint can be explained
by the nutrient immobilizing effect caused by both reduced tillage and the retention of mulch.
With planting basins, adoption is also constrained by increased labor requirements for land
preparation, compost production and weeding. The high input to output price ratio causes CA
practices to be unprofitable except on small plots for farmers who have a low opportunity cost of
household labor. These findings suggest that CA can improve maize yields but capital and labor
constraints limit adoption to small plots in the absence of NGO-provided inputs. Given the
current ranges of prices for grain and inputs CA will not be adopted at a large scale in Angonia.
Nevertheless, the small CA plots can serve the purpose of reliably providing farmers with high
yields where constraints are lowest.

iii
DEDICATIONS
I would like to dedicate this work to the smallholder farmers in southern Africa. I am inspired by
their courage and ingenuity in the face of tremendous challenges. I have been humbled by the
hospitality and love they have shown me and my family as we have sought to work with them
towards a brighter future. I would also like to thank God for the abundant blessings I have
experienced through this work and throughout my life.
“You care for the land and water it;
you enrich it abundantly.
The streams of God are filled with water
to provide the people with grain,
for so you have ordained it.
You drench its furrows and level its ridges;
you soften it with showers and bless its crops.
You crown the year with your bounty,
and your carts overflow with abundance.
The grasslands of the desert overflow;
the hills are clothed with gladness.
The meadows are covered with flocks
and the valleys are mantled with grain;
They shout for joy and sing.”
Psalm 65:9-13 New International Version
iv
ACKNOWLEDGEMENTS
First I would like to thank my adviser, John Kerr, for his continuous support in all stages
of this research, especially for his patience and insight which made this research a great learning
experience for me. I would also like to thank my committee members Kim Chung, Cynthia
Donovan and Robby Richardson for their contributions to the development and support of this
research. I would also like to thank AFRE’s Food Security project in Mozambique for the
summer research assistantship that made it possible for me to gather the data, especially Duncan
Boughton, Cynthia Donovan, Steve Haggblade, Gilead Mlay, Ellen Payongayong and Dave
Tschirley. I greatly appreciate the help of the Christian Reformed World Relief Committee for
facilitating many of the logistics of my travel to Angonia with my family, especially Larry
McAuley and Istifanus Gimba and our many supporters from churches in the U.S. who
generously contributed to cover the travel costs for the rest of my family. I am grateful for the
collaboration from the organizations involved in the projects studied by this research with special
thanks to Rev. Samuel Bessitala from the Igreja Reformada em Moçambique for much of the
logistical help and Dr. Trent Bunderson from Total Land Care for opening the door for
collaboration. This research would not have been possible without the support of many
individuals within the Mozambican Ministry of Agriculture. Special thanks to the director of the
Instituto de Investigação Agrária em Moçambique, Calisto Bias, and the head of the Centro de
Estudos Socio-Económicos, Feliciano Mazuze. I would also like to recognize the contribution of
the Mozambican scientists studying conservation agriculture, especially Inácio Nhancale and
Tomás Maculuve for their insights.
Finally, I would like to recognize the amazing contributions of my wife, Christa, who has
been a wonderful research assistant, sounding board, editor and critic while at the same time
taking care of our two girls.
v
TABLE OF CONTENTS
LIST OF TABLES ........................................................................................................................ vii
LIST OF FIGURES ..................................................................................................................... viii
1. Introduction ................................................................................................................................. 1
1.1. Conceptual framework ......................................................................................................... 3
1.2. Defining CA in this context ................................................................................................. 9
1.2.1. Benefits of CA ............................................................................................................. 12
1.2.2. Constraints to adoption of hand-hoe CA technologies ................................................ 15
1.3. Summary of potential benefits and constraints .................................................................. 23
2. Methods..................................................................................................................................... 24
2.1. Case description ................................................................................................................. 24
2.1.1. Geographic setting ....................................................................................................... 25
2.1.2. Non-governmental organizations ................................................................................ 25
2.2. Overview of the study design ............................................................................................. 26
2.3. Sampling and Data collection ............................................................................................ 30
2.3.1. Community selection ................................................................................................... 30
2.3.2. Respondent selection ................................................................................................... 31
2.3.3. Data collection ............................................................................................................. 32
2.4. Data Analysis ..................................................................................................................... 33
2.4.1. Thematic analysis ........................................................................................................ 33
2.4.2. Quantitative data analysis ............................................................................................ 35
2.5. Validity issues .................................................................................................................... 38
2.6. Description of participants ................................................................................................. 40
3. Results ....................................................................................................................................... 42
3.1. Soil fertility and CA ........................................................................................................... 43
3.1.1. Compost production .................................................................................................... 45
3.1.2. Fertilizer use ................................................................................................................ 48
3.1.3. Rotation with legumes and permanent mulch cover ................................................... 52
3.2. Labor changes with CA ...................................................................................................... 55
3.2.1. Land preparation and planting ..................................................................................... 55
3.2.2. Weed Control ............................................................................................................... 56
3.2.3. Mulching ...................................................................................................................... 58
3.2.4. Summary ...................................................................................................................... 59
3.3. Profitability of using inputs with CA ............................................................................. 59
3.3.1. Profitability by area ..................................................................................................... 64
3.3.2. Summary ...................................................................................................................... 71
3.4. Missing benefits of CA ...................................................................................................... 71
4. Discussion and Conclusion ....................................................................................................... 72
vi
APPENDICES .............................................................................................................................. 77
Appendix A: Data collection instruments ................................................................................. 78
A.1. Interview guide .............................................................................................................. 78
A.2. Professional Interview Guide – for use with NGO workers or extension staff ............. 81
A.3. Community selection table ............................................................................................ 82
A.4. Labor data collection sheet ............................................................................................ 83
A.5. Record of interviews and community meetings ............................................................ 84
Appendix B: Details on Thematic analysis ............................................................................... 86
Appendix C: Processing labor and profitability data ................................................................ 91
Appendix D: Plot area data ....................................................................................................... 96
REFERENCES ............................................................................................................................. 97
vii
LIST OF TABLES
Table 1: Positive and negative short and long term effects of the three components of
conservation agriculture cited in the literature .............................................................................. 21
Table 2: Details of CA as promoted by two NGOs ...................................................................... 26
Table 3: Fertilizer use by conservation agriculture (CA) farmers and dis-adopters in Bwaila .... 51
Table 4: Maize yield and labor requirements by task for conservation agriculture (CA) and
conventional systems .................................................................................................................... 57
Table 5: Proportion of Total Land Care (TLC) participants with positive net profit for
conservation agriculture for two input application rates under different conditions for valuing
labor, maize and inputs. ................................................................................................................ 61
Table 6: Estimated signs for net profit of Total Land Care (TLC) promoted conservation
agriculture based on ideal yields (2.7 tons/ha) for two input application rates under different
conditions for valuing labor, maize and inputs. ............................................................................ 63
Table 7: Profitability of conservation agriculture use by Igreja Reformada em Moçambique
participants under different conditions for valuing labor and maize. ........................................... 63
Table 8: Community selection table with details of conservation agriculture (CA) participation
and promotion by Total Land Care (TLC) and Igreja Reformada em Moçambique (IRM)......... 82
Table 9: Sample labor data collection sheet ................................................................................. 83
Table 10: Coding rules, definitions and examples ........................................................................ 86
Table 11: Mean net profit for Total Land Care conservation agriculture farmers who received
inputs for one plot under different conditions for valuing labor, grain and inputs. ...................... 91
Table 12: Mean net profit for Total Land Care conservation agriculture farmers who received
inputs for three plots under different conditions for valuing labor, grain and inputs. .................. 93
Table 13: Profitability of conservation agriculture for Igreja Reformada em Moçambique farmers
in Mulingo and Kawale under different conditions for valuing labor and grain. ......................... 94
Table 14: Plot measurements by tape measure and GPS in Bwaila including limited information
about the time required to make the measurements ...................................................................... 96

viii
LIST OF FIGURES
Figure 1: Total cost of production and total benefits under two output price scenarios for Total
Land Care (TLC) plots with 0.4 tons/ha fertilizer application rate. .............................................. 67
Figure 2: Marginal cost of production and marginal benefits under two output price scenarios4
for Total Land Care (TLC) plots with 0.4 tons/ha fertilizer application rate. .............................. 68
Figure 3: Total cost of production and total benefits under two output price scenarios for Igreja
Reformada em Moçambique (IRM) plots with 0.085 tons/ha fertilizer application rate .............. 69
Figure 4: Marginal cost of production and marginal benefits under two output price scenarios for
Igreja Reformada em Moçambique (IRM) plots with 0.085 tons/ha fertilizer application rate ... 70
Figure 5: Conceptual diagram of how labor and capital are constraints to conservation agriculture
adoption by small holder farmers in Mozambique ....................................................................... 76
Figure 6: Marginal cost of production and marginal benefits for a farmer whose opportunity cost
of labor is equal to the market wage rate under two output price scenarios for Total Land Care
(TLC) plots with 0.4 tons/ha fertilizer application rate. ............................................................... 95
1
1. Introduction
The goal of increasing agricultural productivity has gained renewed emphasis in
developing countries since the 2007/08 food crisis. Africa lags behind compared with global
agricultural productivity (Todaro and Smith, 2009) and there is long standing food insecurity
across the continent (World Bank, 2008). The World Health Organization defines food security
as “when all people at all times have access to sufficient, safe, nutritious food to maintain a
healthy and active life” (World Health Organization, 2009).
Rural food insecurity is a key element of poverty throughout Africa and Mozambique is
no exception. In a recent news article the deputy minister of agriculture said that according to the
latest survey results 37% of Mozambican households experience hunger at some point
throughout the year (Mozambique News Agency, 2011). Smallholder agriculture is the
livelihood strategy of 98% of rural people with 79% of households producing maize as a staple
food (Bias & Donovan, 2003). The average smallholder cultivates 1.2 ha using only hand tools
and very few modern inputs (Hanlon & Smart, 2008).
Where most people are smallholder farmers, increasing agricultural productivity is a key
strategy for achieving food security. Though Africa previously produced enough to meet its own
food needs, the population has grown at a faster rate than the agricultural productivity over the
last 100 years (Todaro & Smith, 2009). Increased rural population density has caused there to be
less land available for shifting cultivation, and increased urban demand for food has created a
need for intensifying the traditional farming systems (Todaro & Smith, 2009). Many government
and market failures reduce farmers’ incentives to intensify their agriculture (for examples related
to fertilizer use see Morris, Kelly, Kopicki, & Byerlee, 2007). Innovative farmers tend to have

2
greater access to land, labor and capital (Tripp, 2006) so the barriers to resource accumulation
through markets are also barriers to innovation.
Conservation agriculture (CA) is being promoted as a solution to increase agricultural
productivity and food security while at the same time preventing erosion and maximizing the
ecological functions of the soil (Hobbs, 2007). CA is a package of technologies that includes
minimum tillage, mulching and crop rotation (IIRR & ACT, 2005). CA has potential to reduce
labor needs for land preparation and improve soil fertility while also reducing water stress in
crops (IIRR & ACT, 2005), which is critically important as southern Africa braces for the hotter
and drier weather predicted by climate change models (Lobell et al., 2008).
Governments, UN agencies, corporations and NGOs in sub-Saharan Africa are trying to
convince farmers to adopt CA to improve their production and conserve soil and water (FAO,
2001; Giller, Witter, Corbeels, & Tittonell, 2009; Haggblade & Tembo, 2003; Ito, Matsumoto, &
Quinones, 2007). Despite these efforts, adoption levels are low in southern Africa with less than
1% of arable land under CA (Hove, Kadzere, Sims, Ager, & Mulila-Miti, 2011). Even in
Zambia, with the highest levels of adoption, most farmers use only certain components of CA on
parts of their farm (Baudron, Mwanza, Triomphe, & Bwalya, 2007). In addition, the level of
sustained change is doubtful where fertilizer and hybrid seed were used as incentives for initial
adoption (Giller et al., 2009). Nevertheless, some believe that CA in southern Africa is at “an
advanced stage of early adoption” and needs a coordinated approach and harmonized policy so
that it can “really take off” (Friedrich & Kassam, 2011, p.1).
Researchers from the Mozambican Institute for Agricultural Research (IIAM) have
identified CA as a technology that needs to be understood better in the various agro-ecological
zones in Mozambique, especially in light of climate change dynamics. Through USAID funding,

3
Michigan State University researchers are supporting IIAM’s Center for Socio-Economic Studies
(CESE), with two main goals: 1) to expand the availability of appropriate crop, livestock and
natural-resource management technologies for smallholder farmers, and 2) to accelerate the
uptake of those technologies by strengthening policy institutions and market information services
(AFRE, 2010).
This research contributes to these goals by exploring the constraints to CA adoption in
the Angonia highlands of Mozambique. The study seeks to support IIAM’s work by analyzing
the CA technology from the perspective of smallholders and generating hypotheses about the
constraints limiting wide-scale adoption. I use a qualitative approach in one community to obtain
an in-depth answer to the primary research question: Why are farmers not adopting conservation
agriculture? The hypotheses I generate inform policy decisions about CA promotion and future
quantitative studies about the constraints to adoption.
1.1. Conceptual framework
Farmers face a variety of decisions about what crops to grow, what inputs to use, and
how much of each input to use on different parts of their land in order to fulfill their farming
objectives. The field of agricultural economics provides a theoretical basis for understanding
farmer decision making. One might think that because relatively few of the farmers’ decisions
involve monetary transactions economics might not be the best fit for analyzing developing
country smallholder agriculture. While the other social sciences such as sociology and
anthropology have much to offer, economics is particularly suited to analyzing rational resource
allocation choices, regardless of whether cash is involved or not.
Economics assumes that farmers are rational and will seek to maximize their own well-
being through their choices about crops and inputs given the land they have, the labor they can

4
employ and the capital they can access. Their attitude about risk is also an important factor in
their decision-making: how much are they willing to gamble with a failed harvest? All of these
factors vary by individual, though general trends may exist which can be useful for policy
makers and development practitioners interested in improving smallholder productivity.
The effective application of economic theory to smallholder agriculture in developing
countries requires intimate familiarity with farmers’ reality. It was often thought that poor
smallholder farmers do not respond to price changes related to their crops. This conclusion was
based on the lack of observed correlation between what farmers grow and the market prices but it
ignored the transaction costs farmers face in getting their harvest to market (de Janvry,
Fafchamps, & Sadoulet, 1991). Once the correct “shadow prices”1 were used to reflect the actual
price for the farmer then the rational allocation of land to different crops became clear.
Determining the shadow price of labor can be quite complicated but the key principle is
to consider the opportunity cost by comparing how labor is used in the situation being analyzed
and its next best alternative use (Gittinger, 1982). Gittinger (1982) emphasizes that economic
analysts should have an intimate familiarity with the small farm as a family unit and as a
business firm. Recent research has highlighted the key role of non-farm income for the majority
of the world’s smallholder farmers (Haggblade, Hazell, & Reardon, 2007) and for the labor
bottlenecks that occur at peak times in the agricultural season.
There is a large body of literature in agricultural economics which analyzes agricultural
technology adoption, mostly focusing on the use of modern inputs by smallholder farmers in
1 An explanation of shadow prices provided by Boardman, Greenberg, Vining and Weimer
(2006) is as follows: “When observed prices fail to reflect the social value of a good accurately
or observed prices do not exist, an approach called shadow pricing is often used to measure
benefits and costs. That is, analysts adjust observed prices or assign values when appropriate
observed prices do not exist, thereby finding “in the shadows” needed values that are not readily
observable.” (p.75)
5
developing countries. Feder, Just, and Zilberman (1985) defined adoption as “the degree of use
of a new technology in long-run equilibrium when the farmer has full information about the new
technology and its potential” (p.256). New technologies are constantly arising and, as Feder et al.
recognized, equilibrium may never actually be achieved. Nevertheless, this definition of adoption
is helpful in quantifying adoption, which permits statistical regressions with explanatory
variables.
In the literature there is a wide range of variables that could reasonably be assumed to
correlate with levels of adoption. In a review of empirical studies, Feder et al. (1985) listed farm
size, risk, human capital, labor availability, credit constraints, land tenure, and input supply
constraints as key variables influencing adoption. A thorough understanding of how these
variables impact levels of adoption can help inform projects and policies aimed at promoting
increased productivity. For example, if access to credit is the key constraint then development
agencies can explore linking farmers with commercial credit providers, organizing farmers into
savings and loan groups or even directly setting up a credit component of the project.
Focusing on the characteristics of the technology, Byerlee (1986) hypothesizes that
adoption of a technology depends on its profitability, riskiness, divisibility, complexity and the
availability of inputs. Profitability is simply the value of the outputs less the costs of the inputs.
Risk includes climate risk, price risk, investment risk, etc. Divisibility refers to the initial capital
requirements per unit of investment (i.e. the difference between purchasing a tractor for one large
sum or purchasing fertilizer in small increments). Complexity refers to the change in
management required; high complexity may require substantial training. Availability of inputs is
a critical issue with any new technology, especially those that require specialized machinery or
chemicals that were not previously used. Understanding what aspect of the technology is

6
preventing adoption can allow adaptation of the technology (for example to make it less risky),
adjustment of policies (for example reducing a tariff on an import to increase its supply), or even
choosing a new technology with more favorable attributes.
Agricultural technologies can be complicated to evaluate because multiple changes may
be required simultaneously in order to use the new technology. For example hybrid seeds
perform best under higher levels of fertilizer than conventional varieties. At what fertilizer level
should the yield benefit be compared with conventional varieties? Changes in technology can be
evaluated using Binswanger’s concept (1978) of comparing the costs of production when the old
and new techniques operate at their optimum input levels. One implication of this definition is
that a technology never inherently saves on any one factor of production (for example labor-
saving) because when it is transferred from one context to another it must be compared with the
conventional technique being used in that location.
The induced innovation model (Ruttan, 1998) suggests that successful technologies are
those that use the primary factors of production (land, labor and capital) that are most abundant
while saving on those that are most scarce. This model helps explain why extensive agriculture
technologies (large tractors) suitable for areas with abundant land are used in the U.S., Canada
and Australia while intensive agriculture technologies (growing melons up a trellis and
supporting the fruit with a hammock) are used in Japan and Taiwan. In any particular location,
variation in adoption levels may be explained by variation in the relative scarcities of these
factors of production.
However, simply finding technologies that use the resources that farmers have most in
abundance will not necessarily lead to adoption. In Fujisaka’s article (1994) about reasons why
farmers do not adopt seemingly beneficial soil conservation measures, he emphasizes
7
understanding adoption from the farmer’s perspective. This includes understanding their
priorities, the alternatives available to them in addressing the same problem and the indirect
consequences of the technology. For example, Kerr and Sanghi (1992) found that in India
farmers did not choose soil conservation technologies simply based on how much soil could be
conserved. The recommended practice of contour ridges across plot boundaries interfered with
several aspects of local farming strategies, including farmers’ ability to use soil conservation
structures as boundary markers and places for growing fodder (Kerr & Sanghi, 1992). A
thorough understanding of the farmers’ perspectives is critical for evaluating any technology.
When a technology is spreading slowly, before discarding it as unsuitable it is worth
questioning if it is simply in the early stages of adoption. It is often the case that it takes time for
information to be shared and small adaptations to be made in the promotion strategy before rapid
uptake of a new technology. Diffusion is the term used for the aggregation of adoption in a
region over time. The S-shaped diffusion curve that Griliches (1957) developed is a common
technology diffusion pattern. A slow gradual adoption process (by the early adopters) is followed
by a rapid increase in adoption (by the majority) followed by a final period of slow adoption (by
the late adopters). The factors influencing the specific shape of the diffusion pattern may vary by
context but are generally related to the process of learning and information sharing (Feder et al.,
1985).
Levels and reasons for disadoption can provide clues to help distinguish between the
early stages of adoption and a truly unsuitable technology. Moser and Barrett (2003) state that
“failure to take disadoption seriously signals the implicit assumption that new technologies are
unambiguously superior” (p.1090). Their study of Sustainable Rice Intensification (SRI) in
Madagascar focused on the characteristics and perspectives of disadopters, non-adopters and
8
adopters of SRI to understand barriers to initial adoption and features of the technology that were
not appealing to farmers. Unfortunately, those who have spent their careers developing a
technology or have developed what seems like an attractive plan to donors may resist critical
analysis of the suitability of a technology and instead hide behind the claim that it is just a matter
of time before it takes off.
If interventions are promoted as blanket solutions across a diversity of contexts, variable
levels of adoption may be observed. Heterogeneity in farming systems, social norms, property
rights and the costs of different factors of production may result in different costs and benefits
for individual smallholders. In providing recommendations for agricultural projects carrying out
farm investment analysis, Gittinger (1982) suggests that a separate farm level budget needs to be
prepared for different farm types based on major groupings of soil and water conditions, size of
holdings and cropping patterns. Easterly (2008) criticizes the promotion of comprehensive
approaches by the group he labels as “planners” who “apply global blueprints…think they
already know the answers … and determine what to supply” (p.1). He argues that improvements
to African agriculture require more “searchers” who “find things that work,…find out the reality
at the bottom… and find out what is in demand.” (p.1)
This theoretical background about agricultural technology adoption provides a
framework for analyzing the apparently slow spread of conservation agriculture in southern
Africa. Specifically conservation agriculture should be compared with the conventional system
used in each context with particular attention to the changes in costs and benefits experienced by
different types of farmers. A qualitative approach allows for an open exploration of how the
heterogeneity of smallholders may affect adoption.

9
1.2. Defining CA in this context
In assessing the adoption of any technology it is critically important to be specific about
the technology and its alternative. Conservation agriculture is not actually a technology per se
but a set of principles that have been incorporated into a diverse range of technologies from
mechanized agriculture to hand-hoe land preparation. On one extreme of CA technologies is the
traditional swidden (slash and burn) agriculture once common in many parts of the tropics where
natural vegetation is cleared, crops are sown with little soil disturbance and “rotation” is
achieved through long term fallows. On the other extreme, CA for mechanized agriculture in
North and South America and Australia has led to adaptations in equipment allowing the
injection of seeds into undisturbed soil and weed control through chemical herbicides. The
prevalence of these different forms relate to the relative abundance of the factors of production
(land, labor and capital). Swidden agriculture is only found in areas with abundant land but
relatively low labor and capital. Mechanized CA has been adopted in places where there is
abundant land and capital but labor is constrained.
Nearly the entire range of CA technologies can be found in southern Africa. Mechanized
CA is used in parts of South Africa, Zimbabwe and Zambia among large-holder commercial
farmers. Animal traction CA is used in parts of Zimbabwe and Zambia where there is a tradition
of cattle ownership and plowing with oxen. In many other areas where manual land preparation
is prevalent CA takes the form of planting basins and direct seeding with a jab-planter or dibble
stick. Much of the literature from Zimbabwe and the southern province of Zambia combines the
analysis of CA with animal traction and CA with hand-hoe basins though the costs and benefits
are different (Haggblade & Tembo, 2003). Usually both forms of CA are compared with plowing
10
done by animal traction since that is the most common form of conventional land preparation in
those contexts.
This paper focuses on two different forms of manual CA land preparation for maize
production: basins and direct seeding. Both of these CA methods are being promoted by NGOs
with smallholder farmers on small plots. CA can be used on many other crops (cotton, sorghum
and millet are grown with CA in the region) but maize is the staple food in most of the region
and is therefore the focus of many CA projects. Both of the NGOs promoting CA in Angonia
include mulching as a key component but neither promotes crop rotation or intercropping with
CA. These forms of CA are being compared with intercropped ridges prepared by hand-hoe,
which is the traditional agricultural system for maize in this part of Mozambique, much of
Malawi and eastern Zambia.
The basin planting method was developed by Brian Oldreive in Zimbabwe and adapted
for widespread promotion in Zambia by the Conservation Farming Unit (CFU) (Baudron et al.,
2007). In theory a permanent grid of basins is established with precise measurements which
allows for easy calculation of required inputs. In addition, the permanent basins allow for
improving the soil in small pockets rather than improving the soil of the entire field. The basins
are generally 15cm deep and 15cm long and the width of a hoe-blade. The basins are then filled
with compost or animal manure if available. Shallower basins may be used if only fertilizer is
being applied. Generally two or three maize plants are allowed to grow per basin depending on
the space between basins. The exact spacing between basins can be adapted depending on the
crops a farmer plans to use and the desired plant population (usually based on the fertilizer
application rate and the expected amount of rainfall). However, once the basins are established,
adapting the spacing requires additional work in measuring as well as losing any benefits from
11
improving the soil in the old basins. Often NGOs promote a specific spacing and even provide
farmers with “teren ropes” that have knots or bottle caps indicating where each basin should be
dug (Baudron et al., 2007).
The direct seeding method is being researched by CIMMYT in southern Africa and
promoted by NGOs as well. The maize seeds are planted individually and close together within
the row much as would be done by a mechanical planter (for example 15cm between plants and
70cm between rows). The lines are carefully measured but this is done rather easily with any
string or rope. There is no preparation of the seed bed; instead the planting is accomplished
through a dibble stick, jab-planter or one shallow cut of the hoe. Compared to the basins this
method allows much less disturbance of soil but it offers no opportunity for the addition of
organic matter to improve the soil.
The most common farming system for maize in this part of Mozambique, most of Malawi
and eastern Zambia is that of intercropped ridges. In this method farmers prepare for the next
season by either burning the residues or laying them down in the troughs between ridges, which
are generally around 1 meter apart (Chigowo, 2011). A hoe is then used to split the old ridge and
cover any remaining residues so that a new ridge is formed where the trough once was (for
photos illustrating this technique see Aagard, 2009). When this ridge-splitting is done in the dry
season the new ridges may be mostly large clods (depending on the soil type) and further work
may be needed to form the ridge once the rains soften the soil. Cow manure or compost can be
applied by putting it in the trough before splitting the ridge or by the handful at the planting
stations. Maize is usually planted in clusters of about five plants approximately a meter apart
with one or two legume stations between the maize clusters. A variety of other non-leguminous
crops may also be intercropped with the maize in a variety of configurations. Commonly the
12
ridges are added to through “banking” part way through the agricultural season. In order to bank
the ridge farmers go through the rows using their hoe to cut under the weeds growing in the
troughs and inverting them onto the ridge so that the weeds become buried. The banking is also
done to prevent lodging of the maize due to wind.
Conventional agriculture in Mozambique is contributing to land degradation through
erosion and nutrient mining caused by the intensive cultivation of the soil without fertilizer
application (Famba, 2010). This is especially acute in areas with sloping land and high amounts
of rainfall which have the highest erosion levels in Mozambique (Folmer, Geurts & Francisco,
1998). As soils become degraded smallholder farmers face yield reductions and decreased
welfare unless they are able to compensate with non-agricultural activities. Technological
changes in agricultural practices can prevent land degradation by reducing erosion and nutrient
mining.
1.2.1. Benefits of CA
Conservation agriculture is thought to provide many benefits compared to the ridged
farming system including reduced erosion. One of the most notable differences with CA is that
there is little or no time spent on the physically demanding tasks of ridging and banking
(Chigowo, 2011). Though basin making may be less physically demanding it may not be any
faster because of the need to measure and align the grid of permanent basins (see reduced tillage
constraints below). In addition, reduced tillage under certain soil conditions can improve the
biological and physical properties of the soil, eventually resulting in increased production.
Mulching provides further soil improvements as well as maintaining moisture by providing a
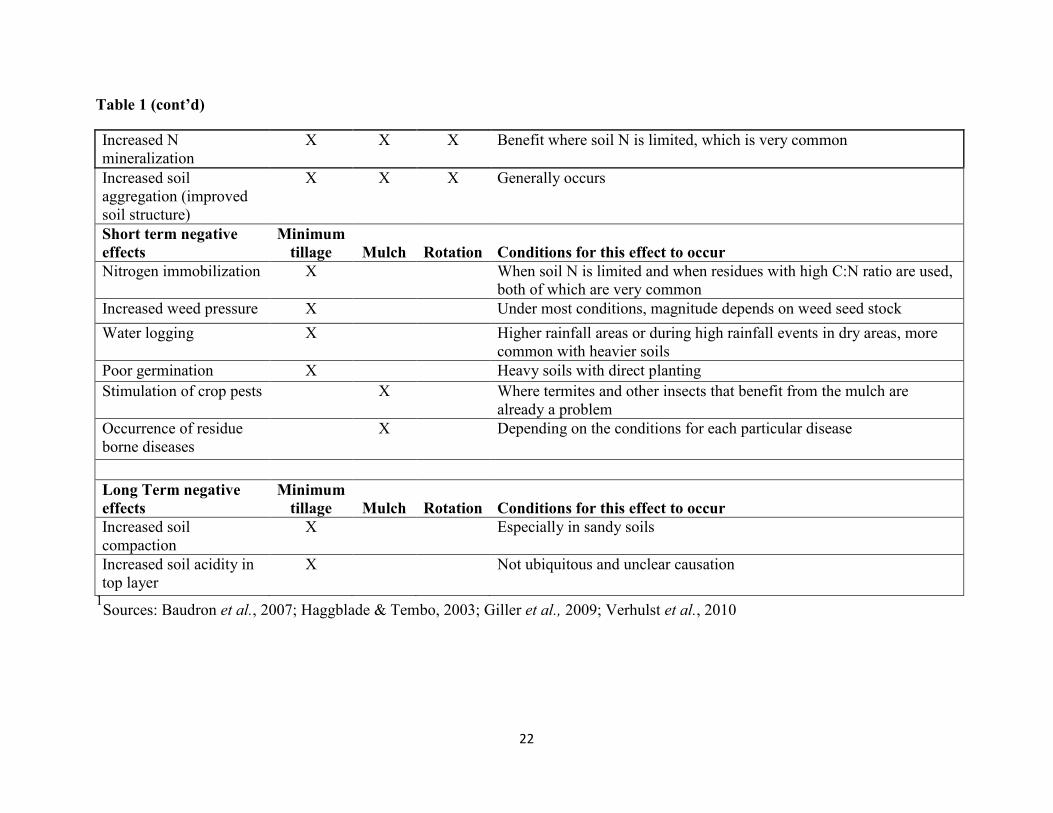
cover for the bare soil. Rotations can help improve the soil and reduce crop diseases. See Table
1 for a summary of the positive and negative effects of CA.
13
Benefits from reduced tillage
CA has spread spontaneously among cotton farmers in the lower rainfall areas of Zambia
because of the ability to plant with the first rains (Haggblade & Tembo, 2003). CA provides this
advantage in places where farmers feel that the soil is too hard to make ridges until it is softened
by the first rains. The long growing season requirement of cotton means farmers in drier regions
with shorter seasons can experience significant yield losses from late planting. A further
advantage of CA in this context (where most farmers use oxen to plow after the rains start) is that
basin making can be done slowly throughout the dry season, thereby reducing labor during the
labor bottleneck at planting. CA was shown to increase farmers’ crop income in Zambia’s cotton
belt through both higher yields and the cultivation of larger fields. This result was true even for
the poorest households though the magnitude of the income increase was greater for wealthier
households who could afford chemical inputs (Haggblade, Kabwe, & Plerhoples, 2011).
Reduced tillage can improve soil in several ways. Under certain soil conditions, ridged
agriculture that involves regularly hoeing to the same depth over several years may result in a
hard pan or compacted layer of soil. A hard pan makes it difficult for water to penetrate beyond
the top layer of soil, which can result in water logging and excess runoff. The basin method of
CA can allow for punching through the compacted layer at each basin thereby allowing greater
water infiltration (Baudron et al., 2007). Ridges of tilled soil have more surface area and dry out
faster than undisturbed soil. On-station research with CA in southern Africa over a number of
years indicates that CA can improve moisture retention and increase crop resilience to dry spells
(Nyagumbo, Thierfelder, & Cheesman, 2011). Minimum soil disturbance prevents soil erosion,
though on steep slopes contour bunds may be needed as well in order to slow down runoff
(Giller et al., 2009). The loose soil on ridges is prone to erosion and when unusually large
quantities of rain fall in a short time, entire ridges may be washed away (Aagard, 2009).

14
Reduced tillage can prevent or slow down the loss of soil organic matter (SOM), a
process which is accelerated by oxidizing the soil when it is tilled. SOM is a key component of
soil fertility that affects the soil’s ability to absorb water, store nutrients and sustain a diverse
community of microorganisms. Soils with too little SOM are unresponsive to fertilizer
applications (Marenya & Barrett, 2009). Reduced tillage can improve the effectiveness of
fertilizer use both by increasing soil organic matter and by reducing the erosion of the fertilizer.
Reduced SOM loss from minimum tillage is more significant on heavier clay soils (Chivenge,
Murirwa, Giller, Mapfumo, & Six, 2007). Sandy soils do not provide a structure for stable SOM
regardless of tillage system, so they require regular inputs of organic matter to maintain SOM
levels (Chivenge et al., 2007). Soil samples from within basins in Zimbabwe show a trend of
increased soil organic carbon concentration (closely related to SOM) with longer CA use in some
regions, though overall soil qualities were not statistically different between CA plots and non-
CA plots (Nyamangara & Masvaya, 2011).
Benefits from mulch
Maintaining a thick layer of mulch can be beneficial in conserving soil moisture,
reducing erosion and increasing soil organic matter (Locke & Bryson, 1997). When residues are
burned nutrients are lost, soil microorganisms are destroyed and the loss of biomass means less
SOM is added to the soil. Maintaining the residues on top of the soil and/or adding a layer of
mulch to cover the soil can reduce erosion by reducing the impact of the rain on the soil and
slowing down runoff across the field. The mulch also conserves moisture by absorbing water and
protecting the soil from direct exposure to sunlight. Mulch is also beneficial in preventing weed
growth either by physically preventing weed emergence or by blocking direct sunlight that some
weed seeds require for germination.
Benefits from rotation

15
Crop rotation can improve soil nutrient management and reduce the prevalence of crop
pests and diseases. Rotation with a legume can result in some increase in nitrogen from the
nitrogen-fixing bacteria present in the legume’s root nodules. Similar benefits can be gained by
combining agroforestry practices using leguminous trees or shrubs with CA (Akinnifesi, Sileshi,
Ajayi, & Beedy, 2011). Intercropping with legumes is another option that may help soil nutrient
management. Even rotations with non-legumes can result in relative yield increases, possibly
because of increased water infiltration caused by higher levels of soil organisms such as
earthworms (Thierfelder & Cheesman, 2011).
When benefits occur
While some of these benefits from CA are immediate many of them do not occur until the
system has been used for many years. This may make adoption difficult for risk-averse farmers
with short planning horizons, especially if there are short term costs (such as yield penalties) in
obtaining the long term benefits. Some conservation agriculture case studies suggest evidence of
a gradual intensification of adoption (in both area and number of components) over time by some
smallholder farmers in Zambia and Zimbabwe (Haggblade & Tembo, 2003; Mazvimavi &
Twomlow, 2009).
1.2.2. Constraints to adoption of hand-hoe CA technologies
The components of CA are complementary in that under certain conditions the benefits
increase dramatically if more components are used (Gama & Thierfelder, 2011). This explains
why it is usually promoted as a package. In southern Africa however, free range cattle make it
challenging to maintain permanent soil cover through a layer of mulch (Aagard, 2009).
Furthermore, rotating every third year with a legume is constrained by low prices for legumes
(Haggblade & Tembo, 2003). In most cases less than half of the farmers using CA are
implementing all three principles (Baudron et al., 2007; Mutsindikwa, Dumba, Munguri, &

16
Mvumi, 2011). Perhaps because of these challenges most organizations promoting CA
emphasize minimum soil disturbance (Baudron et al., 2007) and accept that many will not be
able to follow the other two principles. The lack of rotation and the lack of additional fertility
gained from permanent mulch cover theoretically increase the need for fertilizer in order for CA
to achieve high yields.
Fertilizer constraints
Organizations promoting CA often promote the technology with subsidized or free
chemical inputs (especially fertilizer and herbicides) so that farmers give the technology a try.
This has led to confusion about what benefits come from the inputs and what benefits come from
the CA principles (Giller et al., 2009). The promotion of CA with cheap or free inputs also
complicates adoption studies since adoption may not continue once the inputs are no longer
provided.
CA with higher levels of fertilizer than conventional maize production has the potential
to raise yields, (Ito et al., 2007) but cash constraints are a barrier to widespread fertilizer use
(regardless of tillage method). Most farmers in Mozambique grow maize without fertilizer (Bias
& Donovan, 2003). The benefits from fertilizer use depend on soil conditions (see above).
Fertilizer use in Africa is generally low because of both demand side and supply side factors.
Demand is often weak because of “the low-levels and high variability of crop yields on the one
hand and the high level of fertilizer prices relative to crop prices on the other.” (Morris et al.,
2007, p.5). The supply side is constrained by the high transportation costs and excessive
regulations for businesses (Morris et al., 2007). These issues have caused corporations for
tobacco and cotton production to set up contract farming schemes in southern Africa where
smallholder farmers get fertilizer directly from the company on loan, which is automatically
deducted from their payment when they bring their harvest for sale.
17
Reduced tillage constraints
Without fertilizer minimum tillage may lead to nutrient immobility causing farmers to
experience reduced yields (Giller et al., 2009). The decomposition of crop residues, which have
high carbon to nitrogen ratios, can lead to short term nitrogen immobilization because of
increased biological activity by organisms that lock up nitrogen in their bodies (Verhulst et al.,
2010). Tilling allows the incorporation of the residues, which speeds up the decomposition
process, which allows the nutrients to be available to plants for the next cropping season.
Leaving the crop residues on top of the soil slows the decomposition rate and may lead to short-
term losses in nitrogen availability (Verhulst et al., 2010). Over the long term greater nutrient
availability may be achieved if SOM content increases.
Baudron et al. (2007) reported that perceived increased labor costs in the first years were
a major disincentive for CA adoption in Zambia. Minimum tillage may require additional labor
for land preparation and weeding though under certain conditions these may decrease after the
first two or three seasons (Haggblade & Tembo, 2003). It is unclear from the literature whether
basins require more or less time for land preparation than conventional ridge splitting. One
estimate suggests that farmers need 320 hours per hectare of dry season land preparation to dig
basins (Baudron et al., 2007). The CFU in Zambia recognizes that it may take that long the first
year but asserts that with time farmers can learn to efficiently dig the basins in 180 hours
(Aagard, 2009) or even 138 hours (Nkatiko, 2011). Though most of these studies are based on
farmer recall, one study in Zimbabwe actually observed the labor required for CA with a sample
of 38 farmers and found that basin digging requires 25 days per hectare or 200 hours (Tshuma,
Mazvimavi, Murendo, Kunzekweguta, & Mutsvangwa, 2011).
The amount of labor required for land preparation with ridges in Malawi was estimated to
be 79 days per hectare or 632 hours (Takane, 2008), though this includes time spent clearing or
18
knocking down residues which CA farmers would also need to do but was not considered in the
basin digging measurements above. In contrast to this high estimate the CFU estimates ridge-
splitting would require 184 hours per hectare while overall digging (for example for potatoes)
requires 450 hours per hectare (Aagard, 2009; Nkatiko, 2011), though no sample size is given for
these estimates.
Theoretically the labor for basin making can be spread throughout the dry season but this
option may not be attractive where farmers practice irrigation, migrate for work or prioritize
cultural events after harvest. Furthermore, in Zambia there were complaints about livestock
ruining the basins between digging and planting (Baudron et al., 2007), requiring additional
digging shortly before the rains. With conventional tillage, on the other hand, residues become
buried supposedly decreasing livestock time spent on ridged plots.
One of the primary motivations for tillage is weed control (Wall, 2007); reduced tillage
greatly increases weed pressure (Baudron et al., 2007). Zambia’s conservation farming unit
recommends six weedings in order to manage the increased weed pressure but farmers rarely
achieve this (Baudron et al., 2007). CA plots in Zimbabwe showed greater weed density than
tilled plots early in the season (Mavunganidze & Madakadze, 2011) though another study found
no difference in weed biomass between CA and tilled plots at the end of the season
(Mashingaidze et al., 2011). Increased labor for weed control with CA has been recognized as a
constraint that can be overcome with herbicides (Baudron et al., 2007). Minimum tillage without
herbicides faces the challenge of controlling perennial weeds (Vogel, 1995) because of the need
to remove their deep roots.
In addition, reduced tillage can lead to soil and water management problems. The same
properties of minimum tillage that increase infiltration and reduce water loss can lead to water

19
logging in wetter areas or in dry areas that experience high rainfall events. When direct seeding
is used on heavy soils germination may be impaired because of the hardness and density of the
soil around the seed. Sandy soils may be more likely to become compacted which leads to
increased runoff and decreased infiltration (Giller et al., 2009).
Mulch constraints
The challenge of maintaining mulch is mostly caused by conflicts with livestock
(Baudron et al., 2007; Nyathi et al., 2011). Most of the regions where manual land preparation
through ridge splitting is common have a mixed crop-livestock system with free range livestock
able to graze on crop residues, which become a communal resource after harvest (Baudron et al.,
2007). Competition for crop residue prevented full adoption in case studies in Tanzania (Shetto
& Owenya, 2007). Cattle ownership is usually concentrated in the higher income groups who
benefit from these existing cultural norms and few development agencies even attempt to change
this property rights regime (Baudron et al., 2007). In addition, investments in maintaining crop
residue (including the cost of foregoing other uses) may be lost because of uncontrolled fires.
Mulching may also lead to an increase in crop pests, especially termites (Nyathi et al., 2011).
Furthermore, maintaining mulch may lock up nitrogen (see above), requiring increased
fertilization in the short term (IIRR & ACT, 2005).
Rotation constraints
The key challenges for crop rotation are the lack of a reliable markets for many
leguminous crops and the shortage of improved legume seeds (Baudron et al., 2007; Haggblade
& Tembo, 2003). One analysis of the gross margin earned by different combinations of rotating
maize, cotton, and sunhemp showed that the greatest profits were earned from growing maize
only (Thierfelder & Cheesman, 2011) despite yield increases from rotation. Much of the
experimentation with rotations has been done on experiment stations and there is little evidence
20
of fertility benefits in on-farm trials (Snapp, Rohrbach, Simtowe, & Freeman, 2002).
Intercropping with pigeon peas may have potential but one study in central Mozambique shows
that this practice results in increased weeding time and has the risk of losing the pigeon pea
harvest due to free range cattle after the maize harvest is complete (Rusinamhodzi et al., 2011).
Farmers are also hesitant to plant legumes in the permanent planting basins because of the
spacing (Baudron et al., 2007). The grid of planting stations is usually set up for the conventional
spacing for maize or cotton, which is different from the conventional practice of planting peanuts
and soybeans very close to each other in a line.

21
Table 1: Positive and negative short and long term effects of the three components of conservation agriculture cited in the
literature1
Short term positive
effects
Minimum
tillage Mulch Rotation Conditions for this effect to occur
Facilitates early planting X Where conventional system does not prepare land until the rains have
softened it and where a short rainy season limits yields
Reduced labor bottle
neck at planting time
X Where CA basins can be prepared throughout the dry season and where
the conventional system does not
Reduced labor for land
preparation
X Where ripping is faster than plowing and where direct seeding is used
Increased soil water
availability
Benefit only where water shortages frequently limit crop yields (see
waterlogging below for the other side of this effect)
- reduced evaporation X X Generally occurs
- reduced runoff X Minimum tillage increases runoff on "clay-poor structurally weak"
soils (Giller et al., 2009) but mulch may correct for this.
- increased infiltration X X X Minimum tillage decreases infiltration on "clay-poor structurally weak"
soils (Giller et al., 2009) though it could increase infiltration where a
hard pan problem is corrected by basins or deep ripping.
Breaks through hard pan X Only where hard pan is a problem; requires deep basins, deep ripping
or sub-soiling before using CA to have this benefit immediately. Or it
is possible to wait several years for root systems to break up hard pan.
Reduced soil
temperature oscillations
X Generally occurs
Long term positive
effects
Minimum
tillage Mulch Rotation Conditions for this effect to occur
Reduced erosion X X On gently sloping fields or in combination with contour bunds or
vegetation strips
Increased soil organic
matter
X X X Larger effect on clay soils; on sand it depends on what is added each
year; effect occurs faster with basins using manure or compost
22
Table 1 (cont’d)
Increased N
mineralization
X X X Benefit where soil N is limited, which is very common
Increased soil
aggregation (improved
soil structure)
X X X Generally occurs
Short term negative
effects
Minimum
tillage Mulch Rotation Conditions for this effect to occur
Nitrogen immobilization X When soil N is limited and when residues with high C:N ratio are used,
both of which are very common
Increased weed pressure X Under most conditions, magnitude depends on weed seed stock
Water logging X Higher rainfall areas or during high rainfall events in dry areas, more
common with heavier soils
Poor germination X Heavy soils with direct planting
Stimulation of crop pests X Where termites and other insects that benefit from the mulch are
already a problem
Occurrence of residue
borne diseases
X Depending on the conditions for each particular disease
Long Term negative
effects
Minimum
tillage Mulch Rotation Conditions for this effect to occur
Increased soil
compaction
X Especially in sandy soils
Increased soil acidity in
top layer
X Not ubiquitous and unclear causation
1Sources: Baudron et al., 2007; Haggblade & Tembo, 2003; Giller et al., 2009; Verhulst et al., 2010

23
1.3. Summary of potential benefits and constraints
Changes from ridged agriculture to CA may result in a variety of positive and negative
effects that vary with the specific context. The specific combination of positive and negative
effects in any given area will affect the yield difference and labor requirement differences
between CA and conventional agriculture. The general attractiveness of CA to smallholder
farmers, therefore, may be very context specific. Even in areas where CA is generally not
beneficial there may be niches where the constraints are low and the benefits are adequate for
farmers to use CA on a small scale. If the principles of CA are taught broadly and farmers
innovate and adapt then it is more likely that they will be able to maximize the benefits and
minimize the negative effects of CA using the resources most available to them.

24
2. Data and Methods
In this study I explored CA adoption through semi-structured interviews with CA
farmers, dis-adopters and non-adopters. By gathering qualitative and quantitative data from
farmers who are using CA on small plots I was able to explore the constraints to farm-wide
adoption from the farmers’ perspective. During the interviews I visited farmers’ CA plots where
I gathered labor data for every task in the last season based on farmer recall, measured field size
with a GPS and obtained the farmer’s estimate on the harvest. I developed partial budgets by
using the labor, input and yield data in order to assess farmers’ incentives for adoption of CA
maize. Interviews with non-adopters and dis-adopters provided further detail on the constraints
of CA adoption. I also interviewed agricultural professionals to check what I was learning from
the farmers with the local technical experts. Some of these professionals were involved in CA
projects and through the interviews I was able to understand how CA was being promoted in the
region. All interviews were recorded and transcribed. Thematic analysis was used to process the
text data.
2.1. Case description
The majority of data was collected from one community where two NGOs have been
promoting CA for the past three years. By focusing on one community I was able to obtain a rich
understanding of the farmers’ perspectives by interviewing most participants in a similar context.
The community makes an interesting study because two NGOs promoting very different CA
technologies have been working there for several years with a reasonable number of participants
in each program. The Angonia highlands are an interesting place to study CA because they are a
highly productive zone of Mozambique. While CA practices are often used in more arid
environments than the high rainfall Angonia highlands, this area does experience significant

25
mid-season dry spells. Though farmers in this agroclimatic region may not need to conserve
moisture as dramatically as other parts of the country they also may have fewer challenges to
intensification because of the high agricultural potential.
2.1.1. Geographic setting
The Angonia highlands of Tete province Mozambique are a productive zone on the
western border of Malawi with high rainfall (900-1200mm) and high population density. The
altitude for this region is over 1000 meters with average temperatures between 18 and 24 degrees
Celsius (Amane & Mlay, 2002). The most common soil types are Lixisols and Luvisols (see soil
maps in Geurts, 1997; Amane & Mlay, 2002), both of which are considered decent soils for
agriculture though possibly rather nutrient depleted (Geurts, 1997). Soil fertility is a key
constraint to smallholder production in Mozambique in general (Bias, Donovan, 2003). A low
population density means land is generally abundant in Mozambique but farmland is constrained
in the most productive areas (Bias & Donovan, 2003) including in most of the study area of
Angonia and Tsangano districts. The range of landholdings for smallholders in these areas varies
roughly from five hectares down to one hectare.
2.1.2. Non-governmental organizations
In the Angonia highlands the Igreja Reformada em Moçambique (IRM) is a NGO
promoting CA with basins and compost (Table 2). IRM has been promoting CA in Tete province
for four years and in 2009 it had 1307 farmers using some form of CA in 12 catchment areas.
Total Land Care (TLC) is a NGO promoting CA with direct seeding, herbicides and fertilizers
(Table 2). TLC has 248 farmers participating in 30 communities in its CA program in Angonia,
Tsangano and Macanga districts, which have been growing steadily over the past three years.

26
Table 2: Details of CA as promoted by two NGOs
Organization IRM1 TLC
2
Plot size .04 ha (20mX20m) 0.1 ha (50mX20m) 0.3 ha (50mX60m)
Planting method Basins Direct seeding Direct Seeding
Plant spacing 2 plants/basin 60cm
between basins and 75
cm between rows
1 plant every 25cm
and 75cm between
rows
1 plant every 25cm
and 75cm between
rows
Plant population 44,443 plants/ha 53,320 plants/ha 53,320 plants/ha
Fertilizer 6kg NPK, 6kg Urea
2 oxcarts of compost
25kg NPK 25kg Urea 50kg NPK 50kg
Urea
Fertilizer
application rate
.15 tons/ha of each 0.25 tons/ha of each .167 tons/ha of each
Herbicide None 0.5L Glyphosate,
0.5L
Alachlor/Atrazine
1 L Glyphosate, 1 L
Alachlor/Atrazine
1Igreja Reformada em Moçambique
2Total Land Care (TLC) provides different farmers with two different levels of inputs for
different plot sizes depending on which project is funding their participation in CA production.
2.2. Overview of the study design
The research presented here is a case study focused on one community using qualitative
interview data and quantitative partial budget data in order to obtain an in-depth analysis of the
constraints to CA adoption by smallholder farmers. This section provides background for the
qualitative research methodology that may be less familiar to many of the readers than survey
based research methodology or agronomic experimental methodology.
The term “qualitative research” can refer to a variety of different research types which
differ from quantitative research in that they depend less on numbers, categories and/or statistical
analysis. In this paper I use the term “qualitative research” to refer to text data analyzed
qualitatively using thematic analysis (see below). While quantitative data is used in this study for
an in-depth understanding of farmers’ incentives for CA adoption, that data was gathered during
the qualitative interviews which do not arise from a random sample.
27
Qualitative methods differ from survey-based statistical analysis in that they are less
structured, allow for iterative interactions with participants and do not rely on random sampling
(Chung, 2000). Frequently semi-structured interviews are used in qualitative studies to provide a
framework for interacting with research participants and categorizing their responses while still
being easily adapted mid-course in order to include new categories or refine previously defined
categories (see Rubin and Rubin, 2005, Ch.6 for an overview of qualitative interviewing).
Iterative interactions with research participants enable the researcher to check back with earlier
participants in order to gain their perspective on concepts or relationships that were only seen to
be important after their first contact or to clarify their responses in light of what was learned
from other interviews.
While quantitative research is usually associated with positivist or post-positivist
epistemologies, qualitative approaches are often promoted by those with constructivist and
critical theory epistemological perspectives (Guba & Lincoln, 1994). In reflecting on my own
epistemological assumptions I seem to hover between post-positivism and constructivism. I
think that this tension comes from my ontological assumptions that there exists one “true” reality
but that reality is only partially comprehensible by humans because we are inherently biased by
our socially constructed perspectives. Qualitative research allows for carefully discerning a
complex reality by intentionally recognizing one’s own bias and explicitly aiming to understand
the perspectives of research participants, including their categorization and explanation of the
phenomenon.
Much of the debate between proponents of qualitative and quantitative research methods
have been around these epistemological and ontological issues. However the either/or
dichotomy ignores the complementarities between the two approaches (Chung, 2000).

28
Qualitative research and surveys are not mutually exclusive and, in fact, they are becoming
increasingly popular together (Patton, 2002). Qualitative research can be instrumental before
survey design to ensure that the right questions are asked in the right way in order to gather as
much information as possible (Chung, 2000). Sometimes it might be desirable to include a few
open-ended questions in a survey to be analyzed qualitatively to allow research participants more
freedom to share their own perspectives (see the case of the Kalamazoo school system in Patton,
2002). In addition, qualitative research methods can be utilized after surveys have been analyzed
in order to facilitate the interpretation of the results. For example, quantitative surveys in
Thailand in the 1970s detected a dramatic change in average family size but provided little
evidence about why this phenomenon occurred (Knodel, Havanon & Pramualratana, 1984).
Knodel’s qualitative research on the fertility transition in Thailand provided missing information
about what motivated people to have smaller families thus facilitating the interpretation of the
quantitative results (Knodel et al., 1984).
Tashakkori and Teddlie (1998) “stress the importance of the research question over the
paradigm” (p.10) and suggest that “for most applications… research questions are best answered
with mixed method … research designs” (p.10). Though this study is primarily a qualitative
exploration of the research question, I had originally hoped to follow it up with a quantitative
survey. Time and resource constraints prevented me from doing so.
Qualitative research was appropriate for the final scope of this study because it focuses
on why farmers are not adopting CA on more of their land. Qualitative research has a number of
advantages over traditional survey methodology for addressing social science research questions
aiming to understand how or why a phenomenon occurs. Research on how a social phenomenon
happens requires exploring many different possibilities that may be difficult to thoroughly
29
categorize a priori but may become apparent in the middle of the data collection, thereby
requiring a less structured or more flexible approach. Research on why a social phenomenon
occurs often requires subtle questioning to tease out research participants’ motivations and/or a
less rigid research design that is able to include unanticipated variables.
In addition, this qualitative study provides a unique contribution to the CA literature as a
community-focused case study grounded in data from in-depth interviews with individual
farmers. This is different than other CA case studies (such as Baudron et al. 2007 for Zambia
and Shetto & Owenya, 2007 for Tanzania), which depended more on grey literature from NGOs
and focus groups facilitated by CA promoters which may be biased towards the benefits of CA.
While those studies provide significant insights into the advantages and constraints of CA from a
large scale perspective, they risk missing important factors faced by individual farmers. This
study on the other hand aims to present in-depth analysis of the perspectives of individual
farmers in a specific community in order to generate hypotheses about the constraints to adoption
from their perspective.
Qualitative research methods are ideally suited for initial efforts to answer the research
question of this study: why are farmers not adopting conservation agriculture? By answering this
question in-depth in one specific community this study aims to generate hypotheses that will
inform both policy decisions about CA promotion and further research examining the constraints
to CA adoption. By providing details about the critical categories of benefits and constraints in
this context, this study aims to facilitate future quantitative studies about CA adoption.
30
2.3. Sampling and Data collection
2.3.1. Community selection
The community, Bwaila (a pseudonym2), was purposively selected after visiting 13 of the
communities where at least one of the two NGOs are promoting CA (see Table 8 in Appendix A
for the community selection table). Bwaila was chosen for three reasons: CA had been promoted
there for three seasons, both NGOs were operating there, and it had more CA participants than
other communities. Visits to other communities helped put the results in a broader context.
Bwaila is a large concentrated village of over 800 households with agricultural lands in a
3 km radius around it. Nearly all of the land is cultivated each year except the steepest parts of
the hills, which are used for grazing. Three creeks run through the village enabling small-scale
irrigation. A 2 km path leads from the village to a well-maintained dirt road leading to the
nearest administrative centers. Most farmers sell their potatoes either at Vila Ulongue (25km
away) or at Tsangano turn-off (17km away) in Malawi situated along the Lilongwe-Blantyre
highway.
Two other communities are specifically mentioned in the analysis below for how they
contrast with Bwaila. Mulingo is a small community (about 100 households) a few kilometers
from the border with Malawi, about 15km east of Vila Ulongue, where only IRM is working.
The landscape there is a deforested rolling plain with lower population density and large tracts of
uncultivated grasses. The area may have higher rainfall and the community is crossed by a large
stream used for irrigation. Kawale is a community about 30km west of Domue with low
2 All of the communities in this study are given pseudonyms to protect the identity of individuals
who participated in this research. This decision was made a priori and was communicated as
part of the consent process, partly in order to encourage greater disclosure by participants. In the
end there is hardly any information in this study that could be considered sensitive but
pseudonyms are retained since confidentiality was promised to all participants.

31
population density and many large trees and large tracts of woodlands between fields and houses.
Irrigation is also practiced in the small streams that run through this community. (Note that
Kawale is not listed in the community selection table (Table 8) because it was not visited before
Bwaila was selected.)
2.3.2. Respondent selection
I interviewed 18 CA farmers, four dis-adopters and 11 non-adopters in the focus
community, Bwaila. In addition, I gathered some additional information from visits to 16 other
communities where the two NGOs work and from interviews with eight agricultural
professionals (see Appendix A for a list of data collections).
I identified CA farmers in the communities with the help of the IRM and TLC staff
responsible for the communities I visited. The staff of each NGO organized a meeting to present
me to the CA participants in Bwaila during which I introduced my research to them, gathered
some general information about their use of CA and scheduled interviews. Some CA participants
did not attend this initial meeting. Time prevented me from interviewing every adopter but the
majority of TLC participants (11 out of 15) and many of the most active IRM participants (10
out of 45) took part in the study. The CA farmers who did participate in my study tended to be
the most active participants as evidenced by their attendance at the initial meetings and their
willingness to spend time with me in an interview. This selection bias towards the leading edge
of CA farmers does not threaten my results since it can safely be assumed that the less active
participants would not generally have had more success with CA.
The NGO staff only accompanied me to Bwaila in the first weeks to introduce me to the
participants and the local authorities. I interviewed every dis-adopter in Bwaila that I learned of
during the data collection. Non-adopters were interviewed opportunistically as I met people in
32
the focus community (for example the daughter of one older CA farmer, the brother-in-law of
another and the sub-chief near the church). Professionals were purposively chosen who could
provide information on either the specifics of the CA projects or general information about
agriculture in the area. (See Appendix A for a list of interviews.)
2.3.3. Data collection
Semi-structured interviews with CA participants focused on the following main topics:
the specific practices used on the CA plot visited, benefits and challenges of minimum tillage,
mulch and crop rotation, land tenure security, perception of rainfall patterns, how they learned
about CA, household characteristics, labor use and general agriculture practices. During these
interviews the CA participants shared their detailed labor data for every task, their estimated
yield, the inputs used and the prices of inputs if they purchased any themselves. I measured CA
plots at the same time as the interviews. Interviews with professionals focused on how their
organization promotes CA and what benefits and challenges they perceive in its use. (Please see
the semi-structured interview guides in Appendix A for details). In addition, I was able to check
what I was learning about CA from the participants with the NGO professionals. The NGOs
provided me with information about the prices they paid for inputs provided to CA participants
which was used for the partial budget analysis for TLC.
I carried out my interviews over two months during the dry season. I spent about 5 hours
interviewing and visiting the fields of each CA farmer, though this time was usually broken up
over two or three days. By visiting their CA plots I was able to directly observe the size of the
plots that were farmed without ridges relative to other fields, the level of mulch on the ground
and weeds in the plot. Since I was visiting the plots shortly after harvest it was possible to
observe the size of the maize stalks.

33
Interviews were conducted in Chichewa with farmers and in Portuguese with
professionals. All interviews with farmers and most with professionals were recorded and
transcribed. Two interviews with professionals were not recorded but my detailed notes were
expanded into an interview summary document within 24 hours of the interview. During the
interviews with farmers I took some notes that I later typed. In addition, after most days of data
collection I recorded my own reflections on the process and my otherwise unrecorded
observations from the day. These recordings were also transcribed. Occasionally I typed my
observations after carrying out interviews.
At the end of conducting the interviews I had three group interviews in order to check my
initial findings with CA participants. Two of these group interviews were conducted in one
community with the participants of each NGO while the other was conducted in another
community with CA participants from IRM. During this final interaction I was able to ask each
group some of my remaining questions and get their feedback about my initial conclusions.
These group interviews also gave me an opportunity to observe the level of consensus on certain
issues in a group setting and compare how individuals’ responses compared to the private
interviews. The group interviews were recorded and transcribed though it was not always
possible to determine specifically who was speaking from the recording.
2.4. Data Analysis
2.4.1. Thematic analysis
Thematic analysis was used to code and summarize the transcripts and notes from the
data collections. Thematic analysis is an on-going process of developing and reformulating
hypotheses that starts in the field while the data is being recorded and continues until the
research is written up (Rubin & Rubin, 2005). In thematic analysis the researcher systematically

34
examines the transcripts for themes and concepts that address the research question and then
develops a coding system for labeling all of the text data that relates to each theme or concept
(Rubin & Rubin, 2005). The themes and concepts may be based on the literature or may emerge
from the data (Rubin & Rubin, 2005). Coded data facilitates the systematic retrieval and analysis
of the data into meaningful and manageable “chunks” (Miles & Huberman, 1994).
The interview data were coded into 19 themes using the definitions and rules detailed in
Table 10 in Appendix B. I initially developed these themes before I started collecting data
considering the categories of information I expected to hear from participants based on my
previous experience and the literature on CA. This list of categories was then refined and
formalized during the data collection based on the information I was collecting. When I had
transcribed about one third of the interviews I started coding and by using the codes I was able to
make some adjustments in the definitions and add to gaps in the coding system. At this point I
finalized the codes and definitions presented in Appendix B. I was open to further adjustments
on the coding system in case new categories emerged but none were necessary. I was already
familiar with the content of all of the interview data because I collected it and had been reflecting
on it throughout the collection process. In addition, I made the decision to apply the code
whenever I was in doubt so as to ensure that no meaningful data was left out of the coding
scheme.
I used the Nvivo computer program to facilitate the analysis by electronically coding the
text and gathering the categorized data into groups for extraction and analysis. Once all the data
for a particular code was in one place I read through it carefully making marginal notes on paper.
I then summarized the information for each code into a set of condensed statements that
highlight the main points from that data regarding the research question. I revised these summary

35
statements by systematically re-reading the categorized data and my marginal notes to make sure
that the diversity of responses were represented.
Throughout the analysis I processed the data with a focus on answering the key research
question: what are the constraints to CA adoption? Information that was not relevant to this
question was not fully analyzed (for example, the codes on livestock and irrigation). I started by
processing the codes for benefits and challenges of CA use. This information gave me a general
picture of how to continue the analysis: by focusing on fertilizer use and labor changes. The
tension between the positive and negative perspectives on CA by the same individuals caused me
to look for greater depth of meaning through the quantitative details about labor, yields and costs
of inputs. The importance of fertilizer for CA led me to develop displays comparing participants’
levels of fertilizer use and the resulting yields. I also created a display about compost production
with details from each IRM participant in order to summarize their perspectives on compost. The
themes and displays were then organized into groups related to soil fertility (mulching, rotations,
compost, fertilizer) and labor changes (herbicide, labor shortages, wage labor). The results
below address these two categories and the qualitative information comes directly from the
summary statements and displays generated in the thematic analysis.
2.4.2. Quantitative data analysis
I analyzed the quantitative data (gathered during the in-depth interviews) on plot size,
labor by task, quantities and prices of inputs and estimated yields in order to assess labor changes
and CA profitability. Labor data is based on farmer recall of all tasks carried out on a given plot
in the previous season. Farmers shared how many people did each task for how many days
including approximate start and end times for the different tasks. The data were entered into a

36
labor data table (see Table 9 in Appendix A) and the information was separated by gender and
age. Household labor was recorded separately from paid labor.
Total man hours were calculated by adjusting female labor by a factor 0.75 for the heavy
tasks of basin making, ridge making and banking. This factor was based on interviews with
women who supplied agricultural labor and were asked to compare what they were able to
accomplish on those tasks in one day compared to men. Labor from children under 15 was
adjusted by a factor 0.5 except for planting and fertilizing where it was only adjusted down by
0.75. The difference is based on how farmers seemed to value their children’s efforts more for
the tasks of fertilizing and planting. (Note: Uaiene (2008) used a similar adjustment (0.75 for
women and 0.5 for children) for calculating labor based on number or people in the household;
Mupanda (2009) valued men and women equally and excluded children under 15).
I used the transcripts for checking and correcting the labor data tables that I filled out
during the interview process. Labor data was collected disaggregating by gender and age (see
Table 9 in Appendix A for the data collection instrument). The mean labor requirements and
standard deviations were calculated for each set of agricultural tasks. I collected data on field
size using a measuring tape and GPS for each CA plot visited and for some non-CA plots.
In addition, I analyzed the quantitative data using partial budget analysis to assess the
profitability of CA use. This analysis required putting a cash value on the yield and subtracting
the cash costs and a monetized value of household labor. These calculations were made under
different assumptions of maize prices and household labor opportunity costs. Valuing the TLC
inputs can be done either by valuing the grain the farmers actually return to the NGO or by
estimating the market value of the inputs. In the first case the monetized value was calculated
using the low maize price, which is appropriate for when the grain was to be collected. To
37
estimate the market value of the inputs (MZN 2640 on average for the farmers receiving higher
input levels) I used the prices provided by TLC and the quantities the farmers said they actually
applied to that plot. Participants receiving the larger quantity of inputs were expected to repay 3
sacks of maize (50kg each), which had a value of 600 MZN during the harvest period, indicating
that NGO was effectively subsidizing over 75% of the input costs.
I analyzed CA profitability for three different groups of CA farmers (IRM and the two
TLC groups). The TLC participants were separated into two groups based on the amount of
inputs they were provided with (see Table 2 for details). The participants who received two 50kg
bags of fertilizer were supposed to use it on 0.3 ha but on average applied it only over 0.25 ha
thereby increasing the fertilizer application rate from the recommended 0.334 tons/ha to 0.4
tons/ha.
It is also possible to construct an approximation of the total costs and benefits of using
CA under different field sizes by making a few assumptions about the opportunity cost of labor.
For large fields (over 0.5 ha) the opportunity cost of labor can be assumed to be equal to the
market agricultural wage rate (40 MZN/day) because a household would either be able to sell
their labor at that rate (for example if they decided to leave it fallow) or would have to pay for
labor at that rate if their own supply was inadequate.
However, as the field size gets smaller this assumption seems less realistic for many
households since it may not be necessary to spend a full working day at a time in the small plot.
It seems likely that small farmers in this context have some surplus time (during non-peak labor
seasons) that cannot reasonably be used for wage labor since it is only a few hours a day. This
“spare” time would have very low opportunity cost and could be used for agricultural activities
(such as making one pile of compost or weeding a very small plot). Stated conversely, as more

38
hours are needed the opportunity cost increases since the farmer would otherwise be doing
something else (weeding another field for example).
2.5. Validity issues
Qualitative data collection deals with threats to validity in a very different manner than
quantitative studies (Maxwell, 2005). Quantitative studies use control groups, random sampling
and other methods to generically control for rival hypotheses in advance. Qualitative studies, on
the other hand, frequently use non-random (purposeful) sampling to allow researchers to select
participants based on the information they can provide (Patton, 2002). By focusing on where
rich information can be found the researcher avoids wasting time interviewing, transcribing and
analyzing irrelevant or redundant information. The key criterion for participant selection is their
potential to provide a deeper understanding of the research question.
In the absence of random sampling as a check against the subjectivity of the researcher,
qualitative researchers cannot simply draw conclusions from the data without explicitly
providing evidence against alternative conclusions (Maxwell, 2005). During the data collection
process therefore, researchers must actively seek evidence that could challenge their conclusions.
This requires consciously developing alternative hypotheses and considering what information
would be needed to support or discredit each hypothesis.
Qualitative researchers have a variety of strategies that can be used to improve the
validity of their findings. Long-term involvement with participants through multiple interviews
and multiple visits to each site can “help rule out spurious associations and premature theories”
(Maxwell, 2005, p.110). Intensive interviews rich in detail which are recorded and transcribed
reduce the chances of producing “data that uniformly support a mistaken conclusion” (Becker,
1970, quoted in Maxwell, 2005, p. 110). Researchers can also systematically solicit feedback

39
from participants about the data and their conclusions to avoid misinterpretation, a process which
is often referred to as “member checks” (Maxwell, 2005). Researchers can avoid systematic bias
through triangulation: a process of “collecting information from a diverse range of individuals
and settings, using a variety of methods” (Maxwell, 2005, p.112). For example, interviews with
farmers can be combined with observation of their fields and interviews with extensionists in
order to verify what farmers self report.
In addition, qualitative researchers reduce threats to the validity of their study by
systematically mitigating the negative effects their own bias may have on how the research is
conducted and the conclusions drawn (Maxwell, 2005). During the data collection researchers
must be aware of their own bias and of how they influence the responses of participants. In
conducting semi-structured interviews it is critical for researchers to avoid using leading
questions and to be aware of how their reactions to participants’ responses (through both words
and body language) affect the information participants share (Rubin & Rubin, 2005).
Rubin and Rubin (2005) argue that “interviewing is more than learning how to word and
ask questions. …an interview is part of a developing relationship in which issues of mutual
interest are explored in depth” (p.128). In the context of personal relationships it is impossible to
imagine eliminating researcher bias or reactivity to the researcher. Because of this, in analyzing
the interview data, qualitative researchers must reflect critically on how the participant came to
share some evidence towards a hypothesis. For example, evidence that is shared voluntarily with
rich detail can carry more weight than a short response prompted by a leading question.
This study incorporates many of these principles in order to maximize the validity of the
findings. Though many of these strategies were described throughout the methods section they
are listed again to document the care that was taken to ensure that the results are as valid as

40
possible. This study’s design aimed to reduce the chance of coming to the wrong conclusions by
carrying out iterative in-depth interviews in one location which allowed for longer term
relationships with the respondents and a greater understanding of their context. Furthermore the
triangulation of findings by observing fields, interviewing farmers and the NGO staff responsible
for those communities helped ensure that the data was robust in supporting the conclusions
drawn. Member checks by the farmers at the end of the data collection period were used to verify
that the conclusions drawn were supported by the participants. Finally the research design
supports that the conclusions are valid by explicitly pursuing evidence for alternative hypotheses
as explained in the results below.
The study design also aimed to minimize researcher bias by transcribing the interviews
and using open-ended questions. Furthermore, I attempted to reflect critically on how my
actions may be influencing responses and made every effort to avoid reacting to what seemed
surprising or indirectly leading respondents to answer in the way I expected.
2.6. Description of participants
The 19 NGO participants that I interviewed were a heterogeneous group with varying
levels of assets, education and experience with CA. The IRM participants were mostly members
of the local Reformed Church since the NGO uses that local institution as the starting place for
its community outreach. The most active members from IRM were composed of five men and
seven women and I interviewed 10 of these 12 and came to know seven quite well by visiting
their fields and some of their homes. Though the IRM staff person responsible for Bwaila gave
me a list of 45 CA participants, it was these 12 who managed the CA demonstration garden next
to the church and attended both the initial meeting and final meeting I had with them.

41
Of the seven participants I came to know well, two of the best off IRM participants were
older men who had metal roofed homes and adequate maize harvests despite low education
levels. One man and one woman (both in their 30s) had higher education levels (3rd
and 6th
grade respectively), metal roofed housing, and higher levels of fertilizer use. At the low end of
the asset spectrum was a man in his 30s and a woman in her 50s who were both illiterate, had
homes that were small and thatched and expressed frustration about low agricultural
productivity. A woman in her 50s was at the lowest asset level judging by her inability to buy
any fertilizer and the shortage of labor in her household (abandoned by her husband but
supported by her three married daughters). All of these participants had landholdings of at least
one hectare, often divided over multiple fields. They each had a small CA mono-crop maize plot
(on average 0.08 ha) that had been under minimum tillage for 2 or 3 years without rotation.
None of them were actively employed in non-farm income earning activities and only one of
them earned the potentially high return cash crop tobacco.
There are 15 TLC participants in Bwaila who are using CA and receiving subsidized
fertilizer, herbicide and seed from the NGO. I interviewed 11 of them and I visited 9 of their CA
fields and many of their homes. Two of these TLC participants are also IRM participants – both
of them men in their 30s described above. Of the remaining nine, four of them are older men
who seemed to be well off compared to most of the IRM participants with three having
significant non-agricultural earning and the other one being the only tobacco farmer of the group.
One man and one woman (both in their 30s) had limited outside employment, some fertilizer use
but poor housing. Two older women had low levels of fertilizer use and low education levels.
One young woman who had been left by her husband to care for two small children never used
fertilizer unless it was given to her and regularly sold her labor to meet her cash needs.

42
As with IRM participants all of these farmers had landholding of over one hectare spread
over several fields. Five of the TLC participants I interviewed were trying CA for the first time
this year, three had done it for two years and three participants had three years of CA experience.
All but one were only using CA on a single plot, for which TLC provided all of the inputs. The
chairman of the TLC group had an additional CA plot that he added the previous season using
the fertilizer he received at a subsidized price from the Mozambican government.
3. Results
This study explores the constraints to CA adoption by smallholder hand hoe maize
farmers in the Angonia highlands of Mozambique. I explored the constraints to farm-wide
adoption by interviewing farmers who were using CA on small plots because of their
participation in NGO programs that were promoting CA. I also interviewed farmers in the same
community who had never used CA in order to understand the constraints to initial CA adoption.
The first step in analyzing the constraints to adoption was to understand the participants’
perceptions of the technology.
Most farmers in this study state that they like practicing conservation agriculture, mostly
because it addresses one of their key priorities: increased maize yields. One lady said, “I never
expected to get an oxcart of maize from that area.” The CA farmers explained in the interviews
that the key reasons for yield increases are fertility supplements and a greater planting density.
The combination of higher yields for less effort was also a frequently mentioned benefit as
succinctly summarized by one farmer: “The difference is that we don’t work them (the fields)
with much power but we harvest for real.” For another farmer the change in work requirements
was the key benefit: “Here (in a CA plot) you don’t cry, it is different than that type
43
(conventional agriculture).” Another added, “It doesn’t get your blood running, this no-till
farming.” Additional benefits that were mentioned are that CA is more drought-tolerant and is
better for long-term soil fertility.
However, in contrast to all the positive opinions about CA there is little sign of CA
adoption beyond the plots where NGOs have provided inputs. By visiting the fields of CA
participants and inquiring about their tillage methods I came to understand that CA practices
were limited to small plots and that most land was still being farmed with conventional ridges. In
Bwaila only one farmer had one plot where he expanded CA use beyond where the NGOs had
ever provided inputs. Many of the IRM participants had reduced the area under CA because the
NGO failed to provide inputs during the last agricultural season. These findings suggest that
farmers were convinced of the benefits of CA but something about the technology was
preventing them from using it on more of their land. This seeming contradiction between the
opinions of the farmers and their actions is what motivated the in-depth analysis of this study.
The remainder of this section focuses on three constraints to CA adoption that emerged from
analyzing the data: reduced nutrient availability, increased labor requirements and low
profitability.
3.1. Soil fertility and CA
Most of the farmers explained during the interviews that because they could not afford
fertilizer they were not able to use CA on more of their land and reap the benefits of what they
had seen on the small plots where NGOs had provided the inputs. The nutrient immobilizing
effect of reduced tillage appears to be preventing farmers from using CA on their unfertilized
maize fields.

44
Most farmers in Bwaila see burying crop residues as a strategy to make low fertility
fields produce some maize by making “compost” right in the field. One of the TLC chairmen in
the village said, “If I just dig a hole and plant, the roots quickly reach infertile soil, so the maize
doesn’t grow much, but on a ridge it will grow well because it is only on good soil.” An IRM
dis-adopter added that, “where there is minimum tillage the roots quickly find un-dug places that
are too dry so it (maize) gets weak quickly. But where you have made ridges they (the maize
plants) all do well.”
When interviewed, most CA farmers said they wanted to expand CA but they were
adamant that they need fertilizer to make CA perform better than ridges. The IRM participants
showed me their group demonstration garden with three CA plots – one with fertilizer only, one
with compost only and one with nothing added. They explained that the portion with no added
fertility grew maize that was only about one meter tall and produced almost no grain. The small
stalks were still visible in the plot when I visited in June. Another IRM participant in another
community, Mulingo, showed me her CA field which she had divided into three portions – one
with compost and fertilizer, one with compost only and one without anything added. The maize
in the last section was less than a meter tall and produced no harvest at all. Both of these farmer
trials were surrounded by ridged maize that grew tall and presumably was not fertilized. Though
there are many imperfections to these “experiments” they convinced most of the farmers that CA
without added fertility would not produce anything.
Not everyone agreed that farmers would experience better yields with ridges than with
CA absent of fertility amendments. Many professionals and some of the participants asserted
that it would make no difference if you make ridges or not; the yield simply depends on soil
45
fertility. The head TLC chairman said, “If there is no fertility even if you make ridges it won’t do
well and without ridges it won’t do well.”
Interviews with farmers revealed mixed opinions on the performance of unfertilized
ridged maize. While some farmers expressed their satisfaction and pride, others said that the
ridges were hardly producing. One of the IRM dis-adopters explained that he had a fertile field
that he had cleared a few years earlier that consistently produced several oxcarts of maize
without fertilizer, which was more than he expected for its size. In contrast, a young couple that
participated with TLC explained that they have to add fertilizer to produce acceptable maize
yields on their family plot. I collected detailed labor and yield information for two conventional
maize plots (see the last column of Table 4) and it was striking that almost twice as much labor
was used on the plot that had nearly half the yield of the other plot. It is likely that this variation
has much to do with the existing soil fertility of the field and the timeliness of the management
practices of the farmers. This heterogeneity in conventional agriculture may be critical for
understanding CA adoption since farmers are directly comparing how CA performs relative to
their other fields.
Farmers believe that they need increased fertility to use CA and there are two ways they
commonly meet this need: compost and fertilizer. The next section discusses compost
production and its potential as an alternative to fertilizer. After that I examine farmers’ fertilizer
use patterns in order to explore if access to fertilizer relates to CA adoption.
3.1.1. Compost production
IRM professionals explained that compost production is their strategy for helping cash-
constrained farmers to supplement the fertility in their soil. During the interviews these
professionals pointed out that compost production uses farmers’ labor and saves their cash while
46
still improving the soil structure and adding nutrients. In the interviews with many of the
farmers who used compost, they mentioned benefiting by needing less fertilizer and improving
drought resistance. The key complaint that compost-using farmers shared was the problem of
transporting the compost to their fields by head or oxcart. IRM CA participants explained to me
that they apply one can of compost per basin which may weigh about 150 grams (IIRR & ACT,
2005) coming to a total of about 3,330 kg per hectare. Some of the farmers I interviewed who
used compost also complained that obtaining the ingredients was too difficult and time
consuming.
During the interviews the majority of compost-using farmers complained that compost
was not as effective as fertilizer and that it made the maize grow well but then it “ran out of
power” at tasseling. Many IRM participants described how their harvests were radically reduced
this year compared to last year when IRM gave them 12kg of fertilizer for 0.04 ha plots (20m by
20m). Farmers use about one oxcart or less of compost for a 0.03 ha plot (10m by 30m). IRM
suggests that farmers apply at least an oxcart on 0.02 ha plots (10m by 20m). The low
application rate by IRM participants probably explains much of the poor results they perceive
from production with compost only. In contrast, one farmer at Kawale had increased harvests
because he increased his compost application and kept his fertilizer rate the same.
Many of the farmers I interviewed say that minimum tillage with compost is better than
minimum tillage with no fertility amendments. In the “experiments” mentioned above compost
did better than CA without adding any sort of fertility. One joint TLC and IRM participant
stated his opinion about compost this way:
We have seen that it is a very good method, making compost, because the field is going
back to old times; because that soil had run out with our parents. So, if we just hoe, the
maize does not come. But if we add compost we can see a difference with how things
were (interview with BM8).
47
Despite challenges all of the IRM farmers interviewed in Bwaila made compost in small batches.
One farmer in Mulingo said that making compost was much easier than finding money to buy
fertilizer suggesting that, for him, labor is more abundant than cash for small-scale CA
investment. All IRM participants were using compost either for CA or for irrigation agriculture
but it would probably improve conventional maize production as well.
One of the lead IRM participants explained to me that he minimizes the constraints to
compost production by locating his CA plot close to home. Another explained that last season
he made compost little by little, which he found less inconvenient than making it all at once as he
did previously. The IRM participants in Mulingo found that group work helped reduce labor
because “every hand grabs something” as they produce compost on a rotating basis.
Nevertheless, in the individual and group interviews every IRM participant agreed that it would
not be possible for each farmer to have enough compost even for one entire field.
The labor data results from this study indicate that on average it takes 24 hours to make
one compost pit (1 cubic meter) and transport it to the field. The cost of this labor (at the
agricultural wage rate of MZN40/day) is MZN120. Making two compost pits plus renting one
oxcart can be valued at MZN340 and this amount can be used on the same area where NGOs
would recommend applying 6kg of fertilizer (MZN120). Therefore the monetized price of
compost is greater than the cost of fertilizer.
This means that it is not profitable to make compost at a large scale since time would be
better spent earning agricultural wages and buying fertilizer. However, the opportunity cost of
labor is negligible for small batches of compost for many households with surplus labor (see
discussion below in the profitability sections 3.3 and 3.3.1). Theoretically, having the materials
close by, owning an oxcart, applying it at a nearby field and having extra family labor would all

48
make composting more profitable. This monetary comparison with fertilizer ignores the benefits
unique to compost (drought resistance and long-term soil improvement).
Poor land quality constrains the effectiveness of minimum tillage and compost is a labor-
intensive way of addressing this issue. With the current range of prices for labor and fertilizer,
profitable compost production is limited to small batches where the opportunity cost of labor is
minimal.
3.1.2. Fertilizer use
The lack of fertilizer experienced by most smallholder farmers in sub-Saharan Africa is
indicative of a cash constraint on agricultural productivity (Morris et al., 2007). Most CA
farmers that I interviewed are adamant that they need fertilizer for CA to perform better than
ridges. One logical supposition is that CA adoption is constrained by access to fertilizer, but is
that the key constraint?
There are two ways to explore whether fertilizer is the key constraint preventing farmers
from adopting CA in the Angonia highlands. The first is by looking at what happens to CA
adherence when the NGO stops subsidizing fertilizer. The second is to see if CA farmers who
use their own fertilizer on maize make ridges or use CA. If it is true that CA is desirable but
fertilizer is the key constraint, then farmers will dis-adopt when the inputs stop coming in (unless
they can buy their own fertilizer). In addition, if farmers think CA is the best system for fertilized
maize then they will not put fertilizer on ridged maize.
The first test was observed in this community since IRM’s project had limited funding
and decided to provide inputs only for demonstration plots. At least three farmers in Bwaila dis-
adopted CA with IRM once the fertilizer did not appear last season. Two others explained in
their interviews that they reduced the area to match what fertilizer they could afford on their own

49
(see the last column of Table 3). In fact, the only other dis-adopters I found out about were two
TLC participants who no longer received inputs (one because of her inability to repay some grain
to the NGO and the other because she stopped attending TLC meetings and work days). These
cases show that the decision for some farmers of how much area to plant using CA practices was
highly influenced by NGO input provision.
The interviews with IRM participants indicate that fertilizer provision motivated CA use
but the data does not suggest that fertilizer was the single most important constraint. All three
dis-adopters of IRM CA purchased fertilizer for other uses. The two who reduced area because
of lack of fertilizer used fertilizer on their cash crops. In addition, there is some evidence that
input provision also affected how farmers managed their CA plots. Two IRM participants said
that the lack of fertilizer from the NGO induced them not to mulch their CA plot because they
were less motivated to ensure good production. Interestingly neither of them used fertilizer on
their CA maize, though both purchased fertilizer for their potatoes suggesting that access to
fertilizer was not the key constraint. To summarize, fertilizer motivates CA use by IRM
participants but its presence does not guarantee continued adoption. IRM’s system of CA must
have other challenges that make it to not be the priority for fertilizer use.
Fertilizer use in general is low with the highest levels being a few hundred kg per farmer
(based on the interviews with CA participants). Most participants (13 out of 18) buy fertilizer for
potatoes or tobacco (Table 3) and usually in larger quantities than for maize. Five of the 13
farmers growing cash crops used all of their own fertilizer on cash crops (though three of these
received some from TLC for CA maize). It is interesting to note that farmers 1, 3, and 4 in Table
3 had outside income from either small business or earning wages but no other farmers except 13
indicated significant non-farm income. On the other extreme farmers 16, 17, 18 and 19 are

50
female-headed households who either currently or until recently sell their labor in agriculture.
High levels of fertilizer use therefore seem to be partly correlated with non-agricultural income.
Fertilized maize on ridges is usually grown as a monocrop at a higher plant population
than the traditional intercrop. Farmers often refer to this approach of monocropped maize with
ridges as the Sasakawa method. Only two out of 10 non-adopters applied any fertilizer on maize.
On the other hand nine out of 18 CA farmers purchased fertilizer to use on maize and five of
these nine used it on non-CA maize as well (Table 3). Non-adopters expressed interest in CA but
many said they had never been trained how to do it. Most also pointed out that farmers received
fertilizer to use CA and that they were very interested in that and felt left out by the NGO.

51
Table 3: Fertilizer use by conservation agriculture (CA) farmers and dis-adopters in
Bwaila
Crop
type:
CA
maize
CA
maize
CA
maize
Conventional
Maize
Potatoes
or Tobacco
Fertilizer
source: Purchase NGO Gov.
subsidy4
Purchase or
Gov. subsidy
Purchase
or loan
NGO: IRM2
TLC3 - - -
Change in
IRM CA: Category1 Farmer #
1
1 - X X X X Disadopted
2 X X - X X Same area
3 - X - X X n.a.
4 - X - X X n.a.
2
5 X - - - X Same area
6 X - - - X Reduced
area 7 X - - - X Reduced
area 8 X - - - X Same area
9 Compost X - - X Same area
10 - X - - X Disadopted
11 - X - - X n.a.
12 - X - - X n.a.
3 13 - X - X - n.a.
4 14 - - - - X Disadopted
15 Compost - - - X Same area
5 16 - X - - - n.a.
17 - X - - - n.a.
6 18 Compost - - - - Same area
19 Compost - - - - Same area
Source: author’s survey, 2010. 1Category of fertilizer use:
Category 1: Fertilizer used on CA maize, other maize, and cash crop
Category 2: Fertilizer used on CA maize and cash crop only
Category 3: Fertilizer used on CA maize and other maize only
Category 4: Fertilizer used on cash crop only
Category 5: Fertilizer used on CA maize only and all of it provided by the NGO
Category 6: No fertilizer used on any crop 2For Igreja Reformada em Moçambique (IRM), X indicates fertilizer purchased by farmers.
“Compost” means the use of compost only. All other participants did not have any plots using
IRM’s method of CA. 3All Total Land Care (TLC) CA participants received fertilizer from the NGO.
4The Mozambican government subsidized fertilizer for the 2009/10 season. One participant used
it on his own CA plot, mimicking what he does with TLC but without herbicide. Another used it
on ridged maize.
52
By analyzing how farmers use their own fertilizer, the second means of exploring
whether fertilizer is the key constraint can be done. One IRM and TLC dual participant (number
2 in Table 3) used his own fertilizer on non-CA maize as well as CA maize, showing that CA
was at best tied as his first choice for fertilized maize production. Though he liked CA enough
not to dis-adopt, he used more fertilizer on a larger Sasakawa plot.
Of the five TLC participants who bought their own fertilizer and used it on maize, only
one of them used the CA system for land preparation on the plots where they applied their own
fertilizer. Three of the five used the Sasakawa method and two used fertilizer to top-dress ridged
intercropped maize on those plots. Two of these five participants who used their own fertilizer on
non-CA maize were using CA for the first time this season, so they might not be expected to
adopt CA immediately for all fertilized maize.
In conclusion, it appears that CA adoption is not simply limited by a cash constraint for
fertilizer. Even if the fertilizer constraint is overcome it is not certain that CA would expand.
The fact that many farmers were able to purchase fertilizer for potatoes suggests that the key
constraint is not access to fertilizer but rather the profitability of applying fertilizer to maize
fields. I return to a discussion of profitability in section 3.3 below after discussing other
constraints.
3.1.3. Rotation with legumes and permanent mulch cover
In addition to analyzing the capital and labor constraints affecting soil fertility
supplements, it is necessary to consider how farmers perceive basic agronomic practices.
Understanding farmers’ perceptions about crop rotation and residue management provides a
more complete picture of the challenges related to soil fertility management. During the in-depth

53
interviews I asked the farmers about each of their fields and what crops they previously grew on
each field in order to get a history of any rotations that were practiced.
The farmers I interviewed explained that year after year most of their fields were planted
to conventional maize on ridges intercropped with a diverse set of legumes. As I visited their
fields and measured them with a GPS I was able to observe the ridges and the residues of the
maize and intercrops. The primary goal of intercropping seems to be food production since most
farmers did not state any soil fertility benefit from the practice. When asked about planting pure
stands of legumes, the farmers in Bwaila explained that they are not accustomed to that in this
area but in other areas with more land they do that. The CA participants that I interviewed
explained that they prefer not to produce legume monocultures because it is either too risky
(unreliable bean varieties and fluctuating soy prices) or because it is “too much work” (implying
too little profit). As they explained the history of crops grown on their fields I came to
understand that a few years ago many of the farmers in Bwaila planted pure stands of soya. They
told me that they were promised high prices and this induced them to try it as a new crop.
Though a few continue to grow soya as a monoculture many explained that they now intercrop it
with maize or do not plant it all. The farmers explained that this change was caused by their
disappointment in the low prices for soya. This evidence suggests that these farmers are aware of
the markets for legumes and respond to higher prices with increased production.
In contrast, based on the interview data the cash crops potatoes and tobacco are grown as
monocultures and then rotated with maize. The farmers explained that they were very aware of
the risk of losing a crop of potatoes or tobacco to diseases and this motivated them to practice
rotation with those crops. It seems logical then that if there was a benefit to the farmer of
rotating maize with a legume, they would practice it, even if the benefit did not come until the

54
following year. According to the interview data the low and unreliable prices for legumes and
the lack of improved varieties are what keep farmers from deciding to rotate their maize with
legumes.
During my interviews with the professionals from both NGOs I inquired about rotation
since it is one of the three key principles of CA. While they acknowledge the benefits of
rotations they promote CA as a maize monoculture year after year. They explained that the
farmers refuse to plant pure stands of legumes because they prefer intercropping. Staff from both
NGOs recognized the possibility of intercropping with CA during the interviews but neither
actively promotes CA intercrops. In addition, TLC’s choice of Bullet (Alachlor and Atrazine) as
a non-selective pre-emergent herbicide prevents intercropping with a legume. For these reasons
none of the CA farmers in Bwaila are benefiting from the potential agro-ecological benefits of
incorporating legumes with their maize production.
The CA farmers I interviewed see mulch as a beneficial means of controlling weeds and
conserving soil moisture. During the group interviews farmers from both organizations
explained that they are unable to maintain mulch on their fields through the dry season primarily
because of free-range livestock and people gathering residues for fuel but also because of
termites. In other communities, TLC participants mentioned that they would gather their maize
residues from their CA plot and store them at home through the dry season. CA farmers
explained that they add mulch by gathering residues from neighboring plots and by carrying old
thatching from the village to their CA plot. Though farmers recognized that CA is more
drought-tolerant because of the mulch, this did not seem to be a key motivation for adoption, in
contrast to what is described for the Southern Province of Zambia (Haggblade &Tembo, 2003,
Baudron et al., 2007).

55
To summarize, CA as practiced is not benefiting from the agro-ecological principles of
rotations or intercrops because of poor legume varieties and unreliable markets. CA is also
missing the advantages that come from permanent soil cover because of livestock and fuel
pressure, both of which are challenging in many areas throughout southern Africa. These missing
components of CA exacerbate the need for fertility supplements.
3.2. Labor changes with CA
In the interviews with CA professionals, staff from both IRM and TLC were quick to
point out that CA saves labor because farmers do not need to make ridges. However, minimum
tillage makes weed control more challenging and for this reason CA is often promoted with
herbicide use (Baudron et al. 2007). This section explores how CA farmers perceive labor
requirements for CA with emphasis on land preparation and weed control.
3.2.1. Land preparation and planting
By reducing the amount of tillage CA moves less soil which should reduce the amount of
heavy labor needed for land preparation. However, if farmers are applying compost they will still
need to use some heavy labor for digging basins. TLC’s system of direct seeding avoids the
labor of basin making but offers no opportunity for fertilizing with manure or compost.
IRM participants explained that CA was impossible on a large scale because of the
tedious work of measuring and digging basins. Though ridges are laborious to make, the farmers
claim that they facilitate fast planting of a large field because they have perfected a system where
they “just plant (a seed) and step on it, plant and step on it.” During the field visits and
interviews I observed that few farmers could not remember the measurements for setting up the
basins, which suggests that the complexity of establishing a precise grid may considerably slow
them down.
56
On average it took IRM farmers 349 hours/ha to dig basins (Table 4) which is higher than
estimates from Zambia (between 138 and 330 hours/ha) (Aagard, 2009, Baudron et al. 2007,
Nkatiko, 2011). In addition, during the first year IRM recommended that farmers level their old
ridges requiring even more labor. No IRM participants leveled fields in the last season because
all of them had been using CA for at least 2 seasons so this task is not reflected in the labor data.
Many of the TLC farmers state that CA is easier work but the data does not indicate a
general reduction in hours per hectare. Instead their comment could imply greater returns for
their effort or less time on the demanding tasks of ridging and banking, both of which are
supported by the data in Table 4. The labor requirement for land preparation and planting with
TLC’s direct planting method is slightly lower than the conventional tillage data gathered in
Bwaila and dramatically lower than Takane’s (2008) conventional tillage estimate in Malawi
(Table 4). Planting time is generally the most critical labor bottleneck but further analysis would
be needed to understand the seasonality of the CA labor changes in the Angonia context.
3.2.2. Weed Control
Not moving the soil results in increased weed pressure thereby requiring either more
labor or more herbicides. IRM farmers complained about the weeding labor required by CA
without an effective herbicide. On average IRM weeding requires more labor than conventional
according to the labor data gathered in the interviews, though it varied from 1400 hours/ha to
200 hours/ha. Conventionally farmers weed twice in the season, the second is done through
banking. Though requiring heavy physical exertion, banking a ridge is a task that does not need
to be repeated in a given season, while weeding a CA plot requires 2 to 4 total weedings.
Farmers mentioned several cases when illness in their family prevented them from weeding.
Banking therefore has less risk than many weedings with CA.

57
Table 4: Maize yield and labor requirements1 by task for conservation agriculture (CA)
and conventional systems
TLC –CA IRM-CA Conventional
(Malawi)
Conventional
Intercrop
Number of plots 9 6 186 2
Yield (ton/ha) 1.66 (.67)2
1.45 (1.01)2
0.90 (.47)3
0.7 (.93, .46)2
Plot size (ha) 0.18 0.08 (.03) - 0.72 (0.72, 0.71)
Land preparation and
planting (hours/ha) 295(110) 527 (328) 704
4 341 (269,414)
Weeding (hours/ha) 292 (131) 587 (431) 520 440 (438, 443)
Fertilizing (hours/ha) 225 (131) 200 (137) 56 0
Mulching (hours/ha) 248 (200) 286 (204) 03
122 (0, 246)
Harvesting (hours/ha) 226 (119) 157 (92) 136 77 (56, 99)
Total (hours/ha) 1534 (781) 1756 (793) 1416 (256)3
980 (762, 1202)
Power tasks (hours/ha)5 0 200 (162) 712 404 (270, 308)
Labor per ton (hours/ton) 1128 (1022) 3048 (1572) 1564 1395 (813, 2586)
Sources: TLC and IRM conservation agriculture data are from author’s fieldwork, 2010.
Conventional agriculture data for Malawi ridged maize are from Takane (2008). 1Weighted averages based on plot size to correct for error in small plot sizes
2Parentheses indicate standard deviations for the two forms of conservation agriculture. For the
conventional intercrop, n=2 so both data points are given in parentheses. 3Takane’s study presents the average labor needed for maize in man days (converted to hours by
multiplying by 8) from 6 villages broken down by task without any information about the
variability in the data. The yields and total labor by village are also presented without any
variability information but I estimated the variability in the yield and total labor needed for
maize by calculating the standard deviation of the village averages. 4Note that Takane’s study did not separate clearing residues from ridgemaking so the land
preparation figure includes clearing residues, which would fit under mulch in this table. 5Ridgemaking, banking and digging basins were regarded as tasks requiring greater physical
exertion.
Based on CA experience in Zambia herbicides can provide 70% saving on weeding labor
(Aagard, 2009). Both the comments from the participants and the figures in Table 4 show that
herbicide with TLC failed to reduce time spent weeding to that extent (292 hours/ha by TLC is a
43% reduction from 520 hours/ha). Farmers said that the herbicide failed to work well this
season because of heavy rains shortly after application.

58
Aagard asserts that weeding is costly ($100-$120/ha) compared to herbicides ($60-
$70/ha). In Bwaila, CA farmers who did not use herbicides spent between 320 and 800 hours/ha
weeding (Table 4) which would cost between $45 and $114/ha in paid labor. TLC uses 1 liter of
herbicide (which costs MZN 450 or $12.86) for 0.1 ha which comes to $129/ha. In order to cost
the same as paying agricultural laborers for 450 hours of weeding the herbicide price would need
to be reduced to half its price (or even lower if we assume that many households’ opportunity
cost of labor is less than the agricultural wage). TLC provides the herbicide in exchange for 26kg
of grain which has a value of $5.93 if it were to be sold at the time it was collected. Though
herbicide use may not be profitable it does require less physical effort than banking. It is
interesting to note that the cost of herbicide in neighboring Zimbabwe is only about $6 per liter
(Thierfelder, personal communication, February 9, 2011) which, if achievable in Mozambique,
would increase the profitability of herbicide use.
During the visits to CA plots I observed high variation in weed levels after harvest but
this may be related more to cattle pressure than weeding effort. In the interviews TLC
professionals said that they hope weed seed stocks will decrease after a few years of herbicide
use. However, this does not seem plausible based on the abundance of weeds going to seed after
the crop was mature and the small plot size surrounded by weed filled conventional fields. Many
CA promoters urge farmers to carry out late season weeding to reduce the weed seed levels but
this is rarely done (Baudron et al., 2007). Other complications with herbicide use include the
lack of any safety equipment and the lack of locally available herbicide (TLC buys it in Malawi).
3.2.3. Mulching
In conventional agriculture farmers do not mulch so time spent mulching is an additional
task for CA compared to conventional tillage. The clearing of crop residue (one of the tasks
59
included in the mulch total) is also done with ridging but would normally be included under land
preparation. The amount of mulch put on the field this season varied from zero to full coverage
according to interviews with the farmers and my own observations. Through the interviews
several farmers explained that they noted a difference in weed growth caused by different levels
of mulch cover. The inability to maintain mulch throughout the dry season and the general
shortage of mulch probably led to increased labor in weeding.
3.2.4. Summary
IRM farmers using basins say that labor is a constraint limiting their use of CA to a small
plot. In order to prepare their fields quickly they say they need to make ridges. IRM participants
found CA to be more work in weeding and in measuring and digging basins.
TLC farmers using direct seeding and herbicides said CA was less work than ridging.
The labor data gathered does not provide enough evidence to suggest a significant reduction in
the number of hours per hectare. However, time spent on physically demanding tasks (ridge-
making and banking) was eliminated with TLC’s form of CA. Based on this the farmers’
statements that CA is “less work” can be interpreted as the need for less exertion with CA or that
CA work that has greater returns.
3.3. Profitability of using inputs with CA
Smallholder participation in staple grain markets in southern and eastern Africa is low
(Barrett, 2008). Most smallholders in the region are net buyers of grain and in Mozambique data
show that only 30% of maize producers are net sellers (Boughton et al., 2007). Most grain is
produced for household consumption or sold at harvest not because of an annual grain surplus
but because of the need for immediate cash (Barrett, 2008). Because of this smallholders face
severe constraints on the cash that they invest in grain production and need to choose wisely

60
what inputs they purchase and how they use them. This qualitative research allows for a limited
analysis of the profitability of CA because of the small sample size but it will allow for some
indicative findings requiring more detailed research before they can be made conclusive.
The profitability of CA can be assessed in various ways: with or without valuing labor,
with different output prices, using the actual cost charged to the farmer by the NGO for the
inputs or the market value paid by the NGO. For further details of how labor, inputs and outputs
were valued, see Appendix C. In this section I first examine the profitability of TLC’s method of
CA and then analyze IRM’s method of CA. Because I used purposive sampling the data cannot
be analyzed statistically to infer similarities with the larger population of CA participants. For
this reason I present the proportion of CA participants interviewed who had positive net profit
under different conditions for valuing labor, inputs and maize. The average profitability figures
for TLC are presented in Appendix C.
The results show that for the TLC participants interviewed the application of inputs is
profitable primarily when the inputs are subsidized and when the value of labor is not considered
(Table 5). When the full value of labor is included, the system is only profitable when the price
of maize is high and inputs are subsidized for the 0.4 tons/ha fertilizer regime (three plots). When
the market value of the inputs is used, farmers may break even if they sell maize at the high
price, but they lose money if they sell at the low harvest price. This suggests that few farmers
would be able to afford the inputs or would choose to apply them on maize given the possibility
of making greater profits on potatoes.
Many TLC participants explained in the interviews that they experienced crop losses due
to the cobs rotting caused by heavy rains after the crop was mature, which impacts these
profitability calculations. The signs for net profitability using an ideal harvest of 2.7 tons per
61
hectare (based on the best CA yields reported by farmers) are presented in Table 6 which has the
same trends as Table 5. For the ideal harvest with high maize prices the TLC system is profitable
except when the full labor value and market value of inputs are used in the calculation for the 0.5
tons/ha fertilizer regime. With low maize prices it is only profitable if subsidized and even then
it is not profitable when the full labor value is used on the 0.5 tons/ha fertilizer regime.
The same profitability calculations were carried out on the data from IRM and the
proportion of farmers with positive net profit are reported in Table 7. The results indicate that the
profitability of IRM’s CA system suffers from high labor requirements. IRM participants paid
the full market value for low levels of fertilizer. When the value of labor is not included then
IRM’s CA is profitable with the high maize price but is near the breakeven point with the low
maize price. When the opportunity cost of labor is included at the market wage rate
(40MZN/day) IRM’s CA was not profitable (last row of Table 7). This suggests that labor is the
key constraint for making the basin system of CA profitable at a large scale. The same
relationship held for data from four IRM participants in other communities (three in Mulingo and
one in Kawale) though farmers in those communities experienced higher yields and therefore
slightly greater profitability (see Table 14 in Appendix C).
IRM CA with higher fertilizer use may be profitable based on yields described for the
previous year though respondents likely exaggerated them in order to convince me that IRM
should keep giving out fertilizer. Still it does make sense that medium range fertilizer
application rates (around 0.25 tons/ha) complemented by compost could profitably increase
maize yields.

62
Table 5: Proportion of Total Land Care (TLC) participants with positive net profit for
conservation agriculture for two input application rates under different conditions for
valuing labor, maize and inputs.1
TLC one plot2
TLC three plots3
Inputs
subsidized4
Inputs at mkt.
value5
Inputs
subsidized
Inputs at mkt.
value
Low
Maize
Price6
(4/kg)
High
Maize
Price7
(8/kg)
Low
Maize
Price
(4/kg)
High
Maize
Price
(8/kg)
Low
Maize
Price
(4/kg)
High
Maize
Price
(8/kg)
Low
Maize
Price
(4/kg)
High
Maize
Price
(8/kg)
Labor free8 4/4 4/4 0/4 1/4 5/5 5/5 0/5 3/5
Labor at
20/day9 1/4 ¾ 0/4 1/4 3/5 5/5 0/5 3/5
Labor at
40/day10 0/4 2/4 0/4 1/4 1/5 4/5 0/5 2/5
Source: author’s fieldwork, 2010 1All prices in Mozambican Meticais (35 MZN = 1 USD)
20.5 tons/ha fertilizer application rate; average field size = 0.1ha; average yield = 1.05 tons/ha;
n=4
30.4 tons/ha fertilizer application rate; average field size = 0.25 ha; average yield = 1.85 tons/ha;
n=5
4 TLC inputs were provided in return for grain after harvest (75kg for the 0.1 ha plots and 150kg
for the 0.25 ha plots). The calculation was done by counting the low maize price value of this
grain as a cash input. The inputs were provided following the TLC guidelines in Table 1. 5 The market value of the actual inputs used was calculated using prices from TLC
6 The low maize price is the farm-gate price at harvest time.
7 The high maize price is the high nominal retail value in Tete for a 5 year average (USAID
FEWS Net, 2010). 8 No household labor costs were included. Paid labor costs are included. This row is a cash
analysis of cash costs compared to the value of the grain produced 9 Includes the cost of labor valued at MZN 20 per 8 hour day for all household labor adjusted by
gender and age 10
Includes the cost of labor valued at MZN 40 per 8 hour day for all household labor adjusted
by gender and age
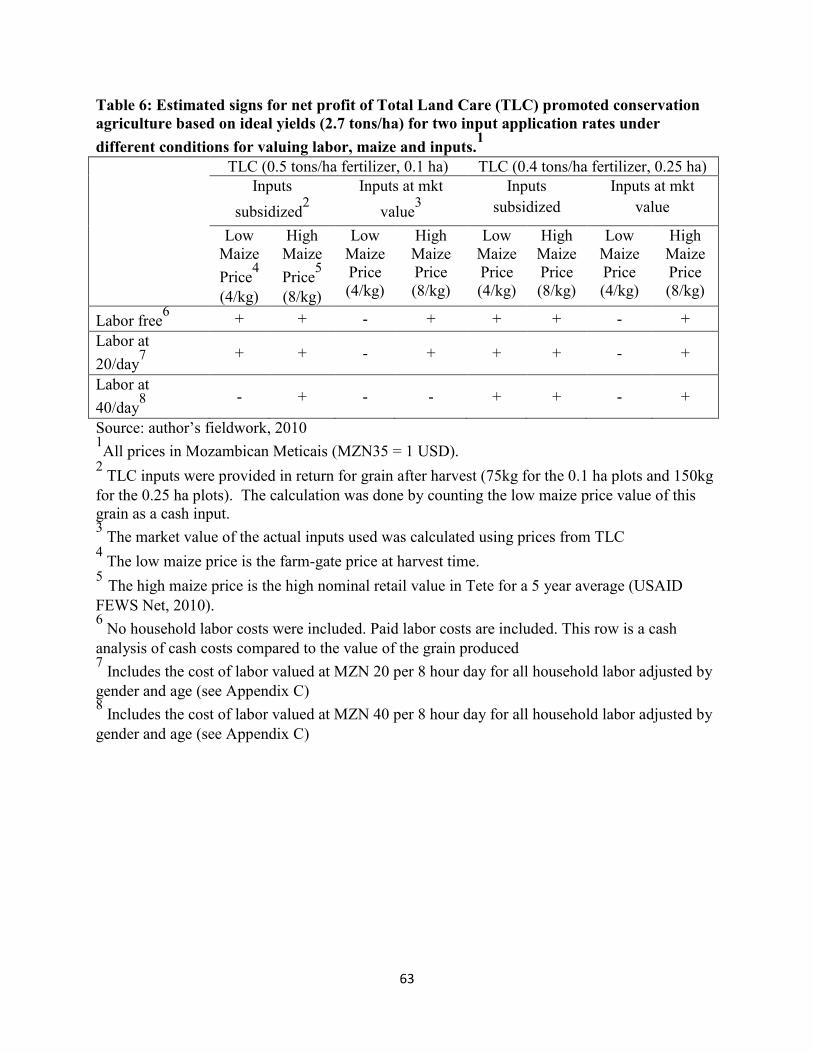
63
Table 6: Estimated signs for net profit of Total Land Care (TLC) promoted conservation
agriculture based on ideal yields (2.7 tons/ha) for two input application rates under
different conditions for valuing labor, maize and inputs.1
TLC (0.5 tons/ha fertilizer, 0.1 ha) TLC (0.4 tons/ha fertilizer, 0.25 ha)
Inputs
subsidized2
Inputs at mkt
value3
Inputs
subsidized
Inputs at mkt
value
Low
Maize
Price4
(4/kg)
High
Maize
Price5
(8/kg)
Low
Maize
Price
(4/kg)
High
Maize
Price
(8/kg)
Low
Maize
Price
(4/kg)
High
Maize
Price
(8/kg)
Low
Maize
Price
(4/kg)
High
Maize
Price
(8/kg)
Labor free6 + + - + + + - +
Labor at
20/day7 + + - + + + - +
Labor at
40/day8 - + - - + + - +
Source: author’s fieldwork, 2010 1All prices in Mozambican Meticais (MZN35 = 1 USD).
2 TLC inputs were provided in return for grain after harvest (75kg for the 0.1 ha plots and 150kg
for the 0.25 ha plots). The calculation was done by counting the low maize price value of this
grain as a cash input. 3 The market value of the actual inputs used was calculated using prices from TLC
4 The low maize price is the farm-gate price at harvest time.
5 The high maize price is the high nominal retail value in Tete for a 5 year average (USAID
FEWS Net, 2010). 6 No household labor costs were included. Paid labor costs are included. This row is a cash
analysis of cash costs compared to the value of the grain produced 7 Includes the cost of labor valued at MZN 20 per 8 hour day for all household labor adjusted by
gender and age (see Appendix C) 8 Includes the cost of labor valued at MZN 40 per 8 hour day for all household labor adjusted by
gender and age (see Appendix C)

64
Table 7: Profitability of conservation agriculture use by Igreja Reformada em
Moçambique participants under different conditions for valuing labor and maize.1, 2
Low Maize Price (4/kg)3 High Maize Price (8/kg)
4
Proportion with
positive net profit
Mean Median Proportion with
positive net profit
Mean Median
Labor free5 5/6 108 210 5/6 482 420
Labor at 20/day6 1/6 -519 -305 2/6 -146 119
Labor at 40/day7 0/6 -1146 -801 1/6 -773 -559
Source: author’s fieldwork, 2010 1All prices in Mozambican Meticais (MZN 35 = 1 USD).
2Actual input purchase prices used, no herbicides were used, hybrid seed was not purchased;
average yield = 1.45 tons/ha; average plot size = 0.08 ha; average fertilizer use was 0.085
tons/ha; average compost use was 1.5 oxcarts per plot; (n=6). 3The low maize price is the farm-gate price at harvest time.
4The high maize price is the high nominal retail value in Tete for a 5 year average (USAID
FEWS Net, 2010). 5No household labor costs were included. This row is a cash analysis of cash costs compared to
the value of the grain produced 6Includes the cost of labor valued at MZN 20 per 8 hour day for all household labor adjusted by
gender and age (see Appendix C) 7Includes the cost of labor valued at MZN 40 per 8 hour day for all household labor adjusted by
gender and age (see Appendix C)
3.3.1. Profitability by area
Figures 1 and 3 present the estimated total costs and benefits for TLC farmers and IRM
farmers respectively for different field sizes by making the following assumptions about the
opportunity cost of labor: I assume that labor requirement has a linear relationship with the field
size and that the opportunity cost of labor for 0.5 ha or above is the market wage rate but the
marginal wage decreases linearly to half the market wage rate at 0.25 ha and on to a very low
value at 0.01ha. In reality, the exact relationship would be household and season-specific based
on the opportunities each household has for using its labor productively at different times of the
year.
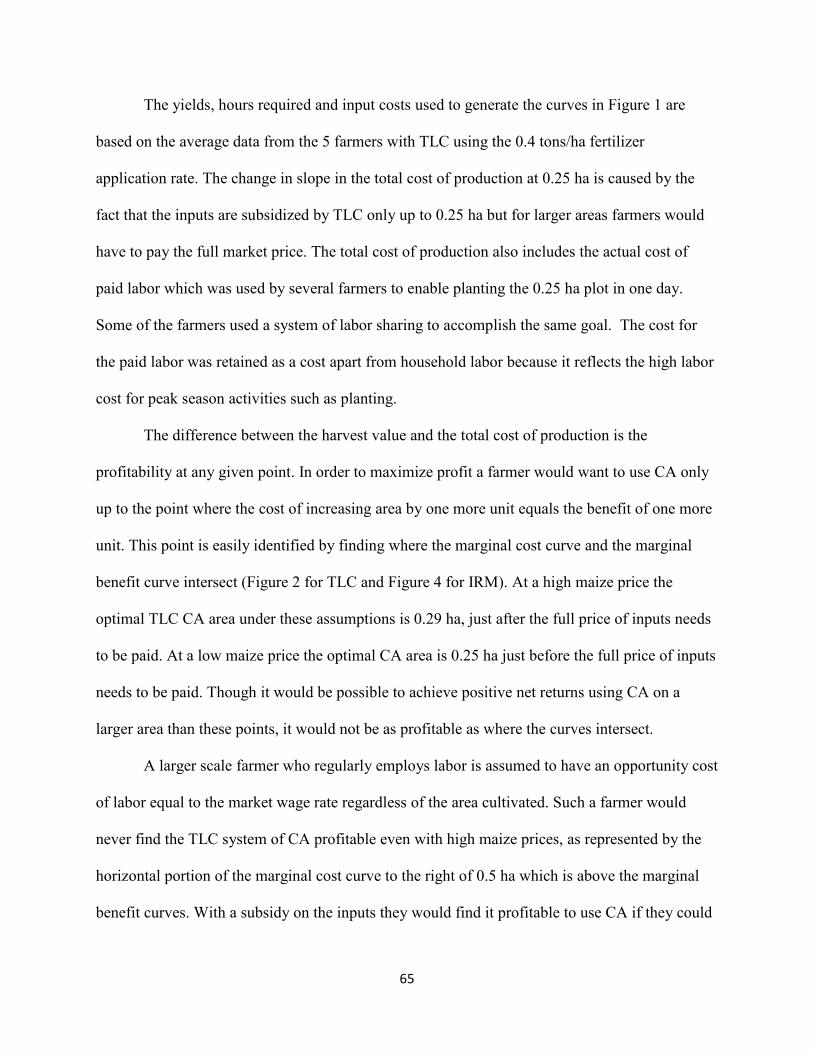
65
The yields, hours required and input costs used to generate the curves in Figure 1 are
based on the average data from the 5 farmers with TLC using the 0.4 tons/ha fertilizer
application rate. The change in slope in the total cost of production at 0.25 ha is caused by the
fact that the inputs are subsidized by TLC only up to 0.25 ha but for larger areas farmers would
have to pay the full market price. The total cost of production also includes the actual cost of
paid labor which was used by several farmers to enable planting the 0.25 ha plot in one day.
Some of the farmers used a system of labor sharing to accomplish the same goal. The cost for
the paid labor was retained as a cost apart from household labor because it reflects the high labor
cost for peak season activities such as planting.
The difference between the harvest value and the total cost of production is the
profitability at any given point. In order to maximize profit a farmer would want to use CA only
up to the point where the cost of increasing area by one more unit equals the benefit of one more
unit. This point is easily identified by finding where the marginal cost curve and the marginal
benefit curve intersect (Figure 2 for TLC and Figure 4 for IRM). At a high maize price the
optimal TLC CA area under these assumptions is 0.29 ha, just after the full price of inputs needs
to be paid. At a low maize price the optimal CA area is 0.25 ha just before the full price of inputs
needs to be paid. Though it would be possible to achieve positive net returns using CA on a
larger area than these points, it would not be as profitable as where the curves intersect.
A larger scale farmer who regularly employs labor is assumed to have an opportunity cost
of labor equal to the market wage rate regardless of the area cultivated. Such a farmer would
never find the TLC system of CA profitable even with high maize prices, as represented by the
horizontal portion of the marginal cost curve to the right of 0.5 ha which is above the marginal
benefit curves. With a subsidy on the inputs they would find it profitable to use CA if they could
66
get the higher maize price for their output (see figure 6 in Appendix C for the marginal cost
curve of a farmer whose opportunity cost of labor equals the market wage rate).
For the IRM data the average total cost of production is higher and the average yield is
lower thereby reducing the marginal benefit and causing a reduction in the area where CA is
profitable (Figure 3). The level of inputs used is lower than with TLC and the relative amount of
labor is higher which causes the labor cost curve to be closer to the total cost curve than for TLC.
The optimal IRM CA area for maximizing profitability under these assumptions (where the
marginal costs equal the marginal benefits) is at .04 ha for a low maize price and .19 ha for a
high maize price (Figure 4).
These figures for both IRM and TLC are illustrative of the relationships indicated by the
qualitative results. The results are based on a very small sample size and need to be tested with a
much larger sample size to establish the finer details of the relationships. Nevertheless, the
figures help to demonstrate how the profitability of CA depends on the opportunity cost of labor,
which varies significantly from one farmer to the next.

67
Figure 1: Total cost of production1,2
and total benefits under two output price scenarios3
for Total Land Care (TLC) plots with 0.4 tons/ha fertilizer application rate.4
Source: author’s fieldwork 2010 1The total cost of production is estimated by adding the cost of purchased inputs, the cost of paid
labor and the opportunity cost of household labor. 2For this figure the opportunity cost of household labor was valued at the agricultural wage rate
(40 MZN/day) for all areas beyond 0.5 ha. The opportunity cost of labor was calculated by using
a marginal wage rate which was assumed to decrease linearly passing through a point where half
the agricultural wage rate (20 MZN/day) is the value at 0.25 ha. 3“Harvest value high” has a maize price of 8 MZN/kg and “Harvest value low” has maize price
of 4 MZN/kg. 4For interpretation of the references to color in this and all other figures, the reader is referred to
the electronic version of this thesis.
0
2000
4000
6000
8000
10000
12000
14000
16000
0 0.2 0.4 0.6 0.8 1
Met
icai
s
Hectares
Harvest value high
Harvest value low
Total costs
Total cost of labor

68
Figure 2: Marginal cost of production1,2,3
and marginal benefits under two output price
scenarios4 for Total Land Care (TLC) plots with 0.4 tons/ha fertilizer application rate.
Source: author’s fieldwork, 2010 1Marginal costs and benefits were calculated for increments of 0.01 ha.
2The marginal cost of production is estimated by adding the marginal cost of purchased inputs,
the marginal cost of paid labor and the marginal opportunity cost of household labor. 3For this figure the marginal opportunity cost of household labor was valued at the agricultural
wage rate (40 MZN/day) for all areas beyond 0.5 ha. The marginal opportunity cost of labor was
assumed to decrease linearly passing through a point where half the agricultural wage rate (20
MZN/day) is the value at 0.25 ha. 4“Harvest value high” has a maize price of 8 MZN/kg and “Harvest value low” has maize price
of 4 MZN/kg.
0
20
40
60
80
100
120
140
160
180
200
0 0.2 0.4 0.6 0.8 1
Met
icai
s
Hectares
Marginal benefit (high)
Marginal benefit (low)
Total marginal cost
Marginal cost of labor

69
Figure 3: Total cost of production1,2
and total benefits under two output price scenarios3
for Igreja Reformada em Moçambique (IRM) plots with 0.085 tons/ha fertilizer application
rate
Source: author’s fieldwork 2010 1The total cost of production is estimated by adding the cost of purchased inputs, the cost of paid
labor and the opportunity cost of household labor. 2For this figure the opportunity cost of household labor was valued at the agricultural wage rate
(40 MZN/day) for all areas beyond 0.5 ha. The opportunity cost of labor was calculated by using
a marginal wage rate which was assumed to decrease linearly passing through a point where half
the agricultural wage rate (20 MZN/day) is the value at 0.25 ha. 3“Harvest value high” has a maize price of 8 MZN/kg and “Harvest value low” has maize price
of 4 MZN/kg.
0
500
1000
1500
2000
2500
3000
3500
0 0.1 0.2 0.3 0.4
Met
icai
s
Hectares
Harvest value high
Harvest value low
Total costs
Total labor costs

70
Figure 4: Marginal cost of production1,2,3
and marginal benefits under two output price
scenarios4 for Igreja Reformada em Moçambique (IRM) plots with 0.085 tons/ha fertilizer
application rate
Source: author’s fieldwork 2010 1Marginal costs and benefits were calculated for increments of 0.01 ha.
2The marginal cost of production is estimated by adding the marginal cost of purchased inputs,
the marginal cost of paid labor and the marginal opportunity cost of household labor. 3For this figure the marginal opportunity cost of household labor was valued at the agricultural
wage rate (40 MZN/day) for all areas beyond 0.5 ha. The marginal opportunity cost of labor was
assumed to decrease linearly passing through a point where half the agricultural wage rate (20
MZN/day) is the value at 0.25 ha. 4“Harvest value high” has a maize price of 8 MZN/kg and “Harvest value low” has maize price
of 4 MZN/kg.
0
20
40
60
80
100
120
140
0 0.1 0.2 0.3 0.4
Met
icai
s
Hectares
Marginal Benefit (high)
Marginal Benefit (low)
Total marginal cost
Marginal cost of labor

71
3.3.2. Summary
The high ratio of input cost to output price means that if TLC farmers had to pay the full
market price for inputs they would only cover their costs if they were able to store their maize
until its price rose to MZN 8/kg (the annual high based on a 5-year average (USAID FEWS Net,
2010)). Though farmers under these conditions could cover their costs by using CA they would
not be maximizing their profits. This implies that CA with high inputs is not profitable at a large
scale unless subsidized. At a small scale CA is profitable for households with a low opportunity
cost of labor.
According to the data from the interviews IRM’s system of CA with basins is too labor-
intensive to be profitable when the opportunity cost of labor is at least equivalent to the lowest
agricultural wage. This implies that unless labor requirements can somehow be reduced IRM’s
CA system is only profitable on small plots where the opportunity cost of labor is negligible.
3.4. Missing benefits of CA
It is worth noting here that some of the possible benefits of CA were not mentioned or
hinted at by the farmers in Bwaila. They did not view early planting and reducing a labor
bottleneck at planting time as benefits of the CA system. In this community all farmers prepare
land for conventional agriculture months before the rains start, enabling planting with the first
rains. In addition, there is high dry season labor opportunity cost because of irrigation. There
was no mention of the benefit of breaking through hard pan, nor any description of reduced
water logging. The soil type may be one that is not easily compacted, though I did not test the
compaction of the soil, nor did I observe the fields during the rainy season to check if this is the
case. Farmers in Bwaila also did not mention any benefit from reduced erosion, and many of
them even felt that the lack of ridges may increase erosion, leading them to only use CA on
relatively flat fields.

72
4. Discussion and Conclusion
This qualitative assessment of farmers’ perspectives on CA provides depth and detail
from the farmers’ perspectives which is often lacking in quantitative studies and which can
inform CA research about constraints to adoption. Through the analysis I developed a number of
hypotheses regarding constraints to the adoption of CA for maize by smallholder hand-hoe
farmers. The results are potentially generalizable to similar agro-ecological and socio-economic
conditions. The partial budget analysis is based on a small sample size and is not meant to be
conclusive. Instead the profitability data illustrate the challenges in wide-scale adoption in this
specific context and for this specific form of CA.
Hypothesis 1: In order to attain yields from CA higher than conventional tillage, fertilizer or
compost is required which in turn requires either cash or labor, so adoption is difficult for both
cash- and labor-constrained farmers.
Farmers in Bwaila use tillage as a means of in-field compost making and nutrient release.
CA only performs better than ridges in the short term if fertilizer or compost is added. Compost
is labor intensive and therefore can only be applied to small areas. Fertilizer is expensive and
farmers prefer using it on cash crops which have a higher profit than maize. Some farmers used
their own fertilizer on small plots of maize but not all of them used CA. The current constraints
preventing permanent mulch cover and rotations with a legume exacerbate the need for fertility
supplements with CA.
Implications: If CA requires fertility supplements then mulching, rotations, intercrops and green
manures all need more attention so that chemical fertilizer use can be minimized and its benefit
maximized. NGOs or governments may subsidize fertilizer and this can be used to persuade CA
adoption. Agro-ecological practices can help maximize the cost effectiveness of fertilizer use.

73
Mulching continues to remain a challenge but allowing farmers to choose fields with the least
biomass pressure may help.
The policy of subsidizing inputs has been both highly praised and highly criticized.
These results suggest that input subsidies affect CA utilization in the short term. Despite
increased production and possibly reduced erosion from CA use, more information is needed to
really analyze the net effect of a subsidy.
Hypothesis 2: CA eliminates the work of making ridges but requires more labor for land
preparation (for basin making) as well as more labor or money for weed control.
Labor constraints in basin making and weeding for IRM participants limit the widespread use of
CA. TLC participants save time and effort in land preparation but herbicides are too expensive
to justify their use.
Implications: Those promoting CA with planting basins should train farmers how to dig basins as
quickly and efficiently as possible to reduce the labor needed in land preparation. In addition,
IRM should explore the possibility of not requiring participants to level their ridges so that first
year land preparation labor can be reduced. Those promoting CA with herbicides should
carefully consider the cost of weeding relative to herbicide use.
Hypothesis 3: Under the current price ranges for labor, maize and chemical inputs CA is not
profitable for maize production except on a small scale where the opportunity cost of labor is
lower.
The small scale allows farmers with some surplus labor to implement CA without much
cost while providing them with an “insurance plot” for reliable maize production. As long as
these constraints exist, small CA maize plots will operate side-by-side with larger conventional
maize plots.
74
Implications: Promoters of CA should be more aware of the labor and capital limitations farmers
face in CA adoption and understand that these are likely to vary by household. They should
work with farmers to find the niches where CA costs can be minimized and its benefits
maximized. They should understand that in the Angonia highlands CA and conventional
agriculture are likely to continue to exist side-by-side and understand that promoting sustainable
agriculture in that region means more than promoting CA. Development agencies interested in
sustainable agriculture in Angonia need to work with farmers on their non-CA plots as well to
reduce erosion, increase production and reduce labor requirements.
Figure 5 summarizes these hypotheses about constraints conceptually. Poor land quality
is being addressed through minimum tillage which results in a need for more fertility
amendments and weeding. Weed control requires either herbicides (which is constrained by
capital) or more weeding (which is constrained by labor). Decreased nutrient availability
requires either fertilizer (which is constrained by capital) or compost (which is constrained by
labor and by the scarcity of biomass). If compost is used then basins are needed (which also
requires more labor). Mulch permanence would reduce the amount of weeds and increase the
fertility in the long term but it is not feasible under the current conditions of dry season biomass
demand. Rotations with a legume would reduce the need for fertility amendment but requires
sufficient output market.
It is important to remember that the results of this study are for hand-hoe CA methods for
maize production without rotation in a high rainfall area. Under different conditions most of the
constraints identified would still exist but new benefits or constraints may exist as well. This
study focuses on CA in a high rainfall agro-ecological zone and so its moisture conserving
benefits may not be as noticeable as in drier regions. However, in drier areas it is likely that

75
farmers would face even greater challenges for maintaining an adequate cover of mulch. CA
with animal traction has potential for reducing the labor costs to smallholders but would require
higher initial investment in equipment.
Further research is needed to guide policy makers about CA promotion decisions. First of
all the hypotheses developed in this study can be tested quantitatively in the same context. Now
that I have analyzed the qualitative data I am in a position to embark on a much better survey
research process than if I had attempted the two methods simultaneously. Similar studies could
be carried out in different agro-ecological and socio-economic contexts with a larger, randomly
selected sample in order to discern where CA has the most promise and where it might not be
worth promoting. The results of this study specifically compare two forms of CA for hand-hoe
farmers with the conventional ridge-making system for maize but other crops and other forms of
CA are being used and would require their own analysis.
The positive and negative effects of CA broadly described in Table 1 should be explored
in different agro-ecological zones of southern Africa. For example, areas with shorter seasons
and less rainfall than Angonia may find the drought tolerance of CA more attractive but those
contexts may have other constraints, perhaps even greater demand for biomass from livestock
and for fuel. A more thorough understanding of the conditions where the different costs and
benefits of CA are present would allow NGOs, policy makers and other development agencies to
be more effective in how they promote sustainable agriculture. In addition, a comparative study
of CA in contexts with varying socio-economic conditions could facilitate a discussion about
how changes in factors such as market access or animal traction would affect CA adoption.

76
Figure 5: Conceptual diagram of how labor and capital are constraints to conservation agriculture adoption by small
holder farmers in Mozambique
Poor Land
Quality
Key
productivity
constraint
Technical
solutions
that
address
these side
effects
Manual weeding
Herbicide Mulch Basins with compost
Fertilizer Rotation w/ legumes
Increased weed
pressure
Decreased
nutrient
availability
Negative
side effects
of minimum
tillage
Labor Constraints
to solutions Capital Markets
Minimum
Tillage
Technical
solution for
land quality
constraint
Limited Biomass

77
APPENDICES

78
Appendix A: Data collection instruments
A.1. Interview guide
This guide indicates the key topics for an unstructured interview with farmers at their home or in
their fields. The main questions are listed first in each section with possible follow up questions
listed beneath them.
Introduction
Can you describe for me the different agricultural activities you carried out over the last year?
What did you grow on this plot last year?
When did you start land preparation for this plot? How much time did it take?
When were you able to plant? What inputs did you use? Did you use any animal manure
or compost? How did you apply it?
What activities do you do and what activities are done by your spouse or children? What
activities do you hire laborers to complete?
How were the rains?
How did the crop perform?
(See plot level data collection sheet below)
Minimum tillage
Can you explain to me how you learned about planting in basins instead of ridges?
How long have you been using basins on part of your farm?
How many basins did you have each year since you started?
What technical support have you had in learning how to use basins?
What have you heard about basins from outside organizations supporting your
community’s agriculture?
What motivated you to try this method of land preparation?
How did you decide on which plot to try using basins on?
What was your attitude about CA when you first tried it? Did you think it would
work?
What made it difficult? What parts were easy?
Who approved of you trying CA? Who disapproved?
What prevented you from using basins on more area?
What is your general opinion about the benefits of the basins?
What are your plans for land preparation for the coming year? When will you start?
What method will you use?
Please describe to me how to use basins for agriculture?
How do you go from a ridged field to a field with basins?
Do you need any special tools?
How do you decide where to dig the basins? Do you measure?

79
What do you put in the basins?
How do you weed without turning over the soil?
How does weeding compare with traditional ridge tilling? Who has been most affected by
any changes in weeding?
How do you bank your maize?
Do you have to dig the basins every year? Do you measure every year?
Do you do anything differently depending on the type of soil in the field? Please explain.
Do the basins affect the water in your field? How?
When it rains hard how is a plot with basins different from a plot with ridges?
When there is a dry spell how is a plot with basins different from a plot with ridges?
Can you share examples from the last few seasons about any noted differences between
basins and ridges?
Do you have any concerns about erosion in any of your fields?
What do you do if you are concerned about erosion?
Crop Rotation
How do you decide where you will plant your maize?
What is your experience growing maize in a field that previously had legumes?
What would make it easier to grow more legumes?
Mulching
What do you do with what is left in the field after you harvest?
For those not using mulch:
What do you think would happen if you left the crop residue in the field?
For those using mulch:
What happens to the crop residue when it is left on the field?
Do termites remove it? Do cattle eat it?
What difference do you see between a plot where you have left crop residue and one where the
crop residue has been removed or burned?
How does the crop residue affect weeding if at all?
How does the crop residue affect soil fertility if at all?
Animal Traction

80
What livestock do you own?
Is there anyone you know who uses livestock for land preparation?
Have you ever used livestock for land preparation (either your own or someone else’s)? Please
explain.
For those who have livestock but have not used them for land preparation
What prevents you from using your livestock for land preparation?
For those who have livestock and used them for land preparation
How did you learn about animal traction?
What equipment do you use?
How much area do you prepare using animal traction?
How long does it take to prepare one hectare of land? What method do you use?
Are you aware of ripping lines as an effective land preparation method?
Do you let others borrow your animals for land preparation?
Do you rent your animals for land preparation?
Labor
How many people are in your household? How many of them work in the fields? What other
types of work does each person in your household do? How many children are in your
household?
What activities do you do between the start of the harvest and when the rains start again? How
much time do you spend on the different activities? Which ones are most important?
(Possible answers may include: Processing the harvest, Irrigation, Buying and selling agricultural
products, Buying and selling manufactured goods, Wage Labor, Land Preparation for rain fed
plots, Cultural activities such as weddings, funerals, and other ceremonies, Home improvements
/ construction, Community projects)
Land Tenure Security
Do you think you will be farming this same plot next year? What about two years from now?
What about five years from now? (If applicable: What makes you think that you may not be
farming this plot in the future?)
Perceptions about rainfall patterns
Did your crops experience any dry spells over the last three seasons? How severe were they
(mild, severe, very severe)? Which plots were affected?
Did your fields have any flooding or damage from excess water over the last three seasons? How
severe were they (mild, severe, very severe)? Which plots were affected?

81
A.2. Professional Interview Guide – for use with NGO workers or extension staff
Please explain for me the history of your organizations involvement in promoting conservation
agriculture?
How did you first hear about it?
Please explain for me the process your organization has used for promoting conservation
agriculture?
What methods do you use to motivate farmers to try a new tillage method?
Can you share with me any training manuals or lesson plans you use?
Where did they come from?
What adaptations have you made?
How do you interact with farmers in the communities? Groups? Individually? How regularly?
Has your organization been involved in the formation of groups of farmers? How is that
done?
How are the skills of groups built by your organization (if at all)?
What are the results that you see so far in farmers adopting conservation agriculture?
How many farmers? What locations? What benefits?
How long have you been promoting it?
What challenges do farmers share with you about conservation agriculture?
What challenges do you see for the widespread adoption of conservation agriculture?
What do you think should be done to address these challenges?
How does your organization feel about farmers who adopt only portions of conservation
agriculture or do not implement it the way that you trained them to?
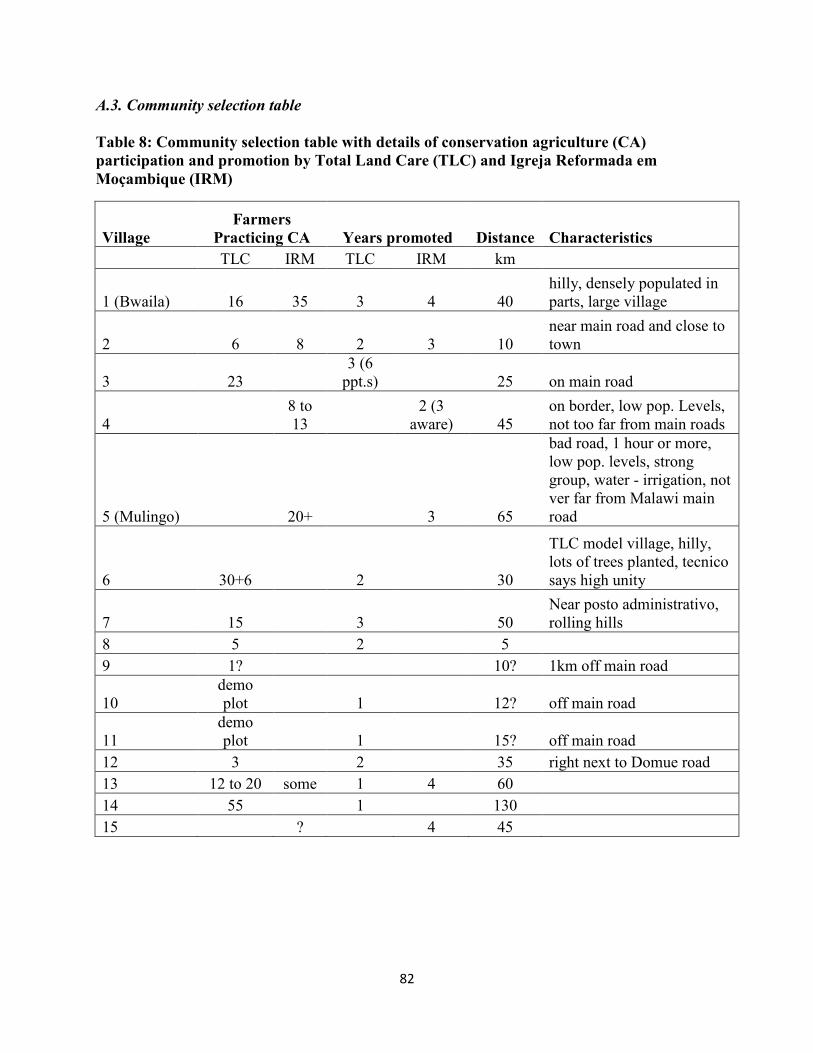
82
A.3. Community selection table
Table 8: Community selection table with details of conservation agriculture (CA)
participation and promotion by Total Land Care (TLC) and Igreja Reformada em
Moçambique (IRM)
Village
Farmers
Practicing CA Years promoted Distance Characteristics
TLC IRM TLC IRM km
1 (Bwaila) 16 35 3 4 40
hilly, densely populated in
parts, large village
2 6 8 2 3 10
near main road and close to
town
3 23
3 (6
ppt.s) 25 on main road
4
8 to
13
2 (3
aware) 45
on border, low pop. Levels,
not too far from main roads
5 (Mulingo) 20+ 3 65
bad road, 1 hour or more,
low pop. levels, strong
group, water - irrigation, not
ver far from Malawi main
road
6 30+6 2 30
TLC model village, hilly,
lots of trees planted, tecnico
says high unity
7 15 3 50
Near posto administrativo,
rolling hills
8 5 2 5
9 1? 10? 1km off main road
10
demo
plot 1 12? off main road
11
demo
plot 1 15? off main road
12 3 2 35 right next to Domue road
13 12 to 20 some 1 4 60
14 55 1 130
15 ? 4 45

83
A.4. Labor data collection sheet
Table 9: Sample labor data collection sheet
Community: Mulingo ID: MF 3
Field: IRM
Date: 23 July
Men Women Children Paid labor
Task
description
Timing
(dates)
Method/
notes
work
ers
# d
ays
hours
/day
Tota
l h
ou
rs
work
ers
# d
ays
hours
/day
Tota
l h
ou
rs
work
ers
# d
ays
hours
/day
Tota
l h
ou
rs
Tota
l p
erso
n
hou
rs
Ad
just
ed m
an
hou
rs
How
pai
d
Val
ue
per
day
Oth
er p
aym
ent
Dig basins Nov
before
rain 0 1 3 6 18 0 18 13.5
Compost Nov 0 1 3 6 18 0 18 18
Residues Oct 0 1 2 6 12 0 12 12
Add grass Oct 0 1 5 6 30 0 30 30
Plant Dec 3/basin 0 1 3 6 18 1 3 6 18 36 31.5
Weed Jan 0 1 4 6 24 1 4 6 24 48 36
Weed Feb 0 1 2 6 12 1 2 6 12 24 18
Weed Feb 0 1 2 6 12 1 2 6 12 24 18
Harvest Jun 0 1 1 9 9 0 9 9
Total 0 153 66 219 186
Other
notes: this year 3 sacks harvested
Summary
Hr.
s %
last year one oxcart
Planting 45 24%
child age 11
Weeding 72 39%
Fertilizing 18 10%
Mulching 42 23%
Harvesting 9 5%
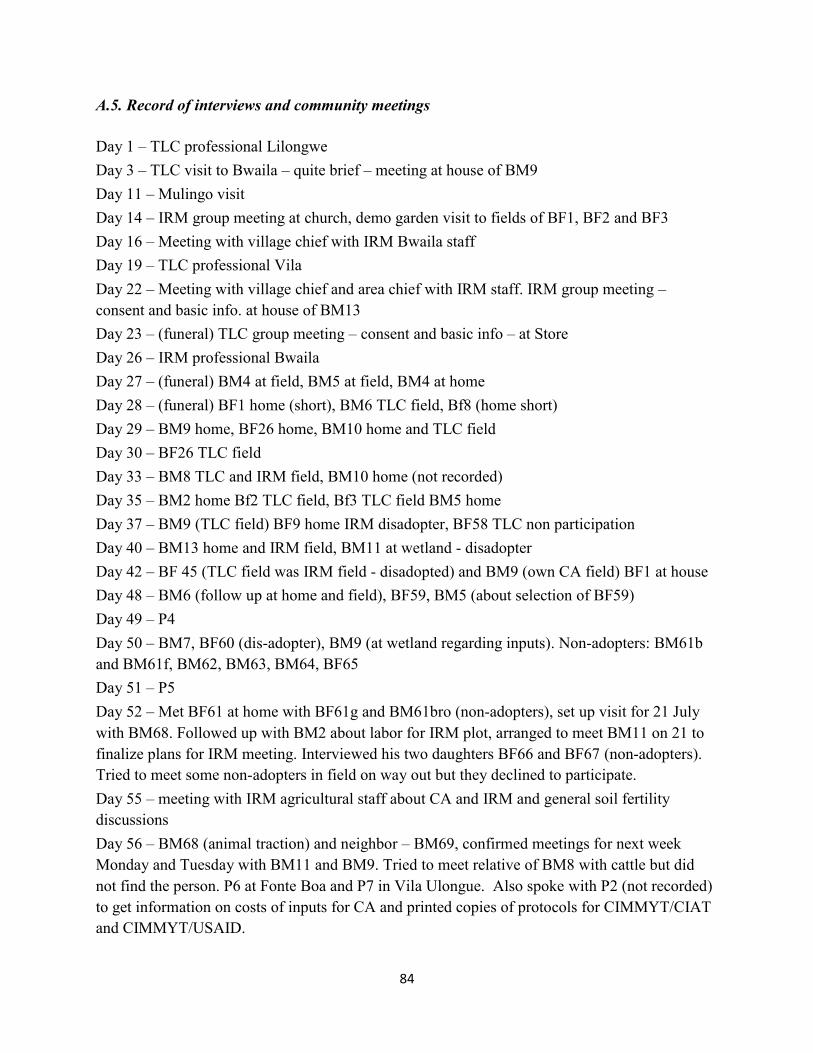
84
A.5. Record of interviews and community meetings
Day 1 – TLC professional Lilongwe
Day 3 – TLC visit to Bwaila – quite brief – meeting at house of BM9
Day 11 – Mulingo visit
Day 14 – IRM group meeting at church, demo garden visit to fields of BF1, BF2 and BF3
Day 16 – Meeting with village chief with IRM Bwaila staff
Day 19 – TLC professional Vila
Day 22 – Meeting with village chief and area chief with IRM staff. IRM group meeting –
consent and basic info. at house of BM13
Day 23 – (funeral) TLC group meeting – consent and basic info – at Store
Day 26 – IRM professional Bwaila
Day 27 – (funeral) BM4 at field, BM5 at field, BM4 at home
Day 28 – (funeral) BF1 home (short), BM6 TLC field, Bf8 (home short)
Day 29 – BM9 home, BF26 home, BM10 home and TLC field
Day 30 – BF26 TLC field
Day 33 – BM8 TLC and IRM field, BM10 home (not recorded)
Day 35 – BM2 home Bf2 TLC field, Bf3 TLC field BM5 home
Day 37 – BM9 (TLC field) BF9 home IRM disadopter, BF58 TLC non participation
Day 40 – BM13 home and IRM field, BM11 at wetland - disadopter
Day 42 – BF 45 (TLC field was IRM field - disadopted) and BM9 (own CA field) BF1 at house
Day 48 – BM6 (follow up at home and field), BF59, BM5 (about selection of BF59)
Day 49 – P4
Day 50 – BM7, BF60 (dis-adopter), BM9 (at wetland regarding inputs). Non-adopters: BM61b
and BM61f, BM62, BM63, BM64, BF65
Day 51 – P5
Day 52 – Met BF61 at home with BF61g and BM61bro (non-adopters), set up visit for 21 July
with BM68. Followed up with BM2 about labor for IRM plot, arranged to meet BM11 on 21 to
finalize plans for IRM meeting. Interviewed his two daughters BF66 and BF67 (non-adopters).
Tried to meet some non-adopters in field on way out but they declined to participate.
Day 55 – meeting with IRM agricultural staff about CA and IRM and general soil fertility
discussions
Day 56 – BM68 (animal traction) and neighbor – BM69, confirmed meetings for next week
Monday and Tuesday with BM11 and BM9. Tried to meet relative of BM8 with cattle but did
not find the person. P6 at Fonte Boa and P7 in Vila Ulongue. Also spoke with P2 (not recorded)
to get information on costs of inputs for CA and printed copies of protocols for CIMMYT/CIAT
and CIMMYT/USAID.

85
Day 58 – Mulingo field visit
Day 61 – Neighboring TLC community, BM9, BF25, TLC group meeting
Day 62 – BF 19 and 20, IRM group meeting, BM12 and11, BF13 history, took village chief to
area chief
Day 63 – Kawale with P8

86
Appendix B: Details on Thematic analysis
Table 10: Coding rules, definitions and examples
Name Definition Rule Example (my words in italics)
Benefits of
CA
Benefits from
conservation agriculture
which may be referred to
as Farming God's Way or
farming without tilling
Apply to any data where the
interviewee expresses a positive
opinion of the agricultural
methods learned from Total Land
Care or the Igreja Reformada.
How did you first react the first time when you heard
let’s try no till farming? I just heard that and thought
let’s see it and how it worked. I saw it and the herbicide
sprayed and saw that it doesn’t need a lot of work, in
our farming we have to ridge and hoe and this one you
just have to arrange the cornstalks which is easy and
saves a person. It doesn’t get your blood running this no
till farming.
Challenges of
CA and
reasons for
disadoption
Both directly stated
problems as well as
reasons why farmers do
not expand no till
farming or reasons why
they have stopped using
no till methods
Apply to any data where the
interviewee describes problems
with the agricultural methods
learned from the NGOs, reasons
they cannot expand it or reasons
they have reduced area or stopped
altogether.
That other way of planting stations produced a lot of
maize but when there was a lot of rain it seemed like a
lot of maize rotted. We only pala (lightly weed) the
power of the holes. But this way of cutting the ridges
and adding manure the roots develop better, they find
the food faster but without till they dry faster. Where
there is minimum tillage the roots quickly find undug
places that are too dry so it gets weak quickly. But
where you have made ridges they all do well.
Compost
making
Producing organic
compost in a pit or a
heap
Apply to any data discussing
compost making, transport, its
application and its effectiveness.
Include even simple statements
about not knowing how to make
compost.
Have you learned to make compost? Yes we make it.
What do you use? To make compost we dig out that
hole and then we go around get cow manure, leaves, to
mix it all up, different leaves of fertility and we mix it
all together and add water and wait a few days until it is
ripe.
Conversions
for units
measuring
maize
The local measures of
the volume of grain or
cobs of maize
Apply to any data indicating how
the different measures relate to
each other
How many baskets fit in an oxcart? It depends on the
oxcart – some are bigger and some are smaller. I use
my parents’ oxcart and it has 17 baskets. You fill the
oxcart by nailing the cobs in.

87
Table 10 (Cont’d)
Name Definition Rule Example (my words in italics)
Day labor use
and wages
Agricultural wage labor
in cash or in kind. Not
family labor.
Apply to any data discussing the
use of wage labor or participation
in wage labor for agriculture
including availability, wages and
quantity of wage labor used or
provided.
So you have these 4 fields, do you pay day laborers?
Yes, we have to pay day laborers, sometimes when
hunger is a problem, instead of eating enough ourselves
we use some maize in the rainy season and find some
friends who can help us a little, and we give them
maize. How much do you pay them per day? Do you
count out a plate? We count out. We find people who
can work 4 days and we pay them one bucket of maize .
One person 4 days we give them a bucket of maize.
Decisions
about CA plot
location
The explanation about
why a specific plot was
chosen for conservation
agriculture compared to
other options.
Apply to any data stating reasons
for the choice of the plot for CA
use or any guidance from the
NGO about plot location
He said that if they have visitors they want to be able to
visit quickly so fields should be close to the road.
That’s what he said. That’s why I chose field three
because even though it is a bit away it is right on the
road and my other fields, hey they are on the other side
of the hills. Indeed. That’s what happened, they want
close fields so that they can take visitors there. But if it
wasn’t like that what would you do on your own, which
field would you choose? Ohh… I would rather have the
TLC farming be on field 2. The one on the other side of
the hill? Yes. Why is that? Because it has a lot of space
and it is level. If I could have I would have chosen that
one.
Erosion The loss of soil due to
runoff and the resulting
soil degradation
Apply to any data talking about
erosion - it's prevention,
prevalence or how CA affects it
What about regarding soil erosion? Regarding soil
erosion it is better here in TLC plot because we put the
crop residues, they help keep the water from running
very fast, when the rain comes and it hits the residues, it
is caught up a little bit.

88
Table 10 (Cont’d)
Name Definition Rule Example (my words in italics)
Fertilizer use Chemical fertilizer use in
general
Apply to any data relating to
fertilizer use, benefits, challenges
and its effectiveness. Leave out
isolated requests for fertilizer that
do not have any further discussion
about fertilizer.
Where have you used fertilizer? I used it in three fields.
The TLC plot, the IRM plot and the small one with only
maize. And that third plot, how much fertilizer? I added
25kg of Chitowe. As a basal dressing? Yes. Are there
other field where you used compost? No, only the IRM
plot.
Herbicide Herbicide use in general Apply to any data discussing
herbicide application and its
effectiveness
In the first year I used herbicide – roundup and bullet
applied before planting and before the rains came. We
mix the two herbicides at once in the backpack sprayer.
The sprayer came from TLC and stays with the
chairman.
Interactions
with NGO
Total Land Care and the
Igreja Reformada (also
referred to as CCAP and
Bwaila) are non
governmental
organizations actively
promoting CA
Apply to any data where the
interviewee describes how they
interact with either NGO
including any reference to their
selection, provision of inputs, the
timing of those inputs, and the
need to return harvest to the NGO
as well as the influence of the
NGO on field selection.
I saw others farming like that and I was
admiring/jealous and thought I should try my own
farming God’s way field. Whose field did you see?
Fulana’s. She is the one who… I saw her and said, so
that’s how you do it? She said yes and then I said when
your facilitator comes tell him that I am also interested.
So then when the facilitator came and told me how to
do it. I entered that church and learned about
agriculture, they were training about compost making
and they said here is a visitor and I said I don’t want to
be a visitor I want to be one of you.
Irrigation Any discussion of any
type of irrigation
Apply to any data referring to
irrigation
You have two dimba gardens? Yes, this one and the
other over there. We are harvesting potatoes now and
will plant beans. Only beans? We will put a few maize
plants in there. We have a well and we carry it with a
can and our hands hurt – we need a treadle pump.

89
Table 10 (Cont’d)
Name Definition Rule Example (my words in italics)
Labor
Shortage
Expression of not being
able to complete a task
for any reason indicating
a shortage of labor
Apply to any data where the
interviewee specifically mentions
a labor shortage related to
agriculture
I used a hoe to weed once here. My wife got sick and so
I was not able to do a second weeding with a hoe and
you would have seen much less weeds than you see
now. It takes my wife and two kids and I four days to
weed this field. But this is less work than weeding in
conventional ridging.
Land Tenure Any mention of the
expectation of staying or
being kicked off the land.
Discussions about
inheritance or renting
Apply to any data where land
tenure is discussed or alluded to.
And all the fields are yours or do you have to pay for
them? No they are mine, I am the owner. And do you
expect to continue farming those fields for many years?
Yes. Those fields are the end of my life. Really the end
of my life. I will leave them to my children and they are
the ones I received from my parents. They are not
borrowed.
Legumes and
Rotations
Legumes in this area are
peanuts, cowpeas, beans,
pigeon peas and soya.
Rotation refers to any
description of changing
the crop in a given field
from one year to the
next.
Apply to any data relating to
legume production or describing
any type of rotation.
We plant peanuts, beans but they did not stay, the
weather – they dried up. These (cowpeas) do not dry
quickly though, they grew without drying up even when
the rains came back then these still grew.
Livestock Any discussion of any
livestock
Apply to any data referring to
livestock
How do you protect your cassava from livestock this
time of year? The field where we have cassava
livestock do not come. Why? Is it far? Yes it is far and
it is near the wetland gardens and people don’t want the
cattle to ruin their potatoes and beans so there is
protection for my cassava.

90
Table 10 (Cont’d)
Name Definition Rule Example (my words in italics)
Mulching Maintaining crop
residues on the surface or
adding plant material as
a soil cover
Apply to any data discussing
mulch and any data describing
how crop residues are used.
I brought some grass after I had already planted and the
maize was about 6 inches tall. I wasn’t able to add more
because of the transport challenge of an oxcart. Last
year I left the corn stalks. Others come by and take
them for fuel for cooking. I sometimes use the
cornstalks near my home for cooking but I try to use
wood, cut a mango tree for the year.
Personal
Characteristics
Household information,
education levels, other
ways they make a living,
personal history
Apply to any data revealing
details about the basic
characteristics or history of the
individual or household.
During the war I was here and we left for Malawi. I
went to school there but it was a school for us who were
refugees in Malawi – I learned 1-3 there. Grades 4-6 I
did here when I got back. I was in Malawi 7 years.
Planting
method
How the maize is planted
- can be direct planted
through "stabbing" with
a stick, or direct planted
by cutting with a hoe or
by making planting
stations in either a no-till
field or a ridge.
Apply to any data referring to the
planting method used.
The next job was digging the planting stations with a
hoe. Last year I measured but this year I just left the
stumps of maize and planted where I saw them – in
places where I couldn’t see them I just guessed.
Tillage-
Fertility
connection
The connection between
tillage and fertility of the
soil
Apply only to data directly stating
a connection between tilling and
having better production or no till
requiring fertilizer
If you plant maize in those basins without compost or
fertilizer you can see that it doesn’t grow well but in the
ridges it grows. Why is that? It is because you have
mixed the dirt, what was on top is now below and what
was on top gives moisture and compost to the ridge,
because we take all the residues from the field and
knock it down between the ridges and bury it under the
ridges and it is like having a bit of fertilizer because of
all that residue is in the ridge; whereas the other way
we clear the field and leave it all on top, and that is the
big difference.
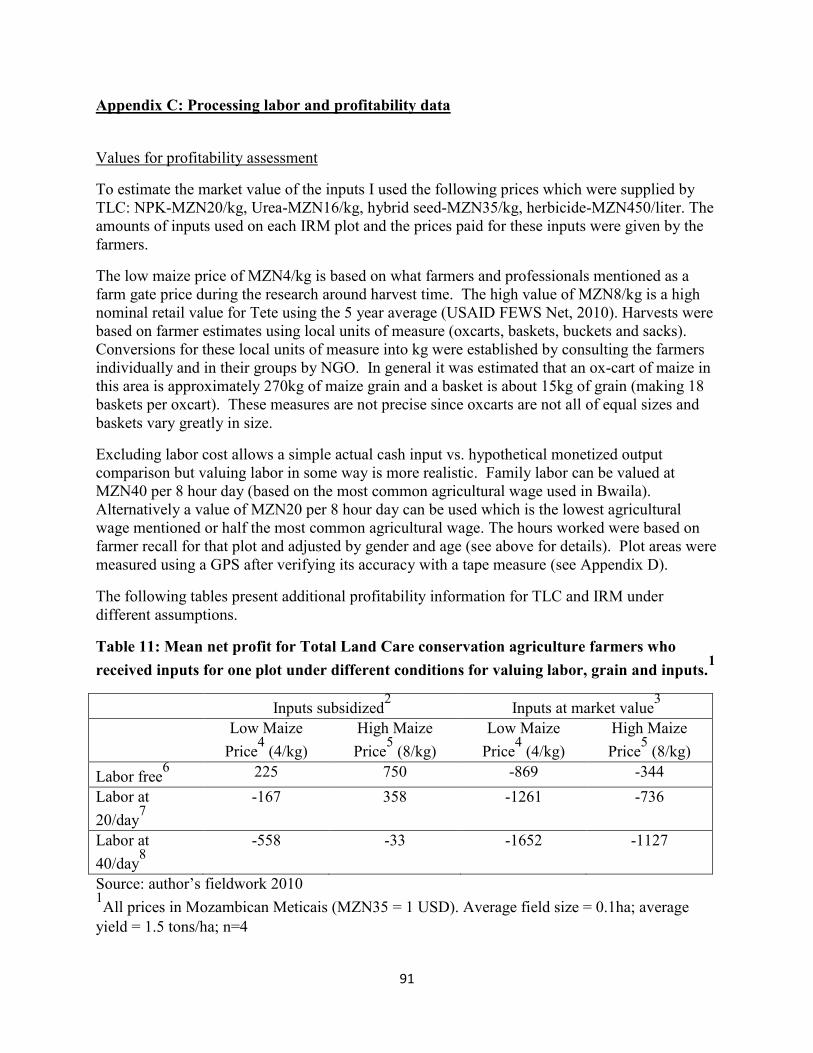
91
Appendix C: Processing labor and profitability data
Values for profitability assessment
To estimate the market value of the inputs I used the following prices which were supplied by
TLC: NPK-MZN20/kg, Urea-MZN16/kg, hybrid seed-MZN35/kg, herbicide-MZN450/liter. The
amounts of inputs used on each IRM plot and the prices paid for these inputs were given by the
farmers.
The low maize price of MZN4/kg is based on what farmers and professionals mentioned as a
farm gate price during the research around harvest time. The high value of MZN8/kg is a high
nominal retail value for Tete using the 5 year average (USAID FEWS Net, 2010). Harvests were
based on farmer estimates using local units of measure (oxcarts, baskets, buckets and sacks).
Conversions for these local units of measure into kg were established by consulting the farmers
individually and in their groups by NGO. In general it was estimated that an ox-cart of maize in
this area is approximately 270kg of maize grain and a basket is about 15kg of grain (making 18
baskets per oxcart). These measures are not precise since oxcarts are not all of equal sizes and
baskets vary greatly in size.
Excluding labor cost allows a simple actual cash input vs. hypothetical monetized output
comparison but valuing labor in some way is more realistic. Family labor can be valued at
MZN40 per 8 hour day (based on the most common agricultural wage used in Bwaila).
Alternatively a value of MZN20 per 8 hour day can be used which is the lowest agricultural
wage mentioned or half the most common agricultural wage. The hours worked were based on
farmer recall for that plot and adjusted by gender and age (see above for details). Plot areas were
measured using a GPS after verifying its accuracy with a tape measure (see Appendix D).
The following tables present additional profitability information for TLC and IRM under
different assumptions.
Table 11: Mean net profit for Total Land Care conservation agriculture farmers who
received inputs for one plot under different conditions for valuing labor, grain and inputs.1
Inputs subsidized2
Inputs at market value3
Low Maize
Price4 (4/kg)
High Maize
Price5 (8/kg)
Low Maize
Price4 (4/kg)
High Maize
Price5 (8/kg)
Labor free6 225 750 -869 -344
Labor at
20/day7
-167 358 -1261 -736
Labor at
40/day8
-558 -33 -1652 -1127
Source: author’s fieldwork 2010 1All prices in Mozambican Meticais (MZN35 = 1 USD). Average field size = 0.1ha; average
yield = 1.5 tons/ha; n=4

92
2 TLC inputs were provided in return for grain after harvest (75kg for the 0.1 ha plots). The
calculation was done by counting the low maize price value of this grain as a cash input. The
inputs were provided follow the TLC guidelines in Table 1. 3 The market value of the actual inputs used was calculated using prices from TLC
4 The low maize price is the farm gate price at harvest time.
5 The high maize price is the high nominal retail value in Tete for a 5 year average (USAID
FEWS Net, 2010). 6 No household labor costs were included. Paid labor costs are included. This row is a cash
analysis of cash costs compared to the value of the grain produced 7 Includes the cost of labor valued at MZN 20 per 8 hour day for all household labor adjusted by
gender and age (see above) 8 Includes the cost of labor valued at MZN 20 per 8 hour day for all household labor adjusted by
gender and age (see above)
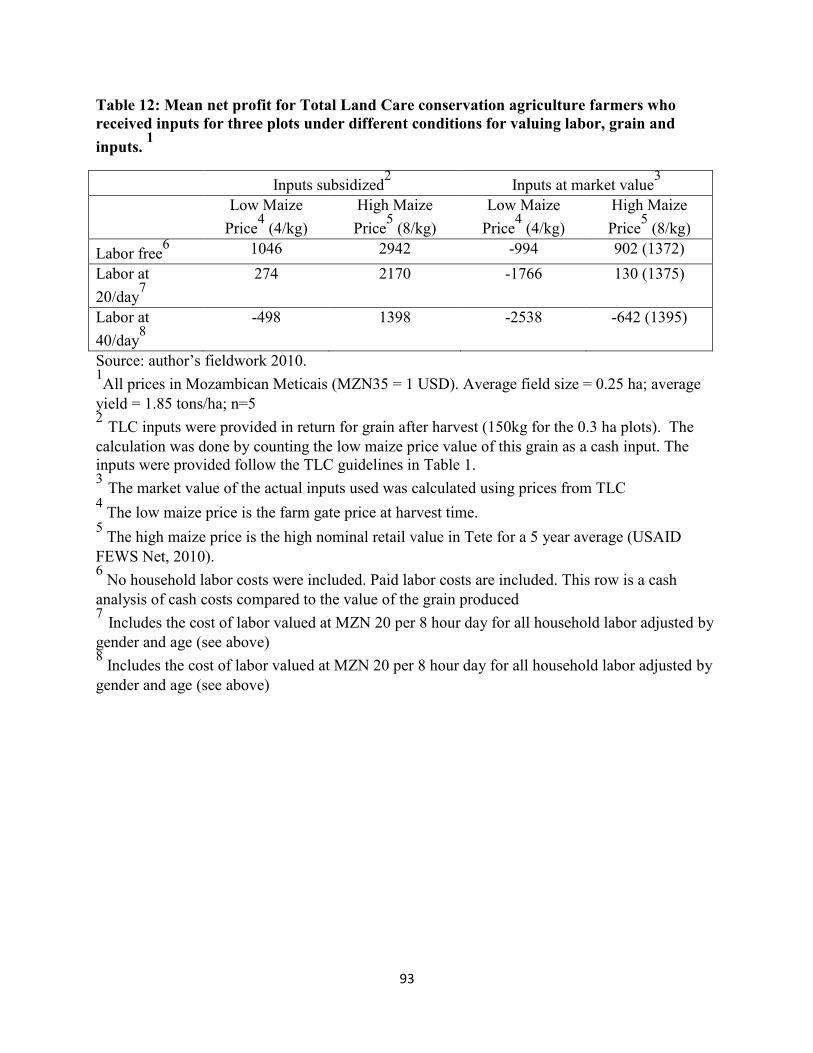
93
Table 12: Mean net profit for Total Land Care conservation agriculture farmers who
received inputs for three plots under different conditions for valuing labor, grain and
inputs. 1
Inputs subsidized2
Inputs at market value3
Low Maize
Price4 (4/kg)
High Maize
Price5 (8/kg)
Low Maize
Price4 (4/kg)
High Maize
Price5 (8/kg)
Labor free6 1046 2942 -994 902 (1372)
Labor at
20/day7
274 2170 -1766 130 (1375)
Labor at
40/day8
-498 1398 -2538 -642 (1395)
Source: author’s fieldwork 2010. 1All prices in Mozambican Meticais (MZN35 = 1 USD). Average field size = 0.25 ha; average
yield = 1.85 tons/ha; n=5 2 TLC inputs were provided in return for grain after harvest (150kg for the 0.3 ha plots). The
calculation was done by counting the low maize price value of this grain as a cash input. The
inputs were provided follow the TLC guidelines in Table 1. 3 The market value of the actual inputs used was calculated using prices from TLC
4 The low maize price is the farm gate price at harvest time.
5 The high maize price is the high nominal retail value in Tete for a 5 year average (USAID
FEWS Net, 2010). 6 No household labor costs were included. Paid labor costs are included. This row is a cash
analysis of cash costs compared to the value of the grain produced 7 Includes the cost of labor valued at MZN 20 per 8 hour day for all household labor adjusted by
gender and age (see above) 8 Includes the cost of labor valued at MZN 20 per 8 hour day for all household labor adjusted by
gender and age (see above)
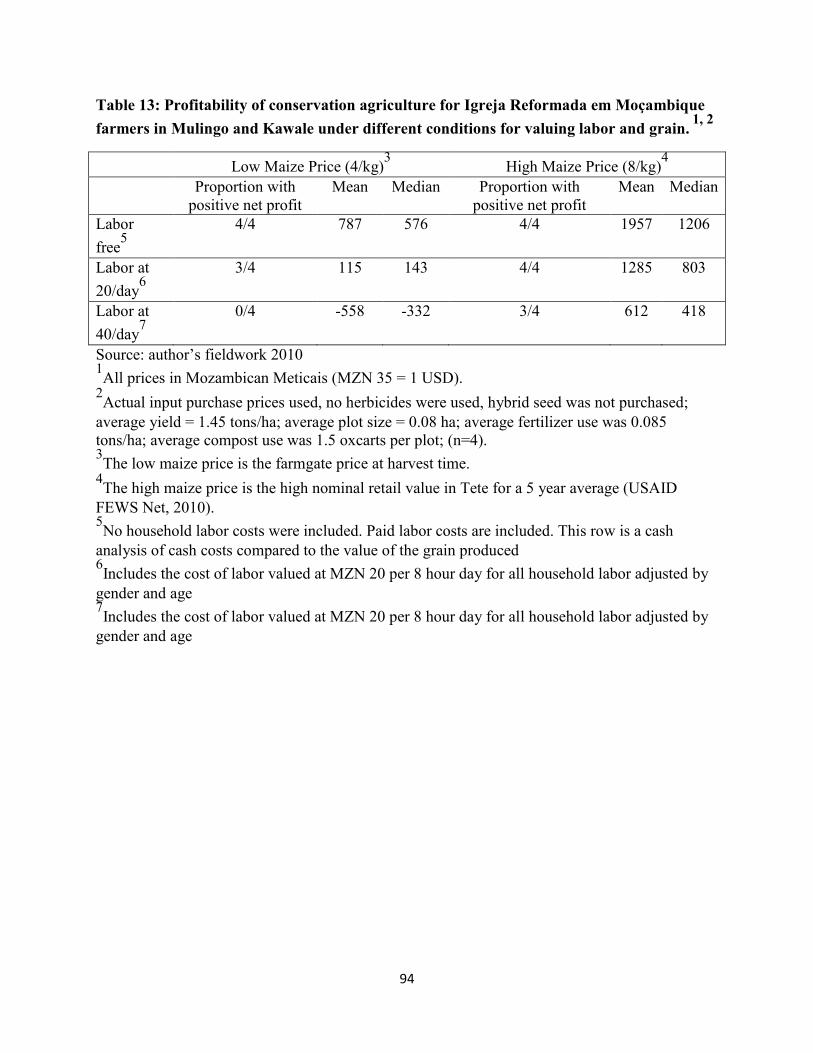
94
Table 13: Profitability of conservation agriculture for Igreja Reformada em Moçambique
farmers in Mulingo and Kawale under different conditions for valuing labor and grain. 1, 2
Low Maize Price (4/kg)3 High Maize Price (8/kg)
4
Proportion with
positive net profit
Mean Median Proportion with
positive net profit
Mean Median
Labor
free5
4/4 787 576 4/4 1957 1206
Labor at
20/day6
3/4 115 143 4/4 1285 803
Labor at
40/day7
0/4 -558 -332 3/4 612 418
Source: author’s fieldwork 2010 1All prices in Mozambican Meticais (MZN 35 = 1 USD).
2Actual input purchase prices used, no herbicides were used, hybrid seed was not purchased;
average yield = 1.45 tons/ha; average plot size = 0.08 ha; average fertilizer use was 0.085
tons/ha; average compost use was 1.5 oxcarts per plot; (n=4). 3The low maize price is the farmgate price at harvest time.
4The high maize price is the high nominal retail value in Tete for a 5 year average (USAID
FEWS Net, 2010). 5No household labor costs were included. Paid labor costs are included. This row is a cash
analysis of cash costs compared to the value of the grain produced 6Includes the cost of labor valued at MZN 20 per 8 hour day for all household labor adjusted by
gender and age 7Includes the cost of labor valued at MZN 20 per 8 hour day for all household labor adjusted by
gender and age

95
Figure 6: Marginal cost of production1,2,3
and marginal benefits for a farmer whose
opportunity cost of labor is equal to the market wage rate under two output price
scenarios4 for Total Land Care (TLC) plots with 0.4 tons/ha fertilizer application rate.
Source: author’s fieldwork 2010 1Marginal costs and benefits were calculated for increments of 0.01 ha.
2The marginal cost of production is estimated by adding the marginal cost of purchased inputs,
the marginal cost of paid labor and the marginal opportunity cost of household labor. 3For this figure the marginal opportunity cost of household labor was valued at the agricultural
wage rate (40 MZN/day) for all areas. 4“Harvest value high” has a maize price of 8 MZN/kg and “Harvest value low” has maize price
of 4 MZN/kg.
0
20
40
60
80
100
120
140
160
180
200
0 0.2 0.4 0.6 0.8 1
Met
icai
s
Hectares
Marginal benefit (high)
Marginal benefit (low)
Total marginal cost
Marginal cost of labor

96
Appendix D: Plot area data
Table 14: Plot measurements by tape measure and GPS in Bwaila including limited information about the time required to
make the measurements
Participant
Field
type Measurements
Calculated
area (square
meters)
Time
(2
people)
GPS
area
(ha)
Time
(1
person) Notes
1 Bm7 TLC 0.12
2 Bm9 Own 0.31
3 Bf45 TLC 53.4 31.1 1661 5 min 0.14
4 Bm13 IRM 25 30.5 13.5 30.8 590 0.06
Corner angled
off
5 Bm9 TLC 56.4 47.8 2696 0.24
Forgot to start
watch
6 Bf3 IRM 26 53.2 1383 4m27s 0.12
7 Bf2 IRM 27.2 43.2 27.2 39.5 1081 8m30s 0.11 3min
2 m of ridges
along 22m of the
39.5m lenth
8 Bm8 IRM 26.3 9.2 13.9 304 8m 0.03
9 Bm8 TLC 59.9 22.5 1348 0.1
10 Bf26 TLC 40.8 50.3 40.1 54 2109 18m56s 0.2 4m4s
11 Bm10 TLC 62.4 66.1 4125 10m50s 0.33
irregular shape -
makes sense
GPS calculates
smaller
12 Bm6 TLC 103.7 20.7 2147 0.2 Forgot watch
13 Bm5 TLC 51.6 39.3 52.4 41.8 2109 0.21
14 Bm4 IRM 22.8 29 21 25.9 601 0.06
15 Bm4 TLC 50 24.5 53 26.6 1316 0.14
16 Bf1 IRM 33.3 25.3 33 29.3 905 6m4s 0.08 2m25s

97
REFERENCES

98
REFERENCES
Aagaard, P. J. (2009). Misconceptions regarding minimum tillage and conservation farming: A
farmers perspective. Zambia Conservation Farming Unit.
Agriculture, Food, and Resource Economics. (2010). Strengthening Mozambique's capacity for
agricultural policy analysis, productivity, growth and poverty reduction. Retrieved from:
http://www.aec.msu.edu/fs2/Mozambique/
Akinnifesi, F. Sileshi, G., Ajayi, O.C., & Beedy, T. (2011). Prospects for integrating
conservation agriculture with fertilizer trees in southern Africa. Presented at:
Conservation agriculture regional symposium for southern Africa, 8-10 February 2011,
Johannesburg, South Africa. Abstract available from:
http://ecoport.org/ep?SearchType=reference&Keyword=CASympJhb&domainId=2&Key
wordWild=BW&MaxList=0
Amane, M.I., & Mlay, G.I. (2002). Zonas agroecológicas. Análise Temática do Censo Agro-
Pecuario (CAP) de Moçambique 1999-2000.
Arellanes, P., & Lee, D.R. (2003). The determinants of adoption of sustainable agriculture
technologies: evidence from the hillsides of Honduras. In Proceedings of the 25th
International Conference of Agricultural Economists (IAAE) 16-22 August 2003,
Durban, South Africa.
Barrett, C. (2008). Smallholder market participation: Concepts and evidence from eastern and
southern Africa. Food Policy, 33, 299-317.
Baudron, F., Mwanza, H. M., Triomphe, B., & Bwalya, M. (2007). Conservation agriculture in
Zambia: A case study of Southern Province. Nairobi: African Conservation Tillage
Network, Centre de Coopération Internationale de Recherche Agronomique pour le
Dévelopment, Food and Agricultural Organization of the United Nations.
Bias, C., & Donovan, C. (2003). Gaps and opportunities for agricultural sector development in
Mozambique. (Vol. Research Report 54E). Maputo: MADER Directorate of Economics,
Department of Policy Analysis (MADER/DE/DAP).
Binswanger, H.P. (1978). Induced technical change: Evolution of thought. in H.P. Binswanger
and V.W. Ruttan, Induced Innovation: Technology, Institutions, and Development. Johns
Hopkins University Press.
Boardman, A., Greenberg, D., Vining, A. & Weimer, D. (2006). Cost-benefit analysis: Concepts
and practice. (3rd ed.). Upper Saddle River, NJ: Pearson Prentice Hall.
Boughton, D., Mather, D., Barrett, C., Benfica, R. Abdula, D., Tschirley, D. & Cunguara, B.
(2007). Market participation by rural households in a low-income country: An asset-
based approach applied to Mozambique. Faith and Economics, 50, 64-101

99
Byerlee, D. (1986). Farmers' stepwise adoption of technological packages: Evidence from the
Mexican Altiplano. American Journal of Agricultural Economics, 46 (3), 519-527.
Chigowo, T. (2011). The effects of reduced tillage on soil chemical and physical characteristics,
and maize yields in Malawi. Presented at: Conservation agriculture regional symposium
for southern Africa, 8-10 February 2011, Johannesburg, South Africa. Abstract available
from:
http://ecoport.org/ep?SearchType=reference&Keyword=CASympJhb&domainId=2&Key
wordWild=BW&MaxList=0
Chivenge, P.P., Murirwa, H.K., Giller, K.E., Mapfumo, P., & Six, J. (2007). Long-term impact
of reduced tillage and residue management on soil carbon stabilization: Implications for
conservation agriculture on contrasting soils. Soil and Tillage Research, 94, 328-337.
Chung, K. (2000). Qualitative data collection techniques. In M.E. Grosh &P. Glewwe (Eds.),
Designing household survey questionnaires for developing countries. (pp. 337-
363).Washington D.C.: The World Bank.
de Janvry, A., Fafchamps, M., & Sadoulet, E. (1991). Peasant household behavior with missing
markets: some paradoxes explained. The Economic Journal, 101, 1400-1417.
Easterly, W. (2008). Planners vs. searchers in African agricultural aid. Retrieved from:
http://www.fao.org/ag/againfo/programmes/en/pplpi/docarc/feature04_searchers.pdf
Famba, S. (2010). Land Degradation Status: Mozambique Country Situational Appraisal.
presented for FAO Land Degradation Assessment meeting in Pretoria, South Africa.
Retrieved from:
http://www.fao.org/nr/lada/index.php?option=com_docman&task=doc_download&gid=5
45&Itemid=165&lang=en
Feder, G., Just, R.E., & Zilberman, D. (1985). Adoption of agricultural innovations in
developing countries: A survey. Economic Development and Cultural Change, 33 (2),
255-298.
Folmer, E., Geurts, P., & Francisco, J. (1998). Assessment of soil fertility depletion in
Mozambique. Agriculture, Ecosystems and Environment, 71 (1-3), 159-167.
Food and Agriculture Organization. (2001). The economics of conservation agriculture. Rome:
United Nations Food and Agriculture Organization.
Friedrich, T., & Kassam, A. (2011). Conservation agriculture: Global perspectives and
development. Presented at: Conservation agriculture regional symposium for southern
Africa, 8-10 February 2011, Johannesburg, South Africa. Abstract available from:
http://ecoport.org/ep?SearchType=reference&Keyword=CASympJhb&domainId=2&Key
wordWild=BW&MaxList=0

100
Fujisaka, S. (1994). Learning from six reasons why farmers do not adopt innovations intended to
improve sustainability of upland agriculture. Agricultural Systems, 46 (4), 409-425.
Gama, M., & Thierfelder, C. (2011). Improved food security and livelihoods for resource poor
smallholder farmers through conservation agriculture in Balaka district, Malawi. Poster
presented at: Conservation agriculture regional symposium for southern Africa, 8-10
February 2011, Johannesburg, South Africa. Abstract available from:
http://ecoport.org/ep?SearchType=reference&Keyword=CASympJhb&domainId=2&Key
wordWild=BW&MaxList=0
Geurts, P.M.H. (1997). Recomendações de adubaçào azotada e fosfórica para as culturas anuais
alimentares e algodão em Moçambique. Maputo, Série Terra e Água, Instituto Nacional
de Investigação Agrária, Comunicação No. 88. Retrieved from:
http://library.wur.nl/isric/fulltext/ISRIC_14914.pdf
Giller, K. E., Witter, E., Corbeels, M., & Tittonell, P. (2009). Conservation agriculture and
smallholder farming in Africa: The heretics' view. Field Crops Research, 114, 23-24.
Gittinger, J.P. (1982). Economic analysis of agricultural projects. Baltimore: Johns Hopkins
University Press.
Griliches, Z. (1957). Hybrid corn: An exploration in the economics of technology change.
Econometrica, 25 (4), 501-522.
Guba, E.G., & Lincoln, Y.S. (1994). Competing paradigms in qualitative research. In N.K.
Denzin & Y.S. Lincoln, (Eds.) Handbook of qualitative research (pp. 105-117).
Thousand Oaks, CA: Sage Publications.
Haggblade, S., Hazell, P., & Reardon, T. (2007). The Rural non-farm economy: Prospects for
growth and poverty reduction. World Development, 38 (10), 1429-1441.
Haggblade, S., Kabwe, S., & Plerhoples, C. (2011). Productivity impact of conservation farming
on smallholder cotton farmers in Zambia. Presented at: Conservation agriculture regional
symposium for southern Africa, 8-10 February 2011, Johannesburg, South Africa.
Abstract available from:
http://ecoport.org/ep?SearchType=reference&Keyword=CASympJhb&domainId=2&Key
wordWild=BW&MaxList=0
Haggblade, S., & Tembo, G. (2003). Development, diffusion and impact of conservation farming
in Zambia. Food Security Research Project. Lusaka, Zambia: Michigan State University.
Retrieved from: http://aec.msu.edu/fs2/zambia/wp8zambia.pdf
Hanlon, J., & Smart, T. (2008). Do bicycles equal development in Mozambique? Woodbridge,
UK: James Currey.
Hobbs, P. R. (2007). Conservation agriculture: what is it and why is it important for future
sustainable food production. Journal of Agricultural Science, 145 (2), 127-137.

101
Hove, L., Kadzere, I., Sims B., Ager, M., & Mulila-Miti, J. (2011). Conservation agriculture
research and development in southern Africa: A review of achievements and challenges
in the past 20 Years. Presented at: Conservation agriculture regional symposium for
southern Africa, 8-10 February 2011, Johannesburg, South Africa. Abstract available
from:
http://ecoport.org/ep?SearchType=reference&Keyword=CASympJhb&domainId=2&Key
wordWild=BW&MaxList=0
International Institute of Rural Reconstruction & African Conservation Tillage Network. (2005).
Conservation agriculture: A manual for farmers and extension workers in Africa.
Nairobi: International Institute of Rural Reconstruction, African Conservation Tillage
Network.
Ito, M., Matsumoto, T., & Quinones, M. A. (2007). Conservation tillage practice in sub-Saharan
Africa: the experience of Sasakawa Global 2000. Crop Protection, 26, 417-423.
Lobell, D.B., Burke, M.B., Tebaldi, C., Mastrandrea, M.D., Falcon, W.P. & Naylor, R.L. (2008).
Prioritizing climate change adaptation needs for food security in 2030. Science, 319
(5863), 607 - 610.
Locke, M.A., & Bryson, C.T. (1997). Herbicide-soil interactions in reduced tillage and plant
residue management systems. Weed Science, 45 (2), 307-320.
Kerr, J. M., & Sanghi, N. K. (1992). Indigenous soil and water conservation in India's semi-arid
tropics. London: IIED International Institute for Environment and Development,
Sustainable Agriculture Programme. Retrieved from: http://pubs.iied.org/6048IIED.html
Knodel, J., Havanon, N., Pramualratana, A. (1984). Fertility transition in Thailand: A qualitative
analysis. Population and Development Review, 10 (2), 297-328.
Marenya, P.P. & Barrett, C.B. (2009). Soil quality and fertilizer use rates among smallholder
farmers in western Kenya. Agricultural Economics, 40, 561–572.
Mashingaidze, N., Nyamangara, J., & Madakadze, I. (2011). Weed growth under hand-hoe
based conservation agriculture in smallholder farmers' fields in Zimbabwe. Presented at:
Conservation agriculture regional symposium for southern Africa, 8-10 February 2011,
Johannesburg, South Africa. Abstract available from:
http://ecoport.org/ep?SearchType=reference&Keyword=CASympJhb&domainId=2&Key
wordWild=BW&MaxList=0
Mavunganidze, Z. & Madakadze, I. (2011). Effects of tillage system and weed management on
weed emergence and density in smallholder cotton production systems. Presented at:
Conservation agriculture regional symposium for southern Africa, 8-10 February 2011,
Johannesburg, South Africa. Abstract available from:
http://ecoport.org/ep?SearchType=reference&Keyword=CASympJhb&domainId=2&Key
wordWild=BW&MaxList=0

102
Maxwell, J. (2005). Qualitative research design: An iterative approeach. 2nd
Ed. Thousand
Oaks, CA: Sage Publications.
Mazvimavi, K., & Twomlow, S. (2009). Socioeconomic and institutional factors influencing
adoption of conservation farming by vulnerable households in Zimbabwe Agricultural
Systems, 101, 20-29.
Miles, M., & Huberman, A. (1994). Qualitative data analysis. 2nd
Ed. Thousand Oaks, CA: Sage
Publications.
Morris, M. L., Kelly, V.A., Kopicki, R.J., & Byerlee, D. (2007). Fertilizer use in African
agriculture : lessons learned and good practice guidelines. Washington D.C.: World
Bank.
Moser, C.M. & Barrett, C.B. (2003). The disappointing adoption dynamics of a yield-increasing,
low external-input technology: the case of SRI in Madagascar. Agricultural Systems 76,
1085-1100.
Mozambique News Agency (2011). Mozambique: Food security must be improved. 15 March
2011. Retrieved from: http://www.reliefweb.int/rw/rwb.nsf/db900SID/EDIS-
8EYQDR?OpenDocument
Mupanda, K. (2009). Market access, marketing behavior and technical efficiency among farming
households in Mozambique. Retrieved from ProQuest Digital Dissertations. (AAT
1470073)
Mutsindikwa, U., Dumba, L. Munguri, W., & Mvumi, B. (2011). Conservation agriculture “a
winners’ choice” – Catholic Relief Services’ experiences of using holistic approaches in
scaling up CA in rural Zimbabwe. Presented at: Conservation agriculture regional
symposium for southern Africa, 8-10 February 2011, Johannesburg, South Africa.
Abstract available from:
http://ecoport.org/ep?SearchType=reference&Keyword=CASympJhb&domainId=2&Key
wordWild=BW&MaxList=0
Nkatiko, C. (2011). Conservation agriculture training: Experiences from the CFU in Zambia.
Presented at: Conservation agriculture regional symposium for southern Africa, 8-10
February 2011, Johannesburg, South Africa. Abstract available from:
http://ecoport.org/ep?SearchType=reference&Keyword=CASympJhb&domainId=2&Key
wordWild=BW&MaxList=0
Nyagumbo, I., Thierfelder, C., & Cheesman, S. (2011). Climate change mitigation benefits of
CA in southern Africa. Presented at: Conservation agriculture regional symposium for
southern Africa, 8-10 February 2011, Johannesburg, South Africa. Abstract available
from:
http://ecoport.org/ep?SearchType=reference&Keyword=CASympJhb&domainId=2&Key
wordWild=BW&MaxList=0
103
Nyamangara, J., & Masvaya, E.N. (2011). Soil fertility status of fields under conservation
agriculture in selected smallholder areas with contrasting agroecological conditions in
Zimbabwe. Presented at: Conservation agriculture regional symposium for southern
Africa, 8-10 February 2011, Johannesburg, South Africa. Abstract available from:
http://ecoport.org/ep?SearchType=reference&Keyword=CASympJhb&domainId=2&Key
wordWild=BW&MaxList=0
Nyathi, P., Mazvimavi, K., Kunzekweguta, M., Murendo, C., Masvaya, E., & Tirivavi, R.
(2011). Assessing the feasibility of mulching in mixed-crop livestock systems in
Zimbabwe. Presented at: Conservation agriculture regional symposium for southern
Africa, 8-10 February 2011, Johannesburg, South Africa. Abstract available from:
http://ecoport.org/ep?SearchType=reference&Keyword=CASympJhb&domainId=2&Key
wordWild=BW&MaxList=0
Patton, M.Q. (2002). Qualitative research and evaluation methods. (3rd
ed.). Newbury Park, CA:
Sage Publications.
Rubin, H. & Rubin I. (2005). Qualitative interviewing: The art of hearing data. Thousand Oaks,
CA: Sage Publications.
Rusinamhodzi, L., Corbeels, M., van Wijk, M., Nyamangara, J., Rufino, M., & Giller, K. (2011).
Productivity of maize-legume intercropping under no-till in central Mozambique:
Challenges and opportunities. Presented at: Conservation agriculture regional symposium
for southern Africa, 8-10 February 2011, Johannesburg, South Africa. Abstract available
from:
http://ecoport.org/ep?SearchType=reference&Keyword=CASympJhb&domainId=2&Key
wordWild=BW&MaxList=0
Ruttan, V. (1998). Models of agricultural development. in: Eicher, C. K., & Staatz, J. M. (1998).
International agricultural development. Baltimore, Md: Johns Hopkins University Press.
Shetto, R., & Owenya, M. (2007). Conservation agriculture as practised in Tanzania : three
case studies. Nairobi: African Conservation Tillage Network; Food Agriculture
Organization of the United Nations,.
Snapp, S., Rohrbach, D., Simtowe, F., & Freeman, H. (2002). Sustainable soil management
options for Malawi: Can smallholder farmers grow more legumes? Agriculture,
Ecosystems and Environment, 91, 159–174.
Takane, T. (2008). Labor use in smallholder agriculture in Malawi: Six village case studies.
African Study Monographs, 29 (4), 183-200.
Tashakkori, A., & Teddlie, C. (1998). Preface. In A. Tashakkori & C. Teddlie, Mixed
methodology: Combining qualitative and quantitative approaches. Thousand Oaks, CA:
Sage Publications.
104
Thierfelder, C., & Cheesman, S. (2011). Benefits and challenges of crop rotations in maize-based
conservation agriculture (CA) cropping systems of southern Africa. Presented at:
Conservation agriculture regional symposium for southern Africa, 8-10 February 2011,
Johannesburg, South Africa. Abstract available from:
http://ecoport.org/ep?SearchType=reference&Keyword=CASympJhb&domainId=2&Key
wordWild=BW&MaxList=0
Todaro, M. P., & Smith, S. C. (2009). Economic development (10th ed.). Boston: Pearson
Addison Wesley.
Tripp, R. (2006). Self-sufficient agriculture: Labour and knowledge in small scale farming.
London: Earthscan.
Tshuma, P., Mazvimavi, K., Murendo, C., Kunzekweguta, M., & Mutsvangwa, E. (2011).
Assessment of labour requirements in conservation agriculture in Zimbabwe. Presented
at: Conservation agriculture regional symposium for southern Africa, 8-10 February
2011, Johannesburg, South Africa. Abstract available from:
http://ecoport.org/ep?SearchType=reference&Keyword=CASympJhb&domainId=2&Key
wordWild=BW&MaxList=0
Uaiene, R. (2008). Determinants of agricultural technical efficiency and technology adoption in
Mozambique. Retrieved from ProQuest Digital Dissertations. (AAT 3373253)
United States Agency for International Development, Famine Early Warning System Network.
(2010). Mozambique monthly price bulletin, November 2010. Retrieved from:
http://www.fews.net/Pages/marketcenter.aspx?loc=3&gb=mz&l=en
Verhulst, N., Govaerts, B., Verachtert, E., Castellanos-Navarrete, A., Mezzalama, M., Wall, P.,
… Sayre, K. (2010). Conservation agriculture, improving soil quality in sustainable
production systems. In R. Lal and B. Stewart (Eds.), Food Security and Soil Quality.
Boca Raton, FL: CRC Press.
Vogel, H. (1995). The need for integrated weed management systems in smallholder
conservation farming in Zimbabwe. Der Tropenlandwirt. 96, 35-56.
Wall, P. (2007). Tailoring conservation agriculture to the needs of small farmers in developing
countries: an analysis of issues. Journal of Crop Improvement. 19, 137-155.
World Bank. (2008). World development report. New York: Oxford University Press.
World Health Organization. (2009). Food security. Retrieved from
http://www.who.int/trade/glossary/story028/en/