Constraining cosmological parameters with the X-ray … · 2 Moscardini et al. formalism, one can...
15
arXiv:astro-ph/0009006v2 12 Jun 2001 Mon. Not. R. Astron. Soc. 000, 000–000 (0000) Printed 17 June 2018 (MN L A T E X style file v1.4) Constraining cosmological parameters with the clustering properties of galaxy clusters in optical and X-ray bands L. Moscardini 1 , S. Matarrese 2,3 and H.J. Mo 3 1 Dipartimento di Astronomia, Universit` a di Padova, vicolo dell’Osservatorio 2, I–35122 Padova, Italy 2 Dipartimento di Fisica G. Galilei, Universit` a di Padova, via Marzolo 8, I–35131 Padova, Italy 3 Max-Planck-Institut f¨ ur Astrophysik, Karl-Schwarzschild-Strasse 1, D-85748 Garching, Germany 17 June 2018 ABSTRACT We use a theoretical model to predict the clustering properties of galaxy clus- ters. Our technique accounts for past light-cone effects on the observed cluster- ing and follows the non-linear evolution in redshift of the underlying dark mat- ter correlation function and cluster bias factor. A linear treatment of redshift- space distortions is also included. We perform a maximum-likelihood analysis by comparing the theoretical predictions to a set of observational data, both in the optical (two different subsamples of the APM catalogue and the EDCC catalogue) and X-ray band (RASS1 Bright Sample, BCS, XBACs, REFLEX). In the framework of cold dark matter models, we compute the constraints on cosmological parameters, such as the matter density Ω 0m , the cosmological constant Ω 0Λ , the power-spectrum shape parameter Γ and normalisation σ 8 . Our results show that X-ray data are more powerful than optical ones, allow- ing smaller regions in the parameter space. If we fix Γ and σ 8 to the values suggested by different observational datasets, we obtain strong constraints on the matter density parameter: Ω 0m ≤ 0.5 and 0.2 ≤ Ω 0m ≤ 0.35, for the op- tical and X-ray data, respectively. Allowing the shape parameter to vary, we find that the clustering properties of clusters are almost independent of the matter density parameter and of the presence of a cosmological constant, while they appear to be strongly dependent on the shape parameter. Using the X- ray data only, we obtain Γ ∼ 0.1 and 0.4 ∼ < σ 8 ∼ < 1.1 for the Einstein-de Sitter model, while 0.14 ∼ < Γ ∼ < 0.22 and 0.6 ∼ < σ 8∼ < 1.3 for open and flat models with Ω 0m =0.3. Finally, we use our model to make predictions on the correlation length of galaxy clusters expected in future surveys. In particular, we show the results for an optical catalogue with characteristics similar to the EIS project and for a very deep X-ray catalogue with the characteristics of the XMM/LSS survey. We find that clusters at high redshifts are expected to have larger a correlation length than local ones. Key words: cosmology: theory – galaxies: clusters – large–scale structure of Universe – X-rays: galaxies – dark matter 1 INTRODUCTION Clusters of galaxies are the largest collapsed objects with masses dominated by dark matter. Their proper- ties are largely determined by the gravitational collapse in the cosmological density field, and so their distribu- tion in the Universe depends both on cosmology and on the initial density perturbations. Therefore, the study of the clustering of clusters may provide important di- agnostics for models of structure formation. One impor- tant advantage of using clusters to study the large-scale structure is that their formation in the cosmic density field is relatively easy to understand. Indeed, modern cosmological simulations show that clusters of galaxies may be identified as the most massive dark haloes pro- duced by gravitational collapse, and so their clustering properties are relatively easy to interpret theoretically. In fact, based on an extension of the Press-Schechter formalism, one can obtain an analytical model in which c 0000 RAS
Transcript of Constraining cosmological parameters with the X-ray … · 2 Moscardini et al. formalism, one can...
arX
iv:a
stro
-ph/
0009
006v
2 1
2 Ju
n 20
01Mon. Not. R. Astron. Soc. 000, 000–000 (0000) Printed 17 June 2018 (MN LATEX style file v1.4)
Constraining cosmological parameters with the
clustering properties of galaxy clusters in optical and
X-ray bands
L. Moscardini1, S. Matarrese2,3 and H.J. Mo31Dipartimento di Astronomia, Universita di Padova, vicolo dell’Osservatorio 2, I–35122 Padova, Italy2Dipartimento di Fisica G. Galilei, Universita di Padova, via Marzolo 8, I–35131 Padova, Italy3Max-Planck-Institut fur Astrophysik, Karl-Schwarzschild-Strasse 1, D-85748 Garching, Germany
17 June 2018
ABSTRACT
We use a theoretical model to predict the clustering properties of galaxy clus-ters. Our technique accounts for past light-cone effects on the observed cluster-ing and follows the non-linear evolution in redshift of the underlying dark mat-ter correlation function and cluster bias factor. A linear treatment of redshift-space distortions is also included. We perform a maximum-likelihood analysisby comparing the theoretical predictions to a set of observational data, bothin the optical (two different subsamples of the APM catalogue and the EDCCcatalogue) and X-ray band (RASS1 Bright Sample, BCS, XBACs, REFLEX).In the framework of cold dark matter models, we compute the constraints oncosmological parameters, such as the matter density Ω0m, the cosmologicalconstant Ω0Λ, the power-spectrum shape parameter Γ and normalisation σ8.Our results show that X-ray data are more powerful than optical ones, allow-ing smaller regions in the parameter space. If we fix Γ and σ8 to the valuessuggested by different observational datasets, we obtain strong constraints onthe matter density parameter: Ω0m ≤ 0.5 and 0.2 ≤ Ω0m ≤ 0.35, for the op-tical and X-ray data, respectively. Allowing the shape parameter to vary, wefind that the clustering properties of clusters are almost independent of thematter density parameter and of the presence of a cosmological constant, whilethey appear to be strongly dependent on the shape parameter. Using the X-ray data only, we obtain Γ ∼ 0.1 and 0.4∼< σ8∼
< 1.1 for the Einstein-de Sittermodel, while 0.14∼< Γ∼< 0.22 and 0.6∼< σ8∼
< 1.3 for open and flat models withΩ0m = 0.3. Finally, we use our model to make predictions on the correlationlength of galaxy clusters expected in future surveys. In particular, we show theresults for an optical catalogue with characteristics similar to the EIS projectand for a very deep X-ray catalogue with the characteristics of the XMM/LSSsurvey. We find that clusters at high redshifts are expected to have larger acorrelation length than local ones.
Key words: cosmology: theory – galaxies: clusters – large–scale structure ofUniverse – X-rays: galaxies – dark matter
1 INTRODUCTION
Clusters of galaxies are the largest collapsed objectswith masses dominated by dark matter. Their proper-ties are largely determined by the gravitational collapsein the cosmological density field, and so their distribu-tion in the Universe depends both on cosmology and onthe initial density perturbations. Therefore, the studyof the clustering of clusters may provide important di-agnostics for models of structure formation. One impor-
tant advantage of using clusters to study the large-scalestructure is that their formation in the cosmic densityfield is relatively easy to understand. Indeed, moderncosmological simulations show that clusters of galaxiesmay be identified as the most massive dark haloes pro-duced by gravitational collapse, and so their clusteringproperties are relatively easy to interpret theoretically.In fact, based on an extension of the Press-Schechterformalism, one can obtain an analytical model in which
c© 0000 RAS

2 Moscardini et al.
the dependence of the two-point correlation function ofdark haloes on cosmology and initial power spectrumcan be explicitly seen (Mo & White 1996; Catelan et al.1998; Sheth, Mo & Tormen 2001).
It has been known for some time that the strongobserved correlation of clusters on large scales is verydifficult to reconcile with the standard cold dark mat-ter (CDM) model (White et al. 1987; Dalton et al. 1992;Jing et al. 1993; Mo, Peacock & Xia 1993; Dalton et al.1994; Borgani, Coles & Moscardini 1994; Croft & Efs-tathiou 1994; Borgani et al. 1995). More recently, anal-yses on the constraints by the cluster-cluster correlationfunction on current theoretical models of structure for-mation have been carried out by a number of authors(Eke et al. 1996; Mo, Jing & White 1996; Moscardini etal. 2000a,b; Robinson 2000; Colberg et al. 2000).
In this paper, we use current available observationaldata on the cluster two-point correlation function toconstrain theoretical models of structure formation. Weuse analytical tools well tested by numerical simulationsto make predictions for a large grid of models. Our anal-ysis follows closely that of Mo et al. (1996) and Robin-son (2000). However, there are several important differ-ences. First, we consider new datasets; in particular, weuse data from recent X-ray surveys (see also Moscardiniet al. 2000b). Second, we use improved theoretical mod-els (Matarrese et al. 1997). In particular we pay muchattention to the redshift evolution in the clustering ofclusters and to light-cone and selection effects. Third,we present theoretical predictions for some future sur-veys.
The plan of the paper is as follows. In Section 2we list the observational cluster samples used in thefollowing analysis. Section 3 is devoted to the presen-tation of our theoretical model to estimate the correla-tion of galaxy clusters both in the optical and in theX-ray bands. In Section 4 we present the results ofa maximum-likelihood analysis performed on existingdata and we discuss the constraints on the cosmologicalparameters. In Section 5 we show the predictions of thecorrelation length for possible future surveys. Conclu-sions are drawn in Section 6.
2 CLUSTER SAMPLES
In this section we present the observational data on thegalaxy cluster correlation length that we will use in thefollowing analysis to constrain the cosmological param-eters. A summary of these data is presented in Table1.
2.1 Optical data
As far as the optical band is concerned, we will use forour study the observational results from the analysis byCroft et al. (1997) on the APM cluster redshift surveyand by Nichol et al. (1992) on the Edinburgh-Durhamcluster catalogue (EDCC).
• To construct the APM cluster survey, an auto-mated procedure has been used to select from the an-gular APM galaxy survey the clusters whose redshifts
were later measured. An early sample, containing 364clusters with richness R ≥ 50, called Sample B (Dal-ton et al. 1994), has been created by fixing the limitingmagnitude of the galaxy catalogue to bj = 20.5. A new,richer sample was then obtained by Croft et al. (1997)by extending the limit to bj = 21.0 and considering onlyclusters with richness R ≥ 80. This catalogue (calledSample C) contains 165 objects with redshift cz ≤ 55000km s−1. Even if the clustering study made by Croft etal. (1997), using a maximum-likelihood technique, con-sidered six different subsamples with decreasing clusterdensity, in our statistical analysis we will prefer to usethe results only for the two whole samples B and C.This is done to reduce the possible problems comingfrom the assumption of independence of the differentsamples. This assumption is required by the way wewrite the likelihood (see equation 6). Our final resultswill not be affected by this choice, as shown by the factthat the confidence levels on the cosmological parame-ters obtained using sample B only are almost indistin-guishable from those coming from the complete analysisof the optical datasets. The corresponding mean intra-cluster separations for samples B and C are 30 and 57h−1 Mpc, respectively (h is the value of the local Hubbleconstant H0 in units of 100 km s−1 Mpc−1); the valuesof the correlation lengths r0, of the slope γ of the corre-lation function, and their 1σ errorbars, obtained from amaximum likelihood analysis, are reported in Table 1.
• The EDCC is a machine-based, objectively selectedsample of galaxy clusters consisting of 737 objects of allrichness, over 0.5 sr of sky centred on the South GalacticPole (Lumsden et al. 1992). A subsample of 79 clusters,with at least 22 galaxies inside a radius corresponding to1 h−1 Mpc, with magnitudes between the limits m3 andm3+2 (see Abell 1958 for the definitions) has been spec-troscopically confirmed. The resulting catalogue, with acorresponding mean intracluster separation dc = 46h−1
Mpc, has been used by Nichol et al. (1992) to estimatethe clustering properties. The values of r0 and γ ob-tained from a least-squares fit are reported in Table 1.
2.2 X-ray data
In the following analysis we will consider four differentcatalogues of galaxy clusters selected in the X-ray band:the ROSAT All-Sky Survey 1 (RASS1) Bright Sample,the ROSAT Brightest Cluster Sample (BCS), the X-ray brightest Abell-type cluster sample (XBACs), theROSAT −ESO Flux-limited X-ray sample (REFLEX).Here we list some of their characteristics; more detailscan be found in the original papers.
• The RASS1 Bright Sample (De Grandi et al. 1999a)contains 130 clusters of galaxies selected from theROSAT All-Sky Survey (RASS) data. The cataloguehas an effective flux limit in the (0.5 – 2.0 keV) bandbetween 3.05 and 4 × 10⁻¹² erg cm−2 s−1 over the se-lected area which covers a region of approximately 2.5sr within the Southern Galactic Cap, i.e. δ < 2.5o andb < −20o. For our theoretical predictions we will use theexact sky map of the sample which is presented in Figure2 of De Grandi et al. (1999a). The redshift distribution
c© 0000 RAS, MNRAS 000, 000–000

Clustering properties of galaxy clusters in optical and X-ray bands 3
Table 1. The clustering data (in the optical and X-ray bands) used in the likelihood analysis. Column 1: catalogue name.Column 2: characteristics of the catalogue: for the optical catalogues, the richness R and the mean intracluster distance dc; forthe X-ray catalogues, the limiting luminosity LX or the limiting flux Slim, unless the whole catalogue is analyzed. Column 3:reference for the clustering analysis. Column 4: number of clusters in the catalogue nc. Columns 5, 6 and 7: correlation lengthr0 (in h−1 Mpc), the slope of the correlation function γ and the corresponding confidence levels of the quoted errorbars.
Catalogue Characteristics Reference nc r0 (h−1 Mpc) γ Errorbars
Optical band:
APM Sample B R ≥ 50, dc = 30 h−1 Mpc Croft et al. (1997) 364 14.2+0.4−0.6 2.13+0.09
−0.06 1σ
APM Sample C R ≥ 80, dc = 57 h−1 Mpc idem 110 18.4+2.2−2.4 1.7+0.3
−0.3 1σ
EDCC dc = 46 h−1 Mpc Nichol et al. (1992) 79 16.4 ± 4.0 2.1± 0.3 1σ
X-ray band:
RASS1 Bright Sample whole catalogue Moscardini et al. (2000a) 130 21.5+3.4−4.4 2.11+0.53
−0.56 2σ
BCS LX ≥ 0.24× 1044h−2 erg s−1 Lee & Park (1999) 33 33.0+6.2−5.9 1.82+0.49
−0.50 1σ
XBACs whole catalogue Borgani et al. (1999) 203 26.0 ± 4.5 1.98+0.35−0.53 2σ
REFLEX Slim = 3× 10⁻¹² erg cm−2 s−1 Collins et al. (2000) 449 18.8 ± 0.9 1.83+0.15−0.08 1σ
has a tail up to z ≃ 0.3 but the majority of the clus-ters have z < 0.1. Moscardini et al. (2000a) found thatthe two-point correlation function of the whole sampleis well fitted by a power-law with r0 = 21.5+3.4
−4.4h−1 Mpc
and γ = 2.11+0.53−0.56 (95.4 per cent confidence level with
one fitting parameter).
• The BCS catalogue (Ebeling et al. 1998) is an X-ray selected, flux-limited sample of 201 galaxy clusterswith z ≤ 0.3 drawn from the RASS data in the north-ern hemisphere (δ ≥ 0o) and at high Galactic latitude(|bII | ≥ 20o). The limiting flux is Slim = 4.45 × 10⁻¹²
erg cm−2 s−1 in the (0.1–2.4) keV band. Since the sky-coverage Ωsky(S) of BCS is not available, we will useΩsky(S) = const ≃ 4.13 steradians for fluxes largerthan Slim. Lee & Park (1999) analyzed the cluster-ing properties of this catalogue using four differentvolume-limited subsamples. For simplicity, in the fol-lowing analysis we will consider only the catalogue withLX ≥ 0.24 × 1044h−2 erg s−1 and a limiting redshiftof z = 0.07. The correlation function in this case is fit-ted by a power-law with r0 = 33.0+6.2
−5.9h−1 Mpc and
γ = 1.82+0.49−0.50 (68.3 per cent confidence level with one
fitting parameter). We checked that the inclusion of thedeeper subsamples produced very small changes in ourlikelihood analysis.
• The XBACs catalogue (Ebeling et al. 1996) is anall-sky X-ray sample of 242 Abell galaxy clusters ex-tracted from the RASS data. Being optically selected,it is not a complete flux-limited catalogue. The sam-ple covers high Galactic latitudes (|bII | ≥ 20o). Theadopted limiting flux is Slim = 5 × 10⁻¹² erg cm−2
s−1 in the (0.1–2.4) keV band. Also in this case, sincethe actual sky coverage is not available, we will adoptΩsky(S) = const ≃ 8.27 steradians for fluxes larger thanSlim. The aforementioned selection effects produce a lu-minosity function for XBACs which is much lower in thefaint part than that obtained from other catalogues (e.g.Ebeling et al. 1997; Rosati et al. 1998; De Grandi et al.1999b). We take into account this incompleteness in ourmodel following the same method described in Moscar-dini et al. (2000b). The clustering properties of this cat-
alogue have been studied by different authors. Abadi,Lambas & Muriel (1998) found for the whole cataloguea correlation length r0 = 21.1+1.6
−2.3h−1 Mpc (1σ errorbar)
and a slope γ = −1.92. Borgani, Plionis & Kolokotro-nis (1999) analyzed the same sample finding a somewhatlarger correlation amplitude: r0 = 26.0+4.1
−4.7h−1 Mpc and
γ = 1.98+0.35−0.53 (95.4 per cent confidence level with one
fitting parameter). The difference between these two es-timates is probably due to a different assumption onthe errors. Since the maximum-likelihood approach ismore robust than the quasi-Poisson assumption madeby Abadi et al. (1998), we prefer to use in the followinganalysis the results obtained by Borgani et al. (1999).
• The REFLEX survey (Bohringer et al. 1998) isa large sample of optically confirmed X-ray clustersselected from RASS. The sample includes 452 X-rayselected clusters in the southern hemisphere, at highGalactic latitude (|bII | ≥ 20o). For our computations,we use the actual sky coverage given in Figure 1 ofCollins et al. (2000). Using a catalogue with a limitingflux of 3× 10⁻¹² erg cm−2 s−1 (defined in the 0.1 – 2.4keV energy band), where the sky coverage falls to 97.4per cent of the whole surveyed region (4.24 steradians),Collins et al. (2000) found that the two-point correlationfunction is fitted by a power-law with r0 = 18.8±0.9h−1
Mpc and γ = 1.83+0.15−0.08 (68.3 per cent confidence level
from a maximum-likelihood analysis). As for the APMsubsamples at higher richness, in our analysis we prefernot to use the clustering results for the REFLEX sub-samples at higher luminosities, also discussed in Collinset al. (2000).
3 THEORETICAL MODELS FOR THE
CORRELATION FUNCTION
Our theoretical predictions for the spatial two-point cor-relation function of galaxy clusters in different cosmo-logical models have been here obtained by using an up-dated version of the method presented in Moscardiniet al. (2000a,b), where the application was limited to
c© 0000 RAS, MNRAS 000, 000–000

4 Moscardini et al.
X-ray selected clusters. Here we will give only a shortdescription of the method and we refer to those papersfor a more detailed discussion.
3.1 Clustering in the past-light cone
Matarrese et al. (1997; see also Moscardini et al. 1998and Yamamoto & Suto 1999 and references therein) de-veloped an algorithm to describe the clustering in ourpast light-cone taking into account both the non-lineardynamics of the dark matter distribution and the red-shift evolution of the bias factor. The final expressionfor the observed spatial correlation function ξobs in agiven redshift interval Z is
ξobs(r) =
∫
Zdz1dz2N (z1)N (z2) ξobj(r; z1, z2)
[∫
Zdz1N (z1)
]2, (1)
where N (z) ≡ N (z)/r(z) and N (z) is the actual red-shift distribution of the catalogue. In the previous for-mula ξobj(r, z1, z2) represents the correlation functionof pairs of objects at redshifts z1 and z2 with comovingseparation r. An accurate approximation for it is givenby
ξobj(r, z1, z2) ≈ beff(z1)beff(z2)ξm(r, zave) , (2)
where ξm is the dark matter covariance function andzave is a suitably defined intermediate redshift.
Another important ingredient entering the previousequation is the effective bias beff which can be expressedas a weighted average of the ‘monochromatic’ bias factorb(M, z) of objects of some given intrinsic property M(like mass, luminosity, etc):
beff(z) ≡ N (z)−1
∫
M
d lnM ′ b(M ′, z) N (z,M ′) , (3)
where N (z,M) is the number of objects actually presentin the catalogue with redshift in the range z, z+dz andM in the range M, M + dM , whose integral over lnMis N (z).
As galaxy clusters are expected to form by the hi-erarchical merging of smaller mass units, one can fullycharacterize their properties by the mass M of theirhosting dark matter haloes at each redshift z. One canthen estimate their comoving mass function n(z,M) bythe Press-Schechter (1974) formula and adopt the Mo &White (1996) relation for the monochromatic bias. Ac-tually, we use the relations recently introduced by Sheth& Tormen (1999) and Sheth, Mo & Tormen (2001),which have been shown to produce a more accurate fitof the distribution of the halo populations in numericalsimulations (Jenkins et al. 2001).
To complete our model we need a technique to com-pute the redshift evolution of the dark matter covariancefunction ξm. For this, we use the fitting formula by Pea-cock & Dodds (1996), which allows to evolve ξm intothe fully non-linear regime.
3.2 From the catalogue characteristics to the
halo mass
In order to predict the abundance and clustering ofgalaxy clusters in the different catalogues describedabove (both in the optical and X-ray bands) we needto relate the sample characteristics to a correspondinghalo mass at each redshift.
For the optical catalogues, the various samples ofAPM and EDCC considered by Croft et al. (1997) andNichol et al. (1992) respectively, are characterized by adifferent cluster number density (see Table 1). In thiscase, for each cluster subsample, we fix the minimummass (which in our model represents the lower limit ofthe integral in equation 3) of the hosting dark matterhaloes in such a way that the comoving cumulative massfunction reproduces the number density of clusters inthe range of redshift sampled by the original catalogues.
For X-ray selected clusters, we use a different ap-proach (see Moscardini et al. 2000a,b and Suto et al.2000). In this case it is quite easy to relate the limit-ing flux (and/or eventually the limiting luminosity, asrequired for instance by the BCS subsample that weconsider) to the minimum halo mass. In fact the fluxS in a given band corresponds to an X-ray luminosityLX = 4πd2LS in the same band, where dL is the luminos-ity distance. The quantity LX can be converted into thetotal luminosity Lbol by performing band and bolomet-ric corrections (we assume an overall ICM metallicityof 0.3 times solar). Local observations suggest that thecluster bolometric luminosity is related to the tempera-ture by a simple relation: T = A LB
bol, where the temper-ature is expressed in keV and Lbol is in units of 1044h−2
erg s−1. We assume A = 4.2 and B = 1/3, which are agood representation of the data with T∼
> 1 keV (e.g.Markevitch 1998 and references therein). Below thistemperature (i.e. for galaxy groups) the Lbol − T re-lation has much steeper a slope: for this reason we set aminimum temperature at T = 1 keV. Recent analyses ofcluster temperature data at higher redshifts (Mushotzky& Scharf 1997; Donahue et al. 1999) are consistent withno evolution in the Lbol − T relation out to z ≈ 0.4.Therefore, we can safely assume that the previous re-lation holds true in the redshift range sampled by theconsidered catalogues. Moscardini et al. (2000b), whoallowed a moderate redshift evolution of the Lbol − Tto reproduce the observed logN–log S relation, showedthat the clustering properties are only slightly sensitiveto this assumption. To convert the cluster temperatureinto the mass of the hosting dark matter halo, we assumevirial isothermal gas distribution and spherical collapse:T ∝ M2/3E2/3(z)∆vir(z)
1/3, where ∆vir represents themean density of the virialized halo in units of the criticaldensity at that redshift and E(z) is the ratio betweenthe value of the Hubble constant at redshift z and to-day. Once the relation between observed flux and halomass at each redshift is established we have to accountfor the catalogue sky coverage Ωsky(S) (when available)to predict the redshift distribution.
c© 0000 RAS, MNRAS 000, 000–000

Clustering properties of galaxy clusters in optical and X-ray bands 5
3.3 Redshift distortions
We include the effect of redshift-space distortions usinglinear theory and the distant-observer approximation(Kaiser 1987). Under these assumptions the enhance-ment of the redshift-space averaged power spectrum isapproximately 1+2β/3+β2/5, where β ≃ Ω0.6
0m/beff . Wefind that the total effect of redshift distortions on thevalue of the correlation length is always smaller than 10per cent.
4 RESULTS
4.1 Cosmological models
In what follows we use a maximum-likelihood analysisto constrain the main parameters defining a cosmolog-ical model. We will consider a set of structure forma-tion models all belonging to the general class of colddark matter (CDM) ones, for which the linear power-spectrum reads Plin(k, 0) ∝ knT 2(k), with T (k) theCDM transfer function (Bardeen et al. 1986)
T (q) =ln (1 + 2.34q)
2.34q× [1 + 3.89q +
(16.1q)2 + (5.46q)3 + (6.71q)4]−1/4 , (4)
where q = k/hΓ. The shape parameter Γ depends on theHubble parameter h, on the matter density Ω0m and onthe baryon density Ω0b (Sugiyama 1995):
Γ = Ω0mh exp(−Ω0b −√
h/0.5 Ω0b/Ω0m) . (5)
We fix the spectral index n to unity and we allowΓ to vary in the range 0.05–0.5, while Ω0m ranges from0.1 to 1 in the framework of both open and flat models,with a cosmological constant contributing to the totaldensity with Ω0Λ = 1 − Ω0m. Finally, we use differentnormalisations of the primordial power-spectrum, pa-rameterized by σ8 (the r.m.s. fluctuation amplitude ina sphere of 8h−1 Mpc) in the range 0.2 ≤ σ8 ≤ 2.
In summary, the cosmological models we considerare defined by four parameters: Ω0m, Ω0Λ, Γ and σ8.
4.2 Maximum likelihood analysis
Confidence levels for the cosmological parameters areobtained through a maximum likelihood analysis. Thelikelihood is L ∝ exp(−χ2/2), where
χ2 =
Ndata∑
i=1
[r0(i)− r0(i; Ω0m,Ω0Λ,Γ, σ8)]2
σ2r0(i)
. (6)
The sum runs over the observational dataset describedin Section 2, i.e. Ndata = 3 and Ndata = 4 for the opticaland X-ray bands, respectively. The quantities r0(i) andσr0(i) represent the values of the correlation length andits 1σ errorbar for each catalogue, as reported in Table1; r0(i; Ω0m,Ω0Λ,Γ, σ8) is the corresponding theoreticalprediction obtained with a given choice of cosmologicalparameters. Note that the observed correlation lengthsreported in Table 1 have been obtained using differentfitting methods (least-squares or maximum-likelihood
analyses) and over different spatial scales in ways whichcould be inconsistent with each other. Moreover, thequoted values of r0 come from fits of the data where alsothe values of the slope are marginalized and it is knownthat there is significant covariance between r0 and γ.In spite of this, we prefer not to estimate r0 throughthe standard power-law fit procedure with two param-eters, because in the case of the maximum-likelihoodanalyses the comparison would not be appropriate. Forthese reasons we define the predicted correlation lengthas the distance where the two-point correlation functionis unity. However, in all cases we also checked that thevalues of the slope γ obtained from the power-law fitare well inside the observed 1σ errorbar. This ensuresthat the effect of the different definition of r0 is small.Finally, we note that equation 6 assumes that the dif-ferent data are uncorrelated. This is expected to be afair assumption, especially for the X-ray data, whichcome from different catalogues. In the case of the opti-cal datasets, some larger correlation is probably presentbetween the APM samples, due to the presence of com-mon objects in the two catalogues. However, we willshow that we obtain almost identical conclusions aboutthe confidence levels for the cosmological parametersconsidering the APM sample B only or the whole set ofoptical catalogues. This shows that the assumption ofindependence which underlies our likelihood analysis isnot essential for the results.
Finally, the best-fit cosmological parameters are ob-tained by maximizing L, i.e. by minimizing χ2. The 95.4and 99.73 per cent confidence levels for the parametersare computed by finding the region corresponding to anincrease ∆χ2 with respect to the minimum value of χ2:the exact value of ∆χ2 depends on the given number ofdegrees of freedom νf .
A similar analysis has been very recently performedby Robinson (2000), who used a simplified version ofthe above model and considered only APM data (all sixsubsamples). Wherever the comparison is possible, theresults are qualitatively similar, but some quantitativedifferences are present. These differences can be ascribedto a different definition of the effective bias and, aboveall, to the absence of any account of the past-light coneeffects in his analysis.
We start our analysis by considering as a free pa-rameter Ω0m only. We fix Γ = 0.2, which is in therange suggested by different works (see e.g. Peacock& Dodds 1996), and σ8 to reproduce the cluster abun-dance. For the normalization we adopt the fitting for-mula by Viana & Liddle (1999), who revised the Henry& Arnaud (1991) dataset of cluster X-ray temperaturesand included a treatment of measurement errors. Theirformula reads
σ8 = 0.56Ω−C0m , (7)
where C = 0.34 and C = 0.47 for open and flat mod-els, respectively. The claimed accuracy of this expres-sion is better than 3 per cent for Ω0m between 0.1and 1. The results of our maximum likelihood analy-sis obtained by using the complete set of cataloguesare shown for flat models by heavy solid lines in Fig-ure 1. The corresponding results for open models (not
c© 0000 RAS, MNRAS 000, 000–000

6 Moscardini et al.
Figure 1. The variation of ∆χ2 around the best-fitting value of the matter density parameter Ω0m for flat CDM models withshape parameter Γ = 0.2 and normalization reproducing the cluster abundance. The left panel refers to the results obtainedusing the optical dataset, while the right one refers to the dataset in the X-ray band. The heavy solid lines correspond tothe results obtained using the complete cluster datasets, the light dotted ones refer to results obtained using only the largestcatalogue (APM sample B and REFLEX, for optical and X-ray bands, respectively). Horizontal lines corresponding to the 95.4and 99.73 per cent confidence levels are also shown.
shown here) are very similar. The left panel refer tothe analysis of the optical catalogues. In this case theminimum of χ2 is in the range Ω0m = 0.2 − 0.3 andwe find Ω0m∼
< 0.5 and Ω0m∼< 0.7 at 95.4 and 99.73 per
cent levels, respectively. The results for the X-ray cat-alogues are shown in the right panel. Also in this casethe most likely value for Ω0m is 0.2-0.3 but the allowedregions are much smaller, i.e. the X-ray data on the cor-relation length give tighter constraints: 0.2∼
< Ω0m∼< 0.35
and 0.2∼< Ω0m∼
< 0.45 at 95.4 and 99.73 per cent levels,respectively. This result is in qualitative agreement withour previous analyses, where we found that an Einstein-de Sitter model can be rejected because it predicts toolow a correlation function for the RASS1 and XBACscatalogues (Moscardini et al. 2000a,b).
In order to understand which subsamples con-tribute to the constraints, we repeat the same analysisusing in both the optical and X-ray cases the largestcatalogues, i.e. APM sample B and REFLEX. The cor-responding curves are shown in the relative panels aslight dotted lines. Unlike the case of the optical cata-logues where very small differences are found, the con-straints obtained using REFLEX only are less tight:0.2∼
< Ω0m∼< 0.5 and 0.2∼
< Ω0m∼< 0.6 at 95.4 and 99.73
per cent levels, respectively. This shows the importanceof including in the analysis the subsamples at higherX-ray luminosities.
In Figure 2 we show the results of our maximumlikelihood analysis when we only fix the model normal-isation to reproduce the cluster abundance, leaving twofree parameters: Ω0m and Γ.
The upper panels refer to the analysis of the opti-cal catalogues. Confidence levels are shown separately
for flat (left panels) and open (right panels) models.Here νf = 2, i.e. ∆χ2 = 6.17 and 11.8, for 95.4 and99.73 per cent levels, respectively. The allowed regions,at least for values of the density parameter Ω0m∼
> 0.4,appear to strongly depend only on Γ. The data sug-gest Γ ∼ 0.15 ± 0.05 (errorbars are at 3σ level), bothfor open and flat models. At smaller Ω0m, the re-sulting values of Γ are larger, especially for modelswith non-zero cosmological constant. For instance, forΩ0m = 0.2 we find Γ ∼ 0.24+0.10
−0.08 for flat models, andΓ ∼ 0.20+0.06
−0.06 for open ones. The centre of the al-lowed region gives a relation between Γ and Ω0m, namelyΓ = 0.382−0.797Ω0m+1.029Ω2
0m−0.478Ω30m for the flat
models and Γ = 0.215−0.079Ω0m−0.064Ω20m+0.069Ω3
0m
for the open models.
The lower panels present the results obtained forthe X-ray catalogues. Even if the allowed regions arequalitatively compatible with those displayed by theoptical analysis, we notice some differences. First, the2- and 3σ regions are narrower, i.e. the X-ray data onthe correlation length give tighter constraints on thecosmological parameters. Once again, the Ω0m depen-dence is small for high-density models: we find Γ inthe range 0.1-0.15 (3σ confidence levels) for Ω0m∼
> 0.5,with no dependence on the presence of a cosmologi-cal constant. Again, models with low matter densityfavour larger values of Γ, between 0.2 and 0.3. The re-lations describing the centre of the allowed region areΓ = 0.487−1.342Ω0m +1.687Ω2
0m −0.73Ω30m for the flat
models and Γ = 0.394−0.933Ω0m+1.084Ω20m−0.44Ω3
0m
for the open models.
Note that, combining the optical and X-ray dataaltogether, the allowed regions in the parameter space
c© 0000 RAS, MNRAS 000, 000–000

Clustering properties of galaxy clusters in optical and X-ray bands 7
Figure 2. Confidence contours (95.4 and 99.73 per cent confidence levels; light and heavy solid lines, respectively) of Γ andΩ0m for CDM models with normalization reproducing the cluster abundance. The left panels refer to flat cosmological modelswith varying cosmological constant Ω0Λ = 1 − Ω0m; the right ones to open models with vanishing Ω0Λ. The upper row showsthe results obtained using the optical dataset, while the lower one refers to the dataset in the X-ray band. The results obtainedusing only the largest subsamples (APM sample B for the optical case, REFLEX for the X-ray band one) are shown by lightand heavy dotted lines (95.4 and 99.73 per cent confidence levels, respectively).
(not reported in the Figure) are very similar to thoseobtained in the analysis of the X-ray catalogues only,showing once again that these data have larger discrim-inating power.
Also in this case we checked the robustness of theresults when only the largest catalogues are used in theanalysis. The results, presented by dotted lines, showthat the confidence regions obtained using the APMsample B are very similar to those obtained using allthree optical catalogues. On the contrary, when we usethe REFLEX catalogue only, the resulting allowed re-gions, even if compatible with those obtained using also
the catalogues at higher X-ray luminosity, appear to belarger. For instance, values of Γ as large as 0.4 cannotbe excluded if the matter density parameter is small(Ω0m∼
< 0.2).
In Figure 3 we present the constraints in the Γ−σ8
plane, once the values for Ω0m and Ω0Λ are fixed (i.e.νf = 2). We consider an Einstein-de Sitter model, anopen model with Ω0m = 0.3 and a flat model, alwayswith Ω0m = 0.3. Again the upper panels refer to theoptical data. The confidence limits are quite similar forthe three cosmological models, confirming once againthe weak dependence on the density parameter. These
c© 0000 RAS, MNRAS 000, 000–000

8 Moscardini et al.
Figure 3. Confidence contours (95.4 and 99.73 per cent confidence levels; light and heavy solid lines, respectively) of Γ andσ8 for CDM models with (Ω0m,Ω0Λ) = (1, 0) (left panels), (0.3,0) (central panels) and (0.3,0.7) (right panels). The upper rowshows the results obtained using the optical dataset, while the lower one refers to the X-ray dataset. The results obtained usingonly the largest subsamples (APM sample B for the optical case, REFLEX for the X-ray band one) are shown by light andheavy dotted lines (95.4 and 99.73 per cent confidence levels, respectively).
results can be directly compared to the analysis madeby Robinson (2000; its Figure 3): the agreement is good,even if at a given value of σ8 slightly larger values of Γare allowed in our analysis.
The lower panels refer to the X-ray data andshow the strongest constraints coming from these data.For example, for the Einstein-de Sitter model only asmall region with values of Γ quite close to 0.1 and0.4∼
< σ8∼< 1.1 is allowed. The confidence limits obtained
in the case of open and flat models with Ω0m = 0.3 aresimilar and are consistent with the analysis of the op-tical data, but the allowed region is narrower: the 2σregion has Γ in the range 0.14-0.22 and σ8 between 0.6
and 1.3 for the open model, while 0.16∼< Γ∼
< 0.22 and0.7∼
< σ8∼< 1.3 for the flat model.
Again the combination of optical and X-ray cat-alogues produces results almost indistinguishable fromthose obtained by the X-ray analysis only. The maindifference is the further reduction of the allowed regionin the case of the Einstein-de Sitter model: in this casewe find Γ ∼ 0.1 and 0.45∼
< σ8∼< 0.6.
When the analysis is limited to the largest cata-logues, again no significant differences are found be-tween the confidence regions allowed by the APM sam-ple B and the complete set of optical catalogues. On thecontrary, the results for the X-ray catalogues show that
c© 0000 RAS, MNRAS 000, 000–000

Clustering properties of galaxy clusters in optical and X-ray bands 9
the inclusion in the analysis of the shallower cataloguesallows to reduce the confidence regions, excluding highvalues of Γ and σ8.
In conclusions, the previous results show that theconstraints coming from the X-ray datasets are in gen-eral tighter than those obtained from the optical data.This is also evident from the analysis limited to thelargest corresponding catalogues (APM sample B andREFLEX). At first glance this is unexpected. In fact theerrorbars of the correlation length r0 for the APM sam-ple B are smaller than the REFLEX ones (see Table 1)and consequently their weights in the χ2 estimates arelarger. However, the galaxy clusters belonging to theX-ray datasets typically have a mass larger than theoptical ones. In fact the density of the present opticalclusters requires a minimum mass smaller than that ob-tained from the limiting fluxes of the X-ray catalogueshere considered. Since the bias factor entering in thecorrelation estimates is strongly dependent on the mass(see, for example, the discussion in Moscardini et al.2000b), this difference in mass produces a large spreadof the r0 values predicted for different cosmological mod-els, increasing the constraining ability of the results. Fora similar reason, the inclusion in our analysis of otherX-ray datasets besides REFLEX, even if with a smallernumber of objects and with larger errorbars, helps inreducing the allowed regions in the parameter space. Infact these catalogues have a larger limiting flux thanREFLEX and sample the cluster population at highermass.
5 PREDICTIONS FOR FUTURE SURVEYS
5.1 The catalogues
In this section we will use our model to predict the corre-lation length expected in possible future surveys both inthe optical and X-ray bands. Thanks to their depth, inthese surveys it would be possible to obtain informationon the high-redshift behaviour of the cluster two-pointfunction. For this reason we present our predictions di-viding the data in two different redshift bins (z ≤ 0.3and z > 0.3), to allow a discussion of the redshift evo-lution of cluster clustering.
In the optical band, a large improvement of ourknowledge on the properties of the large-scale structureas traced by galaxy clusters will be obtained when theSloan Digital Sky Survey (SDSS; York et al. 2000) willbe completed. This survey, which covers an area threetimes larger than the APM, will contain redshifts for ap-proximately one million galaxies. The expected numberof galaxy clusters having at least 100 redshift measure-ments is approximately 1000. Moreover, the availabilityof 5 × 10⁷ galaxies in the photometric data (completeto a magnitude limit of r’=22) will allow the applica-tion of automated cluster-finding algorithms (e.g. thematched-filter approach), to extend the cluster cata-logue to higher redshifts. In its final form the SDSSis expected to be nearly as deep as two existing cat-alogues, the Palomar Distant Cluster Survey (PDCS;Postman et al. 1996; Holden et al. 1999) and the ESO
Imaging Survey (EIS; Olsen et al. 1999; Scodeggio et al.1999), which however are much smaller, covering only5.1 and 14.4 square degrees, respectively. These two cat-alogues have been built to find good distant candidatesfor successive more detailed observations and cannot beconsidered complete and well-defined samples suitablefor statistical studies. Nevertheless, considering the ex-tended versions of these catalogues, the number densityof candidates and the corresponding estimated redshiftdistributions are compatible. For these reasons we de-cided to use their characteristics to define the propertiesof a possible future cluster survey in the optical band.In particular, we use the number density measured forthe EIS catalogue, which consists of 304 objects in theredshift range 0.2∼
< z∼< 1.3, with a median redshift of
z ∼ 0.5. The redshifts have been estimated by applyingthe matched-filter algorithm (Postman et al. 1996) andhave an intrinsic uncertainty of at least ∆z = 0.1. Alarge effort began to validate these cluster candidates.Preliminary results (da Costa et al. 2000; Ramella et al.2000) show that more than 65 per cent of the studiedcandidates have strong evidence of being real physicalassociations. Moreover, first direct spectroscopic deter-minations of redshifts are in reasonable agreement withthose derived from the matched-filter algorithm, with apossible systematic difference of ∆z ∼ 0.1. We will com-pute the predictions of the clustering properties of thiscatalogue by fixing the minimum mass needed to repro-duce the EIS cluster density for z ≤ 0.3 and z > 0.3.This choice automatically takes into account the pos-sibility that false candidates are included in the EIScatalogue by reducing the required minimum mass. Asa consequence, the estimated correlation function willrefer to the objects targeted as candidates and not tothe real clusters which will be actually validated usingspectroscopic techniques. The underlying assumption isthat the failure of the technique used to select the candi-dates comes from the inclusion in the catalogue of high-luminosity systems with a mass just below the minimummass of the true EIS clusters.
In the X-ray band, the existing cluster clusteringstudies were expected to be largely overcome by thedata that the ABRIXAS satellite (Trumper, Hasinger& Staubert 1998) was expected to collect, startingfrom mid 1999. Unluckily, problems with energy sup-ply caused the untimely loss of the satellite at the endof April 1999. In the plans, the ABRIXAS cataloguewould have covered an area of 8.27 steradians up to alimiting flux of Slim = 5 × 10⁻¹³ erg cm−2 s−1 in the0.5–2 keV band. These characteristics have been usedby Moscardini et al. (2000b) to make predictions of thecluster two-point correlation function.
More recently, it has been proposed to use the veryhigh sensitivity and good point-spread function of theXMM/Newton satellite, successfully launched in De-cember 1999, to build a very deep large-scale structuresurvey. The idea is to cover a region of 64 square degreesat high galactic latitude using 24×24 10ks XMM/EPICpointings separated by 20 arcmin offsets. The expectedlimiting flux will be approximately Slim = 5×10⁻¹⁵ ergcm−2 s−1 in the 0.5–2 keV band, which is 500 timesmore sensitive than the REFLEX one (see Pierre 2000
c© 0000 RAS, MNRAS 000, 000–000

10 Moscardini et al.
for more details). We predict the clustering properties ofthis sample using a constant sky coverage (in absence ofreal estimates) and assuming the previous limiting flux.Hereafter this sample will be called XMM/LSS.
5.2 Results
In Figure 4 we show the predicted value of the correla-tion length for future surveys in the optical band (EIS)and in the X-ray band (XMM/LSS) as a function ofthe present matter density content Ω0m. Here we con-sider only CDM models with σ8 fixed to reproduce thecluster abundances (see equation 7) and we allow the Γparameter to assume values from 0.1 to 0.5. The resultsare shown separately for clusters having z ≤ 0.3 (upperpanels) and z > 0.3 (lower panels). As a general result,we find that the presence of a cosmological constant in-creases the correlation length by a factor always smallerthan 15 per cent. Once again we find that the depen-dence on the shape parameter Γ is strong: the higherΓ, the lower the predicted correlation length. On thecontrary varying the matter density parameter, once Γis fixed, changes r0 only by a factor of at most 20 percent. More precisely, we find a slight decrease of the cor-relation length with increasing Ω0m. All the catalogues,both in optical and in X-ray bands, display a positiveredshift evolution of the clustering, i.e. the estimates ofr0 are larger for clusters at high redshifts. This result,which confirms a previous analysis by Moscardini et al.(2000b), is due to the large increase of the bias factorwith redshift; this increase overcompensates the corre-sponding decrease of the dark matter correlation func-tion. In fact, considering high redshifts, galaxy clustersbecome rarer objects, connected to higher density fluc-tuations.
The relatively low values of the predicted correla-tion length for the EIS catalogue show that its clus-ter number density corresponds to objects with a smallmass, with some possible contamination coming fromfalse candidates, which would reduce the amplitude ofthe expected clustering.
Finally, we notice that the XMM/LSS sample hassmaller r0 than the ABRIXAS survey considered in ourprevious analysis (Moscardini et al. 2000b). Moreoverthe increase of clustering with redshift is less evidentfor the XMM/LSS sample than for the ABRIXAS cat-alogue. This is what we expect: when the limiting fluxis decreased, a large number of small clusters enter inthe catalogue, resulting in a smaller correlation function(see also Moscardini et al. 2000b).
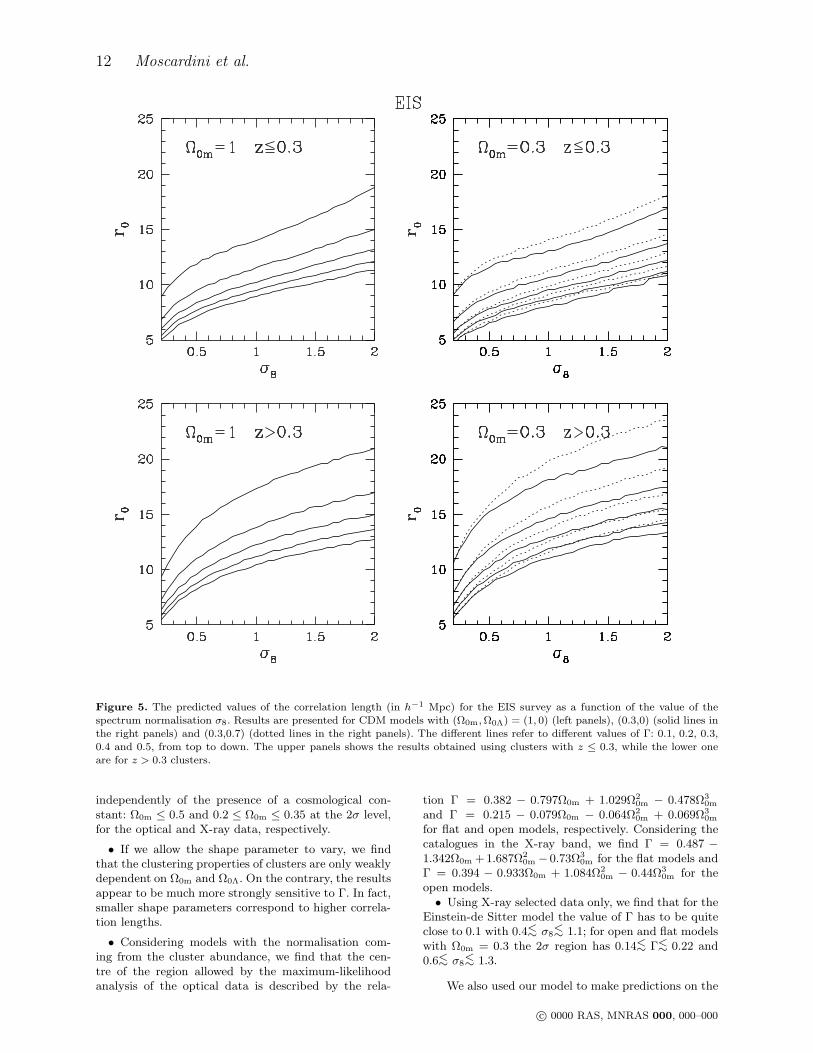
Figure 5 shows the predicted correlation length forthe EIS catalogue when the geometry of the universe isfixed and the values of Γ and σ8 are varied. We considerhere the Einstein-de Sitter model and the open and flatmodels with Ω0m = 0.3. The small differences in thecorresponding results confirm the slight dependence onthe cosmology chosen. We find that, at a given σ8, r0 isa decreasing function of Γ, while, fixing Γ, r0 is alwaysan increasing function of σ8.
A similar analysis has been performed using thecharacteristics of the XMM/LSS survey. Comparing theresults, shown in Figure 6, with the EIS ones, we can
notice that the σ8-dependence of r0 is different: for verysmall normalisations, the correlation length is a decreas-ing function of σ8. This effect is due to the decrease ofthe effective bias, which is more rapid than the growthof the dark matter correlation function.
It is interesting to note that, given a cosmologicalmodel, the predicted values of the correlation length forEIS and XMM/LSS are quite different, but the spreadof r0 obtained in different cosmological models is ex-pected to be of the same order of magnitude for the twocases. Unfortunately this does not allow to understandwhether future X-ray or optical surveys will better con-strain cosmological parameters.
Another important issue to be discussed is the con-straining ability of the clustering analysis with respectto the standard analysis based on cluster counts.
In Figure 7 we show the expected number of galaxyclusters in the XMM/LSS survey as a function of thespectrum normalisation σ8. Results refer to the samecosmological models presented in the previous figures.We notice that these numbers are obtained directly fromthe model described above and do not pretend to re-produce the observed logN − log S relation for clus-ters. To this aim it would be necessary to introduce anad-hoc redshift evolution of the temperature-luminosityrelation with one more parameter (see Section 3.2 andthe discussion in Moscardini et al. 2000b). As alreadyknown, the results show a strong dependence on σ8 anda relatively weak dependence on Γ. For instance, usingthe values of the normalisation suggested by equation7, the change in the predicted number of clusters for0.1 ≤ Γ ≤ 0.3 (which includes the values suggested bya set of other observational data, see e.g. Peacock &Dodds 1996) is at most 50 per cent. If we analyse Fig-ure 6 we find that with the same assumptions (σ8 fromcluster abundances and 0.1 ≤ Γ ≤ 0.3) the correlationlength has a 100 per cent variation. This result allows usto conclude that clustering studies are a good comple-mentary tool to determine the cosmological parameters.In particular, once the normalisation σ8 is constrainedby other observational data (i.e. cluster counts, clusterluminosity function or cosmic microwave background),it is quite useful in fixing the shape parameter Γ.
6 CONCLUSIONS
In this paper we discussed the model constraints thatit is possible to infer from the analysis of the observa-tional data on the clustering of galaxy clusters. A setof 3 optical (coming from the APM and EDCC cata-logues) and 4 X-ray catalogues (RASS1 Bright Sample,BCS, XBACs, REFLEX) has been considered. The the-oretical predictions for the different cosmological mod-els have been obtained by using a model which accountsfor the clustering of observable objects in our past light-cone and for the redshift evolution of both the under-lying dark matter covariance function and the clusterbias factor. A linear treatment of redshift-space dis-tortions has been also included. In the case of X-rayselected clusters we followed the approach of Moscar-dini et al. (2000b), which makes use of theoretical and
c© 0000 RAS, MNRAS 000, 000–000

Clustering properties of galaxy clusters in optical and X-ray bands 11
Figure 4. The predicted value of the correlation length (in h−1 Mpc) for different future surveys in the optical band (EIS, leftcolumn) and in the X-ray band (XMM/LSS, left column) as a function of the present matter density content Ω0m. Results arepresented for CDM models with normalization fitted to reproduce the cluster abundance. The different lines refer to differentvalues of the Γ parameter: 0.1, 0.2, 0.3, 0.4 and 0.5, from top to bottom. Dotted lines: flat cosmological models (i.e. withnon-zero cosmological constant); solid ones: open models with vanishing Ω0Λ. The upper panels show the results obtained usingclusters with z ≤ 0.3, while the lower ones are for z > 0.3 clusters.
empirical relations between mass, temperature and X-ray luminosity to convert the limiting flux of cataloguesinto a corresponding minimum mass for the dark mat-ter haloes hosting the clusters. In the optical band, weused the mean distance (i.e the number density) of theobserved clusters to fix the minimum mass required bythe model.
Our theoretical predictions have been comparedwith the observed correlation lengths by means of amaximum-likelihood analysis. We considered cosmolog-ical models belonging to the cold dark matter class, de-fined by four parameters: the closure density in dark
matter and vacuum energy (Ω0m and Ω0Λ, respectively);the power-spectrum shape parameter Γ and normalisa-tion σ8.
Our main results can be summarized as follows:
• The constraints coming from X-ray and opticalclusters are consistent but the former appear to betighter.
• If we fix the power-spectrum shape parameter Γ =0.2, in the range suggested by different observationaldatasets, and the power-spectrum normalisation to re-produce the cluster abundance, we obtain strong con-straints on the value of the matter density parameter,
c© 0000 RAS, MNRAS 000, 000–000
12 Moscardini et al.
Figure 5. The predicted values of the correlation length (in h−1 Mpc) for the EIS survey as a function of the value of thespectrum normalisation σ8. Results are presented for CDM models with (Ω0m,Ω0Λ) = (1, 0) (left panels), (0.3,0) (solid lines inthe right panels) and (0.3,0.7) (dotted lines in the right panels). The different lines refer to different values of Γ: 0.1, 0.2, 0.3,0.4 and 0.5, from top to down. The upper panels shows the results obtained using clusters with z ≤ 0.3, while the lower oneare for z > 0.3 clusters.
independently of the presence of a cosmological con-stant: Ω0m ≤ 0.5 and 0.2 ≤ Ω0m ≤ 0.35 at the 2σ level,for the optical and X-ray data, respectively.
• If we allow the shape parameter to vary, we findthat the clustering properties of clusters are only weaklydependent on Ω0m and Ω0Λ. On the contrary, the resultsappear to be much more strongly sensitive to Γ. In fact,smaller shape parameters correspond to higher correla-tion lengths.
• Considering models with the normalisation com-ing from the cluster abundance, we find that the cen-tre of the region allowed by the maximum-likelihoodanalysis of the optical data is described by the rela-
tion Γ = 0.382 − 0.797Ω0m + 1.029Ω20m − 0.478Ω3
0m
and Γ = 0.215 − 0.079Ω0m − 0.064Ω20m + 0.069Ω3
0m
for flat and open models, respectively. Considering thecatalogues in the X-ray band, we find Γ = 0.487 −1.342Ω0m +1.687Ω2
0m −0.73Ω30m for the flat models and
Γ = 0.394 − 0.933Ω0m + 1.084Ω20m − 0.44Ω3
0m for theopen models.
• Using X-ray selected data only, we find that for theEinstein-de Sitter model the value of Γ has to be quiteclose to 0.1 with 0.4∼
< σ8∼< 1.1; for open and flat models
with Ω0m = 0.3 the 2σ region has 0.14∼< Γ∼
< 0.22 and0.6∼
< σ8∼< 1.3.
We also used our model to make predictions on the
c© 0000 RAS, MNRAS 000, 000–000

Clustering properties of galaxy clusters in optical and X-ray bands 13
Figure 6. As Figure 5 but for the XMM/LSS survey.
clustering properties of galaxy clusters expected in fu-ture surveys. We considered an optical catalogue withcharacteristics similar to the EIS project and a deep X-ray catalogue with the characteristics of the XMM/LSSsurvey. From this analysis we can conclude that:
• Clusters at high redshifts are expected to have alarger correlation function than at low redshifts.
• Again, predictions are almost insensitive to thepresence of a cosmological constant while they arestrongly dependent on the shape parameter.
• The predicted clustering for the EIS catalogue isrelatively small for all cosmological models suggestingthat its cluster number density corresponds to objectswith small mass, including some possible false candi-dates.
• The correlation length for X-ray selected clusters is
confirmed to depend on the limiting flux of the survey:the deeper the catalogue, the smaller r0. Moreover, theredshift evolution of clustering is less evident in deepercatalogues.
In conclusion, our results show that the existingdata on the clustering properties of clusters can be suc-cessfully used to put constraints on the cosmologicalparameters. The future availability of deeper surveyscan increase the power of this approach, which can beconsidered complementary to the traditional study ofcluster abundances.
ACKNOWLEDGMENTS.
This work has been partially supported by ItalianMURST, CNR and ASI, and by the TMR european net-
c© 0000 RAS, MNRAS 000, 000–000

14 Moscardini et al.
Figure 7. The expected number of galaxy clusters with z ≤ 0.3 (upper panels) and z > 0.3 (lower panels) in the XMM/LSSsurvey as a function of the value of the spectrum normalisation σ8. Results are presented for CDM models with (Ω0m,Ω0Λ) =(1, 0) (left panels), (0.3,0) (solid lines in the right panels) and (0.3,0.7) (dotted lines in the right panels). The different linesrefer to different values of the Γ parameter: 0.1, 0.2, 0.3, 0.4 and 0.5, from bottom to top.
work “The Formation and Evolution of Galaxies” undercontract n. ERBFMRX-CT96-086. LM thank the Max-Planck-Institut fur Astrophysik for its hospitality dur-ing the visit when this work was completed. We wantto warmly thank Sabrina De Grandi for stimulatingcomments and helpful suggestions. We are grateful toC. Collins for having provided the clustering results ofthe REFLEX catalogue before publication and to HerveAussel, Marco Scodeggio and Bepi Tormen for clarifyingdiscussions. We thank the anonymous referee for usefulsuggestions which helped to improve the presentation ofour results.
REFERENCES
Abadi M.G., Lambas D.G., Muriel H., 1998, ApJ, 507, 526
Abell G.O., 1958, ApJSS, 3, 211
Bardeen J.M., Bond J.R., Kaiser N., Szalay A.S., 1986, ApJ,304, 15
Bohringer H. et al., 1998, Messenger, 94, 21
Borgani S., Coles P., Moscardini L., 1994, MNRAS, 271, 223
Borgani S., Plionis M., Coles P., Moscardini L., 1995, MN-RAS, 277, 1191
Borgani S., Plionis M., Kolokotronis V., 1999, MNRAS, 305,866
Catelan P., Lucchin F., Matarrese S., Porciani C., 1998, MN-
RAS, 297,692
Colberg J.M. et al., 2000, MNRAS, 319, 209
Collins C.A. et al., 2000, MNRAS, 319, 939
c© 0000 RAS, MNRAS 000, 000–000

Clustering properties of galaxy clusters in optical and X-ray bands 15
Croft R.A.C., Dalton G.B., Efstathiou G., Sutherland W.J.,
Maddox S.J., 1997, MNRAS, 291, 305Croft R.A.C., Efstathiou G., 1994, MNRAS, 267, 390
da Costa L., Scodeggio M., Olsen L.F., Benoist C., 2000, inPlionis M., Georgantopoulos I., eds, Large Scale Struc-ture in the X-ray Universe. Atlantisciences, Paris, p. 21
Dalton G.B., Croft R.A.C., Efstathiou G., Sutherland W.J.,Maddox S.J., Davis M., 1994, MNRAS, 271, L47
Dalton G.B., Efstathiou G., Maddox S.J., Sutherland W.J.,1992, ApJ, 390, L1
De Grandi S. et al., 1999a, ApJ, 514, 148De Grandi S. et al., 1999b, ApJ, 513, L17
Donahue M., Voit G.M., Scharf C.A., Gioia I.M., Mullis C.R.,Hughes J.P., Stocke J.Y., 1999, ApJ, 527, 525
Ebeling H., Edge A.C., Bohringer H., Allen S.W., CrawfordC.S., Fabian A.C., Voges W., Huchra J.P., 1998, MN-RAS, 301, 881
Ebeling H., Edge A.C., Fabian A.C., Allen S.W., CrawfordC.S., Bohringer H., 1997, ApJ, 479, L101
Ebeling H., Voges W., Bohringer H., Edge A.C., Huchra J.P.,Briel U.G., 1996, MNRAS, 283, 1103
Eke V., Cole S., Frenk C.S., Navarro J.F., 1996, MNRAS,281, 703
Henry J.P., Arnaud K.A., 1991, ApJ, 372, 410
Holden B.P., Nichol R.C., Romer A.K., Metevier A., Post-man M., Ulmer M.P., Lubin L.M., 1999, AJ, 118, 2002
Jenkins A., Frenk C.S., White S.D.M., Colberg J.M., ColeS., Evrard A.E., Yoshida N., 2001, MNRAS, 321, 372
Jing Y.P., Mo H.J., Borner G, Fang L.Z., 1993, ApJ, 411,450
Kaiser N., 1987, MNRAS, 227, 1Lee S., Park C., 1999, preprint, astro-ph/9909008
Lumsden S.L., Nichol R.C., Collins C.A., Guzzo L., 1992,MNRAS, 258, 1
Markevitch M., 1998, ApJ, 504, 27
Matarrese S., Coles P., Lucchin F., Moscardini L., 1997, MN-RAS, 286, 115
Mo H.J., Jing Y.P., White S.D.M., 1996, MNRAS, 282, 1096Mo H.J., Peacock J.A., Xia X.Y., 1993, MNRAS, 260, 121
Mo H.J., White S.D.M., 1996, MNRAS, 282, 347
Moscardini L., Coles P., Lucchin F., Matarrese S., 1998, MN-RAS, 299, 95
Moscardini L., Matarrese S., De Grandi S., Lucchin F.,2000a, MNRAS, 314, 647
Moscardini L., Matarrese S., Lucchin F., Rosati P., 2000b,MNRAS, 316, 283
Mushotzky R.F., Scharf C.A., 1997, ApJ, 482, L13Nichol R.C., Collins C.A., Guzzo L., Lumsden S.L., 1992,
MNRAS, 255, 21p
Olsen L.F. et al., 1999, A&A, 345, 681Peacock J.A., Dodds S.J., 1996, MNRAS, 280, L19
Pierre M., in Banday A.J. et al. eds, Mining the sky. ESOAstrophysics Symposia Series, Springer Verlag, Berlin, inpress, astro-ph/0011166
Postman M., Lubin L.M., Gunn J.E., Oke J.B., Hoessel J.G.,Schneider D.P., Christensen J.A., 1996, AJ, 111, 615
Press W.H., Schechter P., 1974, ApJ, 187, 425
Ramella M. et al., 2000, A&A, 360, 861
Robinson J., 2000, preprint, astro-ph/0004023Rosati P., Della Ceca R., Norman C., Giacconi R., 1998, ApJ,
492, L21
Scodeggio et al., 1999, A&AS, 137, 83Sheth R.K., Mo H.J., Tormen G., 2001, MNRAS, 323, 1
Sheth R.K., Tormen G., 1999, MNRAS, 308, 119
Sugiyama N., 1995, ApJS, 100, 281Suto Y., Yamamoto K., Kitayama T., Jing Y.P., 2000, ApJ,
534, 551
Trumper J., Hasinger G., Staubert R., 1998, AN, 319, 113
Viana P., Liddle A.R., 1999, MNRAS, 303, 535
White S.D.M., Frenk C.S., Davis M., Efstathiou G., 1987,ApJ, 313, 505
Yamamoto K., Suto Y., 1999, ApJ, 517, 1York D.G. et al., 2000, AJ, 120, 1579
c© 0000 RAS, MNRAS 000, 000–000