constellation energy Q3 2007 Earnings Presentation 2007 Third Quarter
41
1 Constellation Energy Q3 2007 Earnings Presentation October 31, 2007 Kevin Hadlock: Thank you, and good morning, everyone. I am Kevin Hadlock, Vice President of Investor Relations for Constellation Energy. Welcome to our third quarter 2007 earnings call. Thank you for joining us today. Turning to slide 2…
-
Upload
finance12 -
Category
Economy & Finance
-
view
318 -
download
1
Transcript of constellation energy Q3 2007 Earnings Presentation 2007 Third Quarter

1
Constellation EnergyQ3 2007 Earnings Presentation
October 31, 2007
Kevin Hadlock:
Thank you, and good morning, everyone. I am Kevin Hadlock, Vice President of Investor Relations for Constellation Energy. Welcome to our third quarter 2007 earnings call. Thank you for joining us today.
Turning to slide 2…

2
2
Forward-looking Statements DisclaimerCertain statements made in this presentation are forward-looking statements and may contain words such as “believes,” “anticipates,” “expects,”“intends,” “plans,” and other similar words. We also disclose non-historical information that represents management’s expectations, which are based on numerous assumptions. These statements are not guarantees of future performance and are subject to risks and uncertainties that could cause actual results to be materially different from projected results. These risks include, but are not limited to: the timing and extent of changes in commodity prices for energy including coal, natural gas, oil, electricity, nuclear fuel, and emissions allowances; the timing and extent of deregulation of, and competition in, the energy markets, and the rules and regulations adopted on a transitional basis in those markets; the conditions of the capital markets, interest rates, availability of credit, liquidity and general economic conditions, as well as Constellation Energy’s and BGE’s ability to maintain their current credit ratings; the ability to attract and retain customers in our competitive supply activities and to adequately forecast their energy usage; the effectiveness of Constellation Energy’s and BGE’s risk management policies and procedures and the ability and willingness of our counterparties to satisfy their financial and other commitments; the liquidity and competitiveness of wholesale markets for energy commodities; uncertainties associated with estimating natural gas reserves, developing properties and extracting gas; operational factors affecting the operations of our generating facilities (including nuclear facilities) and BGE’s transmission and distribution facilities, including catastrophic weather-related damages, unscheduled outages or repairs, unanticipated changes in fuel costs or availability, unavailability of coal or gas transportation or electric transmission services, workforce issues, terrorism, liabilities associated with catastrophic events, and other events beyond our control; the inability of BGE to recover all its costs associated with providing customers service; the effect of weather and general economic and business conditions on energy supply, demand, and prices; regulatory or legislative developments that affect deregulation, transmission or distribution rates, demand for energy, or that would increase costs, including costs related to nuclear power plants, safety, or environmental compliance; the ability of our regulated and non-regulated businesses to comply with complex and/or changing market rules and regulations; the actual outcome of uncertainties associated with assumptions and estimates using judgment when applying critical accounting policies and preparing financial statements, including factors that are estimated in applying mark-to-market accounting, such as the ability to obtain market prices and in the absence of verifiable market prices, the appropriateness of models and model impacts (including, but not limited to, extreme contractual load obligations, unit availability, forward commodity prices, interest rates, correlation and volatility factors); changes in accounting principles or practices; losses on the sale or write-down of assets due to impairment events or changes in management intent with regard to either holding or selling certain assets; our ability to successfully identify and complete acquisitions and sales of businesses and assets; and cost and other effects of legal and administrative proceedings that may not be covered by insurance, including environmental liabilities. Given these uncertainties, you should not place undue reliance on these forward-looking statements. Please see our periodic reports filed with the SEC for more information on these factors. These forward-looking statements represent estimates and assumptions only as of the date of this presentation, and no duty is undertaken to update them to reflect new information, events or circumstances.
Before we begin our presentation, let me remind you that our comments today will include forward-looking statements, which are subject to certain risks and uncertainties.
For a complete discussion of these risks, we encourage you to read our documents on file with the SEC.
Our presentation today is being webcast, and the slides are available on our website, which you can access at constellation.com under Investor Relations.
Moving to slide 3…

3
3
Use of Non-GAAP Financial MeasuresConstellation Energy presents adjusted earnings per share (adjusted EPS) in addition to its reported earnings per share in accordance with generally accepted accounting principles (reported GAAP EPS). Adjusted EPS is a non-GAAP financial measure that differs from reported GAAP EPS because it excludes the cumulative effects of changes in accounting principles, discontinued operations, special items (which we define as significant items that are not related to our ongoing, underlying business or which distort comparability of results) included in operations, the impact of certain economic, non-qualifying hedges, and synfuel earnings. The mark-to-market impact of economic non-qualifying hedges is significant to reported results, but economically neutral to the company in that offsetting gains or losses on underlying accrual positions will be recognized in the future. Synfuel earnings are excluded due to the potential for oil price volatility to result in a difficult-to-forecast phase-out of tax credits. We present adjusted EPS because we believe that it is appropriate for investors to consider results excluding these items in addition to our results in accordance with GAAP. We believe this measure provides a picture of our results that is comparable among periods since it excludes the impact of items such as workforce reduction costs or gains and losses on the sale of assets, which may recur occasionally, but tend to be irregular as to timing, thereby distorting comparisons between periods. However, investors should note that this non-GAAP measure involves judgment by management (in particular, judgment as to what is classified as a special item or an economic, non-qualifying hedge to be excluded from adjusted earnings). This non-GAAP measure is also used to evaluate management's performance and for compensation purposes. Constellation Energy also provides its earnings guidance in terms of adjusted EPS. Constellation Energy is unable to reconcile its guidance to GAAP earnings per share because we do not predict the future impact of special items, economic, non-qualifying hedges or synfuel earnings due to the difficulty of doing so. The impact of special items, economic, non-qualifying hedges, or synfuel earnings could be material to our operating results computed in accordance with GAAP. We note that such information is not in accordance with GAAP and should not be viewed as an alternative to GAAP information. A reconciliation of Non-GAAP information to GAAP information is included either on the slide where the information appears or on one of the slides in the Non-GAAP Measures section provided at the end of the presentation. Please see the Summary of Non-GAAP Measures included to find the appropriate GAAP reconciliation and its related slide(s). These slides are only intended to be reviewed in conjunction with the oral presentation to which they relate.
We will use Non-GAAP financial measures in this presentation to help you understand our operating performance.
We have attached an Appendix to the charts on the website reconciling Non-GAAP measures to GAAP measures.
With that, I would like to turn the time over to Mayo Shattuck, Chairman, President and CEO of Constellation Energy…

4
4
Q3 2007 Adjusted EPS Summary
$1.35 - $1.55Q3 Earnings Guidance (3)
(0.11)0.09Synfuel Earnings (1)
$1.46$1.45Adjusted Earnings (2)
(1) Represents synfuel earnings of $0.14 per share and expected synfuel phase-out risk of $0.23 per share in Q3 2007(2) Excludes special items, certain economic, non-qualifying hedges and synfuel earnings(3) Excludes estimated synfuel earnings of $0.13 per share and estimated synfuel phase-out risk of $0.06 per share See Appendix
(0.02)(0.01)Special Items
(0.20)(0.01)Gain on Economic Non-Qualifying Hedges
$1.79$1.38GAAP Earnings
Q3 2006Q3 2007($ per share)
Thank you, Kevin.
Good morning, everyone. I will apologize if you hear two raspy voices this morning, but I will try to get through this. We’re pleased to announce another solid performance in the third quarter of 2007. We recorded adjusted earnings of $1.45 per share, in the middle of our guidance range of $1.35 to $1.55 per share, and we remain on track to achieve our 2007 earnings projections.
Now turning to slide 5 …

5
5
Q3 2007 Highlights• Constellation Board of Directors approved $1 billion share
repurchase program– Executing $250 million of the program through an accelerated share repurchase
agreement
• Merchant integration moving forward– Announced key leadership – Beginning to implement specific, high-impact initiatives
• New nuclear initiatives progressing– Closed UniStar Nuclear Energy joint venture with EDF– Revised federal loan guarantee program announced – AREVA preparing to file design certification for U.S. EPR in December– UniStar planning to file complete Combined License Application (COLA) in early
2008
• BGE filed demand response and conservation plans with PSC
In the third quarter, we continued to move forward on several key strategic objectives.
This morning, we announced our Board of Directors has authorized a $1 billion share repurchase program, which is expected to be executed over the next 24 months. Further, we are executing on $250 million of the program through an accelerated share repurchase agreement. This announcement illustrates continued confidence in our bright future. Given our strong financial profile, we believe this is the right time to execute a share repurchase program. We also believe this program represents the most efficient return on excess capital to our shareholders, while maintaining flexibility to opportunistically pursue higher, value-added strategic investments.
As you’ll recall, in August we shared with you the details of the new alignment within the merchant organization. We continue to make progress on the integration and have announced key leadership roles and responsibilities. We have also begun to implement specific, high-impact initiatives within the organization.
Also, we’re making steady progress on our new nuclear initiatives. We closed the UniStarNuclear Energy joint venture with EDF in August. Recently, a revised federal loan guarantee program was announced, a watershed event that provides more clarity on the financing necessary for new nuclear development. Looking forward, AREVA is preparing to file the design certification for the U.S. EPR by year-end, and, through UniStar, we expect to complete the Combined License Application or COLA for the proposed Calvert Cliffs Unit 3 in early 2008. We are also making progress on a similar COLA filing for a potential new nuclear plant at our Nine Mile Point facility in upstate New York.
Last week, BGE filed aggressive demand response and conservation programs with the Maryland Public Service Commission. These programs are an important step forward to encourage customers to better manage their electricity usage and to help Maryland meet its reliability and conservation objectives.
Turning to slide 6…

6
6
Maryland Update
• Nearly all (96%) of BGE’s residential customers transitioned to market rates on June 1, 2007
• Current Maryland discussion focused on energy policy and optimal long-term market structure– Maryland PSC expected to issue preliminary report in December 2007 to address:
Status of electric restructuring in MarylandBGE stranded costs settlementEnergy efficiency recommendationsMunicipal opt-out aggregationAlternatives to current wholesale power procurement process, including possible portfolio management approach
– Regulators, legislators and utilities addressing goals for efficiency and conservation
• Maryland Legislature in special session to address projected state budget deficit
Let me spend a minute to update you on current events in Maryland. On June 1st of this year, BGE's residential customers effectively transitioned to market rates, which are equal or slightly lower than the rates of neighboring Maryland utilities.
Discussions in Maryland have moved beyond BGE rates and are now focused on energy policy and the optimal long-term market structure. The PSC is fashioning a preliminary report to the Maryland Legislature, as required by Maryland Senate Bill 400, which was passed earlier this year. The preliminary report, due in December, will address the status of electric restructuring in Maryland and review issues such as the BGE stranded cost settlement, energy efficiency recommendations, municipal opt-out aggregation and other retail choice issues. In addition, the PSC is exploring alternatives to the current wholesale power procurement process. This inquiry is focused on the possible switch to a portfolio management approach which could use a combination of spot market purchases, long-term power purchase agreements, and utility construction or acquisition of generation.
We see that the broader energy policy discussion is increasingly focused on the convergence of energy issues with environmental goals, including support for renewable technologies, energy efficiency and conservation. This convergence, must, of course, be balanced with the need to maintain adequate generation supply and transmission infrastructure. This is a good trend. As we've mentioned previously, we’re focused on opportunities for us to revive or expand generation capacity and to pursue the BGE Smart Energy Savers Programs more aggressively.
As you are probably aware, the Maryland Legislature convened a special session this week to address the projected state budget deficit. We expect the state will entertain proposals to increase property taxes paid by generators and raise state income taxes for corporations in the state. We are actively engaged with the Legislative leadership to ensure everyone understands the need for fair tax treatment for businesses, especially for generators operating in competitive markets.
Turning to slide 7…

7
7
Supportive Industry Fundamentals
Capacity Prices (PJM - SWMAAC)
$188.54
$210.11
$237.33
$100
$150
$200
$250
2007-08 2008-09 2009-10
Planning Year
$ /
MW
day
• Forward natural gas prices continue to support strong forward power prices• Capacity markets expected to continue to tighten
Electricity and Natural Gas Forwards (Calendar Strips)
$50
$55
$60
$65
$70
$75
2008 2009 2010
$ /
MW
h$6.00
$6.50
$7.00
$7.50
$8.00
$8.50
$ /
mm
Btu
12/29/06 PJM West Power (7x24) 9/28/07 PJM West Power (7x24)
12/26/06 NG Exchange 9/28/07 NG Exchange
Implied Market Heat Rate
Dec. 29, 2006 7.42 7.39 7.50
Sept. 28, 2007 7.78 7.83 7.91
Industry fundamentals continue to be supportive of our long-term growth story. The chart on the left shows forward power and natural gas prices at the end of last December and at the end of September. While gas spot prices have fallen in recent months in response to high storage volumes, long-term prices remain robust, providing support for future power prices.
The chart on the right shows the auction clearing prices for Southwest MAAC capacity for the next three planning years. These results are encouraging investment in capacity, transmission and demand response initiatives, which will help meet the reliability needs of customers in the Baltimore/Washington area. However, due to long lead times for these investments to make a meaningful contribution, capacity margins are likely to continue to tighten before we begin to see sufficient development of new generation.
Turning to slide 8…

8
8
Investing in ReliabilityInvest in Existing Cost-Advantaged Assets• Rejuvenate 178 MW of existing capacity• Extend life of 719 MW of existing capacity• Invest : ~ $275 million
Near Term(< 2 years)
Intermediate Term(2-4 years)
Potential Construction of New Capacity• Evaluate feasibility of building up to 520 MW of new capacity• Nine Mile Point uprate of 105 MW• Invest: ~ $650 million
Long Term • Develop option to build new nuclear plants in PJM and New York
BGE • Filed plans for Demand Response and Energy Efficiency programs• Invest: ~ $320 million
8,700 8,9009,500
11,100
4,000
5,000
6,000
7,000
8,000
9,000
10,000
11,000
12,000
13,000
Current < 2 years 2-4 years Long-term
Approximate Generation Capacity (MWs) (1)
(1) Organic growth, does not include potential M&A activities
+
While some may be waiting for new plants to be built to indicate that capacity markets are working, companies are responding in meaningful ways to the new price signals and are investing in reliability programs. Constellation is making reliability investments that we would not be making without the capacity market frameworks operating in the New York Power Pool and PJM.
Based on the recent capacity clearing prices in the PJM, we are focusing on projects where we have significant cost advantages over new generation. We are planning to rejuvenate 178 MWs of retired generation assets in Maryland. In addition, we are making further investments to extend the lives and improve the reliability and operational flexibility of about 700 MWs of older Maryland plants that might otherwise have been retired. Effectively, we are increasing capacity in SW MAAC by almost 900 MWs that would be retired without the RPM framework. In the New York Power Pool, we are investing in a 105MW uprate at our Nine Mile Point nuclear plant that is expected to come on-line in 2010.
We are beginning to see energy and capacity prices approach levels that encourage new build. Over the past several years, rising construction and materials costs have increased the energy and capacity prices required for generators to achieve a sufficient return. We continue to make steady progress in our feasibility study for building up to 520 MWs of new-gas fired generation capacity at existing or permitted sites.
Longer-term, we see a significant opportunity and the option to build new nuclear plants in PJM and New York.
We are also moving forward with investments in reliability at BGE, where we filed plans for Demand Response and Energy Efficiency programs with the Maryland Public Service Commission last week. These two programs could require up to $320 million of capital investment over the next five years and create as much as 600 MWs of available demand response. We are currently in the pilot phase for an Advanced Metering program, which would provide our customers with the tools and incentives to better understand and manage their energy usage. We expect to file for full project implementation for Advanced Metering to the Commission in late 2008, following completion of the pilot program.
Turning to slide 9…

9
9
Earnings Outlook
(1) Adjusted for the effect of special items, certain economic, non-qualifying hedges, and synfuel earningsSee Appendix
• Raising the bottom end of 2007 guidance for a new range of $4.45 to $4.65 per share• Reaffirming 2008 guidance• 2009 adjusted EPS growth of more than 10% over 2008
3.61
> +10%
5.25 - 5.75
4.45 - 4.65
$3.00
$3.50
$4.00
$4.50
$5.00
$5.50
$6.00
$6.50
2006 2007E 2008E 2009E
Adj
uste
d E
PS (1
)
I will wrap up with our 2007 to 2009 outlook, a slide that you have seen before.
We’re raising the bottom end of our 2007 guidance for a new range of $4.45 to $4.65 per share. While we are in the midst of our five-year planning process, we remain confident that our 2008 earnings level will be in the mid-to-high end of our $5.25 to $5.75 per share guidance range. Looking out further to 2009, we expect earnings growth of more than 10 percent over 2008. Beyond 2009, we believe the underlying fundamentals in the energy markets have positive implications for longer-term growth. We plan to share more detailed plans and update our guidance when we see you in New York in January.
Now, I’d like to turn the presentation over to John to cover the Financials in more detail…

10
Financial Overview
John R. CollinsExecutive Vice President,
Chief Financial Officer, and Chief Risk Officer
Thank you, Mayo, and good morning, everyone.
Let’s begin on slide 11…

11
11
Q3 2007 Adjusted EPS Summary
(0.20)(0.01)Gain on Economic Non-Qualifying Hedges
$1.46$1.45Adjusted Earnings (2)
$1.35 - $1.55Q3 Earnings Guidance (3)
(0.02)(0.01)Special Items
(0.11)0.09Synfuel Earnings (1)
$1.79$1.38GAAP Earnings
Q3 2006Q3 2007($ per share)
(1) Represents synfuel earnings of $0.14 per share and expected synfuel tax credit phase-out risk of $0.23 per share in Q3 2007(2) Excludes special items, certain economic, non-qualifying hedges and synfuel earnings(3) Excludes estimated synfuel earnings of $0.13 per share and estimated synfuel tax credit phase-out risk of $0.06 per share See Appendix
For the third quarter, our adjusted earnings were $1.45 per share, in the middle of our guidance range of $1.35 to $1.55 per share. GAAP earnings were $1.38 per share. Let me walk you through the adjustments to GAAP in the third quarter of 2007.
• We had a 1 cent gain related to special items driven primarily by tax-related adjustments associated with the sale of High Desert, which was accounted for as discontinued operations.
• We had a 1 cent gain on economic, non-qualifying hedges associated with gas storage, which we subtract from GAAP earnings.
• Lastly, Synfuel earnings was a 9 cent loss in the quarter due to an increase in tax credits expected to be phased out. Forward prices at the end of the third quarter indicate that approximately 54% of tax credits would be phased out versus an expectation of 29% at the end of Q2. As you’ll recall, we break out synfuel earnings separately since the synfuel tax credit program expires at the end of this year and the fact that synfuel earnings vary with oil prices.
Turning to slide 12…

12
12
Q3 2007 Segment EPS Summary
(1%)$(0.01)$1.46$1.45Adjusted Earnings (1)
N.M.(0.02)0.020.00Other Non Regulated
(30%)(0.06)0.200.14Utility
6%$0.07$1.24$1.31Merchant
%EPSQ3 2006Q3 2007($ per share)
ChangeAdjusted Earnings
(1) Excludes special items, certain economic, non-qualifying hedges and synfuel earningsSee Appendix
Looking at our segment performance in the third quarter compared to last year, the Merchant was up 7 cents, the Utility down 6 cents, and Other Non-regulated down 2 cents. Overall, adjusted earnings were down 1 cent per share.
Moving to slide 13…

13
13
$0.08 - $0.12$0.14Adjusted Earnings
GuidanceActual
Q3 2007Adjusted Earnings vs. Guidance($ per share)
BGE
$(0.06)
Change
$0.20$0.14Adjusted Earnings
Q3 2006Q3 2007
Adjusted Earnings vs. Prior Year($ per share)
See Appendix
BGE earned 14 cents per share in the quarter, down 6 cents per share from the third quarter of 2006. These results were driven by credits to residential customers required by Senate Bill 1 and higher operations and maintenance costs, partially offset by higher electric transmission and demand response revenues.
BGE’s trailing 12-month regulated return on equity for gas and electric distribution, adjusted for weather, is 7.5%. This is well below the rates of return observed around the country in recent rate case decisions. BGE has been investing heavily in infrastructure, and programs in support of reliability and customer growth, and plans to continue this pattern of investment in the future.
Combining the current rate of return with increased capital being invested in both our electric and gas distribution businesses, as we previously discussed, we expect to file a distribution rate case with the Maryland Public Service Commission during 2008.
Turning to slide 14 and a review of the Merchant segment’s performance…

14
14
$1.25 - $1.45$1.31Adjusted Earnings
GuidanceActual (1)
Q3 2007Adjusted Earnings vs. Guidance($ per share)
Merchant
-1¢ Other
-5¢ Retail Competitive Supply+13¢ Wholesale Competitive Supply
Variance Primarily Due to:
$0.07$1.24$1.31Adjusted Earnings (1)
ChangeQ3 2006Q3 2007Adjusted Earnings vs. Prior Year($ per share)
(1) Excludes special items, certain economic, non-qualifying hedges and synfuel earnings See Appendix
The Merchant segment’s adjusted earnings were $1.31 per share. Compared to the third quarter of last year, the Merchant segment was up 7 cents per share. Wholesale Competitive Supply increased 13 cents per share due to higher backlog realization and new business, partially offset by higher operating expenses.
Our Retail Competitive Supply businesses, NewEnergy Electric and NewEnergy Gas, were down 5 cents per share. NewEnergy Electric had a strong third quarter up 5 cents per share, driven by higher realized margins. NewEnergyGas was down 10 cents per share, primarily due to mark-to-market losses related to economic hedges of accrual transactions. Year to date, Retail Competitive Supply earnings, excluding mark to market, are ahead of last year’s pace.
There were a number of small items which result in a net decrease of 1 cent per share. These include unplanned plant outages in the third quarter that impacted fossil reliability and the loss of earnings from the gas plants, which were sold in December 2006, partially offset by lower interest expense.
Turning to slide 15…

15
15
Wholesale Competitive Supply (1)
New Business
18%41225266Total New Business Realized (2)
(1) Excludes special items, certain economic, non-qualifying hedges and synfuel results(2) Includes power, gas (non-project), and coal gross margin and gas project margin (project revenue less operating, depreciation, depletion and interest expenses incurred at
the project level). Excluding gas project-level expenses of $38 million in Q3 2007 and $14 million in Q3 2006, total wholesale competitive supply gross margin in Q3 2007 and Q3 2006 was $384 million and $291 million, respectively.
See Appendix
53126179Portfolio Management & Trading
25%$69$277$346Total Contribution Margin (2)
(12)9987Originated & Realized (2)
54%$28$52$80Total Already Originated Business (2)
%$Q3 2006Q3 2007
Change($ in millions)
As you see in the column on the left, during the quarter, Wholesale Competitive Supply recognized contribution margin of $346 million, including realization of $80 million of backlog and $266 million of new business. Backlog realization in the third quarter was up $28 million versus the same period last year, an increase of 54%.
New business in the third quarter was $41 million higher versus last year’s third quarter, driven primarily by an increase in portfolio management and trading of $53 million.
Turning to slide 16…

16
16
Wholesale Competitive Supply: Origination
$536$469Current Year Plan
$322
142
$180
Q3 2006
$427
220
$207
Q3 2007
(1) Includes power, gas (non-project), and coal gross margin and gas project margin (projected revenue less operating, depreciation, depletion and interest expenses incurred at the project level)
$908$1,026Total Origination Plan (including future years)
113%119%% of Total Origination Plan Achieved
113%93%% of Current Year Plan Achieved
Total Wholesale Competitive Supply Origination Value to be Realized (1)
425787Future Years
$1,029$1,225Total Originated
$604$438Current Year
To Be Realized In:
Q1-Q3 2006Q1-Q3 2007($ in millions)
This chart gives you the full picture of Wholesale Competitive Supply performance because it shows the earnings added to the backlog during the quarter. On the “total originated” line in the center of the chart you see that the Commodities Group originated new business contribution margin of $427 million in the third quarter, compared to $322 million for the same period last year. Looking at the components, we originated $207 million of business to be realized this year, versus $180 million in last year’s third quarter. We also originated $220 million to be realized in future years versus $142 million in the third quarter last year. For the first three quarters of 2007, we have originated new business Contribution margin of over $1.2 billion compared to $1 billion for the first three quarters of last year. While we have made significant progress toward our full-year origination objectives for contribution margin, we are alsoexperiencing higher growth-related costs.
In addition, we are planning to take an outage at Nine Mile Point to perform maintenance during the fourth quarter. We will also take the opportunity to repair a jet pump, which was previously scheduled to occur in the spring refueling outage. We estimate the outage will last 16 days.
Moving to slide 17…

17
17
Wholesale Competitive Supply: Backlog
(1) Includes power, gas (non-project), and coal gross margin and gas project margin (project revenue less operating, depreciation, depletion and interest expenses incurred at the project level)
(2) Includes portfolio value changes for downstream gas and coal(3) Reflects portfolio pricing on 12/31/06
Backlog (1)
(as of 9/30/07)
369
189 170
438
160 151
$0
$200
$400
$600
$800
$1,000
2007 2008 2009
$ in
mil
lion
s
New Business Since 12/31/06
Value as of 12/31/06(3)
(2)
807
349 321
This chart provides an update of the backlog we’ve created this year in our Wholesale Competitive Supply portfolio. Of the $787 million of future contribution margin originated in the first three quarters of 2007, we have added $160 million to the 2008 backlog and $151 million to the 2009 backlog.
Wholesale Competitive Supply continues to perform well, and the future years’ backlog provides a highly visible stream of future earnings already originated as a solid base from which to build.
Turning to slide 18…

18
18
NewEnergy: Retail MWh Backlog
Contracted Retail MWH (as of 9/30/07)
55
17
44
68
8396
0
20
40
60
80
100
120
2006 2007 2008
MW
hs
in m
illio
ns
Delivered Backlog Plan
• NewEnergy is about 86% contracted in 2007 vs. plan as compared to 91% this time last year
At NewEnergy Electric, we have 72 million megawatt hours either delivered or contracted for 2007. This accounts for about 86% of the full-year target and is in line with last year’s pace. Retention rates were 86% in the 3rd quarter, an increase from 81% in the 3rd quarter of 2006. Volumes for 2007 are tracking below plan for the year, but the gross margin impact of lower volumes has been more than offset by higher realized margins.
We are also working to add to future backlog. We currently have 44 million megawatt hours contracted for 2008, providing a solid foundation for next year.
Turning to slide 19…

19
19
Q3 2007 Cash Flow
$251$ -$24$227Net Income
187264121Depreciation & Amortization
8Equity (Repurchase)/Issuance - Benefit Plans
$(341)$6$(89)$(283)Free Cash Flow
10-10-SB1 Rate Deferrals
(213)--(213)Acquisitions/Dispositions/Contract Restructuring
(436)(2)(111)(323)Capital Expenditures & Investments
(79)Dividends
(165)6(76)(95)Working Capital & Other
25Pension Adjustment (pre-tax)
$(412)Net Cash Flow before Debt Issuances/(Payments)
(138)6(99)(70)“Operating” Cash Flow
(249)-(47)(202)Net CapEx
TotalOther
Non RegUtilityMerchant($ in millions)
See Appendix
Free cash flow for the quarter was negative $341 million. Capital spending was a use of $436 million and was consistent with our expectations for the quarter. Working capital was a use of $165 million, primarily driven by collateral posting requirements with exchanges.
During the third quarter, we completed the acquisition of Cornerstone, which is a complementary acquisition to our NewEnergy Gas business and further expands our geographic footprint in the Mid-West. The cash paid of approximately $100 million is reflected in the Acquisitions/Dispositions/Contract Restructuring line along with the amortization of acquired contracts, including the Progress Ventures contracts assumed this year.
You’ll also note, that with the transition of BGE’s residential customers to full market prices effective June 1, we have begun collecting for the recovery of the rate deferrals agreed to last year in Maryland’s Senate Bill 1.
Turning to slide 20…

20
20
2007E Balance Sheet / Credit Metrics
0.30.40.30.4-3rd Party Cash Collateral
1.01.01.40.3-AOCI Balance
32%29%35%43%55%Net Debt to Total Capital (2)
34%
29%
$8.4
5.4
$0.1
$2.9
(2.0)
$4.9
Q2 2007
31%32%44%55%Adjusted Net Debt to Adjusted Total Capital (3)
$0.1$0.1$0.1$0.150% Trust Preferred
Capital
$3.3$2.7$3.9$5.1Net Debt
5.54.95.14.1Equity (1)
(1.6)(2.3)(0.8)(0.1) Less: Cash
$8.9$7.7$9.1$9.4Total Capital
$4.9$5.0$4.7$5.2 Total Debt
34%16%29%19%FFO / Debt (2) (4)
Debt
Q3 2007YE 2006YE 2005YE 2001($ in billions)
(1) Includes preferred stock and minority interest(2) Excludes BGE Rate Stabilization Securitization debt(3) Excludes BGE Rate Stabilization Securitization debt, AOCI balance related to cash flow hedges of commodity transactions and 3rd party cash collateral(4) Full-year, year-end forecast
See Appendix
The balance sheet and associated credit metrics continue to be very strong.
Total debt outstanding has remained constant at $4.9 billion with the issuance of the $623 million of rate stabilization bonds offset by the maturity of $600 million of debt in the second quarter. While shown on the balance sheet, the rating agencies generally exclude this securitized debt from utilities’ credit metrics. Our net debt to total capital at the end of the third quarter was 32%. For the full-year, our Funds Flow from Operations to Debt is expected to be at 34%.
Turning to slide 21…

21
21
$1.0 Billion Share Repurchase Program
• Board has approved a $1 billion share repurchase program to be executed over the next 24 months
• Attractive expected returns given CEG outlook and strong liquidity and balance sheet positions
– Immediately accretive– Efficient use of cash balances– Maintains adequate credit metrics on a prospective basis
• Program is structured to be highly flexible:– Will execute program in small, discretionary pieces– An investment alternative evaluated along-side other investment opportunities– Maintains ability to take advantage of higher value-added strategic investments
Executing on $250 million of the program through an accelerated share repurchase agreement
Given our strong balance sheet and liquidity position, we have announced a $1.0 billion share repurchase program that we expect to execute over the next 24 months. We are executing on the initial $250 million of this program through an accelerated share repurchase agreement.
The decision to approve a share repurchase program is a strong indication of our continued confidence in the outlook for the company.
We believe it represents a significant return on capital opportunity. It is, of course, immediately accretive, and we believe it is an efficient use of our cash balances.
In terms of managing the program, we plan to move incrementally, over the next 24 months to preserve our flexibility if needed to fund strategic investments. We view the repurchase of stock as an alternative that will be evaluated along side other investment opportunities.
Turning to slide 22…

22
22
Impact of Capacity Market ReformPJM capacity auction results
Note: Capacity position includes owned and purchased capacity less sold capacity
43%86%Percentage of capacity hedged (PJM & NY)
20092008(Position as of 9/30/07)
$191.32--MAAC + APS
$40.80
$188.54
$197.67
Planning Year2007/2008
$111.92
$210.11
$148.80
Planning Year2008/2009
$237.33Southwestern MAAC
$102.04Rest of Pool
$191.32Eastern MAAC
Planning Year2009/2010
($ per MW/day)
This chart shows our updated capacity hedge percentages for the combined NY and PJM regions. As with energy, we have sold capacity to load serving customers and bought capacity from numerous generators over the last several years. Together with our owned generation, which accounts for about 3 million megawatt days of capacity, we have a large portfolio of capacity positions throughout New York and PJM. Given competitive dynamics, we do not provide the details of our positions in each location.
In mid-October, PJM released the 2009/2010 planning year auction results. Compared to the price levels we saw in July for the 2008/2009 planning year, clearing prices increased in Southwest and Eastern MAAC and decreased for Rest of Pool. The October auction was also the first time MAAC+APS was included as a separate region. As of the end of September, our hedge ratios on our total capacity position in New York and PJM were 86% in 2008 and 43% in 2009, consistent with the ratios we provided last quarter.
As Mayo discussed in his section, these results are encouraging investment in reliability, but it may be some time before any additions can create meaningful downward pressure on capacity prices. In order for Constellation Energy to fully realize the higher capacity revenues and to avoid costs associated with not meeting established availability requirements for generation assets bid and accepted in the RPM auctions, we plan to make significant investments to ensure continued reliability of our generation assets. We will provide more details in our January presentation.
Let’s turn to slide 23 and wrap up with fourth quarter guidance…

23
23
Q4 2007 Guidance
$1.08
0.02
0.18
$0.88
Actual Q4 2006
0.00 - 0.02 Other Non Regulated
$1.35 - $1.55Adjusted Earnings Per Share (1)
0.18 - 0.22BGE
$1.15 - $1.35Merchant
Guidance Q4 2007($ per share)
See Appendix(1) Excludes special items, certain economic, non-qualifying hedges, and synfuel earnings
We expect fourth quarter earnings to be $1.35 to $1.55 per sharecompared to adjusted earnings of $1.08 per share in the fourth quarter of last year. In Merchant, we are projecting earnings of $1.15 to $1.35 per share versus 88 cents of adjusted earnings per share in the fourth quarter last year. We expect these results to be driven primarily by favorable Wholesale Competitive Supply backlog and new business, higher retail competitive supply gross margin, favorable fleet costs and lower interest expense. These positives will be partially offset by the Nine Mile Point outage mentioned earlier.
We expect BGE to earn 18 to 22 cents per share in the fourth quarter, compared to the 18 cents per share of adjusted earnings earned in the fourth quarter last year. The primary drivers are a return to normal weather compared to a mild fourth quarter of 2006, higher demand response, transmission and gas revenues partially offset by credits to residential customers required by Maryland’s Senate Bill 1.
That concludes our prepared remarks. We will now take your questions.

24
Additional Modeling Information

25
25
Merchant – Income Statement (1)
15%32225Qualifying Facilities / Other
5%9183192Plants with PPAs
(2%)(5)285280Mid-Atlantic Fleet
3%3109112Retail Competitive Supply
32%$93$291$384Wholesale Competitive Supply
(1%)(1)7071D & A
6%$14$226$240Net Income
(3%)(4)149153Income Tax
5%$18$375$393Pre-Tax Income
70%365216Net Interest Expense
(4%)($18)$427$409EBIT
(26%)(121)463584Total Costs below Gross Margin
(6)
(114)
$103
$
Change B/(W)
(17%)
(32%)
12%
%
3743Other Revenue and Expenses
356470O & M
$890$993Gross Margin
Q3 2006Q3 2007($ in millions)
See Appendix
(1) Earnings excluding special items, certain economic, non-qualifying hedges, and synfuel earnings

26
26
($404) $81($73)($331)($250)Cash Collateral Held
($563)
($398)
(165)
(92)
49
(141)
Q3 Change B / (W)
603 (43)744701Exchanges
77991481763rd Parties
34843751877Subtotal Posted
Collateral Posted
115512347627Net Cash Posted Subtotal
($154)Change in Total Collateral Posted
($269)$1,922$1,524$1,653Letters of Credit Posted
Change vs. Year-End B / (W)9/30/076/30/0712/31/06($ in millions)
Collateral Positions

27
27
Limiting Variability – Portfolio Management
Percent Hedged as of 9/30/07
$0.02$0.01Fuel down $0.10/MMBtu, Power unchanged
($0.05)($0.01)Power down $1/MWh, Fuel unchanged
73%100%Fuel
($0.03)
Sensitivity to Price Changes as of 9/30/07 ($ per share)
$0.00Power down $1/MWh, Fuel down $0.10/MMBtu
97%Power 81%
20092008
• Accrual portfolio managed to reduce exposure of future earnings to commodity price changes• MTM portfolio VaR levels remain low at average of $14.7 million at the end of Q3 2007
Note: Percent hedged includes Mid-Atlantic Fleet, Plants with PPA’s, Power Wholesale Competitive Supply and NewEnergy; excludes gas, coal and freight businesses

28
28
The 2007 phase-out estimate is based on oil forwards and volatilities as of September 30, 2007
Synfuel Update (1)
(85)(64)(20)Current period credit phase-out
$0.08
$15
($55)-
$954%
$7012835
($92)
YTD 2007 Actual
$0.10
$18
($73)-
$1254%
$9116545
($120)
2007 Estimate
Tax credit phase-out percentage
($0.09)Net synfuel EPS
($16)Net synfuels income
$4Production expenses, net of tax
Impact of phase-out
Pre-phase-out:
($37)(20)
$213710
($25)
Q3 2007 Actual
Net income impact of phase-outPhase-out catch-up prior quarters
Net income pre-phase-outTax credits before phase-outTax benefit of pre-tax lossPre-tax loss on production
($ in millions, except per share amounts)
(1) Numbers may not sum due to rounding

29
29
South Carolina Synfuel (1)
3.52.60.8Production (tons in millions)
(58)(44)(13)Current period credit phase-out
$0.05
$9
($39)-
$554%
$488725
($65)
YTD 2007 Actual
$0.05
$10
($51)-
$754%
$6111333
($85)
2007 Estimate
Tax credit phase-out percentage
($0.06)Net synfuel EPS
($11)Net synfuels income
$3Production expenses, net of tax
Impact of phase-out
Pre-phase-out:
($24)(14)
$13247
($18)
Q3 2007 Actual
Net income impact of phase-outPhase-out catch-up prior quarters
Net income pre-phase-outTax credits before phase-outTax benefit of pre-tax lossPre-tax loss on production
($ in millions, except per share amounts)
(1) Numbers may not sum due to rounding

30
30
Pace Synfuel (1)
1.61.20.4Production (tons in millions)
(27)(20)(7)Current period credit phase-out
$0.04
$6
($16)-
$454%
$234010
($27)
YTD 2007 Actual
$0.05
$8
($21)-
$554%
$305212
($34)
2007 Estimate
Tax credit phase-out percentage
($0.02)Net synfuel EPS
($5)Net synfuels income
$1Production expenses, net of tax
Impact of phase-out
Pre-phase-out:
($12)(6)
$8132
($7)
Q3 2007 Actual
Net income impact of phase-outPhase-out catch-up prior quarters
Net income pre-phase-outTax credits before phase-outTax benefit of pre-tax lossPre-tax loss on production
($ in millions, except per share amounts)
(1) Numbers may not sum due to rounding

31
31
NewEnergy Performance
Realized Electric Gross Margin (GM / MWh)
$1.00
$3.00
$5.00
$7.00
1Q05 2Q05 3Q05 4Q05 1Q06 2Q06 3Q06 4Q06 1Q07 2Q07 3Q07
Electric Retention Rates
0%
25%
50%
75%
100%
1Q06 2Q06 3Q06 4Q06 1Q07 2Q07 3Q07
Including Return to Utility Excluding Return to Utility
Gas Retention Rates
80%
90%
100%
1Q06 2Q06 3Q06 4Q06 1Q07 2Q07 3Q07
Electric
Gas
(1) Electric Gross Margin excludes aggregator expense; (2) Gross Margin adjusted for FAS 133 and cumulative accounting adjustments
(1)
Operating Gas Gross Margin (GM / Dth)
$0.00
$0.10
$0.20
$0.30
$0.40
1Q05 2Q05 3Q05 4Q05 1Q06 2Q06 3Q06 4Q06 1Q07 2Q07 3Q07
(2)

32
32
NewEnergy Gross Margin Reconciliation
$23$0Gross Margin (excluding NQH)
$86$112Gross Margin
$0.14110.2
$1515
$5.2719.2
10%$101
11(0)
Q3 2007
$0.1786.7
$15(8)
$3.9818.8
14%$75121
Q3 2006
% of Gross Receipts Tax / Gross Margin
Gas Gross Margin / DthVolume (Dth)
Adjusted Gas Gross MarginMTM losses (gains), excluding NQH
Gas(1)
Electric Margin / MWhVolume
Adjusted Electric Gross MarginLess: Gross Receipts TaxPurchase Amortization
Electric
(1) Gross Margin excludes NQH of $20.9M in Q3 2006 and $6.5M in Q3 2007

33
Non-GAAP Reconciliations

34
34
Summary of Non-GAAP Measures
Slide(s) Where Used Slide Containing Non-GAAP Measure in Presentation Most Comparable GAAP Measure Reconciliation
Adjusted EPS Reported GAAP EPSQ307 Actual 4, 11, 12, 13, 14 35Q306 Actual 4, 11, 12, 13, 14 35EPS Guidance 4, 9, 11, 13, 14, 23 35Q406 Actual 23 362006 YTD Actual 9 37
Q307 Merchant Gross Margin 15, 25 Income from Operations / Net Income 38Q306 Merchant Gross Margin 15, 25 39Q307 Merchant Below Gross Margin 25 38Q306 Merchant Below Gross Margin 25 39
Net Cash Flow before Debt Issuances/(Payments) 19 Operating, Investing and Financing Cash Flow 40Free Cash Flow 19 40
Debt to Total Capital 20 Debt Divided by Total Capitalization 41

35
35
Adjusted EPS Q3 2007 and 2006We exclude special items and certain economic, non-qualifying fuel adjustment clause and gas transportation and storage hedges because we believe that it is appropriate for investors to consider results excluding these items, in addition to our results in accordance with GAAP. We have also adjusted earnings to exclude synfuel results due to the potential volatility and phase-out of the tax credits. We believe such a measure provides a picture of our results that is comparable among periods since it excludes the impact of items, which may recur occasionally, but tend to be irregular as to timing and magnitude, thereby distorting comparisons between periods. However, investors should note that this non-GAAP measure involves judgment by management (in particular, judgment as to what is or is not classified as a special item). We also use this measure to evaluate performance and for compensation purposes.
RECONCILIATION:Regulated Regulated Other
Merchant Electric Gas BGE Nonreg. Total
A B C D = (B+C) E F =(A+D+E)
3Q07 ACTUAL RESULTS:
Reported GAAP EPS 1.24$ 0.19$ (0.05)$ 0.14$ -$ 1.38$ GAAP MEASURES
Income from Discontinued Operations 0.01 - - - - 0.01
1.23 0.19 (0.05) 0.14 - 1.37
Special Items, Non-qualifying Hedges, and Synfuel Results Included in Operations:
Non-qualifying hedges 0.01 - - - - 0.01
Synthetic fuel facility results (0.09) - - - - (0.09)
Total Special Items, Non-qualifying Hedges, and Synfuel Results (0.08) - - - - (0.08)
Adjusted EPS 1.31$ 0.19$ (0.05)$ 0.14$ -$ 1.45$ NON-GAAP MEASURE
3Q06 ACTUAL RESULTS:
Reported GAAP EPS 1.57$ 0.24$ (0.04)$ 0.20$ 0.02$ 1.79$
Income from Discontinued Operations 0.10 - - - - 0.10 GAAP MEASURES
1.47 0.24 (0.04) 0.20 0.02 1.69
Special Items, Non-qualifying Hedges, and Synfuel Results Included in Operations:
Non-qualifying hedges 0.20 - - - - 0.20
Merger-related costs (0.01) - - - - (0.01)
Synthetic fuel facility results 0.11 - - - - 0.11
Workforce reduction costs (0.07) - - - - (0.07)
Total Special Items, Non-qualifying Hedges, and Synfuel Results 0.23 - - - - 0.23
Adjusted EPS 1.24$ 0.24$ (0.04)$ 0.20$ 0.02$ 1.46$ NON-GAAP MEASURE
EARNINGS GUIDANCE Constellation Energy is unable to reconcile its earnings guidance excluding special items, non-qualifying hedges, and synfuel results to GAAP earnings per share because we do not predict the future impact of special items such as the cumulative effect of changes in accounting principles, the disposition of assets, economic, nonqualifying hedges or synfuel results.
EPS Before Discontinued Operations
EPS Before Discontinued Operations

36
36
Adjusted EPS – Q4 2006We exclude special items and certain economic, non-qualifying fuel adjustment clause and gas transportation and storage hedges because we believe that it is appropriate for investors to consider results excluding these items, in addition to our results in accordance with GAAP. We have also adjusted earnings to exclude synfuel results due to the potential volatility and phase-out of the tax credits. We believe such a measure provides a picture of our results that is comparable among periods since it excludes the impact of items, which may recur occasionally, but tend to be irregular as to timing and magnitude, thereby distorting comparisons between periods. However, investors should note that this non-GAAP measure involves judgment by management (in particular, judgment as to what is or is not classified as a special item). We also use this measure to evaluate performance and for compensation purposes.
RECONCILIATION:Merchant Regulated Regulated OtherEnergy Electric Gas BGE Nonreg. Total
A B C D = (B+C) E F =(A+D+E)
4Q06 ACTUAL RESULTS:
Reported GAAP EPS 2.01$ 0.13$ 0.06$ 0.19$ 0.02$ 2.22$
Income from Discontinued Operations 0.76 - - - - 0.76 GAAP MEASURES
1.25 0.13 0.06 0.19 0.02 1.46
Special Items, Non-qualifying Hedges, and Synfuel Results Included in Operations:
Gain on sale of gas-fired plants (excluding High Desert) 0.26 - - - - 0.26
Non-qualifying Hedges 0.07 - - - - 0.07
Synthetic fuel facility results 0.04 - - - - 0.04
Workforce Reduction Costs (0.01) - - - - (0.01)
Merger-related costs 0.01 0.01 - 0.01 - 0.02
Total Special Items, Non-qualifying Hedges, and Synfuel Results 0.37 0.01 - 0.01 - 0.38
Adjusted EPS 0.88$ 0.12$ 0.06$ 0.18$ 0.02$ 1.08$ NON-GAAP MEASURE
EPS Before Discontinued Operations

37
37
Adjusted EPS – YTD 2006We exclude special items and certain economic, non-qualifying fuel adjustment clause and gas transportation and storage hedges because we believe that it is appropriate for investors to consider results excluding these items, in addition to our results in accordance with GAAP. We have also adjusted earnings to exclude synfuel results due to the potential volatility and phase-out of the tax credits. We believe such a measure provides a picture of our results that is comparable among periods since it excludes the impact of items, which may recur occasionally, but tend to be irregular as to timing and magnitude, thereby distorting comparisons between periods. However, investors should note that this non-GAAP measure involves judgment by management (in particular, judgment as to what is or is not classified as a special item). We also use this measure to evaluate performance and for compensation purposes.
RECONCILIATION:
Total
2006 ACTUAL RESULTS:
Reported GAAP EPS 5.16$
Income from Discontinued Operations 1.04 GAAP MEASURES
4.12
Special Items and Non-qualifying Hedges Included in Operations:
Non-qualifying Hedges 0.21
Synthetic fuel facility results 0.16
Gain on sale of gas-fired plants (excluding High Desert) 0.26
Merger-related costs (0.03)
Workforce reduction costs (0.09)
Total Special Items, Non-qualifying Hedges, and Synfuel Results 0.51
Adjusted EPS 3.61$ NON-GAAP MEASURE
EPS Before Discontinued Operations

38
38
3Q07 Merchant Gross Margin and Below Gross MarginWe utilize the non-GAAP financial measure of Gross Margin to highlight the relationship between the costs of and prices for energy in our Merchant Energy business categories (i.e., Mid-Atlantic Fleet, Plants with PPAs, Wholesale Competitive Supply, NewEnergy, and QFs/Other). We believe this non-GAAP measure helps investors to better understand the changes in the level of our Merchant Energy operating results for these categories from period to period.
RECONCILIATION:GAAP Adjustments Merchant
GAAP Fuel & Purchased In Arriving Gross MarginMerchant Revenue & Expense Categories Revenues Energy Expenses Difference At Gross Margin Notes (Non-GAAP)
($ millions)Mid-Atlantic Fleet 1,364.6$ 998.9$ 365.7$ (86)$ a, b, c 280$ Plants with PPAs 204.1 20.8 183.3 9 a 192 Wholesale Competitive Supply 1,291.5 1,031.7 259.8 123 a , d, e, g 384 **NewEnergy 2,291.0 2,172.1 118.9 (6) d 112 QFs / Other 29.0 - 29.0 (4) e, f 25
Total Merchant 5,180.2$ 4,223.5$ 956.7$ 36$ 993$
Adjustments Merchant Below Arriving At Merchant Gross Margin
Total Merchant: GAAP Below Gross Margin (Non-GAAP)Revenues less fuel and purchased energy expenses 956.7$ 993$ Operations and maintenance expenses (486.1) 16 h, i, j (470) Depreciation, depletion, and amortization (66.8) (4) i, j (71) Taxes other than income taxes (29.1) 29 k - Accretion of asset retirement obligations (16.0) 16 k -
Income From Operations 358.7 452 Gain on initial Public Offering of CEP LLC 39.2 (39) g - Other income / (expense) 1.6 (44) b, k, l (43)
EBIT N/A 409 Fixed charges (21.3) 6 j, l (16)
Income Before Income Taxes 378.2 393 Income tax expense (151.7) (2) j, m (153)
Income from Continuing Operations 226.5 240 Income from discontinued operations 0.7 (1) m -
Net Income 227.2$ 240$
Details of Adjustments Made in Arriving at Merchant Gross Margin:a Adjustment to remove ($85 million) gain from Mid-Atlantic Fleet and $9 million loss from Plants with PPA's of estimated gross margin created through active portfolio
management more appropriately categorized as a competitive supply activity.b Adjustment to remove ($5 million) of decommissioning revenues from non-GAAP gross margin measure and included in Other Income. The offsetting decommissioning
expense was recorded in accretion of asset retirement obligations.c Adjustment to remove $4 million of other indirect costs from non-GAAP gross margin as they are more appropriately categorized as operating expenses.d Adjustment to remove $3 million loss in Wholesale Competitive Supply and ($6 million) gain in NewEnergy related to economic, non-qualifying hedges of gas transport and storage contracts.e Adjustment to remove synfuel losses from Wholesale Competitive Supply gross margin of $5 million and Other gross margin of $6 million.f Adjustment to reflect ($10 million) of direct costs in Other for purposes of non-GAAP gross margin measure.g Adjustment to move $39 million gain on sale of stock by CEP to gross margin to reflect management's view of this activity as part of operations
Details of Adjustments Made in Arriving at Merchant Below Gross Margin:h Adjustment detailed in "c" and "f" above are offset by adjustments made to O&M costs. i Adjustment to reclassify certain allocated costs totaling $6 million from O&M to Depreciation and Amortization.j Adjustment to remove Synfuel results, which are not included in determining Merchant Below Gross Margin - $4 million in O&M, $2 million in D&A, $2 million in Fixed Charges, and ($1 million) from income tax expense.k Adjustment to reflect management's view of these items as Other Income / Expense.l Adjustment to move Interest Income of $4 million recorded in Other Income / Expense to Fixed Charges (to show a fixed charge amount net of interest income).m Adjustment to remove Special Items and taxes ($1 million) which are not included in determining Merchant Below Gross Margin.
** Excludes $38 million of operating expenses, depreciation, depletion and amortization, and interest expense associated with our Upstream Gas properties
PROJECTED GROSS MARGIN AND RESULTS BELOW GROSS MARGIN:Constellation Energy is unable to reconcile its projected gross margin or results below gross margin to GAAP because we do not predict the future impact of reconciling items or special items such as the cumulative effect of changes in accounting principles and the disposition of assets.
Quarter Ended September 30, 2007
39
39
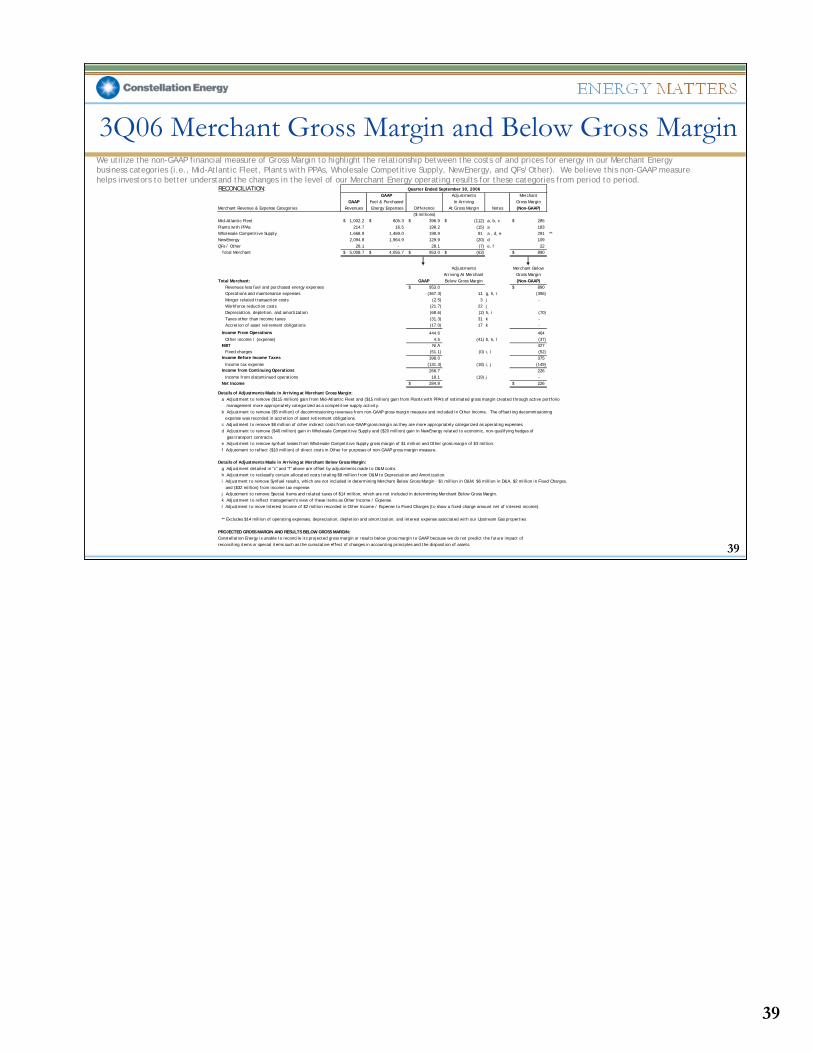
3Q06 Merchant Gross Margin and Below Gross MarginWe utilize the non-GAAP financial measure of Gross Margin to highlight the relationship between the costs of and prices for energy in our Merchant Energy business categories (i.e., Mid-Atlantic Fleet, Plants with PPAs, Wholesale Competitive Supply, NewEnergy, and QFs/Other). We believe this non-GAAP measure helps investors to better understand the changes in the level of our Merchant Energy operating results for these categories from period to period.
RECONCILIATION:GAAP Adjustments Merchant
GAAP Fuel & Purchased In Arriving Gross MarginMerchant Revenue & Expense Categories Revenues Energy Expenses Difference At Gross Margin Notes (Non-GAAP)
($ millions)Mid-Atlantic Fleet 1,002.2$ 605.3$ 396.9$ (112)$ a, b, c 285$ Plants with PPAs 214.7 16.5 198.2 (15) a 183 Wholesale Competitive Supply 1,668.9 1,469.0 199.9 91 a , d, e 291 **NewEnergy 2,094.8 1,964.9 129.9 (20) d 109 QFs / Other 28.1 - 28.1 (7) e, f 22
Total Merchant 5,008.7$ 4,055.7$ 953.0$ (63)$ 890$
Adjustments Merchant Below Arriving At Merchant Gross Margin
Total Merchant: GAAP Below Gross Margin (Non-GAAP)Revenues less fuel and purchased energy expenses 953.0$ 890$ Operations and maintenance expenses (367.3) 11 g, h, i (356) Merger related transaction costs (2.5) 3 j - Workforce reduction costs (21.7) 22 jDepreciation, depletion, and amortization (68.6) (2) h, i (70) Taxes other than income taxes (31.3) 31 k - Accretion of asset retirement obligations (17.0) 17 k -
Income From Operations 444.6 464 Other income / (expense) 4.5 (41) b, k, l (37)
EBIT N/A 427 Fixed charges (51.1) (0) i, l (52)
Income Before Income Taxes 398.0 375 Income tax expense (131.3) (18) i, j (149)
Income from Continuing Operations 266.7 226 Income from discontinued operations 18.1 (19) j -
Net Income 284.8$ 226$
Details of Adjustments Made in Arriving at Merchant Gross Margin:a Adjustment to remove ($115 million) gain from Mid-Atlantic Fleet and ($15 million) gain from Plants with PPA's of estimated gross margin created through active portfolio
management more appropriately categorized as a competitive supply activity.b Adjustment to remove ($5 million) of decommissioning revenues from non-GAAP gross margin measure and included in Other Income. The offsetting decommissioning
expense was recorded in accretion of asset retirement obligations.c Adjustment to remove $8 million of other indirect costs from non-GAAP gross margin as they are more appropriately categorized as operating expenses.d Adjustment to remove ($40 million) gain in Wholesale Competitive Supply and ($20 million) gain in NewEnergy related to economic, non-qualifying hedges of gas transport contracts.e Adjustment to remove synfuel losses from Wholesale Competitive Supply gross margin of $1 million and Other gross margin of $3 million.f Adjustment to reflect ($10 million) of direct costs in Other for purposes of non-GAAP gross margin measure.
Details of Adjustments Made in Arriving at Merchant Below Gross Margin:g Adjustment detailed in "c" and "f" above are offset by adjustments made to O&M costs. h Adjustment to reclassify certain allocated costs totaling $8 million from O&M to Depreciation and Amortization.i Adjustment to remove Synfuel results, which are not included in determining Merchant Below Gross Margin - $1 million in O&M, $6 million in D&A, $2 million in Fixed Charges, and ($32 million) from income tax expense.j Adjustment to remove Special Items and related taxes of $14 million, which are not included in determining Merchant Below Gross Margin.k Adjustment to reflect management's view of these items as Other Income / Expense.l Adjustment to move Interest Income of $2 million recorded in Other Income / Expense to Fixed Charges (to show a fixed charge amount net of interest income).
** Excludes $14 million of operating expenses, depreciation, depletion and amortization, and interest expense associated with our Upstream Gas properties
PROJECTED GROSS MARGIN AND RESULTS BELOW GROSS MARGIN:Constellation Energy is unable to reconcile its projected gross margin or results below gross margin to GAAP because we do not predict the future impact of reconciling items or special items such as the cumulative effect of changes in accounting principles and the disposition of assets.
Quarter Ended September 30, 2006

40
40
Cash FlowsThe following is a reconciliation of the non-GAAP financial measures of Net Cash Flow before Debt Issuances/Payments and Free Cash Flow. We utilize these non-GAAP measures because we believe they are helpful in understanding our ability to reduce debt by existing cash.
RECONCILIATION:
QTD SEPTEMBER ACTUAL RESULTS:Net cash provided by operating activities (GAAP measure) 207 Adjustment for derivative contracts presented as financing activities under SFAS 149 (19) Adjusted Net Cash Provided by Operating Activities 188$ NON-GAAP MEASURE
Net cash used in investing activities (GAAP measure) (533)
Net Cash Used in Financing Activities (Excl. Debt-Related Sources & Uses) *Common stock dividends paid (79) Proceeds from issuance of common stock 8 Other financing activities, excluding SFAS 149 activities included in operating 4 Adjusted Net Cash Used in Financing Activities (67)
Net Cash Flow before Debt Issuances/(Payments) (412) NON-GAAP MEASURE
Less: Proceeds from issuance of common stock (8) Add: Reacquisition of common stock - Add: Common stock dividends paid 79
Free Cash Flow (341)$ NON-GAAP MEASURE
* Total GAAP Cash Used in Financing Activities (incl. debt-related sources & uses) was ($90) million QTD September 07.
PROJECTED CASH FLOWS:Constellation Energy is unable to provide a reconciliation of these measures for Projected 2007 because it does not prepare a forecasted statement of cash flows on a GAAP basis.
Q3 2007($ millions)

41
41
Net Debt to Total CapitalDebt to Total Capital is a non-GAAP ratio that excludes unamortized discounts and premiums, reduces debt by our cash balance, and includes minority interests in equity. In addition, we reflect a 50 percent equity credit for our trust preferred securities, we exclude our securitized debt, and we remove the non-economic impact commodity hedges and cash collateral held, similar to the evaluation performed by major credit rating agencies. Management believes this non-GAAP measures provide investors useful information on our leverage because it is consistent with the evaluation performed by rating agencies, takes into account minority equity interests in our consolidated affiliates and cash available to reduce debt, and facilitates comparability between periods.
RECONCILIATION:
Total long-term debt (gross of current portion) 4,735.4$ 4,735.4$ 4,719.8$ 4,719.8$ 4,849.3$ 4,849.3$ 4,610.9$ 4,610.9$ 3,874.4$ 3,874.4$
Fair value decrease (increase) in fixed to floating rate swap included in long-term debt (3.8) 16.3 7.1 0.9 -
6.20% deferrable interest subordinated debentures due
October 15, 2043 to BGE wholly owned BGE Capital
Trust II relating to trust originated preferred securities 257.7 257.7 257.7 257.7 257.7 257.7 257.7 257.7 250.0 250.0 50% Equity credit to trust preferred securities - (125.0) - (125.0) - (125.0) - (125.0) - (125.0)
Adjustment to include High Desert Lease on Balance Sheet at December 31, 2001 - - - - - - - - - 221.0 Short-term borrowings - - - - - - 0.7 0.7 975.0 975.0 Unamortized discount and premium (5.1) - (5.3) - (5.9) - (8.0) - (5.2) - Subtotal 4,988.0 4,864.3 4,972.2 4,868.8 5,101.1 4,989.1 4,861.3 4,745.2 5,094.2 5,195.4 LESS: Cash - 1,551.7 - 1,968.0 - 2,289.1 - 813.0 - 72.4 Total Net Debt 4,988.0 3,312.6 4,972.2 2,900.8 5,101.1 2,700.0 4,861.3 3,932.2 5,094.2 5,123.0 Rate stabilzation securitization bonds of BGE (623.2) (623.2) - - - Net Debt for Debt to Capital Ratio 4,988.0 2,689.4 32.4% 4,972.2 2,277.6 29.3% 5,101.1 2,700.0 35.0% 4,861.3 3,932.2 42.8% 5,094.2 5,123.0 54.6%
BGE Preference Stock Not Subject To Mandatory Redemption 190.0 190.0 190.0 190.0 190.0 190.0 190.0 190.0 190.0 190.0 Minority Interests - 19.9 - 20.7 - 94.5 - 22.4 - 101.8 Common shareholders' equity 5,266.6 5,266.6 5,159.0 5,159.0 4,611.7 4,611.7 4,915.5 4,915.5 3,843.6 3,843.6
Subtotal 5,456.6 5,476.5 5,349.0 5,369.7 4,801.7 4,896.2 5,105.5 5,127.9 4,033.6 4,135.4 50% Equity credit to trust preferred securities - 125.0 - 125.0 - 125.0 - 125.0 - 125.0
Total Equity 5,456.6 5,601.5 67.6% 5,349.0 5,494.7 70.7% 4,801.7 5,021.2 65.0% 5,105.5 5,252.9 57.2% 4,033.6 4,260.4 45.4%
Total Capitalization 10,444.6 8,914.1 10,321.2 8,395.5 9,902.8 7,721.2 9,966.8 9,185.1 9,127.8 9,383.4
Rate stabilzation securitization bonds of BGE (623.2) (623.2) - - - Total capitalization for Debt to Capital Ratio 10,444.6$ 8,290.9$ 100.0% 10,321.2$ 7,772.3$ 100.0% 9,902.8$ 7,721.2$ 100.0% 9,966.8$ 9,185.1$ 100.0% 9,127.8$ 9,383.4$ 100.0%
Exclude commodity hedge AOCI Balance from common shareholders' equity and rate stabilization bonds 1,049 963 1,379 323 (30.0) Counterparty cash collateral held reflected as a reduction of cash balance and rate stabilzation bonds (331) (404) (253) (388) - Adjusted Net Debt to Total Capital 31.2% 29.3% 31.6% 43.7% 54.8%
PROJECTED LEVERAGE RATIOS:Constellation Energy is unable to provide a reconciliation of this measure for Projected 2007 because it does not prepare a forecasted balance sheet on a GAAP basis.
September 30, 2007
GAAP Balances Non-GAAP Ratio
June 30, 2007
GAAP Balances Non-GAAP Ratio
December 31, 2005
GAAP Balances Non-GAAP Ratio
December 31, 2001
GAAP Balances Non-GAAP Ratio($ millions)
December 31, 2006
GAAP Balances Non-GAAP Ratio