constellation energy 2008 Third Quarter Supporting Materials
54
1 Constellation Energy Q3 2008 Earnings Presentation November 6, 2008 Kevin Hadlock: Thank you. Welcome to our third quarter earnings call. We appreciate you being with us this morning.
-
Upload
finance12 -
Category
Economy & Finance
-
view
1.103 -
download
0
Transcript of constellation energy 2008 Third Quarter Supporting Materials
1
Constellation EnergyQ3 2008 Earnings Presentation
November 6, 2008
Kevin Hadlock:
Thank you. Welcome to our third quarter earnings call. We appreciate you being with us this morning.
2
2
Forward Looking Statements DisclosureCertain statements made in this presentation are forward-looking statements and may contain words such as “believes,” “anticipates,”“expects,” “intends,” “plans,” and other similar words. We also disclose non-historical information that represents management’s expectations, which are based on numerous assumptions. These statements are not guarantees of future performance and are subject to risks anduncertainties that could cause actual results to be materially different from projected results. These risks include, but are not limited to: the timing and extent of changes in commodity prices for energy including coal, natural gas, oil, electricity, nuclear fuel, freight and emissions allowances and the impact of such changes on our liquidity requirements; the timing and extent of deregulation of, and competition in, the energy markets, and the rules and regulations adopted on a transitional basis in those markets; the conditions of the capital markets, interest rates, availability of credit, liquidity and general economic conditions, as well as Constellation Energy’s and BGE’s ability to maintain their current credit ratings; the ability to attract and retain customers in our competitive supply activities and to adequately forecast their energy usage; the effectiveness of Constellation Energy’s and BGE’s risk management policies and procedures and the ability and willingness of our counterparties to satisfy their financial and other commitments; the liquidity and competitiveness of wholesale markets for energy commodities; uncertainties associated with estimating natural gas reserves, developing properties and extracting gas; operational factors affecting the operations of our generating facilities (including nuclear facilities) and BGE’s transmission and distribution facilities, including catastrophic weather-related damages, unscheduled outages or repairs, unanticipated changes in fuel costs or availability, unavailability of coal or gas transportation or electric transmission services, workforce issues, terrorism, liabilities associated with catastrophic events, and other events beyond our control; the inability of BGE to recover all its costs associated with providing customers service; the effect of weather and general economic and business conditions on energy supply, demand, and prices; regulatory or legislative developments that affect deregulation, transmission or distribution rates, demand for energy, or that would increase costs, including costs related to nuclear power plants, safety, or environmental compliance; the ability of our regulated and non-regulated businesses to comply with complex and/or changing market rules and regulations; the actual outcome of uncertainties associated with assumptions and estimates using judgment when applying critical accounting policies and preparing financial statements, including factors that are estimated in applying mark-to-market accounting, such as the ability to obtain market prices and in the absence of verifiable market prices, the appropriateness of models and model impacts (including, but not limited to, extreme contractual load obligations, unit availability, forward commodity prices, interest rates, correlation and volatility factors); changes in accounting principles or practices; losses on the sale or write-down of assets due to impairment events or changes in managementintent with regard to either holding or selling certain assets; our ability to successfully identify and complete acquisitions and sales of businesses and assets; cost and other effects of legal and administrative proceedings that may not be covered by insurance, including environmental liabilities; the likelihood and timing of the completion of the pending merger with MidAmerican Energy Holdings Company and the terms and conditions of any regulatory approvals; and the ability to complete our strategic initiatives to improve our liquidity. Given these uncertainties, you should not place undue reliance on these forward-looking statements. Please see our periodic reports filed with the SEC for more information on these factors. These forward-looking statements represent estimates and assumptions only as of the date of this presentation, and no duty is undertaken to update them to reflect new information, events or circumstances.
On Slide 2, before we begin our presentation, let me remind you that our comments today will include forward-looking statements, which are subject to certain risks and uncertainties.
For a complete discussion of these risks, we encourage you to read our documents on file with the SEC.
Our presentation today is being webcast, and the slides are available on our website, which you can access at www.constellation.com under Investor Relations.
3
3
Use of Non-GAAP Financial MeasuresConstellation Energy presents several non-GAAP financial measures in this presentation in addition to information in accordance with generally accepted accounting principles (GAAP) amounts. This includes measures such as adjusted earnings per share (adjusted EPS), Gross Margin, EBIT, EBITDA, Net Debt to Total Capital, Free Cash Flow, and Adjusted Net Debt to AdjustedTotalCapital.
Constellation Energy provides its earnings and annual earnings guidance in terms of adjusted EPS. Adjusted EPS differs from reported GAAP EPS because it excludes the cumulative effects of changes in accounting principles, discontinued operations, special items (which we define as significant items that are not related to our ongoing, underlying business or which distort comparability of results) included in operations, the impact of certain economic, non-qualifying hedges, and synfuel earnings. The mark-to-market impact of economic non-qualifying hedges is significant to reported results, but economically neutral to the company in that offsetting gains or losses on underlying accrual positions will be recognized in the future. Synfuel earnings are excluded due to the potential for oil price volatility to result in a difficult-to-forecast phase-out of tax credits. We present adjusted EPS because we believe that it is appropriate for investors to consider results excluding these items in addition to our results in accordance with GAAP. We believe this measure provides a picture of our results that is comparable among periods since it excludes the impact of items such as workforce reduction costs or gains and losses on the sale of assets, which may recur occasionally, but tend to be irregular as to timing, thereby distorting comparisons between periods. However, investors should note that this non-GAAP measure involves judgment by management (in particular, judgment as to what is classified as a special item or an economic, non-qualifying hedge to be excluded from adjusted earnings). This non-GAAP measure is also used to evaluate management's performance and for compensation purposes. Constellation Energy is unable to reconcile its annual earnings guidance to GAAP earnings per share because we do not predict the future impact of special items, economic, non-qualifying hedges or synfuel earnings due to the difficulty of doing so. The impact of special items, economic, non-qualifying hedges, or synfuel earnings could be material to our operating results computed in accordance with GAAP.
We note that adjusted EPS and the other non-GAAP measures utilized by Constellation Energy are not in accordance with GAAP and should not be viewed as an alternative to GAAP information. A reconciliation of non-GAAP information to GAAP information is included either on the slide where the information appears or on one of the slides in the Non-GAAP Measures section provided at the end of the presentation, along with additional information on why and how Constellation Energy uses this information. Please see the Summary of Non-GAAP Measures included to find the appropriate GAAP reconciliation and its related slide(s). These slides are only intended to be reviewed in conjunction with the oral presentation to which they relate.
On slide 3, you will notice we will use Non-GAAP financial measures in this presentation to help you understand our operating performance.
We’ve attached an Appendix to the charts on the website reconcilingNon-GAAP measures to GAAP measures.
Turning to slide 4…
Non-solicitationThis communication is being made in respect of the proposed merger transaction involving Constellation Energy and MidAmerican Energy Holdings Company. In connection with the proposed transaction, Constellation Energy has filed with the Securities and Exchange Commission a preliminary proxy statement and will mail a definitive proxy statement to its shareholders. Shareholders are encouraged to read the definitive proxy statement regarding the proposed transaction when it becomes available because it will contain important information. Shareholders will be able to obtain a free copy of the proxy statement, as well as other filings made by Constellation Energy regarding Constellation Energy, MidAmerican Energy Holdings Company and the proposed transaction, without charge, at the Securities and Exchange Commission’s Internet site (http://www.sec.gov). These materials can also be obtained, when available, without charge, by directing a request to Constellation Energy per the investor relations contact information below.
Constellation Energy, MidAmerican Energy Holdings Company and their respective directors and executive officers and other persons may be deemed to be participants in the solicitation of proxies in respect of the proposed transaction. Information regarding Constellation Energy’s directors and executive officers is available in Constellation Energy’s notice of annual meeting and proxy statement for its most recent annual meeting and Constellation Energy’s Annual Report on Form 10-K for the year ended December 31, 2007, which were filed with the Securities and Exchange Commission on April 29, 2008 and February 27, 2008, respectively. Other information regarding the participants in the solicitation and a description of their direct and indirect interests, by security holdings or otherwise, is contained in the preliminary proxy statement and other relevant materials filed or to be filed with the Securities and Exchange Commission.
4
Constellation Energy has filed with the Securities and Exchange Commission a preliminary proxy statement and other relevant documents regarding the proposed transaction with MidAmerican Energy Holdings Company. A definitive proxy statement will be sent to security holders of Constellation Energy seeking approval of the proposed transaction. We urge investors to read the definitive proxy statement and any other relevant documents when they become available, because they willcontain important information about Constellation Energy and theproposed transaction.
With that, I’d like to turn the call over to Mayo Shattuck, Chairman, President and CEO of Constellation Energy…
4
Mayo A. Shattuck III
Chairman, President and Chief Executive Officer
Constellation Energy
Thank you, and good morning everyone. I’d like to begin today with an overview of the last few months.
The shock to the financial system in the past several months is still being digested and analyzed, and although we have our differing macro theories about its causes, I can at least provide some perspective on its effects. Companies like ours are dependent on access to capital in two fundamental ways: first for fulfilling its capital expenditure programs, and second for the liquidity capital required to operate and support its commercial businesses. In 2008, we had planned for a capex program of $2.4 billion, a substantial increase over prior years primarily because of the environmental upgrades required on our coal plants. Since this program was larger than our planned cash generation for the year, we had anticipated going to the market to raise capital during the year. During the first and second quarter of 2008, we raised $1.1 billion in new debt and hybrid securities as part of this program.
Our liquidity capital requirements are funded by lines of credit and cash. The main drivers of the use of liquidity capital in our case has been hedging the generation fleet, hedging our customer supply business in both power and gas, and hedging our international coal business. We will describe this in much detail today, but it is important to note that our approach has been to lock in economic value by hedging our exposures to the extent possible. In this way, we have been able to reasonably forecast the economic exposure and long-term cash flows from our fleet based on our hedge ratios, and also reasonably lock in a spread in our commercial businesses over the life of the contracts.
This formula worked well for many years while access to liquidity capital was available and the cost of that capital was reasonable. We managed the total liquidity capital requirement by comparing our liquidity resources to the requirements if we were to be downgraded by the ratings agencies. When we entered the infamous week of September 15, when Lehman and AIG failed, and when the other major investment banks altered their strategic courses through mergers or bank charters, we were threatened by a downgrade by the ratings agencies after they witnessed violent moves in our stock price and CDS spreads. To avoid the downgrade and potential restriction of our access to credit resources, we engaged in an immediate capital infusion by MidAmerican in the amount of $1 billion. We also agreed to merge into MidAmerican for a price of $26.50 per share. The tumultuous nature of the markets that week caused a tremendous amount of uncertainty over how our counterparties would react if given any signal that a downgrade was possible. As a result, it was imperative that we receive the capital commitment by the end of that Friday. This issue explains why a last minute proposal by EDF and certain private equity firms on Friday was not accepted, in that it did not address the immediate financing need on that day, nor did it spell out important issues such as ownership structure and financing sources, both of which are so important in assessing the probability of a transaction closing.
(cont on next page)
5
Since the merger agreement was signed, the markets worsened, and specifically for power companies, a declining power price environment has caused all companies in our space to decline in price significantly. This has given us an even stronger perspective that a merger partner like MidAmerican has important near and long-term advantages in terms of our access to capital. We also believe that the merger is a compelling proposition to a number of our constituencies, particularly the State of Maryland which must look to the benefit that such a merger has to the BGE ratepayers. In addition, the history of MidAmerican’s management approach, of keeping its subsidiaries as autonomous units, provides some of the qualitative benefits that employees and other state stakeholders always examine in these circumstances. While we have been diligently working on the transaction process with MidAmerican, we have also been hard at work to reduce risk and collateral requirements to adjust to a new environment where prices have declined, markets are illiquid and credit is scarce. We will discuss today our efforts on all fronts. Risk is being reduced through the pursuit of sales of certain businesses and the overall lowering and flattening of our book of business. Collateral requirements are also being reduced through these actions. Since the merger announcement, we have changed the focus of our commodities business to prioritize risk and collateral reduction over the near-term realization of profits. In practical terms, this means that we have spent in the third quarter and will spend in the fourth quarter some money to achieve a lower risk and collateral profile. We are making these decisions with the full concurrence of MidAmerican, such that we have the business appropriately right-sized to fit its long-term strategy.
We are in the midst of our five-year planning process and are assessing how the impact of the current market environment and expected execution of our strategic initiatives will affect our 2009 earnings and cash flow. Our planning efforts are focused on Generation, BGE, Customer Supply and activities in the Global Commodities Group that will either be in a wind-down bucket or an on-going bucket. Obviously, many of the strategic decisions made over the last few months, including those activities we expect to divest, combined with the current economic environment, introduce a degree of uncertainty around earnings expectations for the balance of 2008 and 2009. As such, we are not in a position to affirm our previously stated guidance. That said, Jack will outline our fourth quarter expectations for BGE, Generation, and Customer Supply backlog, as we customarily do each quarter, and I do expect that we will be able to provide an outlook for 2009 by the time of the shareholder vote in late December or January.
Let me take a moment to review our credit sources. This morning we announced that we anticipate to close approximately $1.2 billion of the previously announced credit facility as early as next week. In addition, MidAmerican has committed to provide Constellation up to $350 million in additional liquidity resources. Jack will be providing more specific information on our liquidity position in a moment.
Finally, I have asked Brenda Boultwood, our Chief Risk Officer, to speak this morning about how we are managing risk. It is important to note that the interrelationships between risk, credit support, and earnings are complex, but we will attempt to describe some of the most significant moving parts. As an example, the asymmetry that exists in the margining requirements of some of our businesses has been a major driver of collateral use. When coal prices soared earlier this year, we were required to post collateral to our customers, while receiving none from our suppliers. More recently, as power prices dropped, we were required to post collateral to our suppliers while getting none from our load serving customers. And as volatility in all commodities has increased, the exchanges and ISOs have generally increased the credit requirements to conduct business through them. Most market participants, including ourselves, have adjusted their pricing models to account for the significant increases in the cost of doing business in this credit environment. We have actually seen the market accept these increased credit costs in our origination businesses.
Turning to slide 6…
6
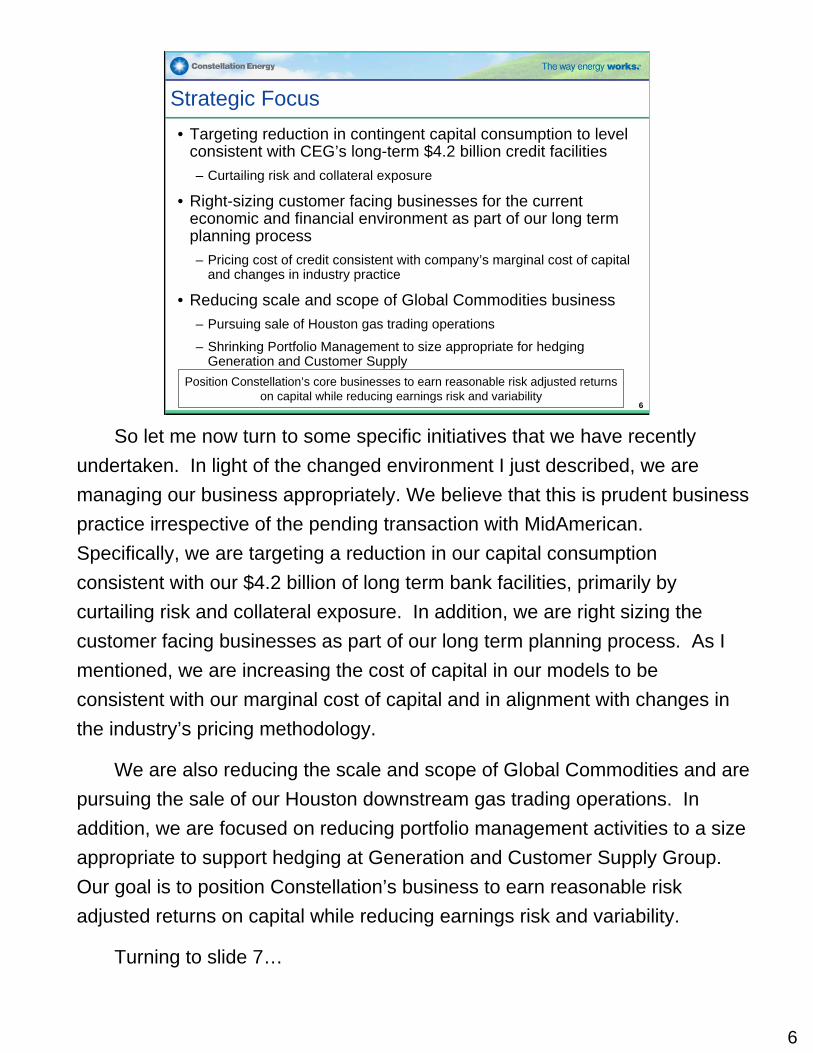
Strategic Focus• Targeting reduction in contingent capital consumption to level
consistent with CEG’s long-term $4.2 billion credit facilities– Curtailing risk and collateral exposure
• Right-sizing customer facing businesses for the current economic and financial environment as part of our long term planning process– Pricing cost of credit consistent with company’s marginal cost of capital
and changes in industry practice
• Reducing scale and scope of Global Commodities business– Pursuing sale of Houston gas trading operations
– Shrinking Portfolio Management to size appropriate for hedging Generation and Customer Supply
Position Constellation’s core businesses to earn reasonable risk adjusted returns on capital while reducing earnings risk and variability
So let me now turn to some specific initiatives that we have recently undertaken. In light of the changed environment I just described, we are managing our business appropriately. We believe that this is prudent business practice irrespective of the pending transaction with MidAmerican. Specifically, we are targeting a reduction in our capital consumption consistent with our $4.2 billion of long term bank facilities, primarily by curtailing risk and collateral exposure. In addition, we are right sizing the customer facing businesses as part of our long term planning process. As I mentioned, we are increasing the cost of capital in our models to be consistent with our marginal cost of capital and in alignment with changes in the industry’s pricing methodology.
We are also reducing the scale and scope of Global Commodities and are pursuing the sale of our Houston downstream gas trading operations. In addition, we are focused on reducing portfolio management activities to a size appropriate to support hedging at Generation and Customer Supply Group. Our goal is to position Constellation’s business to earn reasonable risk adjusted returns on capital while reducing earnings risk and variability.
Turning to slide 7…
6
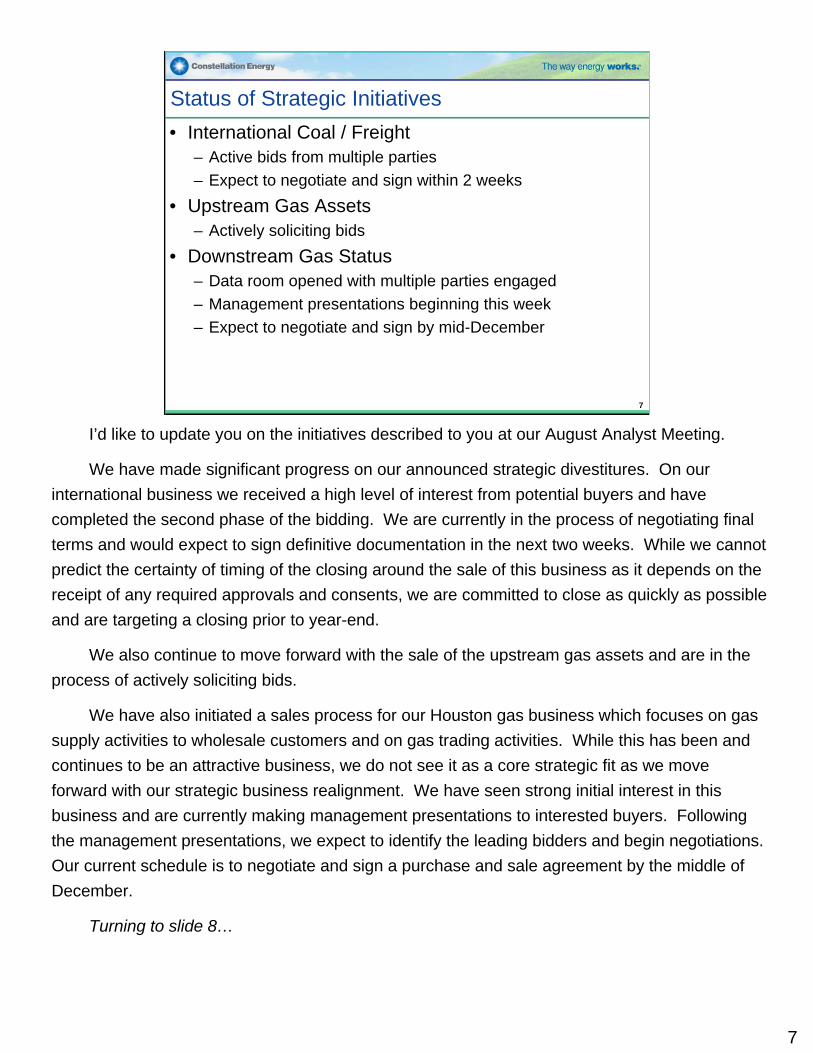
Status of Strategic Initiatives• International Coal / Freight
– Active bids from multiple parties – Expect to negotiate and sign within 2 weeks
• Upstream Gas Assets– Actively soliciting bids
• Downstream Gas Status– Data room opened with multiple parties engaged– Management presentations beginning this week– Expect to negotiate and sign by mid-December
7
I’d like to update you on the initiatives described to you at our August Analyst Meeting.
We have made significant progress on our announced strategic divestitures. On our international business we received a high level of interest from potential buyers and have completed the second phase of the bidding. We are currently in the process of negotiating final terms and would expect to sign definitive documentation in the next two weeks. While we cannot predict the certainty of timing of the closing around the sale of this business as it depends on the receipt of any required approvals and consents, we are committed to close as quickly as possible and are targeting a closing prior to year-end.
We also continue to move forward with the sale of the upstream gas assets and are in the process of actively soliciting bids.
We have also initiated a sales process for our Houston gas business which focuses on gas supply activities to wholesale customers and on gas trading activities. While this has been and continues to be an attractive business, we do not see it as a core strategic fit as we move forward with our strategic business realignment. We have seen strong initial interest in this business and are currently making management presentations to interested buyers. Following the management presentations, we expect to identify the leading bidders and begin negotiations. Our current schedule is to negotiate and sign a purchase and sale agreement by the middle of December.
Turning to slide 8…
7
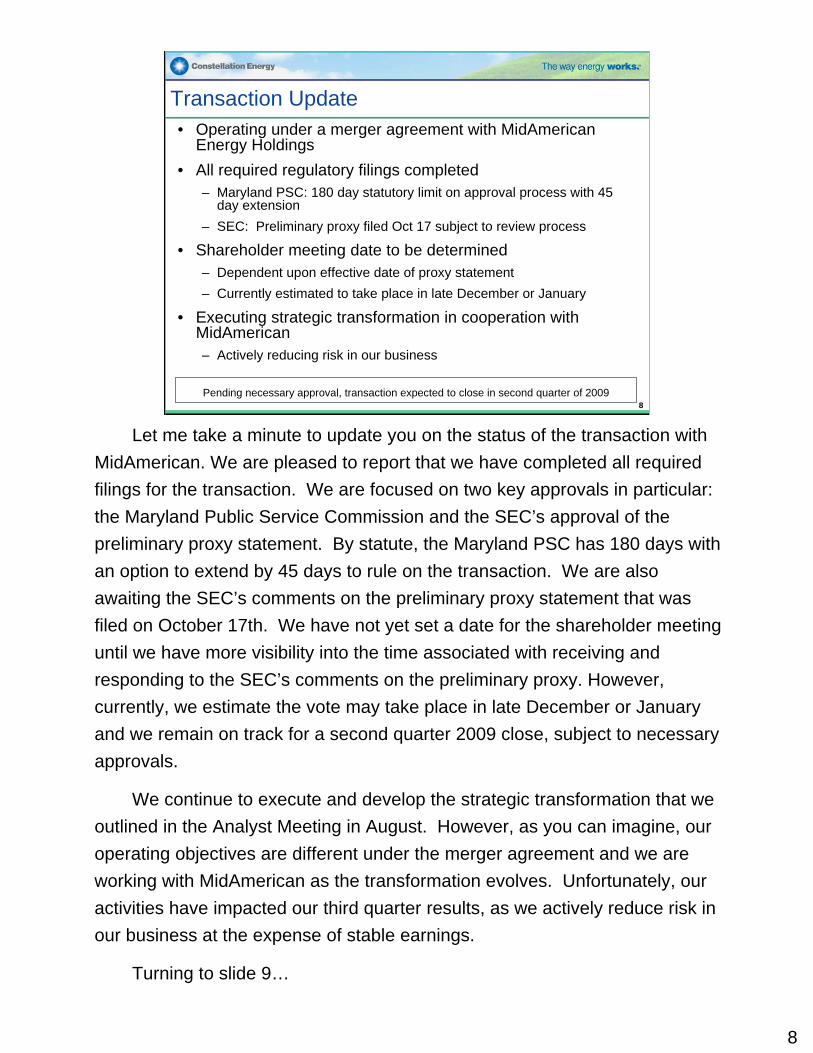
Pending necessary approval, transaction expected to close in second quarter of 2009
Transaction Update• Operating under a merger agreement with MidAmerican
Energy Holdings • All required regulatory filings completed
– Maryland PSC: 180 day statutory limit on approval process with 45 day extension
– SEC: Preliminary proxy filed Oct 17 subject to review process
• Shareholder meeting date to be determined– Dependent upon effective date of proxy statement– Currently estimated to take place in late December or January
• Executing strategic transformation in cooperation with MidAmerican– Actively reducing risk in our business
8
Let me take a minute to update you on the status of the transaction with MidAmerican. We are pleased to report that we have completed all required filings for the transaction. We are focused on two key approvals in particular: the Maryland Public Service Commission and the SEC’s approval of the preliminary proxy statement. By statute, the Maryland PSC has 180 days with an option to extend by 45 days to rule on the transaction. We are also awaiting the SEC’s comments on the preliminary proxy statement that was filed on October 17th. We have not yet set a date for the shareholder meeting until we have more visibility into the time associated with receiving and responding to the SEC’s comments on the preliminary proxy. However, currently, we estimate the vote may take place in late December or January and we remain on track for a second quarter 2009 close, subject to necessary approvals.
We continue to execute and develop the strategic transformation that we outlined in the Analyst Meeting in August. However, as you can imagine, our operating objectives are different under the merger agreement and we are working with MidAmerican as the transformation evolves. Unfortunately, our activities have impacted our third quarter results, as we actively reduce risk in our business at the expense of stable earnings.
Turning to slide 9…
8
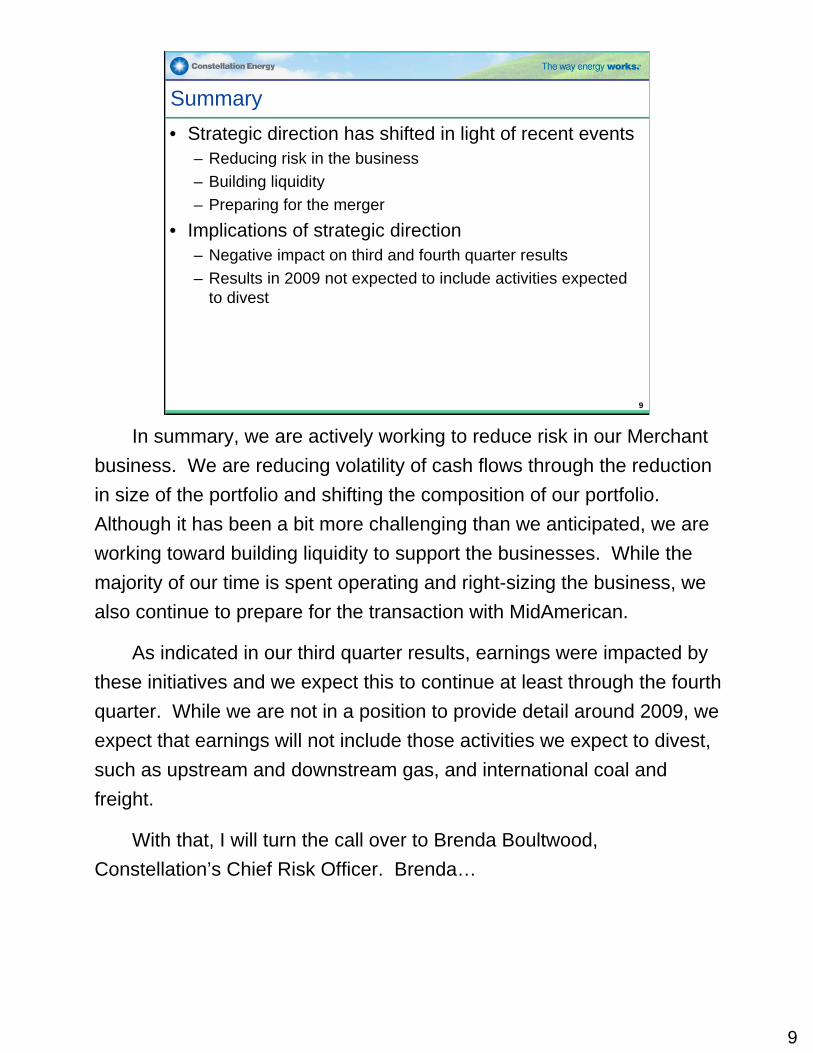
Summary• Strategic direction has shifted in light of recent events
– Reducing risk in the business– Building liquidity– Preparing for the merger
• Implications of strategic direction– Negative impact on third and fourth quarter results– Results in 2009 not expected to include activities expected
to divest
9
In summary, we are actively working to reduce risk in our Merchant business. We are reducing volatility of cash flows through the reduction in size of the portfolio and shifting the composition of our portfolio. Although it has been a bit more challenging than we anticipated, we are working toward building liquidity to support the businesses. While the majority of our time is spent operating and right-sizing the business, we also continue to prepare for the transaction with MidAmerican.
As indicated in our third quarter results, earnings were impacted by these initiatives and we expect this to continue at least through the fourth quarter. While we are not in a position to provide detail around 2009, we expect that earnings will not include those activities we expect to divest, such as upstream and downstream gas, and international coal and freight.
With that, I will turn the call over to Brenda Boultwood, Constellation’s Chief Risk Officer. Brenda…
9

10
Brenda L. BoultwoodSenior Vice President and Chief Risk Officer
Constellation Energy
11
11
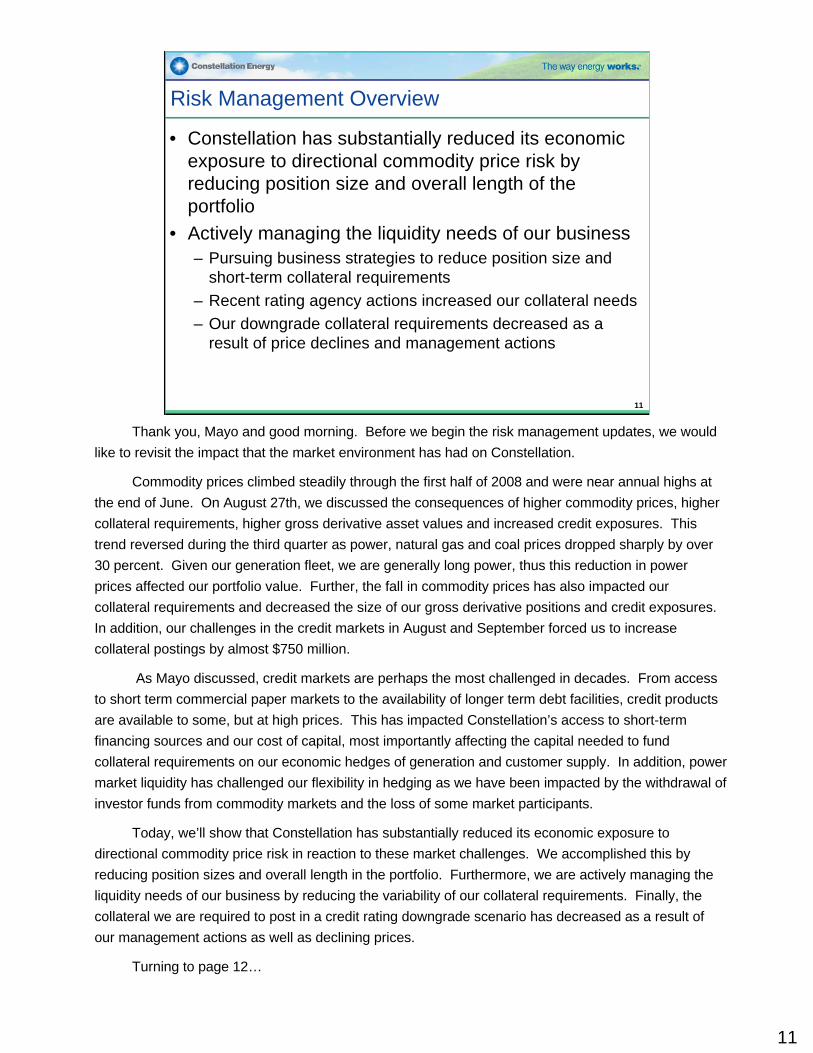
Risk Management Overview
• Constellation has substantially reduced its economic exposure to directional commodity price risk by reducing position size and overall length of the portfolio
• Actively managing the liquidity needs of our business– Pursuing business strategies to reduce position size and
short-term collateral requirements– Recent rating agency actions increased our collateral needs– Our downgrade collateral requirements decreased as a
result of price declines and management actions
Thank you, Mayo and good morning. Before we begin the risk management updates, we would like to revisit the impact that the market environment has had on Constellation.
Commodity prices climbed steadily through the first half of 2008 and were near annual highs at the end of June. On August 27th, we discussed the consequences of higher commodity prices, higher collateral requirements, higher gross derivative asset values and increased credit exposures. This trend reversed during the third quarter as power, natural gas and coal prices dropped sharply by over 30 percent. Given our generation fleet, we are generally long power, thus this reduction in power prices affected our portfolio value. Further, the fall in commodity prices has also impacted our collateral requirements and decreased the size of our gross derivative positions and credit exposures. In addition, our challenges in the credit markets in August and September forced us to increase collateral postings by almost $750 million.
As Mayo discussed, credit markets are perhaps the most challenged in decades. From access to short term commercial paper markets to the availability of longer term debt facilities, credit products are available to some, but at high prices. This has impacted Constellation’s access to short-term financing sources and our cost of capital, most importantly affecting the capital needed to fund collateral requirements on our economic hedges of generation and customer supply. In addition, power market liquidity has challenged our flexibility in hedging as we have been impacted by the withdrawal of investor funds from commodity markets and the loss of some market participants.
Today, we’ll show that Constellation has substantially reduced its economic exposure to directional commodity price risk in reaction to these market challenges. We accomplished this by reducing position sizes and overall length in the portfolio. Furthermore, we are actively managing the liquidity needs of our business by reducing the variability of our collateral requirements. Finally, the collateral we are required to post in a credit rating downgrade scenario has decreased as a result of our management actions as well as declining prices.
Turning to page 12…
12
12
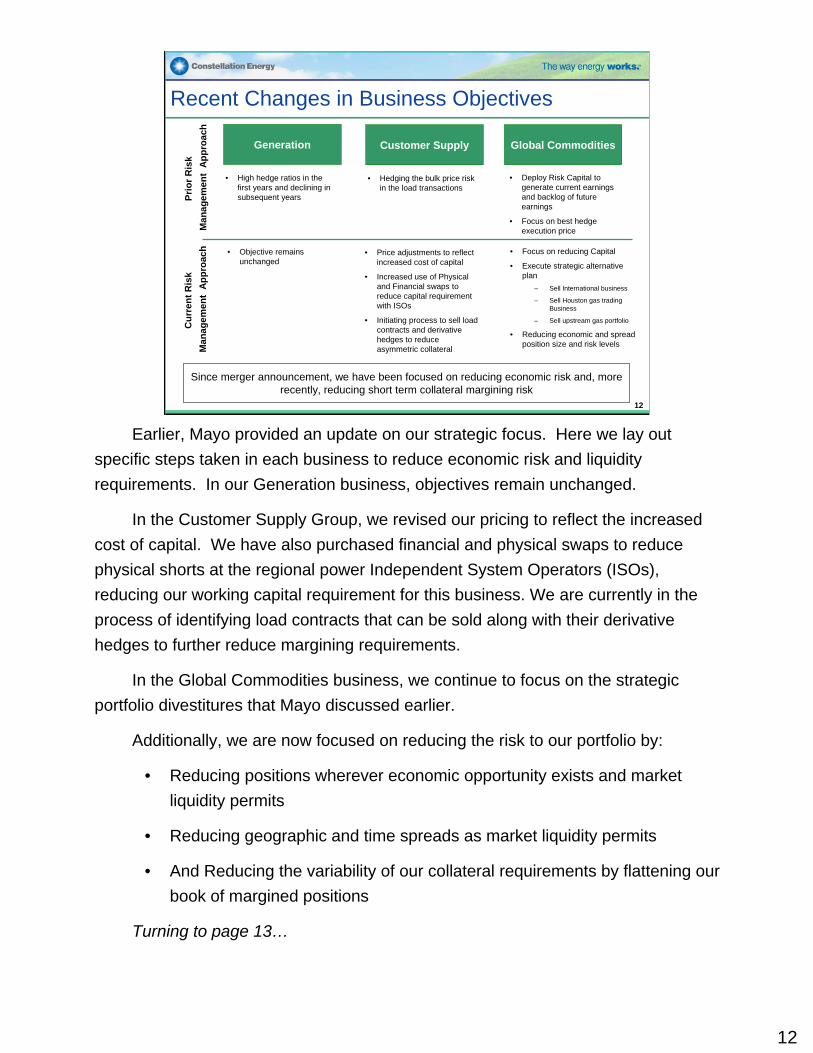
Recent Changes in Business Objectives
• High hedge ratios in the first years and declining in subsequent years
• Hedging the bulk price risk in the load transactions
• Deploy Risk Capital to generate current earnings and backlog of future earnings
• Focus on best hedge execution price
Prio
r Ris
kM
anag
emen
t A
ppro
ach
• Objective remains unchanged
• Price adjustments to reflect increased cost of capital
• Increased use of Physical and Financial swaps to reduce capital requirement with ISOs
• Initiating process to sell load contracts and derivative hedges to reduce asymmetric collateral
• Focus on reducing Capital
• Execute strategic alternative plan
– Sell International business
– Sell Houston gas trading Business
– Sell upstream gas portfolio
• Reducing economic and spread position size and risk levels
Generation Customer Supply Global Commodities
Cur
rent
Ris
kM
anag
emen
t A
ppro
ach
Since merger announcement, we have been focused on reducing economic risk and, more recently, reducing short term collateral margining risk
Earlier, Mayo provided an update on our strategic focus. Here we lay out specific steps taken in each business to reduce economic risk and liquidity requirements. In our Generation business, objectives remain unchanged.
In the Customer Supply Group, we revised our pricing to reflect the increased cost of capital. We have also purchased financial and physical swaps to reduce physical shorts at the regional power Independent System Operators (ISOs), reducing our working capital requirement for this business. We are currently in the process of identifying load contracts that can be sold along with their derivative hedges to further reduce margining requirements.
In the Global Commodities business, we continue to focus on the strategic portfolio divestitures that Mayo discussed earlier.
Additionally, we are now focused on reducing the risk to our portfolio by:
• Reducing positions wherever economic opportunity exists and market liquidity permits
• Reducing geographic and time spreads as market liquidity permits
• And Reducing the variability of our collateral requirements by flattening our book of margined positions
Turning to page 13…
83 29
2 3 53
0
25
50
75
100
Portfolio as of 9/19/08 Global Commodities -Pow er
Global Commodities -Gas
Global Commodities -Coal
Portfolio as of 10/31/08
Mill
ions
of M
Wh
Equi
vale
nts
13
Constellation’s Economic Positions
• Constellation has substantially reduced its economic exposure to directional commodity price risk by reducing size and overall length of the portfolio
• Total portfolio risk has been reduced approximately 30 percent since June 30, 2008
• Constellation’s portfolio of generation and hedges is long MWh equivalents through 2013
• MWh length primarily related to unhedged future generation output• Long position related to financial contracts has been reduced
Total Portfolio Net Economic Position (1)
141 134109
6146
28
$0
$50
$100
$150
$200
$250
30-Jun 30-Sep 31-Oct
In $
Mill
ions
Generation GCG
Total Portfolio Earnings at Risk (2)
(1) Excludes upstream gas positions(2) All Earnings at Risk measurements reported at 95% Confidence Interval. It includes total portfolio 2008-2013 positions. Overall CER Portfolio Earning at Risk includes the
Generation, Global Commodities Group and Customer Supply Group. The Generation Earning at Risk includes the assets and hedges against the assets. NOTE: Megawatt hour equivalents are a management concept based on derived relationships between power, gas and coal.
+
Generation GCG
83
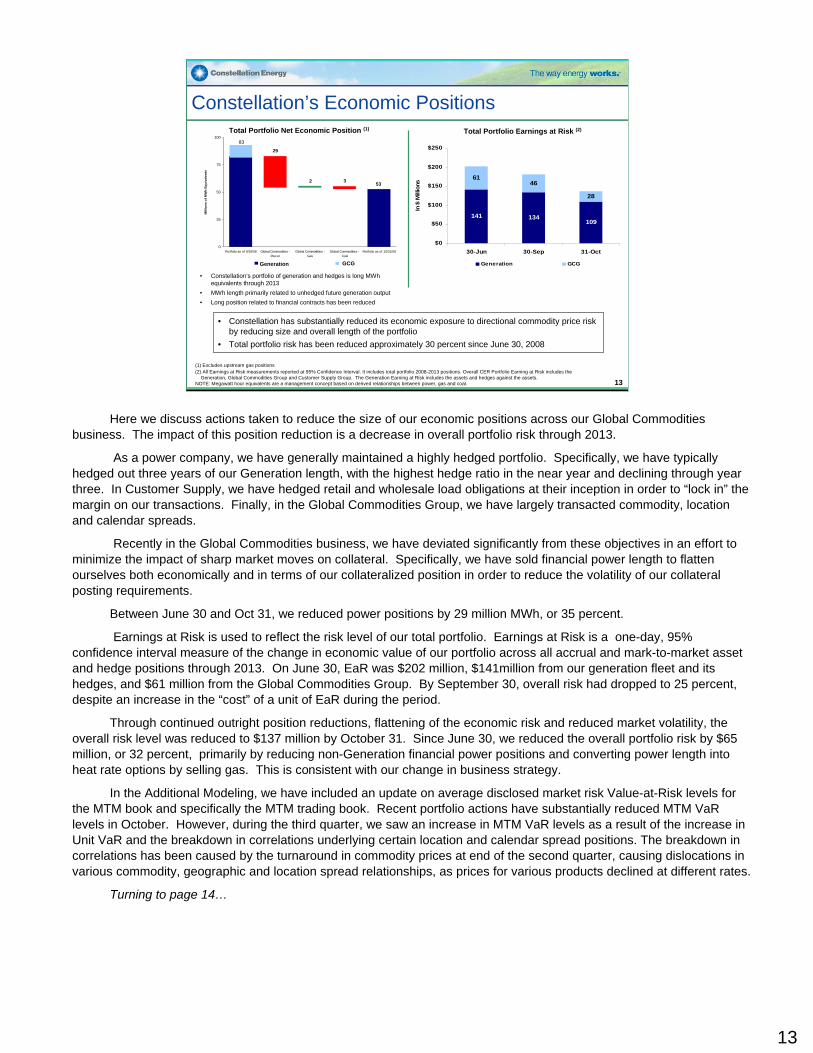
Here we discuss actions taken to reduce the size of our economic positions across our Global Commodities business. The impact of this position reduction is a decrease in overall portfolio risk through 2013.
As a power company, we have generally maintained a highly hedged portfolio. Specifically, we have typically hedged out three years of our Generation length, with the highest hedge ratio in the near year and declining through year three. In Customer Supply, we have hedged retail and wholesale load obligations at their inception in order to “lock in” the margin on our transactions. Finally, in the Global Commodities Group, we have largely transacted commodity, location and calendar spreads.
Recently in the Global Commodities business, we have deviated significantly from these objectives in an effort to minimize the impact of sharp market moves on collateral. Specifically, we have sold financial power length to flatten ourselves both economically and in terms of our collateralized position in order to reduce the volatility of our collateral posting requirements.
Between June 30 and Oct 31, we reduced power positions by 29 million MWh, or 35 percent.
Earnings at Risk is used to reflect the risk level of our total portfolio. Earnings at Risk is a one-day, 95% confidence interval measure of the change in economic value of our portfolio across all accrual and mark-to-market asset and hedge positions through 2013. On June 30, EaR was $202 million, $141million from our generation fleet and itshedges, and $61 million from the Global Commodities Group. By September 30, overall risk had dropped to 25 percent, despite an increase in the “cost” of a unit of EaR during the period.
Through continued outright position reductions, flattening of the economic risk and reduced market volatility, the overall risk level was reduced to $137 million by October 31. Since June 30, we reduced the overall portfolio risk by $65 million, or 32 percent, primarily by reducing non-Generation financial power positions and converting power length into heat rate options by selling gas. This is consistent with our change in business strategy.
In the Additional Modeling, we have included an update on average disclosed market risk Value-at-Risk levels for the MTM book and specifically the MTM trading book. Recent portfolio actions have substantially reduced MTM VaRlevels in October. However, during the third quarter, we saw an increase in MTM VaR levels as a result of the increase in Unit VaR and the breakdown in correlations underlying certain location and calendar spread positions. The breakdown in correlations has been caused by the turnaround in commodity prices at end of the second quarter, causing dislocations in various commodity, geographic and location spread relationships, as prices for various products declined at different rates.
Turning to page 14…
13
14
$5.5$0.3$0.7$0.3
$0.5$0.1$0.1$4.5
$0.0
$1.0
$2.0
$3.0
$4.0
$5.0
$6.0
Tota
l Col
late
ral
6/3
0/08
ISO
Initi
al M
argi
n
Dec
reas
ed C
redi
t Li
nes
Addi
tiona
l Cre
dit
Col
late
ral
Var
iatio
n M
argi
n
Pri
ce S
ensi
tive
Col
late
ral
Tota
l Col
late
ral
10/3
1/08
Col
late
ral P
oste
d ($
Bill
ions
)
87 3 26
26 68
0
30
60
90
120
Total Margined -9/19/08
Customer Supply Global Commodities -Power
Global Commodities -Gas
Global Commodities -Coal
Total Margined -10/31/08
Mill
ions
of M
Wh
Equi
vale
nts
14
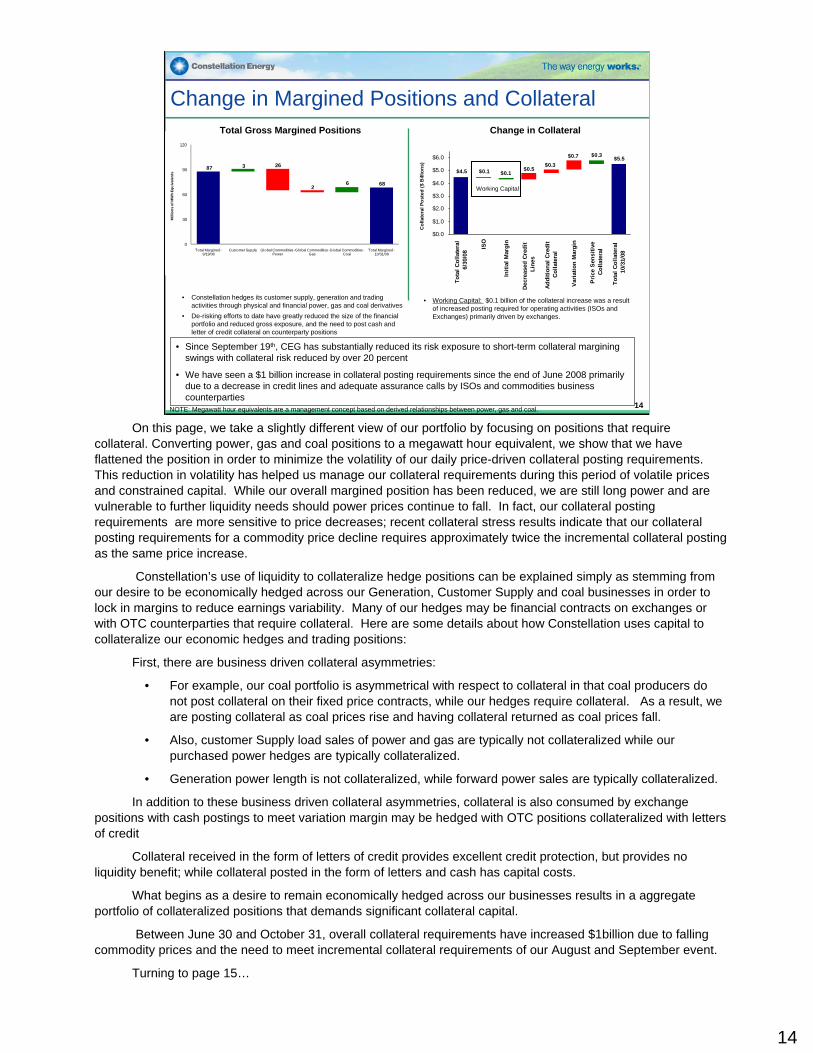
Change in Margined Positions and Collateral
• Working Capital: $0.1 billion of the collateral increase was a result of increased posting required for operating activities (ISOs and Exchanges) primarily driven by exchanges.
• Since September 19th, CEG has substantially reduced its risk exposure to short-term collateral margining swings with collateral risk reduced by over 20 percent
• We have seen a $1 billion increase in collateral posting requirements since the end of June 2008 primarily due to a decrease in credit lines and adequate assurance calls by ISOs and commodities business counterparties
Working Capital
• Constellation hedges its customer supply, generation and tradingactivities through physical and financial power, gas and coal derivatives
• De-risking efforts to date have greatly reduced the size of the financial portfolio and reduced gross exposure, and the need to post cash and letter of credit collateral on counterparty positions
Change in CollateralTotal Gross Margined Positions
NOTE: Megawatt hour equivalents are a management concept based on derived relationships between power, gas and coal.
On this page, we take a slightly different view of our portfolio by focusing on positions that require collateral. Converting power, gas and coal positions to a megawatt hour equivalent, we show that we have flattened the position in order to minimize the volatility of our daily price-driven collateral posting requirements. This reduction in volatility has helped us manage our collateral requirements during this period of volatile prices and constrained capital. While our overall margined position has been reduced, we are still long power and are vulnerable to further liquidity needs should power prices continue to fall. In fact, our collateral posting requirements are more sensitive to price decreases; recent collateral stress results indicate that our collateral posting requirements for a commodity price decline requires approximately twice the incremental collateral posting as the same price increase.
Constellation’s use of liquidity to collateralize hedge positions can be explained simply as stemming from our desire to be economically hedged across our Generation, Customer Supply and coal businesses in order to lock in margins to reduce earnings variability. Many of our hedges may be financial contracts on exchanges or with OTC counterparties that require collateral. Here are some details about how Constellation uses capital to collateralize our economic hedges and trading positions:
First, there are business driven collateral asymmetries:
• For example, our coal portfolio is asymmetrical with respect to collateral in that coal producers do not post collateral on their fixed price contracts, while our hedges require collateral. As a result, we are posting collateral as coal prices rise and having collateral returned as coal prices fall.
• Also, customer Supply load sales of power and gas are typically not collateralized while our purchased power hedges are typically collateralized.
• Generation power length is not collateralized, while forward power sales are typically collateralized.
In addition to these business driven collateral asymmetries, collateral is also consumed by exchange positions with cash postings to meet variation margin may be hedged with OTC positions collateralized with letters of credit
Collateral received in the form of letters of credit provides excellent credit protection, but provides no liquidity benefit; while collateral posted in the form of letters and cash has capital costs.
What begins as a desire to remain economically hedged across our businesses results in a aggregate portfolio of collateralized positions that demands significant collateral capital.
Between June 30 and October 31, overall collateral requirements have increased $1billion due to falling commodity prices and the need to meet incremental collateral requirements of our August and September event.
Turning to page 15…
15
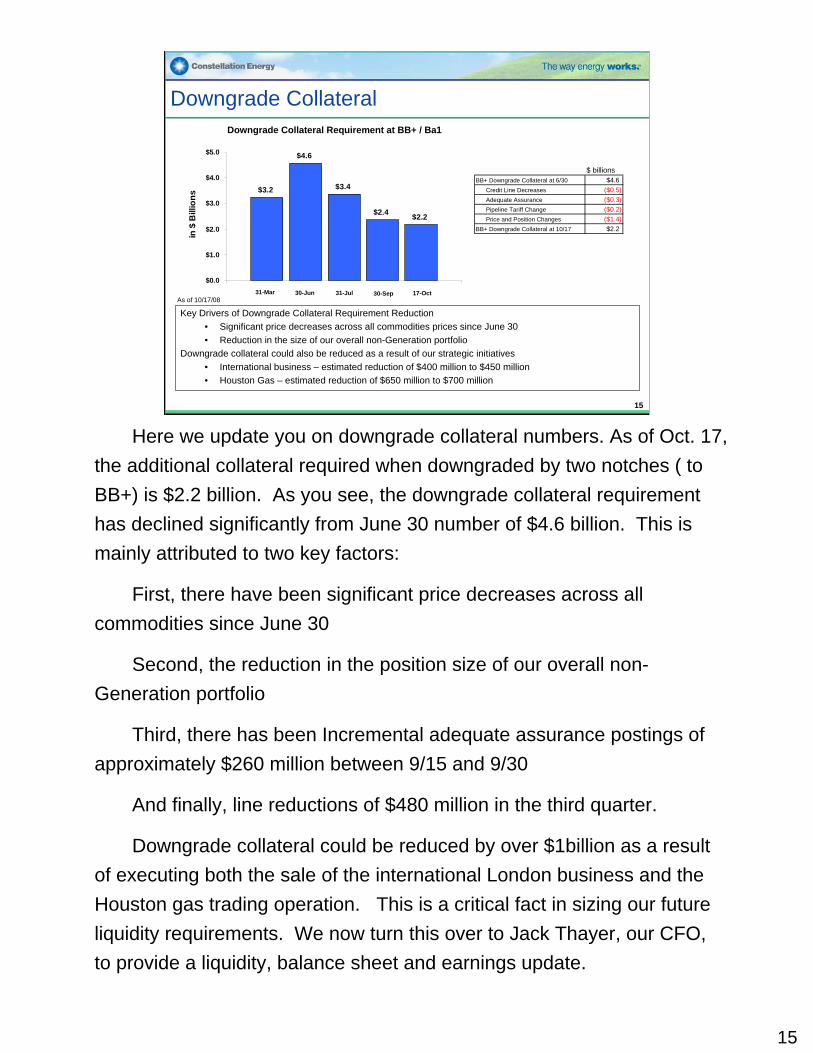
Downgrade Collateral Downgrade Collateral Requirement at BB+ / Ba1
Key Drivers of Downgrade Collateral Requirement Reduction• Significant price decreases across all commodities prices since June 30• Reduction in the size of our overall non-Generation portfolio
Downgrade collateral could also be reduced as a result of our strategic initiatives• International business – estimated reduction of $400 million to $450 million• Houston Gas – estimated reduction of $650 million to $700 million
$3.2
$4.6
$3.4
$2.4 $2.2
$0.0
$1.0
$2.0
$3.0
$4.0
$5.0
in $
Bill
ions
31-Mar 30-Jun 31-Jul 30-Sep 17-OctAs of 10/17/08
$ billionsBB+ Downgrade Collateral at 6/30 $4.6
Credit Line Decreases ($0.5)Adequate Assurance ($0.3)Pipeline Tariff Change ($0.2)Price and Position Changes ($1.4)
BB+ Downgrade Collateral at 10/17 $2.2
Here we update you on downgrade collateral numbers. As of Oct. 17, the additional collateral required when downgraded by two notches ( to BB+) is $2.2 billion. As you see, the downgrade collateral requirement has declined significantly from June 30 number of $4.6 billion. This is mainly attributed to two key factors:
First, there have been significant price decreases across all commodities since June 30
Second, the reduction in the position size of our overall non-Generation portfolio
Third, there has been Incremental adequate assurance postings ofapproximately $260 million between 9/15 and 9/30
And finally, line reductions of $480 million in the third quarter.
Downgrade collateral could be reduced by over $1billion as a result of executing both the sale of the international London business and the Houston gas trading operation. This is a critical fact in sizing our future liquidity requirements. We now turn this over to Jack Thayer, our CFO, to provide a liquidity, balance sheet and earnings update.
15
Financial Overview Jonathan W. Thayer
Senior Vice President and Chief Financial OfficerConstellation Energy
Thank you Brenda, and good morning everyone.
Before diving into the specifics of Constellation’s 3rd quarter liquidity and earnings performance, I think it’s important to take a step back and provide financial context for what transpired in September. An essential part of this history is a discussion of key sources and uses of cash and liquidity during the first three quarters of 2008 given the importance of liquidity to our viability. At the end of 2007, Constellation held approximately $3.8 billion of available cash and lines of credit to support its business operations. Heading into the year we anticipated significant capital spending related to environmental capex, BGE initiatives and generation investments. To fund this activity, we planned to both deploy funds from operations and proceeds from financings and asset sales. Accordingly, we believed we approached the year from a solid financial foundation.
What we did not anticipate were several seismic changes stemming from volatile commodity prices that increased the contingent capital needs of the business including: the significant increase in margin requirements to support merchant participation in exchanges and ISOs, the sizeable incremental posting of cash and LC collateral to maintain economic hedges supporting our merchant business; and incremental collateral posting requirements related to a ratings downgrade. The effects have been compounded by asymmetries in the collateral posting relationship between our assets and contractual hedges in our merchant activities and the adverse impact this relationship has had on our liquidity position.
Exacerbating these issues further, were several additional issues including: the shift in orientation of our merchant earnings from predominantly cash earnings to a greater percentage of non-cash mark-to-market earnings; an unprecedented tightening in the previously liquid credit markets and the impact of volatile commodities markets on the scale of our incremental downgrade collateral posting exposure. The net result of all of these forces was a net use of $1.5 billion of cash and LC collateral through the third quarter despite raising more than $1.7 billion in lines of credit, $1 billion of preferred equity from MidAmerican and $1.1 billion of debt. Importantly, the bulk of this outflow is working capital related, and the timing of its return will primarily occur in 2009 and 2010.
So with that long history behind us, now let me turn to a more detailed discussion of our third quarter liquidity, cash flow and earnings results.
Turning to slide 17 and a discussion of our Q3 change in liquidity…
16
860349 235
491
152
1,000
1,104 1,104
163
2,334
2,886
$-
$500
$1,000
$1,500
$2,000
$2,500
$3,000
$3,500
$4,000
$4,500
$5,000
NAL at Jun30
CashCollateral
LCCollateral
VariationMargin
PP&EInvest
Other Ops& Invest
MEHCPref Stock
S/T DebtRaised
FacilityUsed
OtherFinancing
NAL atSep 30
Change in Liquidity - Q3’08
• Declining power prices, actions taken to reduce portfolio risk, and a one-notch ratings downgrade resulted in economic losses, the posting of adequate assurance collateral and the incremental outflow of cash during the third quarter
• MidAmerican’s $1 billion preferred investment offset much of this decline thereby preserving adequate net available liquidity
Liquidity Required for Operations & Investment
$2.4B at Sep 30
$2.2B at Oct 17
$4.6B at Jun 30
Downgrade Collateral Requirements (below Investment Grade)
Liquidity Provided by Financing
Derivative Collateral & MarginNet Cash Disbursed $ (1,095)Reduction in LCs Posted 349Net Liquidity Impact $ (746)
All Other Operating & Investing Activities
Net Liquidity Impact $ (643)
Financing ActivityNet Cash Raised $ 1,941Facilities Used (1,104)Net Liquidity Impact $ 837
$ millions
17
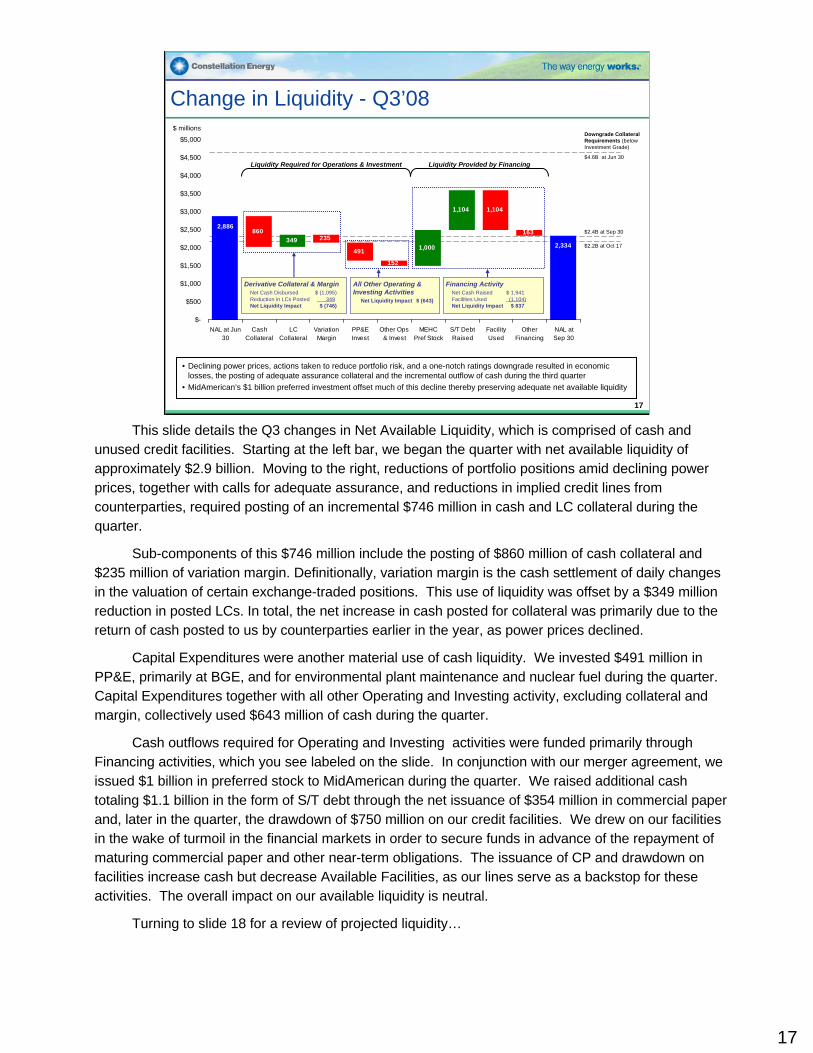
This slide details the Q3 changes in Net Available Liquidity, which is comprised of cash and unused credit facilities. Starting at the left bar, we began the quarter with net available liquidity of approximately $2.9 billion. Moving to the right, reductions of portfolio positions amid declining power prices, together with calls for adequate assurance, and reductions in implied credit lines from counterparties, required posting of an incremental $746 million in cash and LC collateral during the quarter.
Sub-components of this $746 million include the posting of $860 million of cash collateral and $235 million of variation margin. Definitionally, variation margin is the cash settlement of daily changes in the valuation of certain exchange-traded positions. This use of liquidity was offset by a $349 million reduction in posted LCs. In total, the net increase in cash posted for collateral was primarily due to the return of cash posted to us by counterparties earlier in the year, as power prices declined.
Capital Expenditures were another material use of cash liquidity. We invested $491 million in PP&E, primarily at BGE, and for environmental plant maintenance and nuclear fuel during the quarter. Capital Expenditures together with all other Operating and Investing activity, excluding collateral and margin, collectively used $643 million of cash during the quarter.
Cash outflows required for Operating and Investing activities were funded primarily through Financing activities, which you see labeled on the slide. In conjunction with our merger agreement, we issued $1 billion in preferred stock to MidAmerican during the quarter. We raised additional cash totaling $1.1 billion in the form of S/T debt through the net issuance of $354 million in commercial paper and, later in the quarter, the drawdown of $750 million on our credit facilities. We drew on our facilities in the wake of turmoil in the financial markets in order to secure funds in advance of the repayment of maturing commercial paper and other near-term obligations. The issuance of CP and drawdown on facilities increase cash but decrease Available Facilities, as our lines serve as a backstop for these activities. The overall impact on our available liquidity is neutral.
Turning to slide 18 for a review of projected liquidity…
17
$-
$0.5
$1.0
$1.5
$2.0
$2.5
$3.0
$3.5
$4.0
$4.5
$5.0
Jan-08 Feb-08 Mar-08 Apr-08 May-08 Jun-08 Jul-08 Aug-08 Sep-08 Oct-08 Nov-08 Dec-08
$ bi
llion
s
Net Available Liquidity (existing) New Facilities Upstream Gas Other Divestitures
Downgrade Collateral Requirements (below Investment Grade)
$1.1B at Dec 31
Proforma as of Oct 17, estimated for projected reductions due to Strategic Divestitures
$2.4B atSep 30
$4.6B atJun 30
$2.2B atOct 17
$3.2B atMar 31
$3.4B atJul 31
Change in Liquidity – 2008 Historical and Projected
Assuming the successful close of the $1.6 billion of incremental liquidity in November and execution of incremental strategic divestitures, Constellation anticipates having sufficient liquidity following the maturity of the $1.4 billion facility.
(1) Excludes transitional liquidity, which consists of proceeds from the sale of assets, pre-funding of maturing debt and a special purpose credit facility (2) Includes $350M facility allowing Constellation to sell certain assets to MEHC, subject to FERC approval
ProjectedActual
Other Potential Divestitures
$1.4B liquidity through after-tax cash proceeds from sale and return of cash and LC collateral
Anticipated New Facilities (2)
Incremental $1.6B liquidity
Est. Upstream Gas $0.3B
(1)
18
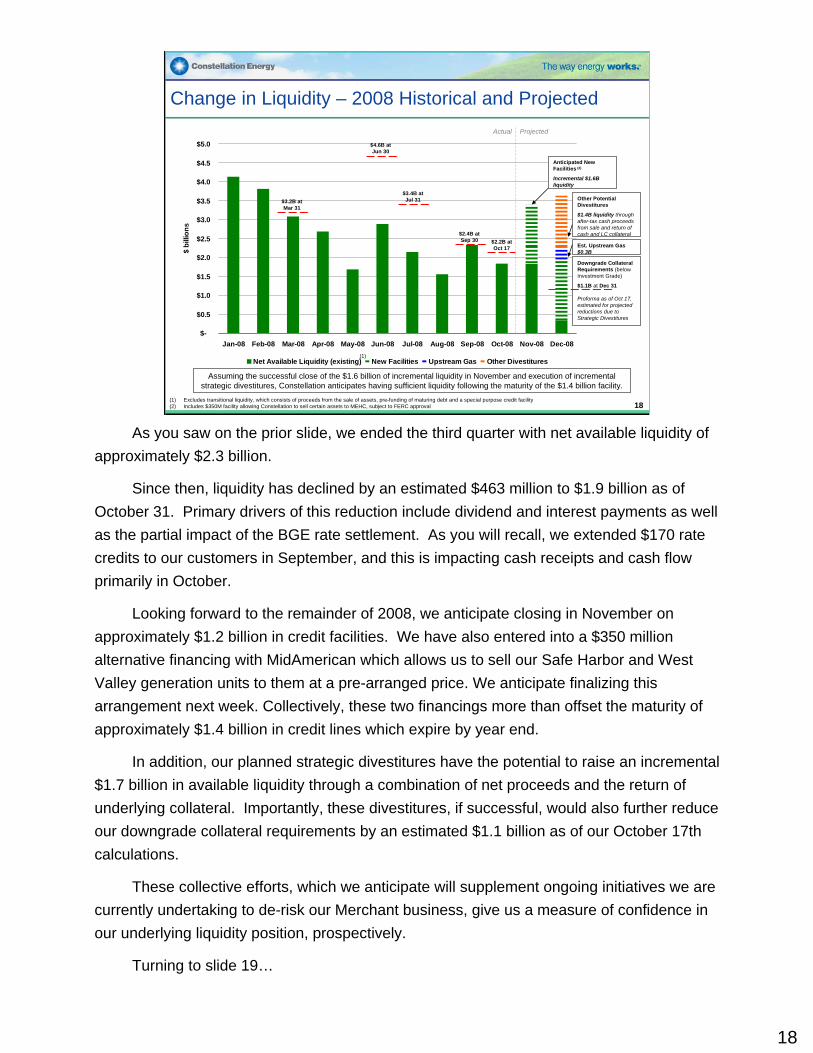
As you saw on the prior slide, we ended the third quarter with net available liquidity of approximately $2.3 billion.
Since then, liquidity has declined by an estimated $463 million to $1.9 billion as of October 31. Primary drivers of this reduction include dividend and interest payments as well as the partial impact of the BGE rate settlement. As you will recall, we extended $170 rate credits to our customers in September, and this is impacting cash receipts and cash flow primarily in October.
Looking forward to the remainder of 2008, we anticipate closing in November on approximately $1.2 billion in credit facilities. We have also entered into a $350 million alternative financing with MidAmerican which allows us to sell our Safe Harbor and West Valley generation units to them at a pre-arranged price. We anticipate finalizing this arrangement next week. Collectively, these two financings more than offset the maturity of approximately $1.4 billion in credit lines which expire by year end.
In addition, our planned strategic divestitures have the potential to raise an incremental $1.7 billion in available liquidity through a combination of net proceeds and the return of underlying collateral. Importantly, these divestitures, if successful, would also further reduce our downgrade collateral requirements by an estimated $1.1 billion as of our October 17th calculations.
These collective efforts, which we anticipate will supplement ongoing initiatives we are currently undertaking to de-risk our Merchant business, give us a measure of confidence in our underlying liquidity position, prospectively.
Turning to slide 19…
18
0
1,000
2,000
3,000
4,000
31-O
ct
31-Ja
n
30-A
pr31
-Jul
31-O
ct20
1020
13
2016
& B
eyond
$ in
mill
ions
OTC
Exchanges
ISOs
Corporate
Initial Margin and Letter of Credit Collateral Roll-off
Anticipate a significant reduction in letter of credit and cash collateral postings over the next 18 months as contracts and hedges realize
19
Letters of Credit and Net CashPosted Roll-Off
Estimated as of 10/31/08Note: Based on a static view of the portfolio
AnnuallyMonthly
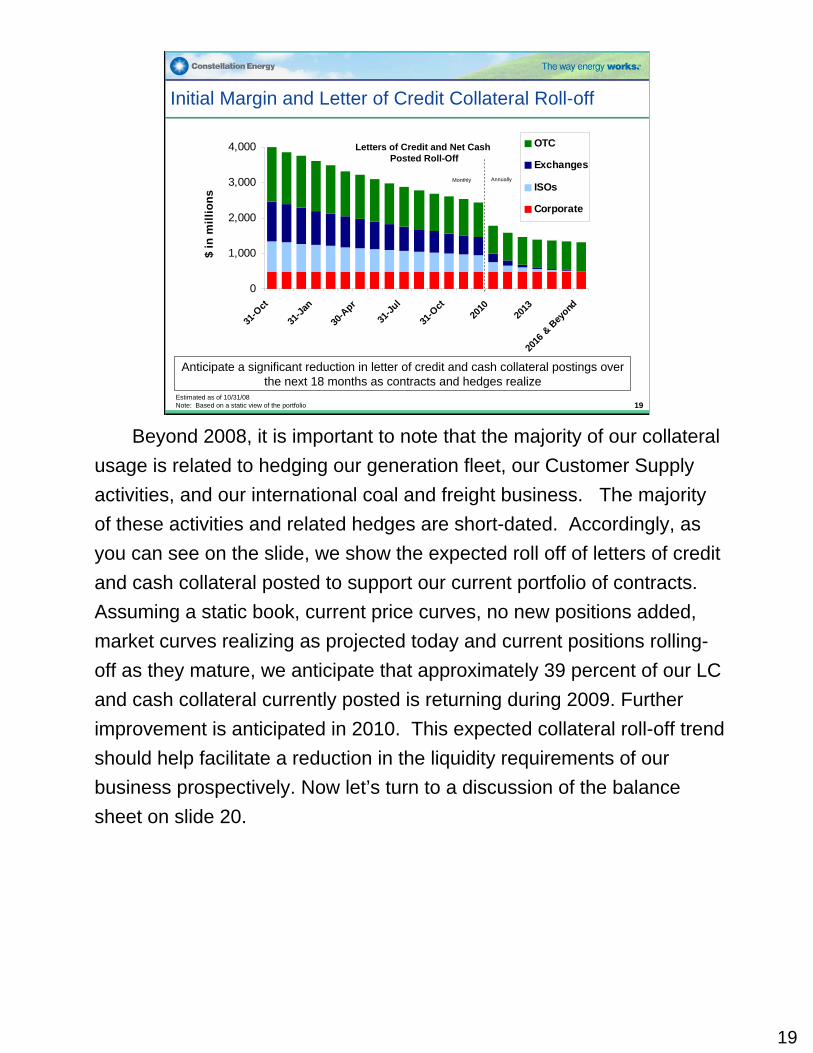
Beyond 2008, it is important to note that the majority of our collateral usage is related to hedging our generation fleet, our Customer Supply activities, and our international coal and freight business. The majority of these activities and related hedges are short-dated. Accordingly, as you can see on the slide, we show the expected roll off of letters of credit and cash collateral posted to support our current portfolio of contracts. Assuming a static book, current price curves, no new positions added, market curves realizing as projected today and current positions rolling-off as they mature, we anticipate that approximately 39 percent of our LC and cash collateral currently posted is returning during 2009. Further improvement is anticipated in 2010. This expected collateral roll-off trend should help facilitate a reduction in the liquidity requirements of our business prospectively. Now let’s turn to a discussion of the balance sheet on slide 20.
19
Balance Sheet Metrics
0.00.00.01.0MEHC Preferred
5.66.26.75.1Equity (1)
$9.5$10.4$11.4$11.8Total Capital
0.90.40.01.2Accum. Other Comprehensive Income Balance
$0.1$0.1$0.3$0.450% Hybrid & Preferred Securities
35%38%35%39%Adjusted Net Debt to Adjusted Total Capital (3)
42%
0.1
$5.3
(1.4)
$6.7
Q3 2008
36%
1.3
$4.4
(1.2)
$5.6
Q2 2008
36%
0.6
$4.1
(0.7)
$4.8
Q1 2008
36%Net Debt to Total Capital (2)
0.33rd Party Cash Collateral
Capital
$3.8Net Debt
(1.1)Less: Cash
$4.9Total Debt
Debt
YE 2007($ in billions)
(1) Includes preferred stock and minority interest(2) Excludes BGE Rate Stabilization Securitization debt(3) Excludes BGE Rate Stabilization Securitization debt, AOCI balance related to cash flow hedges of commodity transactions and 3rd party cash collateralNote: numbers may not add due to roundingSee Appendix
20
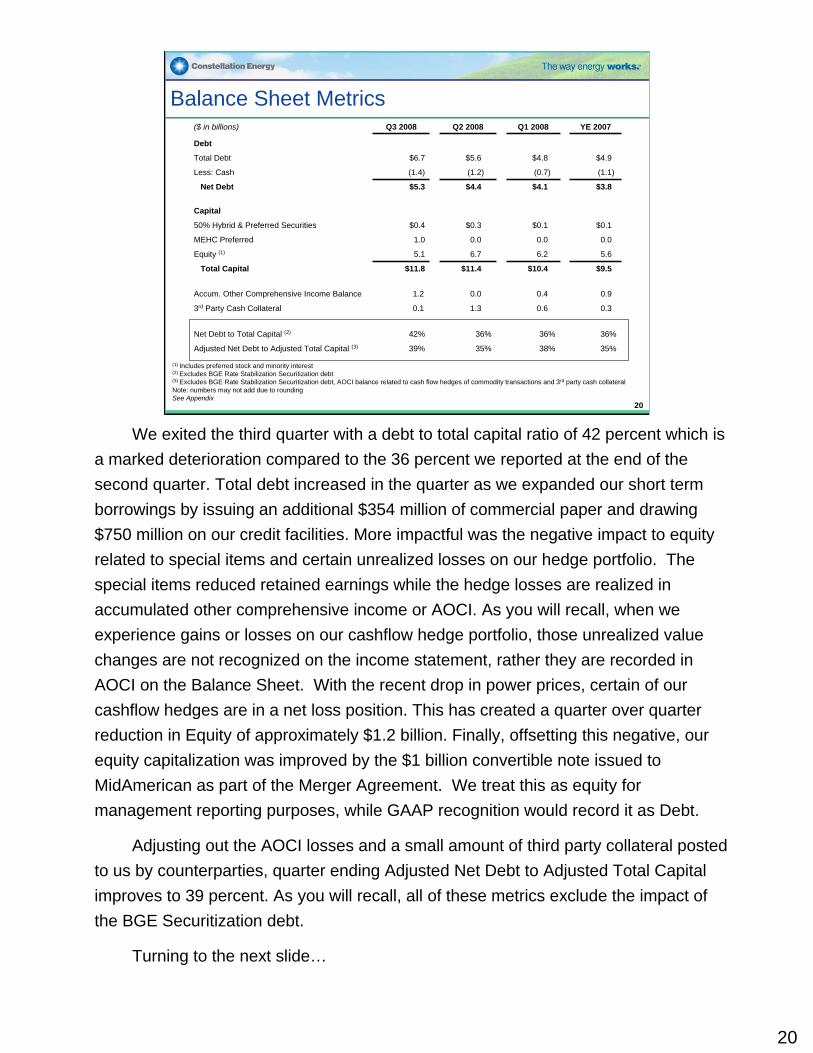
We exited the third quarter with a debt to total capital ratio of 42 percent which is a marked deterioration compared to the 36 percent we reported at the end of the second quarter. Total debt increased in the quarter as we expanded our short term borrowings by issuing an additional $354 million of commercial paper and drawing $750 million on our credit facilities. More impactful was the negative impact to equity related to special items and certain unrealized losses on our hedge portfolio. The special items reduced retained earnings while the hedge losses are realized in accumulated other comprehensive income or AOCI. As you will recall, when we experience gains or losses on our cashflow hedge portfolio, those unrealized value changes are not recognized on the income statement, rather they are recorded in AOCI on the Balance Sheet. With the recent drop in power prices, certain of our cashflow hedges are in a net loss position. This has created a quarter over quarter reduction in Equity of approximately $1.2 billion. Finally, offsetting this negative, our equity capitalization was improved by the $1 billion convertible note issued to MidAmerican as part of the Merger Agreement. We treat this as equity for management reporting purposes, while GAAP recognition would record it as Debt.
Adjusting out the AOCI losses and a small amount of third party collateral posted to us by counterparties, quarter ending Adjusted Net Debt to Adjusted Total Capital improves to 39 percent. As you will recall, all of these metrics exclude the impact of the BGE Securitization debt.
Turning to the next slide…
20
Earnings Summary
We will now turn to the earnings portion of the presentation andquickly discuss our results on a consolidated basis and by business segment. Turning to slide 22…
21
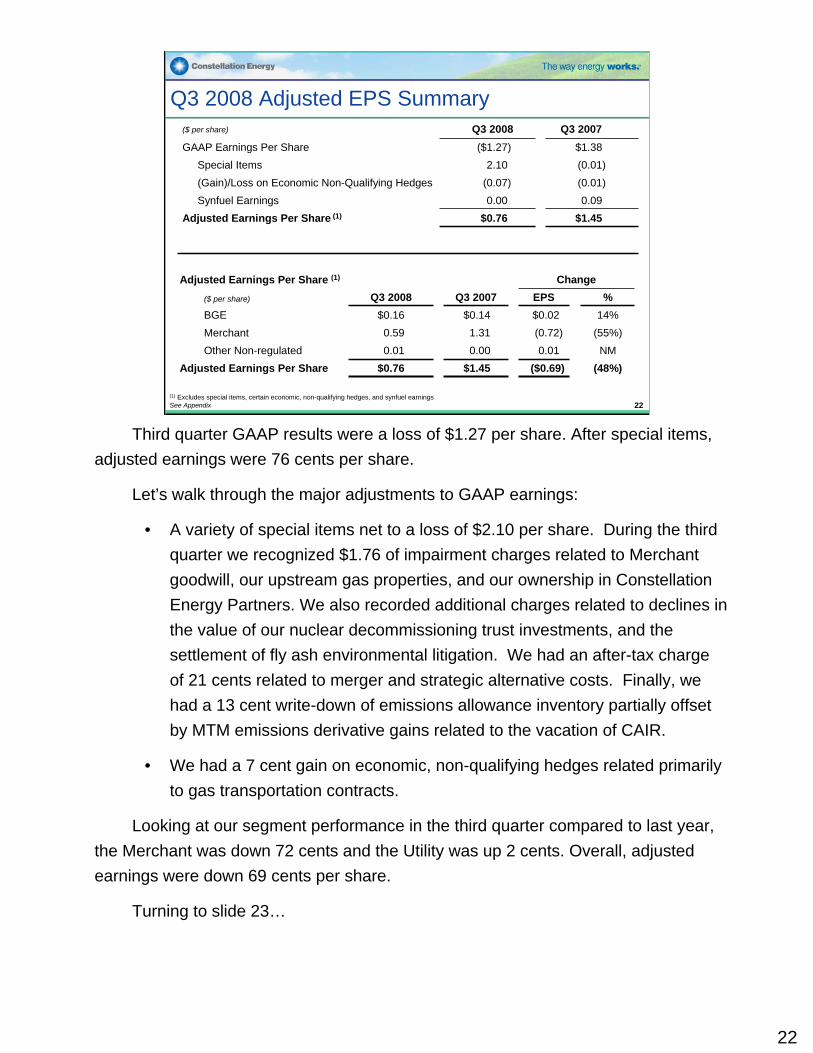
Q3 2008 Adjusted EPS Summary
(0.01)(0.07)(Gain)/Loss on Economic Non-Qualifying Hedges0.090.00Synfuel Earnings
$1.45$0.76Adjusted Earnings Per Share (1)
(0.01)2.10Special Items$1.38($1.27)GAAP Earnings Per Share
Q3 2007Q3 2008($ per share)
(1) Excludes special items, certain economic, non-qualifying hedges, and synfuel earningsSee Appendix
(55%)(0.72)1.310.59Merchant
(48%)($0.69)$1.45$0.76Adjusted Earnings Per ShareNM0.010.000.01Other Non-regulated
14%$0.02$0.14$0.16BGE%EPSQ3 2007Q3 2008($ per share)
ChangeAdjusted Earnings Per Share (1)
22
Third quarter GAAP results were a loss of $1.27 per share. After special items, adjusted earnings were 76 cents per share.
Let’s walk through the major adjustments to GAAP earnings:
• A variety of special items net to a loss of $2.10 per share. During the third quarter we recognized $1.76 of impairment charges related to Merchant goodwill, our upstream gas properties, and our ownership in Constellation Energy Partners. We also recorded additional charges related to declines in the value of our nuclear decommissioning trust investments, and the settlement of fly ash environmental litigation. We had an after-tax charge of 21 cents related to merger and strategic alternative costs. Finally, we had a 13 cent write-down of emissions allowance inventory partially offset by MTM emissions derivative gains related to the vacation of CAIR.
• We had a 7 cent gain on economic, non-qualifying hedges related primarily to gas transportation contracts.
Looking at our segment performance in the third quarter compared to last year, the Merchant was down 72 cents and the Utility was up 2 cents. Overall, adjusted earnings were down 69 cents per share.
Turning to slide 23…
22
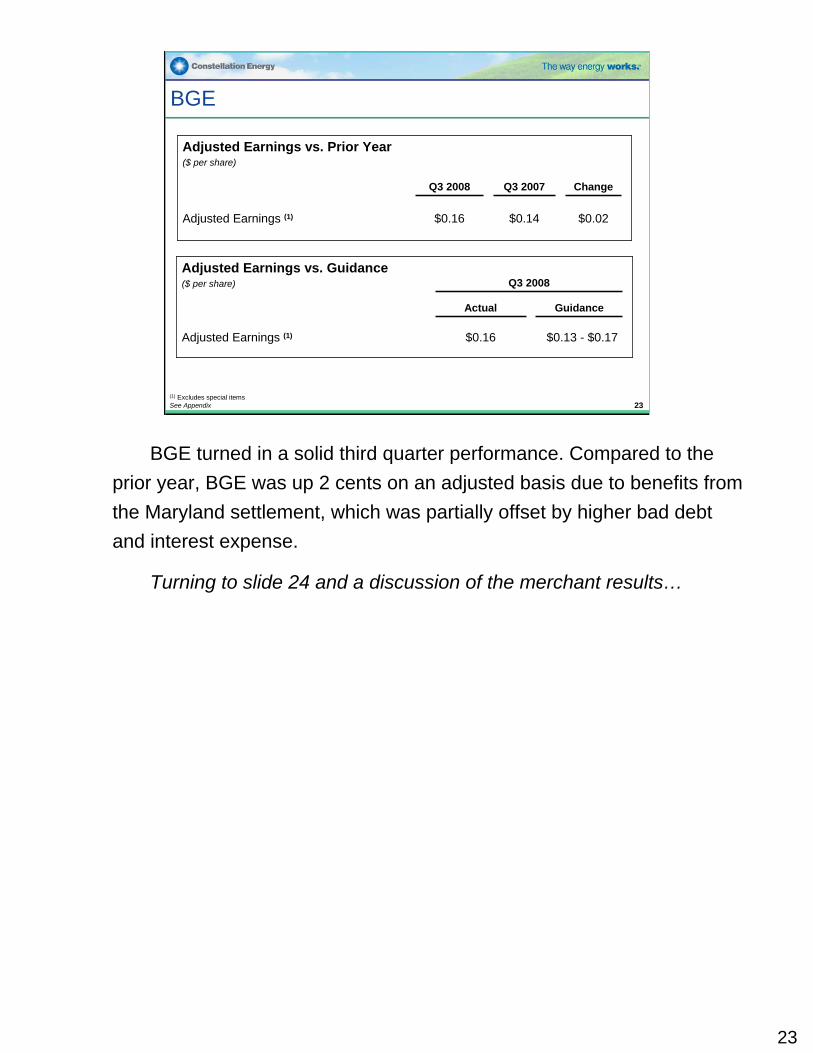
$0.13 - $0.17$0.16Adjusted Earnings (1)
GuidanceActual
Q3 2008Adjusted Earnings vs. Guidance($ per share)
BGE
$0.02
Change
$0.14$0.16Adjusted Earnings (1)
Q3 2007Q3 2008
Adjusted Earnings vs. Prior Year($ per share)
(1) Excludes special itemsSee Appendix 23
BGE turned in a solid third quarter performance. Compared to theprior year, BGE was up 2 cents on an adjusted basis due to benefits from the Maryland settlement, which was partially offset by higher bad debt and interest expense.
Turning to slide 24 and a discussion of the merchant results…
23
24
Merchant
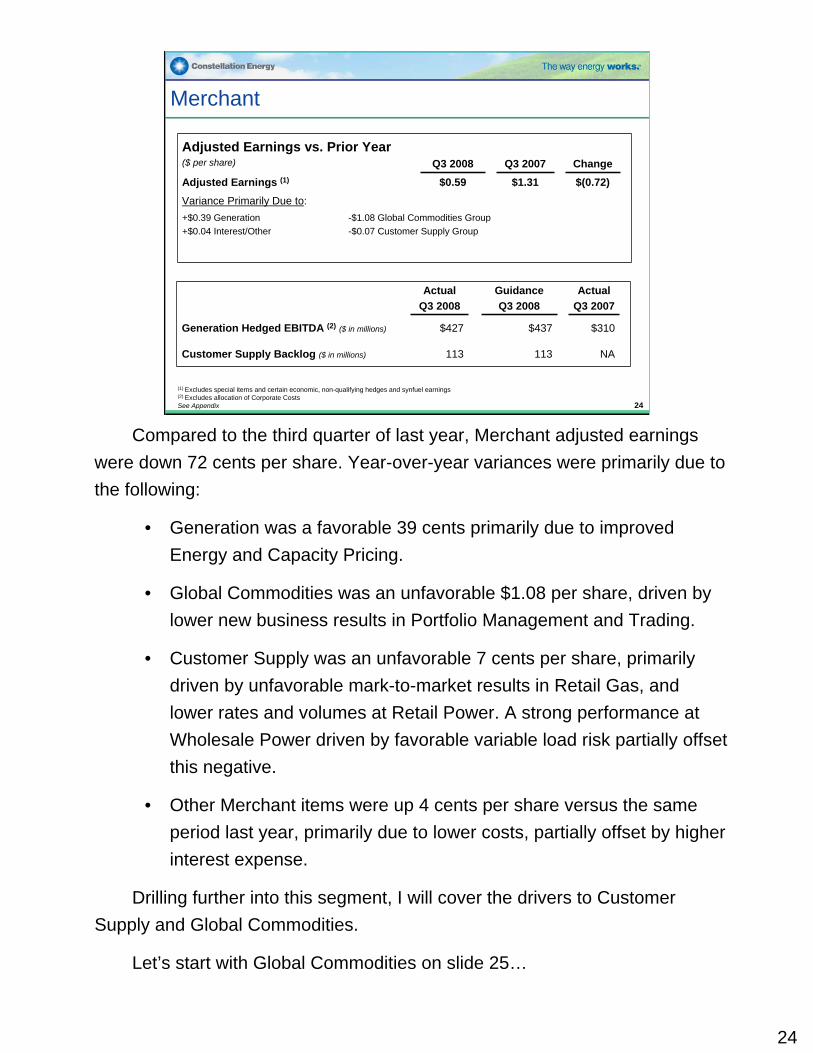
Adjusted Earnings vs. Prior Year($ per share) Q3 2008 Q3 2007 ChangeAdjusted Earnings (1) $0.59 $1.31 $(0.72)Variance Primarily Due to:+$0.39 Generation+$0.04 Interest/Other
-$1.08 Global Commodities Group-$0.07 Customer Supply Group
(1) Excludes special items and certain economic, non-qualifying hedges and synfuel earnings(2) Excludes allocation of Corporate CostsSee Appendix
ActualQ3 2008
GuidanceQ3 2008
ActualQ3 2007
Generation Hedged EBITDA (2) ($ in millions) $427 $437 $310
Customer Supply Backlog ($ in millions) 113 113 NA
24
Compared to the third quarter of last year, Merchant adjusted earnings were down 72 cents per share. Year-over-year variances were primarily due to the following:
• Generation was a favorable 39 cents primarily due to improved Energy and Capacity Pricing.
• Global Commodities was an unfavorable $1.08 per share, driven bylower new business results in Portfolio Management and Trading.
• Customer Supply was an unfavorable 7 cents per share, primarily driven by unfavorable mark-to-market results in Retail Gas, and lower rates and volumes at Retail Power. A strong performance atWholesale Power driven by favorable variable load risk partially offset this negative.
• Other Merchant items were up 4 cents per share versus the same period last year, primarily due to lower costs, partially offset by higher interest expense.
Drilling further into this segment, I will cover the drivers to Customer Supply and Global Commodities.
Let’s start with Global Commodities on slide 25…
25
Global Commodities($ in millions) Change
Q3 2008 Q3 2007 $ %
Already Originated Business (1) $99 $50 $49 98%
New Business Realized (2) (247) 230 (477) (207%)
Total Contribution Margin (2) $(148) $280 $(428) (153%)
2008 2007New Business Realized YTD $218 $329
(1) Includes Structured Products gross margin originated in prior periods(2) Includes Structured Products, gas (non-project), and coal gross margin and gas project margin (project revenue less operating, depreciation, depletion
and interest expenses incurred at the project level). Excluding gas project-level expenses of ($41) million in Q3 2008 and ($38) million in Q3 2007, total Global Commodities gross margin in Q3 2008 and Q3 2007 was ($108) million and $318 million, respectively.
See Appendix25
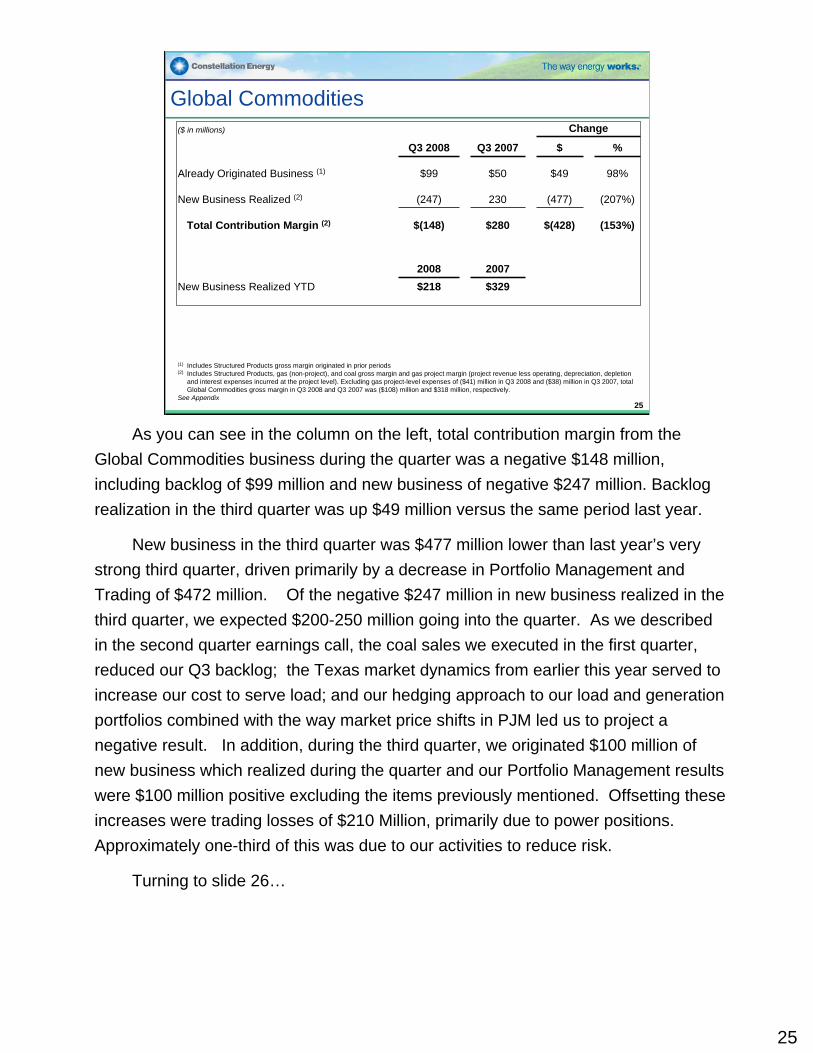
As you can see in the column on the left, total contribution margin from the Global Commodities business during the quarter was a negative $148 million, including backlog of $99 million and new business of negative $247 million. Backlog realization in the third quarter was up $49 million versus the same period last year.
New business in the third quarter was $477 million lower than last year’s very strong third quarter, driven primarily by a decrease in Portfolio Management and Trading of $472 million. Of the negative $247 million in new business realized in the third quarter, we expected $200-250 million going into the quarter. As we described in the second quarter earnings call, the coal sales we executed in the first quarter, reduced our Q3 backlog; the Texas market dynamics from earlier this year served to increase our cost to serve load; and our hedging approach to our load and generation portfolios combined with the way market price shifts in PJM led us to project a negative result. In addition, during the third quarter, we originated $100 million of new business which realized during the quarter and our Portfolio Management results were $100 million positive excluding the items previously mentioned. Offsetting these increases were trading losses of $210 Million, primarily due to power positions. Approximately one-third of this was due to our activities to reduce risk.
Turning to slide 26…
$0.00$1.00$2.00$3.00$4.00$5.00$6.00$7.00$8.00
4Q06 1Q07 2Q07 3Q07 4Q07 1Q08 2Q08 3Q080%
20%
40%
60%
80%
100%
Electric Gross Margin Realized / MWh Retention Rates (inc. month-to-month)
Customer Supply Gross Margin
(8%)$800$737Full Year Plan
(1%)
(50%)
Change
$484$479YTD Sept Actual
Changes in Business Measurement
$165$83Comparable Gross Margin Results
20Retail Power Adjustments
0(36)Wholesale Variable Load Cost(2)
$163 (1)$119Gross Margin
$6New Business
$113Already Originated Business
Q3 2007Q3 2008($ in millions)
(1) Due to Merchant realignment, Already Originated Business and New Business breakdowns are not available for Q3 2007(2) Recognized in Portfolio Management and Trading in prior periods(3) Does not include mark-to-market resultsSee Appendix
Retail GasRetail Power
Retention R
ate
Retention R
ate
Realized As Priced
Elec
tric
GM
/MW
h
Gas
GM
/Dth
(3)
$0.00
$0.05
$0.10
$0.15
$0.20
$0.25
$0.30
3Q06 4Q06 1Q07 2Q07 3Q07 4Q07 1Q08 2Q08 3Q0850%
60%
70%
80%
90%
100%
Gross Margin/Dth Retention Rates
26
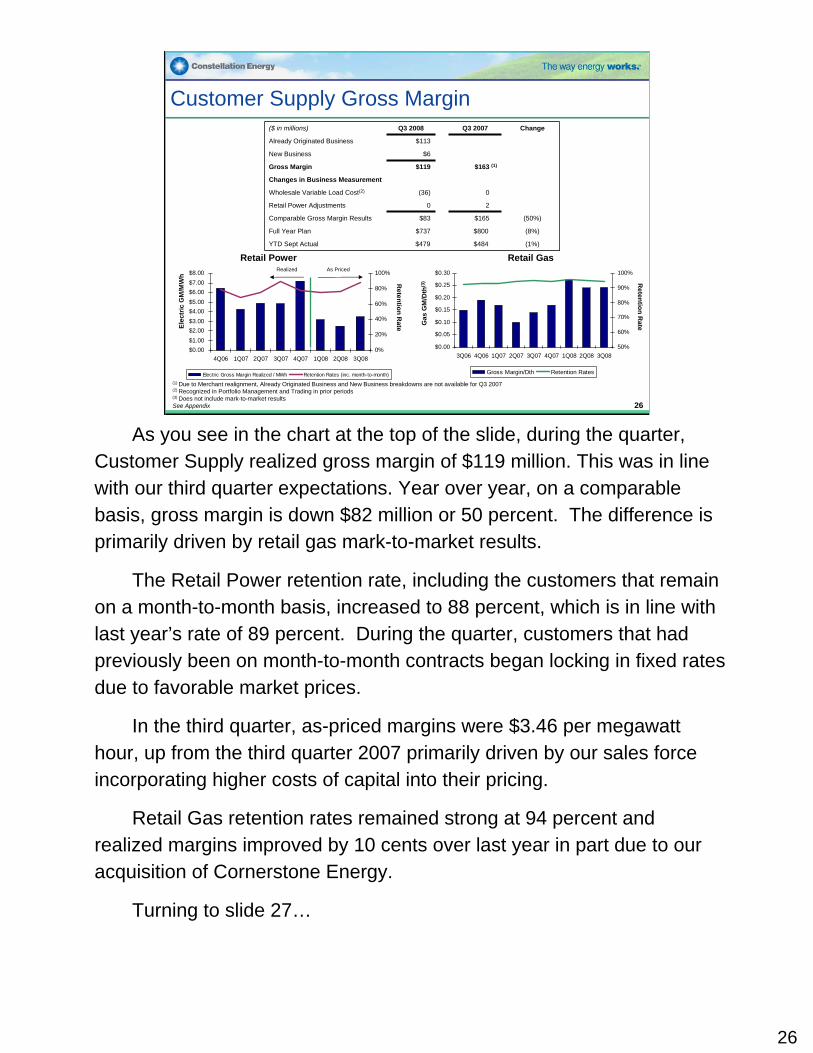
As you see in the chart at the top of the slide, during the quarter, Customer Supply realized gross margin of $119 million. This was in line with our third quarter expectations. Year over year, on a comparable basis, gross margin is down $82 million or 50 percent. The difference is primarily driven by retail gas mark-to-market results.
The Retail Power retention rate, including the customers that remain on a month-to-month basis, increased to 88 percent, which is in line with last year’s rate of 89 percent. During the quarter, customers that had previously been on month-to-month contracts began locking in fixed rates due to favorable market prices.
In the third quarter, as-priced margins were $3.46 per megawatt hour, up from the third quarter 2007 primarily driven by our sales force incorporating higher costs of capital into their pricing.
Retail Gas retention rates remained strong at 94 percent and realized margins improved by 10 cents over last year in part due to our acquisition of Cornerstone Energy.
Turning to slide 27…
26
27
Generation Earnings Outlook
($ millions) 2008E 2009E 2010E 2011E
Total Output (MM MWhs) 51 50 52 53
Unhedged GM 3,267 3,158 3,291 3,124O&M (882) (964) (1,037) (1,084)
Unhedged EBITDA 2,385 2,194 2,254 2,040Hedge Impact (1,338) (975) (990) (530)
Hedged EBITDA 1,048 1,219 1,264 1,510Change since Q4’07 (45) (220) (116) (231)
$0
$500
$1,000
$1,500
$2,000
$2,500
$3,000
2008E 2009E 2010E 2011EEBITDA with hedges Unhedged EBITDA
$MM
Generation EBITDA, before and after hedge results
As of 9/30/08Note: numbers may not add due to rounding 27
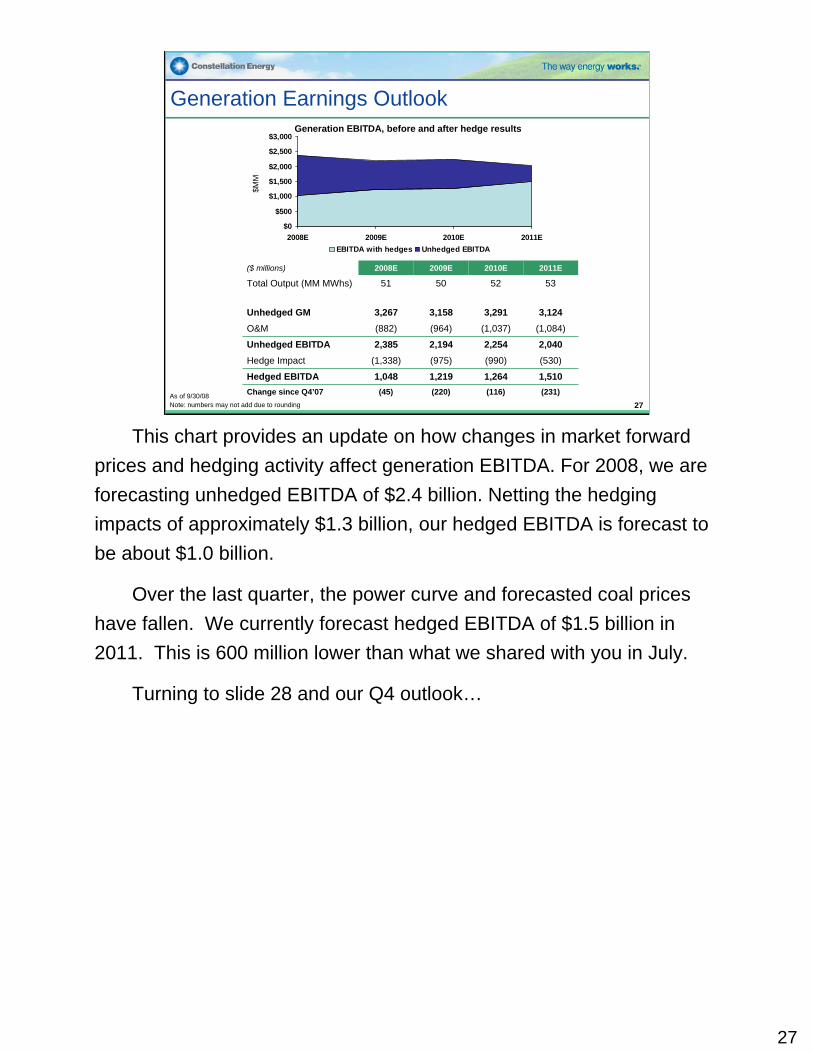
This chart provides an update on how changes in market forward prices and hedging activity affect generation EBITDA. For 2008, we are forecasting unhedged EBITDA of $2.4 billion. Netting the hedgingimpacts of approximately $1.3 billion, our hedged EBITDA is forecast to be about $1.0 billion.
Over the last quarter, the power curve and forecasted coal prices have fallen. We currently forecast hedged EBITDA of $1.5 billion in 2011. This is 600 million lower than what we shared with you in July.
Turning to slide 28 and our Q4 outlook…
28
Q4 2008 OutlookOutlook
Q4 2008EActual
Q4 2007
BGE Earnings Per Share $0.20 - $0.24 $0.17
Generation Hedged EBITDA (1) ($ in millions) $244 $191
Customer Supply Backlog ($ in millions) $210 NA
(1) Excludes allocation of Corporate CostsSee Appendix 28
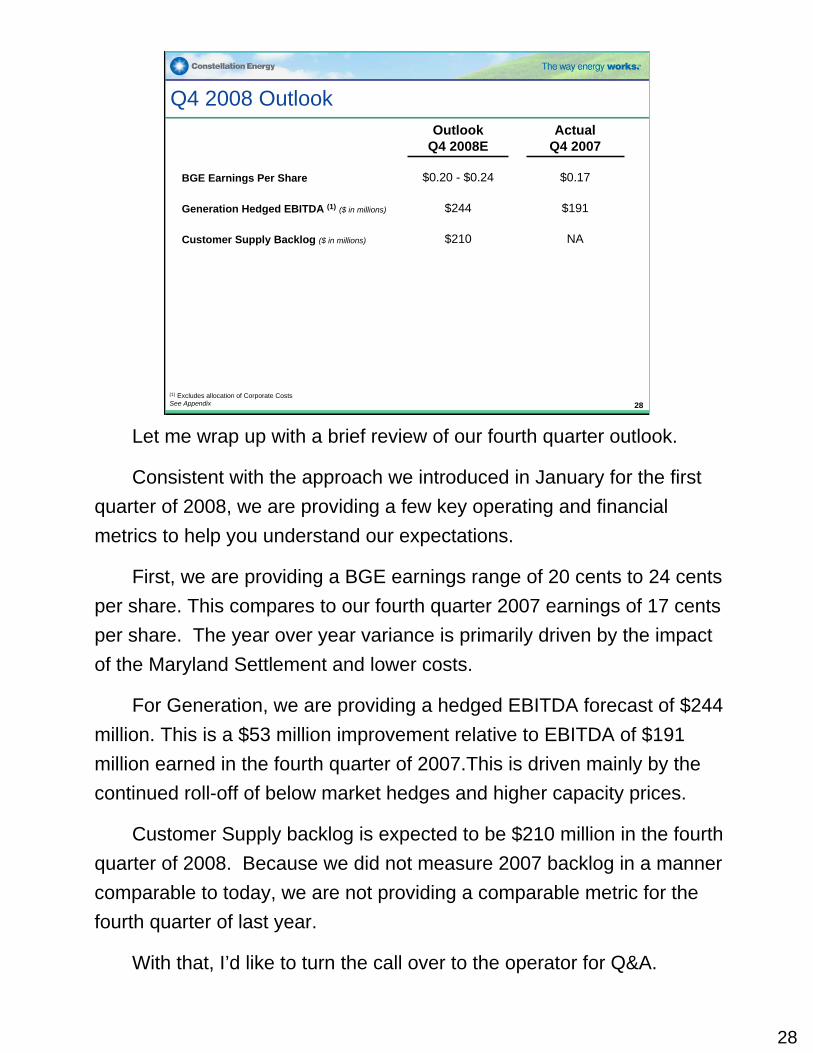
Let me wrap up with a brief review of our fourth quarter outlook.
Consistent with the approach we introduced in January for the first quarter of 2008, we are providing a few key operating and financial metrics to help you understand our expectations.
First, we are providing a BGE earnings range of 20 cents to 24 cents per share. This compares to our fourth quarter 2007 earnings of 17 cents per share. The year over year variance is primarily driven by the impact of the Maryland Settlement and lower costs.
For Generation, we are providing a hedged EBITDA forecast of $244 million. This is a $53 million improvement relative to EBITDA of $191 million earned in the fourth quarter of 2007.This is driven mainly by the continued roll-off of below market hedges and higher capacity prices.
Customer Supply backlog is expected to be $210 million in the fourth quarter of 2008. Because we did not measure 2007 backlog in a manner comparable to today, we are not providing a comparable metric for the fourth quarter of last year.
With that, I’d like to turn the call over to the operator for Q&A.

Additional Modeling Information
29
30
30
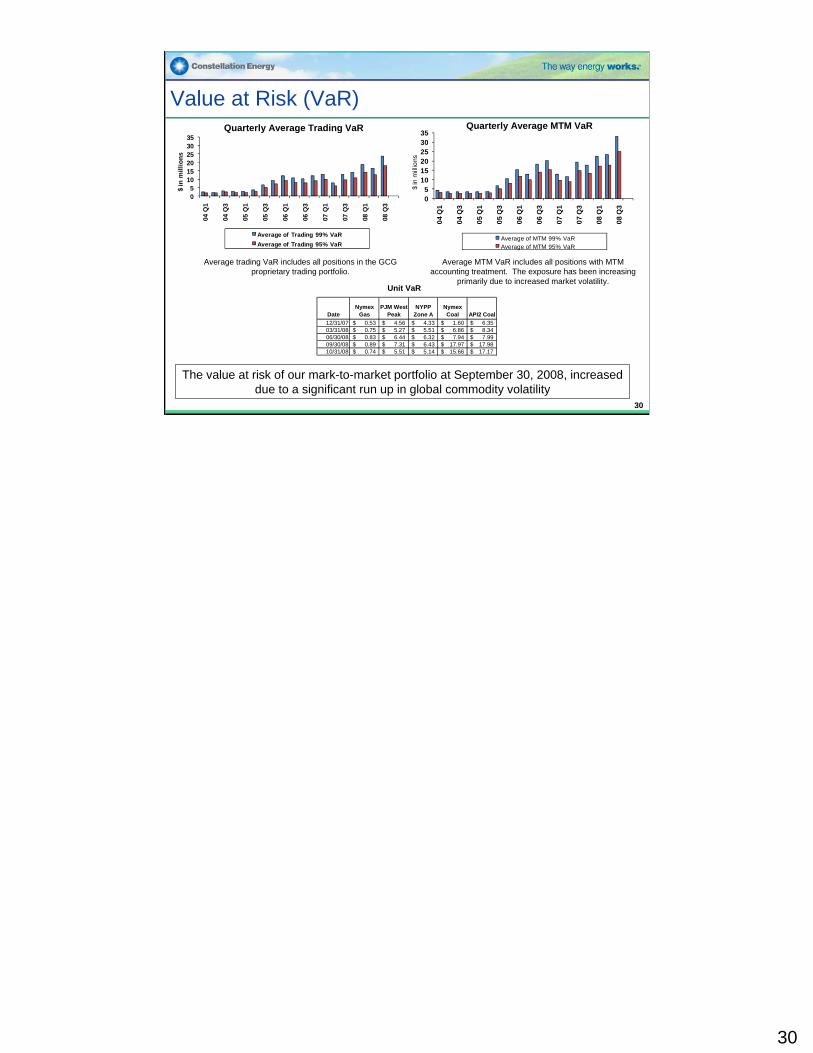
Value at Risk (VaR)
Average MTM VaR includes all positions with MTM accounting treatment. The exposure has been increasing
primarily due to increased market volatility.
Average trading VaR includes all positions in the GCG proprietary trading portfolio.
05
101520253035
04 Q
1
04 Q
3
05 Q
1
05 Q
3
06 Q
1
06 Q
3
07 Q
1
07 Q
3
08 Q
1
08 Q
3
$ in
mill
ions
Average of Trading 99% VaRAverage of Trading 95% VaR
05
101520253035
04 Q
1
04 Q
3
05 Q
1
05 Q
3
06 Q
1
06 Q
3
07 Q
1
07 Q
3
08 Q
1
08 Q
3
$ in
mill
ions
Average of MTM 99% VaRAverage of MTM 95% VaR
Quarterly Average Trading VaR Quarterly Average MTM VaR
The value at risk of our mark-to-market portfolio at September 30, 2008, increased due to a significant run up in global commodity volatility
DateNymex
GasPJM West
PeakNYPP
Zone ANymex Coal API2 Coal
12/31/07 0.53$ 4.56$ 4.33$ 1.60$ 6.35$ 03/31/08 0.75$ 5.27$ 5.51$ 6.86$ 8.34$ 06/30/08 0.83$ 6.44$ 6.32$ 7.94$ 7.99$ 09/30/08 0.89$ 7.31$ 6.43$ 17.97$ 17.98$ 10/31/08 0.74$ 5.51$ 5.14$ 15.66$ 17.17$
Unit VaR
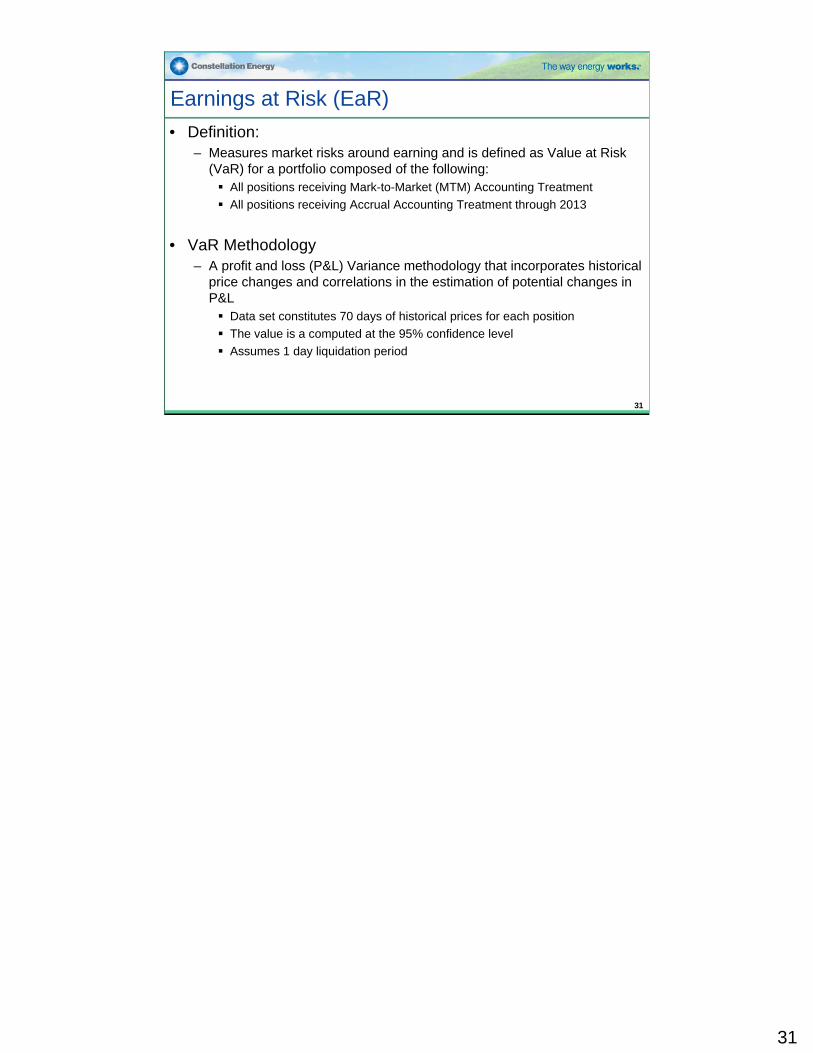
Earnings at Risk (EaR)• Definition:
– Measures market risks around earning and is defined as Value at Risk (VaR) for a portfolio composed of the following:
All positions receiving Mark-to-Market (MTM) Accounting TreatmentAll positions receiving Accrual Accounting Treatment through 2013
• VaR Methodology– A profit and loss (P&L) Variance methodology that incorporates historical
price changes and correlations in the estimation of potential changes in P&L
Data set constitutes 70 days of historical prices for each positionThe value is a computed at the 95% confidence level Assumes 1 day liquidation period
31
31
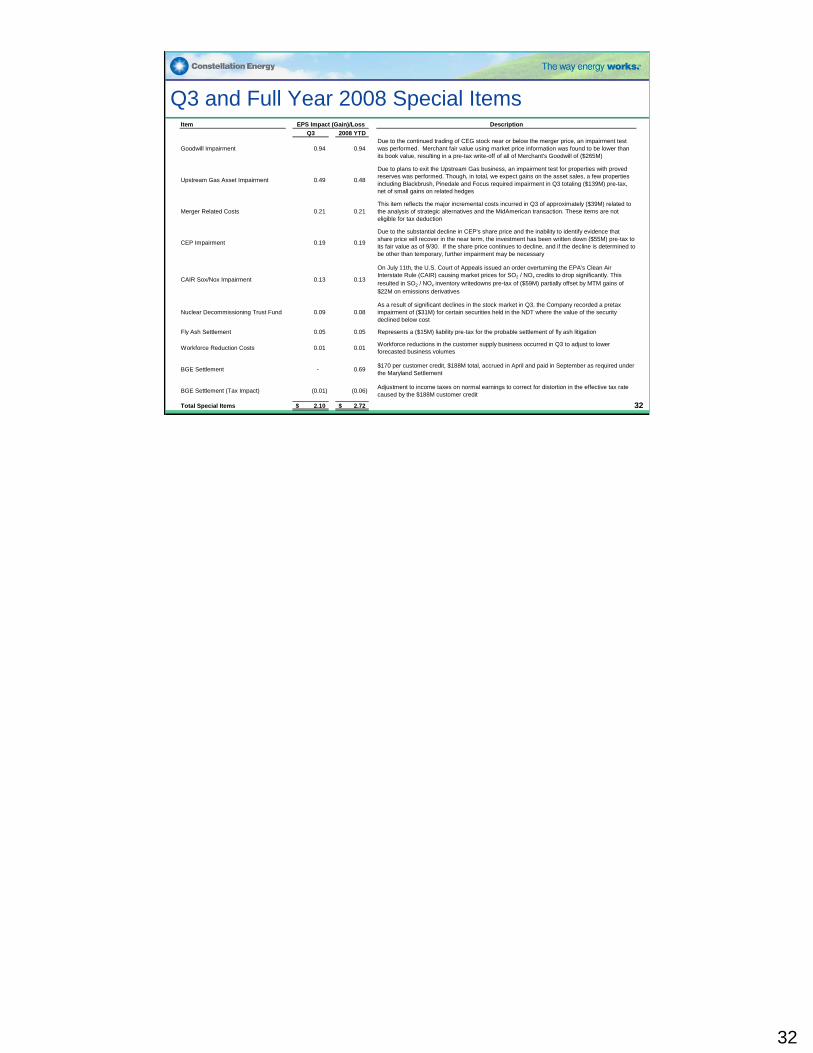
Q3 and Full Year 2008 Special ItemsItem Description
Q3 2008 YTD
Goodwill Impairment 0.94 0.94 Due to the continued trading of CEG stock near or below the merger price, an impairment test was performed. Merchant fair value using market price information was found to be lower than its book value, resulting in a pre-tax write-off of all of Merchant's Goodwill of ($265M)
Upstream Gas Asset Impairment 0.49 0.48
Due to plans to exit the Upstream Gas business, an impairment test for properties with proved reserves was performed. Though, in total, we expect gains on the asset sales, a few properties including Blackbrush, Pinedale and Focus required impairment in Q3 totaling ($139M) pre-tax, net of small gains on related hedges
Merger Related Costs 0.21 0.21 This item reflects the major incremental costs incurred in Q3 of approximately ($39M) related to the analysis of strategic alternatives and the MidAmerican transaction. These items are not eligible for tax deduction
CEP Impairment 0.19 0.19
Due to the substantial decline in CEP's share price and the inability to identify evidence that share price will recover in the near term, the investment has been written down ($55M) pre-tax to its fair value as of 9/30. If the share price continues to decline, and if the decline is determined to be other than temporary, further impairment may be necessary
CAIR Sox/Nox Impairment 0.13 0.13
On July 11th, the U.S. Court of Appeals issued an order overturning the EPA's Clean Air Interstate Rule (CAIR) causing market prices for SO2 / NOx credits to drop significantly. This resulted in SO2 / NOx inventory writedowns pre-tax of ($59M) partially offset by MTM gains of $22M on emissions derivatives
Nuclear Decommissioning Trust Fund 0.09 0.08 As a result of significant declines in the stock market in Q3, the Company recorded a pretax impairment of ($31M) for certain securities held in the NDT where the value of the security declined below cost
Fly Ash Settlement 0.05 0.05 Represents a ($15M) liability pre-tax for the probable settlement of fly ash litigation
Workforce Reduction Costs 0.01 0.01 Workforce reductions in the customer supply business occurred in Q3 to adjust to lower forecasted business volumes
BGE Settlement - 0.69 $170 per customer credit, $188M total, accrued in April and paid in September as required under the Maryland Settlement
BGE Settlement (Tax Impact) (0.01) (0.06) Adjustment to income taxes on normal earnings to correct for distortion in the effective tax rate caused by the $188M customer credit
Total Special Items 2.10$ 2.72$
EPS Impact (Gain)/Loss
32
32
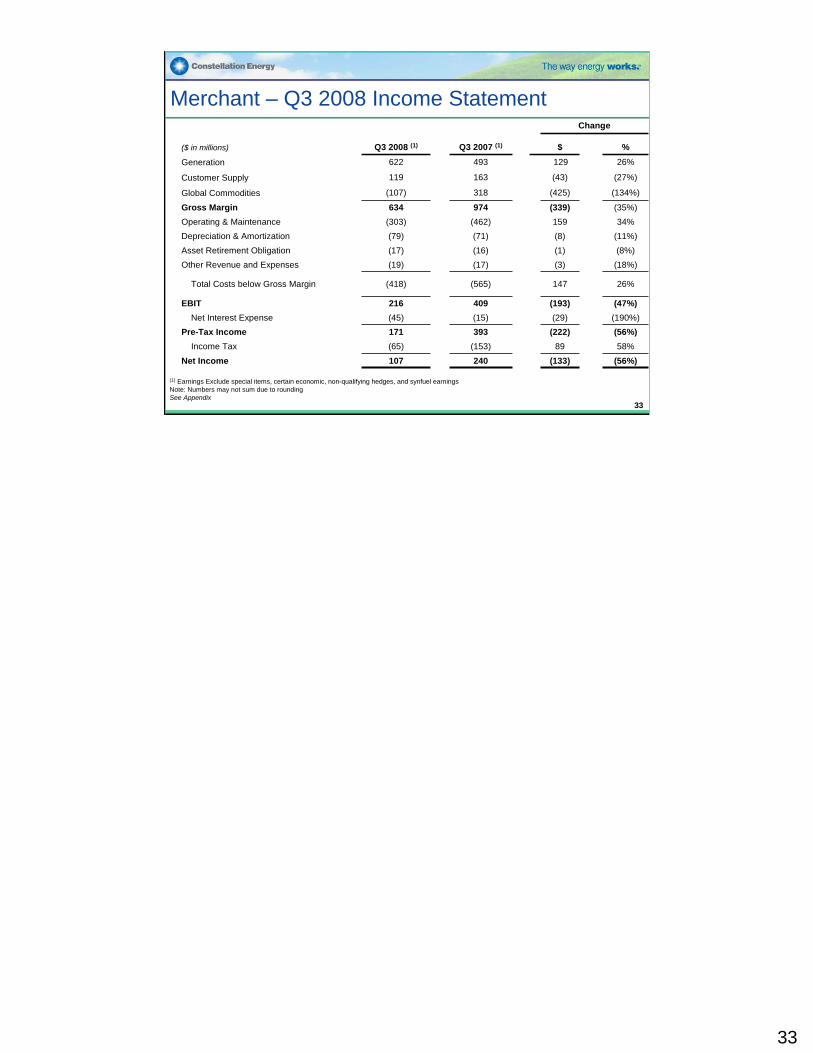
Merchant – Q3 2008 Income Statement
(1) Earnings Exclude special items, certain economic, non-qualifying hedges, and synfuel earningsNote: Numbers may not sum due to roundingSee Appendix
(8%)(1)(16)(17)Asset Retirement Obligation
(134%)(425)318(107)Global Commodities
(27%)(43)163119Customer Supply
26%129493622Generation
(11%)(8)(71)(79)Depreciation & Amortization
(56%)(133)240107Net Income58%89(153)(65)Income Tax
(56%)(222)393171Pre-Tax Income(190%)(29)(15)(45)Net Interest Expense(47%)(193)409216EBIT
26%147(565)(418)Total Costs below Gross Margin
(3)
159(339)
$
Change
(18%)
34%(35%)
%
(17)(19)Other Revenue and Expenses
(462)(303)Operating & Maintenance974634Gross Margin
Q3 2007 (1)Q3 2008 (1)($ in millions)
33
33
34
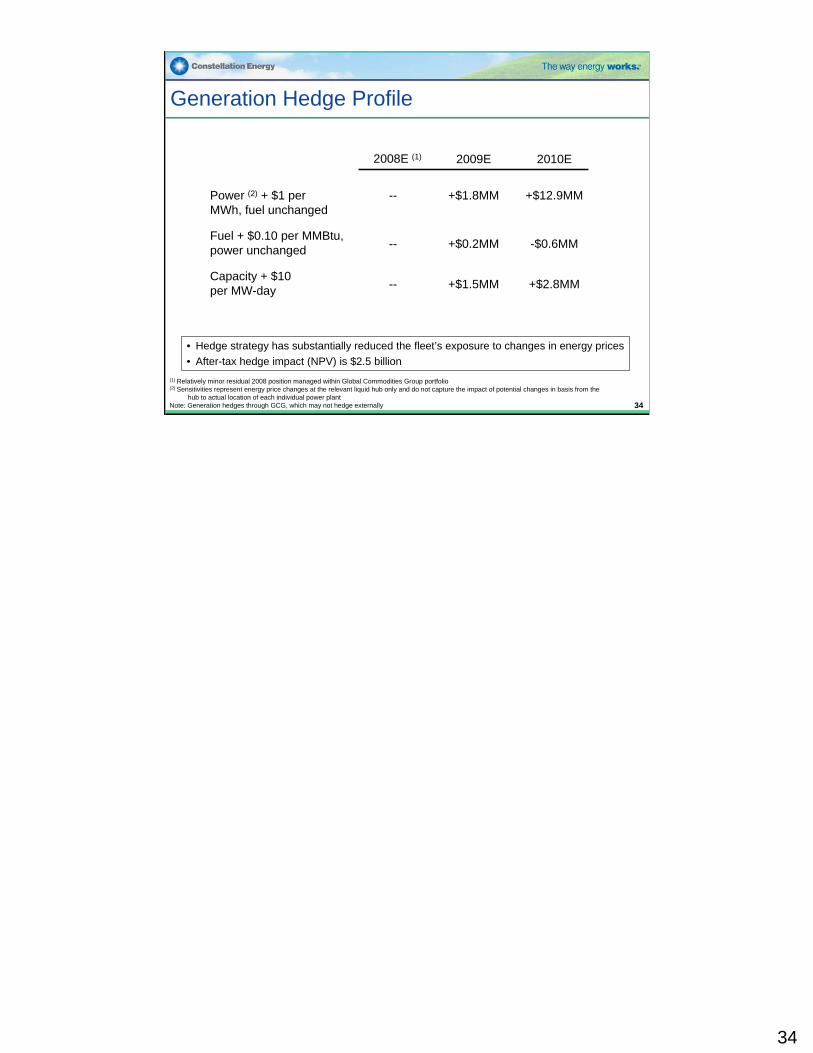
Generation Hedge Profile
• Hedge strategy has substantially reduced the fleet’s exposure to changes in energy prices• After-tax hedge impact (NPV) is $2.5 billion
2008E (1) 2009E 2010E
Power (2) + $1 per MWh, fuel unchanged
Fuel + $0.10 per MMBtu, power unchanged
--
Capacity + $10 per MW-day
+$1.8MM +$12.9MM
-- +$0.2MM -$0.6MM
-- +$1.5MM +$2.8MM
(1) Relatively minor residual 2008 position managed within Global Commodities Group portfolio(2) Sensitivities represent energy price changes at the relevant liquid hub only and do not capture the impact of potential changes in basis from the
hub to actual location of each individual power plantNote: Generation hedges through GCG, which may not hedge externally 34
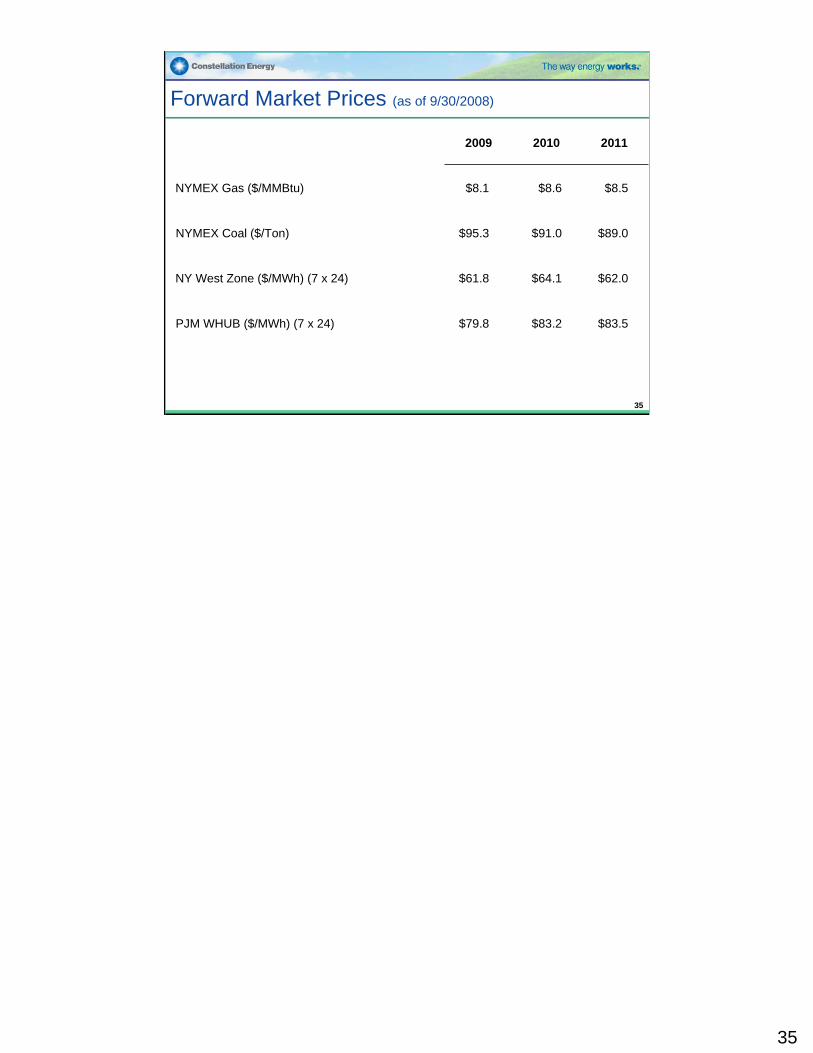
Forward Market Prices (as of 9/30/2008)
201120102009
$83.5$83.2$79.8PJM WHUB ($/MWh) (7 x 24)
$62.0$64.1$61.8NY West Zone ($/MWh) (7 x 24)
$89.0$91.0$95.3NYMEX Coal ($/Ton)
$8.5$8.6$8.1NYMEX Gas ($/MMBtu)
35
35
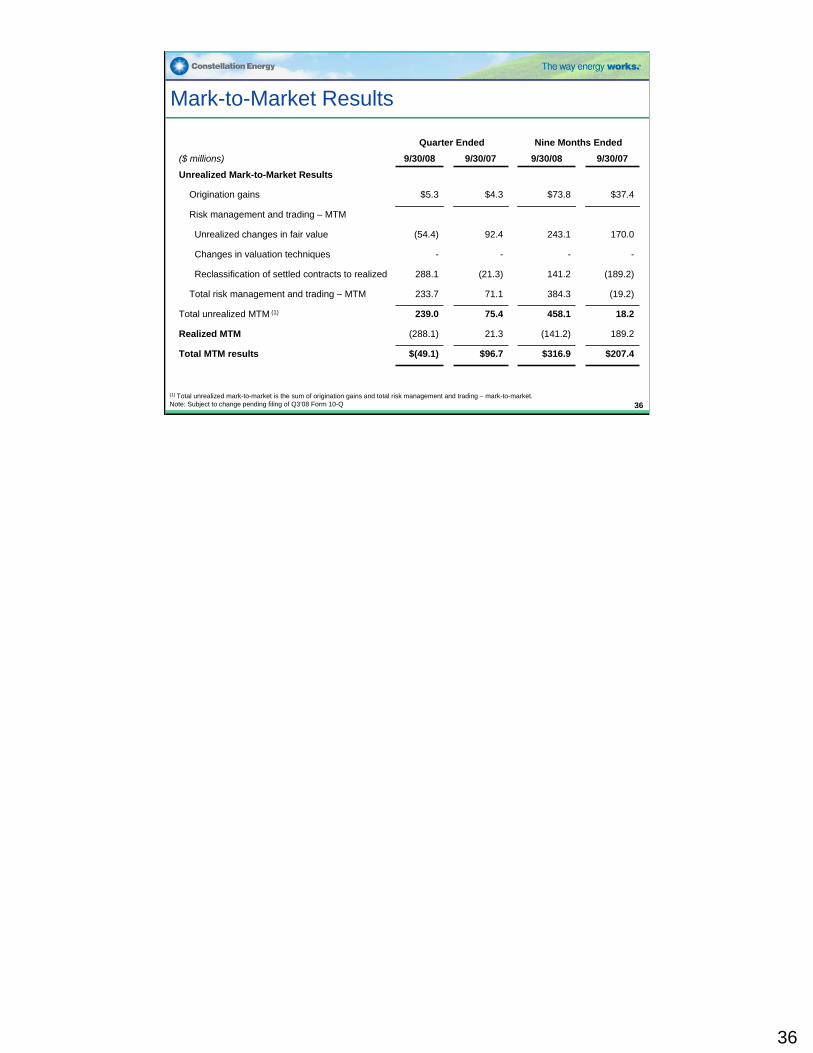
36
Mark-to-Market Results
Nine Months EndedQuarter Ended
$(49.1)
(288.1)
239.0
233.7
288.1
-
(54.4)
$5.3
9/30/08
$316.9
(141.2)
458.1
384.3
141.2
-
243.1
$73.8
9/30/08
189.221.3Realized MTM
(19.2)71.1Total risk management and trading – MTM
18.275.4Total unrealized MTM (1)
$207.4$96.7Total MTM results
Risk management and trading – MTM
170.092.4Unrealized changes in fair value
--Changes in valuation techniques
(189.2)(21.3)Reclassification of settled contracts to realized
$37.4$4.3Origination gains
Unrealized Mark-to-Market Results9/30/079/30/07($ millions)
(1) Total unrealized mark-to-market is the sum of origination gains and total risk management and trading – mark-to-market.Note: Subject to change pending filing of Q3’08 Form 10-Q
36
37
37
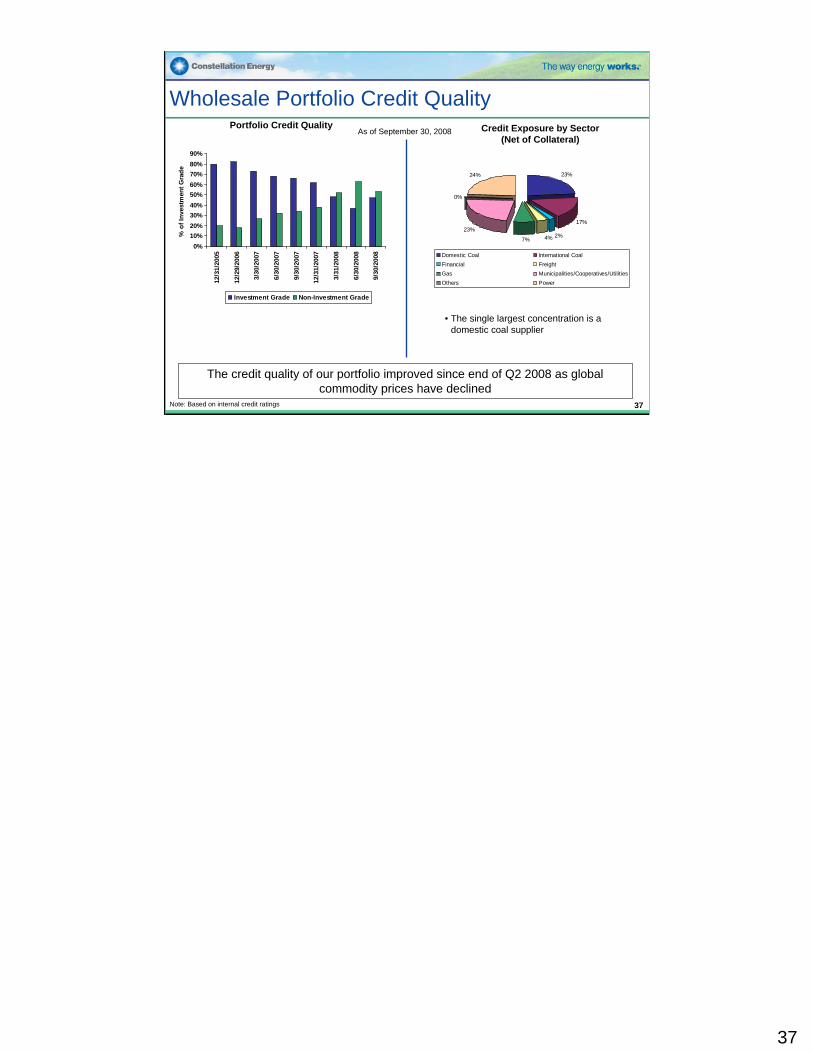
Wholesale Portfolio Credit QualityAs of September 30, 2008
• The single largest concentration is a domestic coal supplier
23%
17%
2%4%7%
23%
0%
24%
Domestic Coal International CoalFinancial FreightGas Municipalities/Cooperatives/UtilitiesOthers Power
0%10%20%30%40%50%60%70%80%90%
12/3
1/20
05
12/2
9/20
06
3/30
/200
7
6/30
/200
7
9/30
/200
7
12/3
1/20
07
3/31
/200
8
6/30
/200
8
9/30
/200
8
% o
f Inv
estm
ent G
rade
Investment Grade Non-Investment Grade
Portfolio Credit Quality Credit Exposure by Sector (Net of Collateral)
The credit quality of our portfolio improved since end of Q2 2008 as global commodity prices have declined
Note: Based on internal credit ratings
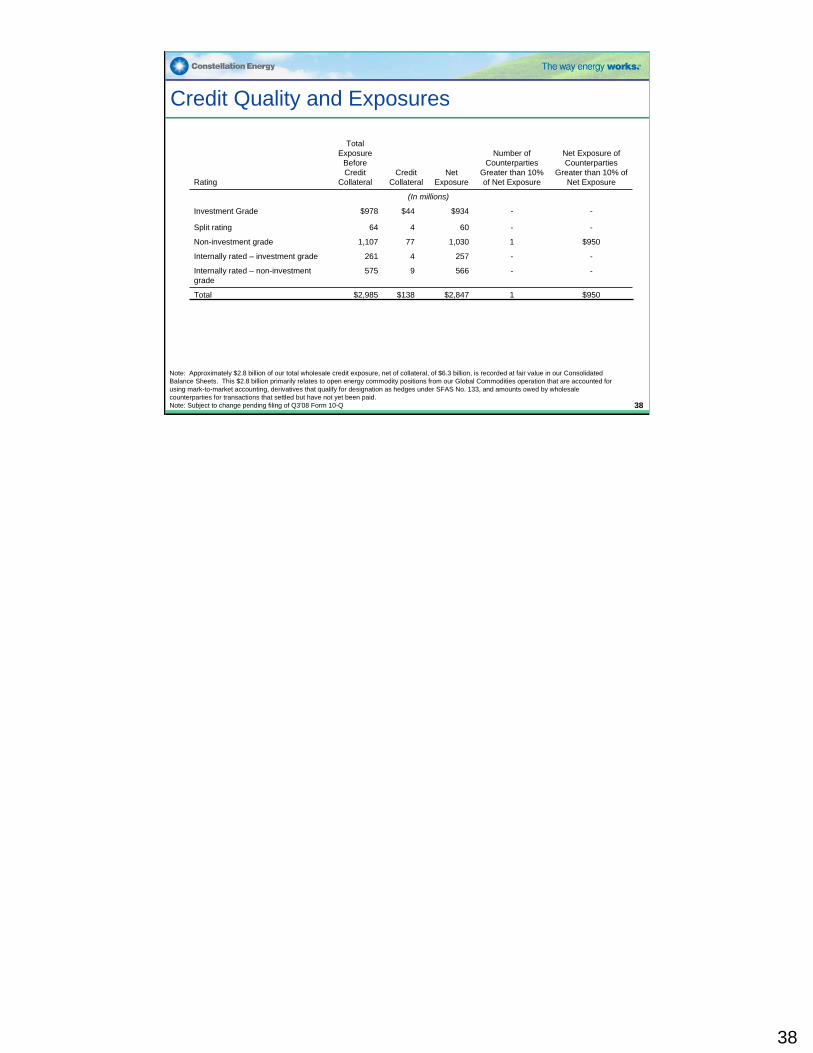
Credit Quality and Exposures
$9501$2,847$138$2,985Total
Net Exposure of Counterparties
Greater than 10% of Net Exposure
Number of Counterparties
Greater than 10% of Net Exposure
Net Exposure
Credit Collateral
Total Exposure
Before Credit
CollateralRating
-
-
1
-
-
(In millions)
-2574261Internally rated – investment grade
566
1,030
60
$934
$950771,107Non-investment grade
-9575Internally rated – non-investment grade
-464Split rating
-$44$978Investment Grade
Note: Approximately $2.8 billion of our total wholesale credit exposure, net of collateral, of $6.3 billion, is recorded at fair value in our Consolidated Balance Sheets. This $2.8 billion primarily relates to open energy commodity positions from our Global Commodities operation that are accounted for using mark-to-market accounting, derivatives that qualify for designation as hedges under SFAS No. 133, and amounts owed by wholesale counterparties for transactions that settled but have not yet been paid.Note: Subject to change pending filing of Q3’08 Form 10-Q 38
38
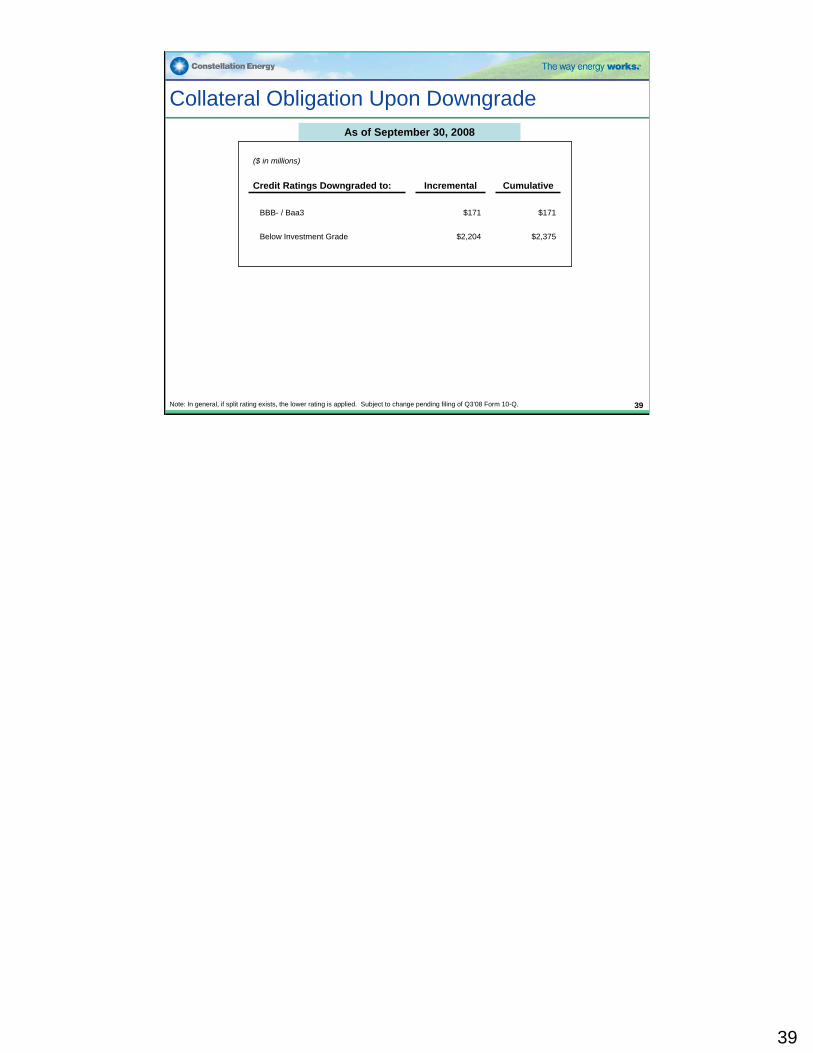
39
Collateral Obligation Upon DowngradeAs of September 30, 2008
$2,375$2,204Below Investment Grade
$171
Cumulative
$171
Incremental
($ in millions)
BBB- / Baa3
Credit Ratings Downgraded to:
Note: In general, if split rating exists, the lower rating is applied. Subject to change pending filing of Q3’08 Form 10-Q. 39
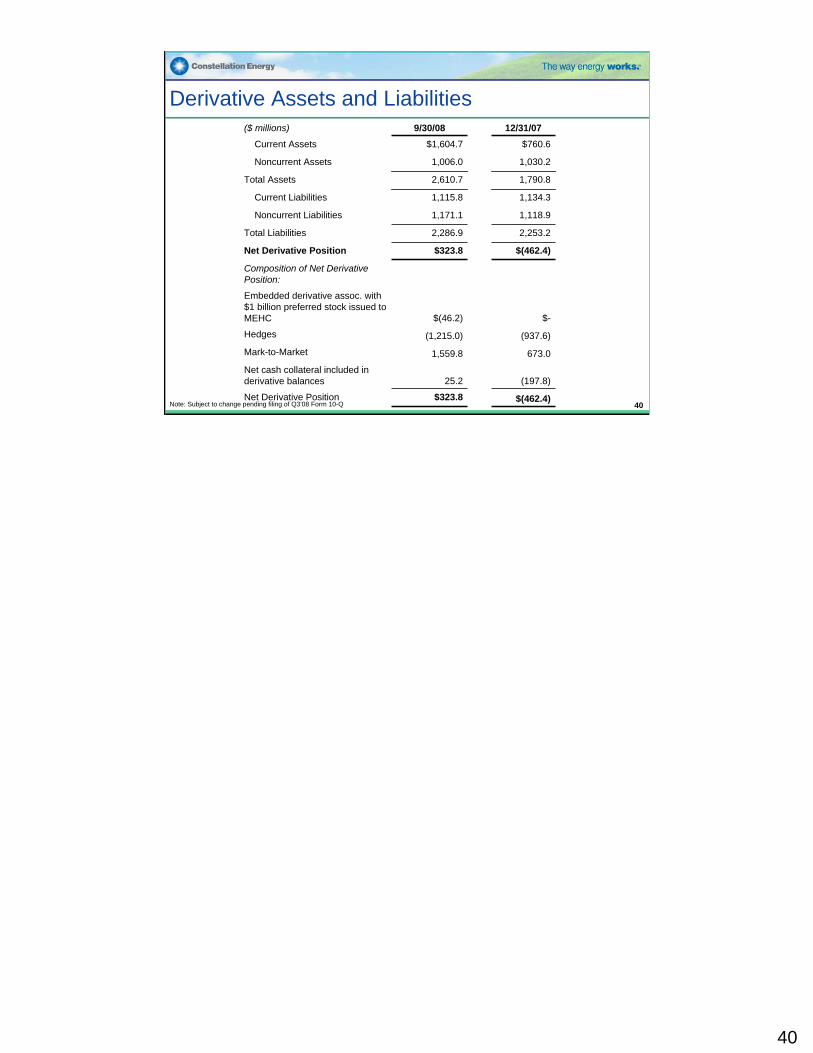
Derivative Assets and Liabilities
$-$(46.2)
Embedded derivative assoc. with $1 billion preferred stock issued to MEHC
(197.8)25.2Net cash collateral included in derivative balances
673.01,559.8Mark-to-Market
(937.6)(1,215.0)Hedges
$(462.4) $323.8Net Derivative Position
Composition of Net Derivative Position:
$(462.4)$323.8Net Derivative Position
1,790.82,610.7Total Assets
1,134.31,115.8Current Liabilities
1,118.91,171.1Noncurrent Liabilities
2,253.22,286.9Total Liabilities
1,030.21,006.0Noncurrent Assets
$760.6$1,604.7Current Assets
12/31/079/30/08($ millions)
Note: Subject to change pending filing of Q3’08 Form 10-Q 40
40
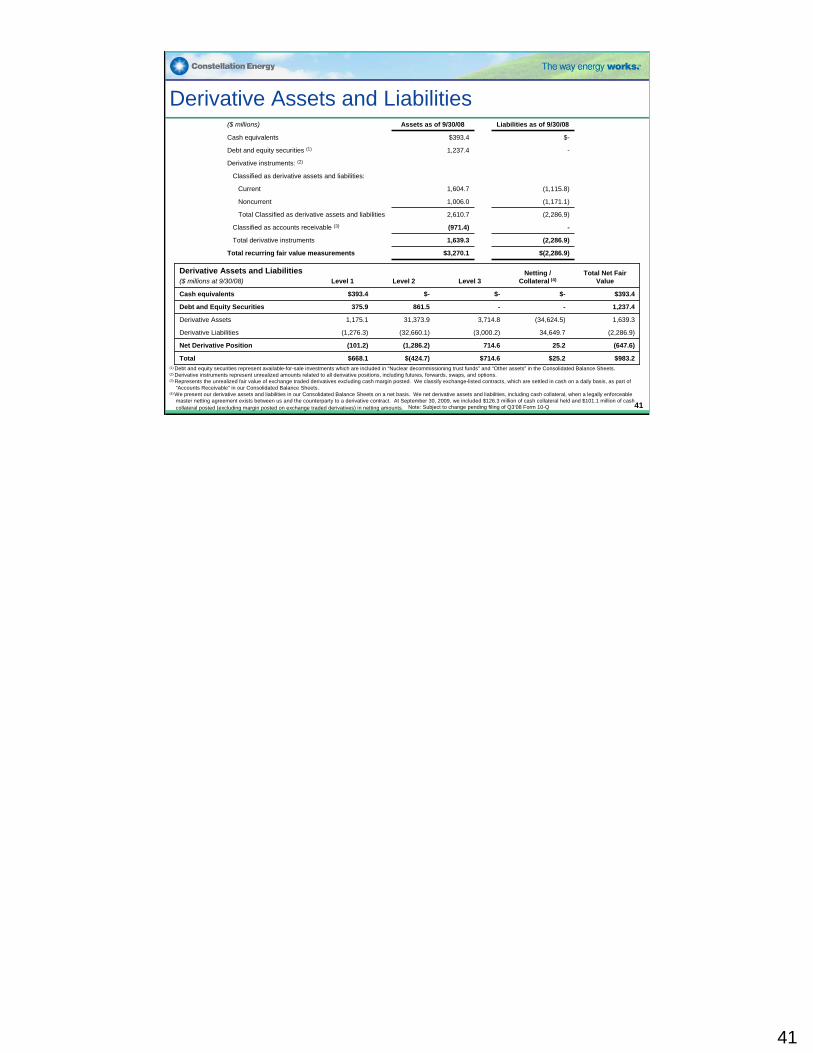
Derivative Assets and Liabilities
$393.4$-$-$-$393.4Cash equivalents
(647.6)25.2714.6(1,286.2)(101.2)Net Derivative Position
$983.2$25.2$714.6$(424.7)$668.1Total
(2,286.9)34,649.7(3,000.2)(32,660.1)(1,276.3)Derivative Liabilities
1,639.3(34,624.5)3,714.831,373.91,175.1Derivative Assets
1,237.4--861.5375.9Debt and Equity Securities
Total Net Fair Value
Netting / Collateral (4)Level 3Level 2Level 1
Derivative Assets and Liabilities($ millions at 9/30/08)
(1) Debt and equity securities represent available-for-sale investments which are included in “Nuclear decommissioning trust funds” and “Other assets” in the Consolidated Balance Sheets.(2) Derivative instruments represent unrealized amounts related to all derivative positions, including futures, forwards, swaps, and options. (3) Represents the unrealized fair value of exchange traded derivatives excluding cash margin posted. We classify exchange-listed contracts, which are settled in cash on a daily basis, as part of
“Accounts Receivable” in our Consolidated Balance Sheets.(4) We present our derivative assets and liabilities in our Consolidated Balance Sheets on a net basis. We net derivative assets and liabilities, including cash collateral, when a legally enforceable
master netting agreement exists between us and the counterparty to a derivative contract. At September 30, 2009, we included $126.3 million of cash collateral held and $101.1 million of cash collateral posted (excluding margin posted on exchange traded derivatives) in netting amounts.
$-$393.4Cash equivalents
-(971.4)Classified as accounts receivable (3)
(2,286.9)1,639.3Total derivative instruments
$(2,286.9)$3,270.1Total recurring fair value measurements
Classified as derivative assets and liabilities:
(1,115.8)1,604.7Current
(1,171.1)1,006.0Noncurrent
(2,286.9)2,610.7Total Classified as derivative assets and liabilities
Derivative instruments: (2)
-1,237.4Debt and equity securities (1)
Liabilities as of 9/30/08Assets as of 9/30/08($ millions)
Note: Subject to change pending filing of Q3’08 Form 10-Q 41
41
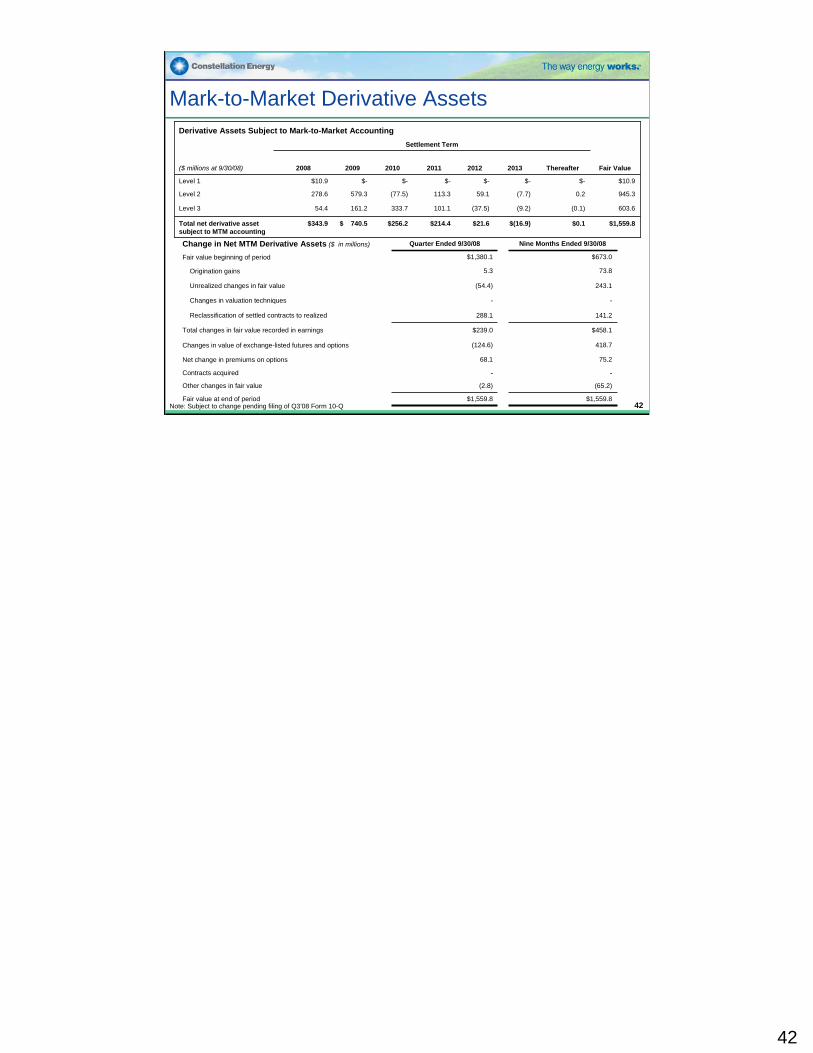
Mark-to-Market Derivative Assets
Settlement Term
$214.4
101.1
113.3
$-
2011
$21.6
(37.5)
59.1
$-
2012
$(16.9)
(9.2)
(7.7)
$-
2013
Derivative Assets Subject to Mark-to-Market Accounting
$1,559.8$0.1$256.2$ 740.5$343.9Total net derivative asset subject to MTM accounting
603.6(0.1)333.7161.254.4Level 3
945.30.2(77.5)579.3278.6Level 2
$10.9$-$-$-$10.9Level 1
Fair ValueThereafter201020092008($ millions at 9/30/08)
73.85.3Origination gains
243.1(54.4)Unrealized changes in fair value
--Changes in valuation techniques
141.2288.1Reclassification of settled contracts to realized
$458.1$239.0Total changes in fair value recorded in earnings
75.268.1Net change in premiums on options
418.7(124.6)Changes in value of exchange-listed futures and options
$673.0$1,380.1Fair value beginning of period
$1,559.8$1,559.8Fair value at end of period
(65.2)(2.8)Other changes in fair value
--Contracts acquired
Nine Months Ended 9/30/08Quarter Ended 9/30/08Change in Net MTM Derivative Assets ($ in millions)
Note: Subject to change pending filing of Q3’08 Form 10-Q 42
42

Nine Months Ended
Merchant Regulated Other 2008 (In millions)
Operating ActivitiesNet income (loss) $105.9 ($14.7) $0.3 $91.5Non-cash adjustments to net income 437.6 239.1 53.1 729.8Changes in working capital:
Derivative assets and liabilities, excluding collateral (931.4) 0.0 (3.6) (935.0)Net collateral and margin (posted) held (571.2) 2.6 0.0 (568.6)Other changes (312.9) 12.0 (57.7) (358.6)
Defined benefit obligations* (10.1) (16.8) (7.3) (34.2)Other 64.7 (41.0) 27.4 51.1
Net cash (used in) provided by operating activities (1,207.3) 198.0 19.5 (1,024.0)Investing Activities
Investments in property, plant and equipment (986.1) (314.9) (59.5) (1,360.5)Acquisitions, net of cash acquired (309.4) 0.0 (7.1) (316.5)Contribution to nuclear decommissioning trust funds (18.7) 0.0 0.0 (18.7)Sales of investments and other assets 14.4 0.0 0.0 14.4Sales of property, plant and equipment 212.8 12.9 1.1 226.8Contract and portfolio acquisitions 0.0 0.0 0.0 0.0Issuance of loans recievable 0.0 0.0 0.0 0.0Repayments of loans receivable 26.0 0.0 0.0 26.0(Increase) decrease in restricted funds 2.7 (5.4) 11.0 8.3Other (2.6) 0.0 (1.5) (4.1)
Net cash used in investing activities (1,060.9) (307.4) (56.0) (1,424.3)Cash flows from operating activities less cash flows
from investing activities ($2,268.2) ($109.4) ($36.5) ($2,448.3)Financing Activities*
653.6 329.6 2,058.6 3,041.8Debt issuance costs 0.0 0.0 0.0 (50.6)Proceeds from issuance of common stock (51.7) 0.0 69.4 17.6Common stock dividends paid 0.0 0.0 (250.7) (250.7)Reacquisition of common stock 0.0 0.0 (16.2) (16.2)Proceeds from contract and portfolio acquisitions 0.0 0.0 0.0 0.0Other 76.9 (174.1) 91.0 44.5
Net cash provided by financing activities 678.8 155.5 1,952.1 2,786.4
Net increase (decrease) in cash and cash equivalents (1,599.4) 29.3 1,908.2 $338.1* Reflects reclassification adjustment made subsequent to November 6, 2008 Earnings Presentation, but prior to filing of Q3 08 Form 10-Q.**Items are not allocated to the business segments because they are managed for the company as a whole. Certain prior-period amounts have been reclassified to conform to the current period presentation.
Net issuance (repayment) of debt (includes $953.8 millionmandatorily redeemable preferred stock from MidAmerican and related $46.2 million embedded derivative liability)
September 30, 2008
2008 Segment Cash FlowsConsolidated Cash
Flows Nine Months Ended
September 30,
Cash Flow YTD 2008 (Revised)*
43
43
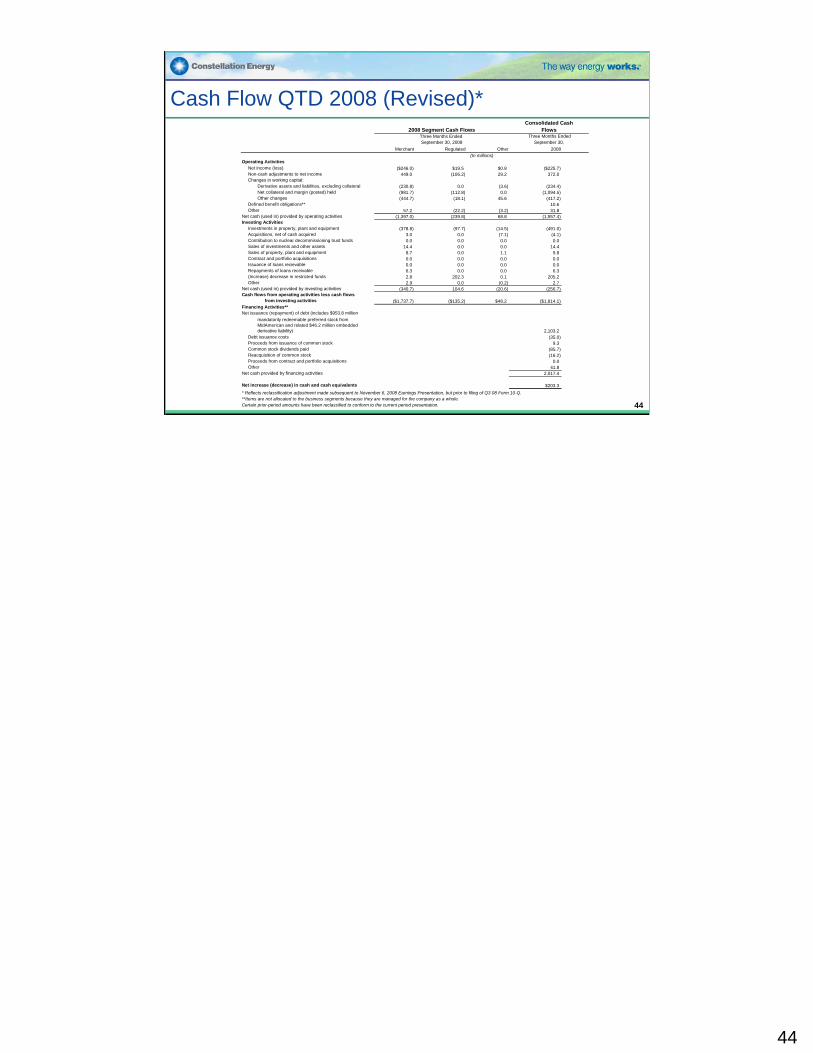
Cash Flow QTD 2008 (Revised)* Three Months Ended
Merchant Regulated Other 2008 (In millions)
Operating ActivitiesNet income (loss) ($246.0) $19.5 $0.8 ($225.7)Non-cash adjustments to net income 449.0 (106.2) 29.2 372.0Changes in working capital:
Derivative assets and liabilities, excluding collateral (230.8) 0.0 (3.6) (234.4)Net collateral and margin (posted) held (981.7) (112.8) 0.0 (1,094.5)Other changes (444.7) (18.1) 45.6 (417.2)
Defined benefit obligations** 6.4 6.5 (2.2) 10.6Other 57.2 (22.2) (3.2) 31.8
Net cash (used in) provided by operating activities (1,397.0) (239.8) 68.8 (1,557.4)Investing Activities
Investments in property, plant and equipment (378.8) (97.7) (14.5) (491.0)Acquisitions, net of cash acquired 3.0 0.0 (7.1) (4.1)Contribution to nuclear decommissioning trust funds 0.0 0.0 0.0 0.0Sales of investments and other assets 14.4 0.0 0.0 14.4Sales of property, plant and equipment 8.7 0.0 1.1 9.8Contract and portfolio acquisitions 0.0 0.0 0.0 0.0Issuance of loans recievable 0.0 0.0 0.0 0.0Repayments of loans receivable 6.3 0.0 0.0 6.3(Increase) decrease in restricted funds 2.8 202.3 0.1 205.2Other 2.9 0.0 (0.2) 2.7
Net cash (used in) provided by investing activities (340.7) 104.6 (20.6) (256.7)Cash flows from operating activities less cash flows
from investing activities ($1,737.7) ($135.2) $48.2 ($1,814.1)Financing Activities**
0.0 189.0 1,914.1 2,103.2Debt issuance costs 0.0 0.0 0.0 (35.0)Proceeds from issuance of common stock 0.0 0.0 9.3 9.3Common stock dividends paid 0.0 0.0 (85.6) (85.7)Reacquisition of common stock 0.0 0.0 (16.2) (16.2)Proceeds from contract and portfolio acquisitions 0.0 0.0 0.0 0.0Other 40.8 (85.6) 51.7 41.8
Net cash provided by financing activities 40.8 103.4 1,873.4 2,017.4
Net increase (decrease) in cash and cash equivalents (1,690.8) (25.4) 1,919.6 $203.3* Reflects reclassification adjustment made subsequent to November 6, 2008 Earnings Presentation, but prior to filing of Q3 08 Form 10-Q.**Items are not allocated to the business segments because they are managed for the company as a whole. Certain prior-period amounts have been reclassified to conform to the current period presentation.
Consolidated CashFlows
Three Months Ended September 30,
Net issuance (repayment) of debt (includes $953.8 millionmandatorily redeemable preferred stock from MidAmerican and related $46.2 million embedded derivative liability)
September 30, 2008
2008 Segment Cash Flows
44
44
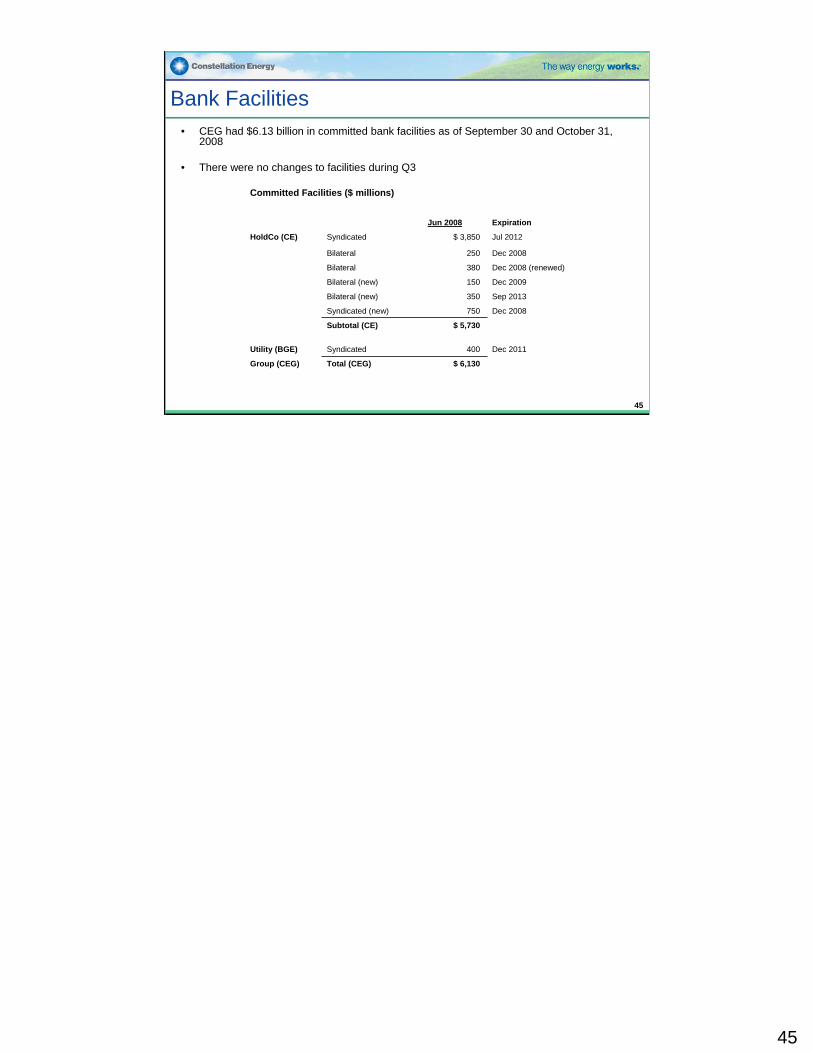
Bank Facilities• CEG had $6.13 billion in committed bank facilities as of September 30 and October 31,
2008
• There were no changes to facilities during Q3
Committed Facilities ($ millions)
Dec 2009150Bilateral (new)
$ 6,130
400
$ 5,730
750
350
380
250
$ 3,850
Jun 2008
Total (CEG)Group (CEG)
Dec 2008 (renewed)Bilateral
Sep 2013Bilateral (new)
Dec 2008Syndicated (new)
Subtotal (CE)
Dec 2008Bilateral
Dec 2011SyndicatedUtility (BGE)
Jul 2012SyndicatedHoldCo (CE)
Expiration
45
45
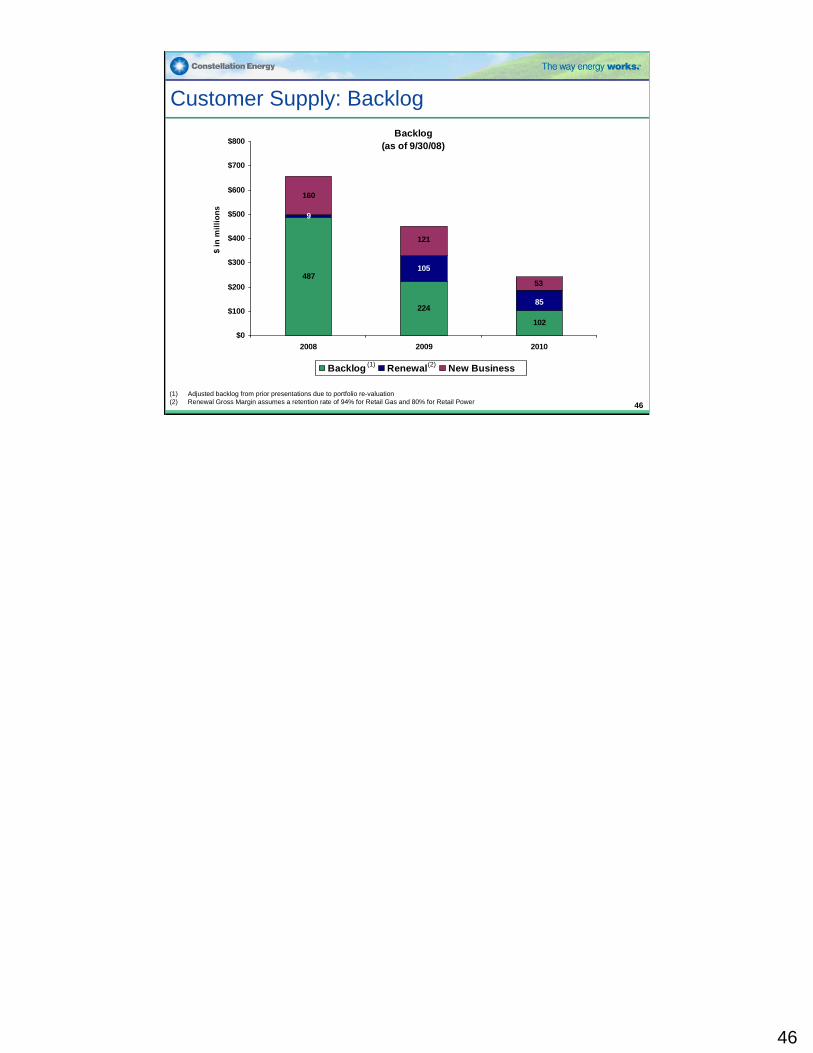
Customer Supply: Backlog
(1) Adjusted backlog from prior presentations due to portfolio re-valuation(2) Renewal Gross Margin assumes a retention rate of 94% for Retail Gas and 80% for Retail Power
Backlog(as of 9/30/08)
487
224
102
9
105
160
85
121
53
$0
$100
$200
$300
$400
$500
$600
$700
$800
2008 2009 2010
$ in
mill
ions
Backlog Renewal New Business (1) (2)
46
46
Non-GAAP Reconciliations
47
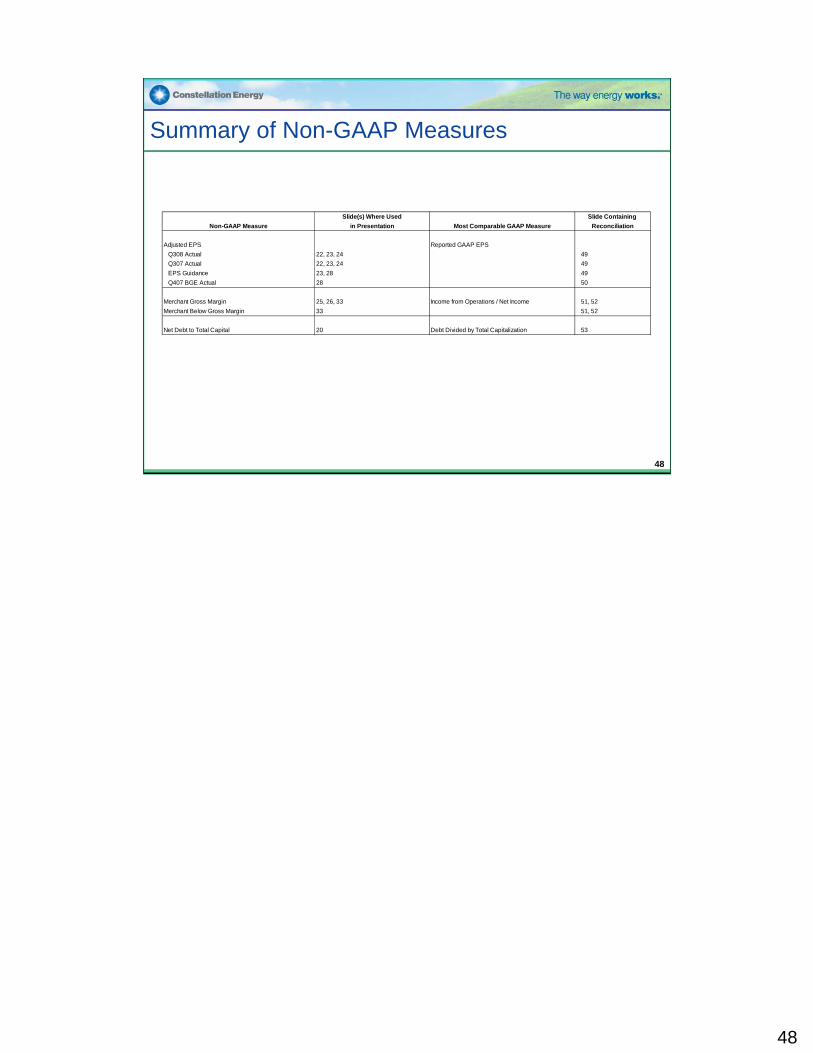
Summary of Non-GAAP Measures
Slide(s) Where Used Slide Containing Non-GAAP Measure in Presentation Most Comparable GAAP Measure Reconciliation
Adjusted EPS Reported GAAP EPSQ308 Actual 22, 23, 24 49Q307 Actual 22, 23, 24 49EPS Guidance 23, 28 49Q407 BGE Actual 28 50
Merchant Gross Margin 25, 26, 33 Income from Operations / Net Income 51, 52Merchant Below Gross Margin 33 51, 52
Net Debt to Total Capital 20 Debt Divided by Total Capitalization 53
48
48
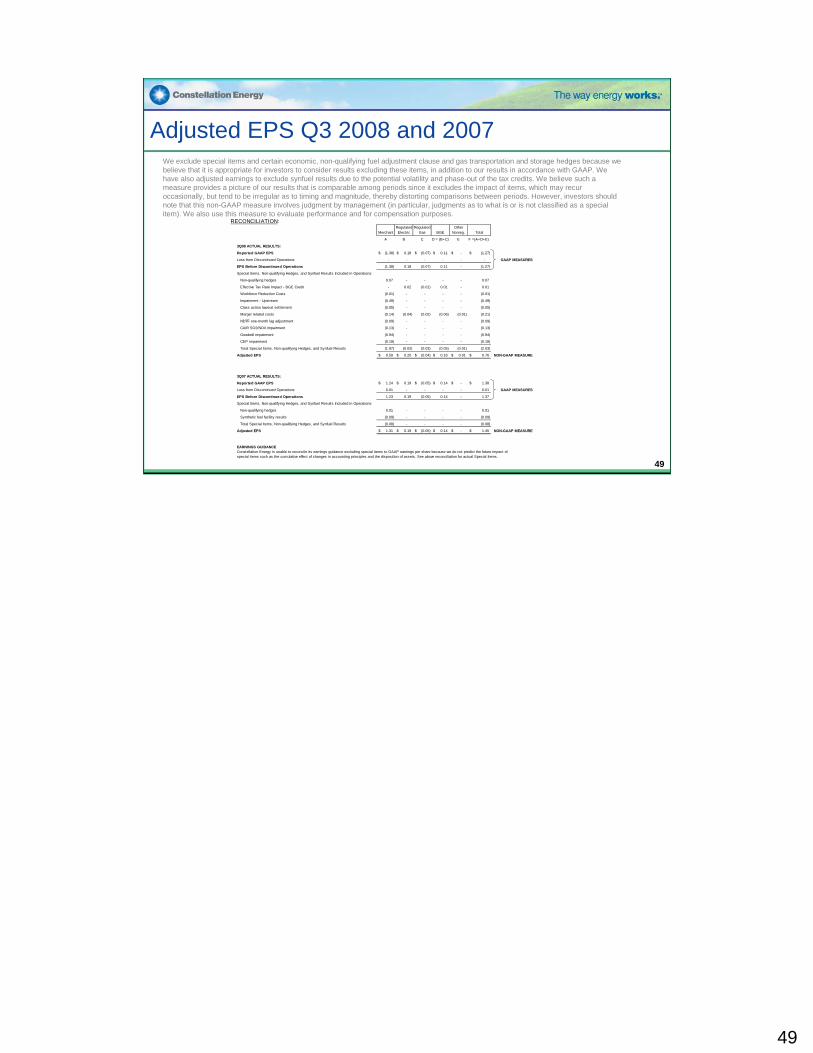
Adjusted EPS Q3 2008 and 2007We exclude special items and certain economic, non-qualifying fuel adjustment clause and gas transportation and storage hedges because we believe that it is appropriate for investors to consider results excluding these items, in addition to our results in accordance with GAAP. We have also adjusted earnings to exclude synfuel results due to the potential volatility and phase-out of the tax credits. We believe such a measure provides a picture of our results that is comparable among periods since it excludes the impact of items, which may recur occasionally, but tend to be irregular as to timing and magnitude, thereby distorting comparisons between periods. However, investors should note that this non-GAAP measure involves judgment by management (in particular, judgments as to what is or is not classified as a special item). We also use this measure to evaluate performance and for compensation purposes.
RECONCILIATION:Regulated Regulated Other
Merchant Electric Gas BGE Nonreg. Total
A B C D = (B+C) E F =(A+D+E)
3Q08 ACTUAL RESULTS:
Reported GAAP EPS (1.38)$ 0.18$ (0.07)$ 0.11$ -$ (1.27)$
Loss from Discontinued Operations - - - - - - GAAP MEASURES
(1.38) 0.18 (0.07) 0.11 - (1.27)
Special Items, Non-qualifying Hedges, and Synfuel Results Included in Operations:
Non-qualifying hedges 0.07 - - - - 0.07
Effective Tax Rate Impact - BGE Credit - 0.02 (0.01) 0.01 - 0.01
Workforce Reduction Costs (0.01) - - - - (0.01)
Impairment - Upstream (0.49) - - - - (0.49)
Class action lawsuit settlement (0.05) - - - - (0.05)
Merger related costs (0.14) (0.04) (0.02) (0.06) (0.01) (0.21)
NDTF one-month lag adjustment (0.09) - - - - (0.09)
CAIR SO2/NOX impairment (0.13) - - - - (0.13)
Goodwill impairment (0.94) - - - - (0.94)
CEP impairment (0.19) - - - - (0.19)
Total Special Items, Non-qualifying Hedges, and Synfuel Results (1.97) (0.02) (0.03) (0.05) (0.01) (2.03)
Adjusted EPS 0.59$ 0.20$ (0.04)$ 0.16$ 0.01$ 0.76$ NON-GAAP MEASURE
3Q07 ACTUAL RESULTS:
Reported GAAP EPS 1.24$ 0.19$ (0.05)$ 0.14$ -$ 1.38$
Loss from Discontinued Operations 0.01 - - - - 0.01 GAAP MEASURES
1.23 0.19 (0.05) 0.14 - 1.37
Special Items, Non-qualifying Hedges, and Synfuel Results Included in Operations:
Non-qualifying hedges 0.01 - - - - 0.01
Synthetic fuel facility results (0.09) - - - - (0.09)
Total Special Items, Non-qualifying Hedges, and Synfuel Results (0.08) - - - - (0.08)
Adjusted EPS 1.31$ 0.19$ (0.05)$ 0.14$ -$ 1.45$ NON-GAAP MEASURE
EARNINGS GUIDANCE Constellation Energy is unable to reconcile its earnings guidance excluding special items to GAAP earnings per share because we do not predict the future impact ofspecial items such as the cumulative effect of changes in accounting principles and the disposition of assets. See above reconciliation for actual Special Items.
EPS Before Discontinued Operations
EPS Before Discontinued Operations
49
49
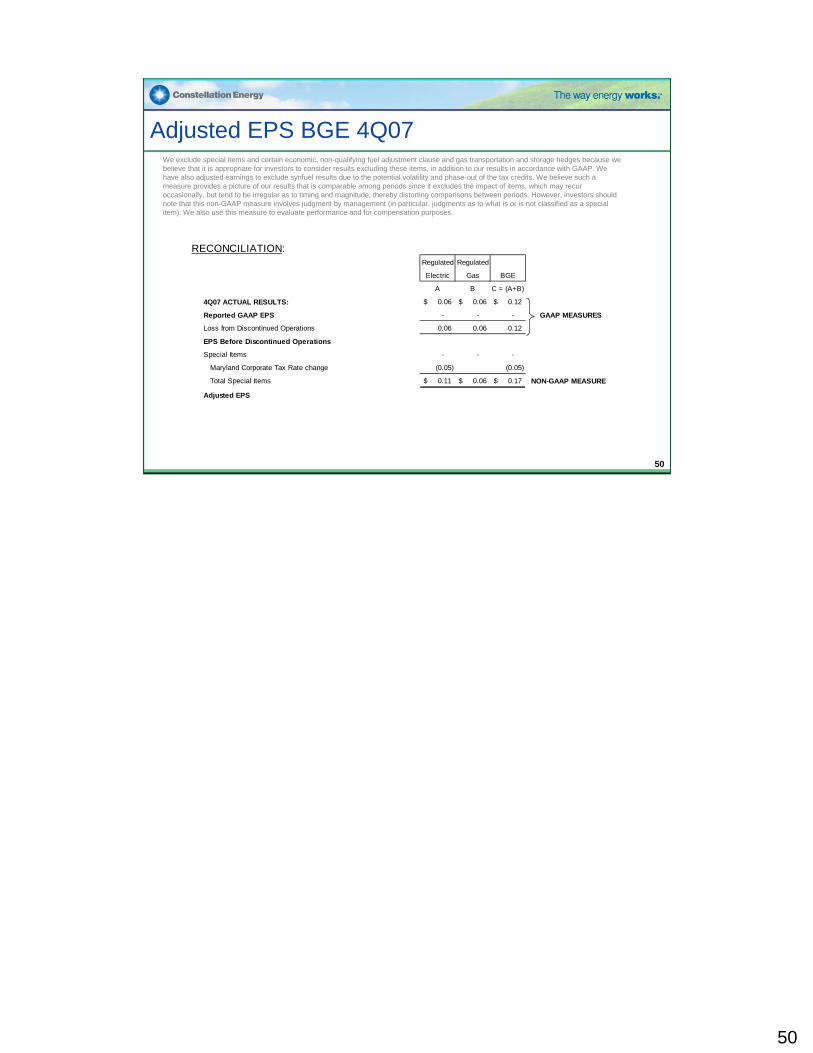
Adjusted EPS BGE 4Q07 We exclude special items and certain economic, non-qualifying fuel adjustment clause and gas transportation and storage hedges because we believe that it is appropriate for investors to consider results excluding these items, in addition to our results in accordance with GAAP. We have also adjusted earnings to exclude synfuel results due to the potential volatility and phase-out of the tax credits. We believe such a measure provides a picture of our results that is comparable among periods since it excludes the impact of items, which may recur occasionally, but tend to be irregular as to timing and magnitude, thereby distorting comparisons between periods. However, investors should note that this non-GAAP measure involves judgment by management (in particular, judgments as to what is or is not classified as a special item). We also use this measure to evaluate performance and for compensation purposes.
RECONCILIATION:Regulated Regulated
Electric Gas BGE
A B C = (A+B)
4Q07 ACTUAL RESULTS: 0.06$ 0.06$ 0.12$
Reported GAAP EPS - - - GAAP MEASURES
Loss from Discontinued Operations 0.06 0.06 0.12
Special Items - - -
Maryland Corporate Tax Rate change (0.05) (0.05)
Total Special Items 0.11$ 0.06$ 0.17$ NON-GAAP MEASURE
Adjusted EPS
EPS Before Discontinued Operations
50
50
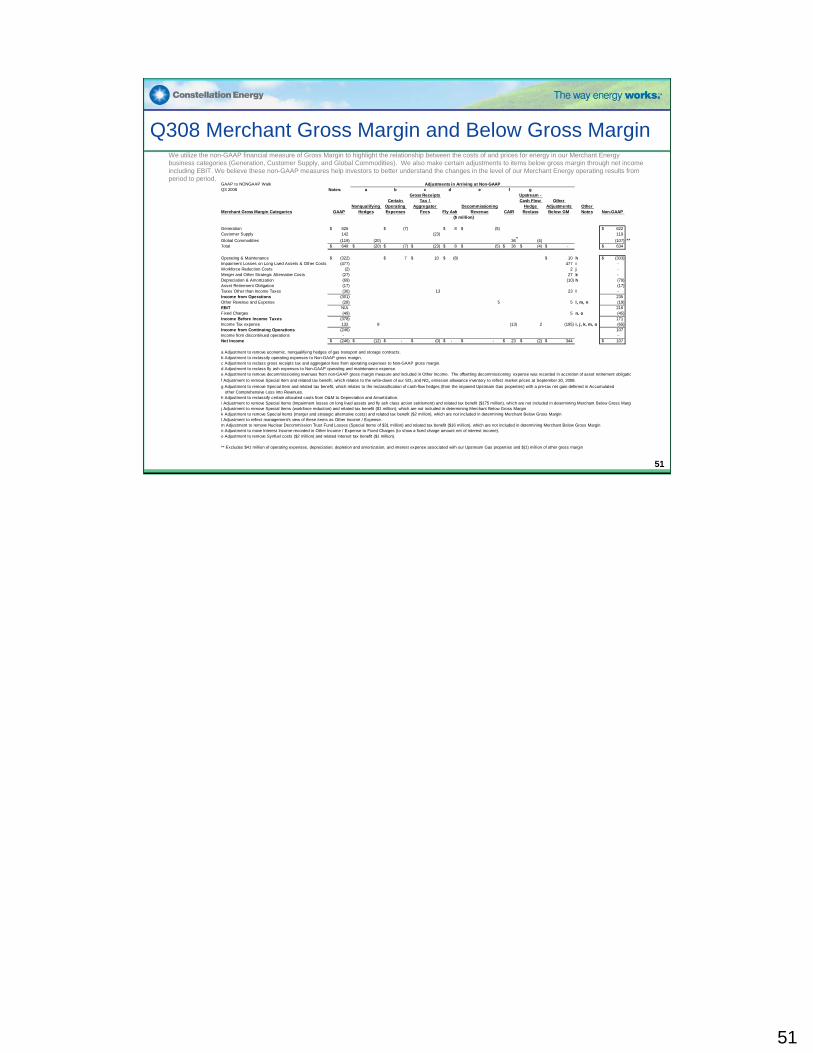
Q308 Merchant Gross Margin and Below Gross MarginWe utilize the non-GAAP financial measure of Gross Margin to highlight the relationship between the costs of and prices for energy in our Merchant Energy business categories (Generation, Customer Supply, and Global Commodities). We also make certain adjustments to items below gross margin through net income including EBIT. We believe these non-GAAP measures help investors to better understand the changes in the level of our Merchant Energy operating results from period to period.
GAAP to NONGAAP WalkQ3 2008 Notes: a b c d e f g
Merchant Gross Margin Categories GAAPNonqualifying
Hedges
Certain Operating Expenses
Gross Receipts Tax /
Aggregator Fees Fly Ash
DecommissioningRevenue CAIR
Upstream - Cash Flow
Hedge Reclass
Other Adjustments Below GM
Other Notes Non-GAAP
Generation 626$ (7)$ 8$ (5)$ 622$ Customer Supply 142 (23) 119 Global Commodities (119) (20) 36 (4) (107) **Total 649$ (20)$ (7)$ (23)$ 8$ (5)$ 36$ (4)$ -$ 634$
Operating & Maintenance (322)$ 7$ 10$ (8)$ 10$ h (303)$ Impairment Losses on Long Lived Assets & Other Costs (477) 477 i - Workforce Reduction Costs (2) 2 j - Merger and Other Strategic Alternative Costs (27) 27 k - Depreciation & Amortization (69) (10) h (79) Asset Retirement Obligation (17) (17) Taxes Other than Income Taxes (36) 13 23 l - Income from Operations (301) 235 Other Revenue and Expense (28) 5 5 l, m, n (19) EBIT N/A 216 Fixed Charges (49) 5 n. o (45) Income Before Income Taxes (378) 171 Income Tax expense 132 8 (13) 2 (195) i, j, k, m, o (65) Income from Continuing Operations (246) 107 Income from discontinued operations - - Net Income (246)$ (12)$ -$ (0)$ -$ -$ 23$ (2)$ 344$ 107$
a Adjustment to remove economic, nonqualifying hedges of gas transport and storage contracts.b Adjustment to reclassify operating expenses to Non-GAAP gross margin.c Adjustment to reclass gross receipts tax and aggregator fees from operating expenses to Non-GAAP gross margin.d Adjustment to reclass fly ash expenses to Non-GAAP operating and maintenance expense.e Adjustment to remove decommissioning revenues from non-GAAP gross margin measure and included in Other Income. The offsetting decommissioning expense was recorded in accretion of asset retirement obligatiof Adjustment to remove Special Item and related tax benefit, which relates to the write-down of our SO2 and NOx emission allowance inventory to reflect market prices at September 30, 2008.g Adjustment to remove Special Item and related tax benefit, which relates to the reclassification of cash-flow hedges (from the impaired Upstream Gas properties) with a pre-tax net gain deferred in Accumulated other Comprehensive Loss into Revenues. h Adjustment to reclassify certain allocated costs from O&M to Depreciation and Amortization.i Adjustment to remove Special Items (Impairment losses on long lived assets and fly ash class action settlement) and related tax benefit ($175 million), which are not included in determining Merchant Below Gross Margij Adjustment to remove Special Items (workforce reduction) and related tax benefit ($1 million), which are not included in determining Merchant Below Gross Margink Adjustment to remove Special Items (merger and strategic alternative costs) and related tax benefit ($2 million), which are not included in determining Merchant Below Gross Marginl Adjustment to reflect management's view of these items as Other Income / Expense. m Adjustment to remove Nuclear Decommission Trust Fund Losses (Special Items of $31 million) and related tax benefit ($16 million), which are not included in determining Merchant Below Gross Marginn Adjustment to move Interest Income recorded in Other Income / Expense to Fixed Charges (to show a fixed charge amount net of interest income).o Adjustment to remove Synfuel costs ($2 million) and related interest tax benefit ($1 million).
** Excludes $41 million of operating expenses, depreciation, depletion and amortization, and interest expense associated with our Upstream Gas properties and $(1) million of other gross margin
Adjustments in Arriving at Non-GAAP
($ million)
51
51
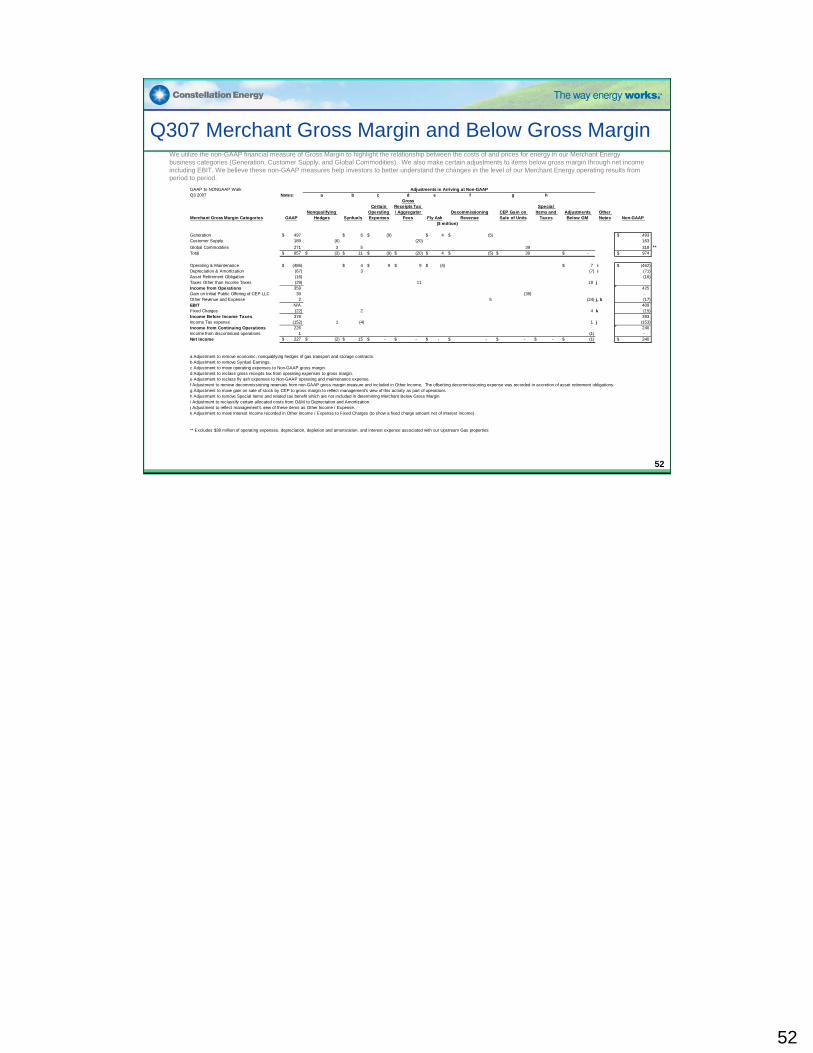
Q307 Merchant Gross Margin and Below Gross MarginWe utilize the non-GAAP financial measure of Gross Margin to highlight the relationship between the costs of and prices for energy in our Merchant Energy business categories (Generation, Customer Supply, and Global Commodities). We also make certain adjustments to items below gross margin through net income including EBIT. We believe these non-GAAP measures help investors to better understand the changes in the level of our Merchant Energy operating results from period to period.
GAAP to NONGAAP WalkQ3 2007 Notes: a b c d e f g h
Merchant Gross Margin Categories GAAPNonqualifying
Hedges Synfuels
Certain Operating Expenses
Gross Receipts Tax / Aggregator
Fees Fly AshDecommissioning
RevenueCEP Gain on Sale of Units
Special Items and
TaxesAdjustments Below GM
Other Notes Non-GAAP
Generation 497$ 6$ (9)$ 4$ (5)$ 493$ Customer Supply 189 (6) (20) 163 Global Commodities 271 3 5 39 318 **Total 957$ (3)$ 11$ (9)$ (20)$ 4$ (5)$ 39$ -$ 974$
Operating & Maintenance (486)$ 4$ 9$ 9$ (4)$ 7$ i (462)$ Depreciation & Amortization (67) 3 (7) i (71) Asset Retirement Obligation (16) (16) Taxes Other than Income Taxes (29) 11 18 j - Income from Operations 359 425 Gain on initial Public Offering of CEP LLC 39 (39) - Other Revenue and Expense 2 5 (24) j, k (17) EBIT N/A 409 Fixed Charges (22) 2 4 k (15) Income Before Income Taxes 378 393 Income Tax expense (152) 1 (4) 1 j (153) Income from Continuing Operations 226 240 Income from discontinued operations 1 (1) - Net Income 227$ (2)$ 15$ -$ -$ -$ -$ -$ -$ (1)$ 240$
a Adjustment to remove economic, nonqualifying hedges of gas transport and storage contracts.b Adjustment to remove Synfuel Earnings.c Adjustment to move operating expenses to Non-GAAP gross margin.d Adjustment to reclass gross receipts tax from operating expenses to gross margin.e Adjustment to reclass fly ash expenses to Non-GAAP operating and maintenance expense.f Adjustment to remove decommissioning revenues from non-GAAP gross margin measure and included in Other Income. The offsetting decommissioning expense was recorded in accretion of asset retirement obligations.g Adjustment to move gain on sale of stock by CEP to gross margin to reflect management's view of this activity as part of operationsh Adjustment to remove Special Items and related tax benefit which are not included in determining Merchant Below Gross Margin.i Adjustment to reclassify certain allocated costs from O&M to Depreciation and Amortization.j Adjustment to reflect management's view of these items as Other Income / Expense. k Adjustment to move Interest Income recorded in Other Income / Expense to Fixed Charges (to show a fixed charge amount net of interest income).
** Excludes $38 million of operating expenses, depreciation, depletion and amortization, and interest expense associated with our Upstream Gas properties
($ million)
Adjustments in Arriving at Non-GAAP
52
52
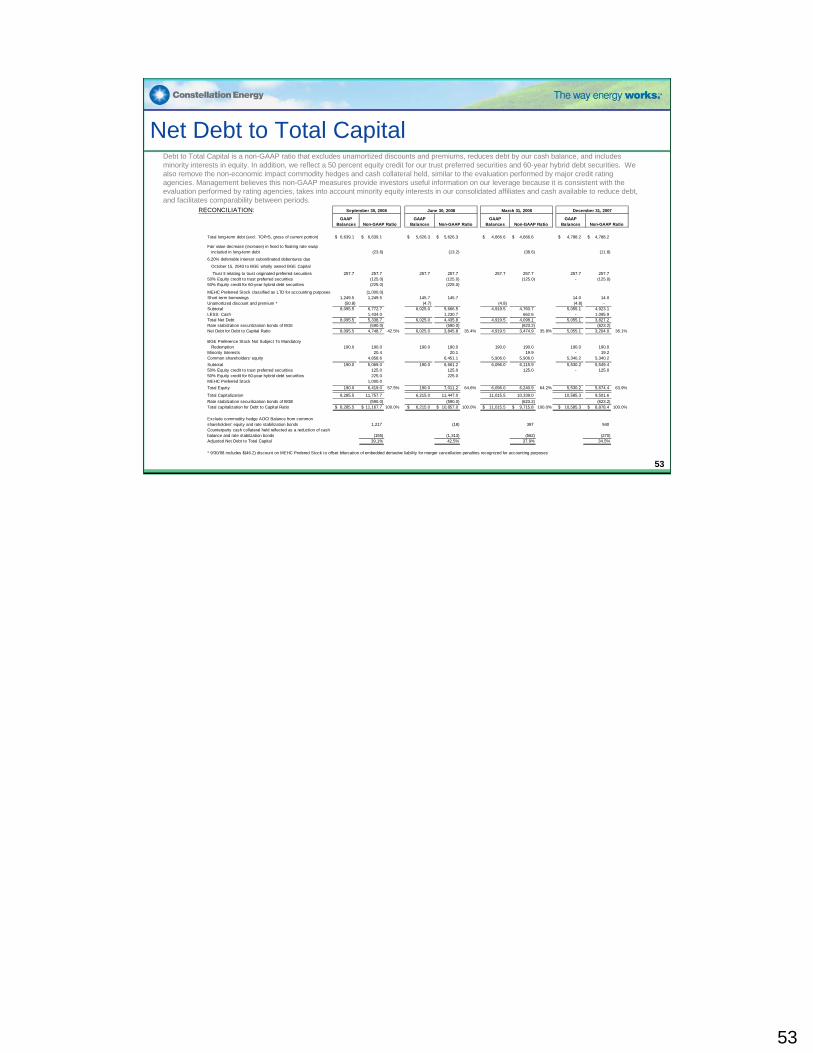
Net Debt to Total Capital Debt to Total Capital is a non-GAAP ratio that excludes unamortized discounts and premiums, reduces debt by our cash balance, and includes minority interests in equity. In addition, we reflect a 50 percent equity credit for our trust preferred securities and 60-year hybrid debt securities. We also remove the non-economic impact commodity hedges and cash collateral held, similar to the evaluation performed by major credit rating agencies. Management believes this non-GAAP measures provide investors useful information on our leverage because it is consistent with the evaluation performed by rating agencies, takes into account minority equity interests in our consolidated affiliates and cash available to reduce debt, and facilitates comparability between periods.
RECONCILIATION:
Total long-term debt (excl. TOPrS, gross of current portion) 6,639.1$ 6,639.1$ 5,626.3$ 5,626.3$ 4,666.6$ 4,666.6$ 4,788.2$ 4,788.2$
Fair value decrease (increase) in fixed to floating rate swap included in long-term debt (23.6) (13.2) (38.6) (11.8)
6.20% deferrable interest subordinated debentures due
October 15, 2043 to BGE wholly owned BGE Capital
Trust II relating to trust originated preferred securities 257.7 257.7 257.7 257.7 257.7 257.7 257.7 257.7 50% Equity credit to trust preferred securities (125.0) (125.0) (125.0) - (125.0) 50% Equity credit for 60-year hybrid debt securities (225.0) (225.0)
MEHC Preferred Stock classified as LTD for accounting purposes (1,000.0) Short-term borrowings 1,249.5 1,249.5 145.7 145.7 14.0 14.0 Unamortized discount and premium * (50.8) (4.7) (4.8) (4.8) - Subtotal 8,095.5 6,772.7 6,025.0 5,666.5 4,919.5 4,760.7 5,055.1 4,923.1 LESS: Cash 1,434.0 1,230.7 662.6 - 1,095.9 Total Net Debt 8,095.5 5,338.7 6,025.0 4,435.8 4,919.5 4,098.1 5,055.1 3,827.2 Rate stabilzation securitization bonds of BGE (590.0) (590.0) (623.2) (623.2) Net Debt for Debt to Capital Ratio 8,095.5 4,748.7 42.5% 6,025.0 3,845.8 35.4% 4,919.5 3,474.9 35.8% 5,055.1 3,204.0 36.1%
BGE Preference Stock Not Subject To Mandatory Redemption 190.0 190.0 190.0 190.0 190.0 190.0 190.0 190.0 Minority Interests 20.4 20.1 19.9 - 19.2 Common shareholders' equity 4,858.6 6,451.1 5,906.0 5,906.0 5,340.2 5,340.2 Subtotal 190.0 5,069.0 190.0 6,661.2 6,096.0 6,115.9 5,530.2 5,549.4 50% Equity credit to trust preferred securities 125.0 125.0 125.0 - 125.0 50% Equity credit for 60-year hybrid debt securities 225.0 225.0 MEHC Preferred Stock 1,000.0 Total Equity 190.0 6,419.0 57.5% 190.0 7,011.2 64.6% 6,096.0 6,240.9 64.2% 5,530.2 5,674.4 63.9%
Total Capitalization 8,285.5 11,757.7 6,215.0 11,447.0 11,015.5 10,339.0 10,585.3 9,501.6 Rate stabilzation securitization bonds of BGE (590.0) (590.0) (623.2) (623.2) Total capitalization for Debt to Capital Ratio 8,285.5$ 11,167.7$ 100.0% 6,215.0$ 10,857.0$ 100.0% 11,015.5$ 9,715.8$ 100.0% 10,585.3$ 8,878.4$ 100.0%
Exclude commodity hedge AOCI Balance from common shareholders' equity and rate stabilization bonds 1,217 (18) 397 940 Counterparty cash collateral held reflected as a reduction of cash balance and rate stabilzation bonds (155) (1,313) (562) (270) Adjusted Net Debt to Total Capital 39.1% 42.5% 37.9% 34.5%
* 9/30/08 includes $(46.2) discount on MEHC Prefered Stock to offset bifurcation of embedded derivative liability for merger cancellation penalties recognized for accounting purposes
March 31, 2008
GAAP Balances Non-GAAP Ratio
December 31, 2007
GAAP Balances Non-GAAP Ratio
GAAP Balances
September 30, 2008
Non-GAAP Ratio
June 30, 2008
GAAP Balances Non-GAAP Ratio
53
53