Consolidated Interim Report for Q4 2016 -...
45
ASBISc Enterprises Plc INTERIM REPORT FOR THE THREE AND TWELVE MONTHS ENDED 31 DECEMBER 2016 Limassol, February 28 th , 2017
-
Upload
truongkhanh -
Category
Documents
-
view
215 -
download
1
Transcript of Consolidated Interim Report for Q4 2016 -...
ASBISc Enterprises Plc
INTERIM REPORT FOR THE THREE AND TWELVE MONTHS ENDED 31 DECEMBER 2016
Limassol, February 28th, 2017

2
TABLE OF CONTENTS
Page
PART I ADDITIONAL INFORMATION 4
PART II FINANCIAL STATEMENTS 24

3
DIRECTORS’ REPORT ON THE COMPANY’S AND GROUP’S OPERATIONS
We have prepared this report as required by Paragraph 82 section 1 point 1 of the Regulation of the Ministry of
Finance dated 19 February 2009 on current and periodic information to be published by issuers of securities and
conditions of recognition of information required by the law of non-member country as equal.
PRESENTATION OF FINANCIAL AND OTHER INFORMATION
In this quarterly report all references to the Company apply to ASBISc Enterprises Plc and all references to the
Group apply to ASBISc Enterprises Plc and its consolidated subsidiaries. Expressions such as "we", "us", "our"
and similar apply generally to the Group (including its particular subsidiaries, depending on the country
discussed), unless from the context it is clear that they apply to the Company alone.
Financial and Operating Data
This quarterly report contains financial statements of, and financial information relating to the Group. In particular,
this quarterly report contains our interim consolidated financial statements for the three months ended 31
December 2016. The financial statements appended to this quarterly report are presented in U.S. dollars and
have been prepared in accordance with International Accounting Standard ("IAS") 34.
The functional currency of the Company is U.S. dollars. Accordingly, transactions in currencies other than our
functional currency are translated into U.S. dollars at the exchange rates prevailing on the applicable transaction
dates.
Certain arithmetical data contained in this quarterly report, including financial and operating information, have
been subject to rounding adjustments. Accordingly, in certain instances, the sum of the numbers in a column or a
row in tables contained in this quarterly report may not conform exactly to the total figure given for that column or
row.
Currency Presentation
Unless otherwise indicated, all references in this quarterly report to "U.S. $" or "U.S. dollars" are to the lawful
currency of the United States; all references to "€" or the "Euro" are to the lawful currency of the member states of
the European Union that adopt the single currency in accordance with the EC Treaty, which means the Treaty
establishing the European Community (signed in Rome on 25 March 1957), as amended by the Treaty on
European Union (signed in Maastricht on 7 February 1992) and as amended by the Treaty of Amsterdam (signed
in Amsterdam on 2 October 1997) and includes, for this purpose, Council Regulations (EC) No. 1103/97 and No.
974/98; and all references to "PLN" or "Polish Zloty" are to the lawful currency of the Republic of Poland.
All references to U.S. dollars, Polish Zloty, Euro and other currencies are in thousands, except share and per
share data, unless otherwise stated.
FORWARD-LOOKING STATEMENTS
This quarterly report contains forward-looking statements relating to our business, financial condition and results
of operations. You can find many of these statements by looking for words such as "may", "will", "expect",
"anticipate", "believe", "estimate" and similar words used in this quarterly report. By their nature, forward-looking
statements are subject to numerous assumptions, risks and uncertainties. Accordingly, actual results may differ
materially from those expressed or implied by the forward-looking statements. We caution you not to place undue
reliance on such statements, which speak only as of the date of this quarterly report.
The cautionary statements set out above should be considered in connection with any subsequent written or oral
forward-looking statements that we or persons acting on our behalf may issue. We do not undertake any
obligation to review or confirm analysts’ expectations or estimates or to release publicly any revisions to any
forward-looking statements to reflect events or circumstances after the date of this quarterly report.

4
Part I Additional information
1. Overview
ASBISc Enterprises Plc is one of the leading distributors of Information Technology ("IT") products in
Europe, Middle East and Africa (“EMEA”) Emerging Markets: Central and Eastern Europe, the Baltic
States, the Former Soviet Union, the Middle East and Africa, combining a broad geographical reach
with a wide range of products distributed on a "one-stop-shop" basis. Our main focus is on the
following countries: Slovakia, Poland, Czech Republic, Romania, Croatia, Slovenia, Bulgaria, Serbia,
Hungary, Middle East countries (i.e. United Arab Emirates, Iraq, Qatar and other Gulf states), Russia,
Belarus, Kazakhstan and Ukraine.
The Group distributes IT components (to assemblers, system integrators, local brands and retail) as
well as A-branded finished products like desktop PCs, laptops, servers, and networking to SMB and
retail. Our IT product portfolio encompasses a wide range of IT components, blocks and peripherals,
and mobile IT systems. We currently purchase the majority of our products from leading international
manufacturers, including Intel, Advanced Micro Devices ("AMD"), Seagate, Western Digital, Samsung,
Microsoft, Toshiba, Dell, Acer, Apple, Lenovo and Hitachi. In addition, a significant part of our revenue
is comprised of sales of IT products under our private labels, Prestigio and Canyon.
ASBISc commenced business in 1990 in Belarus and in 1995 we incorporated our holding Company
in Cyprus and moved our headquarters to Limassol. Our Cypriot headquarters support, through two
master distribution centres (located in the Czech Republic and the United Arab Emirates), our network
of 31 warehouses located in 24 countries. This network supplies products to the Group's in-country
operations and directly to its customers in approximately 60 countries.
The Company’s registered and principal administrative office is at Diamond Court, 43 Kolonakiou
Street, Ayios Athanasios, CY-4103 Limassol, Cyprus.
2. Executive summary for the three and twelve month periods ended 31 December 2016
The three month period ended December 31st, 2016, was a continuation of improvement that the
Company started back in Q3 2015. Following restructuring done in 2015 the Company’s results were
improving in every single quarter of 2016 as compared to the corresponding quarters of 2015 and to
preceding quarters of 2016. This was also the case of Q4 2016 when our net profitability reached its
2016 peak. This allowed us to deliver our forecast for 2016. The positive events of 2016 allow the
Group to aim for better results in 2017.
The principal events of the three months ended 31 December 2016 were as follows:
Revenues in Q4 2016 decreased by 0.71% to U.S. $ 364,242 from U.S. $ 366,846 in Q4 2015.
However, revenues in Q4 2016 were 31.95% higher as compared to Q3 2016 continuing on the
upward trend.
Gross profit in Q4 2016 has increased by 16.70% to U.S. $ 21,171 from U.S. $ 18,140 in Q4 2015.
More importantly, it also grew by 25.48% as compared to Q3 2016. This is very significant, since
our gross profitability throughout 2016 has been growing fast despite flat revenues.
Gross profit margin in Q4 2016 has increased by 17.54% to 5.81% from 4.94% in Q4 2015. This
continued on the trend of increased gross profitability in 2016.
Selling expenses in Q4 2016 have increased by 21.67% to U.S. $ 9,104 from U.S. $ 7,483 in Q4
2015. This is obviously related to significant improvement in gross profitability.

5
Administrative expenses in Q4 2016 have decreased by 3.34% to U.S. $ 4,173 from U.S. $ 4,317
in Q4 2015. They were also a 2.83% below expenses of Q3 2016. This followed our strict control
over expenses.
Financial expenses in Q4 2016 have decreased by 1.89% to U.S.$ 4,455 from U.S.$ 4,541.
EBITDA in Q4 2016 was positive and amounted to U.S. $ 8,452 in comparison to U.S. $ 7,001 in
Q4 2015.
As a result of flat revenues, much improved gross profitability and controlled expenses, the
Company has generated in Q4 2016 a net profit after taxation of U.S. $ 2,635 as compared to
U.S.$ 2,039 in Q4 2015.
The following table presents revenues breakdown by regions for the three month periods ended
December 31st, 2016 and 2015 respectively (in U.S.$ thousands):
Region
Q4 2016
Q4 2015
Change Q4/Q4
Former Soviet Union 153,830 117,847 +30.53%
Central and Eastern Europe 129,377 169,327 -23.59%
Middle East and Africa 48,695 45,673 +6.62%
Western Europe 29,588 25,961 +13.97%
Other 2,752 8,038 -65.77%
Total 364,242 366,846 -0.71%
The principal events of the twelve months ended 31 December 2015 were as follows:
Revenues in Q1-Q4 2016 decreased by 3.72% to U.S. $ 1,137,709 from U.S. $ 1,181,613 in Q1-
Q4 2015.
Gross profit in Q1-Q4 2016 increased by 40.23% to U.S. $ 65,414 from U.S. $ 46,649 in Q1-Q4
2015.
Gross profit margin in Q1-Q4 2016 increased to 5.75% from 3.95% in Q1-Q4 2015. This was
a result of our strategy to focus more on margins and net profitability.
Selling expenses in Q1-Q4 2016 decreased by 5.85% to U.S. $ 28,838 from U.S. $ 30,630 in Q1-
Q4 2015. This has been achieved despite the significant growth in gross profit.
Administrative expenses in Q1-Q4 2016 have decreased by 14.34% to U.S. $ 16,339 from U.S. $
19,075 in Q1-Q4 2015 following strict control on expenses after restructuring of 2015.
Financial expenses in Q1-Q4 2016 have decreased by 0.11% to U.S.$ 14,855 from U.S.$ 14,872.
EBITDA in Q1-Q4 2016 was positive and amounted to U.S. $ 22,381 in comparison to a negative
number of U.S. $ -482 in Q1-Q4 2015.
As a result, despite flat revenues, we had a much improved year. In Q1-Q4 2016 the Company
posted a net profit after tax of U.S. $ 4,636 in comparison to a net loss after tax of U.S. $ 17,152 in
Q1-Q4 2015. This is a significant U.S.$ 21.5 million improvement year on year.
6
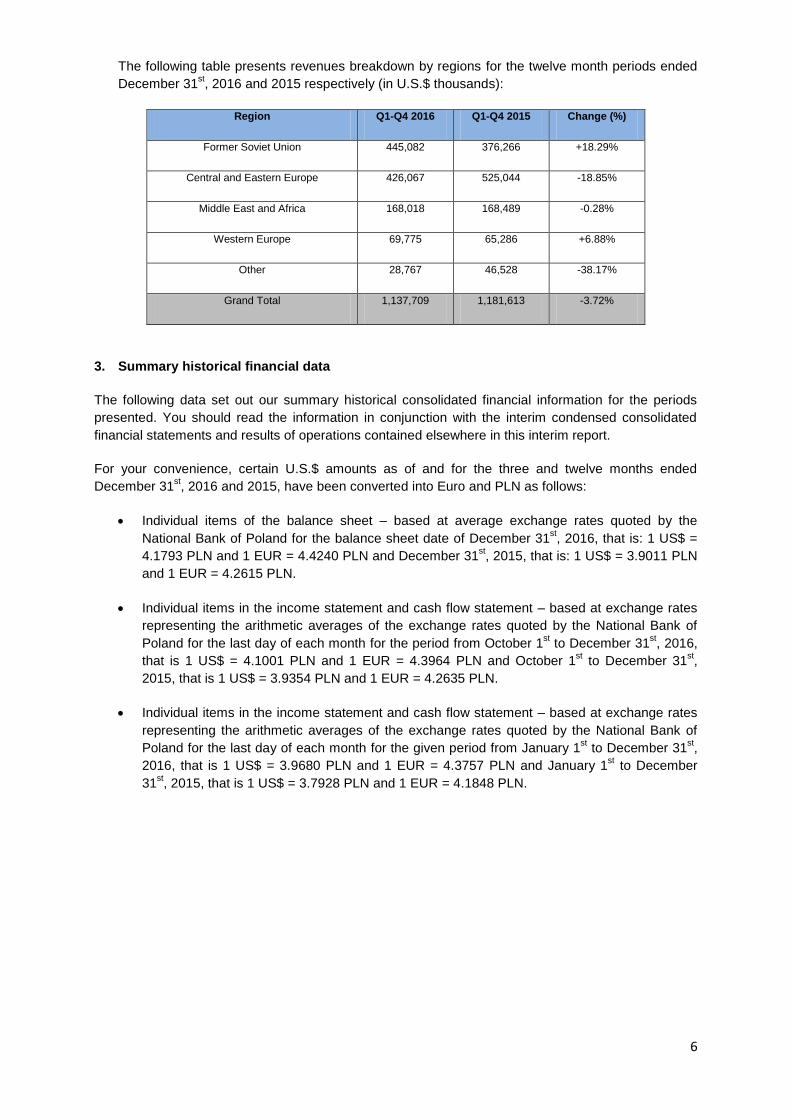
The following table presents revenues breakdown by regions for the twelve month periods ended
December 31st, 2016 and 2015 respectively (in U.S.$ thousands):
Region Q1-Q4 2016 Q1-Q4 2015 Change (%)
Former Soviet Union 445,082 376,266 +18.29%
Central and Eastern Europe 426,067 525,044 -18.85%
Middle East and Africa 168,018 168,489 -0.28%
Western Europe 69,775 65,286 +6.88%
Other 28,767 46,528 -38.17%
Grand Total 1,137,709 1,181,613 -3.72%
3. Summary historical financial data
The following data set out our summary historical consolidated financial information for the periods
presented. You should read the information in conjunction with the interim condensed consolidated
financial statements and results of operations contained elsewhere in this interim report.
For your convenience, certain U.S.$ amounts as of and for the three and twelve months ended
December 31st, 2016 and 2015, have been converted into Euro and PLN as follows:
Individual items of the balance sheet – based at average exchange rates quoted by the
National Bank of Poland for the balance sheet date of December 31st, 2016, that is: 1 US$ =
4.1793 PLN and 1 EUR = 4.4240 PLN and December 31st, 2015, that is: 1 US$ = 3.9011 PLN
and 1 EUR = 4.2615 PLN.
Individual items in the income statement and cash flow statement – based at exchange rates
representing the arithmetic averages of the exchange rates quoted by the National Bank of
Poland for the last day of each month for the period from October 1st to December 31
st, 2016,
that is 1 US$ = 4.1001 PLN and 1 EUR = 4.3964 PLN and October 1st to December 31
st,
2015, that is 1 US$ = 3.9354 PLN and 1 EUR = 4.2635 PLN.
Individual items in the income statement and cash flow statement – based at exchange rates
representing the arithmetic averages of the exchange rates quoted by the National Bank of
Poland for the last day of each month for the given period from January 1st to December 31
st,
2016, that is 1 US$ = 3.9680 PLN and 1 EUR = 4.3757 PLN and January 1st to December
31st, 2015, that is 1 US$ = 3.7928 PLN and 1 EUR = 4.1848 PLN.

7
Period from Period from
1 October to 31 December 2016 1 October to 31 December 2015
USD PLN EUR USD PLN EUR
Revenue 364,242 1,493,428 339,693 366,846 1,443,687 338,616
Cost of sales (343,071) (1,406,627) (319,950) (348,706) (1,372,298) (321,871)
Gross profit 21,171 86,802 19,744 18,140 71,390 16,744
Selling expenses (9,104) (37,327) (8,490) (7,483) (29,447) (6,907)
Administrative expenses (4,173) (17,108) (3,891) (4,317) (16,989) (3,985)
Profit from operations 7,894 32,367 7,362 6,341 24,954 5,853
Financial expenses (4,455) (18,267) (4,155) (4,541) (17,872) (4,192)
Financial income 190 779 177 313 1,232 289
Other gains and losses (145) (595) (135) 102 400 94
Profit before taxation 3,484 14,283 3,249 2,214 8,713 2,044
Taxation (849) (3,481) (792) (175) (690) (162)
Profit after taxation 2,635 10,802 2,457 2,039 8,023 1,882
Attributable to: Non-controlling interests 6 23 5 4 16 4
Owners of the Company 2,629 10,799 2,452 2,035 8,007 1,878
USD (cents)
PLN (grosz)
EUR (cents)
USD (cents)
PLN (grosz)
EUR (cents)
Basic and diluted earnings per share from continuing operations 4.74 19.42 4.42 3.67 14.44 3.39
Period from Period from
1 October to
31 December 2016 1 October to
31 December 2015
USD PLN EUR USD PLN EUR
Net cash inflows from operating activities 38,366 157,304 35,780 26,971 106,140 24,895
Net cash outflows from investing activities (893) (3,660) (832) (1,675) (6,593) (1,546)
Net cash outflows from financing activities (564) (2,313) (526) (3,074) (12,095) (2,837)
Net increase in cash and cash equivalents 36,909 151,331 34,422 22,222 87,452 20,512
Cash at the beginning of the period (30,372) (124,529) (28,325) (17,932) (70,569) (16,552)
Cash at the end of the period 6,537 26,802 6,096 4,290 16,882 3,960
As at 31 December 2016 As at 31 December 2015
USD PLN EUR USD PLN EUR
Current assets 387,011 1,617,435 365,605 352,259 1,374,199 322,468
Non-current assets 28,374 118,585 26,805 29,316 114,363 26,836
Total assets 415,385 1,736,020 392,410 381,575 1,488,562 349,305
Liabilities 329,490 1,377,039 311,266 300,095 1,170,701 274,716
Equity 85,895 358,980 81,144 81,480 317,860 74,589
8
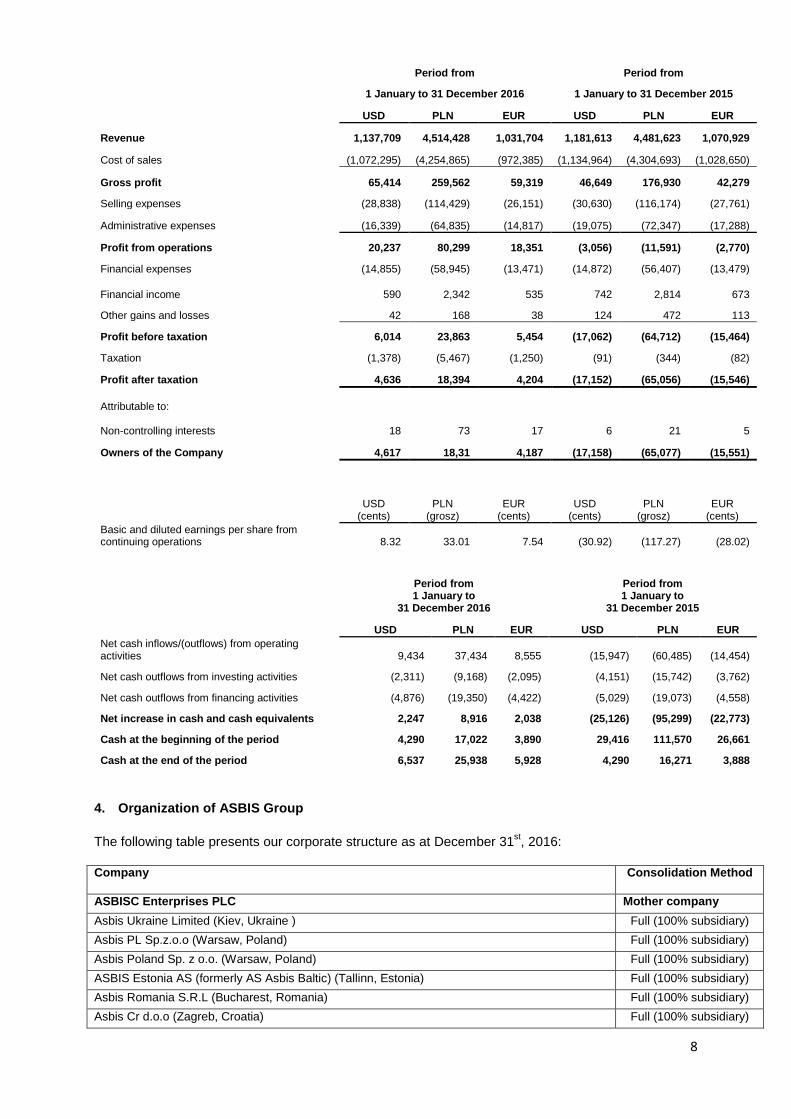
Period from Period from
1 January to 31 December 2016 1 January to 31 December 2015
USD PLN EUR USD PLN EUR
Revenue 1,137,709 4,514,428 1,031,704 1,181,613 4,481,623 1,070,929
Cost of sales (1,072,295) (4,254,865) (972,385) (1,134,964) (4,304,693) (1,028,650)
Gross profit 65,414 259,562 59,319 46,649 176,930 42,279
Selling expenses (28,838) (114,429) (26,151) (30,630) (116,174) (27,761)
Administrative expenses (16,339) (64,835) (14,817) (19,075) (72,347) (17,288)
Profit from operations 20,237 80,299 18,351 (3,056) (11,591) (2,770)
Financial expenses (14,855) (58,945) (13,471) (14,872) (56,407) (13,479)
Financial income 590 2,342 535 742 2,814 673
Other gains and losses 42 168 38 124 472 113
Profit before taxation 6,014 23,863 5,454 (17,062) (64,712) (15,464)
Taxation (1,378) (5,467) (1,250) (91) (344) (82)
Profit after taxation 4,636 18,394 4,204 (17,152) (65,056) (15,546)
Attributable to: Non-controlling interests 18 73 17 6 21 5
Owners of the Company 4,617 18,31 4,187 (17,158) (65,077) (15,551)
USD (cents)
PLN (grosz)
EUR (cents)
USD (cents)
PLN (grosz)
EUR (cents)
Basic and diluted earnings per share from continuing operations 8.32 33.01 7.54 (30.92) (117.27) (28.02)
Period from Period from
1 January to
31 December 2016 1 January to
31 December 2015
USD PLN EUR USD PLN EUR
Net cash inflows/(outflows) from operating activities 9,434 37,434 8,555 (15,947) (60,485) (14,454)
Net cash outflows from investing activities (2,311) (9,168) (2,095) (4,151) (15,742) (3,762)
Net cash outflows from financing activities (4,876) (19,350) (4,422) (5,029) (19,073) (4,558)
Net increase in cash and cash equivalents 2,247 8,916 2,038 (25,126) (95,299) (22,773)
Cash at the beginning of the period 4,290 17,022 3,890 29,416 111,570 26,661
Cash at the end of the period 6,537 25,938 5,928 4,290 16,271 3,888
4. Organization of ASBIS Group
The following table presents our corporate structure as at December 31st, 2016:
Company Consolidation Method
ASBISC Enterprises PLC Mother company
Asbis Ukraine Limited (Kiev, Ukraine ) Full (100% subsidiary)
Asbis PL Sp.z.o.o (Warsaw, Poland) Full (100% subsidiary)
Asbis Poland Sp. z o.o. (Warsaw, Poland) Full (100% subsidiary)
ASBIS Estonia AS (formerly AS Asbis Baltic) (Tallinn, Estonia) Full (100% subsidiary)
Asbis Romania S.R.L (Bucharest, Romania) Full (100% subsidiary)
Asbis Cr d.o.o (Zagreb, Croatia) Full (100% subsidiary)

9
Asbis d.o.o Beograd (Belgrade, Serbia) Full (100% subsidiary)
Asbis Hungary Commercial Limited (Budapest, Hungary) Full (100% subsidiary)
Asbis Bulgaria Limited (Sofia, Bulgaria) Full (100% subsidiary)
Asbis CZ,spoI.s.r.o (Prague, Czech Republic) Full (100% subsidiary)
UAB Asbis Vilnius (Vilnius, Lithuania) Full (100% subsidiary)
Asbis Slovenia d.o.o (Trzin, Slovenia) Full (100% subsidiary)
Asbis Middle East FZE (Dubai, U.A.E) Full (100% subsidiary)
Asbis SK sp.l sr.o (Bratislava, Slovakia) Full (100% subsidiary)
Asbis Limited (Charlestown, Ireland) Full (100% subsidiary)
FPUE Automatic Systems of Business Control (Minsk, Belarus) Full (100% subsidiary)
E.M. Euro-Mall Ltd (former ISA Hardware Limited–Group) (Limassol, Cyprus) Full (100% subsidiary)
OOO ‘ Asbis’-Moscow (Moscow, Russia) Full (100% subsidiary)
Asbis Morocco Limited (Casablanca, Morocco) Full (100% subsidiary)
EUROMALL CZ s.r.o. (formerly ISA Hardware s.r.o.) (Prague, Czech Republic) Full (100% subsidiary)
S.C. EUROMALL 2008 S.R.L (formerly ISA Hardware International S.R.L) (Bucharest, Romania) Full (100% subsidiary)
ISA Hardware s.r.o Slovakia (Bratislava, Slovakia) Full (100% subsidiary)
Euro-Mall SRB d.o.o. (former ISA Hardware d.o.o Beograd) (Belgrade, Serbia) Full (100% subsidiary)
Prestigio Plaza Sp. z o.o in liquidation (Warsaw, Poland) Full (100% subsidiary)
Prestigio Plaza Ltd (formerly Prestigio Technologies) (Limassol, Cyprus) Full (100% subsidiary)
Prestigio Europe s.r.o (Prague, Czech Republic) Full (100% subsidiary)
Prestigio Plaza NL.B.V. (Amsterdam, Netherlands) Full (100% subsidiary)
Asbis Kypros Ltd (Limassol, Cyprus) Full (100% subsidiary)
Asbis TR Bilgisayar Limited Sirketi (Istanbul, Turkey) Full (100% subsidiary)
SIA “ASBIS LV” (Riga, Latvia)
Full (100% subsidiary)
Asbis d.o.o. (former Megatrend d.o.o.) (Sarajevo, Bosnia Herzegovina) Full (90% ownership)
ASBIS Close Joint-Stock Company (former CZAO ASBIS) (Minsk, Belarus) Full (100% subsidiary)
ASBIS Kazakhstan LLP (Almaty, Kazakhstan) Full (100% subsidiary)
Euro-Mall SRO (Bratislava, Slovakia) Full (100% subsidiary)
Prestigio China Corp. (former AOSBIS TECHNOLOGY (SHENZHEN) CORP.) (Shenzhen,China) Full (100% subsidiary)
ASBIS DE GMBH, (Munchen, Germany) Full (100% subsidiary)
EUROMALL BULGARIA EOOD (Sofia, Bulgaria) Full (100% subsidiary)
Advanced Systems Company LLC (Riyadh, Kingdom of Saudi Arabia) Full (100% subsidiary)
SHARK ONLINE a.s. (Bratislava, Slovakia) Full (100% subsidiary)
SHARK Computers a.s. (Bratislava, Slovakia) Full (100% subsidiary)
E-vision Production Unitary Enterprise (Minsk, Belarus) Full (100% subsidiary)
ASBIS UK LTD (Hounslow, England) Full (100% subsidiary)
5. Changes in the structure of the Company
During the three months ended December 31st, 2016 there were the following changes in the structure
of the Company and the Group:
- the Company’s inactive subsidiary - EUROMALL d.o.o. (formerly ISA Hardware d.o.o.)
(Zagreb, Croatia) has been finally deregistered from the proper registry.
- The Company’s inactive subsidiary - PTUE IT-MAX (Minsk, Belarus) has been finally
deregistered from the proper registry.
The above mentioned changes were a result of the Company’s restructuring actions that started in
2015 in order to decrease administrative expenses. These subsidiaries have been inactive and the
Issuer’s operations in both Croatia and Belarus are conducted through other entities. Therefore,
closure of these subsidiaries will not have any impact on the Issuer’s operations.

10
6. Discussion of the difference of the Company's results and published forecasts
We have not published any forecasts for the three-month period ended December 31st, 2016.
However, on March 21st, 2016 we have announced our financial forecasts for the year 2016. Having
seen Q4 2016 results, we see that our revenues were slightly below the forecasted figure, while net
profitability was in the upper half of the forecasted range. This is because we focused mostly on
margins, and refused some low margin deals in Q4 2016 in order to build a stronger base for further
improvement of net profitability in 2017. Our net profitability in Q1-Q4 2016 was higher than originally
budgeted as a ratio to achieved revenues.
7. Information on dividend payment
In the period of the three months ended 31 December 2016 no dividend has been paid.
8. Shareholders possessing more than 5% of the Company's shares as of the date of
publication of the interim report
The following table presents shareholders possessing more than 5% of the Company’s shares as of
the date of publication of this report, according to our best knowledge. The information included in the
table is based on the information received from the shareholders pursuant to Art. 69, sec. 1, point 2 of
the Act on Public Offering, conditions governing the introduction of financial instruments to organized
trading and public companies.
Name Number of
shares
% of share
capital
Number of
votes
% of
votes KS Holdings Ltd 20,401,361 36.76% 20,401,361 36.76%
Quercus Towarzystwo Funduszy Inwestycyjnych S.A. Quercus
Parasolowy SFIO and Quercus Absolutnego Zwrotu FIZ)*
3,274,931 5.90% 3,274,931 5.90%
Noble Funds TFI S.A. managing Noble Funds Fundusz
Inwestycyjny Otwarty, Noble Funds Specjalistyczny Fundusz
Inwestyjny Otwarty and Noble Fund Opportunity Fundusz
Inwestycyjny Zamknięty
2,934,690 5.29% 2,934,690 5.29%
Noble Funds Fundusz Inwestycyjny Otwarty** 2,866,781 5.17% 2,866,781 5.17%
NN OFE 2,872,954 5.18% 2,872,954 5.18%
* Including 2,775,045 shares corresponding to 5.00% votes at the AGM held by Quercus Parasolowy SFIO - according to notification from December 9th, 2011 amended by the notification from July 14
th, 2015.
** Following notification from October 6th, 2016
In the three-month period ended on December 31st, 2016 the Company has received the following
information about changes in its shareholders structure:
(1) on October 6th, 2016 the Company has received from Noble Funds Towarzystwo Funduszy
Inwestycyjnych S.A. notification that following to purchase of the Company’s shares on
October 5th, 2016 share of Noble Funds Fundusz Inwestycyjny Otwarty managed by Noble
Funds Towarzystwo Funduszy Inwestycyjnych S.A. exceeded the threshold of 5% of total
number of votes at the Company’s General Meeting of Shareholders.
According to the notification, before the abovementioned purchase of shares the Fund had
2 769 525 Company’s shares that were equal to 4,99% in the Company’s share capital and
had 2 769 525 votes from these shares, that were equal to 4,99% of total number of votes.
According to the notification, after the abovementioned purchase of shares the Fund holds
2 866 781 Company’s shares, equal to 5,17% in the Company’s share capital and have 2 866
781 votes from these shares, equal to 5,17% of total number of votes.
9. Changes in the number of shares owned by the members of the Board of Directors
During the three-month period ended on 31 December 2016 as well as in the period between
November 8th, 2016 (the date of the publication of the Q3 results) and February 28
th, 2017 (date of this

11
report) there were no changes in the number of shares possessed by the members of the Board of
Directors.
The table below presents the number of shares held by the members of the Board of Directors as of
the date of this report. The information included in the table below is based on information received
from the members of our Management Board pursuant to Art. 160 sec. 1 of the Act on Public Trading.
Name Number of Shares % of the share capital
Siarhei Kostevitch (directly and indirectly) 20,443,127 36.83%
Constantinos Tziamalis 555,000 1.00%
Marios Christou 463,061 0.83%
Yuri Ulasovich 210,000 0.38%
Demos Demou
Chris Pavlou
0
0
0%
0%
__________
Siarhei Kostevitch holds shares as the ultimate beneficial owner of KS Holdings Ltd.
10. Changes in the members of managing bodies
During the three-month period ended December 31st, 2016 there were no changes in the members of
the Company’s Board of Directors.
11. Significant administrative and court proceedings against the Company
As of December 31st, 2016, no court, arbitration or administrative proceedings whose single or
aggregate value exceeds 10% of our equity were pending against us or any of the members of our
Group.
12. Related party transactions
During the three months ended December 31st, 2016 we have not had any material related party
transaction exceeding the Polish Zloty equivalent of Euro 500 thousand other than typical or routine
transactions.
13. Information on guarantees granted to third parties
The Company has granted corporate guarantees to support its subsidiaries’ local financing from U.S.$
136,683 at December 31st, 2015 and U.S.$ 176,278 at September 30
th, 2016 to U.S.$ 147,628 at
December 31st, 2016, representing more than 10% of the Company’s equity. The total bank
guarantees and letters of credit raised by the Group (mainly to Group suppliers) as at December 31st,
2016 was U.S. $ 13,447 – as per note number 16 to the financial statements – which is more than
10% of the Company’s equity.
14. Information on changes in conditional commitments or conditional assets, occurred since
the end of last fiscal year
No changes in conditional commitments or conditional assets have occurred since the end of the last
fiscal year.
15. Other information important for the assessment of our personnel, economic and financial
position, as well as our financial results
In the three and twelve month periods ended December 31st, 2016, the Company’s results of
operations have been affected and are expected to continue to be affected by a number of factors.
These factors were: the in-country crisis seriously affecting major markets, currency fluctuations,

12
competition and price pressures, low gross profit margins, potential inventory obsolescence and price
erosions, the worldwide unstable financial environment, seasonality, development of own brand
business, warranty claims and high cost of debt and increase in business with Apple.
Despite the fact that Q4 2016 revenues were still slightly lower than a year ago, they grew signifiantly
as compared to previous quarters of 2016. While this was done with significantly improved gross profit
margins, all other lines of our income statement have been improved as well. Below we present all
factors that have affected and continue to affect our business:
The in-country crisis affecting our major markets and our gross profit and gross profit margin
Throughout the years of operation, the Company has suffered from specific in-country crises. The
example of Ukraine in 2014 and Russia in 2015 is proving that the risk of in country crises is quite high
and must be weathered at all times. Moreover, since these crises are driven by external unforeseen
factors, it is of high importance that such crises are weathered fast enough.
Despite the fact that the crisis in Ukraine and Russia is not over yet, we have adapted to market needs
and have won some market share from weaker competitors, and achieved a significant sales growth in
Ukraine. In Russia, we have decided to offload risks and mostly focus on profits, thus our revenues in
this market were still lower than a year ago for the most part of the year. The CEE revenue decrease
is a result of changes in our strategy in countries like Poland where:
a) we have decided to drop trading activities that were high in volume but low in gross profit
margin
b) as we have previously reported (through a current report in 2015), issues we have faced in
Poland following the unjustified we believe allegations from the authorities, forced us to lower
our business activity in the country
In Romania the latest demonstrations might cause a political instability in the country and affect our
business going forward. It is therefore extremely important for us to timely tackle any crisis that might
arise out of such cases.
Currency fluctuations
The Company’s reporting currency is the U.S. dollar. About 40% of the Company’s revenues are
denominated in U.S. dollars, while the balance is denominated in Euro, Ruble and other currencies,
some of which are pegged to the Euro. Since most of the Company’s trade payable balances are
denominated in U.S. dollars (about 80%), the Company is exposed to foreign exchange risk that
remains a crucial risk factor that might affect the Group’s results in the future. Although the problem
still persists and will persist as the Euro and other Eastern European currencies fluctuate in a steep
manner against the U.S. Dollar, the Group has adopted hedging strategies to tackle this problem and
this has been successful despite large volatility of some currencies. It is also believed by the
management that hedging is a very important function in our industry and we shall continue enhancing
this procedure.
Competition and price pressure
The IT distribution industry is a highly competitive market, particularly with regards to products
selection and quality, inventory, price, customer services and credit availability and hence is open to
margin pressure from competitors and new entrants. The Company competes at the international level
with a wide variety of distributors of varying sizes, covering different product categories and
geographic markets. In particular, in each of the markets in which the Company operates it faces
competition from:
a) international distributors such as Avnet Inc., Tech Data Corp., Ingram Micro Inc. and Arrow
Electronics Inc., which are much larger than the Company, but do not always cover the same
geographic regions with local presence as the Company does,
b) regional or local distributors, such as Elko, mainly in the Baltic States, Russia, Ukraine,
Merlion in the Former Soviet Union, AB, ABC Data in Poland and ATC and ED System-BGS
Levi in the Czech Republic and Slovakia.

13
Competition and price pressures from market competitors and new market entrants may lead to
significant reductions in the Company’s sales prices. Such pressures may also lead to a loss of market
share in certain of the Group's markets. Price pressures can have a material adverse effect on the
Company’s profit margins and its overall profitability, especially in view of the fact that its gross profit
margins, like those of most of its competitors, are low and sensitive to sales price fluctuations.
This was also visible in the tablet and smartphone segments where we have experienced the entrance
of a number of strong competitors. This had a negative result on our profitability since we had to lower
prices to get rid of our stocks.
In the same time, we see opportunities arising from specifics of particular markets, like in case of
Ukraine, where we have managed to win market share from weaker competitors.
In countries like Poland we decided to undertake a much more cnservative stand until we see how the
situation evolves, following the changes in the competitive landscape.
Low gross profit margins
The Company’s business is both traditional distribution of third party products and own brand sales.
This allows the Company to deliver healthier gross profit margins when conditions are favourable.
However, the own brand business, has been significantly affected by the new entrants and the
margins were lowered.
In the traditional distribution business, the Company’s gross profit margins, like those of other
distributors of IT products, are low and the Company expects that in the distribution arm of its business
they will remain low in the foreseeable future. Increased competition arising from industry
consolidation and low demand for certain IT products may hinder the Company’s ability to maintain or
improve its gross margins. A portion of the Company’s operating expenses is relatively fixed, and
planned expenditures are based in part on anticipated orders that are forecasted with limited visibility
of future demand. As a result, the Company may not be able to reduce its operating expenses as
a percentage of revenue in order to mitigate any reductions in gross margins in the future.
In an effort to increase gross margins, the Company has developed the own brand business, that
allows to generate higher gross profit margins. Since this business already accounts for a significant
part of total sales, it positively affects the overall gross profit margins and profitability of the Company.
However, this business is also connected with risks, including the risk of technology change, the risk of
changes in demand and customer preferences. Therefore, it is extremely important for the Company
to foresee market demand changes and offer new products right in time to satisfy consumer needs
and be able to sell the previous technology as well.
Inventory obsolescence and price erosion
The Company is often required to buy components and finished products according to forecasted
requirements and orders of its customers and in anticipation of market demand. The market for IT
finished products and components is characterized by rapid changes in technology and short product
shelf life, and, consequently, inventory may rapidly become obsolete. Due to the fast pace of
technological changes, the industry may sometimes face a shortage or, at other times, an oversupply
of IT products. As the Company increases the scope of its business and, in particular, of inventory
management for its customers, there is an increasing need to hold inventory to serve as a buffer in
anticipation of the actual needs of the Company’s customers. This increases the risk of inventory
becoming devalued or obsolete and could affect the Company’s profits either because prices for
obsolete products tend to decline quickly, or as a result of the need to make provisions for write-offs.
In an oversupply situation, other distributors may elect to proceed with price reductions in order to
dispose of their existing inventories, forcing the Company to lower its prices to stay competitive. The
Company’s ability to manage its inventory and protect its business against price erosion is critical to its
success.
A number of the Company’s most significant contracts with its major suppliers contain advantageous
contract terms that protect the Company against exposure to price fluctuations, defective products and
stock obsolescence.

14
For the own brand business division, the Company needs to balance between satisfying consumer
demand and risk of inventory obsolence or price erosion, by having a proper level of inventory. This
risk was faced in H1 2015, when we had to sell excess stock of own brands at lower prices in order
not to be left with obsolete inventories. However, this was managed and both in H2 2015 and 2016 we
have not had any problems related to this issue.
Credit risk
The Company buys components and finished products from its suppliers on its own account and
resells them to its customers. The Company extends credit to some of its customers at terms ranging
from 21 to 90 days or, in a few cases, to 120 days. The Company’s payment obligations towards its
suppliers under such agreements are separate and distinct from its customers' obligations to pay for
their purchases, except in limited cases where the Company’s arrangements with its suppliers require
the Company to resell to certain resellers or distributors. Thus, the Company is liable to pay its
suppliers regardless of whether its customers pay for their respective purchases. As the Company’s
profit margin is relatively low compared to the total price of the products sold, in the event where the
Company is not able to recover payments from its customers, it is exposed to a financial liquidity risk.
The Company has in place credit insurance which covers such an eventuality for approximately 60%
of its revenue.
Due to the recent market developments following the changes in credit rating of certain countries and
regions where the Group operates in, credit risk has become one of the most important risk factors
that might affect the Group’s results in the future. Credit insurance companies are being more strict
and risk averse to certain regions they have suffered from significant default cases. A major change
happened in the GCC area where the credit insurers smashed the credit limit granted due to an
extensive number of run-away cases. The Group despite the fact that it has not been directly affected
by these events, has decided to enhance its risk management proceedures. These do not guarantee
that all issues will be avoided, however it grants the Company confidence that is in a position to
weather any possible major credit issue that may arise.
Worldwide financial environment
The world’s financial crisis has eased throughout the last years. This included recovery signals from
some of our markets and stabilization in some of others. Following partial recovery, the Company has
undertaken certain efforts to benefit from these signals both in revenues and profitablity. The revised
strategy and adaptation to the new environment, i.e., by rebuilding our product portfolio, has paid off in
terms of increased market share and sales.
However, there are many uncertainties about the world economy following the developments in China
and turmoil in the ME region coupled with volatility of currencies and fragility of demand in many
markets. Additionally, from time to time, unpredictable situations may happen in selected markets, as
was the case of Ukraine and Russia in 2014, continuing to-date, which has led to a significant
instability in these countries’ financial environment. However, with the experience we gained, the
management strongly believes today the Company is much more flexible and much better prepared to
weather any obstacles that may arise due to worldwide financial environment.
Seasonality
Traditionally the IT distribution industry in which the Company operates experiences high demand
during the months prior to and leading up to the Christmas and New Year holiday period. In particular,
IT distributors’ demand tends to increase in the period starting from September till the end of the year.
Development of own brand business
The Company’s strategy is to focus more on profitability than on revenues, thus the Company has
increased its engagement into the development of own brands business (especially in the last few
years) that allows for higher gross profit margins. This included the development of tablets,
smartphones, GPS and other product lines that are sold under Prestigio and Canyon brands in all
regions of the Company’s operations.

15
Following the dramatic quality issues faced by the Group, a full reshuffling of private labels took place,
ensuring that quality is no longer an issue for the Company. This however came with a significant
decrease of revenues since we had to sacrifice a very big majority of our revenues to be able to
recover the brand that was suffering. The Company is undertaking a number of quality control
measures to mitigate this risk, but given the volumes and the large amount of factories used to
produce these products, these controls might not be enough. Moreover, competition has already been
intensified and the Company may not be able to sustain its profitability levels.
Despite the Company’s efforts, there can be no assurance of a similar development pace in own brand
business in future periods. This is because there may be a significant change in market trends,
customer preferences or technology changes that may affect the development of own brand business
and therefore its results.
Warranty claims from own brand products
The own brand business requires us to put extra efforts to avoid any problems with quality of devices.
Despite all our efforts, we have noticed significant returns on specific models produced the last three
years.
This risk has negatively affected H1 2015 and Y2015 results as we had to provide for losses due to
the decline of certain ODMs to satisfy their contractual obligations on products with epidemic failure.
Unfortunatelly, these factories refused to do so and we were forced to re-assess our provisions for
returns and recognize a significant loss. The Group is undertaking all possible steps towards ensuring
proper compensation. This includes both negotiations and legal actions.
In order to avoid such problems in the future, a much more scrutinized selection of suppliers is
currently in place, which however, does not guarantee elimination of the risk of warranty losses.
High cost of debt
Distribution business entails a higher need for cash available to support growth. The Group has
managed to raise cash from various financial institutions, however in certain cases the cost of this
financing is expensive. The Company has already negotiated better terms with some of its supply-
chain financiers and is currently undertaking certain extra steps to further lower cost of financing.
However, the sanctions imposed to Russia and tensions related to the Ukrainian crisis have resulted in
significantly increased cost of financing facilities in these countries and this may limit our efforts to
further decrease our average cost of debt.
Results of Operations
Three-month period ended 31 December 2016 compared to the three-month period ended 31
December 2015
Revenues: In Q4 2016 our revenues decreased by 0.71% to U.S. $ 364,242 from U.S. $
366,846 in Q4 2015. However, revenues in Q4 2016 were 31.95% higher as compared to Q3
2016 continuing the upward trend.
Revenues in Q1-Q4 2016 decreased by 3.72% to U.S. $ 1,137,709 from U.S. $ 1,181,613 in
Q1-Q4 2015.

16
Gross profit: In Q4 2016 and in Q1-Q4 2016 gross profit has increased significantly when
compared to the corresponding periods of 2015.
Gross profit in Q4 2016 has increased by 16.70% to U.S. $ 21,171 from U.S. $ 18,140 in Q4 2015.
More importantly, it also grew by 25.48% as compared to Q3 2016. This is very significant, since
our gross profitability throughout 2016 has grown quite fast while revenues have been flat.
Gross profit in Q1-Q4 2016 increased by 40.23% to U.S. $ 65,414 from U.S. $ 46,649 in Q1-Q4
2015.
Gross profit margin: In Q4 2016 gross profit margin was significantly higher than in Q4 2015.
Gross profit margin in Q4 2016 has increased by 17.54% to 5.81% from 4.94% in Q4 2015. This
continued our increased gross profitability in 2016.
Gross profit margin in Q1-Q4 2016 increased to 5.75% from 3.95% in Q1-Q4 2015. This was a
result of our strategy to focus more on margins and net profitability than pumping up low margin
sales.
Selling expenses largely comprise of salaries and benefits paid to sales employees (sales,
marketing and logistics departments), marketing and advertising fees, commissions, and traveling
expenses. Selling expenses usually grow together (but not in-line) with growing sales and, most
importantly, gross profit.
Selling expenses in Q4 2016 have increased by 21.67% to U.S. $ 9,104 from U.S. $ 7,483 in Q4
2015. This is obviously related to significant improvement in gross profitability.
Selling expenses in Q1-Q4 2016 decreased by 5.85% to U.S. $ 28,838 from U.S. $ 30,630 in Q1-
Q4 2015. This has been achieved despite a significant growth in gross profit.
17
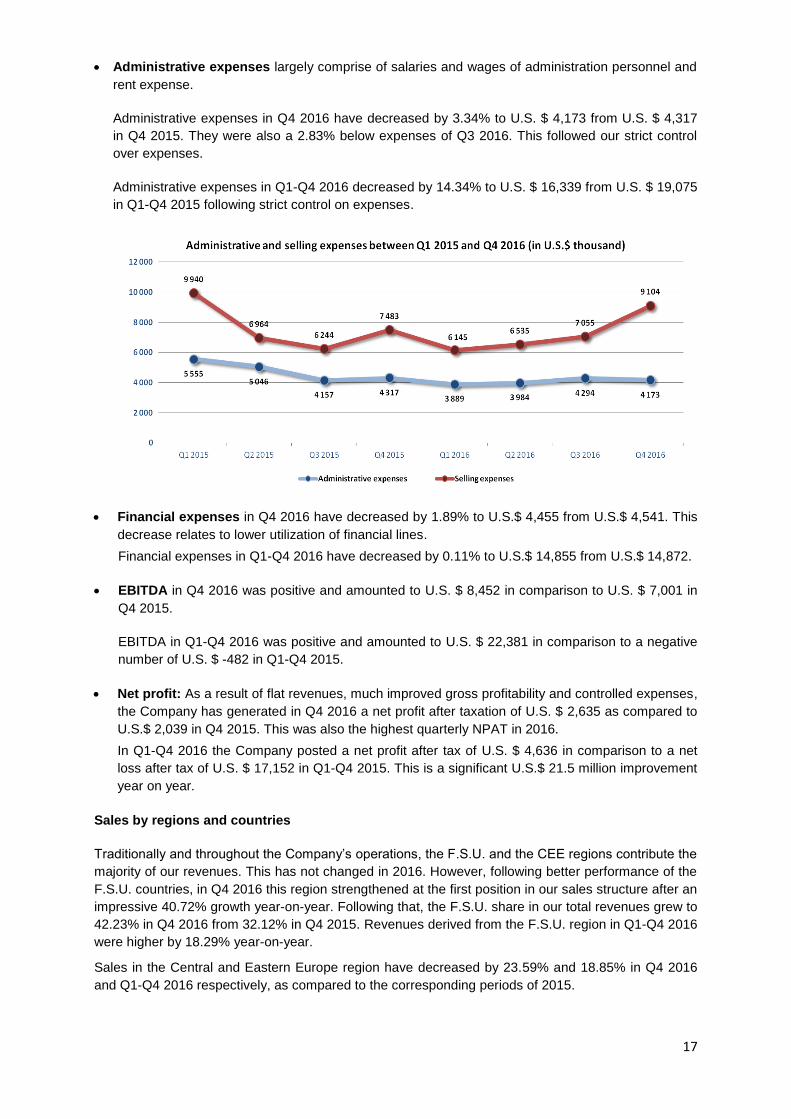
Administrative expenses largely comprise of salaries and wages of administration personnel and
rent expense.
Administrative expenses in Q4 2016 have decreased by 3.34% to U.S. $ 4,173 from U.S. $ 4,317
in Q4 2015. They were also a 2.83% below expenses of Q3 2016. This followed our strict control
over expenses.
Administrative expenses in Q1-Q4 2016 decreased by 14.34% to U.S. $ 16,339 from U.S. $ 19,075
in Q1-Q4 2015 following strict control on expenses.
Financial expenses in Q4 2016 have decreased by 1.89% to U.S.$ 4,455 from U.S.$ 4,541. This
decrease relates to lower utilization of financial lines.
Financial expenses in Q1-Q4 2016 have decreased by 0.11% to U.S.$ 14,855 from U.S.$ 14,872.
EBITDA in Q4 2016 was positive and amounted to U.S. $ 8,452 in comparison to U.S. $ 7,001 in
Q4 2015.
EBITDA in Q1-Q4 2016 was positive and amounted to U.S. $ 22,381 in comparison to a negative
number of U.S. $ -482 in Q1-Q4 2015.
Net profit: As a result of flat revenues, much improved gross profitability and controlled expenses,
the Company has generated in Q4 2016 a net profit after taxation of U.S. $ 2,635 as compared to
U.S.$ 2,039 in Q4 2015. This was also the highest quarterly NPAT in 2016.
In Q1-Q4 2016 the Company posted a net profit after tax of U.S. $ 4,636 in comparison to a net
loss after tax of U.S. $ 17,152 in Q1-Q4 2015. This is a significant U.S.$ 21.5 million improvement
year on year.
Sales by regions and countries
Traditionally and throughout the Company’s operations, the F.S.U. and the CEE regions contribute the
majority of our revenues. This has not changed in 2016. However, following better performance of the
F.S.U. countries, in Q4 2016 this region strengthened at the first position in our sales structure after an
impressive 40.72% growth year-on-year. Following that, the F.S.U. share in our total revenues grew to
42.23% in Q4 2016 from 32.12% in Q4 2015. Revenues derived from the F.S.U. region in Q1-Q4 2016
were higher by 18.29% year-on-year.
Sales in the Central and Eastern Europe region have decreased by 23.59% and 18.85% in Q4 2016
and Q1-Q4 2016 respectively, as compared to the corresponding periods of 2015.

18
Sales in Western Europe in Q4 2016 decreased by 20.70% compared to Q4 2015, while in Q1-Q4
2016 it grew by 6.88%. Sales in MEA region have decreased by 6.52% and 0.28% over the same
periods.
Country-by-country analysis explains why results in the F.S.U. region improved so significantly. It
followed a continuous improvement in Ukraine that grew by 108.31% in Q4 and by 144.13% in Q1-Q4
2016 as compared to the corresponding periods of 2015. In the same time, our business in Russia
decreased by 7.06% and 4.97% in Q4 2016 and Q1-Q4 2016 respectively. The decrease in Russia
was compensated by strong growth in Kazakhstan and Belarus. Kazakhstan grew by 115.57% and
decreased by 12.57% in Q4 2016 and Q1-Q4 2016 respectively as compared to the corresponding
periods of 2015. In the same time Belarus grew by 17.62% in Q4 2016 and by 20.84% in Q1-Q4 2016.
In CEE region, our sales in Slovakia decreased by 38.60% in Q4 2016 (and as a result by 27.68% in
Q1-Q4 2016) while our business in the Czech Republic grew by 7.97% and 17.87% over the same
periods. The Slovakian decrease had solely to do with the huge fulfillment of projects during 2015,
where Slovakia enjoyed the large EU funding for IT infrastructure. The company in Slovakia remains a
leader in its segment and continues to dominate the IT distribution market. As a result, Russia was
again a leader in our sales by countries breakdown in Q4 2016 (similarly to Q3 2016).
The tables below provide a geographical breakdown of sales in the three and twelve month periods
ended 31 December 2016 and 2015.
Q4 2016 Q4 2015
U.S. $
thousand
% of total
revenues
U.S. $
thousand
% of total
revenues
Former Soviet Union 153,830 42.23% 117,847 32.12%
Central and Eastern Europe 129,377 35.52% 169,327 46.16%
Middle East and Africa 48,695 13.37% 45,673 12.45%
Western Europe 29,588 8.12% 25,961 7.08%
Other 2,752 0.76% 8,038 2.19%
Total 364,242 100% 366,846 100%
Q1-Q4 2016 Q1-Q4 2015
U.S. $
thousand
% of total
revenues
U.S. $
thousand
% of total
revenues
Former Soviet Union 445,082 39.12% 376,266 31.84%
Central and Eastern Europe 426,067 37.45% 525,044 44.43%
Middle East and Africa 168,018 14.77% 168,489 14.26%
Western Europe 69,775 6.13% 65,286 5.53%
Other 28,767 2.53% 46,528 3.94%
Total 1,137,709 100% 1,181,613 100%
Revenue breakdown – Top 10 countries in Q4 2016 and Q4 2015 (in U.S. Dollar thousand)
Q4 2016 Q4 2015
Country Sales Country Sales
1. Russia 57,552 Slovakia 91,169
2. Slovakia 55,982 Russia 61,927
3. Ukraine 44,864 United Arab Emirates 33,390

19
4. Kazakhstan 39,508 Ukraine 21,537
5. United Arab Emirates 28,514 Czech Republic 20,958
6. Czech 22,628 Kazakhstan 18,327
7. Belarus 16,149 Romania 17,207
8. Romania 15,125 Belarus 13,730
9. The Netherlands 8,544 United Kingdom 11,399
10. Algeria 7,790 Hungary 7,633
11. Other 67,585 Other 69,570
TOTAL 364,242 TOTAL 366,846
Revenue breakdown – Top 10 countries in Q1-Q4 2016 and Q1-Q4 2015 (in U.S. Dollar thousand)
Q1-Q4 2016 Q1-Q4 2015
Country Sales Country Sales
1. Slovakia 181,365 Slovakia 250,777
2. Russia 181,208 Russia 190,694
3. Ukraine 118,385 United Arab Emirates 129,018
4. United Arab Emirates 118,185 Kazakhstan 86,020
5. Kazakhstan 75,205 Czech Republic 56,603
6. Czech Republic 66,715 Romania 48,993
7. Belarus 52,574 Ukraine 48,493
8. Romania 46,317 Poland 47,688
9. The Netherlands 26,724 Belarus 43,507
10. Hungary 24,514 Bulgaria 26,834
11. Other 246,519 Other 252,986
TOTAL 1,137,709 TOTAL 1,181,613
Sales by product lines
Starting from February 2014 and following the cirisis that hit our major markets, our revenues have
been under pressure emanating from the turbulence in our markets which also affected a number of
countries across our operations.
We continue our efforts to increase revenues, in all markets we operate, mainly by adding more
products in our portfolio and penetrating the markets that have been weak during the last couple of
years. This is possible because ASBIS remains the distributor of first choice for many worldwide
suppliers. A major and good example is APPLE that has entrusted an iPhone distribution to ASBIS for
Ukraine, Belarus and Kazakhstan. Having said the above, the Group’s main focus is on margins and
increased profitability.
The chart below indicates the trends in sales per product line:

20
Revenues from CPUs, that traditionally lead in our revenue breakdown by product line, decreased by
17.34% in Q4 2016 and by 5.81% in Q1-Q4 2016. Revenues from HDDs decreased by 30.29% and
11.52% over the same periods. In the same time laptops sales decreased by 22.49% and 11.83%
respectively. On the other hand, our smartphones segment increased in Q4 2016 by 69.66% year-on-
year (mostly following an improvement in iPhone sales) and by 19.04% in Q1-Q4 2016 year-on-year. It
was again our no. 1 segment in our portfolio in Q4 2016. This was also partially due to the introduction
of I-Phone 7 by Apple which was highly demanded.
From other product lines, the most important is the increase in SSD business that built from zero to
U.S.$ 6,203 in Q2, U.S.$ 9,859 in Q3 2016 and U.S.$ 16,054 in Q4 2016 respectively. We expect this
segment to continue to grow rapidly. Apart from that, the Company has noticed a positive trend both
for Q4 2016 and Q1-Q4 2016 in mainboards and VGA cards (+122.77% and +92.40%), display
products (+4.66% and +20.83%), memory modules (+85.45% and +46.82%) and accessories and
multimedia (+12.00% and +10.63%).
The table below sets a breakdown of revenues, by product lines, for Q4 2016 and Q4 2015:
Q4 2016 Q4 2015
U.S. $
thousand
% of total
revenues
U.S. $
thousand
% of total
revenues
Smartphones 90,299 24.79% 53,225 14.51%
Central processing units
(CPUs) 55,684 15.29% 67,364 18.36%
Hard disk drives (HDDs) 32,580 8.94% 46,737 12.74%
PC-mobile (laptops) 26,544 7.29% 34,247 9.34%
Software 16,714 4.59% 36,476 9.94%
Tablets 12,985 3.57% 17,828 4.86%
Other 129,436 35.54% 110,970 30.25%
Total revenue 364,242 100% 366,846 100%
The table below sets a breakdown of revenues, by product lines, for Q1-Q4 2016 and Q1-Q4 2015:
Q1-Q4 2016 Q1-Q4 2015
U.S. $
thousand
% of total
revenues
U.S. $
thousand
% of total
revenues
Smartphones 236,728 20.81% 198,866 16.83%
21
Central processing units (CPUs) 205,262 18.04% 217,913 18.44%
Hard disk drives (HDDs) 123,866 10.89% 140,017 11.85%
Software 51,859 4.56% 114,246 9.67%
PC-mobile (laptops) 95,678 8.41% 108,520 9.18%
Tablets 46,052 4.05% 73,945 6.26%
Other 378,242 33.25% 328,107 27.77%
Total revenue 1,137,709 100% 1,181,613 100%
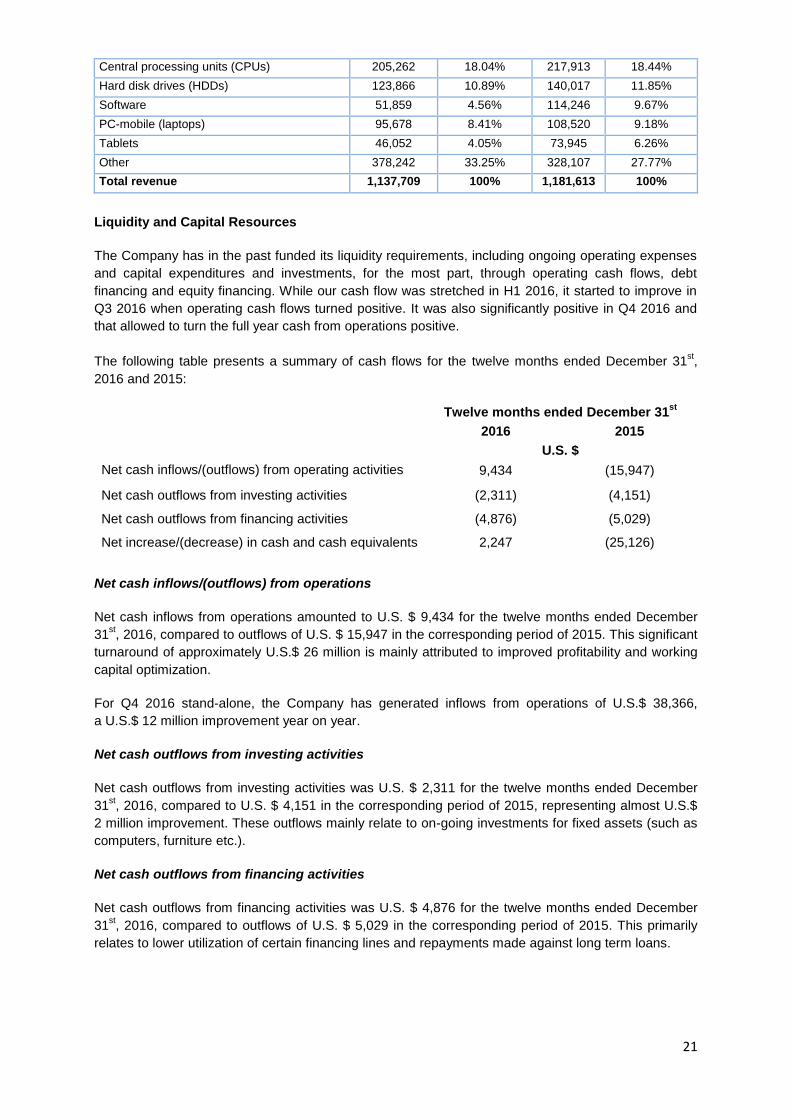
Liquidity and Capital Resources
The Company has in the past funded its liquidity requirements, including ongoing operating expenses
and capital expenditures and investments, for the most part, through operating cash flows, debt
financing and equity financing. While our cash flow was stretched in H1 2016, it started to improve in
Q3 2016 when operating cash flows turned positive. It was also significantly positive in Q4 2016 and
that allowed to turn the full year cash from operations positive.
The following table presents a summary of cash flows for the twelve months ended December 31st,
2016 and 2015:
Twelve months ended December 31st
2016 2015
U.S. $
Net cash inflows/(outflows) from operating activities
9,434 (15,947)
Net cash outflows from investing activities (2,311) (4,151)
Net cash outflows from financing activities (4,876) (5,029)
Net increase/(decrease) in cash and cash equivalents 2,247 (25,126)
Net cash inflows/(outflows) from operations
Net cash inflows from operations amounted to U.S. $ 9,434 for the twelve months ended December
31st, 2016, compared to outflows of U.S. $ 15,947 in the corresponding period of 2015. This significant
turnaround of approximately U.S.$ 26 million is mainly attributed to improved profitability and working
capital optimization.
For Q4 2016 stand-alone, the Company has generated inflows from operations of U.S.$ 38,366,
a U.S.$ 12 million improvement year on year.
Net cash outflows from investing activities
Net cash outflows from investing activities was U.S. $ 2,311 for the twelve months ended December
31st, 2016, compared to U.S. $ 4,151 in the corresponding period of 2015, representing almost U.S.$
2 million improvement. These outflows mainly relate to on-going investments for fixed assets (such as
computers, furniture etc.).
Net cash outflows from financing activities
Net cash outflows from financing activities was U.S. $ 4,876 for the twelve months ended December
31st, 2016, compared to outflows of U.S. $ 5,029 in the corresponding period of 2015. This primarily
relates to lower utilization of certain financing lines and repayments made against long term loans.
22
Net increase/(decrease) in cash and cash equivalents
As a result of increased working capital efficiency, improved profitability and decreased financing, in Q1-Q4 2016 cash and cash equivalents have increased by U.S. $ 2,247, compared to a decrease of U.S. $ 25,126 in the corresponding period of 2015 – a U.S.$ 27 million improvement.
16. Factors which may affect our results in the future
Political and economic stability in Europe and our regions
The markets the Group operates into, have traditionally shown a vulnerability in political and economic
environment. The turbulence that started in Ukraine and also affected Russia has caused a significant
demand reduction. This has affected revenues and gross profit margins, but also negatively impacted
some of our customers, whose financial situation has worsened.
The weak economies in the F.S.U. region and certain politically driven events in all markets, are
considered by the management as a crucial external factor, which might adversely affect our results, in
the short term.
Having said the above, we remain confident - given also a recent increase in demand in most of our
regions that we are in a position to properly manage this and any potential crisis and get stronger out
of it. This now has been proven again, as in 2016 we have delivered a net profit after tax and our
business in Ukraine (the most affected market) has significantly grown. We will continue this strategy
and focus more on our core regions and strengths, to maximize profits and take advantage of any the
market revival.
The Group’s ability to increase revenues and market share while focusing on profits
The diversified geographic coverage of the Group’s revenues ensures that we do mitigate the risk of
lower sales in a particular country with the possibility of higher sales in a number of other countries.
Russia, Slovakia and Ukraine are currently the markets who lead in terms of revenue. We need to
ensure that we adopt to any possible changes in these markets and reinforce our strategy to fully
diversify our sales.
Following recent improvement in F.S.U. region, it regained the leading position in our revenue
breakdown by geographies. This was a result of the focus of the Group to its strong competencies and
to the extended product portfolio to this market place.
Despite all measures taken by the Company, the possibility of a decrease in demand and sales in a
particular country cannot be excluded in the future. Such a situation may limit overall growth. It is of
extreme importance for the Company to prepare its structure to offset such a situation with higher
sales in other markets. This means both a constant upgrade of the product portfolio and close
relations with customers to win more market share from weaker competitors.
The Group’s ability to increase gross profit margins
The Group’s gross profit margin has increased significantly in 2016 as compared to the corresponding
periods of 2015. This is a continuation of an improvement that started in Q3 2015 and is a result of
changes in our product portfolio and focus on margins rather than sales. However, the pace of this
growth is hard to estimate, as the margins may remain under pressure due to enhanced competition
together with lower demand in a number of markets. It is of extreme importance for the Group to
manage its stock level and refine its product portfolio in order to achieve optimum gross profit margins.
The directors believe that the Group has reached satisfactory gross profit margin levels and shall work
hard to retain them.

23
Currency volatilities
The multi-currency environment that the Group operates in exposes its financial results to steep
currency fluctuations. Although volatility of a number of currencies in Q4 and Q1-Q4 2016 was strong,
we have been successfully shielded by our hedging policy. Therefore, the hedging strategy should be
followed and further improved without any exception for 2017.
Ability of the Group to control expenses
Selling and administrative expenses in 2016 decreased as compared to 2015. The decrease in
expenses was a result of restructuring actions undertaken by the Company in 2015. This included less
employees, revised compensation schemes and stricter expenses control.
Ability to further develop the Group’s product portfolio, both third party and own brands
Because of its size, geographical coverage and good relationship with vendors, the Company has
managed to build an extensive product portfolio. It is crucial for the Company to continue refining its
product mix constantly by adding new product lines with higher gross (and net) profit margins to boost
its profitability. A recent example is smartphones that the Company has timely invested in and resulted
in improved profitability. Especially recently, while our smartphones business has significantly
increased.
Ability to cover warranty claims from customers
The own brand business requires us to be very careful with customer satisfaction when it comes to
after sales services relating mostly to the quality of our products. Since we do not manufacture the
devices ourselves, we have built increased warranty provisions and signed separate agreements with
our suppliers to cover us against warranty losses of such products.
We have reviewed all our contracts with factories, and we signed new ones after ensuring the
contractor will be able to pay any contractual penalties that may arise. This is an important part of our
cooperation with third party factories, to make sure the warranty risk is mitigated
17. Information about important events that occurred after the period ended on December 31st
,
2016 and before this report release
According to our best knowledge, in the period between November 7th, 2016 and February 28
th, 2017
no events have occurred that could affect the Company’s operations or its financial stability.

24
Part II Financial Information
The financial information of ASBISc Enterprises Plc presented as a part of this report is as follows:
Report and Interim Condensed Consolidated Financial Statements for the period ended December 31
st, 2016
Contents Page Condensed consolidated interim statement of profit or loss 1 Condensed consolidated interim statement of comprehensive income Condensed consolidated interim statement of financial position
2 3
Condensed consolidated interim statement of changes in equity 4 Condensed consolidated interim statement of cash flows 5 – 6 Notes to the condensed consolidated interim financial statements 7 - 19
ASBISC ENTERPRISES PLC
CONDENSED CONSOLIDATED INTERIM FINANCIAL STATEMENTS
FOR THE PERIOD ENDED 31 DECEMBER 2016

ASBISC ENTERPRISES PLC
CONDENSED CONSOLIDATED INTERIM FINANCIAL STATEMENTS FOR THE PERIOD ENDED 31 DECEMBER 2016
CONTENTS PAGE
Condensed consolidated interim statement of profit or loss
1
Condensed consolidated interim statement of comprehensive income 2 Condensed consolidated interim statement of financial position 3 Condensed consolidated interim statement of changes in equity 4 Condensed consolidated interim statement of cash flows 5 - 6 Notes to the condensed consolidated interim financial statements 7 - 19

ASBISC ENTERPRISES PLC
1
CONDENSED CONSOLIDATED INTERIM STATEMENT OF PROFIT OR LOSS FOR THE PERIOD ENDED 31 DECEMBER 2016
For the three months ended 31 December
2016
For the three months ended 31 December
2015
For the twelve months ended 31 December
2016
For the twelve months ended 31 December
2015 Note US$ US$ US$ US$ Revenue 4,23 364,241,905 366,846,403 1,137,708,534 1,181,613,369 Cost of sales (343,071,291) (348,706,035) (1,072,294,659) (1,134,964,355)
Gross profit 21,170,614 18,140,368 65,413,875 46,649,014 Selling expenses (9,103,885) (7,482,629) (28,837,972) (30,630,140) Administrative expenses (4,172,655) (4,316,921) (16,339,389) (19,074,811)
Profit/(loss) from operations 7,894,074 6,340,818 20,236,514 (3,055,937) Financial income 7 189,932 313,006 590,209 741,974 Financial expenses 7 (4,455,301) (4,541,324) (14,855,174) (14,872,136) Other gains and losses 5 (145,186) 101,612 42,268 124,426
Profit/(loss) before tax 6 3,483,519 2,214,112 6,013,817 (17,061,673) Taxation 8 (848,965) (175,450) (1,378,202) (90,747)
Profit/(loss) for the period 2,634,554 2,038,662 4,635,615 (17,152,420)
Attributable to: Owners of the company 2,629,051 2,034,498 4,617,243 (17,158,036) Non-controlling interests 5,503 4,164 18,372 5,616
2,634,554 2,038,662 4,635,615 (17,152,420)
US$ cents US$ cents US$ cents US$ cents
Earnings per share
Basic and diluted from continuing operations 4.74 3.67 8.32 (30.92)

ASBISC ENTERPRISES PLC
2
CONDENSED CONSOLIDATED INTERIM STATEMENT OF COMPREHENSIVE INCOME FOR THE PERIOD ENDED 31 DECEMBER 2016
For the three months ended 31 December
2016
For the three months ended 31 December
2015
For the twelve months ended 31 December
2016
For the twelve months ended 31 December
2015 US$ US$ US$ US$
Profit/(loss) for the period 2,634,554 2,038,662 4,635,615 (17,152,420) Other comprehensive loss Exchange difference on translating foreign operations (1,354,220) (1,503,554) (410,635) (5,006,487) Reclassification adjustments relating to foreign operations liquidated in the period 190,000 - 190,254 -
Other comprehensive loss for the period (1,164,220) (1,503,554) (220,381) (5,006,487)
Total comprehensive income/(loss) for the period 1,470,334 535,108 4,415,234 (22,158,907) Total comprehensive income/(loss) attributable to: Owners of the company 1,475,402 534,849 4,403,134 (22,147,517) Non-controlling interests (5,068) 259 12,100 (11,390)
1,470,334 535,108 4,415,234 (22,158,907)
ASBISC ENTERPRISES PLC
3
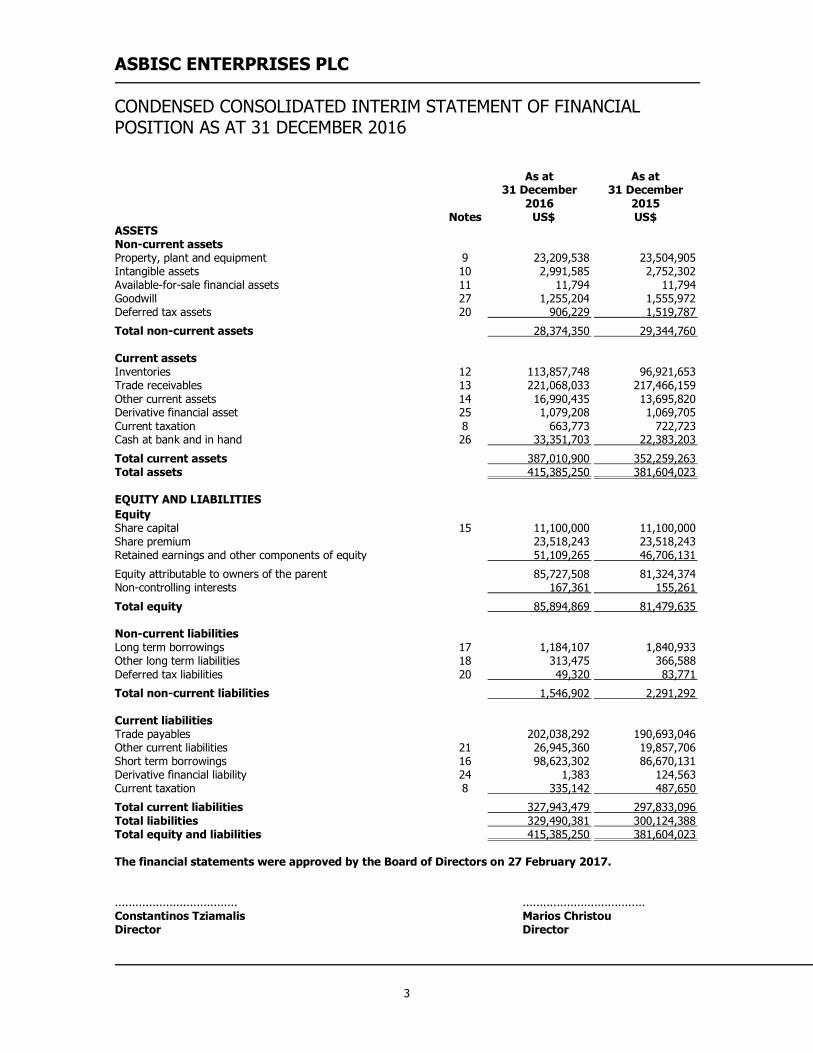
CONDENSED CONSOLIDATED INTERIM STATEMENT OF FINANCIAL POSITION AS AT 31 DECEMBER 2016
As at 31 December
2016
As at 31 December
2015 Notes US$ US$ ASSETS Non-current assets Property, plant and equipment 9 23,209,538 23,504,905 Intangible assets 10 2,991,585 2,752,302 Available-for-sale financial assets 11 11,794 11,794 Goodwill 27 1,255,204 1,555,972 Deferred tax assets 20 906,229 1,519,787
Total non-current assets 28,374,350 29,344,760 Current assets Inventories 12 113,857,748 96,921,653 Trade receivables 13 221,068,033 217,466,159 Other current assets 14 16,990,435 13,695,820 Derivative financial asset 25 1,079,208 1,069,705 Current taxation 8 663,773 722,723 Cash at bank and in hand 26 33,351,703 22,383,203
Total current assets 387,010,900 352,259,263 Total assets 415,385,250 381,604,023 EQUITY AND LIABILITIES
Equity Share capital 15 11,100,000 11,100,000 Share premium 23,518,243 23,518,243 Retained earnings and other components of equity 51,109,265 46,706,131
Equity attributable to owners of the parent 85,727,508 81,324,374 Non-controlling interests 167,361 155,261
Total equity 85,894,869 81,479,635 Non-current liabilities Long term borrowings 17 1,184,107 1,840,933 Other long term liabilities 18 313,475 366,588 Deferred tax liabilities 20 49,320 83,771
Total non-current liabilities 1,546,902 2,291,292 Current liabilities Trade payables 202,038,292 190,693,046 Other current liabilities 21 26,945,360 19,857,706 Short term borrowings 16 98,623,302 86,670,131 Derivative financial liability 24 1,383 124,563 Current taxation 8 335,142 487,650
Total current liabilities 327,943,479 297,833,096 Total liabilities 329,490,381 300,124,388 Total equity and liabilities 415,385,250 381,604,023 The financial statements were approved by the Board of Directors on 27 February 2017. .................................... .................................... Constantinos Tziamalis Marios Christou Director Director

ASBISC ENTERPRISES PLC
4
CONDENSED CONSOLIDATED INTERIM STATEMENT OF CHANGES IN EQUITY FOR THE PERIOD ENDED 31 DECEMBER 2016 Attributable to the owners of the parent
Share capital Share
premium Treasury
stock
Translation of foreign operations
Retained earnings Total
Non-controlling
interests Total US$ US$ US$ US$ US$ US$ US$ US$ Balance at 1 January 2015 11,100,000 23,518,243 (14,211) (8,137,253) 77,005,135 103,471,914 166,651 103,638,565 (Loss)/profit for the year - - - - (17,158,036) (17,158,036) 5,616 (17,152,420) Other comprehensive loss for the year - - - (4,989,481) - (4,989,481) (17,006) (5,006,487) Share-based payments - - (23) - - (23) - (23)
Balance at 31 December 2015 11,100,000 23,518,243 (14,234) (13,126,734) 59,847,099 81,324,374 155,261 81,479,635 Profit for the year - - - - 4,617,243 4,617,243 18,372 4,635,615 Other comprehensive loss for the year - - - (214,109) - (214,109) (6,272) (220,381)
Balance at 31 December 2016 11,100,000 23,518,243 (14,234) (13,340,843) 64,464,342 85,727,508 167,361 85,894,869
ASBISC ENTERPRISES PLC
5
CONDENSED CONSOLIDATED INTERIM STATEMENT OF CASH FLOWS FOR THE PERIOD ENDED 31 DECEMBER 2016
For the three months ended 31 December
2016
For the three months ended 31 December
2015
For the twelve months ended 31 December
2016
For the twelve months ended 31 December
2015 Note US$ US$ US$ US$
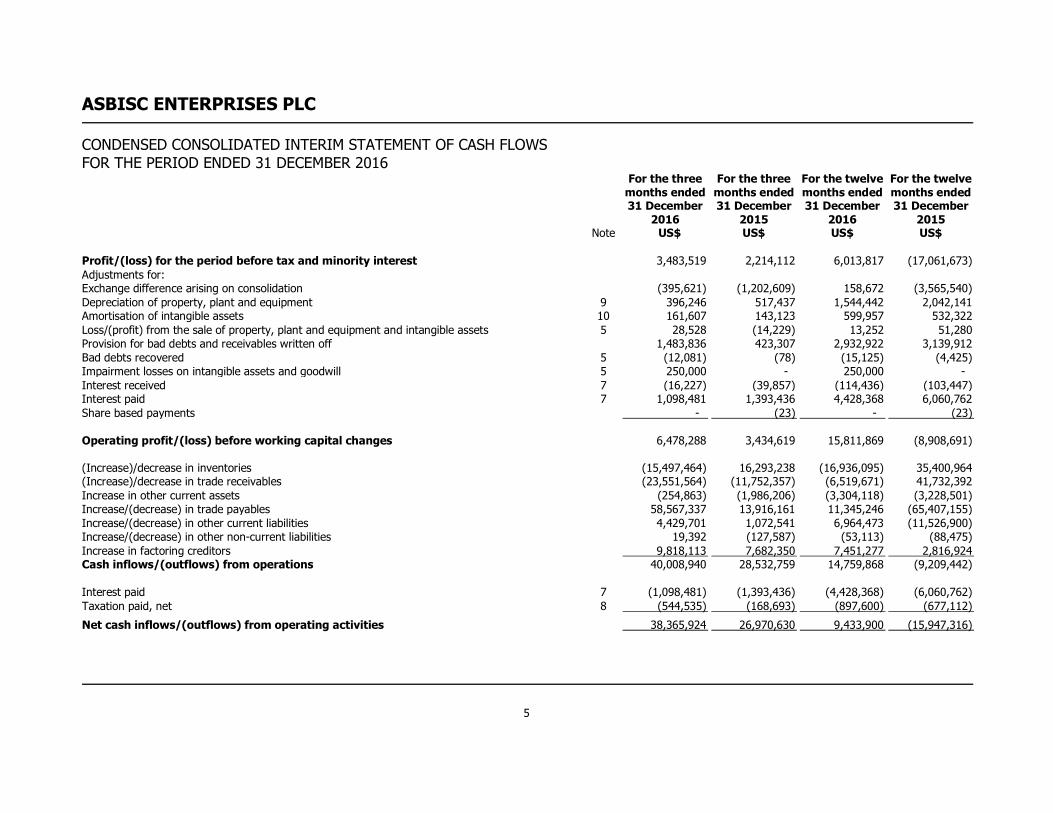
Profit/(loss) for the period before tax and minority interest 3,483,519 2,214,112 6,013,817 (17,061,673) Adjustments for: Exchange difference arising on consolidation (395,621) (1,202,609) 158,672 (3,565,540) Depreciation of property, plant and equipment 9 396,246 517,437 1,544,442 2,042,141 Amortisation of intangible assets 10 161,607 143,123 599,957 532,322 Loss/(profit) from the sale of property, plant and equipment and intangible assets 5 28,528 (14,229) 13,252 51,280 Provision for bad debts and receivables written off 1,483,836 423,307 2,932,922 3,139,912 Bad debts recovered 5 (12,081) (78) (15,125) (4,425) Impairment losses on intangible assets and goodwill 5 250,000 - 250,000 - Interest received 7 (16,227) (39,857) (114,436) (103,447) Interest paid 7 1,098,481 1,393,436 4,428,368 6,060,762 Share based payments - (23) - (23)
Operating profit/(loss) before working capital changes 6,478,288 3,434,619 15,811,869 (8,908,691) (Increase)/decrease in inventories (15,497,464) 16,293,238 (16,936,095) 35,400,964 (Increase)/decrease in trade receivables (23,551,564) (11,752,357) (6,519,671) 41,732,392 Increase in other current assets (254,863) (1,986,206) (3,304,118) (3,228,501) Increase/(decrease) in trade payables 58,567,337 13,916,161 11,345,246 (65,407,155) Increase/(decrease) in other current liabilities 4,429,701 1,072,541 6,964,473 (11,526,900) Increase/(decrease) in other non-current liabilities 19,392 (127,587) (53,113) (88,475) Increase in factoring creditors 9,818,113 7,682,350 7,451,277 2,816,924 Cash inflows/(outflows) from operations 40,008,940 28,532,759 14,759,868 (9,209,442) Interest paid 7 (1,098,481) (1,393,436) (4,428,368) (6,060,762) Taxation paid, net 8 (544,535) (168,693) (897,600) (677,112)
Net cash inflows/(outflows) from operating activities 38,365,924 26,970,630 9,433,900 (15,947,316)

ASBISC ENTERPRISES PLC
6
CONDENSED CONSOLIDATED INTERIM STATEMENT OF CASH FLOWS FOR THE PERIOD ENDED 31 DECEMBER 2016
For the three months ended 31 December
2016
For the three months ended 31 December
2015
For the twelve months ended 31 December
2016
For the twelve months ended 31 December
2015 Note US$ US$ US$ US$ Cash flows from investing activities Purchase of intangible assets 10 (310,349) (112,230) (853,655) (1,852,201) Purchase of property, plant and equipment 9 (581,966) (1,664,286) (1,570,011) (2,604,522) (Write-offs)/proceeds from sale of property, plant and equipment and intangible assets (16,514) 61,310 (1,238) 202,819 Interest received 7 16,227 39,857 114,436 103,447
Net cash outflows from investing activities (892,602) (1,675,349) (2,310,468) (4,150,457) Cash flows from financing activities (Repayments)/proceeds of long term loans and long term obligations under finance lease (218,312) 873,163 (656,826) 225,220 Repayments of short term borrowings and short term obligations under finance lease (345,890) (3,946,634) (4,219,613) (5,253,849)
Net cash outflows from financing activities (564,202) (3,073,471) (4,876,439) (5,028,629) Net increase/(decrease) in cash and cash equivalents 36,909,121 22,221,810 2,246,993 (25,126,403) Cash and cash equivalents at beginning of the period/year (30,372,271) (17,931,954) 4,289,856 29,516,259
Cash and cash equivalents at end of the period/year 26 6,536,849 4,289,856 6,536,849 4,289,856

ASBISC ENTERPRISES PLC NOTES TO THE CONDENSED CONSOLIDATED INTERIM FINANCIAL STATEMENTS FOR THE PERIOD ENDED 31 DECEMBER 2016
7
1. Incorporation and principal activities Asbisc Enterprises Plc was incorporated in Cyprus on 9 November 1995 with limited liability. These condensed consolidated interim financial statements (“interim financial statements”) as at and for the twelve months ended 31 December 2016 comprise the interim financial statements of the company and its subsidiaries (together referred to as the “group”). The group’s and the company's principal activity is the trading and distribution of computer hardware and software. The main shareholder of the company is K.S. Holdings Limited, a company incorporated in Cyprus. The Company is listed on the Warsaw Stock Exchange since 30th October 2007.
2. Basis of preparation (a) Statement of compliance
These interim financial statements have been prepared in accordance with IAS 34 Interim Financial Reporting. They do not include all the information required for a complete set of IFRS financial statements and they should be read in conjunction with the audited financial statements for the year ended 31 December 2015. However, selected explanatory notes are included to explain events and transactions that are significant to an understanding of the changes in financial position and performance of the group since the last annual consolidated financial statements as at and for the year ended 31 December 2015.
These interim financial statements were authorised for issue by the company’s Board of Directors on 27 February 2017. (b) Use of judgments and estimates Preparing the interim financial statements requires Management to make judgments, estimates and assumptions that affect the application of accounting policies and the reported amounts of assets and liabilities, income and expense. Actual results may differ from these estimates. The significant judgments made by Management in applying the group’s accounting policies and the key sources of estimation uncertainty were the same as those that applied to the consolidated financial statements as at and for the year ended 31 December 2015.
Financial instruments comprise financial assets and financial liabilities. Financial assets mainly consist of bank balances, receivables and investments. Financial liabilities mainly consist of trade payables, factoring balances, bank overdrafts and loans. The Directors consider that the carrying amount of the company’s/group’s financial instruments approximate their fair value at the reporting date. Financial assets and financial liabilities carried at fair value through profit or loss represent foreign currency derivative contracts categorized as a Level 2 (inputs other than quoted prices included within level 1 that are observable for the asset or liability, either directly (that is, as prices) or indirectly (that is, derived from prices).
3. Significant accounting policies The accounting policies adopted for the preparation of the condensed consolidated interim financial statements for the twelve months ended 31 December 2016 are consistent with those followed for the preparation of the annual financial statements for the year 2015 except for the adoption by the group of all the new and revised standards and interpretations issued by the International Accounting Standards Board (IASB) and the International Financial Reporting Interpretations Committee (IFRIC) of the IASB that are relevant to its operations and effective for annual periods beginning on 1 January 2016. The adoption of new and revised standards and interpretations did not have any material
effect on the group’s condensed consolidated financial statements.
4. Effects of seasonality The group's revenue and consequently its profitability are significantly lower during the first half of the year. The seasonality is driven by increased household expenditure during the Christmas period as well as the commencement of the academic period during the second half of the year resulting in a positive effect on demand for the group's products.

ASBISC ENTERPRISES PLC NOTES TO THE CONDENSED CONSOLIDATED INTERIM FINANCIAL STATEMENTS FOR THE PERIOD ENDED 31 DECEMBER 2016
8
5. Other gains and losses For the three
months ended 31 December
2016
For the three months ended 31 December
2015
For the twelve months ended 31 December
2016
For the twelve months ended 31 December
2015 US$ US$ US$ US$ (Loss)/profit on disposal of property, plant and equipment (28,528) 14,229 (13,252) (51,280) Other income 103,155 71,950 217,453 127,270 Bad debts recovered 12,081 78 15,125 4,425 Rental income 18,106 15,355 72,942 44,011 Impairment loss on goodwill (250,000) - (250,000) -
(145,186) 101,612 42,268 124,426
6. Profit/(loss) before tax For the three
months ended 31 December
2016
For the three months ended 31 December
2015
For the twelve months ended 31 December
2016
For the twelve months ended 31 December
2015 US$ US$ US$ US$ Profit/(loss) before tax is stated after charging : (a) Amortisation of intangible assets (Note 10) 161,607 143,123 599,957 532,322 (b) Depreciation (Note 9) 396,246 517,437 1,544,442 2,042,141 (c) Auditors' remuneration 61,886 89,767 320,285 342,720 (e) Directors’ remuneration – executive (Note 28) 104,350 70,122 417,764 284,614 (e) Directors’ remuneration – non-executive (Note 28) 538 544 2,216 16,670
7. Financial expense, net For the three
months ended 31 December
2016
For the three months ended 31 December
2015
For the twelve months ended 31 December
2016
For the twelve months ended 31 December
2015 US$ US$ US$ US$ Financial income Interest income 16,227 39,857 114,436 103,447 Other financial income 173,705 273,149 475,773 465,474 Net exchange gain - - - 173,053
189,932 313,006 590,209 741,974
Financial expense Bank interest 1,098,481 1,393,436 4,428,368 6,060,762 Bank charges 419,932 358,528 1,424,254 1,383,128 Derivative charges 236,234 251,418 725,974 811,532 Factoring interest 1,918,518 1,376,764 5,453,672 4,309,777 Factoring charges 118,118 165,350 351,357 570,454 Other financial expenses 13,378 290,812 54,965 344,253 Other interest 428,521 362,145 1,328,274 1,392,230 Net exchange loss 222,119 342,871 1,088,310 - 4,455,301 4,541,324 14,855,174 14,872,136
Net (4,265,371) (4,228,318) (14,264,965) (14,130,162)

ASBISC ENTERPRISES PLC NOTES TO THE CONDENSED CONSOLIDATED INTERIM FINANCIAL STATEMENTS FOR THE PERIOD ENDED 31 DECEMBER 2016
9
8. Tax For the twelve
months ended 31 December
2016
For the year ended
31 December 2015
US$ US$ Receivable balance 1 January (235,073) (315,920) Provision for the year 802,924 677,306 Under provision of prior year periods 5,886 13,000 Exchange difference on retranslation (4,768) 67,653 Amounts paid, net (897,600) (677,112)
Net receivable balance 31 December (328,631) (235,073)
For the twelve months ended 31 December
2016
For the year ended
31 December 2015
US$ US$ Tax receivable (663,773) (722,723) Tax payable 335,142 487,650
Net (328,631) (235,073) The consolidated taxation charge for the year consists of the following: For the three
months ended 31 December
2016
For the three months ended 31 December
2015
For the twelve months ended 31 December
2016
For the twelve months ended 31 December
2015 US$ US$ US$ US$ Provision for the period/year 381,823 807,766 802,924 677,305 (Over)/under provision of prior years (301) 359 5,886 13,000 Deferred tax charge/(credit) (Note 20) 467,443 (632,675) 569,392 (599,558)
Charge for the period/year 848,965 175,450 1,378,202 90,747 The taxation charge of the group comprises corporation tax charge in Cyprus on the taxable profits of the company and those of its subsidiaries which are subject to tax in Cyprus and corporation tax in other jurisdictions on the results of the foreign subsidiary companies.

ASBISC ENTERPRISES PLC NOTES TO THE CONDENSED CONSOLIDATED INTERIM FINANCIAL STATEMENTS FOR THE PERIOD ENDED 31 DECEMBER 2016
10
9. Property, plant and equipment Land and
buildings Computer hardware
Warehouse machinery
Motor vehicles
Furniture and fittings
Office equipment
Total
US$ US$ US$ US$ US$ US$ US$ Cost At 1 January 2015 22,510,892 6,827,184 169,457 3,120,517 2,673,615 3,253,253 38,554,918 Additions 1,935,613 328,696 198,990 - 50,811 90,412 2,604,522 Disposals - (269,355) - (552,196) (87,578) (114,393) (1,023,522) Foreign exchange difference on retranslation (1,091,328) (449,694) 520 (314,559) (252,719) (361,533) (2,469,313) At 31 December 2015 23,355,177 6,436,831 368,967 2,253,762 2,384,129 2,867,739 37,666,605 Additions 732,135 473,166 6,005 218,803 69,371 70,531 1,570,011 Disposals - (798,777) - (419,387) (79,859) (188,327) (1,486,350) Foreign exchange difference on retranslation (301,465) (75,483) (111) (32,009) (41,245) (38,306) (488,619)
At 31 December 2016 23,785,847 6,035,737 374,861 2,021,169 2,332,396 2,711,637 37,261,647 Accumulated depreciation At 1 January 2015 3,157,883 5,087,177 89,933 1,926,623 1,809,913 2,124,715 14,196,244 Charge for the year 566,795 709,590 25,909 312,223 189,056 238,568 2,042,141 Disposals - (258,328) - (387,553) (29,578) (114,393) (789,852) Foreign exchange difference on retranslation (213,967) (446,470) 670 (190,711) (184,517) (251,838) (1,286,833) At 31 December 2015 3,510,711 5,091,969 116,512 1,660,582 1,784,874 1,997,052 14,161,700 Charge for the period 256,585 601,269 38,930 234,095 173,769 239,794 1,544,442 Disposals - (798,777) - (419,387) (79,859) (188,327) (1,486,350) Foreign exchange difference on retranslation (2,839) (66,319) (111) (30,139) (35,807) (32,468) (167,683)
At 31 December 2016 3,764,457 4,828,142 155,331 1,445,151 1,842,977 2,016,051 14,052,109 Net book value
At 31 December 2016 20,021,390 1,207,595 219,530 576,018 489,419 695,586 23,209,538
At 31 December 2015 19,844,466 1,344,862 252,455 593,180 599,255 870,687 23,504,905

ASBISC ENTERPRISES PLC NOTES TO THE CONDENSED CONSOLIDATED INTERIM FINANCIAL STATEMENTS FOR THE PERIOD ENDED 31 DECEMBER 2016
11
10. Intangible assets Computer
software Patents and
licenses Total US$ US$ US$ Cost At 1 January 2015 7,315,063 1,095,656 8,410,719 Additions 687,396 1,164,805 1,852,201 Disposals/ write-offs (18,204) (23,733) (41,937) Foreign exchange difference on retranslation (133,040) (4,634) (137,674) At 31 December 2015 7,851,215 2,232,094 10,083,309 Additions 587,097 266,558 853,655 Disposals/ write-offs (218,742) - (218,742) Foreign exchange difference on retranslation (18,853) 2,474 (16,379)
At 31 December 2016 8,200,717 2,501,126 10,701,843 Accumulated amortisation At 1 January 2015 5,926,972 1,045,280 6,972,252 Additions from acquisitions of subsidiaries 297,030 235,292 532,322 Disposals/ write-offs (7,282) (14,223) (21,505) Foreign exchange difference on retranslation (124,600) (27,462) (152,062) At 31 December 2015 6,092,120 1,238,887 7,331,007 Charge for the period 342,861 257,096 599,957 Disposals/ write-offs (206,728) - (206,728) Foreign exchange difference on retranslation (19,197) 5,219 (13,978)
At 31 December 2016 6,209,056 1,501,202 7,710,258 Net book value
At 31 December 2016 1,991,661 999,924 2,991,585
At 31 December 2015 1,759,095 993,207 2,752,302
11. Available-for-sale financial assets The details of the investments are as follows:
Name
Country of
incorporation
Participation
% Cost US$
Impairment US$
As at 31 December
2016 US$
As at 31 December
2015 US$
Investments held in related companies
E-Vision Ltd Cyprus 18% 90,000 (90,000) - - Other investments
Asekol s.r.o. Czech Republic 9.09% 9,580 - 9,580 9,580 Regnon S.A. Poland 0.01% 2,214 - 2,214 2,214
101,794 (90,000) 11,794 11,794
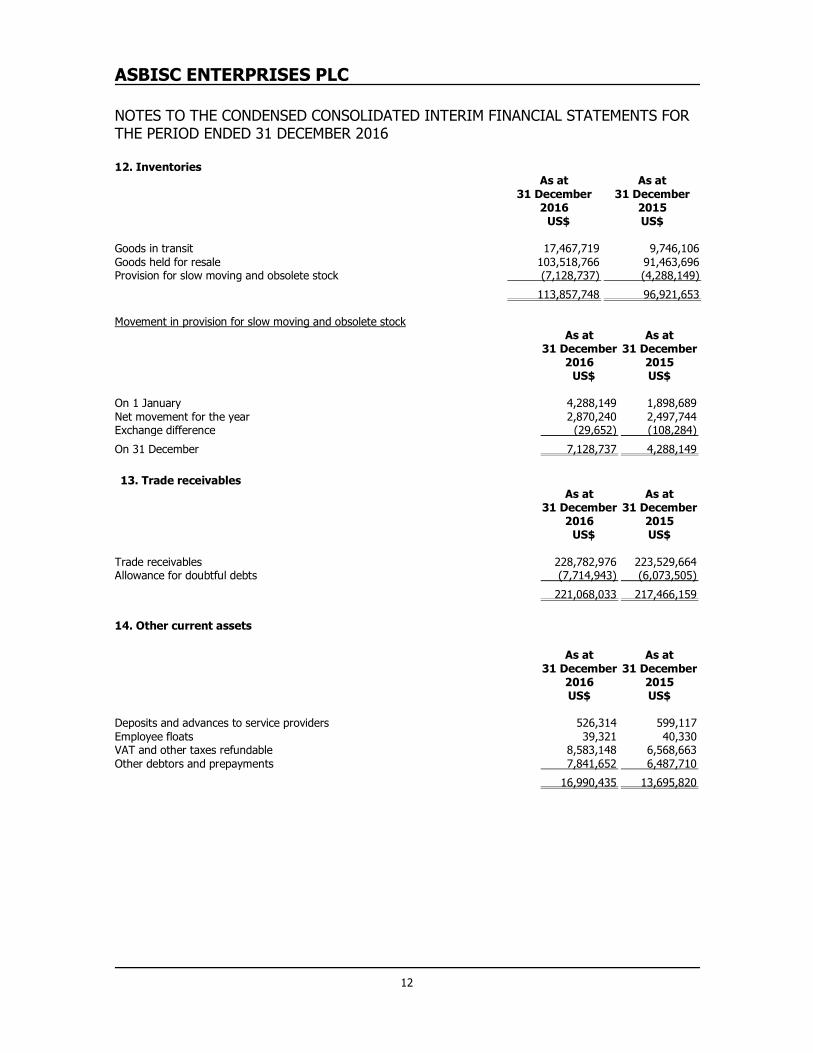
ASBISC ENTERPRISES PLC NOTES TO THE CONDENSED CONSOLIDATED INTERIM FINANCIAL STATEMENTS FOR THE PERIOD ENDED 31 DECEMBER 2016
12
12. Inventories As at
31 December 2016
As at 31 December
2015 US$ US$ Goods in transit 17,467,719 9,746,106 Goods held for resale 103,518,766 91,463,696 Provision for slow moving and obsolete stock (7,128,737) (4,288,149)
113,857,748 96,921,653 Movement in provision for slow moving and obsolete stock As at
31 December 2016
As at 31 December
2015 US$ US$ On 1 January 4,288,149 1,898,689 Net movement for the year 2,870,240 2,497,744 Exchange difference (29,652) (108,284)
On 31 December 7,128,737 4,288,149
13. Trade receivables As at
31 December 2016
As at 31 December
2015 US$ US$ Trade receivables 228,782,976 223,529,664 Allowance for doubtful debts (7,714,943) (6,073,505)
221,068,033 217,466,159
14. Other current assets
As at 31 December
2016
As at 31 December
2015 US$
US$
Deposits and advances to service providers 526,314 599,117 Employee floats 39,321 40,330 VAT and other taxes refundable 8,583,148 6,568,663 Other debtors and prepayments 7,841,652 6,487,710
16,990,435 13,695,820
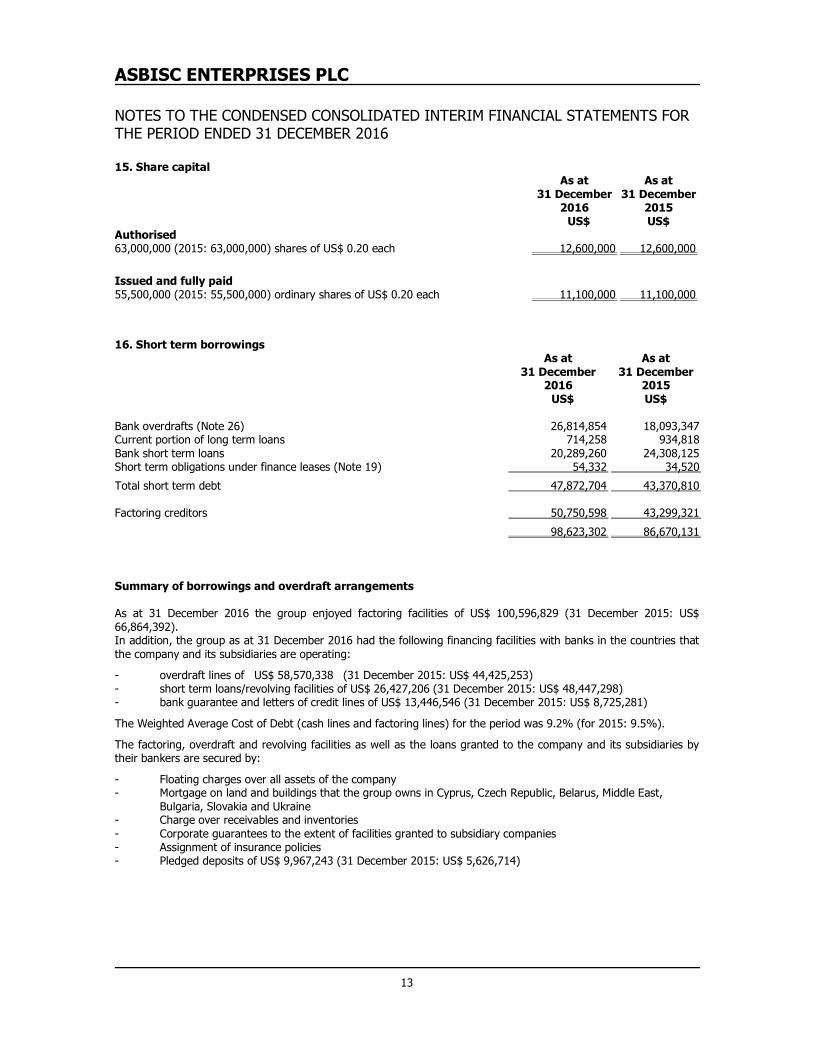
ASBISC ENTERPRISES PLC NOTES TO THE CONDENSED CONSOLIDATED INTERIM FINANCIAL STATEMENTS FOR THE PERIOD ENDED 31 DECEMBER 2016
13
15. Share capital As at
31 December 2016
As at 31 December
2015 US$ US$ Authorised 63,000,000 (2015: 63,000,000) shares of US$ 0.20 each 12,600,000 12,600,000
Issued and fully paid 55,500,000 (2015: 55,500,000) ordinary shares of US$ 0.20 each 11,100,000 11,100,000
16. Short term borrowings As at
31 December 2016
As at 31 December
2015 US$ US$ Bank overdrafts (Note 26) 26,814,854 18,093,347 Current portion of long term loans 714,258 934,818 Bank short term loans 20,289,260 24,308,125 Short term obligations under finance leases (Note 19) 54,332 34,520
Total short term debt 47,872,704 43,370,810 Factoring creditors 50,750,598 43,299,321
98,623,302 86,670,131 Summary of borrowings and overdraft arrangements As at 31 December 2016 the group enjoyed factoring facilities of US$ 100,596,829 (31 December 2015: US$ 66,864,392). In addition, the group as at 31 December 2016 had the following financing facilities with banks in the countries that the company and its subsidiaries are operating:
- overdraft lines of US$ 58,570,338 (31 December 2015: US$ 44,425,253) - short term loans/revolving facilities of US$ 26,427,206 (31 December 2015: US$ 48,447,298) - bank guarantee and letters of credit lines of US$ 13,446,546 (31 December 2015: US$ 8,725,281)
The Weighted Average Cost of Debt (cash lines and factoring lines) for the period was 9.2% (for 2015: 9.5%).
The factoring, overdraft and revolving facilities as well as the loans granted to the company and its subsidiaries by their bankers are secured by:
- Floating charges over all assets of the company - Mortgage on land and buildings that the group owns in Cyprus, Czech Republic, Belarus, Middle East, Bulgaria, Slovakia and Ukraine - Charge over receivables and inventories - Corporate guarantees to the extent of facilities granted to subsidiary companies - Assignment of insurance policies - Pledged deposits of US$ 9,967,243 (31 December 2015: US$ 5,626,714)
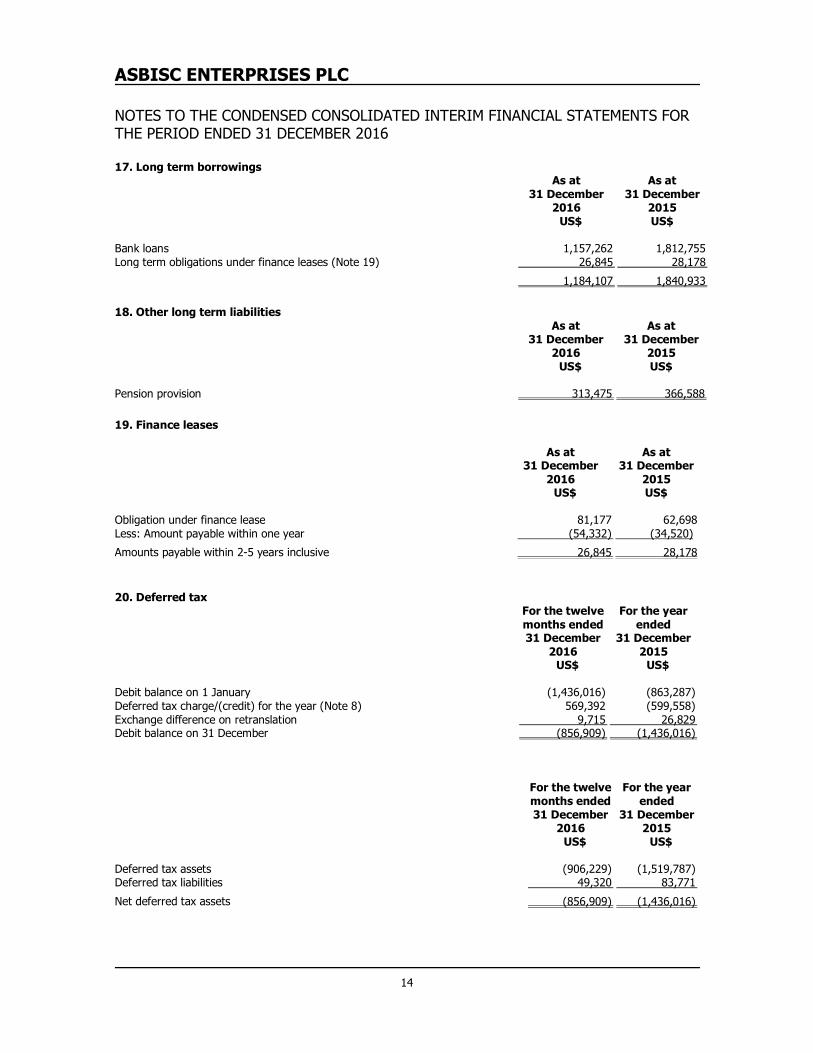
ASBISC ENTERPRISES PLC NOTES TO THE CONDENSED CONSOLIDATED INTERIM FINANCIAL STATEMENTS FOR THE PERIOD ENDED 31 DECEMBER 2016
14
17. Long term borrowings As at
31 December 2016
As at 31 December
2015 US$ US$ Bank loans 1,157,262 1,812,755 Long term obligations under finance leases (Note 19) 26,845 28,178
1,184,107 1,840,933
18. Other long term liabilities As at
31 December 2016
As at 31 December
2015 US$ US$ Pension provision 313,475 366,588
19. Finance leases As at
31 December 2016
As at 31 December
2015 US$ US$ Obligation under finance lease 81,177 62,698 Less: Amount payable within one year (54,332) (34,520)
Amounts payable within 2-5 years inclusive 26,845 28,178
20. Deferred tax For the twelve
months ended 31 December
2016
For the year ended
31 December 2015
US$ US$ Debit balance on 1 January (1,436,016) (863,287) Deferred tax charge/(credit) for the year (Note 8) 569,392 (599,558) Exchange difference on retranslation 9,715 26,829 Debit balance on 31 December (856,909) (1,436,016) For the twelve
months ended 31 December
2016
For the year ended
31 December 2015
US$ US$ Deferred tax assets (906,229) (1,519,787) Deferred tax liabilities 49,320 83,771
Net deferred tax assets (856,909) (1,436,016)
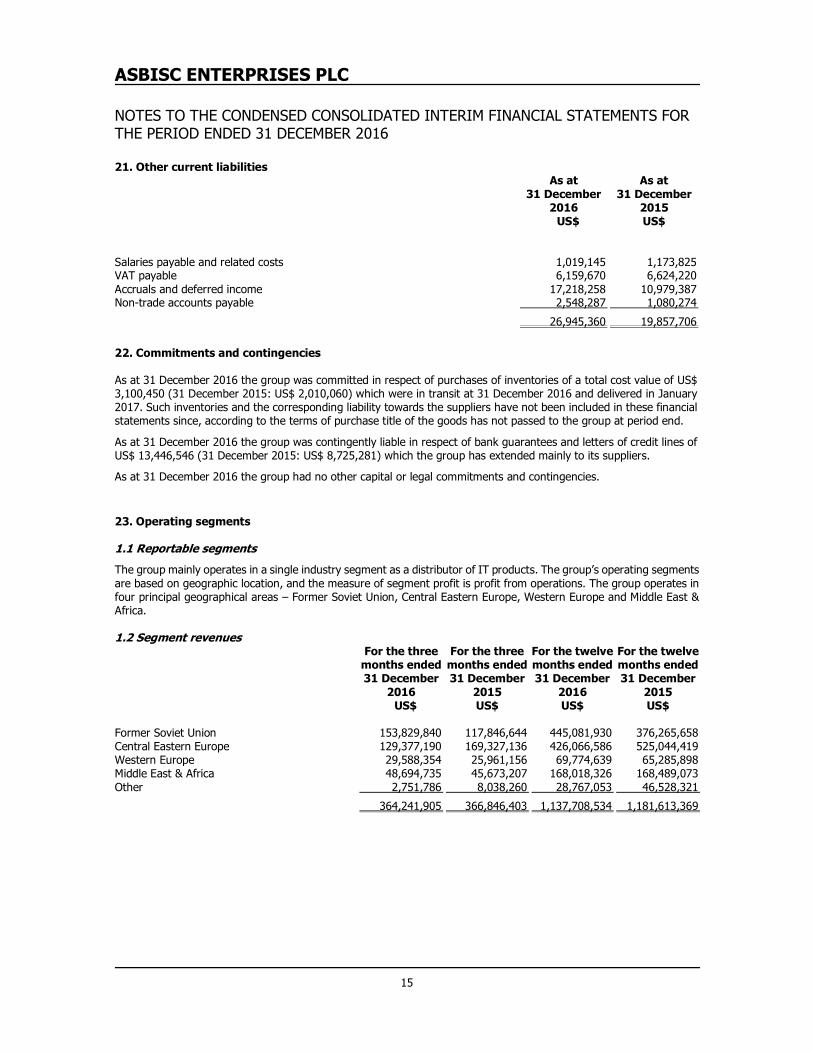
ASBISC ENTERPRISES PLC NOTES TO THE CONDENSED CONSOLIDATED INTERIM FINANCIAL STATEMENTS FOR THE PERIOD ENDED 31 DECEMBER 2016
15
21. Other current liabilities As at
31 December 2016
As at 31 December
2015 US$ US$ Salaries payable and related costs 1,019,145 1,173,825 VAT payable 6,159,670 6,624,220 Accruals and deferred income 17,218,258 10,979,387 Non-trade accounts payable 2,548,287 1,080,274
26,945,360 19,857,706
22. Commitments and contingencies As at 31 December 2016 the group was committed in respect of purchases of inventories of a total cost value of US$ 3,100,450 (31 December 2015: US$ 2,010,060) which were in transit at 31 December 2016 and delivered in January 2017. Such inventories and the corresponding liability towards the suppliers have not been included in these financial statements since, according to the terms of purchase title of the goods has not passed to the group at period end.
As at 31 December 2016 the group was contingently liable in respect of bank guarantees and letters of credit lines of US$ 13,446,546 (31 December 2015: US$ 8,725,281) which the group has extended mainly to its suppliers.
As at 31 December 2016 the group had no other capital or legal commitments and contingencies.
23. Operating segments 1.1 Reportable segments
The group mainly operates in a single industry segment as a distributor of IT products. The group’s operating segments are based on geographic location, and the measure of segment profit is profit from operations. The group operates in four principal geographical areas – Former Soviet Union, Central Eastern Europe, Western Europe and Middle East & Africa. 1.2 Segment revenues For the three
months ended 31 December
2016
For the three months ended 31 December
2015
For the twelve months ended 31 December
2016
For the twelve months ended 31 December
2015 US$ US$ US$ US$ Former Soviet Union 153,829,840 117,846,644 445,081,930 376,265,658 Central Eastern Europe 129,377,190 169,327,136 426,066,586 525,044,419 Western Europe 29,588,354 25,961,156 69,774,639 65,285,898 Middle East & Africa 48,694,735 45,673,207 168,018,326 168,489,073 Other 2,751,786 8,038,260 28,767,053 46,528,321
364,241,905 366,846,403 1,137,708,534 1,181,613,369

ASBISC ENTERPRISES PLC NOTES TO THE CONDENSED CONSOLIDATED INTERIM FINANCIAL STATEMENTS FOR THE PERIOD ENDED 31 DECEMBER 2016
16
1.3 Segment results
1.4 Segment capital expenditure (CAPEX) As at
31 December 2016
As at 31 December
2015 US$ US$ Former Soviet Union 4,100,423 4,105,812 Central Eastern Europe 12,080,453 12,158,485 Western Europe - 85,910 Middle East & Africa 3,206,783 3,406,971 Unallocated 8,068,668 8,056,001
27,456,327 27,813,179 1.5 Segment depreciation and amortization For the three
months ended 31 December
2016
For the three months ended 31 December
2015
For the twelve months ended 31 December
2016
For the twelve months ended 31 December
2015 US$ US$ US$ US$ Former Soviet Union 75,477 86,600 277,193 450,026 Central Eastern Europe 207,091 260,246 772,414 870,766 Western Europe 7,307 10,644 33,296 43,617 Middle East & Africa 55,955 65,545 220,299 252,556 Unallocated 212,023 237,525 841,197 957,498
557,853 660,560 2,144,399 2,574,463
For the three months ended 31 December
2016
For the three months ended 31 December
2015
For the twelve months ended 31 December
2016
For the twelve months ended 31 December
2015 US$ US$ US$ US$ Former Soviet Union 3,896,005 3,888,358 10,196,200 (3,010,392) Central Eastern Europe 3,398,116 729,479 8,269,589 1,186,943 Western Europe 61,277 100,897 290,165 (1,049,466) Middle East & Africa 473,020 1,183,855 1,284,731 447,832 Other 65,656 438,229 195,829 (630,854) Profit/(loss) from operations 7,894,074 6,340,818 20,236,514 (3,055,937) Net financial expenses (4,265,369) (4,228,318) (14,264,965) (14,130,162) Other gains and losses (145,186) 101,612 42,268 124,426
Profit/(loss) before taxation 3,483,519 2,214,112 6,013,817 (17,061,673)
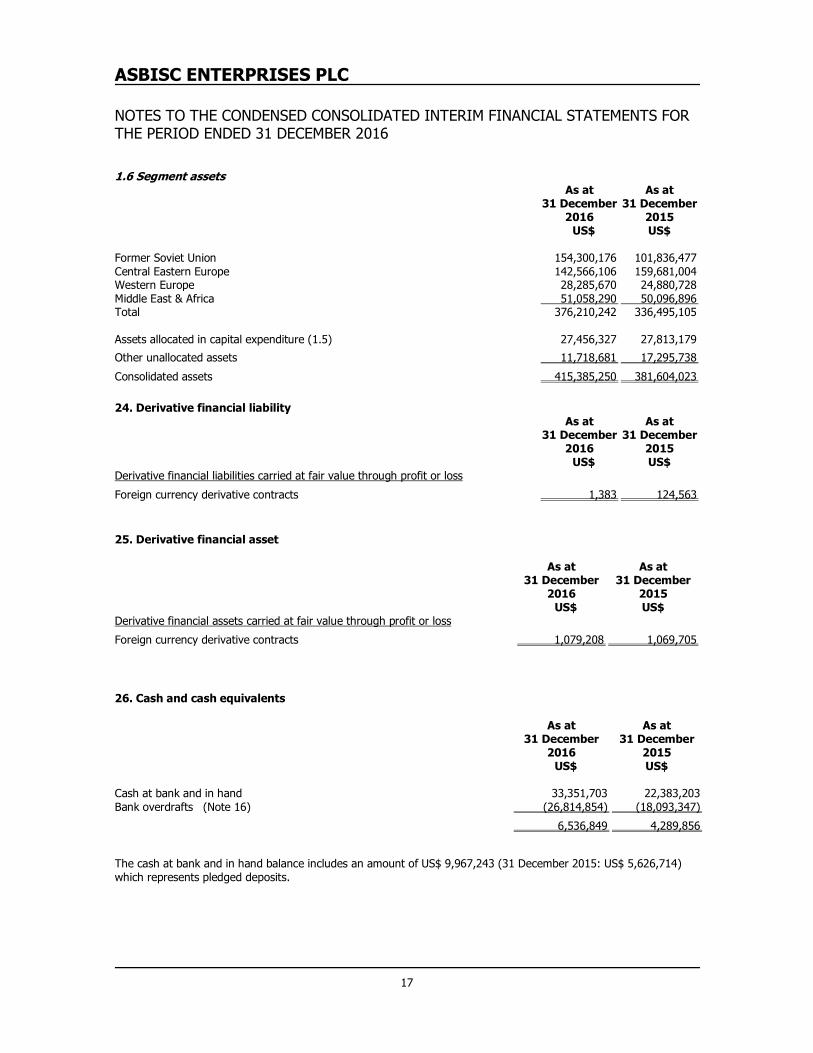
ASBISC ENTERPRISES PLC NOTES TO THE CONDENSED CONSOLIDATED INTERIM FINANCIAL STATEMENTS FOR THE PERIOD ENDED 31 DECEMBER 2016
17
1.6 Segment assets As at
31 December 2016
As at 31 December
2015 US$ US$ Former Soviet Union 154,300,176 101,836,477 Central Eastern Europe 142,566,106 159,681,004 Western Europe 28,285,670 24,880,728 Middle East & Africa 51,058,290 50,096,896 Total 376,210,242 336,495,105 Assets allocated in capital expenditure (1.5) 27,456,327 27,813,179
24. Derivative financial liability As at
31 December 2016
As at 31 December
2015 US$ US$ Derivative financial liabilities carried at fair value through profit or loss
Foreign currency derivative contracts 1,383 124,563
25. Derivative financial asset As at
31 December 2016
As at 31 December
2015 US$ US$ Derivative financial assets carried at fair value through profit or loss
Foreign currency derivative contracts 1,079,208 1,069,705
26. Cash and cash equivalents As at
31 December 2016
As at 31 December
2015 US$ US$ Cash at bank and in hand 33,351,703 22,383,203 Bank overdrafts (Note 16) (26,814,854) (18,093,347)
6,536,849 4,289,856
The cash at bank and in hand balance includes an amount of US$ 9,967,243 (31 December 2015: US$ 5,626,714) which represents pledged deposits.
Other unallocated assets 11,718,681 17,295,738
Consolidated assets 415,385,250 381,604,023

ASBISC ENTERPRISES PLC NOTES TO THE CONDENSED CONSOLIDATED INTERIM FINANCIAL STATEMENTS FOR THE PERIOD ENDED 31 DECEMBER 2016
18
27. Goodwill As at
31 December 2016
As at 31 December
2015 US$ US$ At 1 January 1,555,972 1,734,340 Impairment loss (note ii) (250,000) - Foreign exchange difference on retranslation (50,768) (178,368)
At 31 December (note i) 1,255,204 1,555,972 (i) The capitalized goodwill arose from the business combinations of the following subsidiaries: As at
31 December 2016
As at 31 December
2015 US$ US$ ASBIS d.o.o. (BA) (formerly Megatrend D.O.O. Sarajevo) 367,911 381,349 SHARK Computers a.s. 887,293 1,174,623 1,255,204 1,555,972 (ii) The impairment loss of goodwill relates to the following subsidiary: As at
31 December 2016
As at 31 December
2015 US$ US$ SHARK Computers a.s. (250,000) - (250,000) -
28. Transactions and balances of key management For the three
months ended 31 December
2016
For the three months ended 31 December
2015
For the twelve months ended 31 December
2016
For the twelve months ended 31 December
2015 US$ US$ US$ US$ Director's remuneration - executive (Note 6) 104,350 70,122 417,764 284,614 Director's remuneration - non-executive (Note 6) 538 544 2,216 16,670
104,888 70,666 419,980 301,284
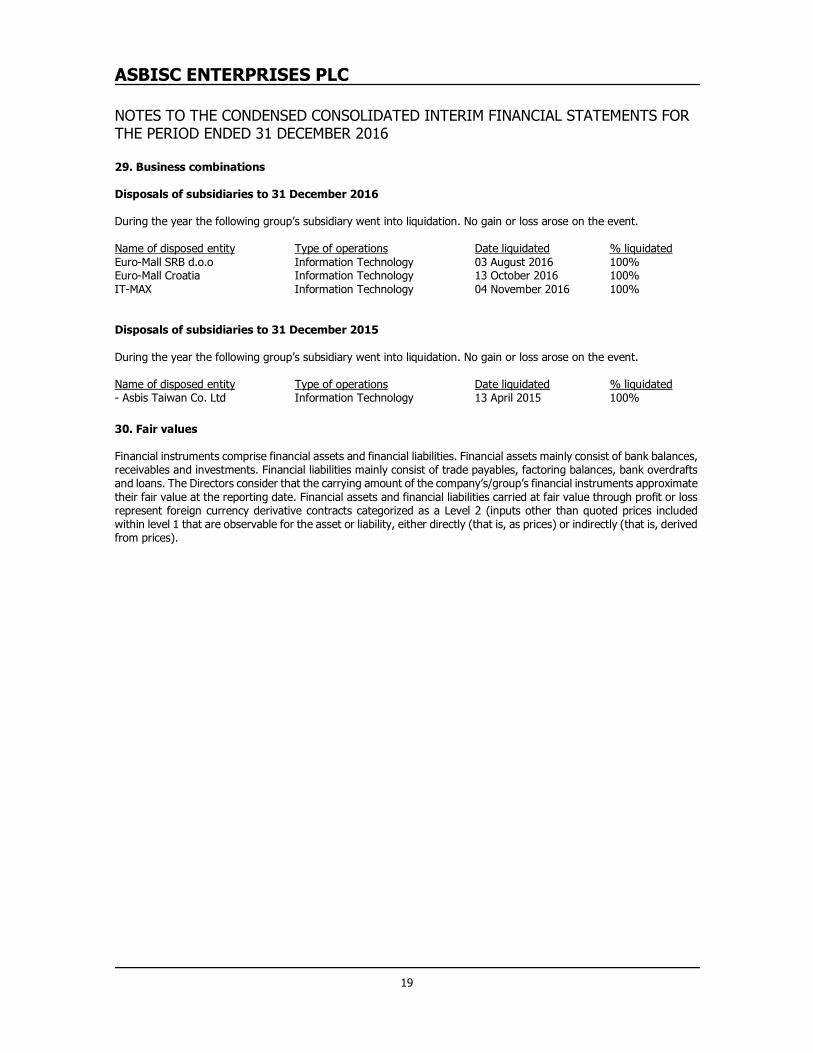
ASBISC ENTERPRISES PLC NOTES TO THE CONDENSED CONSOLIDATED INTERIM FINANCIAL STATEMENTS FOR THE PERIOD ENDED 31 DECEMBER 2016
19
29. Business combinations Disposals of subsidiaries to 31 December 2016 During the year the following group’s subsidiary went into liquidation. No gain or loss arose on the event. Name of disposed entity Type of operations Date liquidated % liquidated Euro-Mall SRB d.o.o Information Technology 03 August 2016 100% Euro-Mall Croatia Information Technology 13 October 2016 100% IT-MAX Information Technology 04 November 2016 100% Disposals of subsidiaries to 31 December 2015 During the year the following group’s subsidiary went into liquidation. No gain or loss arose on the event. Name of disposed entity Type of operations Date liquidated % liquidated - Asbis Taiwan Co. Ltd Information Technology 13 April 2015 100%
30. Fair values Financial instruments comprise financial assets and financial liabilities. Financial assets mainly consist of bank balances, receivables and investments. Financial liabilities mainly consist of trade payables, factoring balances, bank overdrafts and loans. The Directors consider that the carrying amount of the company’s/group’s financial instruments approximate their fair value at the reporting date. Financial assets and financial liabilities carried at fair value through profit or loss represent foreign currency derivative contracts categorized as a Level 2 (inputs other than quoted prices included within level 1 that are observable for the asset or liability, either directly (that is, as prices) or indirectly (that is, derived from prices).