Consolidated Financial Statements - Thal Limited
40
F or t h e y ear en d e d J une 30, 201 5 Consolidated Financial Statements
Transcript of Consolidated Financial Statements - Thal Limited

For the year ended June 30, 2015Consolidated Financial Statements
Consolidated Balance SheetAs at June 30, 2015
Note 2015 2014 (Rupees in ‘000)
ASSETS NON-CURRENT ASSETS Property, plant and equipment 8 1,285,391 1,359,936 Intangible assets 9 8,713 379 Investment properties 10 7,176,769 7,432,450 Long-term investments 11 2,132,047 1,565,041 Long-term loans and deposits 12 11,803 10,282 Long-term prepayments 13 55,946 65,002 Deferred tax asset - net 14 28,612 26,754 10,699,281 10,459,844
CURRENT ASSETS Stores, spares and loose tools 15 91,026 85,756 Stock-in-trade 16 2,543,659 3,386,559 Trade debts - unsecured 17 1,210,643 942,975 Loans, advances, deposits, prepayments and other receivables 18 151,654 140,460 Short-term investments 19 5,053,988 3,121,623 Accrued profit on bank deposits 4,053 2,961 Income tax - net 20 173,214 296,027 Sales tax refundable 31,219 83,505 Cash and bank balances 21 645,884 520,971 9,905,340 8,580,837 TOTAL ASSETS 20,604,621 19,040,681
EQUITY AND LIABILITIES SHARE CAPITAL AND RESERVES Authorised capital 100,000,000 (2014: 100,000,000) ordinary shares of Rs. 5/- each 500,000 500,000 Issued, subscribed and paid-up capital 22 405,150 405,150 Share deposit money 12 12 Reserves 23 12,214,199 10,542,041
Equity attributable to equity holders of the Holding Company 12,619,361 10,947,203 Non-controlling interest 24 5,790,139 5,664,797 Total equity 18,409,500 16,612,000
NON-CURRENT LIABILITIES Long term security deposits 25 309,708 308,119 CURRENT LIABILITIES Trade and other payables 26 1,847,549 2,032,477 Short-term borrowings - secured 27 23,807 74,059 Deferred income 28 14,002 13,995 Accrued markup 55 31 1,885,413 2,120,562 CONTINGENCIES AND COMMITMENTS 29 TOTAL EQUITY AND LIABILITIES 20,604,621 19,040,681
The annexed notes from 1 to 51 form an integral part of these consolidated financial statements.
ASIF RIZVICHIEF EXECUTIVE
SOHAIL P. AHMEDVICE CHAIRMAN
Annual Report 2015130

Consolidated Profit and Loss AccountFor the year ended June 30, 2015
Note 2015 2014 (Rupees in ‘000)
Revenue - net 30 18,938,928 14,281,453
Cost of sales 31 15,504,550 12,162,341
Gross profit 3,434,378 2,119,112
Distribution costs 32 (237,708) (185,024)Administrative expenses 33 (1,268,432) (1,118,208) (1,506,140) (1,303,232)
Other income 34 1,809,850 1,682,977
Operating profit 3,738,088 2,498,857
Finance costs 35 (17,405) (5,543)Other charges 36 (244,959) (177,220) (262,364) (182,763) 3,475,724 2,316,094
Share of net profit / (loss) of associates - after tax 11.1 489,860 (100,622)
Profit before taxation 3,965,584 2,215,472
Taxation 37 (1,192,345) (716,501)
Profit after taxation 2,773,239 1,498,971
Attributable to - Equity holders of Holding Company 2,469,418 1,268,114 - Non-controlling interest 303,821 230,857 2,773,239 1,498,971
(Rupees)
Basic and diluted earnings per share attributable to the equity holders of the Holding Company 38 30.48 15.65
The annexed notes from 1 to 51 form an integral part of these consolidated financial statements.
ASIF RIZVICHIEF EXECUTIVE
SOHAIL P. AHMEDVICE CHAIRMAN
Growth Through Innovation 131

Consolidated Statement of Comprehensive IncomeFor the year ended June 30, 2015
Note 2015 2014 (Rupees in ‘000)
Profit after taxation 2,773,239 1,498,971
Other comprehensive income Items to be reclassified to profit and loss account in subsequent periods: Share of unrealized gain on revaluation of foreign exchange contracts of an associate - 1,448 Gain on revaluation of available-for-sale investments 13,187 23,401 13,187 24,849 Items not to be reclassified to profit and loss account in subsequent periods: Share of actuarial loss on remeasurement of defined benefit plans of associates (146) (107)
Total comprehensive income for the year 2,786,280 1,523,713
Attributable to - Equity holders of the Holding Company 2,482,459 1,292,856 - Non-controlling interest 303,821 230,857 2,786,280 1,523,713
The annexed notes from 1 to 51 form an integral part of these consolidated financial statements.
Annual Report 2015132
ASIF RIZVICHIEF EXECUTIVE
SOHAIL P. AHMEDVICE CHAIRMAN
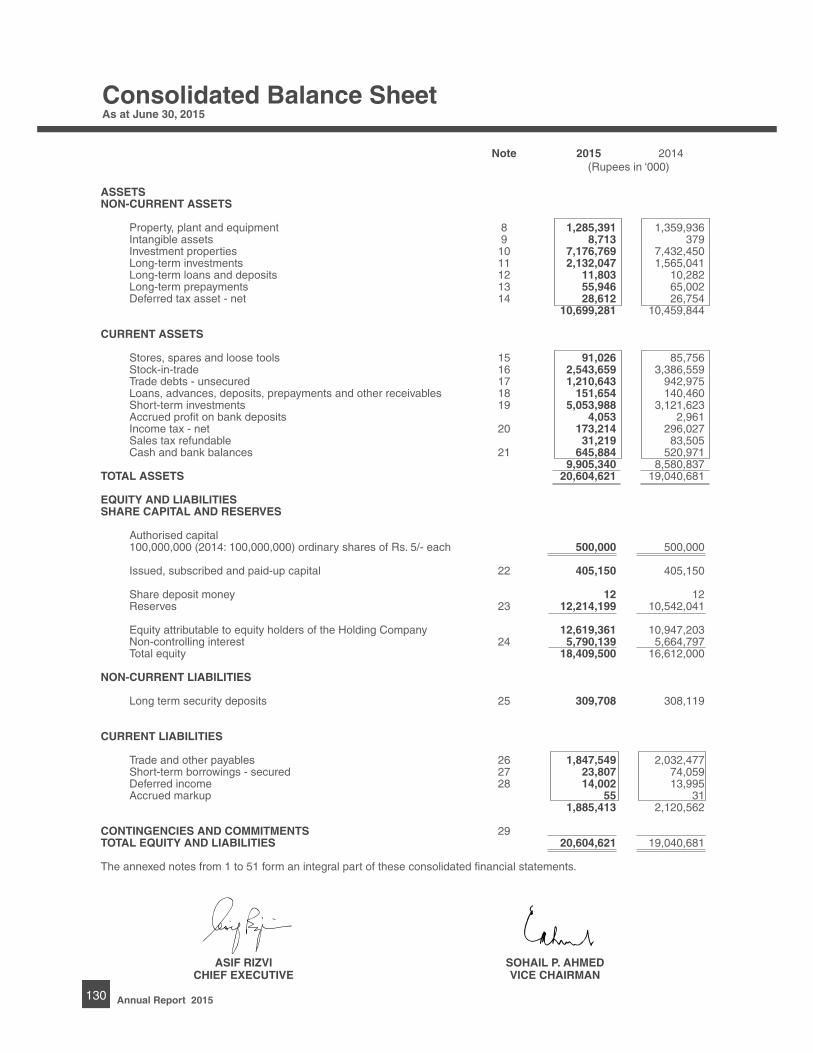
Consolidated Cash Flow StatementFor the year ended June 30, 2015
Note 2015 2014 (Rupees in ‘000)
CASH FLOWS FROM OPERATING ACTIVITIES Cash generated from operations 39 4,029,031 2,071,173 Finance costs paid (16,851) (5,426) Retirement benefits paid (3,529) (3,331) Income tax paid (1,070,201) (952,583) Net cash generated from operating activities 2,938,450 1,109,833
CASH FLOWS FROM INVESTING ACTIVITIES Fixed capital expenditure (137,166) (387,926) Long term loans and deposits 2,258 731 Dividends received 338,704 127,716 Profit received 222,287 191,767 Proceeds from disposal of property, plant and equipment 13,671 24,070 Investment in equities (396,669) - (Purchase) / redemption of short term investments (240,434) 1,039,686 Net cash (used in) / generated from investing activities (197,349) 996,044
CASH FLOWS FROM FINANCING ACTIVITIES Issue of share capital - 85,500 Dividends paid (971,817) (1,151,019) Long term deposit 1,589 967 Net cash used in financing activities (970,228) (1,064,552)
NET INCREASE IN CASH AND CASH EQUIVALENTS 1,770,873 1,041,325
CASH AND CASH EQUIVALENTS AT THE BEGINNING OF THE YEAR 3,485,412 2,444,087
CASH AND CASH EQUIVALENTS AT THE END OF THE YEAR 40 5,256,285 3,485,412
The annexed notes from 1 to 51 form an integral part of these consolidated financial statements.
Growth Through Innovation 133
ASIF RIZVICHIEF EXECUTIVE
SOHAIL P. AHMEDVICE CHAIRMAN

Consolidated Statement of Changes in EquityFor the year ended June 30, 2015
Balance as at June 30, 2013 405,150 12 67,929 7,134,874 2,988,785 (1,448) 71,920 5,501,071 16,168,293
Profit for the year - - - - 1,268,114 - - 230,857 1,498,971
Other comprehensive income - - - - (107) 1,448 23,401 - 24,742 Total comprehensive income - - - - 1,268,007 1,448 23,401 230,857 1,523,713
Transfer to general reserve - - - 814,000 (814,000) - - - -
Transaction with owners, recorded directly in equity Final dividend @ Rs. 7.50/- per share for the year ended June 30, 2013 - - - - (607,725) - - - (607,725)
Interim dividend @ Rs. 2.50/- per share for the period ended December 31, 2013 - - - - (202,575) - - - (202,575)
Interim dividend @ Rs. 2.50/- per share for the period ended March 31, 2014 - - - - (202,575) - - - (202,575)
Subsidiary company Final dividend @ Rs. 0.31/- per share for the year ended June 30, 2013 - - - - - - - (42,171) (42,171)
Interim dividend @ Rs. 0.812/- per share for the year ended June 30, 2014 - - - - - - - (110,460) (110,460)
Shares issued by subsidiary to non controlling interest holders - - - - - - - 85,500 85,500 - - - - (1,012,875) - - (67,131) (1,080,006)
Balance as at June 30, 2014 405,150 12 67,929 7,948,874 2,429,917 - 95,321 5,664,797 16,612,000
Profit for the year - - - - 2,469,418 - - 303,821 2,773,239
Other comprehensive income - - - - (146) - 13,187 - 13,041 Total comprehensive income - - - - 2,469,272 - 13,187 303,821 2,786,280
Transfer to general reserve - - - 754,000 (754,000) - - - -
Transaction with owners, recorded directly in equity Final dividend @ Rs. 2.50/- per share for the year ended June 30, 2014 - - - - (202,575) - - - (202,575)
Interim dividend @ Rs. 3.75/- per share for the period ended December 31, 2014 - - - - (303,863) - - - (303,863)
Interim dividend @ Rs. 3.75/- per share for the period ended March 31, 2015 - - - - (303,863) - - - (303,863)
Subsidiary company Final dividend @ Rs. 0.242/- per share for the year ended June 30, 2014 - - - - - - - (32,920) (32,920)
Interim dividend @ Rs. 1.07/- per share for the year ended June 30, 2015 (145,559) (145,559) - - - - (810,301) - - (178,479) (988,780)
Balance as at June 30, 2015 405,150 12 67,929 8,702,874 3,334,888 - 108,508 5,790,139 18,409,500
The annexed notes from 1 to 51 form an integral part of these consolidated financial statements.
Issued,subscribe and paid-up capital
Share depositmoney
Capital reserves
General reserve
Unrealised gain / (loss) on hedging instruments
Gain onchanges in fair value of
availablefor sale
investments
Non-controlling
interestTotal
equityUnappropriated
profit
(Rupees in ‘000)
Reserves
Annual Report 2015134
ASIF RIZVICHIEF EXECUTIVE
SOHAIL P. AHMEDVICE CHAIRMAN

Notes to the Consolidated Financial StatementsFor the year ended June 30, 2015
1. THE HOLDING COMPANY AND ITS OPERATIONS
1.1 Thal Limited (the Holding Company) was incorporated on January 31, 1966 as a public company limited by shares under the Companies Act, 1913 (now the Companies Ordinance, 1984) and is listed on the Karachi and Lahore Stock Exchanges.
The Holding Company is engaged in the manufacture of jute goods, engineering goods, papersack and laminate sheets. The jute operations are located at Muzaffargarh, engineering operations at Karachi, papersack operations at Hub and Gadoon and laminate operations located at Hub. The registered office of the Holding Company is situated at 4th Floor, House of Habib, 3-Jinnah Co-operative Housing Society, Block 7/8, Sharae Faisal, Karachi.
1.2 The Group comprises of the Holding Company and the following subsidiaries that have been consolidated in these financial statements:
Date of Holding Total Total Total Total becoming assets liabilities assets liabilities Note subsidiary 2015 2014 2015 2014 Subsidiary Companies % % (Rupees in ‘000s) (Rupees in ‘000s) Noble Computer Services (Private) Limited 1.2.1 01-07-2005 100 100 134,484 31,666 121,689 30,485 Pakistan Industrial Aids (Private) Limited 1.2.2 27-03-2006 100 100 28,867 4,584 24,693 1,370 Makro-Habib Pakistan Limited 1.2.3 01-05-2008 100 100 1,004,657 318,170 1,088,576 388,770 A-One Enterprises (Private) Limited 1.2.4 16-12-2011 100 100 180,160 5,097 180,725 5,087 Habib METRO Pakistan (Private) Limited 1.2.5 16-12-2011 60 60 8,894,549 451,152 8,633,873 433,511 Thal Boshoku Pakistan (Private) Limited 1.2.6 03-09-2013 55 55 306,426 70,670 282,365 109,117 Thal Power (Private) Limited 1.2.7 03-07-2014 100 - 85 75 - -
1.2.1 Noble Computer Services (Private) Limited
Noble Computer Services (Private) Limited was incorporated in Pakistan on May 08, 1983 as a private limited company. The subsidiary is engaged in providing share registrar and related accounting services, share floatation services, data entry services and internal audit services.
1.2.2 Pakistan Industrial Aids (Private) Limited
Pakistan Industrial Aids (Private) Limited was incorporated in Pakistan on March 17, 2006 as a private limited company. The subsidiary is engaged in trading of various products.
1.2.3 Makro-Habib Pakistan Limited (MHPL)
(a) MHPL was incorporated in Pakistan on June 29, 2005 as a public limited (unlisted) company. The MHPL was an associated undertaking of the Holding Company until April 30, 2008 and became a subsidiary company with effect from May 01, 2008. The subsidiary is engaged in wholesale / retail cash and carry business.
(b) The MHPL has entered into Arrangement with METRO Habib Cash & Carry Pakistan (Private) Limited (MHCCP) (then a wholly owned subsidiary of METRO Cash and Carry International Holding BV) (the Operator) whereby the Operator has been engaged to operate the AWT Saddar Store (the Store) for an operations fee determined under the agreed mechanism. The Operator has agreed to operate the Store safely and efficiently and in accordance with the standards of a reasonable and prudent Operator; and to perform the services under the Agreement (the Services) entirely at its own cost and expense ensuring that in performing the Services it shall not cause MHPL to be in breach of any of the obligations under the lease deed relating to the Store and those obligations which relate to or are affected by the Services under any of the applicable laws.
1.2.4 A-One Enterprises (Private) Limited A-One Enterprises (Private) Limited was incorporated in Pakistan on December 16, 2011 as a private limited
company. The subsidiary owns a land at Multan road, Lahore.
Growth Through Innovation 135

Notes to the Consolidated Financial StatementsFor the year ended June 30, 2015
1.2.5 Habib METRO Pakistan (Private) Limited
Habib METRO Pakistan (Private) Limited (the Company) was incorporated in Pakistan as a private limited company on December 16, 2011 under the Companies Ordinance, 1984. The main business of the Company is to own and manage properties.
1.2.6 Thal Boshoku Pakistan (Private) Limited (TBPPL)
(a) TBPPL was incorporated on September 03, 2013 as a private company limited by shares under the Companies Ordinance, 1984. The principle activity of TBPPL is to manufacture automobile seats, seat parts, air cleaner and other automobile parts. TBPPL has started commercial production during the year. The registered office of TBPPL is situated at 4th Floor, House of Habib, 3-Jinnah Co-operative Housing Society, Block 7/8, Sharah-e-Faisal, Karachi.
(b) The Company was formed pursuant to a Joint Venture Agreement between Thal Limited (the Holding Company), Toyota Boshoku Corporation, Japan and Toyota Tsusho Corporation, Japan.
1.2.7 Thal Power (Private) Limited (TPPL)
TPPL was incorporated in Pakistan under the Companies Ordinance, 1984 as a private limited company on 03 July 2014. TPPL will be engaged in generating, supplying, converting, transforming, importing, exporting and dealing in electricity and all other forms of energy and electricity generation. TPPL has not started commercial production as at or subsequent to the balance sheet date. The registered office of TPPL is situated at 4th floor, House of Habib, 3-Jinnah Co-operative Housing Society, Block 7/8, Shahrah-e-Faisal, Karachi.
2. STATEMENT OF COMPLIANCE These consolidated financial statements have been prepared in accordance with approved accounting
standards as applicable in Pakistan. Approved accounting standards comprise of such International Financial Reporting Standards (IFRSs) issued by the International Accounting Standards Board and Islamic Financial Accounting Standards (IFASs) issued by the Institute of Chartered Accountants of Pakistan as are notified under the Companies Ordinance, 1984, provisions of and directives issued under the Companies Ordinance, 1984. In case requirements differ, the provisions or directives of the Companies Ordinance, 1984 shall prevail.
3. BASIS OF MEASUREMENT
3.1 These consolidated financial statements have been prepared under the historical cost convention, except for available for sale financial assets and financial assets designated as fair value through profit or loss account which are stated at fair value as required under IAS – 39 “Financial Instruments: Recognition and Measurement”.
3.2 These consolidated financial statements are presented in Pak Rupees which is also the Group’s functional currency.
4. BASIS OF CONSOLIDATION
The consolidated financial statements comprise the financial statements of the Holding Company and its subsidiaries as at 30 June 2015.
Subsidiaries are fully consolidated from the date of acquisition, being the date on which the Group obtains control, and continue to be consolidated until the date when such control ceases. The financial statements of the subsidiaries are prepared for the same reporting period as the Holding Company, using consistent accounting policies. All intra-group balances, transactions, unrealised gains and losses resulting from intra-group transactions and dividends are eliminated in full.
Non-controlling interest in the net assets and profit or loss of subsidiaries are identified and reported separately from
the Holding Company’s ownership interest.
Losses within a subsidiary are attributed to the non-controlling interest even if that results in a deficit balance.
A change in the ownership interest of a subsidiary, without a loss of control, is accounted for as an equity transaction.
Annual Report 2015136

Notes to the Consolidated Financial StatementsFor the year ended June 30, 2015
5. SUMMARY OF SIGNIFICANT ACCOUNTING POLICIES
5.1 New and amended standards and interpretations
The Group has adopted the following revised standard, amendments and interpretation of IFRSs which became effective for the current year:
IAS 19 – Employee Benefits – (Amendment) – Defined Benefit Plans: Employee Contributions IAS 32 – Financial Instruments: Presentation – (Amendment) – Offsetting Financial Assets and Financial Liabilities IAS 36 – Impairment of Assets – (Amendment) – Recoverable Amount Disclosures for Non-Financial Assets
IAS 39 – Financial Instruments: Recognition and Measurement – (Amendment) Novation of Derivatives and Novation of Derivatives and Continuation of Hedge Accounting
IFRIC 21 – Levies
The adoption of the above amendments, improvements to accounting standards and interpretations did not have any effect on the consolidated financial statements.
In addition to the above standards and interpretations, certain improvements to various accounting standards have also been issued by the IASB and are generally effective for current period. The Group expects that such improvements to the standards do not have any impact on the Group’s financial statements for the period.
5.2 Current versus not-current classification
The Group presents assets and liabilities in balance sheet based on current / non-current classification. An asset as current when it is:
- Expected to be realised or intended to be sold or consumed in normal operating cycle; - Held primarily for the purpose of trading; - Expected to be realised within twelve months after the reporting period; or - Cash or cash equivalent unless restricted from being exchanged or used to settle a liability for at least twelve months after the reporting period.
All other assets are classified as non-current. A liability is current when:
- It is expected to be settled in normal operating cycle; - It is held primarily for the purpose of trading; - It is due to be settled within twelve months after the reporting period; or - There is no unconditional right to defer the settlement of the liability for at least twelve months after the reporting period.
The Group classifies all other liabilities as non-current. Deferred tax assets and liabilities are classified as non-current assets and liabilities.
5.3 Property, plant and equipment
(a) Owned
These are stated at cost less accumulated depreciation and impairment loss except for freehold land and capital work-in-progress which are stated at cost.
Depreciation is charged to the consolidated profit and loss account applying the reducing balance method except for computer equipment and jigs and fixtures which are depreciated on straight line method at the rates specified in note 8 to the consolidated financial statements. Depreciation on additions is charged from the month of addition and in case of deletion, up to the month preceding the month of disposal.
Maintenance and normal repairs are charged to consolidated profit and loss account as and when incurred.
Major renewals and improvements are capitalized and the assets so replaced, if any, are retired.
An item of property, plant and equipment and any significant part initially recognised is derecognised upon disposal or when no future economic benefits are expected from its use or disposal. Any gain or loss arising on derecognition of the asset (calculated as the difference between the net disposal proceeds and the carrying amount of the asset) is included in the profit and loss account when the asset is derecognised.
Growth Through Innovation 137

Notes to the Consolidated Financial StatementsFor the year ended June 30, 2015
The residual values, useful lives and methods of depreciation of property, plant and equipment are reviewed at each financial year end and adjusted prospectively, if appropriate.
Leasehold land is amortised in equal installments over the lease period.
(b) Leased
Assets held under finance leases are initially recorded at the lower of the present value of minimum lease payments under the lease agreements and the fair value of the leased assets. The related obligations under the lease less financial charges allocated to future periods are recorded as a liability.
These financial charges relating to the lease are allocated to accounting periods in a manner so as to provide a constant periodic rate of interest on the outstanding liability.
Depreciation is charged at the same rates as charged on the Holding Company’s owned assets.
5.4 Intangible assets
Intangible assets are stated at cost less accumulated amortization and accumulated impairment losses (if any).
Costs in relation to intangible assets are only capitalized when it is probable that future economic benefits attributable to that asset will flow to the Group and the same is amortized applying the straight line method at the rates stated in note 9.
5.5 Investment properties
Investment properties are stated at cost less accumulated depreciation and impairment, if any. Depreciation is charged on reducing balance method at the rate specified in note 10.
5.6 Impairment of non-financial assets
The carrying values of assets are reviewed for impairment when events or changes in circumstances indicate that the carrying value may not be recoverable. If any such indication exists and where the carrying values exceed the estimated recoverable amount, the assets or related cash-generating units are written down to their recoverable amount.
5.7 Leases and licenses
The Group is the lessee (operating leases)
Leases where a significant portion of the risks and rewards of ownership are retained by the lessor are classified as operating leases. Payments made under operating leases (net of any incentives received from the lessor) are charged to profit and loss account on a straight line basis over the lease term.
The Group is the licensor
Such income (net of any incentives given to the lessees) is through licence agreements and is recognised on a straight line basis over the lease term.
5.8 Investments
Associates
Investments in associates are accounted for using the equity method, whereby the investment is initially recorded at cost and adjusted thereafter for the post acquisition change in the Group’s share of the net assets of the associate. The consolidated profit and loss account reflects the Group’s share of the results of the operations of the associate.
The Group determines at each reporting date whether there is any objective evidence that the investment in the associate is impaired. If this is the case the Group calculates the amount of impairment as the difference between the recoverable amount of the associate and its carrying value and recognises the same in the profit and loss account.
Annual Report 2015138
Notes to the Consolidated Financial StatementsFor the year ended June 30, 2015
Others
Held-to-maturity
These represent non-derivative financial assets with fixed or determinable payments and fixed maturities in respect of which the Group has the positive intent and ability to hold till maturity. These investments are recognized initially at fair value plus directly attributable costs and are subsequently measured at amortized cost using effective interest rate method. Gains and losses are recognized in profit and loss account when the investments are derecognized or impaired, as well as through the amortization process.
Designated investments at fair value through profit or loss
Designated investments at fair value through profit or loss are initially recognized at fair value. Subsequently, these are measured at fair value whereas effects of changes in fair value are taken to the profit and loss account.
Available-for-sale
These are non-derivative financial assets which are intended to be held for an indefinite period of time but may be sold in response to the need for liquidity or changes in interest rates.
Quoted
These investments are initially measured at fair value plus transaction costs and subsequently carried at fair value. Changes in fair value are taken to a separate component of other comprehensive income until the investment is derecognized or determined to be impaired, at which time the cumulative gain or loss recorded in other comprehensive income is recognized in profit and loss account.
Un-Quoted
These investments are recorded at cost less accumulated impairment losses, if any.
5.9 Stores, spares and loose tools
Stores, spares and loose tools are stated at cost which is determined by the weighted moving average cost method except for those in transit which are valued at actual cost. Provision is made annually for slow moving and obsolete items.
5.10 Stock-in-trade
Stock-in-trade, except goods-in-transit, is stated at the lower of Net Realisable Value (NRV) and cost determined as follows:
Raw and packing materials - Purchase cost or weighted moving average basis. Work-in-process - Cost of materials, labour cost and appropriate production overheads.
Finished goods - Cost of materials, labour cost and appropriate production overheads.
Goods-in-transit are valued at purchase price, freight value and other charges incurred thereon upto the balance sheet date.
NRV signifies the estimated selling price in the ordinary course of business less the estimated costs of completion and the estimated costs necessary to make the sale.
5.11 Trade debts and other receivables Trade debts originated by the Group are recognized and carried at original invoice amount less provision for
impairment. Provision for impairment is based on the management’s assessment of customers’ outstandings and creditworthiness. Bad debts are written-off as and when identified.
Other receivables are carried at cost less provision for impairment, if any.
Growth Through Innovation 139

Notes to the Consolidated Financial StatementsFor the year ended June 30, 2015
5.12 Ijarah rentals Ijarah payments for assets under Ijarah arrangements are recognised as an expense in the profit and loss
account on a straight line basis over the Ijarah term.
5.13 Cash and cash equivalents
For the purpose of cash flow statement, cash and cash equivalents comprise of cash in hand, bank balances and short term investments with a maturity of three months or less from the date of acquisition net of short-term borrowings. The cash and cash equivalents are readily convertible to known amount of cash and are therefore subject to insignificant risk of changes in value.
5.14 Taxation (a) Current The charge for current taxation in respect of certain income streams of the Group is based on Final Tax Regime
at the applicable tax rates and remaining income streams at current rate of taxation under the normal tax regime after taking into account tax credits and rebates available, if any, or 1% of turnover or 17% alternate corporate tax, whichever is higher. The Group had also availed Group tax relief under the provisions of Section 59AA and 59B of the Income Tax Ordinance, 2001 as explained in note 20 to the consolidated financial statements.
(b) Deferred
Deferred tax is provided using the balance sheet liability method, on all temporary differences at the balance sheet date between the tax basis of assets and liabilities and their carrying amount for financial reporting purposes.
Deferred tax liabilities are recognised for all taxable temporary differences. Deferred tax assets are recognised for all deductible temporary differences, carry-forward of unused tax assets and unused tax losses, to the extent that it is probable that taxable profit will be available against which the deductible temporary differences, carry forward of unused tax assets and unused tax losses can be utilized.
The carrying amount of deferred tax assets is reviewed at each balance sheet date and reduced to the extent that it is no longer probable that sufficient taxable profit will be available to allow all or part of the deferred income tax assets to be utilized. Unrecognised deferred tax assets are re-assessed at each balance sheet date and are recognised to the extent that it has become probable that future taxable profit will allow deferred tax asset to be recovered.
Deferred tax assets and liabilities are measured at the tax rates that are expected to apply to the period when the asset is realized or the liability is settled, based on tax rates (and tax laws) that have been enacted or substantively enacted at the balance sheet date.
5.15 Trade and other payables Liabilities for trade and other amounts payable are carried at cost which is the fair value of the consideration to be
paid in the future for goods and services received, whether or not billed to the Group.
5.16 Borrowing costs
Borrowing costs that are directly attributable to the acquisition and construction of assets and incurred during the period in connection with the activities necessary to prepare the asset for its intended use are capitalised as a part of the cost of related asset.
All other borrowing costs are recognised as an expense in the period in which they are incurred.
Annual Report 2015140
Notes to the Consolidated Financial StatementsFor the year ended June 30, 2015
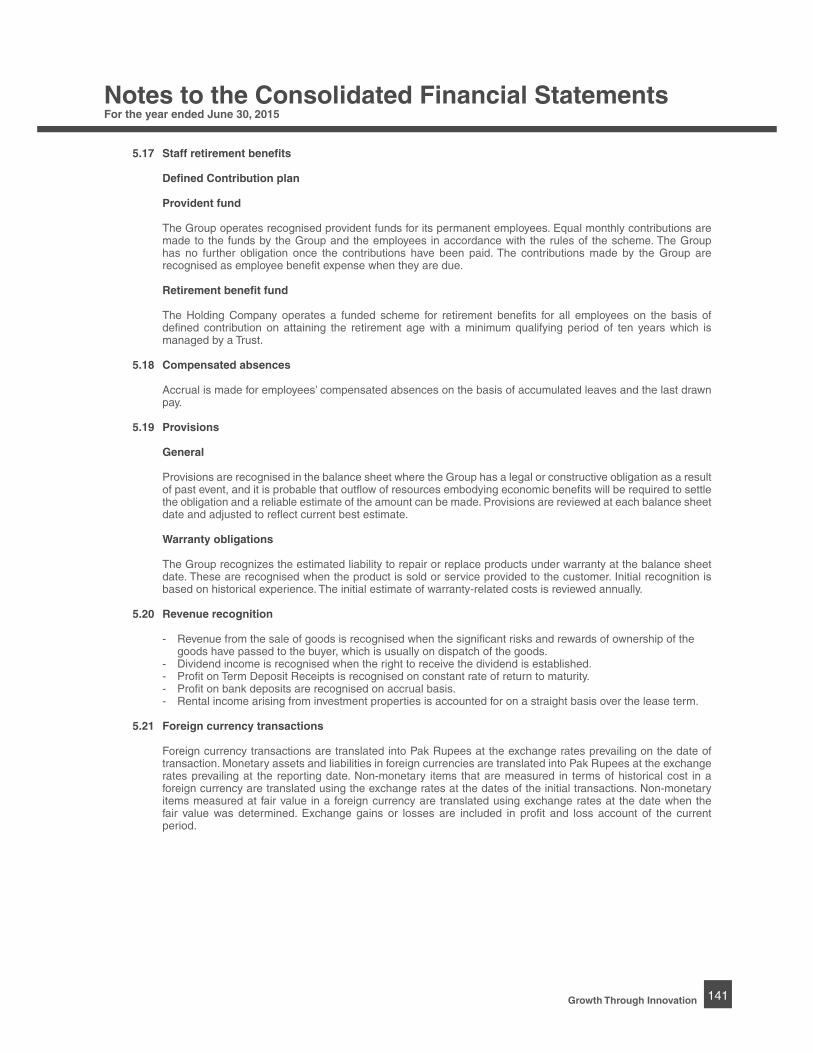
5.17 Staff retirement benefits
Defined Contribution plan
Provident fund
The Group operates recognised provident funds for its permanent employees. Equal monthly contributions are made to the funds by the Group and the employees in accordance with the rules of the scheme. The Group has no further obligation once the contributions have been paid. The contributions made by the Group are recognised as employee benefit expense when they are due.
Retirement benefit fund
The Holding Company operates a funded scheme for retirement benefits for all employees on the basis of defined contribution on attaining the retirement age with a minimum qualifying period of ten years which is managed by a Trust.
5.18 Compensated absences
Accrual is made for employees’ compensated absences on the basis of accumulated leaves and the last drawn pay.
5.19 Provisions
General
Provisions are recognised in the balance sheet where the Group has a legal or constructive obligation as a result of past event, and it is probable that outflow of resources embodying economic benefits will be required to settle the obligation and a reliable estimate of the amount can be made. Provisions are reviewed at each balance sheet date and adjusted to reflect current best estimate.
Warranty obligations
The Group recognizes the estimated liability to repair or replace products under warranty at the balance sheet date. These are recognised when the product is sold or service provided to the customer. Initial recognition is based on historical experience. The initial estimate of warranty-related costs is reviewed annually.
5.20 Revenue recognition - Revenue from the sale of goods is recognised when the significant risks and rewards of ownership of the goods have passed to the buyer, which is usually on dispatch of the goods. - Dividend income is recognised when the right to receive the dividend is established.
- Profit on Term Deposit Receipts is recognised on constant rate of return to maturity. - Profit on bank deposits are recognised on accrual basis. - Rental income arising from investment properties is accounted for on a straight basis over the lease term.
5.21 Foreign currency transactions
Foreign currency transactions are translated into Pak Rupees at the exchange rates prevailing on the date of transaction. Monetary assets and liabilities in foreign currencies are translated into Pak Rupees at the exchange rates prevailing at the reporting date. Non-monetary items that are measured in terms of historical cost in a foreign currency are translated using the exchange rates at the dates of the initial transactions. Non-monetary items measured at fair value in a foreign currency are translated using exchange rates at the date when the fair value was determined. Exchange gains or losses are included in profit and loss account of the current period.
Growth Through Innovation 141

Notes to the Consolidated Financial StatementsFor the year ended June 30, 2015
5.22 Financial instruments
Financial assets and financial liabilities
Financial assets and financial liabilities are recognised at the time when the Group becomes a party to the contractual provision of the instrument. Financial assets are de-recognised when the contractual right to future cash flows from the asset expires or is transferred along with the risk and reward of ownership of the asset. Financial liabilities are de-recognised when obligation is discharged, cancelled or expired. Any gain or loss on de-recognition of the financial asset and liability is recognized in the profit and loss account of the current period.
Offsetting Financial assets and financial liabilities are set off and the net amount is reported in the financial statements only
when the Group has a legally enforceable right to set off and the Group intends to either settle on a net basis, or to realize the assets and to settle the liabilities simultaneously. Income and expense items of such assets and liabilities are also offset and the net amount is reported in the consolidated financial statements.
5.23 Research and development expenditure
Research expenditure is recognised as an expense as incurred. Costs incurred on development projects are recognised as intangible assets to the extent that such expenditure is expected to generate future economic benefits. Other development expenditure is recognised as an expense as incurred.
5.24 Dividends and appropriation to reserves
Dividend and appropriation to reserves are recognised in the consolidated financial statements in the period in which these are approved.
6. SIGNIFICANT ACCOUNTING JUDGEMENTS, ESTIMATES AND ASSUMPTIONS
The preparation of the Group’s financial statements requires management to make judgments, estimates and assumptions that affect the reported amounts of revenues, expenses, assets and liabilities, and the disclosure of contingent liabilities, at the end of the reporting period. However, uncertainty about these assumptions and estimates could result in outcomes that require a material adjustment to the carrying amount of the asset or liability affected in future periods. In the process of applying the accounting policies, management has made the following judgments, estimates and assumptions which are significant to the consolidated financial statements:
Notes
- determining the residual values, useful lives and impairment of property, plant and equipment 5.3 & 8 - intangibles 5.4 & 9 - valuation of inventories 5.9, 5.10, 15 &16 - provision against trade debts 5.11 & 17 - provision for tax and deferred tax 5.14, 14 & 37 - warranty obligations 5.19 & 26.3 - impairment of non financial assets 5.6 - contingencies 29
Annual Report 2015142
Notes to the Consolidated Financial StatementsFor the year ended June 30, 2015
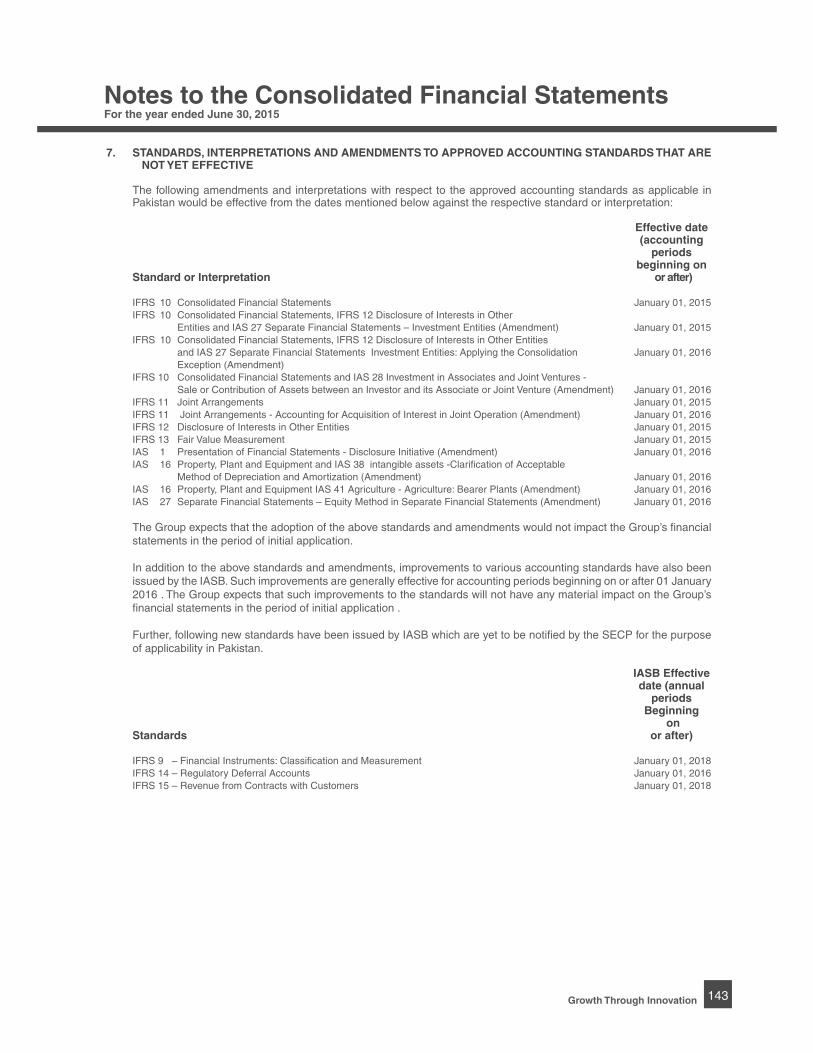
7. STANDARDS, INTERPRETATIONS AND AMENDMENTS TO APPROVED ACCOUNTING STANDARDS THAT ARE NOT YET EFFECTIVE
The following amendments and interpretations with respect to the approved accounting standards as applicable in
Pakistan would be effective from the dates mentioned below against the respective standard or interpretation:
Effective date (accounting periods beginning on Standard or Interpretation or after) IFRS 10 Consolidated Financial Statements January 01, 2015 IFRS 10 Consolidated Financial Statements, IFRS 12 Disclosure of Interests in Other Entities and IAS 27 Separate Financial Statements – Investment Entities (Amendment) January 01, 2015
IFRS 10 Consolidated Financial Statements, IFRS 12 Disclosure of Interests in Other Entities and IAS 27 Separate Financial Statements Investment Entities: Applying the Consolidation January 01, 2016 Exception (Amendment) IFRS 10 Consolidated Financial Statements and IAS 28 Investment in Associates and Joint Ventures - Sale or Contribution of Assets between an Investor and its Associate or Joint Venture (Amendment) January 01, 2016
IFRS 11 Joint Arrangements January 01, 2015 IFRS 11 Joint Arrangements - Accounting for Acquisition of Interest in Joint Operation (Amendment) January 01, 2016 IFRS 12 Disclosure of Interests in Other Entities January 01, 2015
IFRS 13 Fair Value Measurement January 01, 2015 IAS 1 Presentation of Financial Statements - Disclosure Initiative (Amendment) January 01, 2016
IAS 16 Property, Plant and Equipment and IAS 38 intangible assets -Clarification of Acceptable Method of Depreciation and Amortization (Amendment) January 01, 2016 IAS 16 Property, Plant and Equipment IAS 41 Agriculture - Agriculture: Bearer Plants (Amendment) January 01, 2016 IAS 27 Separate Financial Statements – Equity Method in Separate Financial Statements (Amendment) January 01, 2016
The Group expects that the adoption of the above standards and amendments would not impact the Group’s financial statements in the period of initial application.
In addition to the above standards and amendments, improvements to various accounting standards have also been issued by the IASB. Such improvements are generally effective for accounting periods beginning on or after 01 January 2016 . The Group expects that such improvements to the standards will not have any material impact on the Group’s financial statements in the period of initial application .
Further, following new standards have been issued by IASB which are yet to be notified by the SECP for the purpose of applicability in Pakistan.
IASB Effective date (annual periods
Beginning on
Standards or after)
IFRS 9 – Financial Instruments: Classification and Measurement January 01, 2018 IFRS 14 – Regulatory Deferral Accounts January 01, 2016 IFRS 15 – Revenue from Contracts with Customers January 01, 2018
Growth Through Innovation 143

N
ote
20
15
2014
(R
upee
s in
‘000
)
8.
P
RO
PE
RT
Y, P
LA
NT
AN
D E
QU
IPM
EN
T
Ope
ratin
g fix
ed a
sset
s
8.1
1,2
64,0
98
1,1
82,0
36
Cap
ital w
ork-
in-p
rogr
ess
8.
5 2
1,29
3
177
,900
1,
285,
391
1
,359
,936
8.
1
Sta
tem
ent
of
op
erat
ing
fix
ed a
sset
s
C
O
S
T
D E
P R
E C
I A
T I
O N
As
at
As
at
A
s at
A
s at
W
ritt
en d
ow
n
Ju
ly 0
1,
Jun
e 30
, R
ate
July
01,
D
epre
ciat
ion
O
n
Jun
e 30
, va
lue
as a
t
2014
A
dd
itio
ns
Dis
po
sals
20
15
%
2014
fo
r th
e ye
ar
dis
po
sals
20
15
Jun
e 30
, 201
5
(Rup
ees
in ‘0
00)
(R
upee
s in
‘000
)
O
wn
ed:
Land
- F
reeh
old
203
,753
-
-
2
03,7
53
-
-
-
-
-
203
,753
- Le
aseh
old
4
5,38
1
-
-
45,
381
1.
69-3
.33
5,5
91
1,4
49
-
7
,040
3
8,34
1
B
uild
ing
on fr
eeho
ld la
nd
-
Fact
ory
build
ing
270
,035
1
7,55
8
-
2
87,5
93
10
149
,814
1
2,94
4
-
1
62,7
58
124
,835
- N
on fa
ctor
y bu
ildin
g 4
71,9
79
-
-
471
,979
5
-10
1
63,4
50
25,
024
-
188
,474
2
83,5
05
R
ailw
ay s
lidin
g 7
92
-
-
792
5
712
4
-
716
7
6
P
lant
and
mac
hine
ry
1,2
32,5
42
134
,024
-
1
,366
,566
1
0-30
8
30,3
99
95,
461
-
925
,860
4
40,7
06
F
urni
ture
and
fitti
ngs
29,
996
2
,806
-
32,
802
1
5-20
1
8,66
0
2,2
82
-
2
0,94
2
11,
860
V
ehic
les
88,
005
33
,212
(
16,1
97)
1
05,0
20
20
48,
707
1
0,84
0
(8,
975)
5
0,57
2
54,
448
O
ffice
and
mill
s eq
uipm
ent
62,
103
1
2,15
9
(487
)
73,
775
10
-30
3
8,28
2
5,0
90
(42
9)
42,
943
3
0,83
2
C
ompu
ter
equi
pmen
t 6
9,08
6
25,
347
(
1,45
7)
92,
976
33
5
9,99
6
9,0
67
(1,
447)
6
7,61
6
25,
360
Ji
gs a
nd fi
xtur
es
144
,320
5
2,00
9
-
1
96,3
29
33
120
,345
2
5,60
2
-
1
45,9
47
50,
382
20
15
2,6
17,9
92
277,
115
(
18,1
41)
2
,876
,966
1,43
5,95
6
187
,763
(
10,8
51)
1
,612
,868
1
,264
,098
8.1.
1 A
dditi
ons
incl
ude
tran
sfer
s fr
om c
apita
l wor
k in
pro
gres
s am
ount
ing
to R
s. 2
14.7
17 m
illio
n (2
014:
Rs.
73.
111
mill
ion)
.
8.1.
2 F
ixed
ass
ets
incl
ude
mou
lds
havi
ng b
ook
valu
e of
Rs.
0.3
27 m
illio
n (2
014:
Rs.
0.2
1 m
illio
n) in
the
poss
essi
on o
f sub
-con
trac
tors
.
No
tes
to t
he
Co
nso
lidat
ed F
inan
cial
Sta
tem
ents
Fo
r th
e ye
ar e
nd
ed J
un
e 30
, 201
5
Annual Report 2015144

C
O
S
T
D E
P R
E C
I A
T I
O N
As
at
As
at
A
s at
D
epre
ciat
ion
/ O
n
As
at
Wri
tten
do
wn
Ju
ly 0
1,
Ad
dit
ion
s D
isp
osa
ls
Jun
e 30
, R
ate
July
01,
ad
just
men
ts
dis
po
sals
Ju
ne
30,
valu
e as
at
2013
tr
ansf
ers*
tr
ansf
ers*
20
14
%
2013
fo
r th
e ye
ar
/ tra
nsf
ers*
20
14
Jun
e 30
, 201
4
(Rup
ees
in ‘0
00)
(R
upee
s in
‘000
)
O
wn
ed:
La
nd -
Fre
ehol
d 2
11,4
90
(7,
087)
(
650)
2
03,7
53
-
708
(
708)
-
-
2
03,7
53
- Le
aseh
old
3
8,29
4
7,0
87
-
4
5,38
1
1.69
-3.3
3 3
,099
2
,492
-
5,5
91
39,
790
B
uild
ing
on fr
eeho
ld la
nd
-
Fact
ory
build
ing
270
,035
-
-
2
70,0
35
10
136
,455
1
3,35
9
-
1
49,8
14
120
,221
- N
on fa
ctor
y bu
ildin
g 4
67,7
07
-
-
471
,979
5
-10
1
37,4
41
25,
330
-
163
,450
3
08,5
29
4
,272
*
679
*
R
ailw
ay s
lidin
g 7
92
-
-
792
5
708
4
-
712
8
0
P
lant
and
mac
hine
ry
1,1
72,1
90
78,
820
(
14,0
15)
1,2
32,5
42
10-
30
771
,225
7
2,49
4
(12
,641
) 8
30,3
99
402
,143
(
4,45
3) *
(
679)
*
-
F
urni
ture
and
fitti
ngs
28,
612
1
,617
(
233)
2
9,99
6
15-
20
16,
902
2
,076
(
152)
1
8,66
0
11,
336
(166
)
V
ehic
les
85,
416
1
0,30
7
(7,
718)
8
8,00
5
20
42,
477
8
,835
(
2,61
0)
48,
707
39,
298
5 *
O
ffice
and
mill
s eq
uipm
ent
57,
181
5
,513
(
591)
6
2,10
3
10-3
0 34
,482
4
,312
(
512)
3
8,28
2
23,
821
C
ompu
ter
equi
pmen
t 6
5,64
4
4,4
43
(1,
001)
6
9,08
6
33
53,
077
7
,854
(
915)
5
9,99
6
9,0
90
(20
) *
Jigs
and
fixt
ures
1
43,2
46
7,1
25
(6,
232)
1
44,3
20
33
109
,271
7,
125
(
6,23
2)
120
,345
2
3,97
5
1
81 *
1
81 *
2014
2
,540
,607
1
07,8
25
(30
,440
) 2
,617
,992
1,30
5,84
5
153
,173
(
23,0
62)
1,4
35,9
56
1,1
82,0
36
No
tes
to t
he
Co
nso
lidat
ed F
inan
cial
Sta
tem
ents
Fo
r th
e ye
ar e
nd
ed J
un
e 30
, 201
5
Growth Through Innovation 145

Notes to the Consolidated Financial StatementsFor the year ended June 30, 2015
Note 2015 2014 (Rupees in ‘000) 8.2 The depreciation charge for the year has been allocated as follows:
Cost of sales 31 136,057 105,606 Distribution costs 32 992 794 Administrative expenses 33 50,714 46,772 187,763 153,172 8.3 Fixed assets include fully depreciated assets amounting to Rs. 154.095 million (2014: Rs. 42.374 million).
8.4 The following property, plant and equipment were disposed off during the year:
Particulars Written Original Accumulated down Sales Gain Mode of disposal Particulars of buyers
cost depreciation value proceeds Note 34
(Rupees in ‘000)
Vehicles Toyota Corolla Xli 168 - 168 948 780 Sold under company’s Mr. Ahmed Sheraz car scheme - Ex-Emplo Toyota Corolla Gli 320 - 320 1,400 1,080 Sold under company’s Mr. Zaheer Abbas
car scheme - Ex-Employee Toyota Altis 1,809 1,212 597 597 - Sold under company’s Mr. Sohail P. Ahmed
car scheme - Director Toyota Corolla Gli 1,392 951 441 787 346 Sold under company’s Mr. Tariq Iqbal Ansari
car scheme - Employee Suzuki Mehran-VXR. 173 - 173 510 337 Sold under company’s Mr. Eijaz Raza
car scheme - Employee Toyota Corolla Gli 1,410 993 417 743 326 Sold under company’s Mr. Riyaz Y. Shroff
car scheme - Ex-Employee Suzuki Mehran 240 - 240 510 270 Sold under company’s Mr. Kashif Iqbal Butt car scheme - Ex-Employee Toyota Corolla 1,899 1,377 522 522 - Sold under company’s Mr. Hussain Qaiser Rizvi
car scheme - Employee Toyota Altis 1,355 1,061 294 294 - Sold under company’s Mr. Ali Sajjad Dharamsey
car scheme - Employee Toyota Altis 1,317 782 535 535 - Sold under company’s Mr. Asif Rizvi
car scheme - Chief Executive Offi-cer
Toyota Corolla Gli 1,289 770 519 571 52 Sold under company’s Mr. Raza Rajani car scheme - Ex-Employee
Toyota Corolla Xli 1,464 671 793 872 79 Sold under company’s Mr. Ayaz Toosy car scheme - Employee
Toyota Corolla Xli 250 - 250 1,400 1,150 Insurance Claim M/s. Habib Insurance Co. Ltd - a related party
Motor Cycle 70 9 61 62 1 Insurance Claim M/s. Habib Insurance Co. - a related party Motor Cycle 69 11 58 64 6 Insurance Claim M/s. Habib Insurance Co. - a related party Motor Cycle 69 18 51 52 1 Negotiation Mr. Mohammad Saleem
Soomro - Employee Toyota Altis 2,139 673 1,466 1,689 223 Negotiation Toyota Southern Motors Items having book value upto Rs. 50,000 764 447 317 1,940 1,623 Various Various
16,197 8,975 7,222 13,496 6,274
Office and mills equipment Items having book value upto Rs. 50,000 487 429 58 68 10 Various Various
Computer equipment Items having book value upto Rs. 50,000 1,457 1,447 10 107 97 Various Various 2015 18,141 10,851 7,290 13,671 6,381 2014 30,440 23,062 7,378 24,071 16,693
Annual Report 2015146

2015 2014 (Rupees in ‘000) 8.5 Capital work-in-progress
Civil works 141 14,333 Plant and machinery - 157,017 Office and mills equipment 17,240 6,061 Vehicles 3,762 489 Computer Equipment 150 - 21,293 177,900 9. INTANGIBLE ASSETS C O S T A M O R T I Z A T I O N
As at As at Amortisation As at As at Written down July 01, June 30, Rate July 01, June value as at
2014 Additions 2015 % 2014 Amortisation 30, 2015 June 30, 2015
(Rupees in ‘000) (Rupees in ‘000)
Softwares 5,972 6,195 12,167 30 - 50 5,875 949 6,824 5,343 Licenses 1,139 3,980 5,119 33 857 892 1,749 3,370
2015 7,111 10,175 17,286 6,732 1,841 8,573 8,713 2014 7,111 - 7,111 6,155 577 6,732 379
Note 2015 2014 (Rupees in ‘000) 9.1 The amortisation charge for the year has been allocated as follows:
Cost of sales 31 463 - Distribution costs 32 4 - Administrative expenses 33 1,374 577 1,841 577
10. INVESTMENT PROPERTIES Land and building 7,176,769 7,428,950 Capital work-in-progress - Civil works - 3,500 7,176,769 7,432,450
C O S T D E P R E C I A T I O N
As at As at Depreciation As at As at Written down July 01, Additions June 30, Rate July 01, Depreciation June value as at
2014 2015 % 2014 30, 2015 June 30, 2015
(Rupees in ‘000) (Rupees in ‘000)
Freehold land 974,504 - 974,504 - - - - 974,504 Leasehold land 1,657,588 - 1,657,588 3 197,805 - 197,805 1,459,783 Building on freehold land 1,884,362 9,983 1,894,345 10-30 276,460 213,507 489,967 1,404,378 Building on leasehold land 4,100,300 - 4,100,300 10-30 713,539 48,657 762,196 . 3,338,104 2015 8,616,754 9,983 8,626,737 1,187,804 262,164 1,449,968 7,176,769 2014 8,504,464 112,290 8,616,754 919,220 268,584 1,187,804 7,428,950
10.1 Investment property comprises of various properties across Pakistan which have been let out. The fair value of such properties is determined on the basis of a valuation carried out by an independent professional valuer and amount to Rs. 14,840 million (2014: Rs. 13,452 million). The valuation was arrived on the basis of market intelligence, indexation of the original cost, year of construction and present physical condition and location.
Notes to the Consolidated Financial StatementsFor the year ended June 30, 2015
Growth Through Innovation 147

Note 2015 2014 Holding (Rupees in Holding (Rupees in % ‘000) % ‘000)11. LONG-TERM INVESTMENTS Investment in associates - stated as per equity method 11.2 & 11.3 Quoted associates Indus Motor Company Limited 6.22 6.22 Opening balance 1,142,528 998,109 Share of profit for the period - net of tax 496,130 245,642 Share of unrealized gain on hedging - 1,448 Share of actuarial (loss) / gain on remeasurement of defined benefit plan (94) 19 Dividend received during the period (310,515) (102,690) 1,328,049 1,142,528 (Market value Rs. 6,107.610 million) (2014: Rs. 2,630.429 million) Habib Insurance Company Limited 11.4 4.63 4.63 Opening balance 41,431 35,984 Share of profit for the period - net of tax 14,043 11,308 Share of actuarial loss on remeasurement of defined benefit plan (52) (126) Dividend received during the period (11,471) (5,735) 43,951 41,431 (Market value Rs. 108.514 million) (2014: Rs. 88.612 million) Agriauto Industries Limited 7.35 7.35 Opening balance 199,090 189,433 Share of profit for the year - net of tax 35,911 21,500 Share of loss in change in fair value of available for sale investment (1,332) (207) Dividend received during the year (10,578) (11,636) 223,091 199,090 (Market value Rs. 393.396 million) (2014: Rs. 204.155 million) Shabbir Tiles and Ceramics Limited 1.30 1.30 Opening balance 20,552 22,107 Investment made during the period 5,729 - Share of profit / (loss) for the period - net of tax 22 (614) Dividend received during the year - (941) 26,303 20,552 (Market value Rs. 27.751 million) (2014: Rs. 15.523 million) 1,621,394 1,403,601 Un-Quoted associates
METRO Habib Cash & Carry Pakistan (Private) Limited (MHCCP) 11.4 & 11.5 25 25 Opening balance 56,246 434,704 Share of loss for the period - net of tax (56,246) (378,458) - 56,246 TOTAL OF ASSOCIATES 1,621,394 1,459,847
Other investments - Available-for-sale Quoted - at fair value Habib Sugar Mills Limited 78,112 68,142 GlaxoSmithKline (Pakistan) Limited 328 279 Dynea Pakistan Limited 40,032 36,773 Allied Bank Limited 18,171 - Habib Bank Limited 14,010 - 150,653 105,194 Un-Quoted - at cost Sindh Engro Coal Mining Company Limited 11.7 360,000 - TOTAL 2,132,047 1,565,041
Notes to the Consolidated Financial StatementsFor the year ended June 30, 2015
Annual Report 2015148

Note 2015 2014 (Rupees in ‘000)
11.1 Share of net profit / (loss) of associates - after tax Indus Motor Company Limited 496,130 245,642 Habib Insurance Company Limited 14,043 11,308 Agriauto Industries Limited 35,911 21,500 Shabbir Tiles and Ceramics Limited 22 (614) METRO Habib Cash & Carry Pakistan (Private) Limited (56,246) (378,458) 489,860 (100,622)
11.2 The summarised financial information of the associated companies where there is a significant influence, based on the un-audited financial statements for the twelve months period ended March 31, 2015 except for MHCCP which is twelve months period ended June 30, 2015 is as follows:
2015 Total Total Profit / (loss) Assets Liabilities Revenues after tax (Rupees in ‘000) Associates Indus Motor Company Limited 50,413,613 27,495,053 80,473,510 7,974,604 Habib Insurance Company Limited 2,928,944 1,916,786 477,499 303,308 Agriauto Industries Limited 3,450,381 422,377 4,169,514 488,857 Shabbir Tiles and Ceramics Limited 5,131,811 3,474,841 4,292,445 1,741 METRO Habib Cash & Carry Pakistan (Private) Limited 9,541,765 11,161,025 35,489,167 (1,794,063)
2014 Total Total Profit / (loss) Assets Liabilities Revenues after tax (Rupees in ‘000)
Associates Indus Motor Company Limited 25,632,360 7,268,813 65,897,239 3,948,349 Habib Insurance Company Limited 2,271,461 1,189,865 436,623 244,235 Agriauto Industries Limited 3,046,689 345,407 3,514,786 292,688 Shabbir Tiles and Ceramics Limited 4,887,154 3,226,473 4,823,553 (47,006) METRO Habib Cash & Carry Pakistan (Private) Limited 9,086,156 8,982,197 33,539,597 (1,513,829)
11.3 Although the Group has less than 20% equity interest in all its associates except for MHCCP in which the Group has 25% equity interest, the management believes that significant influence over these associates exists by virtue of Group’s representation on the Board of Directors of the respective companies.
11.4 The financial year end of all the associates is June 30 except for Habib Insurance Company Limited where the financial year end is December 31, and MHCCP where financial year end is September 30. As the financial state-ments of all the associates may not necessarily be available at each reporting period of the Group, therefore the Group uses the financial statements of the associates with a lag of three months for applying the equity method of accounting except MHCCP where the Group has used financial statements for the same period end as that of the Holding Company.
11.5 The Group holds a put option with respect to its holding in MHCCP whereby, if MHCCP does not achieve spec-ified financial performance targets, the Group may require METRO Cash and Carry International Holding BV to acquire the shares of MHCCP at a price to be determined on the basis of a predefined mechanism. The put option is exercisable from June 27, 2014 to June 26, 2019 subject to certain conditions.
Notes to the Consolidated Financial StatementsFor the year ended June 30, 2015
Growth Through Innovation 149

Note 2015 2014 (Rupees in ‘000)
11.6 Share in contingent liabilities of associated companies 302,467 184,688
Share in commitments of associated companies 3,890,637 4,125,317
11.7 The Group has entered into a Shareholders Agreement with Engro Powergen Limited and Hub Power Company Limited for joint investment in Sindh Engro Coal Mining Company Limited (SECMC). The Group has made an investment of Rs. 360 million and also agreed to make an investment upto a total of Rs. 3 billion subject to certain conditions and regulatory approvals.
Note 2015 2014 (Rupees in ‘000)
12. LONG-TERM LOANS AND DEPOSITS Loans to employees - unsecured, considered good Interest bearing 58 91 Interest free 264 183 Current portion 18 (151) (101) 171 173 Long-term deposits Security deposits 6,751 5,258 Utilities 4,410 4,410 Others 471 441 11,632 10,109 11,803 10,282
13. LONG TERM PREPAYMENT Rent 13.1 67,640 74,057 Current portion 18 (11,694) (9,055) 55,946 65,002 13.1 Includes prepaid rent of Rs. 3.780 million (2014: 11.340 million) paid in respect of service centre upto June
2016 and prepaid rent of Rs. 63.860 million (2014: 61.222 million) paid for land obtained under operating lease agreement which is adjustable against yearly installments over a period of 20 years.
Note 2015 2014 (Rupees in ‘000)
14. DEFERRED TAX ASSET - net Deferred tax comprises temporary differences relating to : Accelerated tax depreciation (132,584) (144,815) Provisions 155,441 120,036 Unabsorbed tax losses 14.1 131,459 161,655 Investment in associates (125,704) (110,122) 28,612 26,754 14.1 Deferred tax asset on tax losses of a subsidiary company on account of unabsobed depreciation is recognised
on the basis that the realisation of related tax benefits through future taxable profits is probable.
2015 2014 (Rupees in ‘000)15. STORES, SPARES AND LOOSE TOOLS Stores 23,120 22,826 Spares 67,819 62,789 Loose tools 87 141 91,026 85,756
Notes to the Consolidated Financial StatementsFor the year ended June 30, 2015
Annual Report 2015150

Note 2015 2014 (Rupees in ‘000)16. STOCK-IN-TRADE Raw material - In hand 16.1 1,494,319 2,182,610 - In transit 406,768 330,713 1,901,087 2,513,323 Work-in-process 192,326 171,239 Finished goods 16.2 456,564 707,923 Provision for obsolescence and shrinkage (6,318) (5,926) 450,246 701,997 2,543,659 3,386,559 16.1 Raw materials amounting to Rs. 9.577 million (2014: Rs. 13.218 million) are held with the sub-contractors.
16.2 Stock-in-trade includes items amounting to Rs. 611.309 million (2014: Rs. 814.864 million) carried at net realisable
value. [Cost Rs. 674.722 million (2014: Rs. 869.673 million)].
Note 2015 2014 (Rupees in ‘000)17. TRADE DEBTS - unsecured Considered good 17.1 1,210,643 942,975 Considered doubtful 22,290 20,627 Provision for impairment 17.2 (22,290) (20,627 - - 1,210,643 942,975
17.1 This includes amount due from following related parties: Indus Motor Company Limited 333,041 43,164 Habib Metropolitan Bank Limited 2,967 4,047 Agriauto Industries Limited 250 64 Shabbir Tiles & Ceramics Limited 7,511 1,902 METRO Habib Cash & Carry Pakistan (Private) Limited 750 2,271 Schneider Electric Pakistan (Private) Limited - 9 Habib Insurance Company Limited 47 - 344,566 51,457
17.2 Reconciliation of provision for impairment of trade debts Balance at the beginning of the year 20,627 33,688 Charge for the year 32 5,949 6,072 Reversal for the year (2,296) (19,133) 3,653 (13,061) Bad debts written off (1,990) - Balance at the end of the year 22,290 20,627
Notes to the Consolidated Financial StatementsFor the year ended June 30, 2015
Growth Through Innovation 151
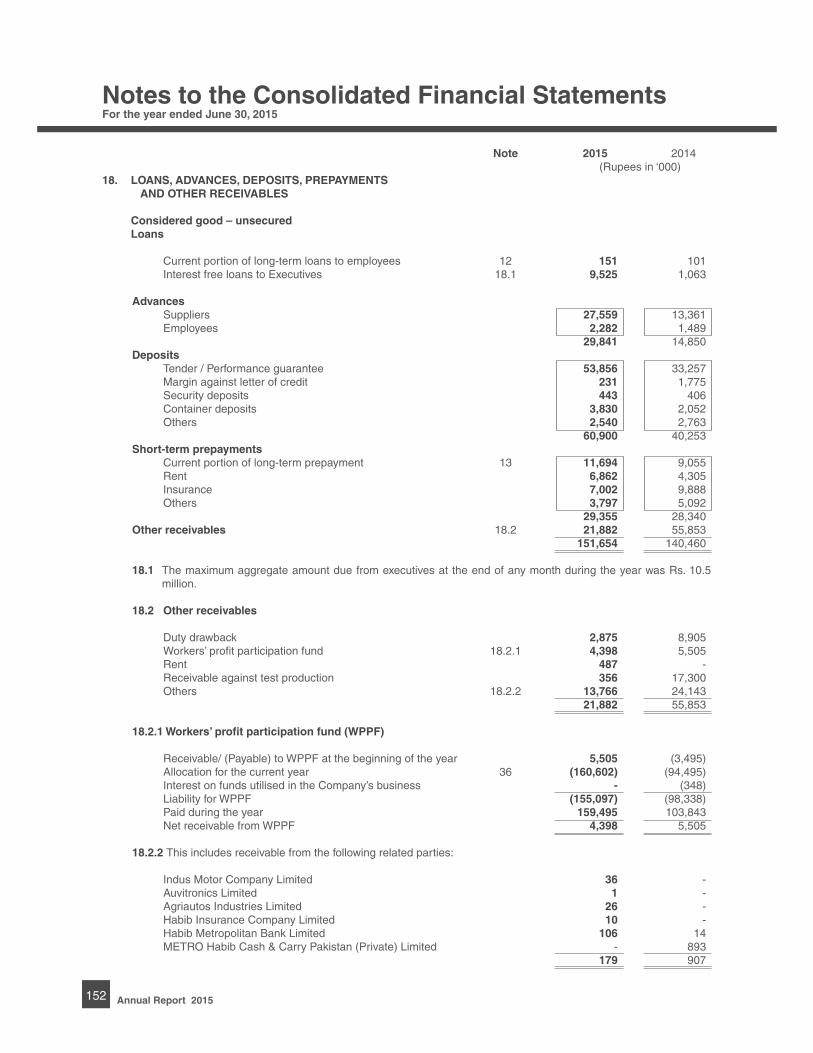
Note 2015 2014 (Rupees in ‘000)18. LOANS, ADVANCES, DEPOSITS, PREPAYMENTS AND OTHER RECEIVABLES Considered good – unsecured Loans Current portion of long-term loans to employees 12 151 101 Interest free loans to Executives 18.1 9,525 1,063 Advances Suppliers 27,559 13,361 Employees 2,282 1,489 29,841 14,850 Deposits Tender / Performance guarantee 53,856 33,257 Margin against letter of credit 231 1,775 Security deposits 443 406 Container deposits 3,830 2,052 Others 2,540 2,763 60,900 40,253 Short-term prepayments Current portion of long-term prepayment 13 11,694 9,055 Rent 6,862 4,305 Insurance 7,002 9,888 Others 3,797 5,092 29,355 28,340 Other receivables 18.2 21,882 55,853 151,654 140,460 18.1 The maximum aggregate amount due from executives at the end of any month during the year was Rs. 10.5
million. 18.2 Other receivables Duty drawback 2,875 8,905 Workers’ profit participation fund 18.2.1 4,398 5,505 Rent 487 - Receivable against test production 356 17,300 Others 18.2.2 13,766 24,143 21,882 55,853 18.2.1 Workers’ profit participation fund (WPPF) Receivable/ (Payable) to WPPF at the beginning of the year 5,505 (3,495) Allocation for the current year 36 (160,602) (94,495) Interest on funds utilised in the Company’s business - (348) Liability for WPPF (155,097) (98,338) Paid during the year 159,495 103,843 Net receivable from WPPF 4,398 5,505 18.2.2 This includes receivable from the following related parties: Indus Motor Company Limited 36 - Auvitronics Limited 1 - Agriautos Industries Limited 26 - Habib Insurance Company Limited 10 - Habib Metropolitan Bank Limited 106 14 METRO Habib Cash & Carry Pakistan (Private) Limited - 893 179 907
Notes to the Consolidated Financial StatementsFor the year ended June 30, 2015
Annual Report 2015152

Note 2015 2014 (Rupees in ‘000) 19. SHORT-TERM INVESTMENTS Held-to-maturity - at amortised cost Term Deposit Receipts 19.1 4,740,409 2,998,409 Accrued profit thereon 8,219 1,404 4,748,628 2,999,813 Musharika Certificates 19.2 106,000 121,000 Accrued profit thereon 78 810 106,078 121,810 Treasury Bills 19.3 196,747 - Accrued profit thereon 2,535 - 199,282 - 5,053,988 3,121,623
19.1 Represents Term Deposit Receipts of Habib Metropolitan Bank Limited, a related party. These deposits carry profit rate of 6.6% to 8.95% (2014: 6.5% to 9.75%) per annum and having maturity ranging from July 05, 2015 to November 30, 2015 out of which Rs. 0.909 million (2014: Rs. 0.909 million) is under lien against a letter of guarantee issued by the Bank on behalf of the Group.
19.2 This represents Musharika Certificates with a Modaraba Company carrying mark-up rate 6.75% to 7.15% (2014: 9.00% to 9.25%) per annum having maturity ranging from September 29, 2015 to November 27, 2015.
19.3 These carry profit rate ranging from 6.84% to 7.38% per annum and having maturity upto August 06, 2015.
Note 2015 2014 (Rupees in ‘000)
20. INCOME TAX - net
Group Tax Relief adjustments 20.1 593,466 593,466 Income tax provision less tax payments – net (420,252) (297,439) 173,214 296,027
20.1 In terms of the provisions of Section 59B of the Income Tax Ordinance, 2001 (the Ordinance), a subsidiary company may surrender its tax losses in favour of its holding company for set off against the income of its holding company subject to certain conditions as prescribed under the Ordinance.
Accordingly, the Holding Company adjusted its tax liabilities for the tax years 2008-2010 by acquiring the losses
of its subsidiary company and consequently an aggregate sum of Rs. 593.466 million equivalent to the tax value of the losses acquired has been paid to the subsidiary company.
The original assessments of the Holding Company for the tax years 2008 to 2010 were amended under Section
122(5A) of the Ordinance by the tax authorities by disallowing Group Relief claimed by the Holding Company under Section 59B of the Ordinance aggregating to Rs. 593.466 million. The Holding Company preferred appeals against the said amended assessments before the Commissioner Inland Revenue (Appeals) who vide his orders dated 10th June 2011 and 11th July 2011 has held that the Holding Company is entitled to Group Relief under section 59B of the Ordinance. However, the tax department filed an appeal before the Appellate Tribunal Inland Revenue (ATIR) against the Commissioner Inland Revenue (Appeal) (CIR) Order. The ATIR has passed an order in favour of the Holding Company for the above tax years; the Tax department filed reference application / appeal against the order of ATIR before the Sindh High Court and with the Chairman ATIR which are under the process of hearings.
Notes to the Consolidated Financial StatementsFor the year ended June 30, 2015
Growth Through Innovation 153

Note 2015 2014 (Rupees in ‘000) 21. CASH AND BANK BALANCES With banks in: Current accounts 21.1 134,883 33,166 Deposit accounts 21.2 398,802 377,927 Saving accounts 21.3 102,307 104,645 635,992 515,738 In hand 9,892 5,233 645,884 520,971
21.1 These include an amount of Rs. 103.053 million (2014: 8.220 million) maintained with Habib Metropolitan Bank, a related party.
21.2 These represent deposits maintained with Habib Metropolitan Bank Limited, a related party, and carry markup at the rates ranging from 5.50% to 8% (2014: 7% to 8%) per annum.
21.3 These include accounts maintained with Habib Metropolitan Bank - a related party, amounting to Rs. 86.676 million (2014: 55.98 million) and carry markup at the rates ranging from 5.50% to 8% (2014: 7% to 8%) per annum.
22. ISSUED, SUBSCRIBED AND PAID-UP CAPITAL 2015 2014 2015 2014 Number of ordinary (Rupees in ‘000) shares of Rs. 5/- each 5,149,850 5,149,850 Fully paid in cash 25,750 25,750 Issued as fully paid bonus shares: 64,640,390 64,640,390 Opening balance 323,202 323,202 - - Issued during the year - - 64,640,390 64,640,390 Closing balance 323,202 323,202 Shares issued under the Scheme of 11,239,669 11,239,669 Arrangements for Amalgamation 56,198 56,198 81,029,909 81,029,909 405,150 405,150
22.1 As at 30 June 2015: 7,512,043 (2014: 7,874,443) ordinary shares of Rs. 5/- each are held by related parties.
2015 2014 (Rupees in ‘000) 23. RESERVES
Capital reserves Reserve on merger of former Pakistan Jute and Synthetics Limited and former Thal Jute Mills Limited 13,240 13,240 Premium on issue of share capital 12,225 12,225 Reserve on merger of former Pakistan Paper Sack Corporation Limited and former Khyber Papers (Private) Limited 42,464 42,464 67,929 67,929 Revenue reserves General reserve 8,702,874 7,948,874 Unappropriated profit 3,334,888 2,429,917 12,037,762 10,378,791 Gain on change in fair value of available for sale investments - net 108,508 95,321 12,214,199 10,542,041
Notes to the Consolidated Financial StatementsFor the year ended June 30, 2015
Annual Report 2015154
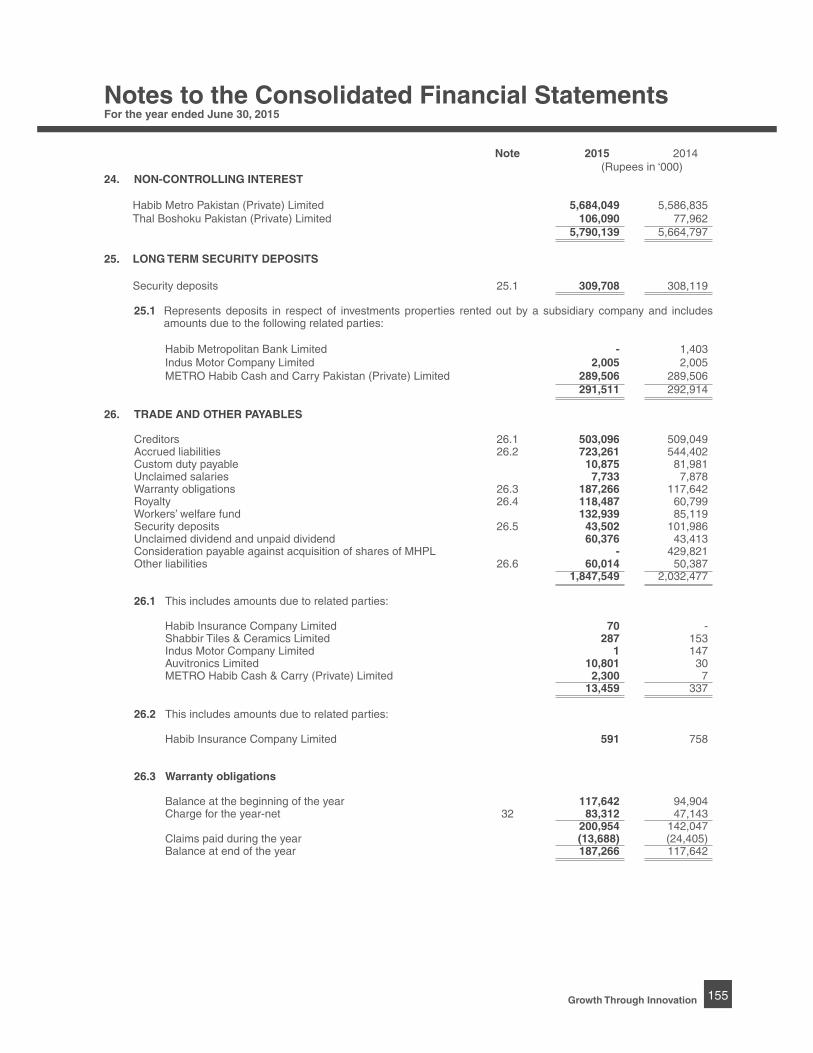
Note 2015 2014 (Rupees in ‘000) 24. NON-CONTROLLING INTEREST Habib Metro Pakistan (Private) Limited 5,684,049 5,586,835 Thal Boshoku Pakistan (Private) Limited 106,090 77,962 5,790,139 5,664,797
25. LONG TERM SECURITY DEPOSITS Security deposits 25.1 309,708 308,119 25.1 Represents deposits in respect of investments properties rented out by a subsidiary company and includes
amounts due to the following related parties:
Habib Metropolitan Bank Limited - 1,403 Indus Motor Company Limited 2,005 2,005 METRO Habib Cash and Carry Pakistan (Private) Limited 289,506 289,506 291,511 292,914
26. TRADE AND OTHER PAYABLES Creditors 26.1 503,096 509,049 Accrued liabilities 26.2 723,261 544,402 Custom duty payable 10,875 81,981 Unclaimed salaries 7,733 7,878 Warranty obligations 26.3 187,266 117,642 Royalty 26.4 118,487 60,799 Workers’ welfare fund 132,939 85,119 Security deposits 26.5 43,502 101,986 Unclaimed dividend and unpaid dividend 60,376 43,413 Consideration payable against acquisition of shares of MHPL - 429,821 Other liabilities 26.6 60,014 50,387 1,847,549 2,032,477
26.1 This includes amounts due to related parties: Habib Insurance Company Limited 70 - Shabbir Tiles & Ceramics Limited 287 153 Indus Motor Company Limited 1 147 Auvitronics Limited 10,801 30 METRO Habib Cash & Carry (Private) Limited 2,300 7 13,459 337 26.2 This includes amounts due to related parties: Habib Insurance Company Limited 591 758 26.3 Warranty obligations Balance at the beginning of the year 117,642 94,904 Charge for the year-net 32 83,312 47,143 200,954 142,047 Claims paid during the year (13,688) (24,405) Balance at end of the year 187,266 117,642
Notes to the Consolidated Financial StatementsFor the year ended June 30, 2015
Growth Through Innovation 155
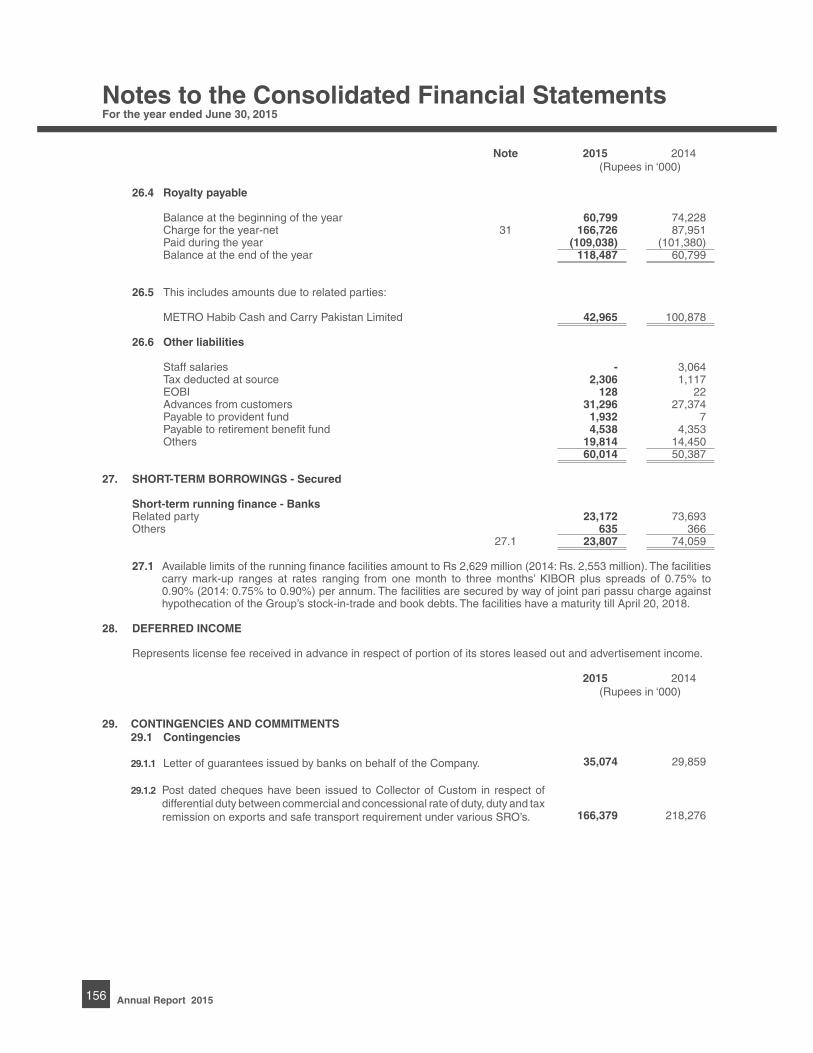
Note 2015 2014 (Rupees in ‘000) 26.4 Royalty payable Balance at the beginning of the year 60,799 74,228 Charge for the year-net 31 166,726 87,951 Paid during the year (109,038) (101,380) Balance at the end of the year 118,487 60,799 26.5 This includes amounts due to related parties: METRO Habib Cash and Carry Pakistan Limited 42,965 100,878 26.6 Other liabilities Staff salaries - 3,064 Tax deducted at source 2,306 1,117 EOBI 128 22 Advances from customers 31,296 27,374 Payable to provident fund 1,932 7 Payable to retirement benefit fund 4,538 4,353 Others 19,814 14,450 60,014 50,387 27. SHORT-TERM BORROWINGS - Secured Short-term running finance - Banks Related party 23,172 73,693 Others 635 366 27.1 23,807 74,059 27.1 Available limits of the running finance facilities amount to Rs 2,629 million (2014: Rs. 2,553 million). The facilities
carry mark-up ranges at rates ranging from one month to three months’ KIBOR plus spreads of 0.75% to 0.90% (2014: 0.75% to 0.90%) per annum. The facilities are secured by way of joint pari passu charge against hypothecation of the Group’s stock-in-trade and book debts. The facilities have a maturity till April 20, 2018.
28. DEFERRED INCOME Represents license fee received in advance in respect of portion of its stores leased out and advertisement income.
2015 2014 (Rupees in ‘000)
35,074 29,859
166,379 218,276
Notes to the Consolidated Financial StatementsFor the year ended June 30, 2015
29. CONTINGENCIES AND COMMITMENTS 29.1 Contingencies 29.1.1 Letter of guarantees issued by banks on behalf of the Company. 29.1.2 Post dated cheques have been issued to Collector of Custom in respect of
differential duty between commercial and concessional rate of duty, duty and tax remission on exports and safe transport requirement under various SRO’s.
Annual Report 2015156

2015 2014 (Rupees in ‘000)
792,000 792,000
29.2 Commitments
29.2.1 Letters of credit outstanding for raw material and spares. 1,282,630 1,028,488 29.2.2 Commitments in respect of capital expenditure - 18,532 29.2.3 Commitments for rentals under Ijarah finance agreements
Within one year 2,209 8,662 Later one year but not later than five years 220 2,643 2,429 11,305 29.2.4 Represent Ijarah agreement entered into with a Modaraba in respect of vehicles. Total Ijarah payments due
under the agreements are Rs. 2.429 (2014: 11.305 million) and are payable in monthly installments latest by September 2017. These commitments are secured by on-demand promissory notes of Rs. 11.834 million (2014: 41.313 million).
29.2.5 The Group has obtained three pieces for land for its stores under operating lease agreements of 30 to 59 years. The leases have varying terms, escalation clauses, contingent rent arrangements and renewal rights. The amounts of future payments under operating leases and the period in which these payments will become due are as follows:
2015 2014 (Rupees in ‘000)
Not later than one year 66,627 65,384 Later than one year but not later than five years 450,076 421,277 Later than five years 2,546,405 2,641,905 3,063,108 3,128,566
Notes to the Consolidated Financial StatementsFor the year ended June 30, 2015
29.1.3 The Subsidiary company MHPL owns a retail store in Saddar Karachi. The Supreme Court of Pakistan, in its judgment released on December 18, 2009, cancelled the 90 years lease (for the area where Saddar store is located) granted by the Government of Pakistan (GoP) to the Army Welfare Trust (AWT) dated December 19, 2002 on the basis that it was granted without lawful authority. As a consequence, the Supreme Court of Pakistan also cancelled the sub-lease granted in favour of the MHPL by AWT dated July 31, 2006. MHPL was allowed three months from the date of judgment to remove its structures and installations from the subject land and hand-over the subject land’s vacant possession to City District Government Karachi.
MHPL filed a review petition against the judgment of the Supreme Court of Pakistan and GoP and AWT also filed review petitions on January 22, 2010. The matter has not been definitively decided up till now.
During the year 2012, MHPL entered into an Operation Agreement with MHCCP whereby MHCCP was engaged to operate MHPL’s AWT (Saddar) Store. Under the above referred Operation Agreement, MHPL is required to pay to MHCCP an Operation Fee of up to Rs. 792 million. Under the agreement between Metro BV and the Company, if the Review Petition filed by MHPL in the Supreme Court is definitively and conclusively decided adversely against MHPL prior to the payment of the entire amount of Rs. 792 million by MHPL to MHCCP, then MHPL is required to pay to MHCCP the balance of the Operation Fee (Rs. 792 million less the Operation Fee paid up to date of such decision of Review Petition). If MHPL fails to make such payment, the Company has agreed that it will make the payment of the same to MHCCP.
However, no provision against the same has been considered necessary in these financial statements as the Company expects a favourable outcome of the review petition.
Growth Through Innovation 157

Note 2015 2014 (Rupees in ‘000)30. REVENUE - net Export sales 30.1 930,322 1,075,530 Local sales 30.2 20,577,623 14,974,227 21,507,945 16,049,757 Less: Sales tax 2,599,115 1,817,408 Sales discount 1,322 1,968 Sales returns 79,216 49,421 2,679,653 1,868,797 18,828,292 14,180,960 Add: Service income 112,702 94,519 18,940,994 14,275,479 Add: Duty drawback (2,066) 5,974 18,938,928 14,281,453 30.1 Export sales are stated net of export related freight and other expenses of Rs. 42.311 million (2014: Rs. 47.535
million). 30.2 Local sales are stated net of freight and other expenses of Rs. 61.242 million (2014: Rs. 51.951 million).
Note 2015 2014 (Rupees in ‘000)31. COST OF SALES Raw material consumed 31.1 10,993,021 8,257,018 Salaries, wages and benefits 1,053,602 971,581 Stores, spares and lubricants 149,358 132,534 Repairs and maintenance 92,651 77,658 Power and fuel 303,425 312,439 Rent, rates and taxes 8,179 1,828 Vehicle running and maintenance 9,024 10,349 Insurance 9,601 9,889 Communication 4,369 3,954 Travelling and conveyance 13,272 8,593 Entertainment 413 926 Printing and stationery 4,629 3,882 Legal and professional 1,064 1,293 Computer accessories 6,424 3,285 Royalty 26.4 166,726 87,951 Depreciation 8.2 136,057 105,606 Amortization 9.1 463 - Research and development 5,517 3,521 Ijarah rentals 2,625 5,240 Technical Assistance fee - 17,226 Others 2,159 15,310 12,962,579 10,030,083 Work-in-process Opening 171,239 176,847 Closing (192,326) (171,239) (21,087) 5,608 Cost of goods manufactured 12,941,492 10,035,691 Finished goods Opening stock 707,919 457,049 Purchases 2,395,722 2,391,471 Sharing of cost under arrangement 1.2.3(b) (84,411) (15,879) Provision for obsolescence and shrinkage 392 1,932 Closing stock (456,564) (707,923) 2,563,058 2,126,650 15,504,5501 2,162,341 31.1 Raw material consumed Opening stock 2,182,610 1,653,805 Purchases 10,304,730 8,785,823 Closing stock (1,494,319) (2,182,610) 10,993,021 8,257,018
Notes to the Consolidated Financial StatementsFor the year ended June 30, 2015
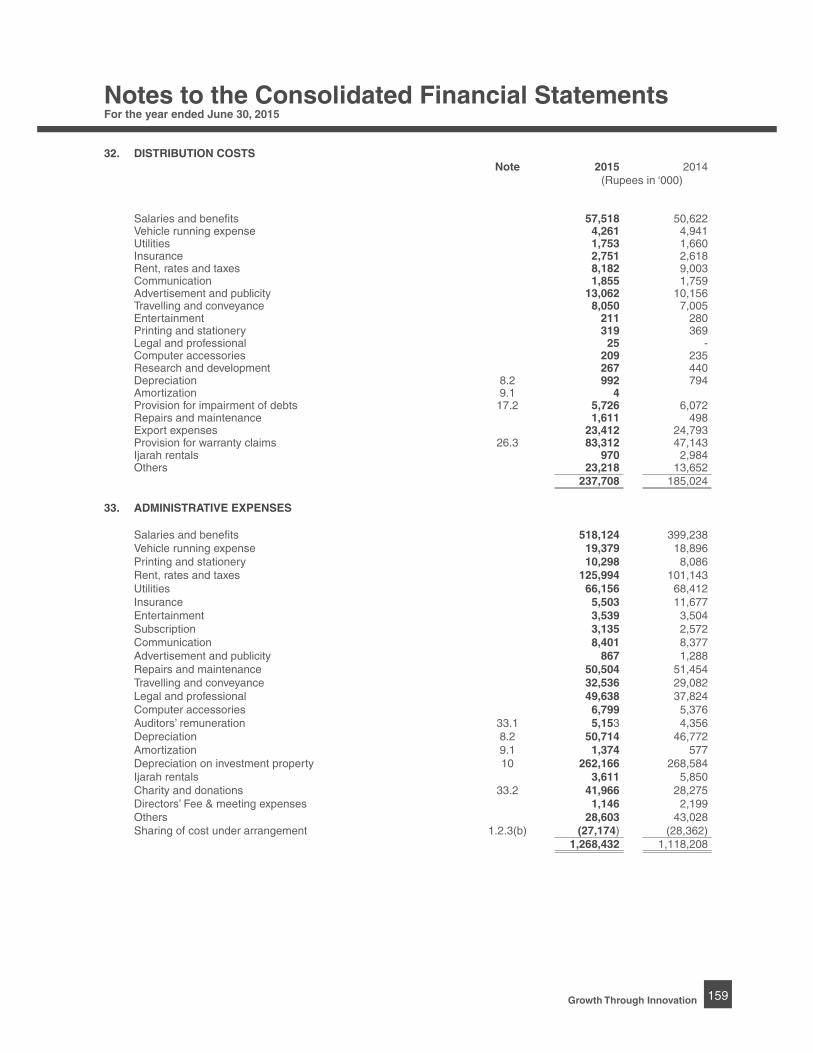
Annual Report 2015158
32. DISTRIBUTION COSTS Note 2015 2014 (Rupees in ‘000)
Salaries and benefits 57,518 50,622 Vehicle running expense 4,261 4,941 Utilities 1,753 1,660 Insurance 2,751 2,618 Rent, rates and taxes 8,182 9,003 Communication 1,855 1,759 Advertisement and publicity 13,062 10,156 Travelling and conveyance 8,050 7,005 Entertainment 211 280 Printing and stationery 319 369 Legal and professional 25 - Computer accessories 209 235 Research and development 267 440 Depreciation 8.2 992 794 Amortization 9.1 4 Provision for impairment of debts 17.2 5,726 6,072 Repairs and maintenance 1,611 498 Export expenses 23,412 24,793 Provision for warranty claims 26.3 83,312 47,143 Ijarah rentals 970 2,984 Others 23,218 13,652 237,708 185,024
33. ADMINISTRATIVE EXPENSES Salaries and benefits 518,124 399,238 Vehicle running expense 19,379 18,896 Printing and stationery 10,298 8,086 Rent, rates and taxes 125,994 101,143 Utilities 66,156 68,412 Insurance 5,503 11,677 Entertainment 3,539 3,504 Subscription 3,135 2,572 Communication 8,401 8,377 Advertisement and publicity 867 1,288 Repairs and maintenance 50,504 51,454 Travelling and conveyance 32,536 29,082 Legal and professional 49,638 37,824 Computer accessories 6,799 5,376 Auditors’ remuneration 33.1 5,153 4,356 Depreciation 8.2 50,714 46,772 Amortization 9.1 1,374 577 Depreciation on investment property 10 262,166 268,584 Ijarah rentals 3,611 5,850 Charity and donations 33.2 41,966 28,275 Directors’ Fee & meeting expenses 1,146 2,199 Others 28,603 43,028 Sharing of cost under arrangement 1.2.3(b) (27,174) (28,362) 1,268,432 1,118,208
Notes to the Consolidated Financial StatementsFor the year ended June 30, 2015
Growth Through Innovation 159

Note 2015 2014 (Rupees in ‘000) 33.1 Auditors’ remuneration Audit fee 3,173 2,777 Half-yearly review 279 234 Taxation services 942 510 Other certifications 393 329 Out of pocket expenses 367 506 5,153 4,356
33.2 Charity and donations Charity and donations include the following donees in whom directors or their spouses are interested:
Name of donee Address of donee Name of directors/spouse 2015 2014 (Rupees in ‘000)
Mohamedali Habib 2nd Floor, House of Habib, 3-Jinnah Co Mr. Rafiq M. Habib - Trustee 10,101 6,582 Welfare Trust -operative Housing Society, Block 7/8, Sharae Faisal, Karachi. Mr. Ali S. Habib - Trustee Habib Education 4th floor, United Bank building, I.I. Mr. Ali S. Habib - Trustee 3,000 3,000 Trust Chundrigar Road, Karachi. Mr. Mohammed Ali R. Habib - Trustee Habib University 147, Block 7&8, Banglore Cooperative Mr. Rafiq M. Habib - Trustee 5,000 5,250 Foundation Housing Society, Tipu Sultan Road, Mr. Ali S. Habib - Trustee Karachi. Mr. Mohamedali R. Habib - Trustee Anjuman -e- ABSA School 26-C National Highway Mrs. Rafiq M. Habib Behbood-Samat Korangi Road, Karachi. - Vice President 36 36 -e- Itefal Note 2015 2014 (Rupees in ‘000)34. OTHER INCOME Income from financial assets Dividend income 6,140 6,714 Profit on call deposit accounts and short term investments 231,598 178,070 Gain on redemption of investments at fair value through profit and loss 88,052 81,707 Reversal of provision for impairment of debt 2,296 19,133 Liabilities/provisions no longer payable/required written back 3,854 19,224 Exchange gain - net 3,554 74 335,494 304,922 Income from non financial assets Gain on disposal of property, plant and equipment 8.4 6,381 16,693 Rental income from investment properties 34.1 1,380,655 1,296,196 Claim from suppliers 14,119 12,735 Licence fee, signage and others 56,456 54,919 Others 25,890 5,937 Sharing of cost under arrangement 1.2.3(b) (9,145) (8,425) 1,474,356 1,378,055 1,809,850 1,682,977 34.1 Includes an amount of Rs.1,245 million (2014: Rs. 1,159 million) under long term agreements with MHCCP,
whereby the immovable properties owned by the Group have been rented out to MHCCP for its cash & carry store operations at fixed annual rent.
Notes to the Consolidated Financial StatementsFor the year ended June 30, 2015
Annual Report 2015160

Note 2015 2014 (Rupees in ‘000)
35. FINANCE COSTS Mark-up / interest on: Short-term borrowings - Related party 8,150 146 - Others 2,361 791 Workers’ profit participation fund - 348 Bank charges and commission 6,894 4,258 17,405 5,543
36. OTHER CHARGES Workers’ profits participation fund 18.2.1 160,602 94,495 Workers’ welfare fund 84,357 82,725 244,959 177,220
37. TAXATION Current 1,191,138 759,273 Prior 3,065 (7,828) Deferred (1,858) (34,944) 37.1 1,192,345 716,501 37.1 Relationship between income tax expense and accounting profit Profit before tax and share of profit of associates 3,475,724 2,316,094 Tax at the rate of 25% - 33% (2014: 25% - 34%) 1,117,093 787,269 Super tax @ 3% of taxable income 37.1.1 108,341 - 1,225,434 787,269 Tax effects of: Tax effect of inadmissible items 241,198 19 Income taxed at reduced rates, exempt or taxed under final tax regime (277,352) (62,959) Prior years 3,065 (7,828) 1,192,345 716,501 37.1.1 The Federal Government vide Finance Act 2015 has imposed a onetime super tax at the rate of 3% on income
of companies for the tax year 2015. This tax has been levied for financing the rehabilitation of internally displaced persons affected by the ongoing war on terror. Accordingly, provisions of Rs. 108.341 million for Super tax has been made in these financial statements.
2015 2014 (Rupees in ‘000) 38. BASIC AND DILUTED EARNINGS PER SHARE There is no dilutive effect on the basic earnings per share of the Holding Company which is based on: Profit for the year after taxation attributable to the equity holders of the Holding Company 2,469,418 1,268,114 Number of shares in thousands Weighted average number of ordinary shares of Rs. 5/- each in issue 81,030 81,030
(Rupees) Basic and diluted earnings per share 30.48 15.65
Notes to the Consolidated Financial StatementsFor the year ended June 30, 2015
Growth Through Innovation 161

Note 2015 2014 (Rupees in ‘000)39. CASH GENERATED FROM OPERATIONS Profit before taxation 3,965,584 2,215,472 Adjustments for non-cash charges and other items: Depreciation and amortization 451,770 422,333 Share in profit / (loss) of associates - after taxation (489,860) 100,622 Finance costs 16,898 5,453 Profit earned on call deposit and short term investments (231,598) (178,070) Liabilities / provisions no longer payable / required written back (3,854) (186) Gain on redemption of investments at fair value through profit and loss (88,052) (67,456) Dividend income (6,140) (6,714) Provision for impairment of debts 3,430 (19,133) Provision for retirement benefits 3,595 2,985 Gain on disposal of property, plant and equipment (6,381) (16,693) (350,192) 243,141 3,615,392 2,458,613 (Increase) / decrease in current assets Stores, spares and loose tools (5,228) (5,172) Stock-in-trade 842,900 (662,937) Trade debts (271,098) 163,149 Loans, advances, deposits, prepayments and other receivables (633) (22,640) Increase / (decrease) in current liabilities - - Deferred income 2 857 Trade and other payables (198,231) 168,936 Sales tax payable 45,927 (29,633) 413,639 (387,440) 4,029,031 2,071,173
40. CASH AND CASH EQUIVALENTS Cash and bank balances 21 645,884 520,971 Short-term investments 4,634,208 3,038,500 Running Finance 27 (23,807) (74,059) 5,256,285 3,485,41241. TRANSACTIONS WITH RELATED PARTIES Related parties of the Company comprise of subsidiaries, associates, and companies with common directorship,
retirement funds, directors and key management personnel. Detail of transactions with related parties during the year, other than those which have been disclosed in notes 38 in these financial statements, are as follows:
Relationship Nature of transactions 2015 2014 (Rupees in ‘000)
Associates Sales 8,542,069 4,510,943 Professional Services rendered 140,485 116,470 Rental Income on properties 1,274,439 1,192,610 Insurance premium 30,041 34,660 Purchase of assets 24,658 158,164 Purchase of goods 204,326 151,646 Insurance claim received 11,307 3,313 Mark-up and bank charges paid 13,902 5,524 Profit received 187,998 157,619 Supplies purchased 1,279 - Licence fee, signage and others 2,936 4,022 Operational fee 102,440 35,815 Rent Paid 2,066 1,033 Employee benefit plans Contribution to provident fund 43,779 48,321 Contribution to retirement benefit fund 3,319 2,902
Notes to the Consolidated Financial StatementsFor the year ended June 30, 2015
Annual Report 2015162
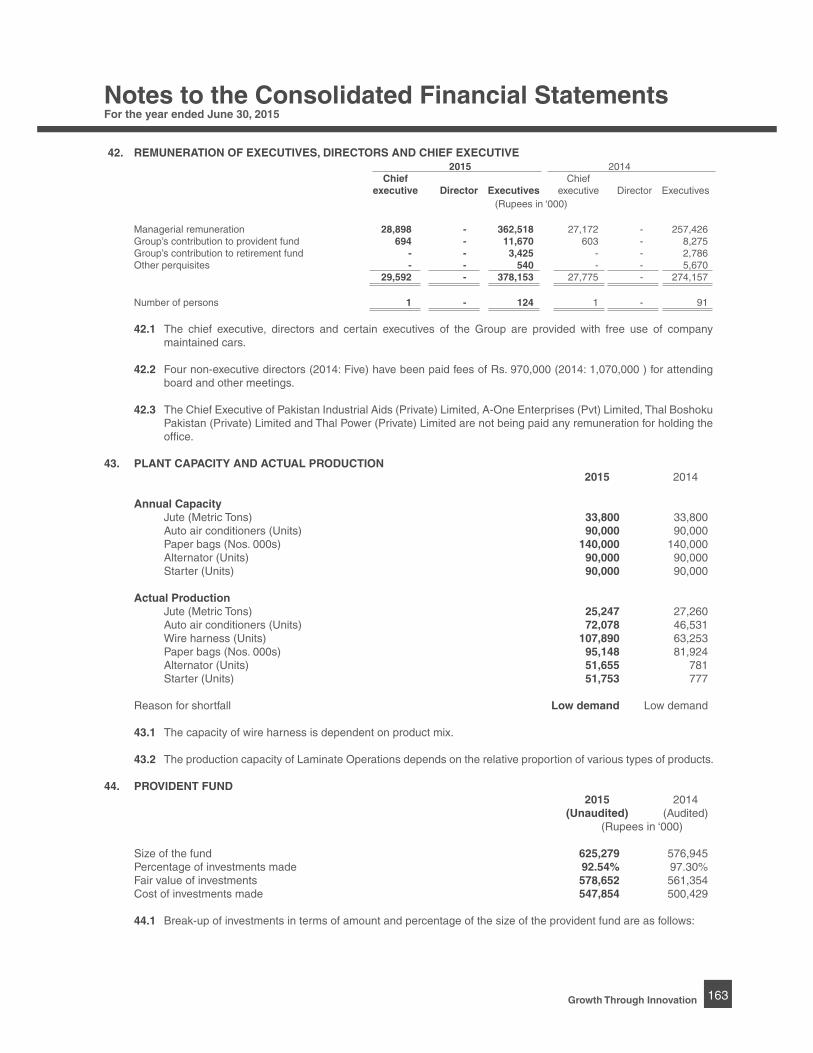
42. REMUNERATION OF EXECUTIVES, DIRECTORS AND CHIEF EXECUTIVE 2015 2014
Chief Chief executive Director Executives executive Director Executives (Rupees in ‘000)
Managerial remuneration 28,898 - 362,518 27,172 - 257,426 Group’s contribution to provident fund 694 - 11,670 603 - 8,275 Group’s contribution to retirement fund - - 3,425 - - 2,786 Other perquisites - - 540 - - 5,670 29,592 - 378,153 27,775 - 274,157 Number of persons 1 - 124 1 - 91
42.1 The chief executive, directors and certain executives of the Group are provided with free use of company maintained cars.
42.2 Four non-executive directors (2014: Five) have been paid fees of Rs. 970,000 (2014: 1,070,000 ) for attending board and other meetings.
42.3 The Chief Executive of Pakistan Industrial Aids (Private) Limited, A-One Enterprises (Pvt) Limited, Thal Boshoku Pakistan (Private) Limited and Thal Power (Private) Limited are not being paid any remuneration for holding the office.
43. PLANT CAPACITY AND ACTUAL PRODUCTION 2015 2014 Annual Capacity
Jute (Metric Tons) 33,800 33,800 Auto air conditioners (Units) 90,000 90,000 Paper bags (Nos. 000s) 140,000 140,000 Alternator (Units) 90,000 90,000 Starter (Units) 90,000 90,000 Actual Production
Jute (Metric Tons) 25,247 27,260 Auto air conditioners (Units) 72,078 46,531 Wire harness (Units) 107,890 63,253 Paper bags (Nos. 000s) 95,148 81,924 Alternator (Units) 51,655 781 Starter (Units) 51,753 777 Reason for shortfall Low demand Low demand 43.1 The capacity of wire harness is dependent on product mix.
43.2 The production capacity of Laminate Operations depends on the relative proportion of various types of products.
44. PROVIDENT FUND 2015 2014 (Unaudited) (Audited) (Rupees in ‘000) Size of the fund 625,279 576,945 Percentage of investments made 92.54% 97.30% Fair value of investments 578,652 561,354 Cost of investments made 547,854 500,429 44.1 Break-up of investments in terms of amount and percentage of the size of the provident fund are as follows:
Notes to the Consolidated Financial StatementsFor the year ended June 30, 2015
Growth Through Innovation 163

2015 2014 (Unaudited) (Audited)
% of % of investment investment Investments as size of Investments as size of (Rs ‘000) the fund (Rs ‘000) the fund Government securities 275,003 43.98% 240,292 41.65% Term finance certificates and Sukuks 100,119 16.01% 87,578 15.18% Term deposit receipts, call deposits and musharika certificates 37,651 6.02% 33,966 5.89% Listed securities and mutual fund units 165,879 26.53% 199,518 34.58%
44.2 Investments out of provident fund have been made in accordance with the provisions of the section 227 of the
Companies Ordinance, 1984 and the rules formulated for this purpose.
45. FINANCIAL RISK MANAGEMENT OBJECTIVES AND POLICIES
The Group’s financial instruments are subject to credit risk, liquidity risk, foreign currency risk, interest rate risk and equity price risk. The Board of Directors oversee policies for managing each of these risks which are summarised below.
45.1 Credit risk
Credit risk is the risk that one party to a financial instrument will fail to discharge an obligation and cause the other party to incur a financial loss.
Concentration of credit risk arises when a number of counterparties are engaged in similar business activities or have similar economic features that would cause their ability to meet contractual obligations to be similarly affected by changes in economic, political or other conditions. Concentration of credit risk indicates the relative sensitivity of the Group’s performance to developments affecting a particular industry.
The Group is mainly exposed to credit risk on trade debts, short term investments and bank balances. The Group seeks to minimize the credit risk exposure through having exposure only to customers considered credit worthy and obtaining securities where applicable.
Quality of financial assets The credit quality of financial assets is analyzed as under: 2015 2014 (Rupees in ‘000) Trade debts The analysis of trade debts is as follows: Neither past due nor impaired [includes Rs. 327.785 million 916,674 609,677 (2014: Rs. 27.429 million) receivable from related parties.] Past due but not impaired - Less than 90 days [includes Rs. 16.781 million 203,121 306,552 (2014: Rs. 26.190 million ) receivable from related parties.]
- 91 to 180 days [includes Rs. Nil million 77,623 26,532 (2014: Rs. 0.171 million) receivable from related parties.]
- 181 to 360 days [includes Rs. Nil million 13,225 214 (2014: Rs. 0.535 million) receivable from related parties.]
1,210,643 942,975
Notes to the Consolidated Financial StatementsFor the year ended June 30, 2015
Annual Report 2015164

Note 2015 2014 (Rupees in ‘000)
Bank balances
Ratings A1+ 605,337 498,466
A-1+ 23,739 16,687 A-1 6,870 26 P-1 * 46 559 635,992 515,738
* This reflects rating assigned by an international rating agency to a foreign bank.
Short term investments
Ratings A1+ 4,854,706 3,121,623
A-1+ 199,282 - 5,053,988 3,121,623
45.2 Liquidity Risk
Liquidity risk is the risk that an Group will encounter difficulty in raising funds to meet commitments associated with the financial instruments. To guard against the risk, the Group has diversified funding sources and the assets are managed with liquidity in mind. The maturity profile is monitored to ensure that adequate liquidity is maintained.
Year ended June 30, 2015 Less than 3 to 12 More than
On demand 3 months months 1 year Total (Rupees in ‘000)
Long term security deposit - - - 309,708 309,708 Trade and other payable 1,431,344 - - - - Short-term borrowing 14,556 - 9,251 - 23,807 Accrued markup 55 - - - 55 14,611 - 9,251 309,708 333,570
Year ended June 30, 2014 Less than 3 to 12 More than
On demand 3 months months 1 year Total (Rupees in ‘000)
Long term security deposit - - - 308,119 308,119 Short-term borrowing 5,338 - 68,721 - 74,059 Trade and other payables 1,633,691 - - - 1,633,691 Accrued markup 31 - - - 31 1,639,060 - 68,721 308,119 2,015,900
45.3 Foreign Currency risk
Foreign currency risk is the risk that the value of financial assets or a financial liability will fluctuate due to a change in foreign exchange rates. It arises mainly where receivables and payables exist due to transactions in foreign currency. The Group’s exposure to foreign currency risks is as follows:
Notes to the Consolidated Financial StatementsFor the year ended June 30, 2015
Growth Through Innovation 165
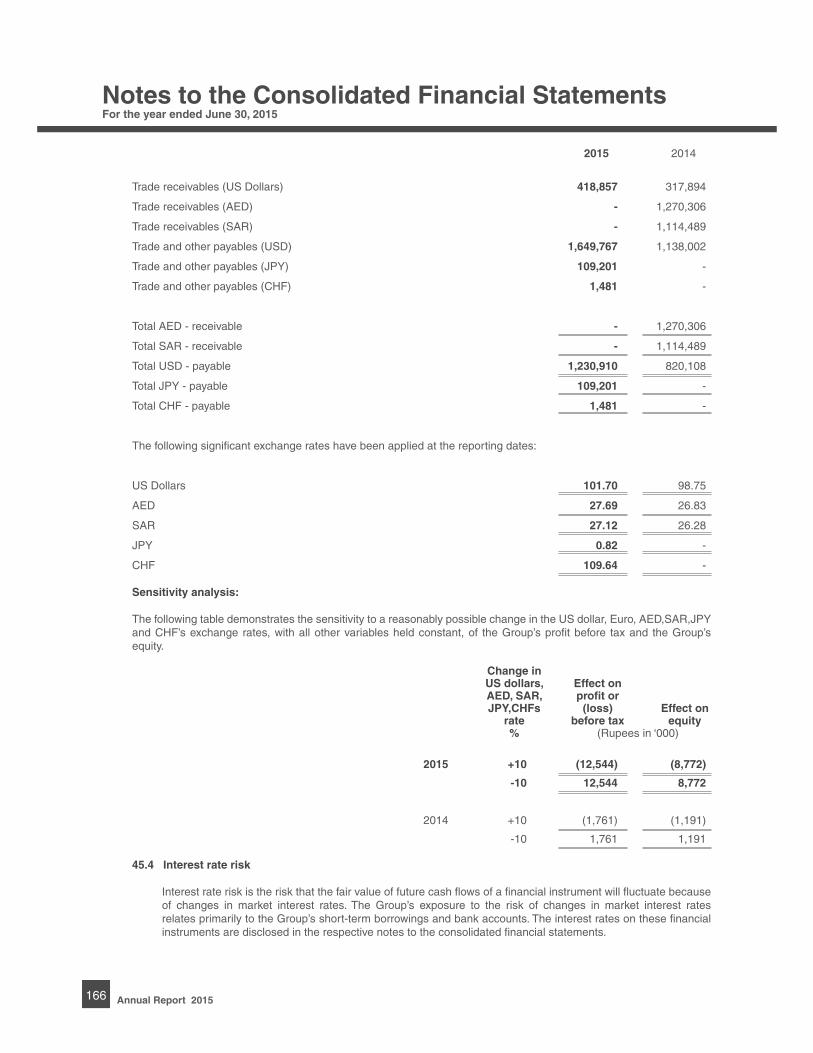
2015 2014
Trade receivables (US Dollars) 418,857 317,894
Trade receivables (AED) - 1,270,306
Trade receivables (SAR) - 1,114,489
Trade and other payables (USD) 1,649,767 1,138,002
Trade and other payables (JPY) 109,201 -
Trade and other payables (CHF) 1,481 -
Total AED - receivable - 1,270,306
Total SAR - receivable - 1,114,489
Total USD - payable 1,230,910 820,108
Total JPY - payable 109,201 -
Total CHF - payable 1,481 -
The following significant exchange rates have been applied at the reporting dates:
US Dollars 101.70 98.75
AED 27.69 26.83
SAR 27.12 26.28
JPY 0.82 -
CHF 109.64 - Sensitivity analysis:
The following table demonstrates the sensitivity to a reasonably possible change in the US dollar, Euro, AED,SAR,JPY
and CHF’s exchange rates, with all other variables held constant, of the Group’s profit before tax and the Group’s equity.
Change in US dollars, Effect on AED, SAR, profit or JPY,CHFs (loss) Effect on rate before tax equity % (Rupees in ‘000)
2015 +10 (12,544) (8,772)
-10 12,544 8,772
2014 +10 (1,761) (1,191)
-10 1,761 1,191
45.4 Interest rate risk
Interest rate risk is the risk that the fair value of future cash flows of a financial instrument will fluctuate because of changes in market interest rates. The Group’s exposure to the risk of changes in market interest rates relates primarily to the Group’s short-term borrowings and bank accounts. The interest rates on these financial instruments are disclosed in the respective notes to the consolidated financial statements.
Notes to the Consolidated Financial StatementsFor the year ended June 30, 2015
Annual Report 2015166
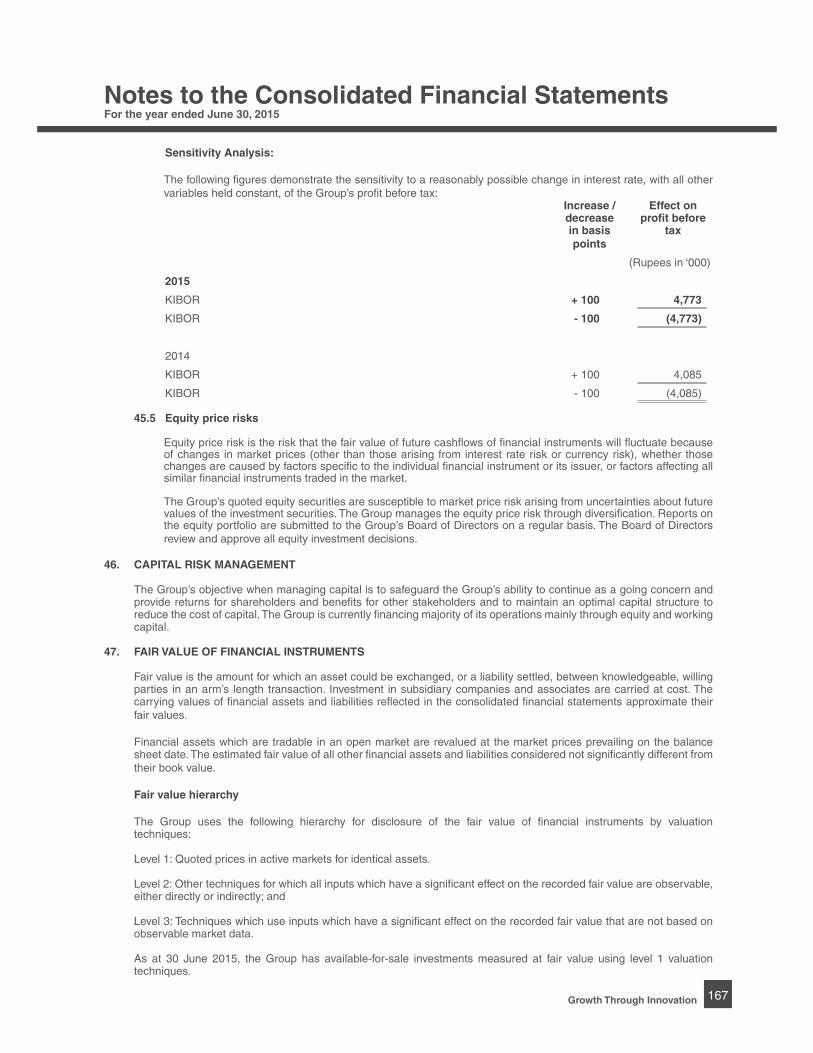
Sensitivity Analysis: The following figures demonstrate the sensitivity to a reasonably possible change in interest rate, with all other
variables held constant, of the Group’s profit before tax: Increase / Effect on decrease profit before in basis tax points
(Rupees in ‘000)
2015
KIBOR + 100 4,773
KIBOR - 100 (4,773)
2014
KIBOR + 100 4,085
KIBOR - 100 (4,085)
45.5 Equity price risks Equity price risk is the risk that the fair value of future cashflows of financial instruments will fluctuate because
of changes in market prices (other than those arising from interest rate risk or currency risk), whether those changes are caused by factors specific to the individual financial instrument or its issuer, or factors affecting all similar financial instruments traded in the market.
The Group’s quoted equity securities are susceptible to market price risk arising from uncertainties about future values of the investment securities. The Group manages the equity price risk through diversification. Reports on the equity portfolio are submitted to the Group’s Board of Directors on a regular basis. The Board of Directors review and approve all equity investment decisions.
46. CAPITAL RISK MANAGEMENT The Group’s objective when managing capital is to safeguard the Group’s ability to continue as a going concern and
provide returns for shareholders and benefits for other stakeholders and to maintain an optimal capital structure to reduce the cost of capital. The Group is currently financing majority of its operations mainly through equity and working capital.
47. FAIR VALUE OF FINANCIAL INSTRUMENTS Fair value is the amount for which an asset could be exchanged, or a liability settled, between knowledgeable, willing
parties in an arm’s length transaction. Investment in subsidiary companies and associates are carried at cost. The carrying values of financial assets and liabilities reflected in the consolidated financial statements approximate their fair values.
Financial assets which are tradable in an open market are revalued at the market prices prevailing on the balance
sheet date. The estimated fair value of all other financial assets and liabilities considered not significantly different from their book value.
Fair value hierarchy The Group uses the following hierarchy for disclosure of the fair value of financial instruments by valuation
techniques:
Level 1: Quoted prices in active markets for identical assets.
Level 2: Other techniques for which all inputs which have a significant effect on the recorded fair value are observable, either directly or indirectly; and
Level 3: Techniques which use inputs which have a significant effect on the recorded fair value that are not based on observable market data.
As at 30 June 2015, the Group has available-for-sale investments measured at fair value using level 1 valuation techniques.
Notes to the Consolidated Financial StatementsFor the year ended June 30, 2015
Growth Through Innovation 167
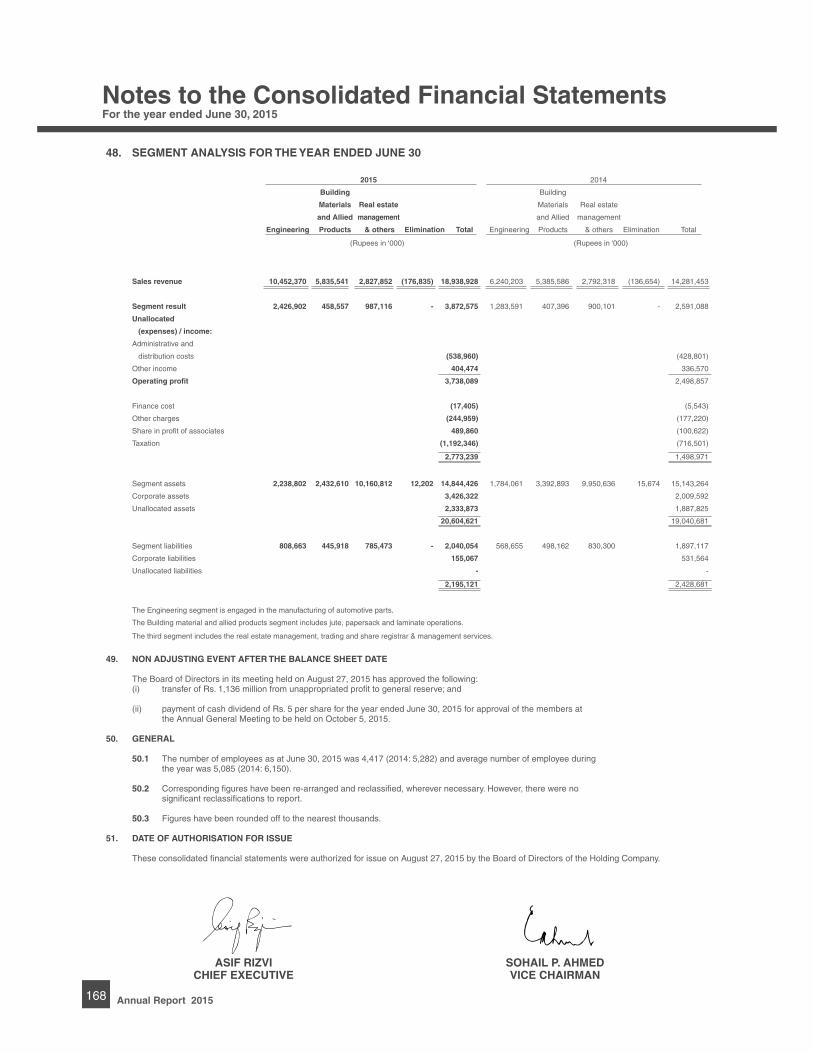
48. SEGMENT ANALYSIS FOR THE YEAR ENDED JUNE 30
2015 2014
Building Building
Materials Real estate Materials Real estate
and Allied management and Allied management
Engineering Products & others Elimination Total Engineering Products & others Elimination Total
(Rupees in ‘000) (Rupees in ‘000)
Sales revenue 10,452,370 5,835,541 2,827,852 (176,835) 18,938,928 6,240,203 5,385,586 2,792,318 (136,654) 14,281,453
Segment result 2,426,902 458,557 987,116 - 3,872,575 1,283,591 407,396 900,101 - 2,591,088
Unallocated
(expenses) / income:
Administrative and
distribution costs (538,960) (428,801)
Other income 404,474 336,570
Operating profit 3,738,089 2,498,857
Finance cost (17,405) (5,543)
Other charges (244,959) (177,220)
Share in profit of associates 489,860 (100,622)
Taxation (1,192,346) (716,501)
2,773,239 1,498,971
Segment assets 2,238,802 2,432,610 10,160,812 12,202 14,844,426 1,784,061 3,392,893 9,950,636 15,674 15,143,264
Corporate assets 3,426,322 2,009,592
Unallocated assets 2,333,873 1,887,825
20,604,621 19,040,681
Segment liabilities 808,663 445,918 785,473 - 2,040,054 568,655 498,162 830,300 1,897,117
Corporate liabilities 155,067 531,564
Unallocated liabilities - -
2,195,121 2,428,681
The Engineering segment is engaged in the manufacturing of automotive parts.
The Building material and allied products segment includes jute, papersack and laminate operations.
The third segment includes the real estate management, trading and share registrar & management services.
49. NON ADJUSTING EVENT AFTER THE BALANCE SHEET DATE The Board of Directors in its meeting held on August 27, 2015 has approved the following: (i) transfer of Rs. 1,136 million from unappropriated profit to general reserve; and (ii) payment of cash dividend of Rs. 5 per share for the year ended June 30, 2015 for approval of the members at the Annual General Meeting to be held on October 5, 2015.
50. GENERAL 50.1 The number of employees as at June 30, 2015 was 4,417 (2014: 5,282) and average number of employee during the year was 5,085 (2014: 6,150).
50.2 Corresponding figures have been re-arranged and reclassified, wherever necessary. However, there were no significant reclassifications to report.
50.3 Figures have been rounded off to the nearest thousands.
51. DATE OF AUTHORISATION FOR ISSUE These consolidated financial statements were authorized for issue on August 27, 2015 by the Board of Directors of the Holding Company.
Notes to the Consolidated Financial StatementsFor the year ended June 30, 2015
Annual Report 2015168
ASIF RIZVICHIEF EXECUTIVE
SOHAIL P. AHMEDVICE CHAIRMAN