Consolidated Financial Statements Summary - TEIJIN · Consolidated Financial Statements Summary...
18
Consolidated Financial Statements Summary (All financial information has been prepared in accordance with accounting principles generally accepted in Japan) August 4, 2014 Company name : TEIJIN LIMITED (Stock code 3401) Contact person : Masahiro Ikeda General Manager, IR section TEL: +81-(0)3-3506-4395 (Amounts less than one million yen are omitted) 1. Highlight of the first quarter of FY14 (April 1, 2014 through June 30, 2014) (1) Consolidated financial results (Percentages are year-on-year changes) % % % % -0.9 162.0 194.0 607.2 5.3 -38.2 -28.3 ― cf. Comprehensive income : 540 million yen (FY2013: 4,830million yen) * E.P.S.: Earnings per share (2) Consolidated financial position cf. Shareholders' equity :281,872 million yen (FY2013: 281,680million yen) 2. Dividends Note: Revision of outlook for dividends in the first quarter: No 3. Forecast for operating results in the year ending March 31, 2015 (Fiscal 2014) (Percentages are interim-on-interim and year-on-year changes) % % % % -1.8 54.2 70.6 -45.3 2.54 -0.6 38.3 13.1 19.7 10.17 Note: Revision of outlook for fiscal 2014 consolidated operating results in the first quarter: No E.P.S. Yen FY2014 interim FY2014 Ordinary income Net income Million yen Million yen Operating income Million yen Million yen 2.00 ― 357,000 Net sales 22,500 10,000 7,000 2,500 Dividends per share 1Q 2Q 3Q 4Q Annual 780,000 25,000 8,000 Yen FY2013 Period FY2014 FY2014 (Outlook) ― 2.00 ― Yen Yen Yen For the three months ended June 30, 2014 For the three months ended June 30, 2013 768,411 300,112 36.7 36.0 For the three months ended June 30, 2014 For the three months ended June 30, 2013 As of June 30, 2014 As of March 31, 2014 Shareholders' equity ratio 300,000 English translation from the original Japanese-language document http://www.teijin.com 4,652 1,582 Total assets 1.67 Million yen Net income Net sales Operating income Ordinary income Million yen Million yen Million yen Net assets 181,858 1,648 233 (For the three months ended June 30, 2014) E.P.S. * Yen Diluted E.P.S. Yen Million yen % 783,801 Million yen 0.24 4,813 183,520 1.68 0.24 1,837 Yen 2.00 4.00 ― 2.00 4.00
Transcript of Consolidated Financial Statements Summary - TEIJIN · Consolidated Financial Statements Summary...
Consolidated Financial Statements Summary
(All financial information has been prepared in accordance with accounting principles generally accepted in Japan) August 4, 2014
Company name : TEIJIN LIMITED (Stock code 3401)
Contact person : Masahiro Ikeda General Manager, IR section TEL: +81-(0)3-3506-4395
(Amounts less than one million yen are omitted)
1. Highlight of the first quarter of FY14 (April 1, 2014 through June 30, 2014)(1) Consolidated financial results (Percentages are year-on-year changes)
% % % %
-0.9 162.0 194.0 607.2
5.3 -38.2 -28.3 ―
cf. Comprehensive income : 540 million yen (FY2013: 4,830million yen)
* E.P.S.: Earnings per share
(2) Consolidated financial position
cf. Shareholders' equity :281,872 million yen (FY2013: 281,680million yen)
2. Dividends
Note: Revision of outlook for dividends in the first quarter: No
3. Forecast for operating results in the year ending March 31, 2015 (Fiscal 2014)
(Percentages are interim-on-interim and year-on-year changes)
% % % %-1.8 54.2 70.6 -45.3 2.54-0.6 38.3 13.1 19.7 10.17
Note: Revision of outlook for fiscal 2014 consolidated operating results in the first quarter: No
E.P.S.Yen
FY2014 interimFY2014
Ordinary income Net incomeMillion yen Million yen
Operating incomeMillion yen Million yen
2.00 ―
357,000
Net sales
22,500 10,0007,000 2,500
Dividends per share
1Q 2Q 3Q 4Q Annual
780,000 25,0008,000
YenFY2013
Period
FY2014
FY2014 (Outlook)
― 2.00
―
Yen Yen Yen
For the three months ended June 30, 2014
For the three months ended June 30, 2013
768,411 300,112 36.736.0
For the three months ended June 30, 2014For the three months ended June 30, 2013
As of June 30, 2014As of March 31, 2014
Shareholders' equityratio
300,000
English translation from the original Japanese-language document
http://www.teijin.com
4,652
1,582
Total assets
1.67
Million yen
Net incomeNet sales Operating income Ordinary income
Million yenMillion yen Million yen
Net assets
181,858 1,648
233
(For the three months ended June 30, 2014)
E.P.S. *
Yen
Diluted E.P.S.
Yen
Million yen %
783,801
Million yen
0.24
4,813
183,520
1.680.24
1,837
Yen
2.00 4.00
― 2.00 4.00

Appropriate Use of Forecasts and Other Information and Other Matters
All forecasts in this document are based on management’s assumptions in light of information currently available and involve certain
risks and uncertainties. Actual results to differ materially from these forecasts. For information on these forecasts, refer to "Qualitative
Information on Outlook for Operating Results", beginning on page 6.
1. Qualitative Information and Financial Statements
Qualitative Information on Results of Operations
Analysis of Consolidated Results of Operations
Economic conditions worldwide were comparatively stable in the three months ended June 30, 2014. In the United
States and other developed countries, signs of a revival persisted, while in Asia and emerging economies growth was
stable, although lacked strength. Japan’s economy remained on the road to recovery, despite a negative rebound in
consumer demand following a sharp rise immediately prior to an increase in the consumption tax, as government
economic policies underpinned domestic demand and the employment environment improved.
In this environment, consolidated net sales remained essentially level, edging down 0.9%, to ¥181.9 billion, as sales
were generally favorable, particularly in materials businesses, countering the impact of the recent discontinuation of
in-house production and sales of paraxylene. Operating income climbed ¥3.0 billion, or approximately 162%, to ¥4.8
billion, bolstered by the impact of restructuring initiatives. Ordinary income, at ¥4.7 billion, was up ¥3.1 billion, or
approximately 194%. Net income amounted to ¥1.6 billion, an increase of ¥1.4 billion. Net income per share rose
¥1.44, to ¥1.68.
Business Segment Results
Advanced Fibers and Composites
Sales in the Advanced Fibers and Composites segment totaled ¥31.4 billion, while operating income was ¥1.7 billion.
High-Performance Fibers
Demand expanded, particularly for automotive applications.
Sales of Twaron para-aramid fibers for automotive applications, including tires, recovered in Europe, and were firm for
infrastructure-related applications, including optical fiber and rope reinforcements, while demand for use in ballistic
protection products and protective clothing remained lackluster. Pricing competition for all applications remained
intense. Sales of Technora para-aramid fibers were stable, reflecting steady sales for automotive applications in Japan
and brisk exports, which were bolstered further by yen depreciation. Sales of Teijinconex meta-aramid fibers for use in
protective clothing and for industrial applications were solid, although sales for use in filters were hampered by
mounting competition despite increased market demand. In polyester fibers, income at our subsidiary in Thailand
remained firm—despite a negative rebound in sales for automotive applications which were robust in fiscal
2013—thanks to healthy sales for use in sportswear, personal hygiene products and general-purpose products, while
income in Japan rallied, bolstered by increased demand for infrastructure-related and civil engineering applications,
among others, and by cost reductions.
Under these circumstances, we resolved to commercialize a new type of meta-aramid fiber offering superior heat
resistance and dyeability and proceeded with preparations to begin production in Thailand in July 2015. Against a
background of increasingly stringent regulations pertaining to heat-resistant materials and environmental safety, we
will focus on expanding our business in promising Asian markets and emerging economies. In the People’s Republic
of China (PRC), our polyester products recycling joint venture in Zhejiang Province pushed ahead with the
construction of a new facility in preparation for the start of operations in fiscal 2014.
– 1 –
Carbon Fibers and Composites
Sales were favorable for use in aircraft, as well as for general industrial applications.
Sales of TENAX carbon fibers for use in aircraft were favorable, as brisk orders for aircraft prompted an increase in
production by leading aircraft manufacturers. Among general industrial applications, demand for use in pressure
vessels for natural gas extraction was firm in North America, supported by the expansion of shale gas development. In
Asia, sales were robust for use in reinforcement materials for civil engineering applications and for use in personal
computer casings. Sales prices, persistently low in recent years, showed signs of recovering, although the outlook
remained difficult to gauge, owing to sales offensives by other manufacturers, particularly late market entrants
overseas.
During the period, sales of our new thermoplastic carbon fiber-reinforced plastic (CFRP) Sereebo, which in fiscal 2013
was chosen for use in the structural components of several new digital single-lens reflex (SLR) cameras, expanded
favorably.
In this environment, we continued working to respond to expanding demand, notably for high-performance products,
as well as to evolve toward a business model that focuses on providing solutions that match the needs of customers
and markets. In particular, we pressed ahead with the development of structural components for mass-produced
vehicles made with Sereebo. To this end, our thermoplastic CFRP pilot plant, situated within the Matsuyama Plant, and
the Teijin Composites Application Center, located in Metro Detroit, in the United States, are collaborating on multiple
projects targeted at developing specific components and establishing mass-production procedures, and are making
steady progress on both fronts.
Electronics Materials and Performance Polymer Products
The Electronics Materials and Performance Polymer Products segment reported sales of ¥46.2 billion and operating
income of ¥0.7 billion.
Resin and Plastics Processing
Profitability improved, thanks to efforts to reduce costs.
The profitability of mainstay polycarbonate resin products Panlite and Multilon improved, bolstered by the
implementation of measures aimed at shrinking fixed costs and reducing costs associated with the procurement of raw
materials. While the supply–demand balance remained soft, hindering sales overall, sales were firm for light-emitting
diode (LED) lighting applications, as well as for use in other electrical and electronics components. We also sought to
take advantage of robust market conditions to expand sales for automotive applications in the PRC and Europe.
In processed plastics, we saw an increase in sales of PURE-ACE RM, a reverse-dispersion solvent-cast retardation
film for use as an antireflective film for smartphones and tablet computers.
Among high-performance resins, sales of specialty polycarbonate resin for use in smartphone camera lenses
increased. We also took decisive steps to expand sales of our polyethylene naphthalate (PEN) resin, the first resin to
be adopted for use in fire extinguishers.
– 2 –
Films
Sales for use in smartphones and tablet computers remained firm, while restructuring initiatives began to yield benefits
in terms of the reduction of fixed costs.
In the area of products for electronics applications, sales of release films for manufacturing processes remained firm,
notably for use in smartphones and tablet computers. In contrast, increasingly fierce competition continued to drive
down sales prices for films for use in liquid crystal display (LCD) televisions, which struggled in fiscal 2013, despite
signs of a recovery in demand, particularly in the PRC. In this environment, we suspended operations on the PET film
line at our domestic joint venture’s Ibaraki factory in December 2013, thereby reducing fixed costs. Looking ahead, we
will focus on further enhancing production line efficiency, with the aim of restoring cost competitiveness, as well as on
strengthening collaborative development with customers for a broad range of applications and expanding sales.
Overseas, profitability in the United Stated and Europe showed signs of recovering, as demand for healthcare and
packaging applications rallied. In light of firm demand for industrial and packaging applications, we sought to maintain
profitability in the PRC by leveraging our superior technological and quality control capabilities to capitalize on sales
opportunities.
Healthcare
Sales in the Healthcare segment came to ¥33.2 billion, while operating income was ¥5.7 billion.
Pharmaceuticals
Sales of our novel treatment for hyperuricemia and gout expanded favorably.
Operating conditions for our domestic pharmaceuticals business remained harsh, owing to the April 2014 revision of
reimbursement prices for prescription pharmaceuticals under Japan’s National Health Insurance (NHI) scheme and to
rising sales of generic drugs following adjustments to fees for medical services. Nonetheless, sales of hyperuricemia
and gout treatment Feburic (febuxostat) expanded favorably, further boosting our leading share of the Japanese
market for such treatments. We also continued working to broaden choices for osteoporosis sufferers by introducing
new formulations of osteoporosis treatment Bonalon®*, including an intravenous and an oral jelly, both firsts for Japan.
Sales of febuxostat also continued to expand favorably overseas. We have secured exclusive distributorship
agreements for febuxostat covering 117 countries and territories. The drug is currently sold in 37 of these countries
and territories, and we are in the process of obtaining regulatory approval to make it available in the others.
In R&D, we signed an agreement with U.K. pharmaceuticals manufacturer Sigma-Tau Pharma Ltd., gaining exclusive
development and distribution rights in Japan for EZN-2279, a therapeutic agent for adenosine deaminase (ADA)
deficiency developed by Sigma-Tau, and began preparing for domestic clinical trials. We also proceeded with the
development of KTF-374, an innovative sheet-type fibrin surgical sealant, while core segment subsidiary Teijin Pharma
Limited and the Chemo-Sero-Therapeutic Research Institute (Kaketsuken) prepared for the launch of clinical trials in
Japan. In June 2014, we commenced clinical trials in Japan for TMX-67XR (Feburic Tablet) (febuxostat), a new
formulation with a revised dosage volume.
* Bonalon® is the registered trademark of Merck Sharp & Dohme Corp., Whitehouse Station, NJ, U.S.A.
– 3 –
Home Healthcare
Rental volumes remained high or increased.
We currently provide home healthcare services to approximately 430,000 individuals in Japan and overseas. In Japan,
rental volume for mainstay therapeutic oxygen concentrators for home oxygen therapy (HOT) remained firm, thanks to
the release of new therapeutic oxygen concentrator models Hi-Sanso 3S and Hi-Sanso Portable α (alpha). In June
2014, we launched Hi-Sanso 5S and Sanso Saver 5, a new unit that helps resolve concerns and inconvenience for
HOT patients in the event of a disaster or a major power failure. Rental volume for continuous positive airway pressure
(CPAP) ventilators for the treatment of sleep apnea syndrome (SAS) advanced favorably, augmented by the launch of
NemLink, a monitoring system for CPAP ventilators that uses mobile phone networks and which also provides
pertinent data to medical care facilities to enhance the effectiveness of treatment. Rentals of our noninvasive positive
pressure ventilators (NPPVs) (the NIP NASAL series and AutoSet CS) and for SAFHS (Sonic Accelerated Fracture
Healing System) also rose encouragingly. To fortify support services for individuals, we sought to improve our ability to
respond effectively to patient needs by capitalizing on our new home healthcare call center in Osaka, which was
established in fiscal 2013. We are gradually expanding marketing of the WalkAide System, a neuromuscular electrical
stimulation device for the treatment of gait impairment resulting from stroke and other causes launched in fiscal 2013,
which currently focuses on the Tokyo metropolitan area, to medical institutions in other areas of the country.
Overseas, we currently provide home healthcare services in the United States, Spain and the Republic of Korea
(ROK). In the period under review, operating conditions in the United States remained harsh, a consequence of
healthcare system reform and sizeable ensuing declines in medical treatment fees and other factors. We responded
by taking steps to restore profitability, including integrating sales bases and reducing headcount.
Trading and Retail
The Trading and Retail segment yielded sales of ¥57.5 billion and operating income of ¥0.8 billion.
Fiber Materials and Apparel
Efforts continued to focus on offering distinctive products that are both functional and fashionable.
In the fiber materials and apparel business, domestic sales and exports of textiles for use in sportswear were firm for
fall and winter items. Exports of textiles for use in ladies’ fashions were robust to Europe and North America, although
sales for use in uniforms got off to a sluggish start. In textiles and apparel, the slump in sales that followed Japan’s
consumption tax hike was largely in line with expectations, but shipments of summer apparel flagged, owing to
unseasonable weather, with stagnancy carrying over into shipments of materials for use in fall and winter apparel. In
June 2014, we staged a comprehensive exhibition of highly functional apparel products for spring and summer 2015.
Attendees gave high marks to the event and to the items shown, particularly composite materials made with our
exclusive SOLOTEX polytrimethylene terephthalate (PTT) fibers.
Industrial Textiles and Materials
Steps were taken to accelerate global sales of products for automotive applications.
In industrial fabrics, sales of yarn for airbags, tire cords, materials for vehicle seats and other materials and
components for automotive applications remained brisk. In general-purpose materials, shipments of tents, unwoven
– 4 –
fabrics, materials for civil engineering applications and materials for bag filters were firm.
In June 2014, we established a tire cord production joint venture that is expected to commence operations in October
2015. We also began building a new processing line for automotive hose cords at subsidiary Teijin Cord (Thailand) Co.,
Ltd. This will position us to accelerate sales of rubber materials for automotive applications to the Asian automobile
industry, which is expected to continue expanding in the years ahead.
Qualitative Information on Financial Position
Analysis of Assets, Liabilities, Net Assets and Cash Flows
Assets, Liabilities and Net Assets
Total assets as of June 30, 2014, amounted to ¥783.8 billion, up ¥15.4 billion from the end of fiscal 2013. This was
primarily attributable to increases in stock purchases and in the valuation difference on available-for-sale securities.
Despite an increase in inventories attributable to seasonal factors, notes and accounts receivable–trade and fixed
assets decreased.
Total liabilities, at ¥483.8 billion, were up ¥15.5 billion from the fiscal 2013 year-end. Interest-bearing debt, which
included commercial paper, short-term loans payable and long-term loans payable, rose ¥21.9 billion, to ¥303.4 billion.
Total net assets were essentially level at ¥300.0 billion, a decline of ¥0.1 billion. Total shareholders’ equity and total
valuation and translation adjustments together represented ¥281.9 billion of the total, up ¥0.2 billion.
– 5 –
Qualitative Information on Outlook for Operating Results
Outlook for Fiscal 2014
Forecast for Operating Results
(Billions of yen/%)
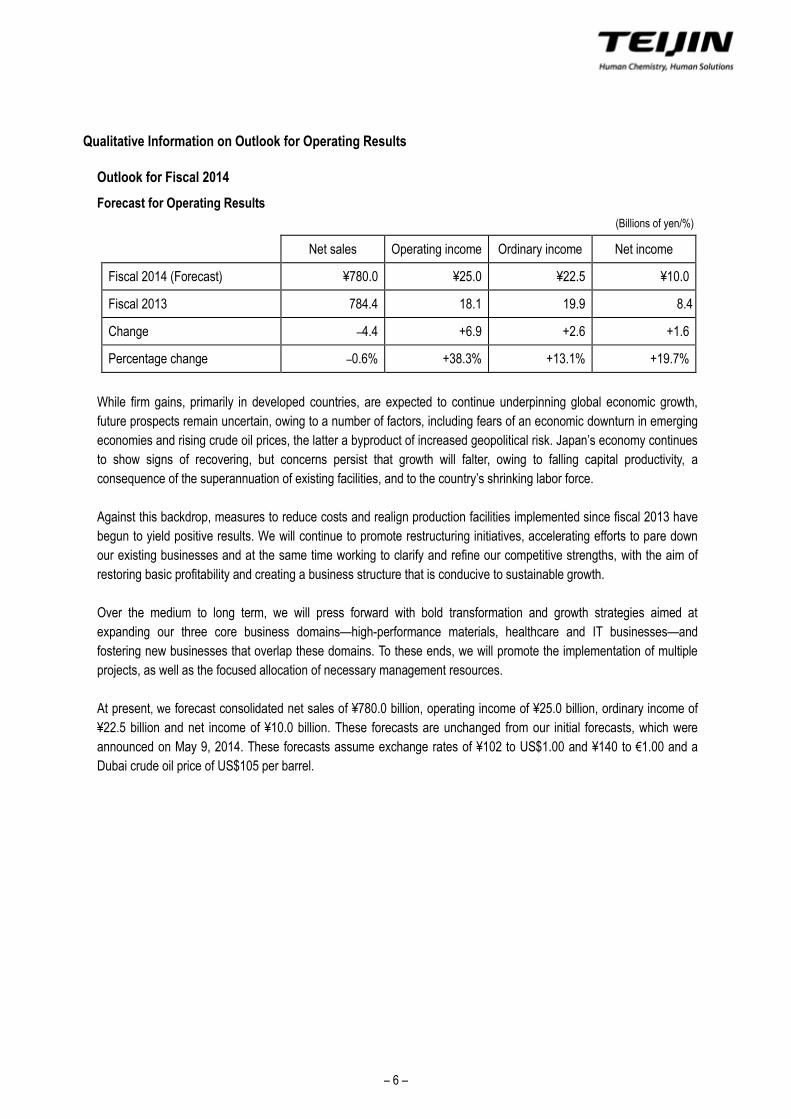
Net sales Operating income Ordinary income Net income
Fiscal 2014 (Forecast) ¥780.0 ¥25.0 ¥22.5 ¥10.0
Fiscal 2013 784.4 18.1 19.9 8.4
Change –4.4 +6.9 +2.6 +1.6
Percentage change –0.6% +38.3% +13.1% +19.7%
While firm gains, primarily in developed countries, are expected to continue underpinning global economic growth,
future prospects remain uncertain, owing to a number of factors, including fears of an economic downturn in emerging
economies and rising crude oil prices, the latter a byproduct of increased geopolitical risk. Japan’s economy continues
to show signs of recovering, but concerns persist that growth will falter, owing to falling capital productivity, a
consequence of the superannuation of existing facilities, and to the country’s shrinking labor force.
Against this backdrop, measures to reduce costs and realign production facilities implemented since fiscal 2013 have
begun to yield positive results. We will continue to promote restructuring initiatives, accelerating efforts to pare down
our existing businesses and at the same time working to clarify and refine our competitive strengths, with the aim of
restoring basic profitability and creating a business structure that is conducive to sustainable growth.
Over the medium to long term, we will press forward with bold transformation and growth strategies aimed at
expanding our three core business domains—high-performance materials, healthcare and IT businesses—and
fostering new businesses that overlap these domains. To these ends, we will promote the implementation of multiple
projects, as well as the focused allocation of necessary management resources.
At present, we forecast consolidated net sales of ¥780.0 billion, operating income of ¥25.0 billion, ordinary income of
¥22.5 billion and net income of ¥10.0 billion. These forecasts are unchanged from our initial forecasts, which were
announced on May 9, 2014. These forecasts assume exchange rates of ¥102 to US$1.00 and ¥140 to €1.00 and a
Dubai crude oil price of US$105 per barrel.
– 6 –
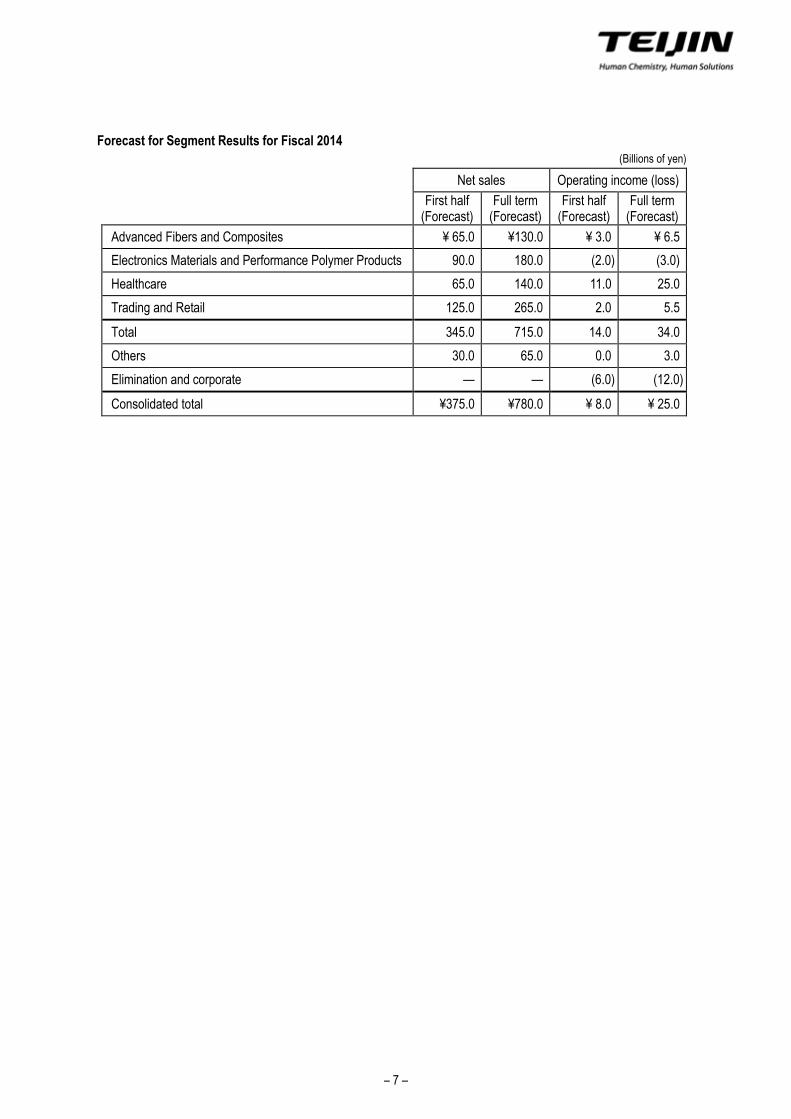
Forecast for Segment Results for Fiscal 2014
(Billions of yen)
Net sales Operating income (loss)
First half (Forecast)
Full term (Forecast)
First half (Forecast)
Full term (Forecast)
Advanced Fibers and Composites ¥ 65.0 ¥130.0 ¥ 3.0 ¥ 6.5
Electronics Materials and Performance Polymer Products 90.0 180.0 (2.0) (3.0)
Healthcare 65.0 140.0 11.0 25.0
Trading and Retail 125.0 265.0 2.0 5.5
Total 345.0 715.0 14.0 34.0
Others 30.0 65.0 0.0 3.0
Elimination and corporate — — (6.0) (12.0)
Consolidated total ¥375.0 ¥780.0 ¥ 8.0 ¥ 25.0
– 7 –
2. Other Information
Changes in significant subsidiaries during the period under review:
None
Adoption of special quarterly accounting methods:
Certain of the Company’s consolidated subsidiaries have adopted a method for estimating in practical terms the
effective tax rate for the fiscal year, including for the first quarter, following the application of tax effect accounting to
income before income taxes, and multiplying this by quarterly income before income taxes to estimate quarterly tax
expense.
Changes in accounting principles, procedures and presentation methods:
Application of Accounting Standard for Retirement Benefits
Effective from the three months ended June 30, 2014, the Company has applied the accounting rules stipulated in
Clause 35 of the “Accounting Standard for Retirement Benefits” (Accounting Standards Board of Japan (ASBJ)
Statement No. 26, issued on May 17, 2012) and the guidelines outlined in Clause 67 of the “Guidance on Accounting
Standard for Retirement Benefits” (ASBJ Guidance No. 25, issued on May 17, 2012). Accordingly, the method of
attributing expected benefits to periods has been changed from the straight-line basis to the benefit formula basis
and the basis for determining the discount rate has been amended from the expected average remaining working
lives of employees and average period up to the estimated timing of benefit payment to a single weighted-average
discount rate that reflects the estimated timing and amount of benefit payment.
The application of the new accounting standard and its accompanying guidance is subject to the transitional
accounting treatment set forth in Clause 37 of the standard. At the beginning of the first quarter of fiscal 2014,
remeasurements of defined benefit plans were included in retained earnings to reflect the impact of this change in
method of accounting. This change added ¥574 million to the “other” component of investments and other assets,
reduced net defined benefit liability by ¥1,589 million and increased retained earnings by ¥1,465 million in the first
quarter of fiscal 2014. The effect of this change on operating, ordinary and net income and losses in the first quarter
of fiscal 2014 was negligible. The effect of this change on segment information was also negligible and has thus not
been reported.
Italicized product names and service names in this report are trademarks or registered trademarks of the Teijin Group in Japan
and/or other countries. Where noted, other italicized product names and service names used in this document are protected as
the trademarks and/or trade names of other companies.
– 8 –
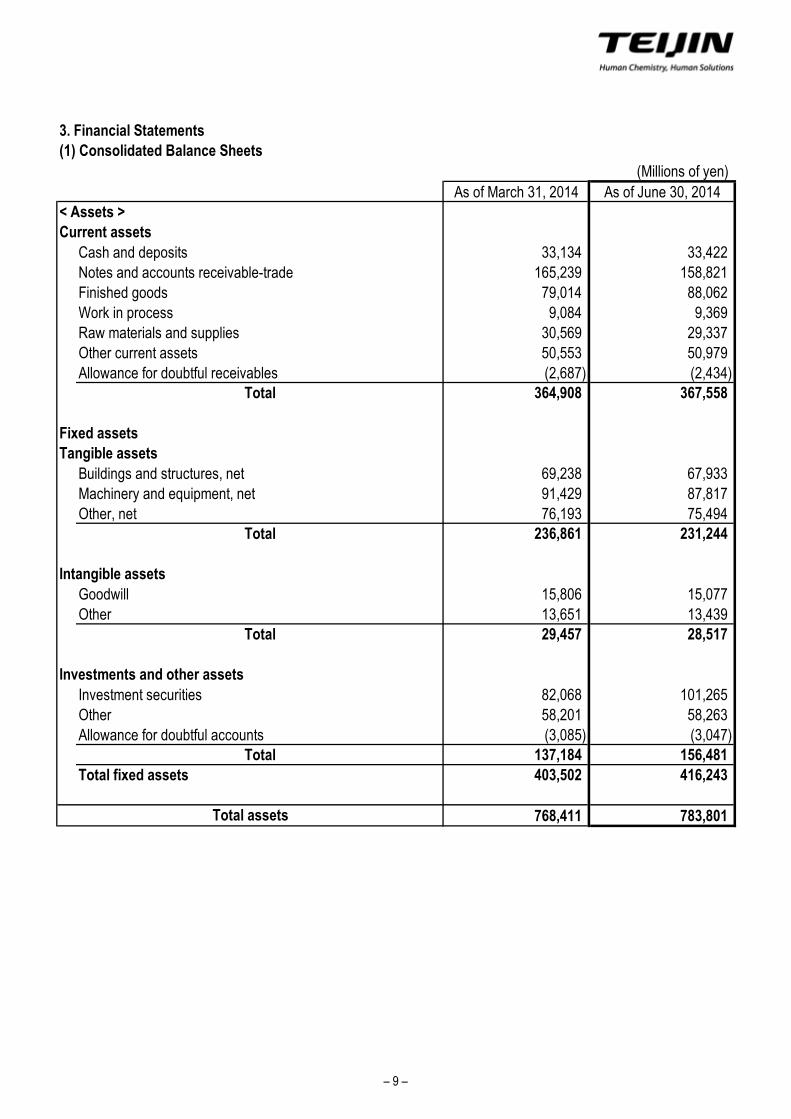
3. Financial Statements
(1) Consolidated Balance Sheets
(Millions of yen)
As of March 31, 2014 As of June 30, 2014< Assets >
Current assets
Cash and deposits 33,134 33,422
Notes and accounts receivable-trade 165,239 158,821
Finished goods 79,014 88,062
Work in process 9,084 9,369
Raw materials and supplies 30,569 29,337
Other current assets 50,553 50,979
Allowance for doubtful receivables (2,687) (2,434)Total 364,908 367,558
Fixed assets
Tangible assets
Buildings and structures, net 69,238 67,933
Machinery and equipment, net 91,429 87,817
Other, net 76,193 75,494Total 236,861 231,244
Intangible assets
Goodwill 15,806 15,077
Other 13,651 13,439Total 29,457 28,517
Investments and other assets
Investment securities 82,068 101,265
Other 58,201 58,263
Allowance for doubtful accounts (3,085) (3,047)Total 137,184 156,481
Total fixed assets 403,502 416,243
768,411 783,801Total assets
– 9 –
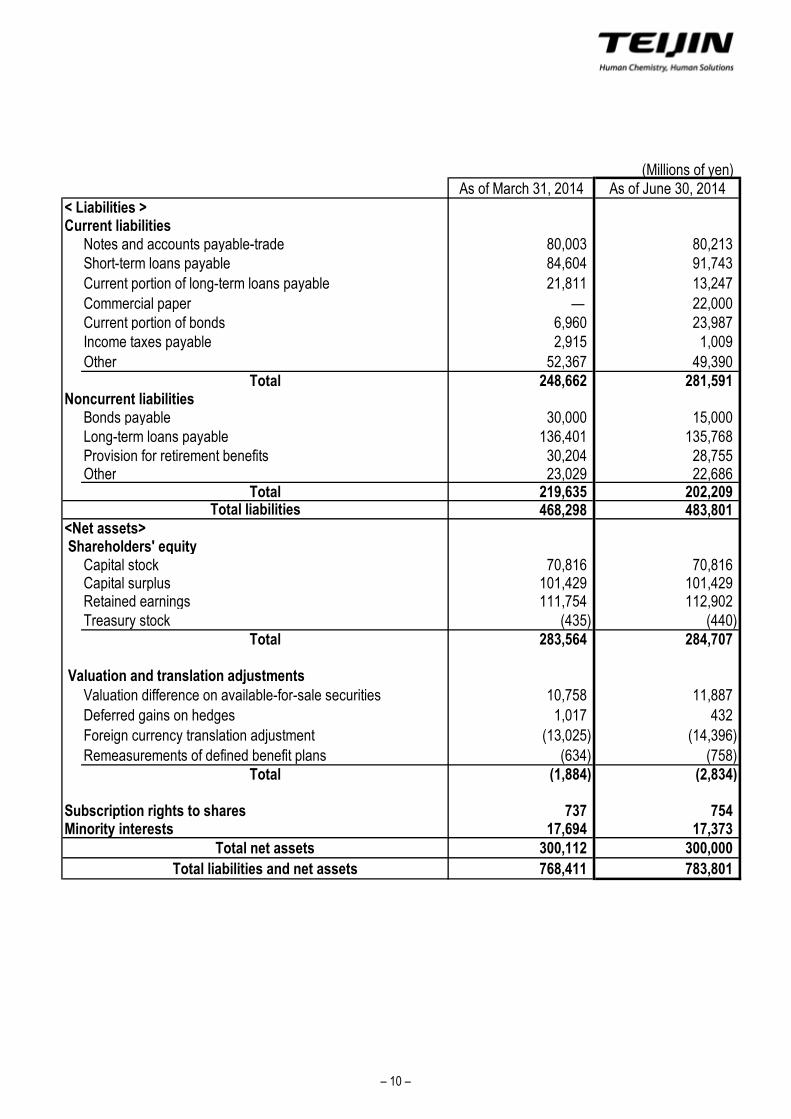
(Millions of yen)As of March 31, 2014 As of June 30, 2014
< Liabilities >Current liabilities
Notes and accounts payable-trade 80,003 80,213Short-term loans payable 84,604 91,743
Current portion of long-term loans payable 21,811 13,247
Commercial paper — 22,000Current portion of bonds 6,960 23,987Income taxes payable 2,915 1,009
Other 52,367 49,390Total 248,662 281,591
Noncurrent liabilitiesBonds payable 30,000 15,000Long-term loans payable 136,401 135,768Provision for retirement benefits 30,204 28,755Other 23,029 22,686
Total 219,635 202,209468,298 483,801
<Net assets>Shareholders' equity
Capital stock 70,816 70,816Capital surplus 101,429 101,429Retained earnings 111,754 112,902Treasury stock (435) (440)
Total 283,564 284,707
Valuation and translation adjustmentsValuation difference on available-for-sale securities 10,758 11,887
Deferred gains on hedges 1,017 432
Foreign currency translation adjustment (13,025) (14,396)
Remeasurements of defined benefit plans (634) (758)Total (1,884) (2,834)
Subscription rights to shares 737 754Minority interests 17,694 17,373
Total net assets 300,112 300,000
Total liabilities and net assets 768,411 783,801
Total liabilities
– 10 –
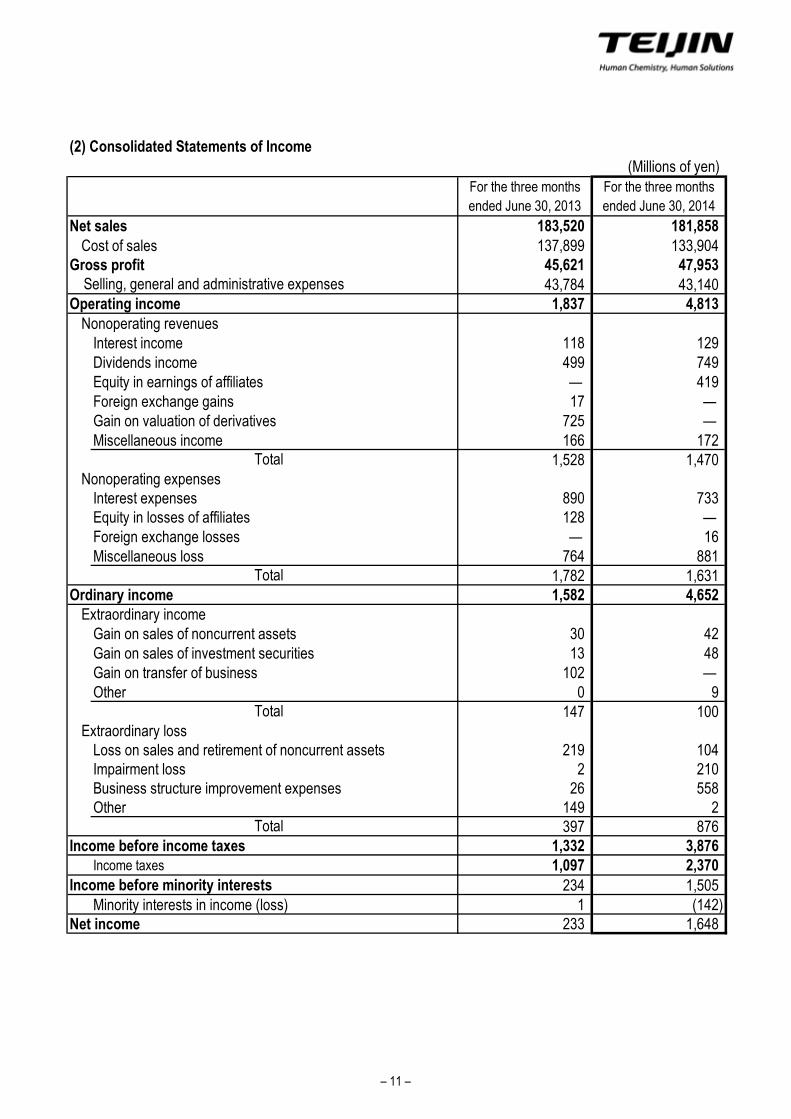
(2) Consolidated Statements of Income
(Millions of yen)
Net sales 183,520 181,858Cost of sales 137,899 133,904
Gross profit 45,621 47,95343,784 43,140
Operating income 1,837 4,813Nonoperating revenues
Interest income 118 129Dividends income 499 749Equity in earnings of affiliates — 419Foreign exchange gains 17 —Gain on valuation of derivatives 725 —Miscellaneous income 166 172
1,528 1,470Nonoperating expenses
Interest expenses 890 733Equity in losses of affiliates 128 —Foreign exchange losses — 16Miscellaneous loss 764 881
1,782 1,631Ordinary income 1,582 4,652
Extraordinary incomeGain on sales of noncurrent assets 30 42Gain on sales of investment securities 13 48Gain on transfer of business 102 —Other 0 9
147 100Extraordinary loss
Loss on sales and retirement of noncurrent assets 219 104Impairment loss 2 210Business structure improvement expenses 26 558Other 149 2
397 876Income before income taxes 1,332 3,876
Income taxes 1,097 2,370Income before minority interests 234 1,505
Minority interests in income (loss) 1 (142)Net income 233 1,648
Total
For the three months
ended June 30, 2014
For the three months
ended June 30, 2013
Selling, general and administrative expenses
Total
Total
Total
– 11 –
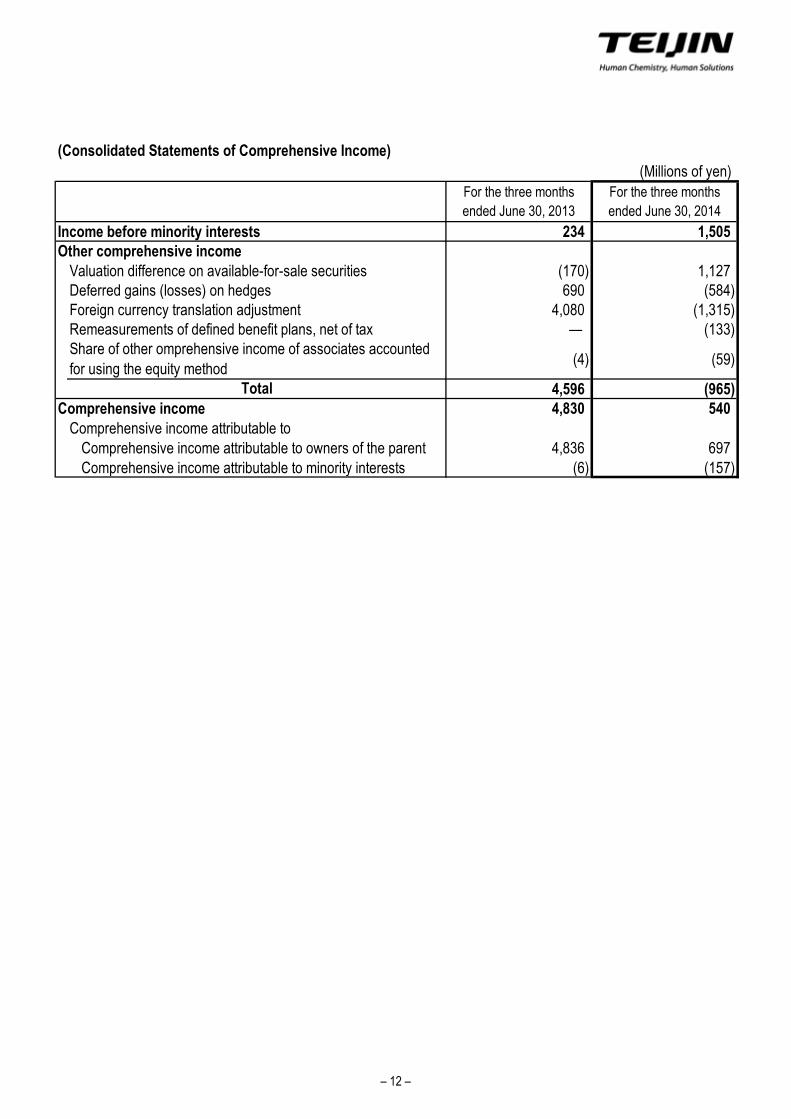
(Consolidated Statements of Comprehensive Income)
(Millions of yen)
Income before minority interests 234 1,505Other comprehensive income
Valuation difference on available-for-sale securities (170) 1,127Deferred gains (losses) on hedges 690 (584)Foreign currency translation adjustment 4,080 (1,315)Remeasurements of defined benefit plans, net of tax — (133)
(4) (59)
4,596 (965)Comprehensive income 4,830 540
Comprehensive income attributable toComprehensive income attributable to owners of the parent 4,836 697Comprehensive income attributable to minority interests (6) (157)
Total
Share of other omprehensive income of associates accounted
for using the equity method
For the three months
ended June 30, 2013
For the three months
ended June 30, 2014
– 12 –
(3) Notes Pertaining to Going Concern Assumption
No
(4) Notes on Significant Changes in Shareholders' Equity
No
(5) Segment Information, etc.
I. Outline of segments
The Company's reportable operating segments are components of an entity for which separate financial information is available
and evaluated regularly by its chief decision-making authority in determining the allocation of management resources and in
assessing performance. The Company currently divides its operations into business groups, based on type of product, nature
of business and services provided. The business groups formulate product and service strategies in a comprehensive manner in
Japan and overseas.
Accordingly, the Company divides its operations into four reportable operating segments on the same basis as it uses internally:
Advanced Fibers and Composites (comprising High-Performance Fibers and Carbon Fibers and Composites); Electronics Materials and
Performance Polymer Products (comprising Polycarbonate Resin and Plastics Processing, and Films); Healthcare; and Trading and Retail.
Within the Advanced Fibers and Composites segment, the High-Performance Fibers business encompasses the production and sale of
advanced aramid fibers and polyester fibers for industrial applications, and the Carbon Fibers and Composites business includes the production
and sales of carbon fibers and composites. Within the Electronics Materials and Performance Polymer Products segment, the Polycarbonate
Resin and Plastics Processing business involves the production and sale of polycarbonate resin, other resins and resin products, while
the Films business includes the production and sales of polyester films. Healthcare encompasses the production and sales of pharmaceuticals,
the production and rental of home healthcare devices and the provision of home healthcare services. Trading and Retail focuses on the planning,
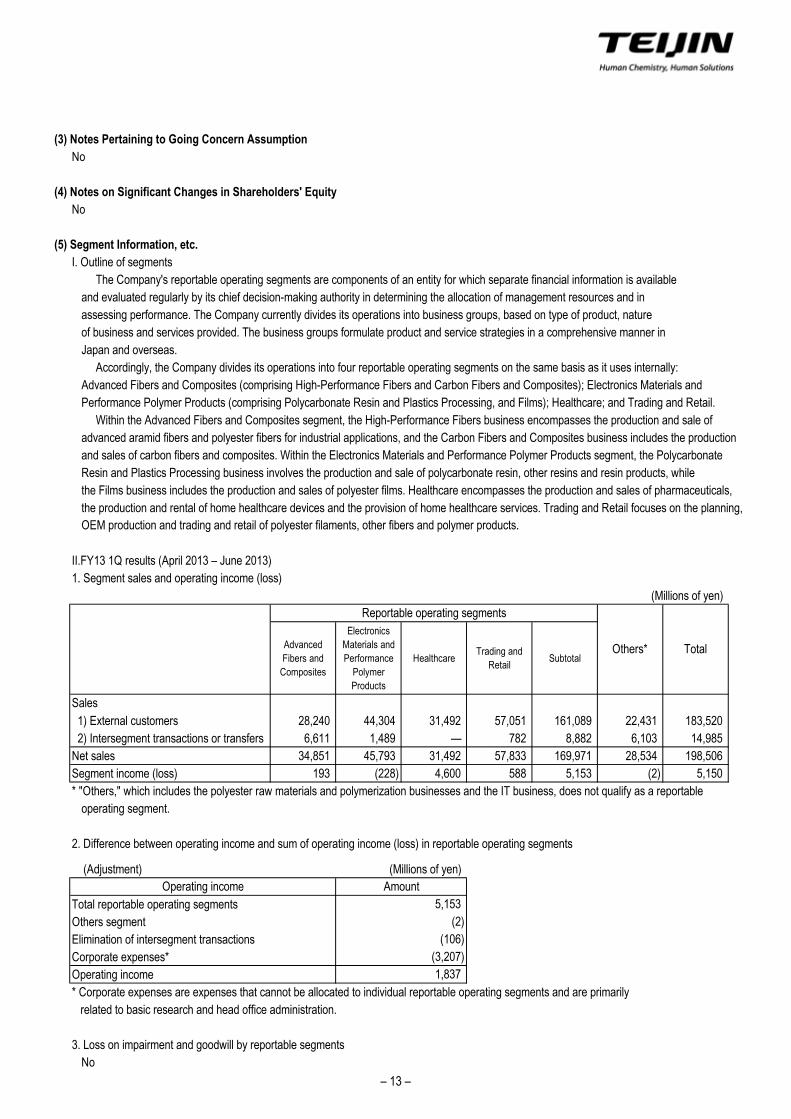
II.FY13 1Q results (April 2013 – June 2013)
1. Segment sales and operating income (loss)
(Millions of yen)
Advanced
Fibers and
Composites
Electronics
Materials and
Performance
Polymer
Products
HealthcareTrading and
RetailSubtotal
1) External customers 28,240 44,304 31,492 57,051 161,089 22,431 183,520
2) Intersegment transactions or transfers 6,611 1,489 — 782 8,882 6,103 14,985
Net sales 34,851 45,793 31,492 57,833 169,971 28,534 198,506
Segment income (loss) 193 (228) 4,600 588 5,153 (2) 5,150
* "Others," which includes the polyester raw materials and polymerization businesses and the IT business, does not qualify as a reportable
operating segment.
2. Difference between operating income and sum of operating income (loss) in reportable operating segments
(Adjustment) (Millions of yen)
Total reportable operating segments
Others segment
Elimination of intersegment transactions
Corporate expenses*
Operating income
* Corporate expenses are expenses that cannot be allocated to individual reportable operating segments and are primarily
related to basic research and head office administration.
3. Loss on impairment and goodwill by reportable segments
No
(3,207)
1,837
OEM production and trading and retail of polyester filaments, other fibers and polymer products.
Reportable operating segments
Others*
(2)
(106)
Total
Sales
Operating income Amount
5,153
– 13 –
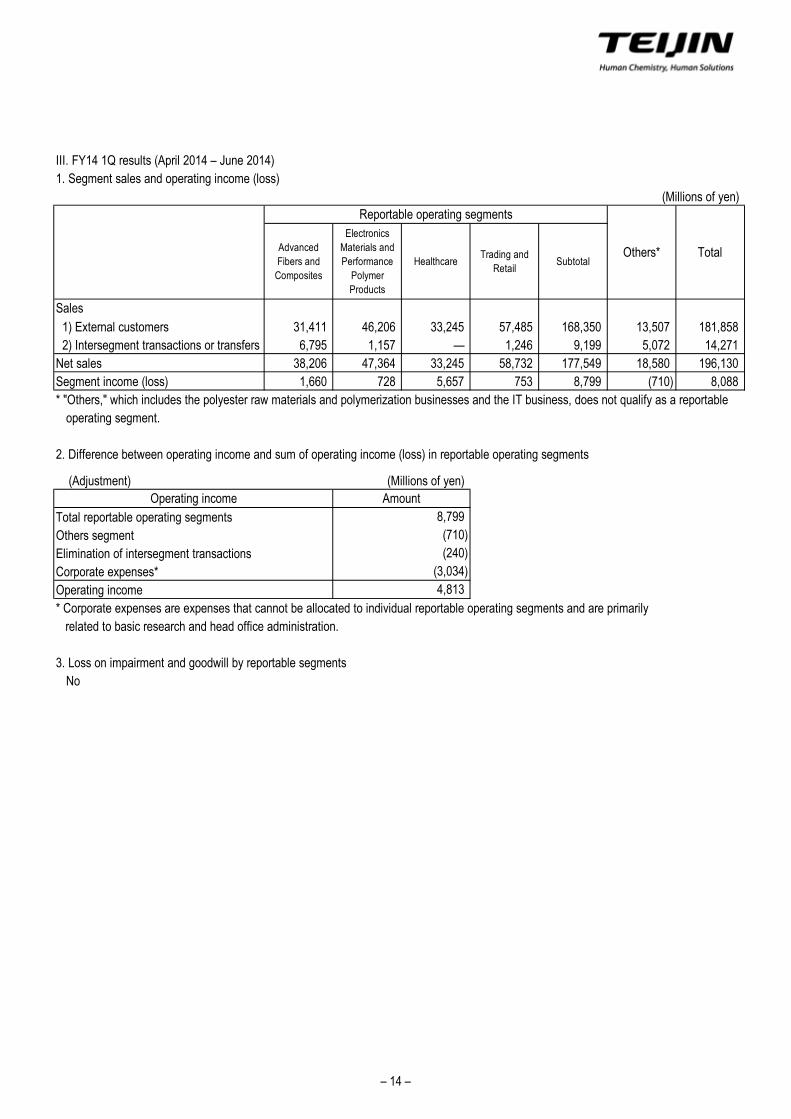
III. FY14 1Q results (April 2014 – June 2014)
1. Segment sales and operating income (loss)
(Millions of yen)
Advanced
Fibers and
Composites
Electronics
Materials and
Performance
Polymer
Products
HealthcareTrading and
RetailSubtotal
1) External customers 31,411 46,206 33,245 57,485 168,350 13,507 181,858
2) Intersegment transactions or transfers 6,795 1,157 — 1,246 9,199 5,072 14,271
Net sales 38,206 47,364 33,245 58,732 177,549 18,580 196,130
Segment income (loss) 1,660 728 5,657 753 8,799 (710) 8,088
* "Others," which includes the polyester raw materials and polymerization businesses and the IT business, does not qualify as a reportable
operating segment.
2. Difference between operating income and sum of operating income (loss) in reportable operating segments
(Adjustment) (Millions of yen)
Total reportable operating segments
Others segment
Elimination of intersegment transactions
Corporate expenses*
Operating income
* Corporate expenses are expenses that cannot be allocated to individual reportable operating segments and are primarily
related to basic research and head office administration.
3. Loss on impairment and goodwill by reportable segments
No
(3,034)
4,813
Total
8,799
(710)
(240)
Sales
Reportable operating segments
Others*
Operating income Amount
– 14 –
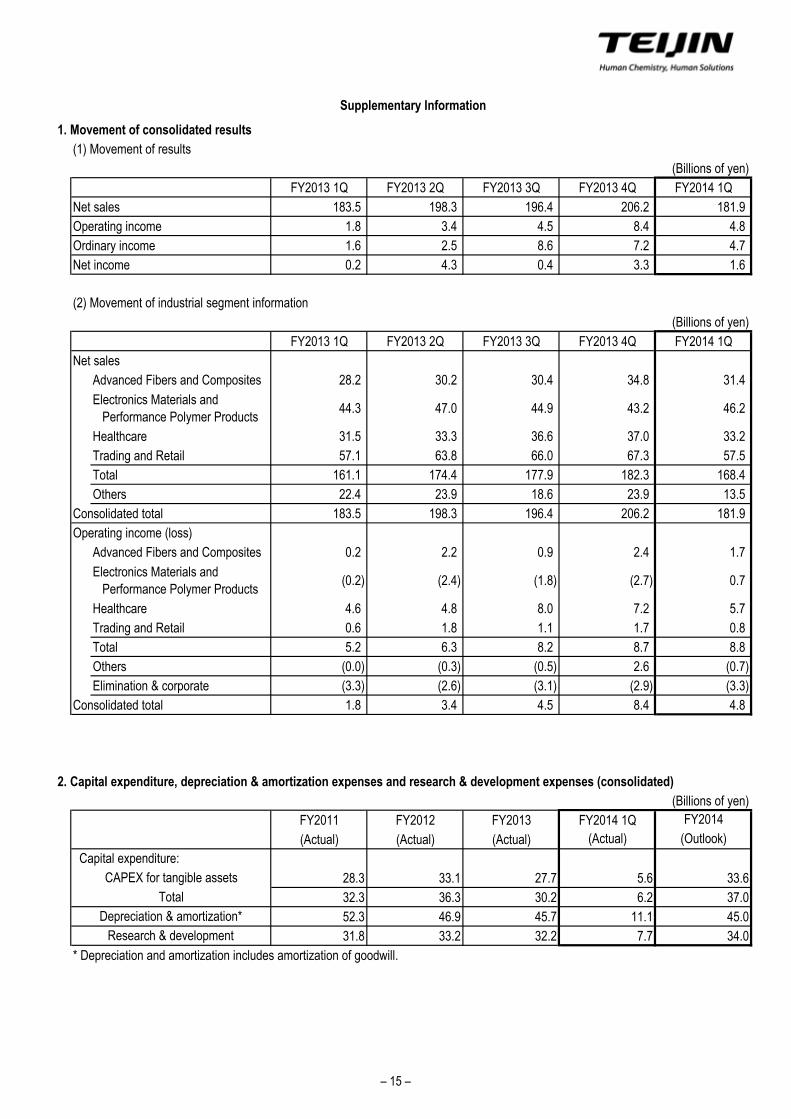
1. Movement of consolidated results
(1) Movement of results
(Billions of yen)
FY2013 1Q FY2013 2Q FY2013 3Q FY2013 4Q FY2014 1Q
Net sales 183.5 198.3 196.4 206.2 181.9
Operating income 1.8 3.4 4.5 8.4 4.8
Ordinary income 1.6 2.5 8.6 7.2 4.7
Net income 0.2 4.3 0.4 3.3 1.6
(2) Movement of industrial segment information
(Billions of yen)
FY2013 1Q FY2013 2Q FY2013 3Q FY2013 4Q FY2014 1Q
Net sales
Advanced Fibers and Composites 28.2 30.2 30.4 34.8 31.4
Electronics Materials and
Performance Polymer Products44.3 47.0 44.9 43.2 46.2
Healthcare 31.5 33.3 36.6 37.0 33.2
Trading and Retail 57.1 63.8 66.0 67.3 57.5
Total 161.1 174.4 177.9 182.3 168.4
Others 22.4 23.9 18.6 23.9 13.5
Consolidated total 183.5 198.3 196.4 206.2 181.9
Operating income (loss)
Advanced Fibers and Composites 0.2 2.2 0.9 2.4 1.7
Electronics Materials and
Performance Polymer Products(0.2) (2.4) (1.8) (2.7) 0.7
Healthcare 4.6 4.8 8.0 7.2 5.7
Trading and Retail 0.6 1.8 1.1 1.7 0.8
Total 5.2 6.3 8.2 8.7 8.8
Others (0.0) (0.3) (0.5) 2.6 (0.7)
Elimination & corporate (3.3) (2.6) (3.1) (2.9) (3.3)
Consolidated total 1.8 3.4 4.5 8.4 4.8
2. Capital expenditure, depreciation & amortization expenses and research & development expenses (consolidated)
(Billions of yen)
FY2011 FY2012 FY2013 FY2014 1Q FY2014
(Actual) (Actual) (Actual) (Actual) (Outlook)
28.3 33.1 27.7 5.6 33.6
32.3 36.3 30.2 6.2 37.0
52.3 46.9 45.7 11.1 45.0
31.8 33.2 32.2 7.7 34.0
* Depreciation and amortization includes amortization of goodwill.
Research & development
Supplementary Information
Depreciation & amortization*
Capital expenditure:
CAPEX for tangible assets
Total
– 15 –
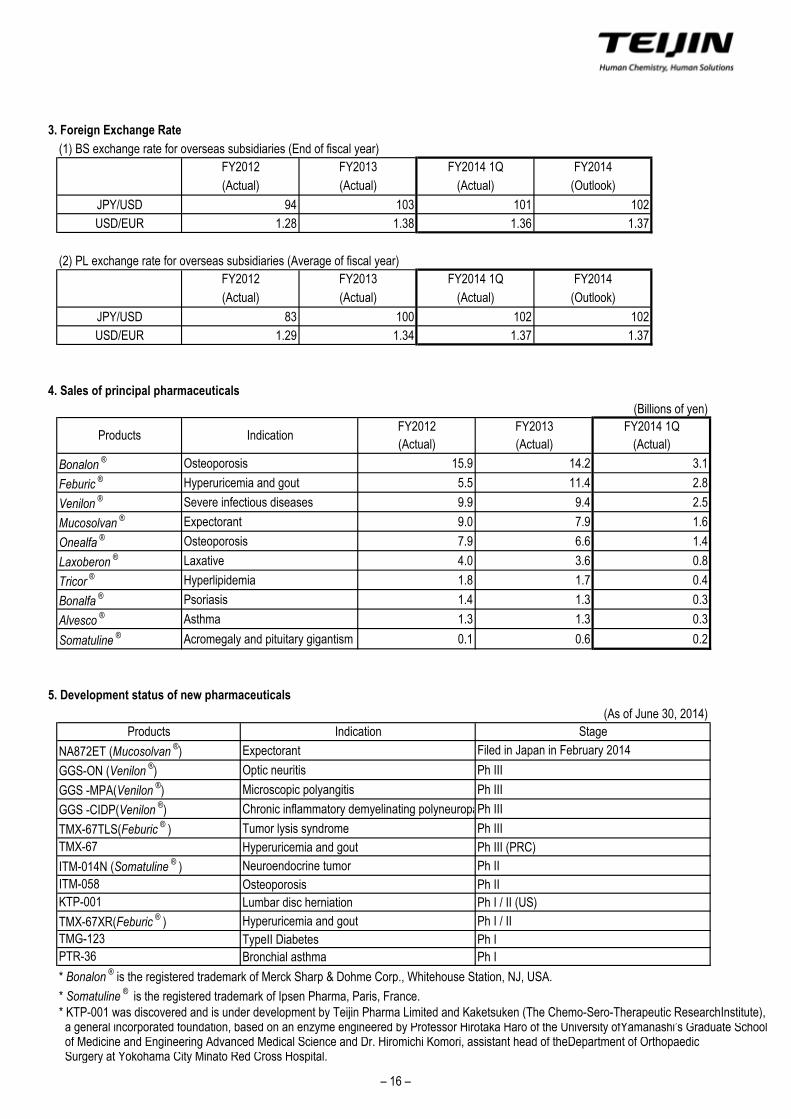
3. Foreign Exchange Rate
(1) BS exchange rate for overseas subsidiaries (End of fiscal year)
JPY/USD 94 103 101 102
USD/EUR 1.28 1.38 1.36 1.37
(2) PL exchange rate for overseas subsidiaries (Average of fiscal year)
JPY/USD 83 100 102 102
USD/EUR 1.29 1.34 1.37 1.37
4. Sales of principal pharmaceuticals
(Billions of yen)
Bonalon ® Osteoporosis 15.9 14.2 3.1
Feburic ® Hyperuricemia and gout 5.5 11.4 2.8
Venilon ® Severe infectious diseases 9.9 9.4 2.5
Mucosolvan ® Expectorant 9.0 7.9 1.6
Onealfa ® Osteoporosis 7.9 6.6 1.4
Laxoberon ® Laxative 4.0 3.6 0.8
Tricor ® Hyperlipidemia 1.8 1.7 0.4
Bonalfa ® Psoriasis 1.4 1.3 0.3
Alvesco ® Asthma 1.3 1.3 0.3
Somatuline ® Acromegaly and pituitary gigantism 0.1 0.6 0.2
5. Development status of new pharmaceuticals
(As of June 30, 2014)
Expectorant
Optic neuritis Ph III
Microscopic polyangitis Ph III
Chronic inflammatory demyelinating polyneuropathyPh III
Tumor lysis syndrome Ph III
Hyperuricemia and gout Ph III (PRC)
Neuroendocrine tumor Ph II
Osteoporosis Ph II
Lumbar disc herniation Ph I / II (US)
Hyperuricemia and gout Ph I / II
TypeII Diabetes Ph I
Bronchial asthma Ph I
* Bonalon ® is the registered trademark of Merck Sharp & Dohme Corp., Whitehouse Station, NJ, USA.
* Somatuline ® is the registered trademark of Ipsen Pharma, Paris, France.* KTP-001 was discovered and is under development by Teijin Pharma Limited and Kaketsuken (The Chemo-Sero-Therapeutic ResearchInstitute),
a general incorporated foundation, based on an enzyme engineered by Professor Hirotaka Haro of the University ofYamanashi’s Graduate Schoolof Medicine and Engineering Advanced Medical Science and Dr. Hiromichi Komori, assistant head of theDepartment of OrthopaedicSurgery at Yokohama City Minato Red Cross Hospital.
FY2014
(Actual) (Actual)
(Actual)
FY2012 FY2013 FY2014 1Q
(Actual)
FY2012 FY2013 FY2014 1Q
(Actual) (Outlook)
FY2014
(Actual) (Outlook)
ProductsFY2012
IndicationFY2013 FY2014 1Q
(Actual) (Actual) (Actual)
ITM-014N (Somatuline ® )
ITM-058
KTP-001
TMG-123
PTR-36
TMX-67XR(Feburic ® )
GGS-ON (Venilon ®)
GGS -MPA(Venilon ®)
GGS -CIDP(Venilon ®)
TMX-67TLS(Feburic ® )
TMX-67
Filed in Japan in February 2014
Products
NA872ET (Mucosolvan ®)
Indication Stage
– 16 –