Consolidated financial statements prepared in IFRS for … · statements prepared in IFRS for the...
50
1 This document is a free translation of an extract of the French language Annual Financial Report that was filed with the French securities regulator (Autorité des Marchés Financiers, AMF) This English version has not been approved by the AMF. This translation has been prepared solely for the information and convenience of English speaking readers. No assurances are given as to the accuracy or completeness of this translation, and ATEME assumes no responsibility with respect to this translation or any misstatement or omission that may be contained therein. In the event of any ambiguity or discrepancy between this translation and the French document, the French document shall prevail. The French language Annual Financial Report is available on the ATEME website (www.ateme.com). Consolidated financial statements prepared in IFRS for the financial year ended 31 December 2017
Transcript of Consolidated financial statements prepared in IFRS for … · statements prepared in IFRS for the...
1
This document is a free translation of an extract of the French language Annual Financial Report that was filed with the French securities regulator (Autorité des Marchés Financiers, AMF) This English version has not been approved by the AMF. This translation has been prepared solely for the information and convenience of English speaking readers. No assurances are given as to the accuracy or completeness of this translation, and ATEME assumes no responsibility with respect to this translation or any misstatement or omission that may be contained therein. In the event of any ambiguity or discrepancy between this translation and the French document, the French document shall prevail. The French language Annual Financial Report is available on the ATEME website (www.ateme.com).
Consolidated financial statements prepared in IFRS for the financial year ended 31 December 2017
2
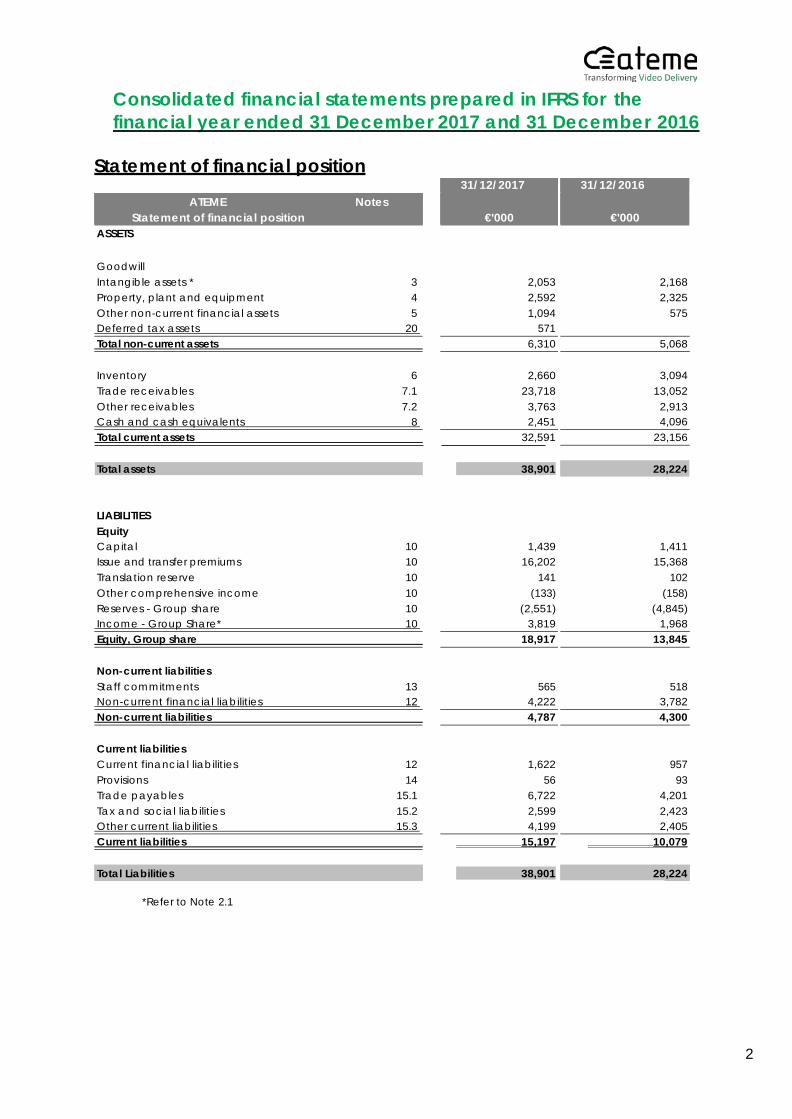
Consolidated financial statements prepared in IFRS for the financial year ended 31 December 2017 and 31 December 2016
Statement of financial position
31/12/2017 31/12/2016 ATEME Notes
Statement of financial position
€'000
€'000 ASSETS
Goodwill
Intangible assets * 3 2,053 2,168 Property, plant and equipment 4 2,592 2,325 Other non-current financial assets 5 1,094 575 Deferred tax assets 20 571 Total non-current assets 6,310 5,068
Inventory 6
2,660
3,094 Trade receivables 7.1 23,718 13,052 Other receivables 7.2 3,763 2,913 Cash and cash equivalents 8 2,451 4,096 Total current assets 32,591 23,156
Total assets 38,901 28,224 LIABILITIES
Equity Capital 10 1,439 1,411 Issue and transfer premiums 10 16,202 15,368 Translation reserve 10 141 102 Other comprehensive income 10 (133) (158) Reserves - Group share 10 (2,551) (4,845) Income - Group Share* 10 3,819 1,968 Equity, Group share 18,917 13,845 Non-current liabilities
Staff commitments 13 565 518 Non-current financial liabilities 12 4,222 3,782 Non-current liabilities 4,787 4,300 Current liabilities
Current financial liabilities 12 1,622 957 Provisions 14 56 93 Trade payables 15.1 6,722 4,201 Tax and social liabilities 15.2 2,599 2,423 Other current liabilities 15.3 4,199 2,405 Current liabilities 15,197 10,079 Total Liabilities 38,901 28,224
*Refer to Note 2.1
3
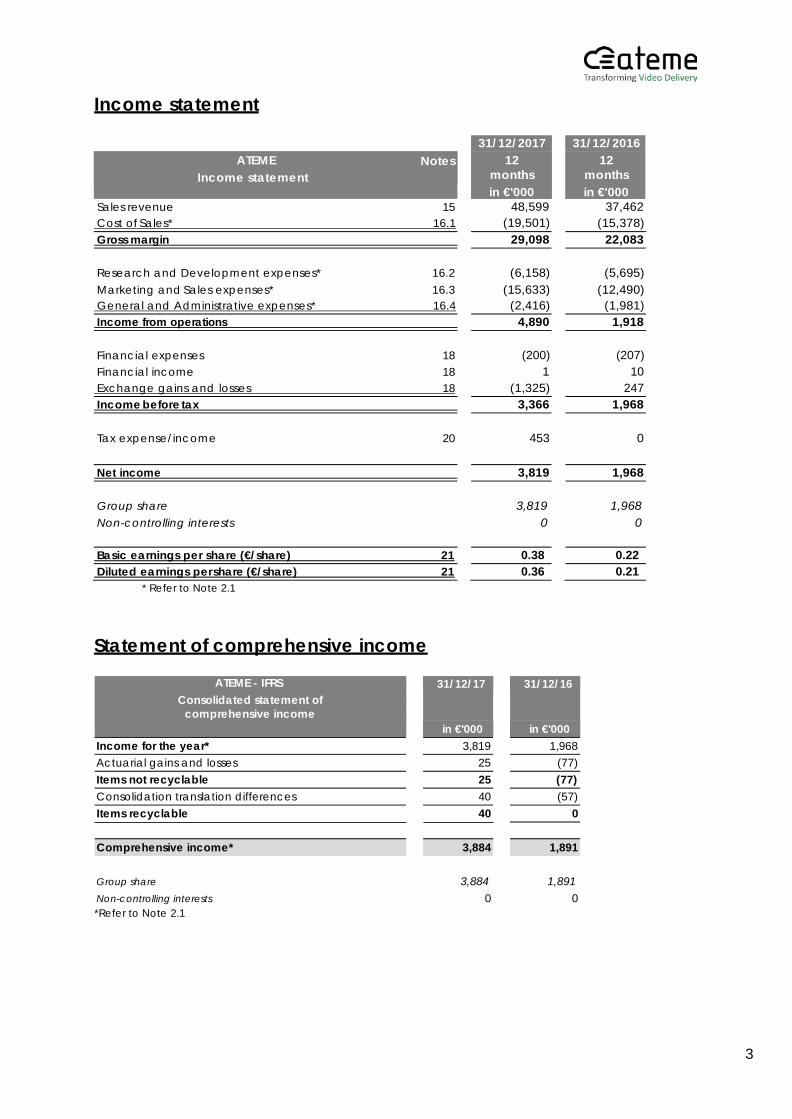
Income statement
31/12/2017 31/12/2016 ATEME Notes
Income statement 12
months in €'000
12 months in €'000
Sales revenue 15 48,599 37,462 Cost of Sales* 16.1 (19,501) (15,378) Gross margin 29,098 22,083
Research and Development expenses* 16.2
(6,158)
(5,695) Marketing and Sales expenses* 16.3 (15,633) (12,490) General and Administrative expenses* 16.4 (2,416) (1,981) Income from operations 4,890 1,918
Financial expenses 18
(200)
(207) Financial income 18 1 10 Exchange gains and losses 18 (1,325) 247 Income before tax 3,366 1,968
Tax expense/income 20
453
0
Net income 3,819 1,968 Group share
3,819
1,968
Non-controlling interests 0 0
Basic earnings per share (€/share) 21 0.38 0.22 Diluted earnings per share (€/share) 21 0.36 0.21
* Refer to Note 2.1
Statement of comprehensive income
ATEME - IFRS Consolidated statement of
comprehensive income
31/12/17 31/12/16
in €'000 in €'000 Income for the year* 3,819 1,968 Actuarial gains and losses 25 (77) Items not recyclable 25 (77) Consolidation translation differences 40 (57) Items recyclable 40 0
Comprehensive income* 3,884 1,891
Group share
3,884
1,891
Non-controlling interests 0 0 *Refer to Note 2.1
4
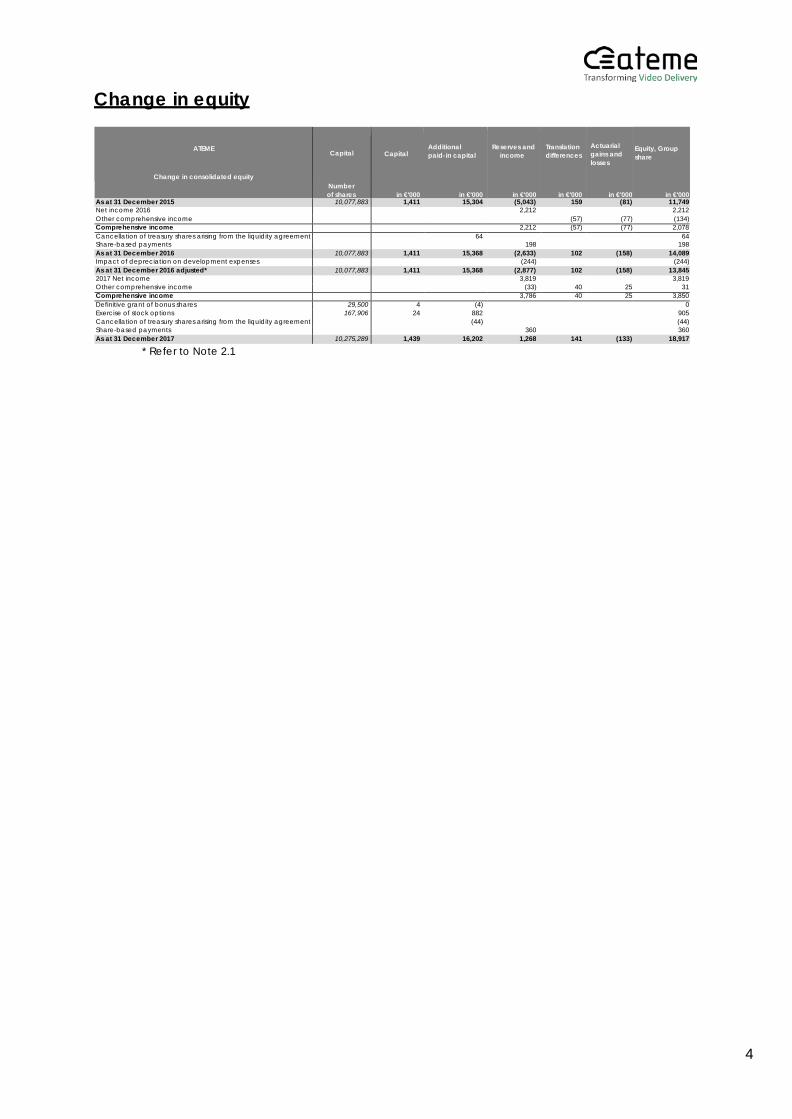
Change in equity
ATEME
Change in consolidated equity
Capital
Number of shares
Capital
in €'000
Additional paid-in capital
in €'000
Reserves and
income
in €'000
Translation differences
in €'000
Actuarial gains and losses
in €'000
Equity, Group share
in €'000 As at 31 December 2015 10,077,883 1,411 15,304 (5,043) 159 (81) 11,749 Net income 2016 2,212 2,212 Other comprehensive income (57) (77) (134) Comprehensive income 2,212 (57) (77) 2,078 Cancellation of treasury shares arising from the liquidity agreement 64 64 Share-based payments 198 198 As at 31 December 2016 10,077,883 1,411 15,368 (2,633) 102 (158) 14,089 Impact of depreciation on development expenses (244) (244) As at 31 December 2016 adjusted* 10,077,883 1,411 15,368 (2,877) 102 (158) 13,845 2017 Net income 3,819 3,819 Other comprehensive income (33) 40 25 31 Comprehensive income 3,786 40 25 3,850 Definitive grant of bonus shares 29,500 4 (4) 0 Exercise of stock options 167,906 24 882 905 Cancellation of treasury shares arising from the liquidity agreement (44) (44) Share-based payments 360 360 As at 31 December 2017 10,275,289 1,439 16,202 1,268 141 (133) 18,917
* Refer to Note 2.1
5
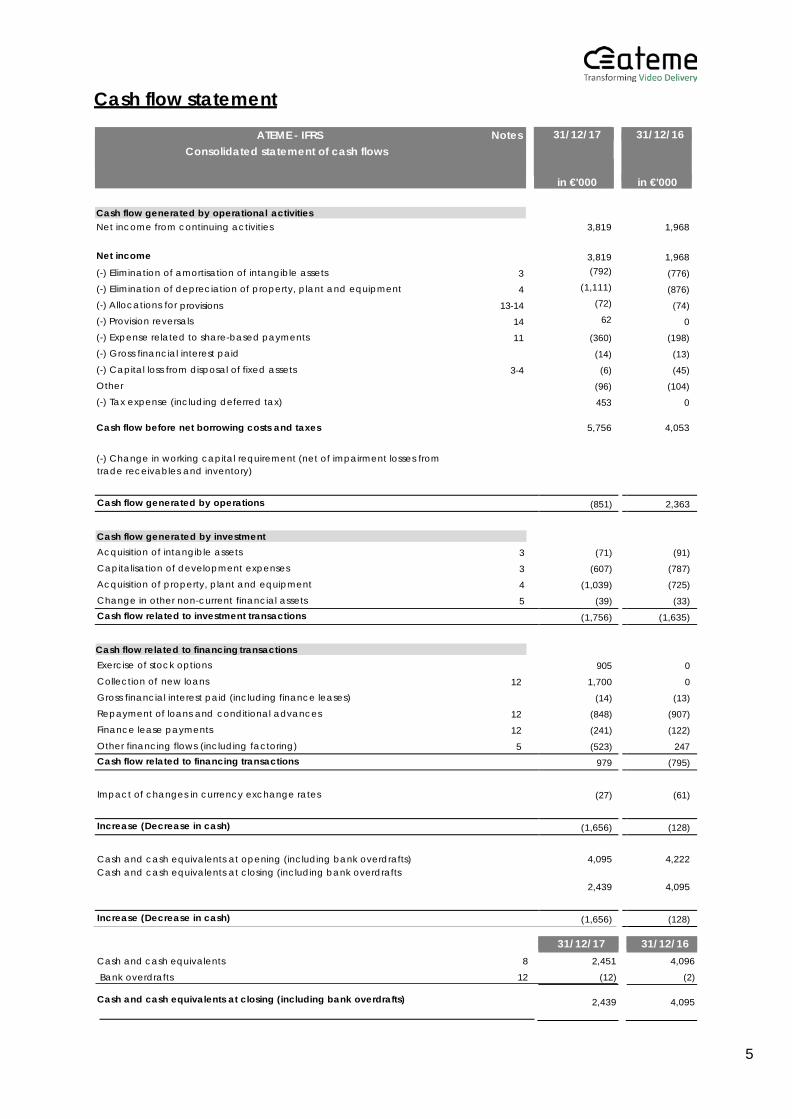
Cash flow statement
ATEME - IFRS Notes Consolidated statement of cash flows
31/12/17 31/12/16
in €'000
in €'000 Cash flow generated by operational activities Net income from continuing activities
3,819
1,968
Net income
3,819
1,968 (-) Elimination of amortisation of intangible assets 3 (792) (776) (-) Elimination of depreciation of property, plant and equipment 4 (1,111) (876) (-) Allocations for provisions 13-14 (72) (74) (-) Provision reversals 14 62 0 (-) Expense related to share-based payments 11 (360) (198) (-) Gross financial interest paid (14) (13) (-) Capital loss from disposal of fixed assets 3-4 (6) (45) Other (96) (104) (-) Tax expense (including deferred tax) 453 0
Cash flow before net borrowing costs and taxes
5,756
4,053
(-) Change in working capital requirement (net of impairment losses from trade receivables and inventory)
Cash flow generated by operations (851) 2,363
Cash flow generated by investment
Acquisition of intangible assets 3 (71) (91) Capitalisation of development expenses 3 (607) (787) Acquisition of property, plant and equipment 4 (1,039) (725) Change in other non-current financial assets 5 (39) (33) Cash flow related to investment transactions (1,756) (1,635)
Cash flow related to financing transactions
Exercise of stock options 905 0 Collection of new loans 12 1,700 0 Gross financial interest paid (including finance leases) (14) (13) Repayment of loans and conditional advances 12 (848) (907) Finance lease payments 12 (241) (122) Other financing flows (including factoring) 5 (523) 247 Cash flow related to financing transactions 979 (795)
Impact of changes in currency exchange rates
(27)
(61)
Increase (Decrease in cash) (1,656) (128)
Cash and cash equivalents at opening (including bank overdrafts)
4,095
4,222
Cash and cash equivalents at closing (including bank overdrafts
2,439 4,095
Increase (Decrease in cash) (1,656) (128)
31/12/17 31/12/16 Cash and cash equivalents 8 2,451 4,096
Bank overdrafts 12 (12) (2)
Cash and cash equivalents at closing (including bank overdrafts)
2,439
4,095
6
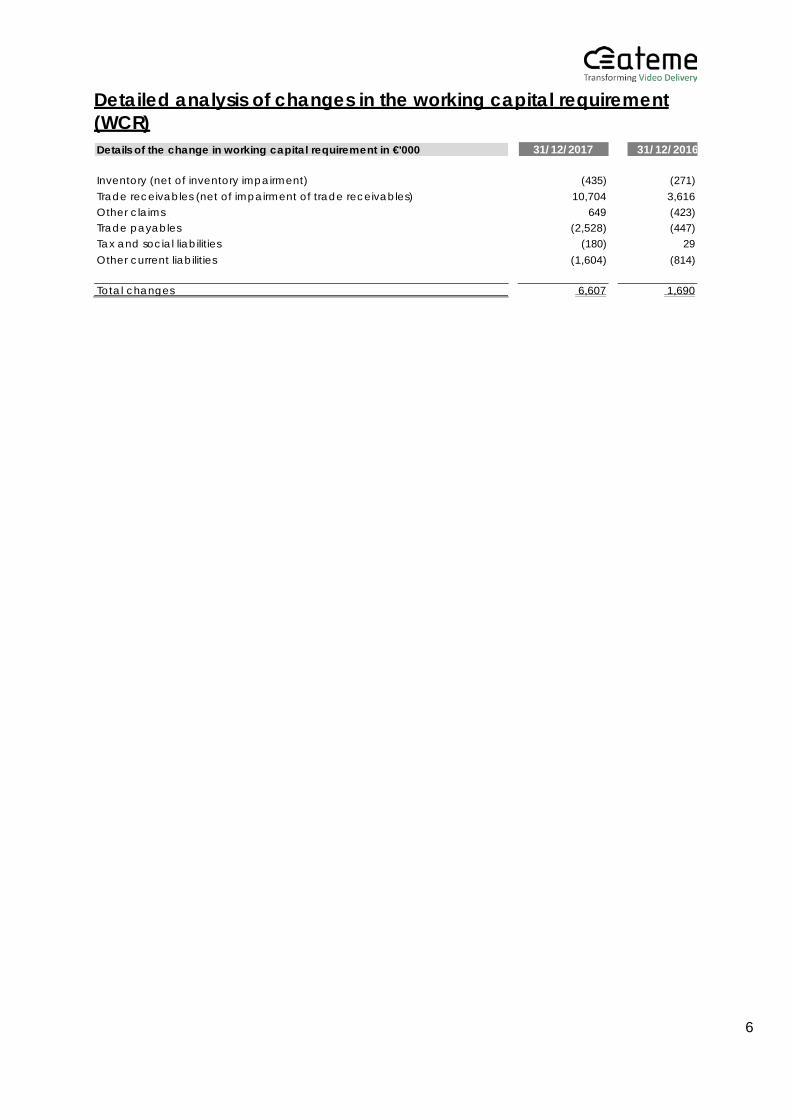
Detailed analysis of changes in the working capital requirement (WCR)
Details of the change in working capital requirement in €'000 31/12/2017 31/12/2016
Inventory (net of inventory impairment)
(435)
(271) Trade receivables (net of impairment of trade receivables) 10,704 3,616 Other claims 649 (423) Trade payables (2,528) (447) Tax and social liabilities (180) 29 Other current liabilities (1,604) (814)
Total changes 6,607 1,690
7
Notes to the Financial Statements (Unless otherwise specified, all amounts listed in these notes are in €'000)
Consolidated financial statements prepared in IFRS for the financial year ended 31 December 2017 and 31 December 2016 .................................................................................. 2 Statement of comprehensive income ........................................................................................ 3 Cash flow statement ...................................................................................................................... 5 Detailed analysis of changes in the working capital requirement (WCR) ............................. 5
Note 1: Presentation of business and major events .......................................................... 9 1.1 Information relating to the Company and its business .............................................. 9 1.2 Highlights of the 2017 financial year ............................................................................. 9 1.3 Events subsequent to 2017 closing.............................................................................. 12
Note 2: Accounting principles, rules and methods ......................................................... 13 2.1 Reporting principle ........................................................................................................ 13 2.2 Use of judgements and estimates ............................................................................... 15 2.3 Functional reporting currency ..................................................................................... 16 2.4 Foreign currency ............................................................................................................ 16 2.5 Current and non-current distinction ........................................................................... 17 2.6 Recoverable amount of non-current assets .............................................................. 17 2.7 Receivables and payables denominated in foreign currencies ............................ 18 2.8 Sector Information ......................................................................................................... 18 2.9 Other comprehensive income .................................................................................... 18
Note 3: Intangible assets ..................................................................................................... 18 Note 4: Property, plant and equipment ........................................................................... 20 Note 5: Other non-current financial assets ....................................................................... 21 Note 6: Inventory .................................................................................................................. 22 Note 7: Receivables ............................................................................................................. 22
7.1 Trade receivables .......................................................................................................... 23 7.2 Other receivables .......................................................................................................... 23
Note 8: Marketable securities and cash ........................................................................... 24 Note 9: Financial assets and liabilities and effects on income ...................................... 25 Note 10: Capital ................................................................................................................... 26 Note 11: Subscription warrants, stock options, and subscription warrants for founders' shares and bonus shares ..................................................................................................... 27 Note 12: Borrowings and financial debts .......................................................................... 30
12.1 Liabilities to credit institutions .................................................................................... 32 12.2 Financial liabilities - Finance leases ......................................................................... 33
Note 13: Staff commitments ............................................................................................... 36 Note 14: Provisions ................................................................................................................ 37 Note 15: Suppliers and other current liabilities ................................................................. 38
15.1. Trade payables ............................................................................................................... 38 15.2 Tax and social liabilities ............................................................................................. 39 15.3 Other current liabilities ............................................................................................... 39
Note 16: Sales revenue ........................................................................................................ 39 Note 17: Details of expenses and income by function ................................................... 40
17.1 Cost of Sales ............................................................................................................... 41
8
17.2 Research and Development expenses .................................................................. 41 17.3 Marketing and Sales expenses ................................................................................ 42 17.4 General and Administrative expenses .................................................................... 43
Note 18: Group Workforce .................................................................................................. 43 Note 19: Financial income and expenses, net ................................................................ 43 Note 20: Income taxes ........................................................................................................ 44 Note 21: Earnings per share ................................................................................................ 45 Note 22: Related parties ..................................................................................................... 46
22.1 Related-party transactions ....................................................................................... 46 22.2 Management remuneration .................................................................................... 46
Note 23: Off-balance sheet commitments ...................................................................... 47 23.1 Commercial leases .................................................................................................... 47 23.2 Operating leasing commitments ............................................................................. 48 23.3 Obligations under other contracts .......................................................................... 48 23.4 Other financial commitments .................................................................................. 48
Note 24: Financial risk management and assessment ................................................... 49 Note 25: Statutory Auditors' fees ........................................................................................ 50
9
Note 1: Presentation of business and major events
The following information is the Appendix to the consolidated financial statements according to IFRS that is included in the financial statements for the financial years ended 31 December 2017 and 2016. Each of these financial years shall be twelve months covering the period from 1 January to 31 December.
1.1 Information relating to the Company and its business
Created in June 1991, ATEME (a French public limited company) produces electronic and computer equipment and instruments for the acquisition, processing and transmission of information.
ATEME offers products and solutions to cover: • Contribution: imbedded encoders in mobile production units, and decoders installed
in studios, • "File" and "Live" distribution: transcoding solution for broadcast on all types of screens
to be able to monetise content.
Address of registered office: 6 rue Dewoitine, 78140 Vélizy-Villacoublay, France
Versailles Trade and Companies Registry number: 382 231 991
ATEME and its subsidiaries are hereinafter referred to as the "Company" or the "Group." The Company is now listed on Euronext Compartment C.
1.2 Highlights of the 2017 financial year
On 10 January 2017: Proximus announced the update of its ATEME video headend used by its national broadcasters to benefit from the latest functions and improvements
ATEME announced that Proximus, one of the Belgian telecom leaders, was upgrading its ATEME based video headend using TITAN full - software solution by ATEME to benefit from the latest functions and improvements developed by R & D.
On 5 February 2017: ATEME powered the first UHD virtual reality experience for Super Bowl LI ATEME announced that its advanced video compression technology was used for virtual reality coverage, in Ultra High Definition (UHD), of the final US football match between the New England Patriots and the Atlanta Falcons, in partnership with Fox Sports and LiveLike.
On 7 March 2017: Dell EMC OEM and IoT Solutions supported ATEME, the leader in video compression, in the transformation of the broadcasting industry
Dell EMC OEM and IoT Solutions announced their collaboration with ATEME, the video compression leader, to provide the servers and storage needed to expand its catalogue of solutions. The performance of Dell EMC solutions allowed ATEME to provide higher density while maintaining high video quality, thereby reducing customer’s opex and capex and offering the flexibility needed to scale without service disruption
On 28 March 2017: Cellnex equips its Labs with ATEME’s TITAN File
10
ATEME announced the integration of its TITAN multi-codec and multi-format video transcoding software into Cellnex Telecom's lab in Spain. The solution, designed for bandwidth-efficient content transcoding up to 4K was provided by TmediaT, ATEME's local partner.
On 14 April 2017: 4EVER-2 delivered a world premiere Ultra HD-TV phase 2 live production, with UHD-TV « HFR » 100 frames per second and Dolby AC-4 audio
ATEME supported the 4EVER-2 project in successful trial of a live High Frame Rate (HFR) production of the ice hockey match. Le match between France and Switzerland, in preparation for the world ice hockey championship, was organised by the French Ice Hockey Federation (FFHG). To broadcast this game, 4EVER-2 has carried out a real time production with multiple cameras and a satellite transmission combining HD-HFR and Dolby® AC-4 Audio; a world premiere in Ultra HD-TV. On 21 April 2017: ATEME Powers AMC Networks International CE Primary Distribution ATEME announced that AMC Networks International Central Europe, a subsidiary of AMC Networks International, chose ATEME's TITAN transcoding solution to improve video quality and optimise connectivity between its network headend and service providers carrying the AMC channels. AMC Networks International also deployed Kyrion encoders and decoders to set up a contribution link between Prague and Budapest. ATEME will provide local support for this infrastructure in close collaboration with its partner, Silicon Computers Ltd.
On 26 April 2017: Totalplay virtualises its video headend with ATEME
ATEME announced that Totalplay, the triple playo perator affiliated with the Mexican multimedia conglomerate, Grupo Salinas, chose ATEME's TITAN virtualised encoding solution for its convergent video headend. TITAN is able to operat with the same source code both in a server and in a blade platform, as well as in virtualised environments, thereby offering Totalplay the necessary flexibility to adapt its processing capacity to customers demand, without any interruption of service. Totalplay now benefits from hardware abstraction, operational simplicity, and service flexibility that help to reduce their operating expenses. Totalplay also benefits from capex savings, with less equipment and spares to maintain
On 16 May 2017: ATEME powers České Radiokomunikace's new DVB-T2 HEVC network headend. full-software DVB-T2 HEVC Video Headend
ATEME announced that České Radiokomunikace, a leading provider of digital infrastructure and the largest Czech service provider chose to integrate its video compression and statistical multiplexing solution for the company’s DVB-T2 HEVC services.
On 14 June 2017: ATEME outlined shapes the future of television at the 2017 French Open
ATEME once again demonstrated the effectiveness of its TITAN Live software-based live video solution at the 2017 French Open. TITAN Live was used to power Virtual Reality application available throughout the tournament. In partnership with LiveLike, the application offered a unique fully immersive 180° and 360° experience to tennis fans. ATEME's TITAN Live solution also provided the best video quality experience on tablets, iOS and Android smartphones during the tournament.
On 27 June 2017: The Russian sports broadcaster, TV START, chose ATEME’s Kyrion solution for its mobile television fleet
11
ATEME announced that the Russian sports broadcaster, TV Start, specialised in live transmission of various sport events, deployed ATEME's Kyrion encoders and decoders in its mobile television units.
On 4 July 2017: TOT chose ATEME to Deliver 4K-UHD Contribution Channels Over IP
ATEME announced that TOT (Telephone Organization of Thailand), one of Thailand's major telecom operators, deployed Kyrion encoders and decoders to deliver nine channels in 4K-UHD over IP. ATEME solutions were already widely used by TOT, but it was the first time the company has used ATEME’s 4K-UHD contribution technology Thanks to ATEME, TOT has a serious competitive advantage: the possibility of providing the best video quality with extremely low latency (130 ms).
On 18 July 2017: ODMedia chose ATEME's TITAN File for its high-quality video encoding facility ATEME announced that ODMedia, the European leader in on-demand video services, chose the TITAN File transcoding software solution to provide extra features to its high-quality encoding facility.
On 27 July 2017: The Company's Board of Directors noted a capital increase of €21,927.50: As of 27 July 2017, the Board of Directors of the Company noted:
- The definitive allocation of 29,500 bonus shares (2016-01). This award resulted in the issue of 29,500 ordinary shares with a nominal value of €0.14 each and a corresponding increase in share capital for an amount of €4,130;
- The exercise of 127,125 stock options pursuant to option plans SO 2010, SO 2011-1, SO 2011-3, SO 2011-3, SO 2013-1, and SO 2013-2. The exercise of these options resulted in the issue of 127,125 shares with a nominal value of €0.14 each and an increase of the share capital of €17,797.50.
As a result of these transactions the share capital is increased to €1,432,831.12, divided into 10,234,508 shares of the same category.
On 7 September 2017: ATEME provided Arquiva and Samsung First 5G Trials with 4K HDR Video Content ATEME announced that its technology expertise in video compression was used by Arquiva and Samsung to carry out the first field trial on a 5G Fixed Wireless Access (FWA) network in the United Kingdom.
On 26 September 2017: VNPTI chose ATEME to cover the 2017 APEC event in Vietnam ATEME announced that VNPTI (a subsidiary of Vietnam Posts and Telecommunications), the largest satellite transmission operator in Vietnam, deployed Kyrion encoders and decoders to cover the 2017 APEC convention (Asia-Pacific Economic Cooperation) in Da Nang.
On 10 October 2017: ATEME offered a comprehensive solution for the broadcast transmission of live video content to Casablanca Online's DSNG fleet ATEME announced that Casablanca Online, the largest video service provider for live broadcasting in Brazil, upgraded its DSNG fleet with Kyrion encoders and decoders
12
On 30 November: ATEME partners with Interra Systems to provide pay-TV operators with a superior quality video experience ATEME announced a technology partnership with Interra Systems, a global provider of quality control (QC), monitoring and analytical solutions for the digital media industry
On 12 December: D2 selected ATEME's full complete video headend for the local television network in the UK ATEME announced that D2, a UK media, broadcasting and telecommunications services company, chose ATEME's TITAN solution for one of its clients. ATEME's TITAN solution is used for DTT services across the UK to encode more than 150 channels, and to deliver high-quality video to viewers, while allowing the best possible use of available bandwidth.
1.3 Events subsequent to 2017 closing
On 31 January 2018: The Company's Board of Directors noted a capital increase of €7,004.34:
As of 31 January 2018, the Board of Directors of the Company noted: - The exercise of 50,031 stock options pursuant to option plans SO 2011-1, SO 2011-3, SO 2013-
2, SO 2014-1 and SO 2014-2. The exercise of these options resulted in the issue of 50,031 shares with a nominal value of €0.14 each and an increase of the share capital of €7,004.34.
As a result of these transactions, the share capital increased to €1,439,835.46, divided into 10,284,539 shares of the same category.
On 15 March 2018: ATEME supported Canal+ Group in the launch of High Quality UHD and the development of its new TV services ATEME and Canal+ Group, the leading pay-TV operator in France, extended their partnership to include premium UHD services. Taking advantage of ATEME's continued research and innovation in image quality, Canal+ workflow can now process SD, HD and UHD content.
13
Note 2: Accounting principles, rules and methods
The financial statements are presented in €'000 unless otherwise stated.
2.1 Reporting principle
Declaration of compliance
ATEME established its accounts, approved by the Board of Directors on 27 March 2018, in accordance with the standards and interpretations published by the International Accounting Standards Board (IASB) and adopted by the European Union on the date of preparation of the financial statements, for all periods presented.
This repository, available on the European Commission website (https://eur-lex.europa.eu/legal-content/fr/txt/?uri=legissum%3al26040), includes international accounting standards (IAS and IFRS), Interpretations of the Standing Interpretations Committee (SIC) and the International Financial Reporting Interpretations Committee (IFRIC).
The accounting principles, methods and options used by the Company are described below. In some cases, IFRS give the choice between the application of a benchmark treatment or another allowed alternative treatment.
Principle of preparation of financial statements The Company's accounts have been prepared in accordance with the historical cost principle, with the exception of certain categories of assets and liabilities, in accordance with the provisions of IFRS. The categories concerned are mentioned in the following notes.
Business continuity The assumption of business continuity over the next 12 months from 31 December 2017 was adopted by the Board on the basis of the growth assumptions for sales revenue and the gross margin.
Error correction and change of presentation. In accordance with IAS 8 on "Accounting policies, changes in accounting estimates and errors", the Company made a correction of an error in the accounts as at 31 December 2016 that had an impact on the statement of financial position.
As at 31 December 2016, the amortisation of capitalised development expenses calculated in accordance with IAS 38 amounted to €2,980 thousand, compared to €2,736 thousand recorded under Research and Development expenses.
The correction of this error impacted the Group's 2016 net income by -€244 thousand.
The company also changed the distribution of its expenses by function for 2016. This change in presentation impacted the 2016 gross margin by €52 thousand, without impact on income from operations or net income.
14
Accounting policies
The following accounting policies have been applied consistently to all periods presented in the financial statements, after taking account of or making exceptions for the new standards and interpretations described below:
Standards, amendments to standards and interpretations applicable for periods beginning on 1 January 2017 The accounting principles used are identical to those used for the preparation of the IFRS annual consolidated financial statements for the year ended 31 December 2016, it being specified that no new standards, amendments to standards or interpretations were adopted, or are mandatory for periods beginning on 1 January 2017.
Standards, amendments and interpretations adopted by the European Union but not yet mandatory for periods beginning on or after 1 January 2017
• IFRS 9 - Financial Instruments • IFRS 15 - Revenue from Contracts with Customers • IFRS 16 - Leases • Amendments to IFRS 4 - Application of IFRS 9 with IFRS 4
Main Standards, amendments and interpretations not adopted by the European Union but not yet mandatory for periods beginning on or after 1 January 2017
• IFRS 14 - Regulatory Deferral Accounts • IFRS 17 - Insurance Contracts • IFRIC 22 - Foreign Currency Transactions and Advance Consideration • IFRIC 23 - Uncertainty over Income Tax Treatments • Amendments to IFRS 2 - Classification and Measurement of Share-based Payment
Transactions • Amendments to IFRS 9 - Prepayment Features with Negative Compensation • Amendments to IAS 28 - Long-term Interests in Associates and Joint Ventures • Amendments to IFRS 10 and IAS 28 - Sale or Contribution of Assets between an Investor
and its Associate or Joint Venture • Amendments to IAS 40 - Transfers of Investment Property • IFRS improvement (2014-2016 cycle)
The Group is currently in the process of assessing impacts following the first application of these new texts. It does not anticipate, at this stage, significant impact on its financial statements.
IFRS 9 and IFRS 15 enter into force for periods beginning on or after 1 January 2018.
- IFRS 9 addresses, inter alia, the recognition of financial assets and liabilities, the
impairment of financial assets (including expected losses on clients) and the recognition of hedging transactions. The ongoing analysis did not identify significant impacts.
15
- IFRS 15 sets out the principles for accounting for sales revenue based on an analysis
in 5 successive stages (contract identification, identification of the various performance obligations, i.e. the list of goods or services that the seller has committed to provide to the buyer, determining the overall price of the contract, allocation of the overall price relating to each performance obligation, accounting for the sales revenue and the costs related to the completion of a performance obligation).
The application of this new approach has not led, in view of the analysis, to identifying a significant impact on the Group's financial statements.
Consolidation principles Fully consolidated companies
The consolidated financial statements comprise, by full consolidation, the accounts of subsidiaries over which the Group exercises exclusive control, whether directly or indirectly. The Group considers that it holds exclusive control over an entity when it has the capacity to govern the operational and financial policies of that entity in order to achieve economic benefits. Full consolidation allows for the inclusion, after elimination of the internal transactions and results, of all assets, liabilities, and elements of the income statements of the companies concerned, the share of income and shareholders' equity attributable to the Group's companies (Group share), distinguished from the interest of the other shareholders (non-controlling interests). All significant transactions between consolidated companies and consolidated internal income (including dividends) are eliminated.
Main Group companies as at 31 December 2017 As at 31 December 2017, five companies are fully consolidated. Directly owned companies are as follows:
ATEME SA France Parent company
ATEME USA Inc. United States
100 100
ATEME Canada Inc. Canada 100 100
ATEME SINGAPORE Singapore 100 100
ATEME Japan KK Japan 100 100
2.2 Use of judgements and estimates
In preparing the financial statements in accordance with IFRS, estimates, judgements and assumptions were made by Company Management; they were able to allot the amounts presented in respect of assets and liabilities, contingent liabilities at the dateof preparation of financial statements and amounts presented in respect of income and expenses for the financial year.
Control of Group in % interest (%) Cou
Compa
16
These estimates are based on the assumption of business continuity and the information available at the date of preparation. They are continuously assessed on the basis of past experience and various other factors deemed reasonable which are the basis for assessments of the carrying amount of assets and liabilities. Estimates may be revised if the circumstances on which they were based change or if further information is available. Actual results could differ significantly from these estimates according to different assumptions or conditions. The major estimates or judgements made by the Company's management include the following:
• Allocation of stock options or subscription warrants for founders' shares to employees and executives
o The determination of the fair value of share-based payments is based on the Black & Scholes pricing model that takes into account assumptions on complex and subjective variables. These variables include the value of the Company's securities, the expected volatility of the share price over the life of the instrument and the current and future behaviour of the holders of such instruments. There is a high inherent risk of subjectivity arising from the use of a pricing model in determining the fair value of share-based payments in accordance with IFRS 2.
o The valuation assumptions used are presented in Note 11.
• Capitalisation of development expenses o The Company devotes significant efforts to research and development. In this
context, the Company must make judgements and interpretations to determine the development expenses to be capitalised once all the six criteria defined in IAS 38 are met.
o The accounting principles and capitalised costs are presented in Note 3.
• Impairment of inventory o The Company determines a provision for impairment of inventory based on an
analysis of the probable net realisable value of its inventory, which is based on historical and projected data. In this context, the Company may be required to take into account assumptions (in particular in terms of technological changes in the different versions of the cards and the risk of obsolescence of such products).
o The accounting principles and the amounts of provisions are presented respectively in Note 6.
2.3 Functional reporting currency
The Group's financial statements are prepared in euros, the reporting and functional currency of ATEME SA.
2.4 Foreign currency
• Foreign currency transactions
Foreign currency transactions are translated into the functional currency of the Company using the exchange rate applicable on the date of the transaction. Currency assets and
17
liabilities denominated in foreign currency at the balance sheet date are translated into the functional currency using the exchange rate at that date. Exchange gains and losses arising from the conversion of monetary items correspond to the difference between amortised cost denominated in the functional currency at the beginning of the period, adjusted for the impact of the effective interest rate and payments over the period, and the amortised cost denominated in the foreign currency translated to the functional currency at the balance sheet date. Non-monetary assets and liabilities denominated in foreign currency that are measured at fair value are translated into the functional currency using the exchange rate of the date on which fair value was determined. The exchange differences resulting from such translations shall be recognised in profit or loss, with the exception of the differences resulting from the translation of equity instruments available for sale, a financial liability designated as a hedge of a net investment in a foreign business, or instruments classified as cash flow hedges, which are recognised directly in equity.
• Translation of foreign subsidiaries' financial statements
The euro, chosen as the reporting currency, is the currency in which most of the flows are generated within the Group. The functional currency of the Company is the euro and the functional currencies of its subsidiaries are as follows:
• ATEME SA Inc.: US Dollar • ATEME Canada Inc.: Canadian Dollar • ATEME Singapore: Singapore Dollar • ATEME Japan KK: Yen
The accounts of Group entities whose functional currencies are different from the euro are translated into euros as follows:
• Assets and liabilities are translated at the closing exchange rate at 31 December 2017; • The income and expenses of each income statement shall be translated at the
average exchange rate for the period or year that is considered to reflect the applicable exchange rates on the effective date of the transactions.
Translation differences resulting from the application of these different rates are included in a specific equity item, ‘Translation differences’.
2.5 Current and non-current distinction
The Company applies a balance sheet presentation that distinguishes between the current and non-current elements of assets and liabilities. The distinction between current items and non-current items has been made in accordance with the following rules:
• The assets and liabilities constituting the working capital requirement within the normal business cycle are classified as "current";
• The assets and liabilities outside of the normal operating cycle are presented in "current", on the one hand and in "non-current" on the other, depending on whether their maturity is more or less than one year or according to the application of the specific cases referred to in IAS 1.
2.6 Recoverable amount of non-current assets
Assets with a finite life are subject to impairment tests whenever there is an internal or external indication showing that the asset may have lost value. As at 1 December 2017 and 2016, no non-current asset presents an internal or external indication of impairment.
18
2.7 Receivables and payables denominated in foreign currencies
Payables and receivables denominated in foreign currencies shall be accounted for at the exchange rate at the time of the original transaction. At the end of the financial year, the corresponding assets and liabilities are valued at the closing exchange rate.
2.8 Sector Information
The Company operates in one segment: The "marketing of professional video compression solutions." The assets and operational loss presented are located in France. Research and Development costs, and most administrative costs are incurred in France. At this stage, these costs are not allocated to the geographical areas where these products are marketed.
Thus, the Company's performance is currently analysed at the level of the identified segment.
2.9 Other comprehensive income
The items of income and expenses for the period recognised directly in equity are presented, where applicable, under "Other comprehensive income".
Note 3: Intangible assets
The costs of the services used or consumed to generate the intangible asset; Salaries and staff expenses committed to generate the asset.
The costs which are directly attributable to the production of the asset include:
Technical feasibility necessary for the completion of the development project, The Company's intention to complete the project, Its ability to use this intangible asset, Demonstrating the likelihood of future economic benefits attached to the asset, Availability of technical, financial and other resources to complete the project, and Reliable assessment of development expenses.
Research costs are systematically recognised as expenses. In accordance with IAS 38, development expenses are recognised in intangible assets only if all of the following criteria are satisfied:
Research and Development
Intangible assets consist mainly of licences, software development and development expenses.
19
Expenses shall be capitalised only from the date on which the conditions for the capitalisation of the intangible asset are met. Expenses shall cease to be recognised in assets when the intangible asset is ready to be used and marketed.
Capitalised development costs are amortised on a straight-line basis between 1 and 4 years, depending on their useful life. The amortisation allocation of capitalised development expenses is presented in the category "Research and Development expenses."
Software
The costs associated with the acquisition of software licences are recognised in assets on the basis of the costs incurred to acquire and implement the relevant software.
Other intangible assets
In accordance with IAS 38 criteria, intangible assets acquired are recognised on the asset side of the balance sheet at acquisition cost.
Duration and depreciation expenses When they have a finite useful life, depreciation is calculated on a straight-line basis in order to break down the cost over their estimated useful life, or:
Element Depreciation period
Development expenses 1 to 4 years
Licences and software development 1 to 5 years
The depreciation expense of intangible assets related to licences and software development is recognised in profit or loss and distributed according to their use in the categories: Cost of Sales, Marketing and Sales expenses, Research and Development expenses, and General and Administrative expenses.
The depreciation expenses for intangible assets relating to capitalised development expenses are recognised in profit or loss in the category of Research and Development expenses.
20
DEPRECIATION
NET CARRYING AMOUNTS
*Refer to Note 2.1
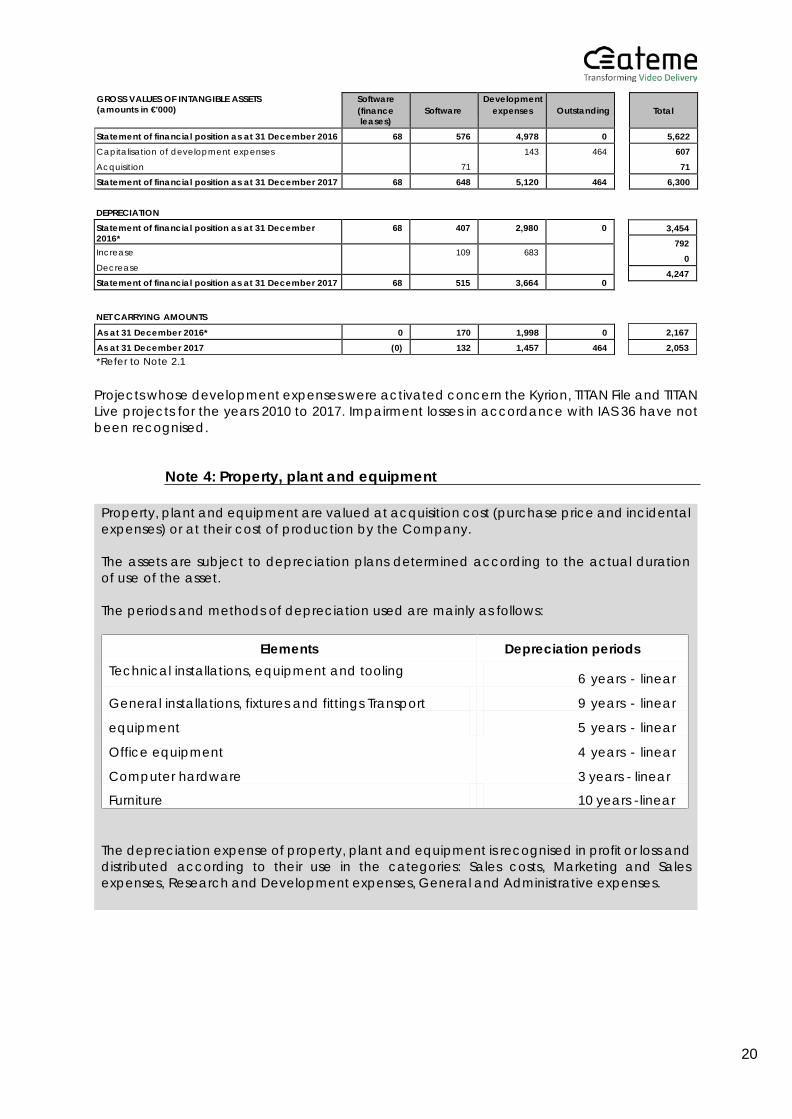
Projects whose development expenses were activated concern the Kyrion, TITAN File and TITAN Live projects for the years 2010 to 2017. Impairment losses in accordance with IAS 36 have not been recognised.
Note 4: Property, plant and equipment
GROSS VALUES OF INTANGIBLE ASSETS (amounts in €'000)
Software (finance leases)
Software
Development expenses
Outstanding
Statement of financial position as at 31 December 2016 68 576 4,978 0 Capitalisation of development expenses
Acquisition
71
143 464
Statement of financial position as at 31 December 2017 68 648 5,120 464
Total
5,622 607 71
6,300
Statement of financial position as at 31 December 2016*
68 407 2,980 0
Increase
Decrease
109 683
Statement of financial position as at 31 December 2017 68 515 3,664 0
3,454 792
0 4,247
As at 31 December 2016* 0 170 1,998 0 As at 31 December 2017 (0) 132 1,457 464
2,167
Property, plant and equipment are valued at acquisition cost (purchase price and incidental expenses) or at their cost of production by the Company.
The assets are subject to depreciation plans determined according to the actual duration of use of the asset.
The periods and methods of depreciation used are mainly as follows:
The depreciation expense of property, plant and equipment is recognised in profit or loss and distributed according to their use in the categories: Sales costs, Marketing and Sales expenses, Research and Development expenses, General and Administrative expenses.
Depreciation periods
6 years - linear
9 years - linear
5 years - linear
4 years - linear
3 years - linear
10 years - linear
Elements Technical installations, equipment and tooling General installations, fixtures and fittings Transport
equipment
Office equipment
Computer hardware
Furniture
2,053
21
DEPRECIATION
NET CARRYING AMOUNTS
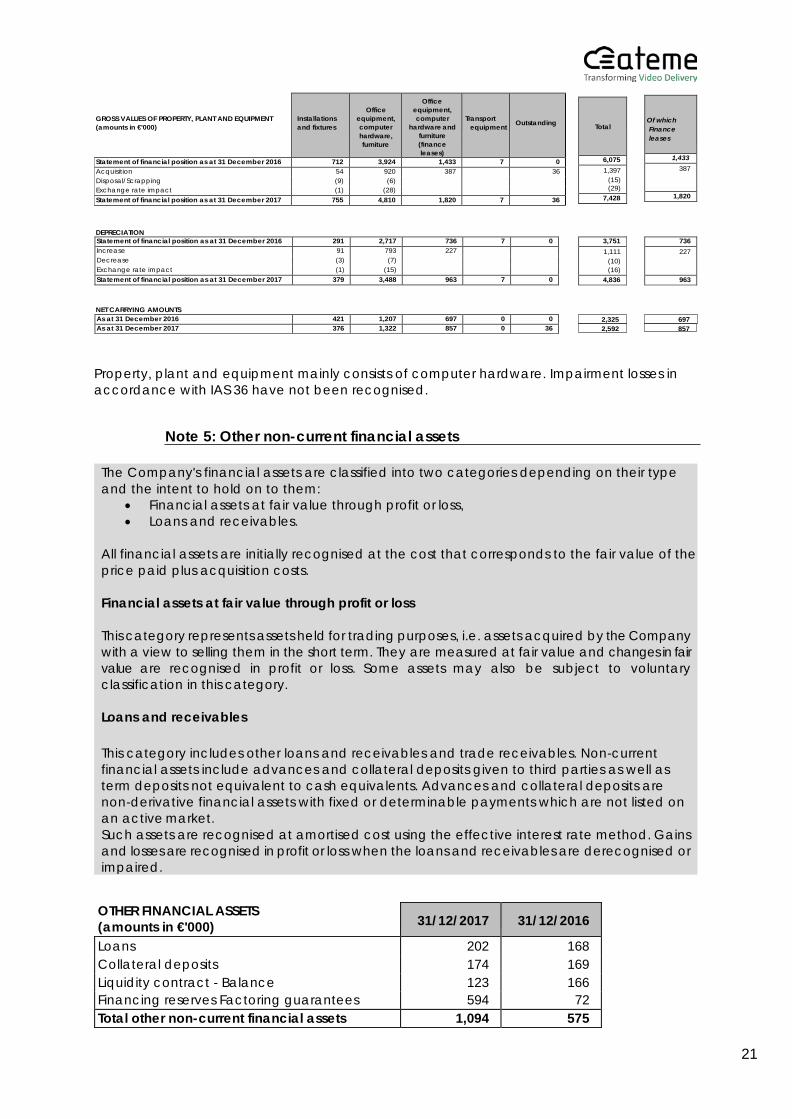
Property, plant and equipment mainly consists of computer hardware. Impairment losses in accordance with IAS 36 have not been recognised.
Note 5: Other non-current financial assets
OTHER FINANCIAL ASSETS (amounts in €'000) 31/12/2017 31/12/2016
Loans 202 168 Collateral deposits 174 169 Liquidity contract - Balance 123 166 Financing reserves Factoring guarantees 594 72 Total other non-current financial assets 1,094 575
GROSS VALUES OF PROPERTY, PLANT AND EQUIPMENT (amounts in €'000)
Installations and fixtures
Office
equipment, computer hardware, furniture
Office equipment, computer
hardware and furniture (finance leases)
Transport
equipment
Outstanding
Statement of financial position as at 31 December 2016 712 3,924 1,433 7 0 Acquisition 54 920 387 36 Disposal/Scrapping (9) (6)
Exchange rate impact (1) (28)
Statement of financial position as at 31 December 2017 755 4,810 1,820 7 36
Total
6,075 1,397
(15) (29)
7,428
Of which Finance leases
1,433 387
1,820
Statement of financial position as at 31 December 2016 291 2,717 736 7 0 Increase 91 793 227 Decrease (3) (7)
Exchange rate impact (1) (15)
Statement of financial position as at 31 December 2017 379 3,488 963 7 0
3,751 1,111
(10) (16)
4,836
736 227
963
As at 31 December 2016 421 1,207 697 0 0 As at 31 December 2017 376 1,322 857 0 36
2,325 697
The Company's financial assets are classified into two categories depending on their type and the intent to hold on to them:
• Financial assets at fair value through profit or loss, • Loans and receivables.
All financial assets are initially recognised at the cost that corresponds to the fair value of the price paid plus acquisition costs.
Financial assets at fair value through profit or loss
This category represents assets held for trading purposes, i.e. assets acquired by the Company with a view to selling them in the short term. They are measured at fair value and changes in fair value are recognised in profit or loss. Some assets may also be subject to voluntary classification in this category.
Loans and receivables
This category includes other loans and receivables and trade receivables. Non-current financial assets include advances and collateral deposits given to third parties as well as term deposits not equivalent to cash equivalents. Advances and collateral deposits are non-derivative financial assets with fixed or determinable payments which are not listed on an active market. Such assets are recognised at amortised cost using the effective interest rate method. Gains and losses are recognised in profit or loss when the loans and receivables are derecognised or impaired.
857 2,592
22
Collateral deposits mainly concern deposits paid under the signed commercial leases. The financing reserve and the guarantee related to factoring was allocated in other financial assets and represents the balance of the amounts due by the factor as at 31 December 2017.
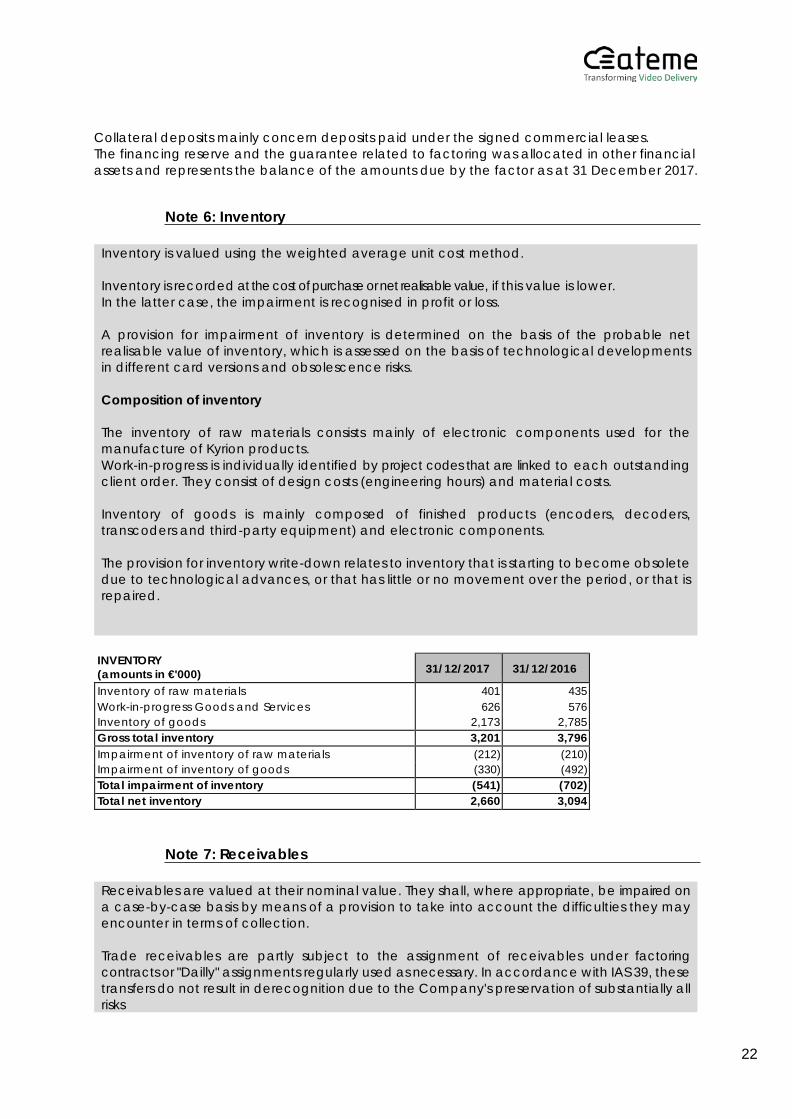
Note 6: Inventory
INVENTORY (amounts in €'000) 31/12/2017 31/12/2016
Inventory of raw materials 401 435 Work-in-progress Goods and Services 626 576 Inventory of goods 2,173 2,785 Gross total inventory 3,201 3,796 Impairment of inventory of raw materials (212) (210) Impairment of inventory of goods (330) (492) Total impairment of inventory (541) (702) Total net inventory 2,660 3,094
Note 7: Receivables
Inventory is valued using the weighted average unit cost method. Inventory is recorded at the cost of purchase or net realisable value, if this value is lower. In the latter case, the impairment is recognised in profit or loss.
A provision for impairment of inventory is determined on the basis of the probable net realisable value of inventory, which is assessed on the basis of technological developments in different card versions and obsolescence risks.
Composition of inventory
The inventory of raw materials consists mainly of electronic components used for the manufacture of Kyrion products. Work-in-progress is individually identified by project codes that are linked to each outstanding client order. They consist of design costs (engineering hours) and material costs.
Inventory of goods is mainly composed of finished products (encoders, decoders, transcoders and third-party equipment) and electronic components.
The provision for inventory write-down relates to inventory that is starting to become obsolete due to technological advances, or that has little or no movement over the period, or that is repaired.
Receivables are valued at their nominal value. They shall, where appropriate, be impaired on a case-by-case basis by means of a provision to take into account the difficulties they may encounter in terms of collection.
Trade receivables are partly subject to the assignment of receivables under factoring contracts or "Dailly" assignments regularly used as necessary. In accordance with IAS 39, these transfers do not result in derecognition due to the Company's preservation of substantially all risks
23
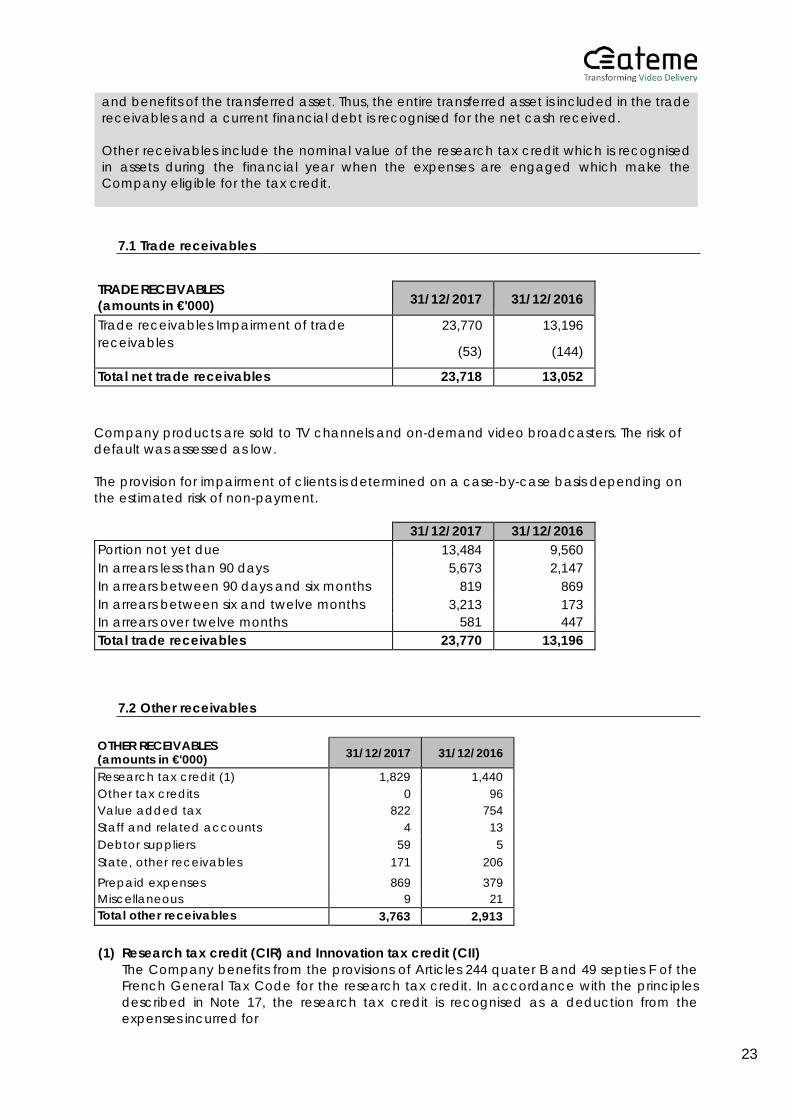
7.1 Trade receivables
TRADE RECEIVABLES (amounts in €'000) 31/12/2017 31/12/2016
Trade receivables Impairment of trade receivables
23,770
(53)
13,196
(144)
Total net trade receivables 23,718 13,052
Company products are sold to TV channels and on-demand video broadcasters. The risk of default was assessed as low.
The provision for impairment of clients is determined on a case-by-case basis depending on the estimated risk of non-payment.
31/12/2017 31/12/2016 Portion not yet due 13,484 9,560 In arrears less than 90 days 5,673 2,147 In arrears between 90 days and six months 819 869 In arrears between six and twelve months 3,213 173 In arrears over twelve months 581 447 Total trade receivables 23,770 13,196
7.2 Other receivables
OTHER RECEIVABLES (amounts in €'000) 31/12/2017 31/12/2016
Research tax credit (1) 1,829 1,440 Other tax credits 0 96 Value added tax 822 754 Staff and related accounts 4 13 Debtor suppliers 59 5 State, other receivables 171 206 Prepaid expenses 869 379 Miscellaneous 9 21 Total other receivables 3,763 2,913
(1) Research tax credit (CIR) and Innovation tax credit (CII)
The Company benefits from the provisions of Articles 244 quater B and 49 septies F of the French General Tax Code for the research tax credit. In accordance with the principles described in Note 17, the research tax credit is recognised as a deduction from the expenses incurred for
and benefits of the transferred asset. Thus, the entire transferred asset is included in the trade receivables and a current financial debt is recognised for the net cash received.
Other receivables include the nominal value of the research tax credit which is recognised in assets during the financial year when the expenses are engaged which make the Company eligible for the tax credit.
24
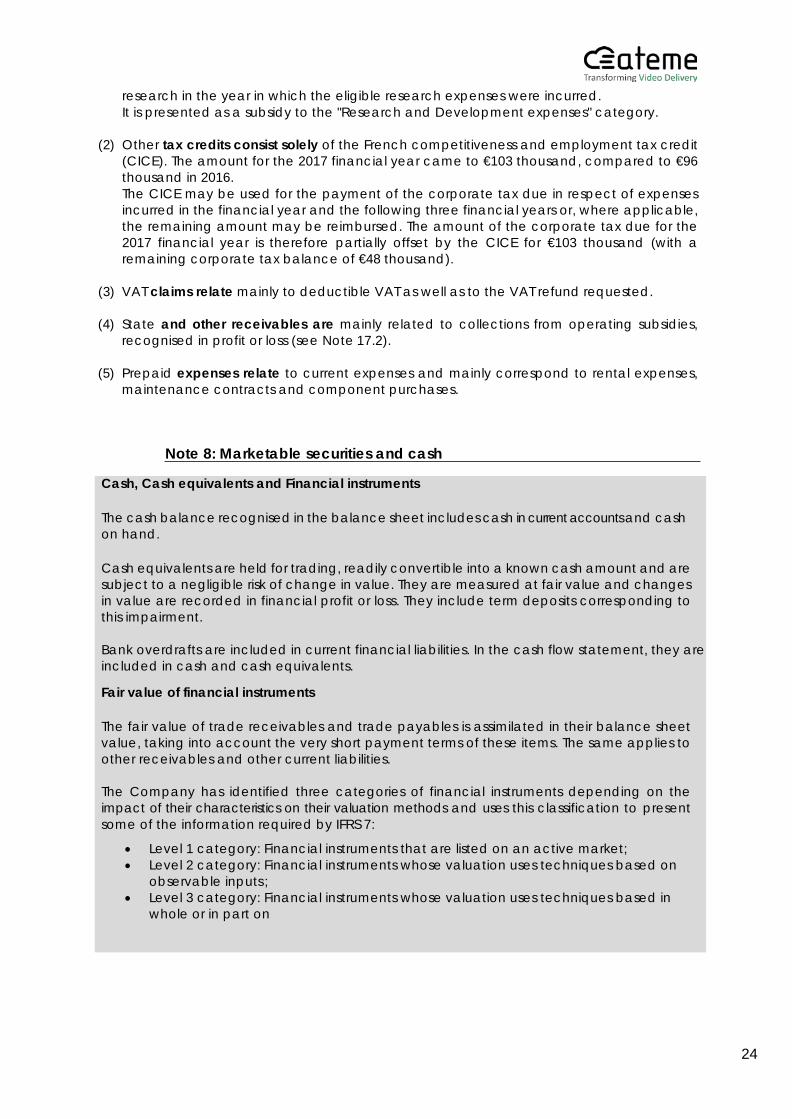
research in the year in which the eligible research expenses were incurred. It is presented as a subsidy to the "Research and Development expenses" category.
(2) Other tax credits consist solely of the French competitiveness and employment tax credit
(CICE). The amount for the 2017 financial year came to €103 thousand, compared to €96 thousand in 2016. The CICE may be used for the payment of the corporate tax due in respect of expenses incurred in the financial year and the following three financial years or, where applicable, the remaining amount may be reimbursed. The amount of the corporate tax due for the 2017 financial year is therefore partially offset by the CICE for €103 thousand (with a remaining corporate tax balance of €48 thousand).
(3) VAT claims relate mainly to deductible VAT as well as to the VAT refund requested.
(4) State and other receivables are mainly related to collections from operating subsidies,
recognised in profit or loss (see Note 17.2).
(5) Prepaid expenses relate to current expenses and mainly correspond to rental expenses, maintenance contracts and component purchases.
Note 8: Marketable securities and cash
Cash, Cash equivalents and Financial instruments
The cash balance recognised in the balance sheet includes cash in current accounts and cash on hand.
Cash equivalents are held for trading, readily convertible into a known cash amount and are subject to a negligible risk of change in value. They are measured at fair value and changes in value are recorded in financial profit or loss. They include term deposits corresponding to this impairment.
Bank overdrafts are included in current financial liabilities. In the cash flow statement, they are included in cash and cash equivalents.
Fair value of financial instruments
The fair value of trade receivables and trade payables is assimilated in their balance sheet value, taking into account the very short payment terms of these items. The same applies to other receivables and other current liabilities.
The Company has identified three categories of financial instruments depending on the impact of their characteristics on their valuation methods and uses this classification to present some of the information required by IFRS 7:
• Level 1 category: Financial instruments that are listed on an active market; • Level 2 category: Financial instruments whose valuation uses techniques based on
observable inputs ; • Level 3 category: Financial instruments whose valuation uses techniques based in
whole or in part on
25
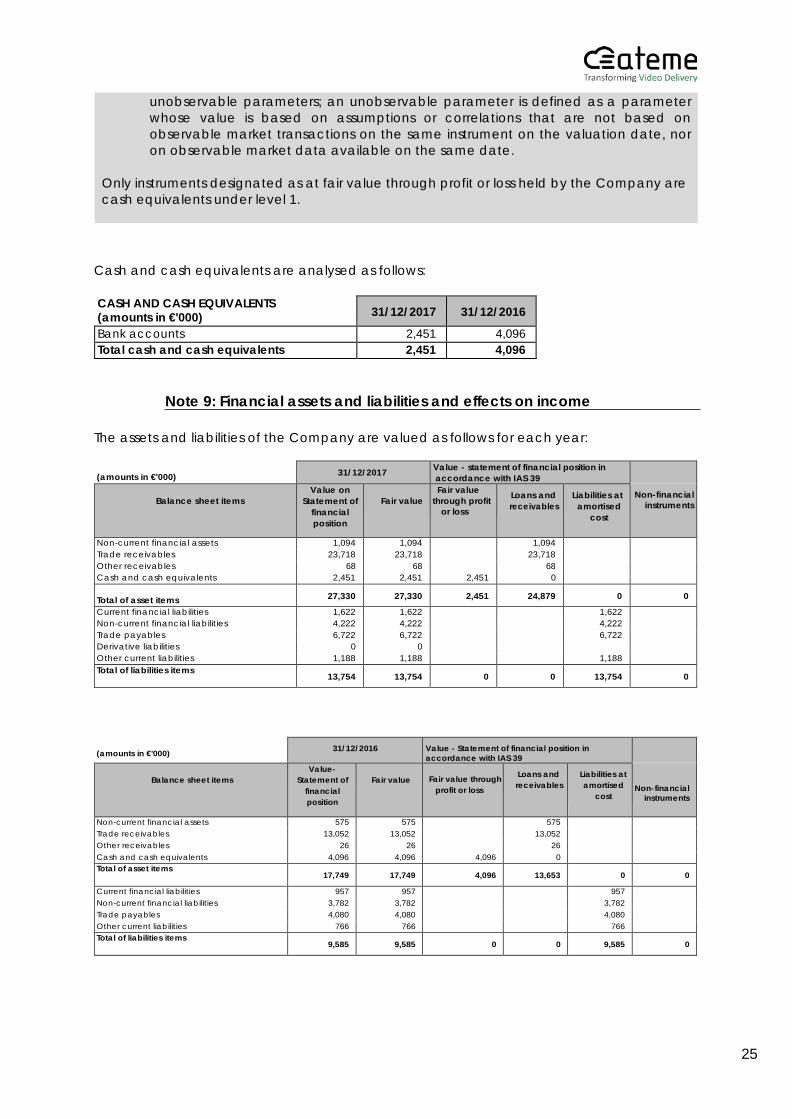
Cash and cash equivalents are analysed as follows:
CASH AND CASH EQUIVALENTS (amounts in €'000) 31/12/2017 31/12/2016
Bank accounts 2,451 4,096 Total cash and cash equivalents 2,451 4,096
Note 9: Financial assets and liabilities and effects on income
The assets and liabilities of the Company are valued as follows for each year:
(amounts in €'000) 31/12/2017 Value - statement of financial position in
accordance with IAS 39
Balance sheet items Value on
Statement of financial position
Fair value
Fair value through profit
or loss
Loans and receivables
Liabilities at amortised
cost
Non-financial instruments
Non-current financial assets 1,094 1,094 1,094 Trade receivables 23,718 23,718 23,718 Other receivables 68 68 68 Cash and cash equivalents 2,451 2,451 2,451 0 Total of asset items 27,330 27,330 2,451 24,879 0 0
Current financial liabilities 1,622 1,622 1,622 Non-current financial liabilities 4,222 4,222 4,222 Trade payables 6,722 6,722 6,722 Derivative liabilities 0 0
Other current liabilities 1,188 1,188 1,188 Total of liabilities items 13,754 13,754 0 0 13,754 0
(amounts in €'000) 31/12/2016 Value - Statement of financial position in
accordance with IAS 39
Balance sheet items
Value-Statement of
financial position
Fair value
Fair value through
profit or loss
Loans and receivables
Liabilities at amortised
cost
Non-financial instruments
Non-current financial assets 575 575 575
Trade receivables 13,052 13,052 13,052 Other receivables 26 26 26 Cash and cash equivalents 4,096 4,096 4,096 0 Total of asset items 17,749 17,749 4,096 13,653 0 0
Current financial liabilities 957 957 957
Non-current financial liabilities 3,782 3,782 3,782 Trade payables 4,080 4,080 4,080 Other current liabilities 766 766 766 Total of liabilities items 9,585 9,585 0 0 9,585 0
unobservable parameters; an unobservable parameter is defined as a parameter whose value is based on assumptions or correlations that are not based on observable market transactions on the same instrument on the valuation date, nor on observable market data available on the same date.
Only instruments designated as at fair value through profit or loss held by the Company are cash equivalents under level 1.
26
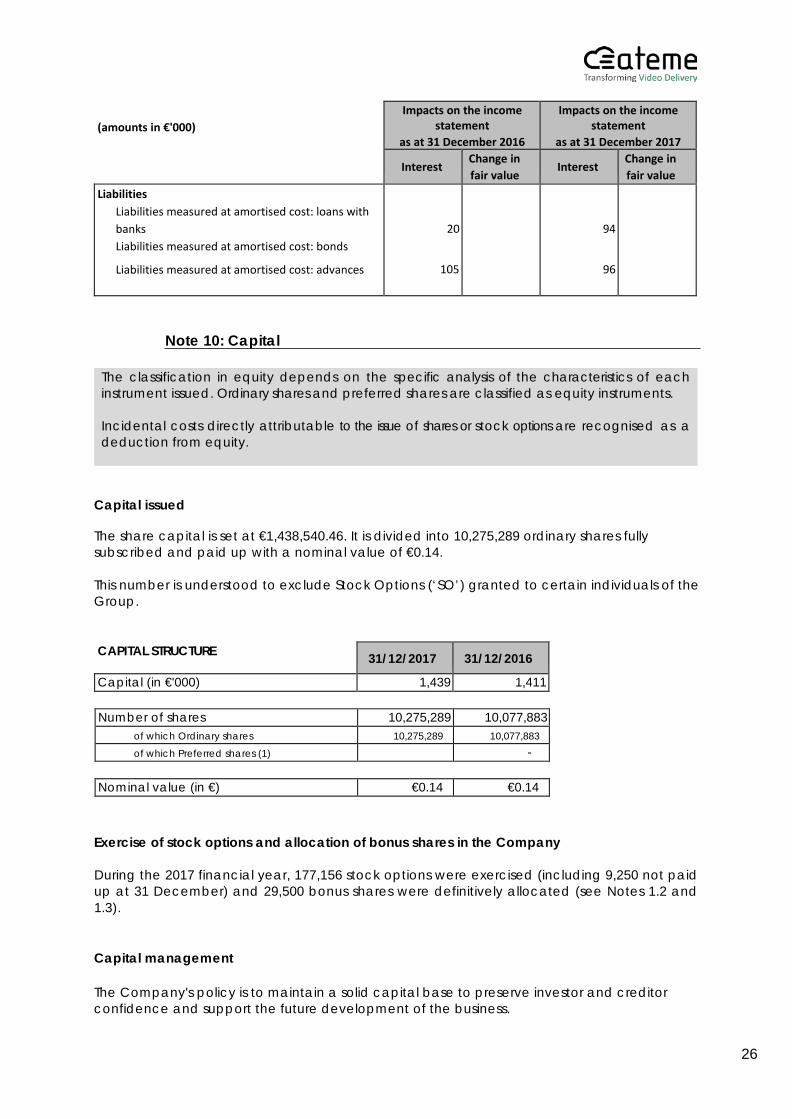
(amounts in €'000)
Impacts on the income statement
as at 31 December 2016
Impacts on the income statement
as at 31 December 2017
Interest Change in fair value
Interest Change in fair value
Liabilities Liabilities measured at amortised cost: loans with banks Liabilities measured at amortised cost: bonds
Liabilities measured at amortised cost: advances
20
105
94
96
Note 10: Capital
Capital issued The share capital is set at €1,438,540.46. It is divided into 10,275,289 ordinary shares fully subscribed and paid up with a nominal value of €0.14.
This number is understood to exclude Stock Options (‘SO’) granted to certain individuals of the Group.
CAPITAL STRUCTURE 31/12/2017 31/12/2016
Capital (in €'000) 1,439 1,411
Number of shares 10,275,289 10,077,883 of which Ordinary shares 10,275,289 10,077,883
of which Preferred shares (1) -
Nominal value (in €) €0.14 €0.14
Exercise of stock options and allocation of bonus shares in the Company During the 2017 financial year, 177,156 stock options were exercised (including 9,250 not paid up at 31 December) and 29,500 bonus shares were definitively allocated (see Notes 1.2 and 1.3).
Capital management The Company's policy is to maintain a solid capital base to preserve investor and creditor confidence and support the future development of the business.
The classification in equity depends on the specific analysis of the characteristics of each instrument issued. Ordinary shares and preferred shares are classified as equity instruments.
Incidental costs directly attributable to the issue of shares or stock options are recognised as a deduction from equity.
27
Dividend distribution
The Company did not pay dividends for the financial years ended 31 December 2016 and 31 December 2017.
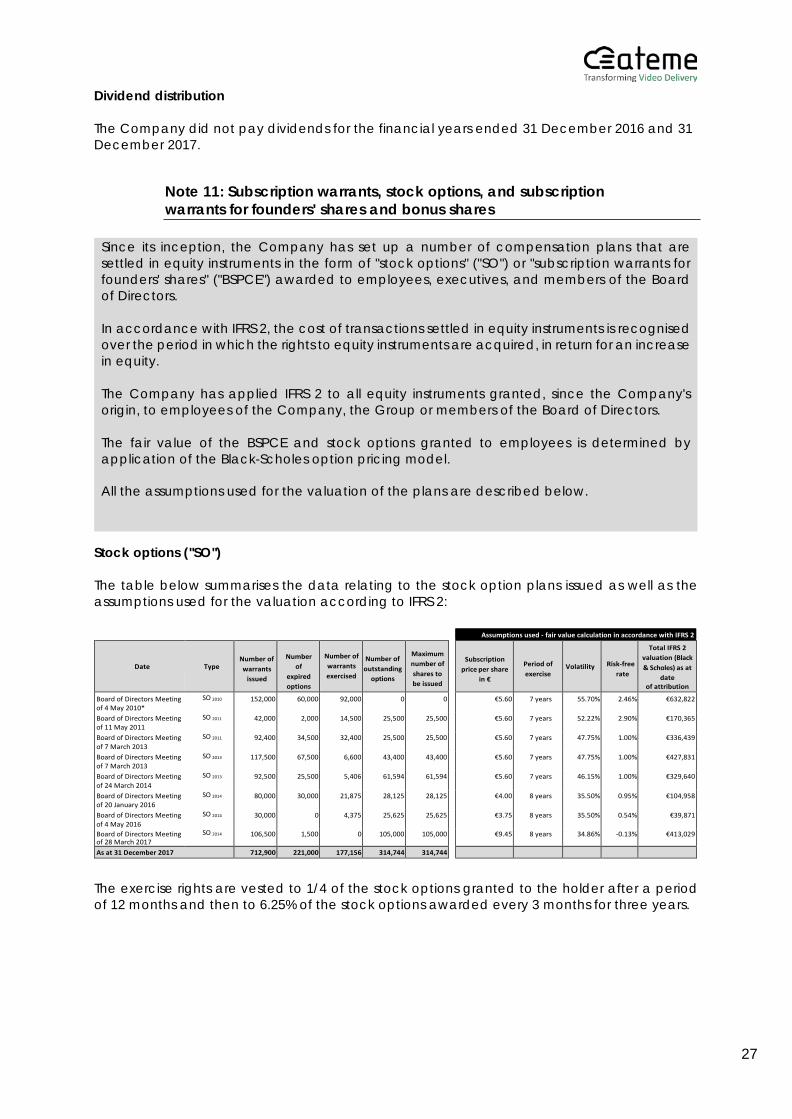
Note 11: Subscription warrants, stock options, and subscription warrants for founders' shares and bonus shares
Stock options ("SO") The table below summarises the data relating to the stock option plans issued as well as the assumptions used for the valuation according to IFRS 2:
Assumptions used - fair value calculation in accordance with IFRS 2
Date
Type Number of warrants
issued
Number
of expired options
Number of warrants exercised
Number of outstanding
options
Maximum number of shares to be issued
Subscription
price per share in €
Period of exercise
Volatility Risk-free rate
Total IFRS 2 valuation (Black & Scholes) as at
date of attribution
Board of Directors Meeting of 4 May 2010*
SO 2010 152,000 60,000 92,000 0 0 €5.60 7 years 55.70% 2.46% €632,822
Board of Directors Meeting of 11 May 2011
SO 2011 42,000 2,000 14,500 25,500 25,500 €5.60 7 years 52.22% 2.90% €170,365
Board of Directors Meeting of 7 March 2013
SO 2011 92,400 34,500 32,400 25,500 25,500 €5.60 7 years 47.75% 1.00% €336,439
Board of Directors Meeting of 7 March 2013
SO 2013 117,500 67,500 6,600 43,400 43,400 €5.60 7 years 47.75% 1.00% €427,831
Board of Directors Meeting of 24 March 2014
SO 2013 92,500 25,500 5,406 61,594 61,594 €5.60 7 years 46.15% 1.00% €329,640
Board of Directors Meeting of 20 January 2016
SO 2014 80,000 30,000 21,875 28,125 28,125 €4.00 8 years 35.50% 0.95% €104,958
Board of Directors Meeting of 4 May 2016
SO 2014 30,000 0 4,375 25,625 25,625 €3.75 8 years 35.50% 0.54% €39,871
Board of Directors Meeting of 28 March 2017
SO 2014 106,500 1,500 0 105,000 105,000 €9.45 8 years 34.86% -0.13% €413,029
As at 31 December 2017 712,900 221,000 177,156 314,744 314,744
The exercise rights are vested to 1/4 of the stock options granted to the holder after a period of 12 months and then to 6.25% of the stock options awarded every 3 months for three years.
Since its inception, the Company has set up a number of compensation plans that are settled in equity instruments in the form of "stock options" ("SO") or "subscription warrants for founders' shares" ("BSPCE") awarded to employees, executives, and members of the Board of Directors.
In accordance with IFRS 2, the cost of transactions settled in equity instruments is recognised over the period in which the rights to equity instruments are acquired, in return for an increase in equity.
The Company has applied IFRS 2 to all equity instruments granted, since the Company's origin, to employees of the Company, the Group or members of the Board of Directors.
The fair value of the BSPCE and stock options granted to employees is determined by application of the Black-Scholes option pricing model.
All the assumptions used for the valuation of the plans are described below.
28
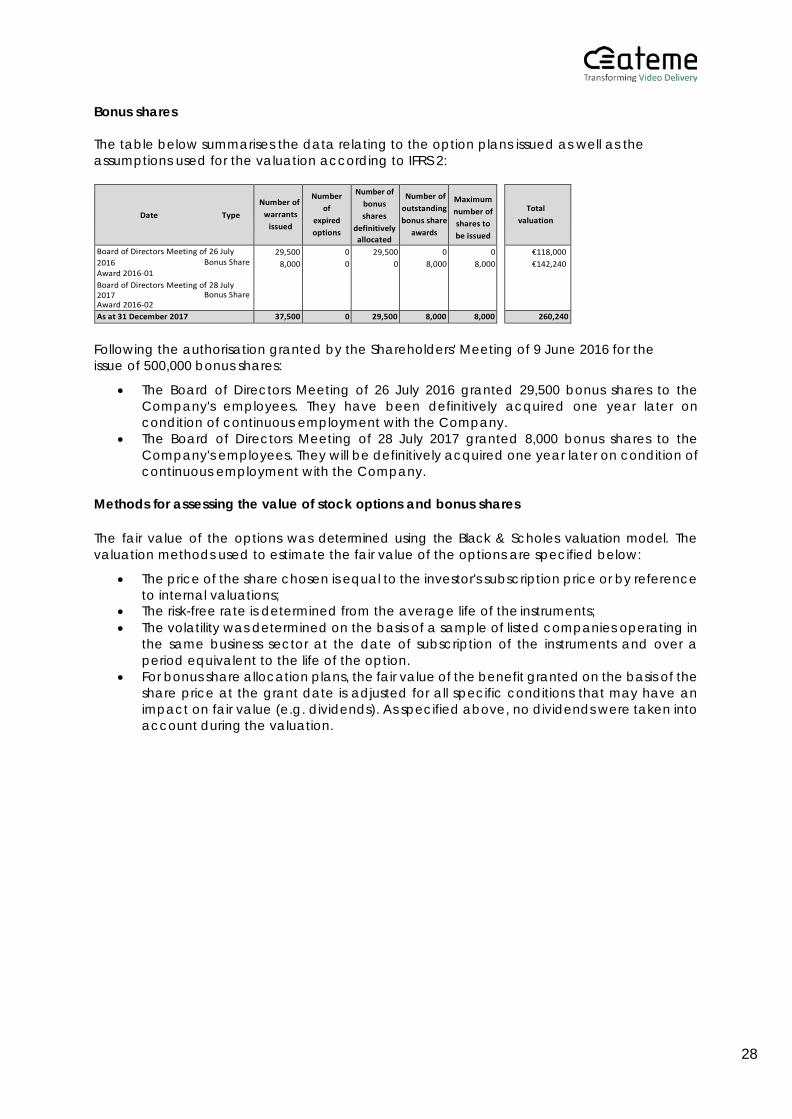
Bonus shares The table below summarises the data relating to the option plans issued as well as the assumptions used for the valuation according to IFRS 2:
Date Type Number of
warrants issued
Number of
expired options
Number of bonus shares
definitively allocated
Number of outstanding bonus share
awards
Maximum number of shares to be issued
Total valuation
Board of Directors Meeting of 26 July 2016 Bonus Share Award 2016-01 Board of Directors Meeting of 28 July 2017 Bonus Share Award 2016-02
29,500 8,000
0 0
29,500 0
0 8,000
0 8,000
€118,000 €142,240
As at 31 December 2017 37,500 0 29,500 8,000 8,000 260,240
Following the authorisation granted by the Shareholders' Meeting of 9 June 2016 for the issue of 500,000 bonus shares:
• The Board of Directors Meeting of 26 July 2016 granted 29,500 bonus shares to the Company's employees. They have been definitively acquired one year later on condition of continuous employment with the Company.
• The Board of Directors Meeting of 28 July 2017 granted 8,000 bonus shares to the Company's employees. They will be definitively acquired one year later on condition of continuous employment with the Company.
Methods for assessing the value of stock options and bonus shares The fair value of the options was determined using the Black & Scholes valuation model. The valuation methods used to estimate the fair value of the options are specified below:
• The price of the share chosen is equal to the investor's subscription price or by reference to internal valuations;
• The risk-free rate is determined from the average life of the instruments; • The volatility was determined on the basis of a sample of listed companies operating in
the same business sector at the date of subscription of the instruments and over a period equivalent to the life of the option.
• For bonus share allocation plans, the fair value of the benefit granted on the basis of the share price at the grant date is adjusted for all specific conditions that may have an impact on fair value (e.g. dividends). As specified above, no dividends were taken into account during the valuation.
29
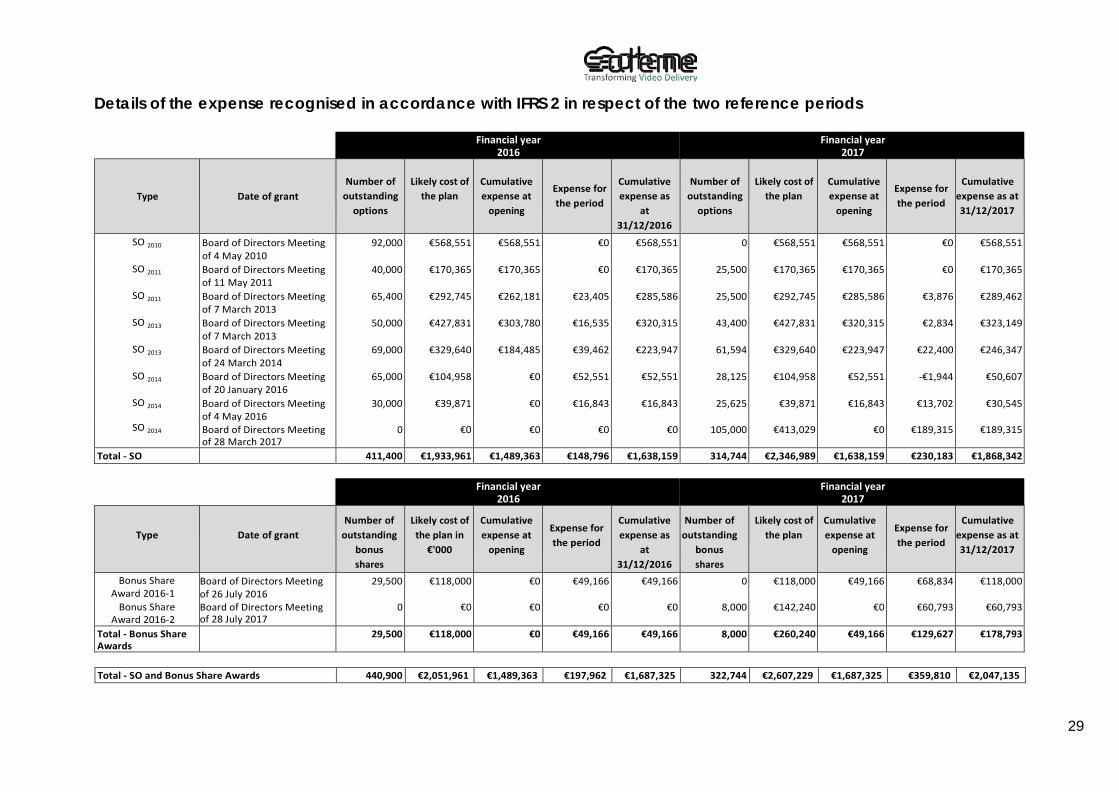
Details of the expense recognised in accordance with IFRS 2 in respect of the two reference periods
Financial year 2016
Financial year 2017
Type
Date of grant
Number of
outstanding options
Likely cost of
the plan
Cumulative expense at
opening
Expense for the period
Cumulative expense as
at 31/12/2016
Number of
outstanding options
Likely cost of
the plan
Cumulative expense at
opening
Expense for the period
Cumulative
expense as at 31/12/2017
SO 2010 Board of Directors Meeting of 4 May 2010
92,000 €568,551 €568,551 €0 €568,551 0 €568,551 €568,551 €0 €568,551
SO 2011 Board of Directors Meeting of 11 May 2011
40,000 €170,365 €170,365 €0 €170,365 25,500 €170,365 €170,365 €0 €170,365
SO 2011 Board of Directors Meeting of 7 March 2013
65,400 €292,745 €262,181 €23,405 €285,586 25,500 €292,745 €285,586 €3,876 €289,462
SO 2013 Board of Directors Meeting of 7 March 2013
50,000 €427,831 €303,780 €16,535 €320,315 43,400 €427,831 €320,315 €2,834 €323,149
SO 2013 Board of Directors Meeting of 24 March 2014
69,000 €329,640 €184,485 €39,462 €223,947 61,594 €329,640 €223,947 €22,400 €246,347
SO 2014 Board of Directors Meeting of 20 January 2016
65,000 €104,958 €0 €52,551 €52,551 28,125 €104,958 €52,551 -€1,944 €50,607
SO 2014 Board of Directors Meeting of 4 May 2016
30,000 €39,871 €0 €16,843 €16,843 25,625 €39,871 €16,843 €13,702 €30,545
SO 2014 Board of Directors Meeting of 28 March 2017
0 €0 €0 €0 €0 105,000 €413,029 €0 €189,315 €189,315
Total - SO 411,400 €1,933,961 €1,489,363 €148,796 €1,638,159 314,744 €2,346,989 €1,638,159 €230,183 €1,868,342
Financial year 2016
Financial year 2017
Type
Date of grant Number of
outstanding bonus shares
Likely cost of the plan in
€'000
Cumulative expense at
opening
Expense for the period
Cumulative expense as
at 31/12/2016
Number of outstanding
bonus shares
Likely cost of the plan
Cumulative expense at
opening
Expense for the period
Cumulative expense as at 31/12/2017
Bonus Share Award 2016-1
Board of Directors Meeting of 26 July 2016
29,500 €118,000 €0 €49,166 €49,166 0 €118,000 €49,166 €68,834 €118,000
Bonus Share Award 2016-2
Board of Directors Meeting of 28 July 2017
0 €0 €0 €0 €0 8,000 €142,240 €0 €60,793 €60,793
Total - Bonus Share Awards
29,500 €118,000 €0 €49,166 €49,166 8,000 €260,240 €49,166 €129,627 €178,793
Total - SO and Bonus Share Awards 440,900 €2,051,961 €1,489,363 €197,962 €1,687,325 322,744 €2,607,229 €1,687,325 €359,810 €2,047,135
30
Note 12: Borrowings and financial debts
Financial liabilities are classified in one category: Financial liabilities recognised at amortised cost.
Financial liabilities recognised at amortised cost
Borrowings and other financial liabilities, such as conditional advances, are recorded at amortised cost calculated using the effective interest rate. The portion of financial liabilities with maturity of less than one year is presented in "Current financial liabilities."
Conditional advances
The Company benefits from a number of public aid programmes, in the form of subsidies or conditional advances. The details of these aid programmes are provided in Note 12.3.
They have been accounted for in accordance with IAS 20. With respect to financial advances, made at interest rates below the market rate, they are valued according to IAS 39 at amortised cost:
• The rate advantage is determined using a discount rate corresponding to a market rate at the date of the grant. The amount resulting from the rate advantage obtained when granting repayable advances not bearing interest is considered a subsidy recorded as income in the statement of comprehensive income.
• The financial cost of repayable advances calculated at the market rate is then recorded in financial expenses.
Subsidies are presented at the level of the category: • « "Research and Development" for aid for innovation and financing of research
activities, • "Marketing and Sales" for prospection in new geographical areas.
These advances are recorded in "Non-current financial liabilities" and "Current financial liabilities" according to their maturity. In the event of failure, the cancellation of the receivable is recognised in subsidies.
Finance leases
Assets financed by finance leases within the meaning of IAS 17, which in substance transfer the risks and rewards of ownership to ATEME, are recognised on the assets side of the balance sheet. The corresponding debt is recorded on the liabilities side in "Financial liabilities".
31
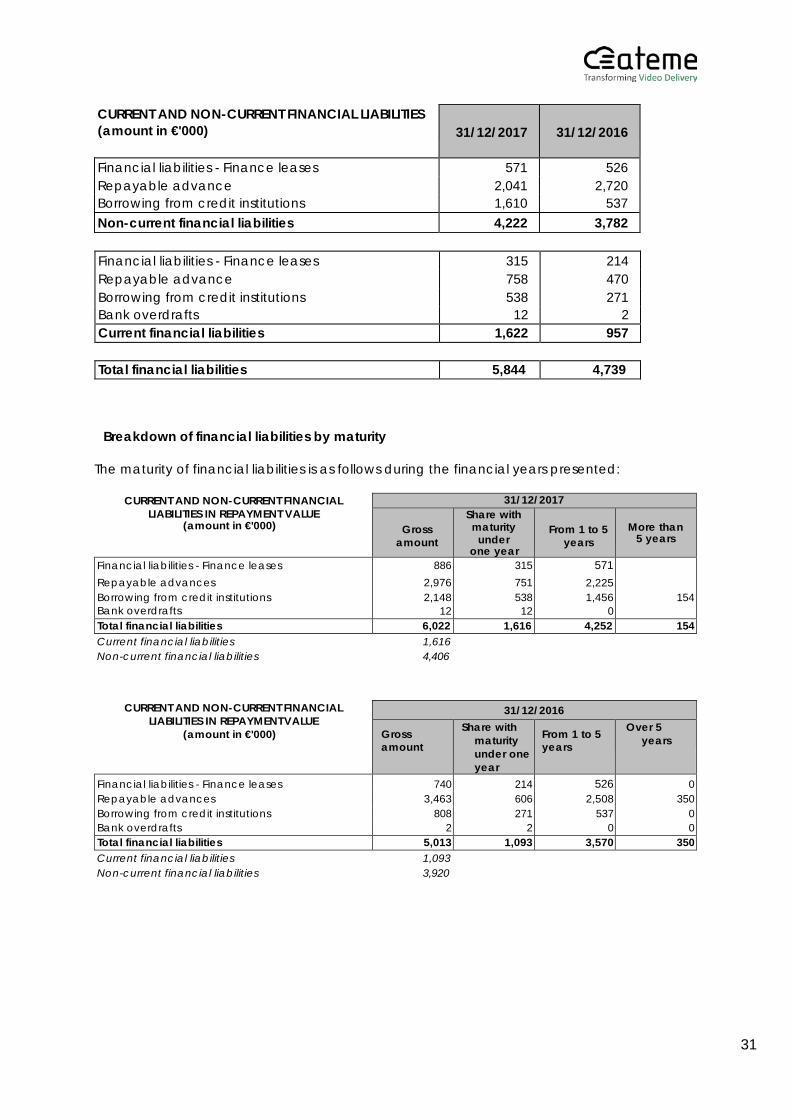
CURRENT AND NON-CURRENT FINANCIAL LIABILITIES (amount in €'000)
31/12/2017
31/12/2016
Financial liabilities - Finance leases 571 526 Repayable advance 2,041 2,720 Borrowing from credit institutions 1,610 537 Non-current financial liabilities 4,222 3,782
Financial liabilities - Finance leases 315 214 Repayable advance 758 470 Borrowing from credit institutions 538 271 Bank overdrafts 12 2 Current financial liabilities 1,622 957
Total financial liabilities 5,844 4,739
Breakdown of financial liabilities by maturity
The maturity of financial liabilities is as follows during the financial years presented:
CURRENT AND NON-CURRENT FINANCIAL LIABILITIES IN REPAYMENT VALUE
(amount in €'000)
31/12/2017
Gross amount
Share with maturity
under one year
From 1 to 5 years
More than 5 years
Financial liabilities - Finance leases Repayable advances Borrowing from credit institutions Bank overdrafts
886 2,976 2,148
12
315 751 538 12
571 2,225 1,456
0
154
Total financial liabilities 6,022 1,616 4,252 154 Current financial liabilities 1,616 Non-current financial liabilities 4,406
CURRENT AND NON-CURRENT FINANCIAL LIABILITIES IN REPAYMENT VALUE
(amount in €'000)
31/12/2016
Gross amount
Share with maturity under one year
From 1 to 5 years
Over 5 years
Financial liabilities - Finance leases 740 214 526 0 Repayable advances 3,463 606 2,508 350 Borrowing from credit institutions 808 271 537 0 Bank overdrafts 2 2 0 0 Total financial liabilities 5,013 1,093 3,570 350 Current financial liabilities 1,093 Non-current financial liabilities 3,920
32
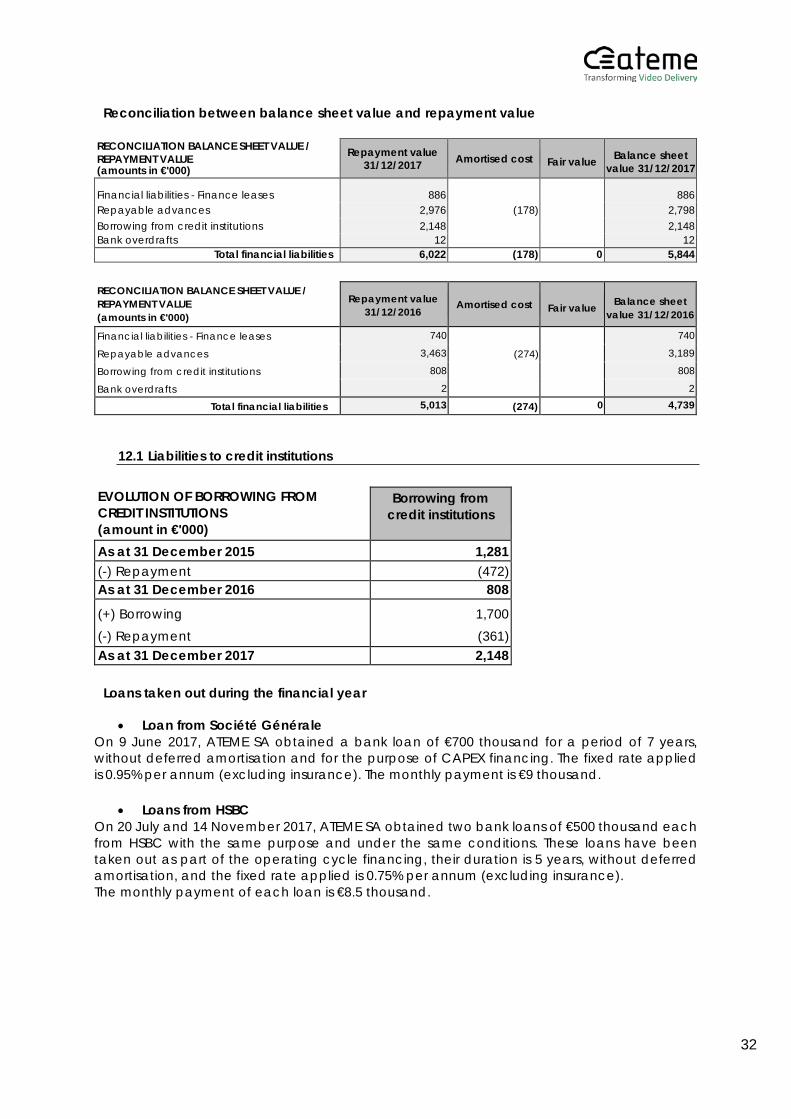
Reconciliation between balance sheet value and repayment value
RECONCILIATION BALANCE SHEET VALUE / REPAYMENT VALUE (amounts in €'000)
Repayment value 31/12/2017 Amortised cost Fair value Balance sheet
value 31/12/2017
Financial liabilities - Finance leases 886
886 Repayable advances 2,976 (178) 2,798 Borrowing from credit institutions 2,148 2,148 Bank overdrafts 12 12
Total financial liabilities 6,022 (178) 0 5,844
RECONCILIATION BALANCE SHEET VALUE / REPAYMENT VALUE (amounts in €'000)
Repayment value 31/12/2016
Amortised cost Fair value Balance sheet value 31/12/2016
Financial liabilities - Finance leases 740 740
Repayable advances 3,463 (274) 3,189
Borrowing from credit institutions 808 808
Bank overdrafts 2 2
Total financial liabilities 5,013 (274) 0 4,739
12.1 Liabilities to credit institutions
EVOLUTION OF BORROWING FROM CREDIT INSTITUTIONS (amount in €'000)
Borrowing from credit institutions
As at 31 December 2015 1,281 (-) Repayment (472) As at 31 December 2016 808
(+) Borrowing (-) Repayment
1,700 (361)
As at 31 December 2017 2,148
Loans taken out during the financial year
• Loan from Société Générale On 9 June 2017, ATEME SA obtained a bank loan of €700 thousand for a period of 7 years, without deferred amortisation and for the purpose of CAPEX financing. The fixed rate applied is 0.95% per annum (excluding insurance). The monthly payment is €9 thousand.
• Loans from HSBC
On 20 July and 14 November 2017, ATEME SA obtained two bank loans of €500 thousand each from HSBC with the same purpose and under the same conditions. These loans have been taken out as part of the operating cycle financing, their duration is 5 years, without deferred amortisation, and the fixed rate applied is 0.75% per annum (excluding insurance). The monthly payment of each loan is €8.5 thousand.
33
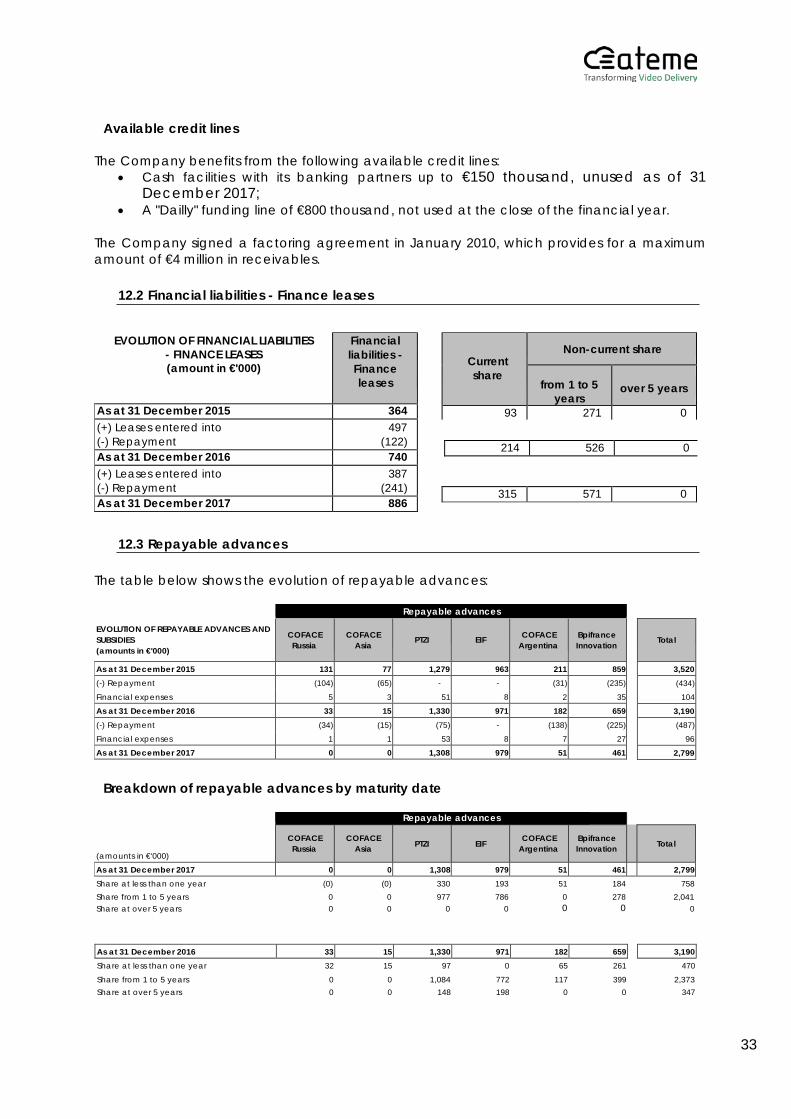
Available credit lines
The Company benefits from the following available credit lines:
• Cash facilities with its banking partners up to €150 thousand, unused as of 31 December 2017;
• A "Dailly" funding line of €800 thousand, not used at the close of the financial year.
The Company signed a factoring agreement in January 2010, which provides for a maximum amount of €4 million in receivables.
12.2 Financial liabilities - Finance leases
12.3 Repayable advances
The table below shows the evolution of repayable advances:
Breakdown of repayable advances by maturity date
Share at less than one year (0) (0) 330 193 51 184 758 Share from 1 to 5 years 0 0 977 786 0 278 2,041 Share at over 5 years 0 0 0 0 0 0 0
As at 31 December 2016 33 15 1,330 971 182 659 3,190 Share at less than one year 32 15 97 0 65 261 470
Share from 1 to 5 years 0 0 1,084 772 117 399 2,373 Share at over 5 years 0 0 148 198 0 0 347
EVOLUTION OF FINANCIAL LIABILITIES - FINANCE LEASES (amount in €'000)
Financial liabilities - Finance leases
As at 31 December 2015 364 (+) Leases entered into (-) Repayment
497 (122)
As at 31 December 2016 740 (+) Leases entered into (-) Repayment
387 (241)
As at 31 December 2017 886
Current share
Non-current share
from 1 to 5 years
over 5 years
93 271 0
214 526 0
315 571 0
EVOLUTION OF REPAYABLE ADVANCES AND SUBSIDIES (amounts in €'000)
Repayable advances
COFACE Russia
COFACE
Asia
PTZI
EIF
COFACE
Argentina
Bpifrance Innovation
As at 31 December 2015 131 77 1,279 963 211 859 (-) Repayment (104) (65) - -
8
(31) (235)
Financial expenses 5 3 51 2 35
As at 31 December 2016 33 15 1,330 971 182 659 (-) Repayment (34) (15) (75) -
8
(138) (225)
Financial expenses 1 1 53 7 27
As at 31 December 2017 0 0 1,308 979 51 461
Total
3,520 (434)
104
3,190 (487)
96
2,799
(amounts in €'000)
Repayable advances
COFACE Russia
COFACE Asia
PTZI
EIF COFACE
Argentina Bpifrance Innovation
Total
As at 31 December 2017 0 0 1,308 979 51 461 2,799
34
Repayable advances
The share of advances received with a maturity of more than one year is recorded as "Non-current financial liabilities"; while the share with maturity of less than one year is recorded as "Current financial liabilities."
In IFRS, the fact that the repayable advance does not include payment of an annual interest is to consider that the Company has benefited from a zero interest rate loan, which is more favourable than market conditions. The difference between the amount of the advance at the historical cost and that of the discounted advance at a market rate is considered to be a subsidy received from the State.
Bpifrance (formerly OSEO) zero percent interest rate loan for innovation ("PTZI") - MPEG-4 Intra Contribution Encoder
On 19 July 2012, ATEME obtained a reimbursable innovation aid of €450,000 from Bpifrance, which is interest-free, for the development of the “MPEG-4 Intra contribution encoder”.
The OSEO payments were made a month after the contract was signed. Repayments will be staggered in 12 quarterly payments from 30 June 2015, i.e. €37,500 per payment, even in case of a commercial failure.
The fair value of this advance was determined on the basis of an estimated interest rate of 4.85% per annum.
The repayment value of the debt's balance was €75 thousand at 31 December 2017, compared with €225 thousand at 31 December 2016.
Bpifrance zero percent interest rate loan for innovation ("PTZI")
The Company obtained a zero percent interest rate innovation loan from Bpifrance of €500 thousand for the development of an HD HEVC contribution encoder. The repayment started on 31 March 2017, for a period of 5 years, with an annual payment of €100 thousand. The loan was received by the Company on 16 May 2014.
The fair value of this advance was determined on the basis of an estimated interest rate of 4.85% per annum.
The repayment value of the debt's balance was €425 thousand at 31 December 2017, compared to €500 thousand at 31 December 2016.
EIF (European Investment Fund) innovation loan
The Company has obtained an innovation loan from Bpifrance for an amount of €1,000 thousand for soft expenses linked to the industrial and commercial launch of an innovation. This loan is repayable in 28 quarterly payments, the first 8 quarters of which are deferred to a fixed rate of 3.52%. The loan was collected in November 2015. - This loan has been received under the PPI (Pret pour innovation, or loan for innovation) fund
for 30% of the principal. - This loan was subject to collateral pledged to the InnovFin programme of the European
Investment Fund for 50% of the principal.
As at 31 December 2017 and 2016, the repayment value of the debt's balance was €1,000 thousand.
35
Bpifrance zero percent interest rate loan for innovation ("PTZI")
The Company obtained a zero percent interest rate loan for innovation (PTZI) from Bpifrance on 1 October 2015 for the amount of €1,500 thousand, repayable in 20 straight-line quarterly payments starting on 30 September 2017.
The fair value of this advance was determined on the basis of the interest rate of the EIF's innovation loan, i.e. 3.52% per annum.
As at 31 December 2017, the repayment value of the debt's balance was €1,425 thousand, compared to €1,500 thousand as at 31 December 2016.
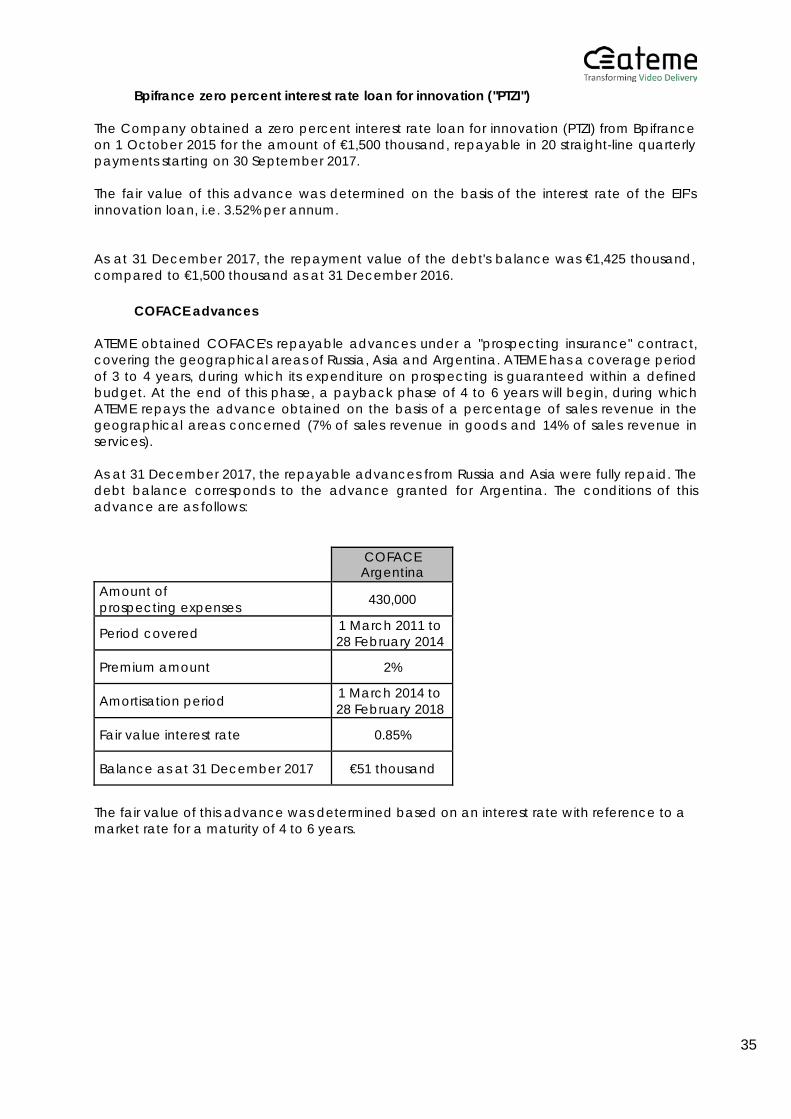
COFACE advances
ATEME obtained COFACE's repayable advances under a "prospecting insurance" contract, covering the geographical areas of Russia, Asia and Argentina. ATEME has a coverage period of 3 to 4 years, during which its expenditure on prospecting is guaranteed within a defined budget. At the end of this phase, a payback phase of 4 to 6 years will begin, during which ATEME repays the advance obtained on the basis of a percentage of sales revenue in the geographical areas concerned (7% of sales revenue in goods and 14% of sales revenue in services). As at 31 December 2017, the repayable advances from Russia and Asia were fully repaid. The debt balance corresponds to the advance granted for Argentina. The conditions of this advance are as follows:
COFACE Argentina
Amount of prospecting expenses 430,000
Period covered 1 March 2011 to 28 February 2014
Premium amount 2%
Amortisation period 1 March 2014 to 28 February 2018
Fair value interest rate 0.85%
Balance as at 31 December 2017 €51 thousand
The fair value of this advance was determined based on an interest rate with reference to a market rate for a maturity of 4 to 6 years.
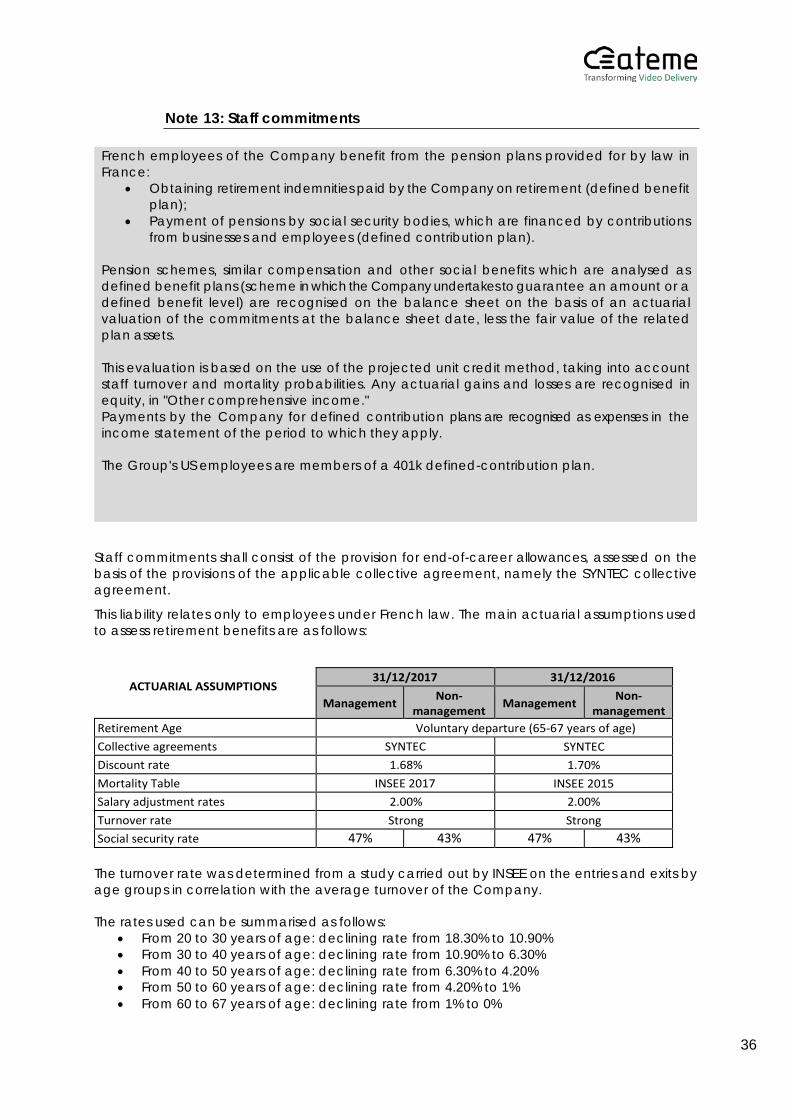
36
Note 13: Staff commitments
Staff commitments shall consist of the provision for end-of-career allowances, assessed on the basis of the provisions of the applicable collective agreement, namely the SYNTEC collective agreement.
This liability relates only to employees under French law. The main actuarial assumptions used to assess retirement benefits are as follows:
ACTUARIAL ASSUMPTIONS 31/12/2017 31/12/2016
Management Non-management Management Non-
management Retirement Age Voluntary departure (65-67 years of age) Collective agreements SYNTEC SYNTEC Discount rate 1.68% 1.70% Mortality Table INSEE 2017 INSEE 2015 Salary adjustment rates 2.00% 2.00% Turnover rate Strong Strong Social security rate 47% 43% 47% 43%
The turnover rate was determined from a study carried out by INSEE on the entries and exits by age groups in correlation with the average turnover of the Company.
The rates used can be summarised as follows:
• From 20 to 30 years of age: declining rate from 18.30% to 10.90% • From 30 to 40 years of age: declining rate from 10.90% to 6.30% • From 40 to 50 years of age: declining rate from 6.30% to 4.20% • From 50 to 60 years of age: declining rate from 4.20% to 1% • From 60 to 67 years of age: declining rate from 1% to 0%
French employees of the Company benefit from the pension plans provided for by law in France:
• Obtaining retirement indemnities paid by the Company on retirement (defined benefit plan);
• Payment of pensions by social security bodies, which are financed by contributions from businesses and employees (defined contribution plan).
Pension schemes, similar compensation and other social benefits which are analysed as defined benefit plans (scheme in which the Company undertakes to guarantee an amount or a defined benefit level) are recognised on the balance sheet on the basis of an actuarial valuation of the commitments at the balance sheet date, less the fair value of the related plan assets.
This evaluation is based on the use of the projected unit credit method, taking into account staff turnover and mortality probabilities. Any actuarial gains and losses are recognised in equity, in "Other comprehensive income." Payments by the Company for defined contribution plans are recognised as expenses in the income statement of the period to which they apply.
The Group's US employees are members of a 401k defined-contribution plan.
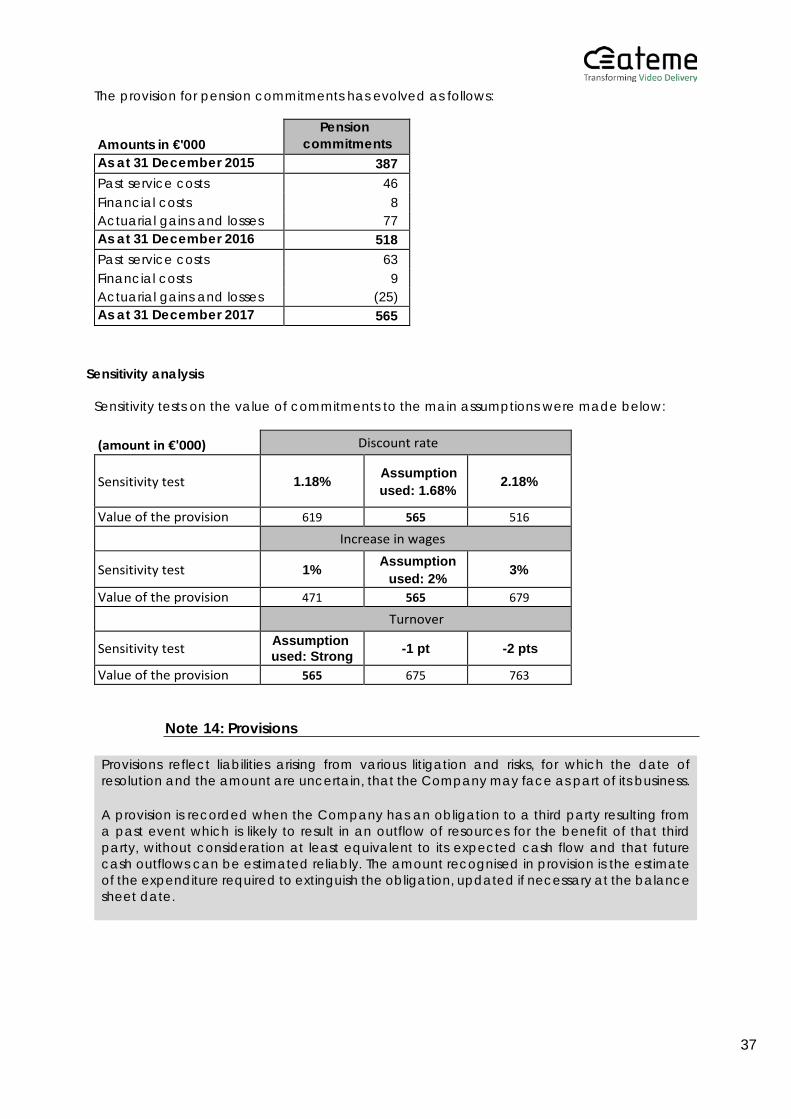
37
The provision for pension commitments has evolved as follows:
Amounts in €'000
Pension commitments
As at 31 December 2015 387 Past service costs 46 Financial costs 8 Actuarial gains and losses 77 As at 31 December 2016 518 Past service costs 63 Financial costs 9 Actuarial gains and losses (25) As at 31 December 2017 565
Sensitivity analysis
Sensitivity tests on the value of commitments to the main assumptions were made below:
(amount in €'000) Discount rate
Sensitivity test
1.18% Assumption
used: 1.68%
2.18%
Value of the provision 619 565 516 Increase in wages
Sensitivity test 1% Assumption used: 2% 3%
Value of the provision 471 565 679 Turnover
Sensitivity test Assumption used: Strong -1 pt -2 pts
Value of the provision 565 675 763
Note 14: Provisions
Provisions reflect liabilities arising from various litigation and risks, for which the date of resolution and the amount are uncertain, that the Company may face as part of its business.
A provision is recorded when the Company has an obligation to a third party resulting from a past event which is likely to result in an outflow of resources for the benefit of that third party, without consideration at least equivalent to its expected cash flow and that future cash outflows can be estimated reliably. The amount recognised in provision is the estimate of the expenditure required to extinguish the obligation, updated if necessary at the balance sheet date.
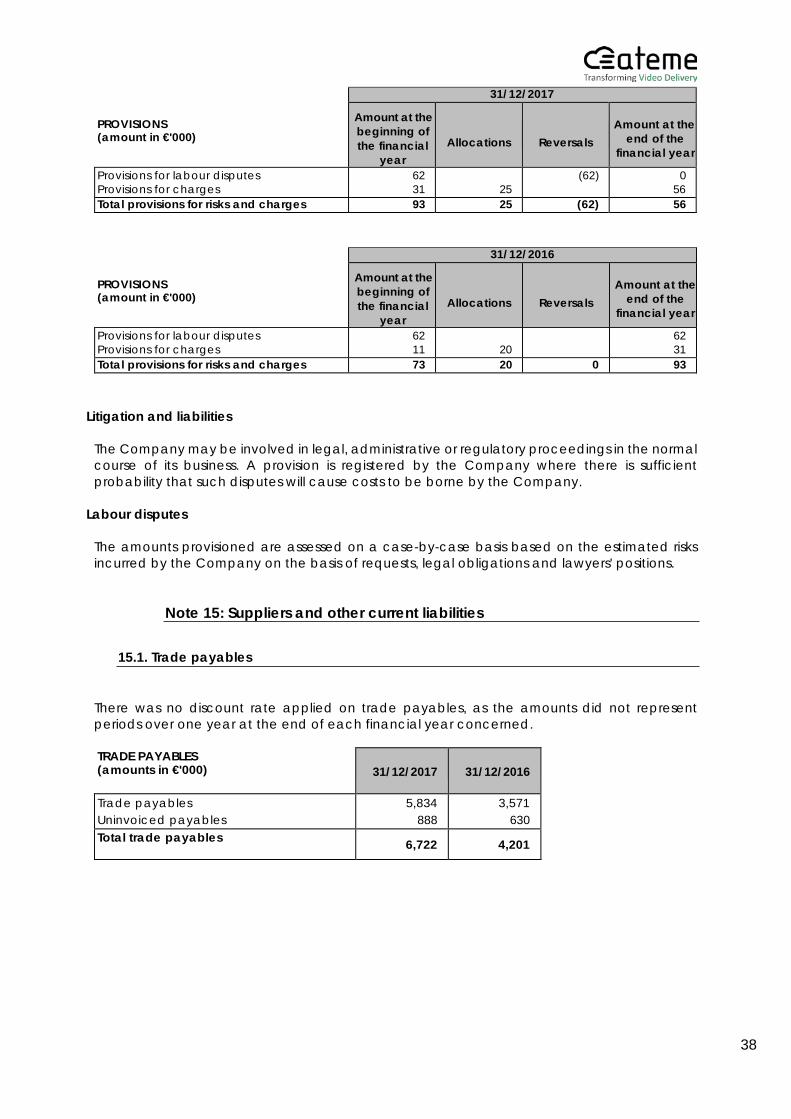
38
PROVISIONS (amount in €'000)
31/12/2017
Amount at the beginning of the financial
year
Allocations
Reversals
Amount at the end of the
financial year
Provisions for labour disputes Provisions for charges
62 31
25
(62) 0 56
Total provisions for risks and charges 93 25 (62) 56
PROVISIONS (amount in €'000)
31/12/2016
Amount at the beginning of the financial
year
Allocations
Reversals
Amount at the end of the
financial year
Provisions for labour disputes Provisions for charges
62 11
20
62 31
Total provisions for risks and charges 73 20 0 93 Litigation and liabilities
The Company may be involved in legal, administrative or regulatory proceedings in the normal course of its business. A provision is registered by the Company where there is sufficient probability that such disputes will cause costs to be borne by the Company.
Labour disputes
The amounts provisioned are assessed on a case-by-case basis based on the estimated risks incurred by the Company on the basis of requests, legal obligations and lawyers' positions.
Note 15: Suppliers and other current liabilities
15.1. Trade payables
There was no discount rate applied on trade payables, as the amounts did not represent periods over one year at the end of each financial year concerned.
TRADE PAYABLES (amounts in €'000)
31/12/2017
31/12/2016
Trade payables Uninvoiced payables
5,834 888
3,571 630
Total trade payables 6,722 4,201
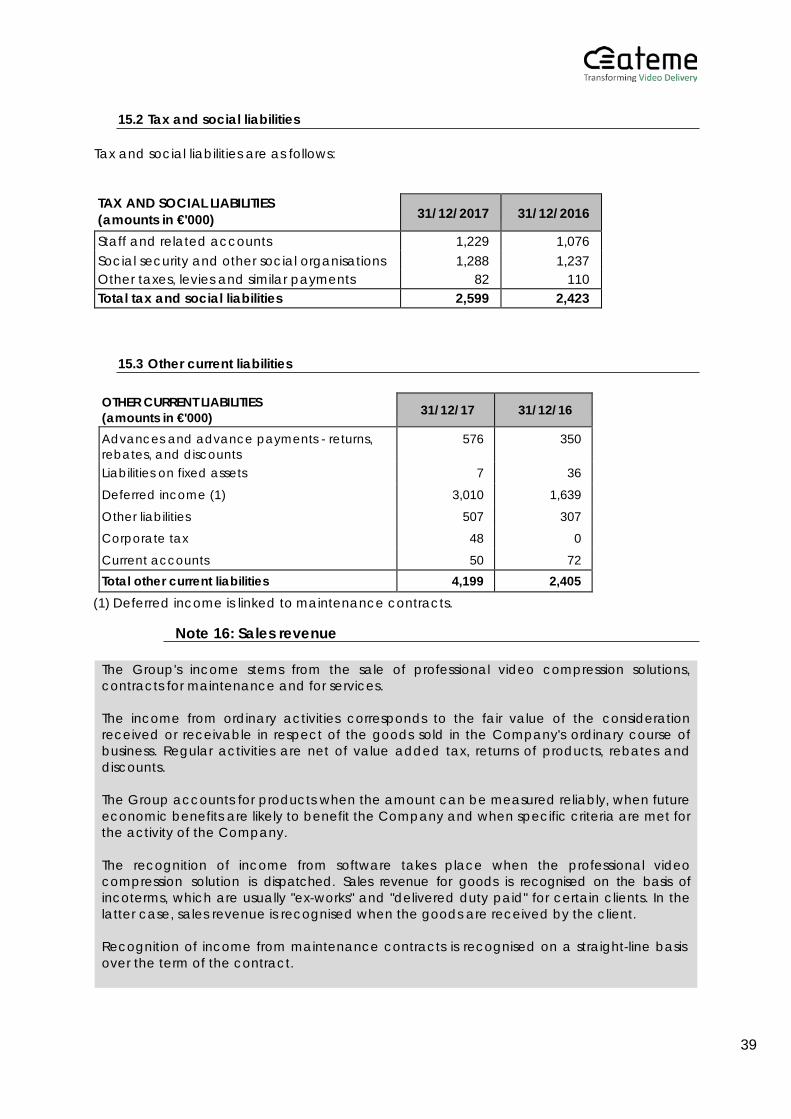
39
15.2 Tax and social liabilities
Tax and social liabilities are as follows:
TAX AND SOCIAL LIABILITIES (amounts in €'000) 31/12/2017 31/12/2016
Staff and related accounts 1,229 1,076 Social security and other social organisations 1,288 1,237 Other taxes, levies and similar payments 82 110 Total tax and social liabilities 2,599 2,423
15.3 Other current liabilities
OTHER CURRENT LIABILITIES (amounts in €'000) 31/12/17 31/12/16
Advances and advance payments - returns, rebates, and discounts
576 350
Liabilities on fixed assets 7 36
Deferred income (1) 3,010 1,639
Other liabilities 507 307
Corporate tax 48 0
Current accounts 50 72 Total other current liabilities 4,199 2,405
(1) Deferred income is linked to maintenance contracts.
Note 16: Sales revenue
The Group's income stems from the sale of professional video compression solutions, contracts for maintenance and for services.
The income from ordinary activities corresponds to the fair value of the consideration received or receivable in respect of the goods sold in the Company's ordinary course of business. Regular activities are net of value added tax, returns of products, rebates and discounts.
The Group accounts for products when the amount can be measured reliably, when future economic benefits are likely to benefit the Company and when specific criteria are met for the activity of the Company.
The recognition of income from software takes place when the professional video compression solution is dispatched. Sales revenue for goods is recognised on the basis of incoterms, which are usually "ex-works" and "delivered duty paid" for certain clients. In the latter case, sales revenue is recognised when the goods are received by the client.
Recognition of income from maintenance contracts is recognised on a straight-line basis over the term of the contract.
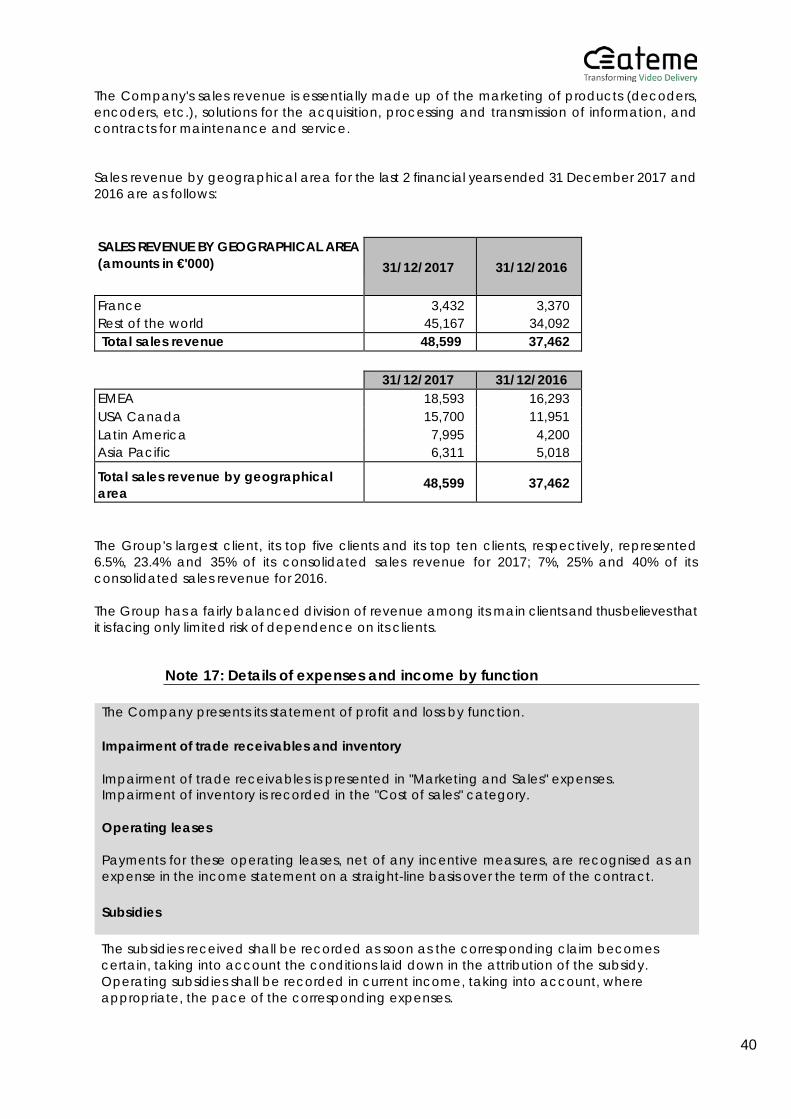
40
The Company's sales revenue is essentially made up of the marketing of products (decoders, encoders, etc.), solutions for the acquisition, processing and transmission of information, and contracts for maintenance and service.
Sales revenue by geographical area for the last 2 financial years ended 31 December 2017 and 2016 are as follows:
SALES REVENUE BY GEOGRAPHICAL AREA (amounts in €'000)
31/12/2017
31/12/2016
France Rest of the world
3,432 45,167
3,370 34,092
Total sales revenue 48,599 37,462
31/12/2017 31/12/2016 EMEA 18,593 16,293 USA Canada 15,700 11,951 Latin America 7,995 4,200 Asia Pacific 6,311 5,018
Total sales revenue by geographical area
48,599 37,462
The Group's largest client, its top five clients and its top ten clients, respectively, represented 6.5%, 23.4% and 35% of its consolidated sales revenue for 2017; 7%, 25% and 40% of its consolidated sales revenue for 2016.
The Group has a fairly balanced division of revenue among its main clients and thus believes that it is facing only limited risk of dependence on its clients.
Note 17: Details of expenses and income by function
The subsidies received shall be recorded as soon as the corresponding claim becomes certain, taking into account the conditions laid down in the attribution of the subsidy. Operating subsidies shall be recorded in current income, taking into account, where appropriate, the pace of the corresponding expenses.
The Company presents its statement of profit and loss by function. Impairment of trade receivables and inventory
Impairment of trade receivables is presented in "Marketing and Sales" expenses. Impairment of inventory is recorded in the "Cost of sales" category.
Operating leases
Payments for these operating leases, net of any incentive measures, are recognised as an expense in the income statement on a straight-line basis over the term of the contract.
Subsidies
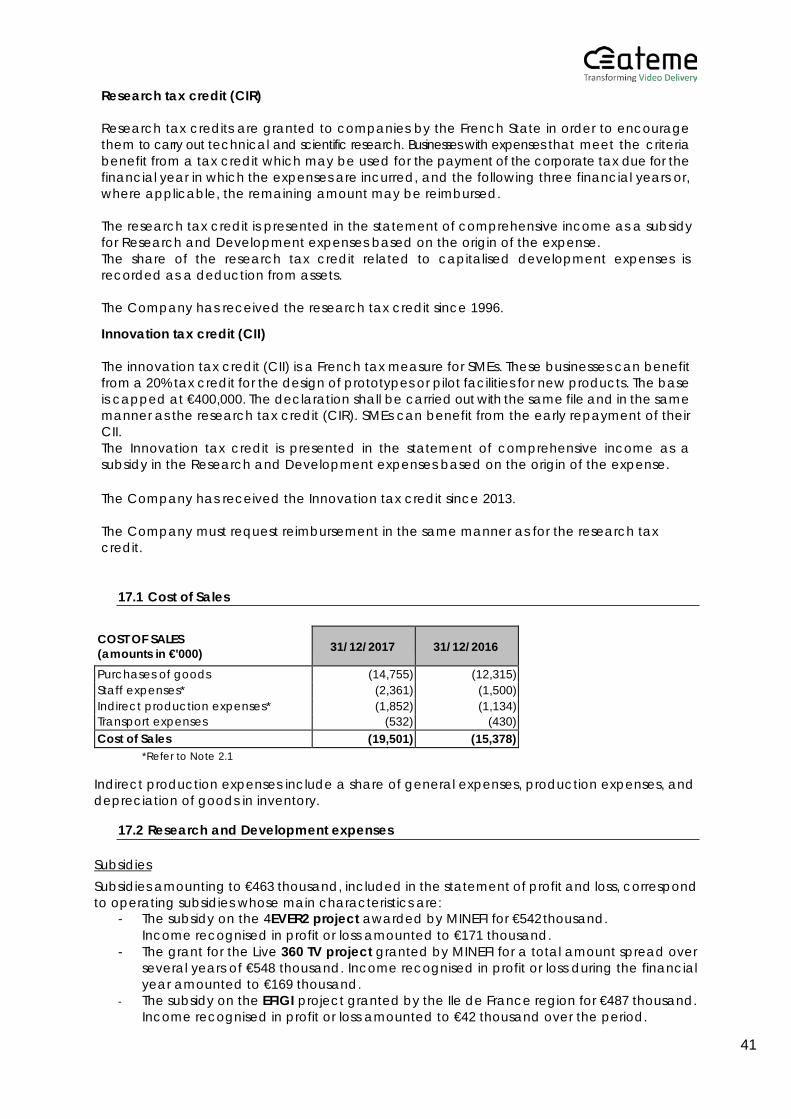
41
Research tax credit (CIR)
Research tax credits are granted to companies by the French State in order to encourage them to carry out technical and scientific research. Businesses with expenses that meet the criteria benefit from a tax credit which may be used for the payment of the corporate tax due for the financial year in which the expenses are incurred, and the following three financial years or, where applicable, the remaining amount may be reimbursed.
The research tax credit is presented in the statement of comprehensive income as a subsidy for Research and Development expenses based on the origin of the expense. The share of the research tax credit related to capitalised development expenses is recorded as a deduction from assets.
The Company has received the research tax credit since 1996.
Innovation tax credit (CII)
The innovation tax credit (CII) is a French tax measure for SMEs. These businesses can benefit from a 20% tax credit for the design of prototypes or pilot facilities for new products. The base is capped at €400,000. The declaration shall be carried out with the same file and in the same manner as the research tax credit (CIR). SMEs can benefit from the early repayment of their CII. The Innovation tax credit is presented in the statement of comprehensive income as a subsidy in the Research and Development expenses based on the origin of the expense.
The Company has received the Innovation tax credit since 2013.
The Company must request reimbursement in the same manner as for the research tax credit.
17.1 Cost of Sales
COST OF SALES (amounts in €'000) 31/12/2017 31/12/2016
Purchases of goods (14,755) (12,315) Staff expenses* (2,361) (1,500) Indirect production expenses* (1,852) (1,134) Transport expenses (532) (430) Cost of Sales (19,501) (15,378)
*Refer to Note 2.1
Indirect production expenses include a share of general expenses, production expenses, and depreciation of goods in inventory.
17.2 Research and Development expenses
Subsidies Subsidies amounting to €463 thousand, included in the statement of profit and loss, correspond to operating subsidies whose main characteristics are:
- The subsidy on the 4EVER2 project awarded by MINEFI for €542 thousand. Income recognised in profit or loss amounted to €171 thousand.
- The grant for the Live 360 TV project granted by MINEFI for a total amount spread over several years of €548 thousand. Income recognised in profit or loss during the financial year amounted to €169 thousand.
- The subsidy on the EFIGI project granted by the Ile de France region for €487 thousand. Income recognised in profit or loss amounted to €42 thousand over the period.
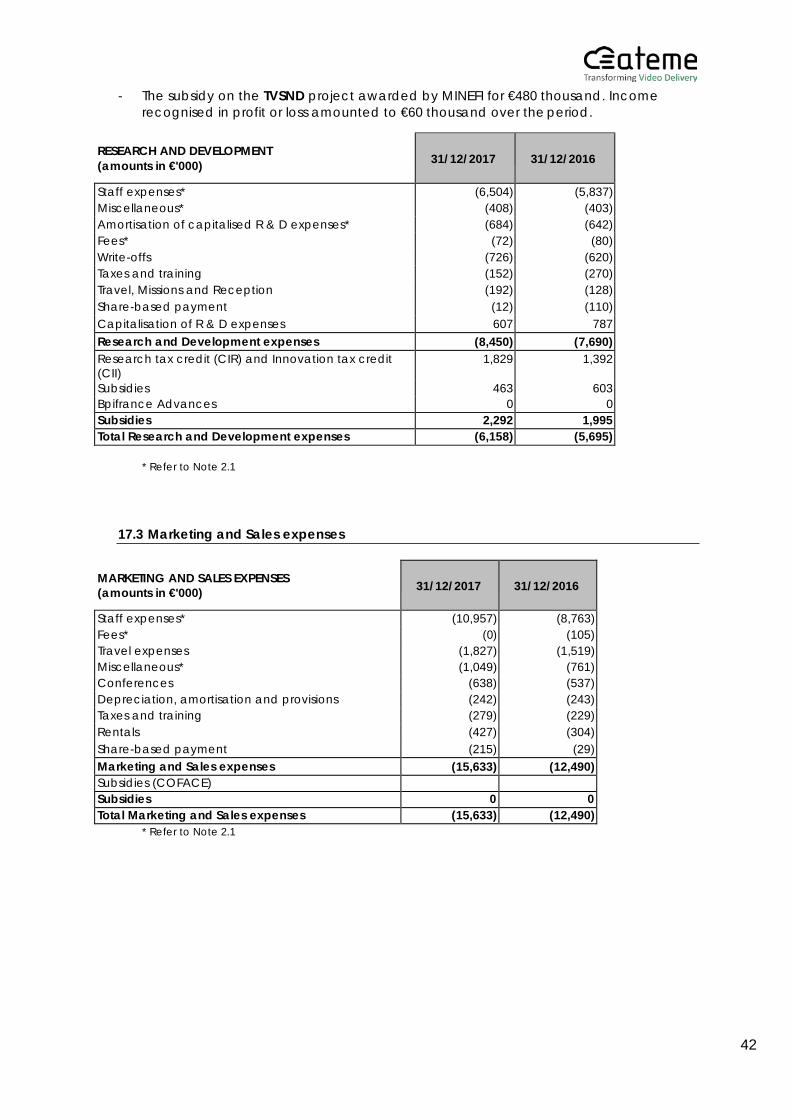
42
- The subsidy on the TVSND project awarded by MINEFI for €480 thousand. Income recognised in profit or loss amounted to €60 thousand over the period.
RESEARCH AND DEVELOPMENT (amounts in €'000)
31/12/2017
31/12/2016
Staff expenses* (6,504) (5,837) Miscellaneous* (408) (403) Amortisation of capitalised R & D expenses* (684) (642) Fees* (72) (80) Write-offs (726) (620) Taxes and training (152) (270) Travel, Missions and Reception (192) (128) Share-based payment (12) (110) Capitalisation of R & D expenses 607 787 Research and Development expenses (8,450) (7,690) Research tax credit (CIR) and Innovation tax credit (CII)
1,829 1,392
Subsidies 463 603 Bpifrance Advances 0 0 Subsidies 2,292 1,995 Total Research and Development expenses (6,158) (5,695)
* Refer to Note 2.1
17.3 Marketing and Sales expenses
MARKETING AND SALES EXPENSES (amounts in €'000)
31/12/2017
31/12/2016
Staff expenses* (10,957) (8,763) Fees* (0) (105) Travel expenses (1,827) (1,519) Miscellaneous* (1,049) (761) Conferences (638) (537) Depreciation, amortisation and provisions (242) (243) Taxes and training (279) (229) Rentals (427) (304) Share-based payment (215) (29) Marketing and Sales expenses (15,633) (12,490) Subsidies (COFACE) Subsidies 0 0 Total Marketing and Sales expenses (15,633) (12,490)
* Refer to Note 2.1
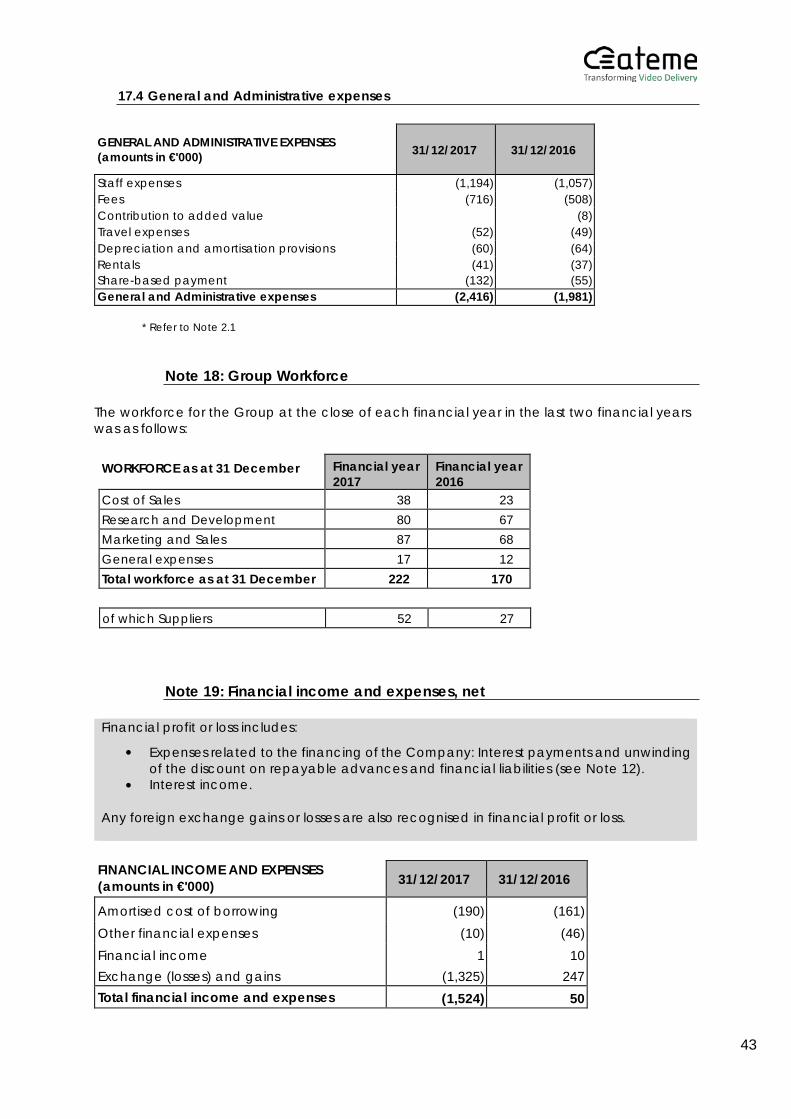
43
17.4 General and Administrative expenses
GENERAL AND ADMINISTRATIVE EXPENSES (amounts in €'000)
31/12/2017
31/12/2016
Staff expenses (1,194) (1,057) Fees (716) (508) Contribution to added value (8) Travel expenses (52) (49) Depreciation and amortisation provisions (60) (64) Rentals (41) (37) Share-based payment (132) (55) General and Administrative expenses (2,416) (1,981)
* Refer to Note 2.1
Note 18: Group Workforce
The workforce for the Group at the close of each financial year in the last two financial years was as follows:
WORKFORCE as at 31 December Financial year
2017 Financial year 2016
Cost of Sales 38 23 Research and Development 80 67 Marketing and Sales 87 68 General expenses 17 12 Total workforce as at 31 December 222 170
of which Suppliers 52 27
Note 19: Financial income and expenses, net
FINANCIAL INCOME AND EXPENSES (amounts in €'000) 31/12/2017 31/12/2016
Amortised cost of borrowing (190) (161) Other financial expenses (10) (46) Financial income 1 10 Exchange (losses) and gains (1,325) 247 Total financial income and expenses (1,524) 50
Any foreign exchange gains or losses are also recognised in financial profit or loss.
Expenses related to the financing of the Company: Interest payments and unwinding of the discount on repayable advances and financial liabilities (see Note 12). Interest income.
Financial profit or loss includes:
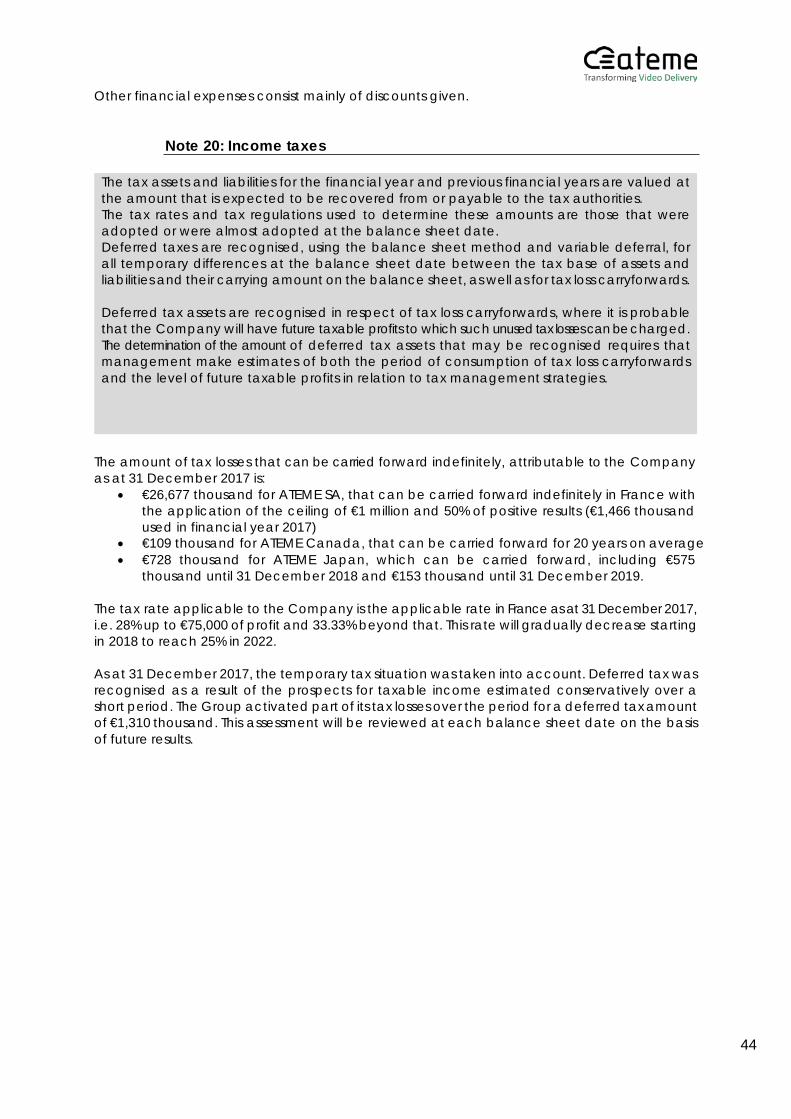
44
Other financial expenses consist mainly of discounts given.
Note 20: Income taxes
The amount of tax losses that can be carried forward indefinitely, attributable to the Company as at 31 December 2017 is:
• €26,677 thousand for ATEME SA, that can be carried forward indefinitely in France with the application of the ceiling of €1 million and 50% of positive results (€1,466 thousand used in financial year 2017)
• €109 thousand for ATEME Canada, that can be carried forward for 20 years on average • €728 thousand for ATEME Japan, which can be carried forward, including €575
thousand until 31 December 2018 and €153 thousand until 31 December 2019.
The tax rate applicable to the Company is the applicable rate in France as at 31 December 2017, i.e. 28% up to €75,000 of profit and 33.33% beyond that. This rate will gradually decrease starting in 2018 to reach 25% in 2022.
As at 31 December 2017, the temporary tax situation was taken into account. Deferred tax was recognised as a result of the prospects for taxable income estimated conservatively over a short period. The Group activated part of its tax losses over the period for a deferred tax amount of €1,310 thousand. This assessment will be reviewed at each balance sheet date on the basis of future results.
The tax assets and liabilities for the financial year and previous financial years are valued at the amount that is expected to be recovered from or payable to the tax authorities. The tax rates and tax regulations used to determine these amounts are those that were adopted or were almost adopted at the balance sheet date. Deferred taxes are recognised, using the balance sheet method and variable deferral, for all temporary differences at the balance sheet date between the tax base of assets and liabilities and their carrying amount on the balance sheet, as well as for tax loss carryforwards.
Deferred tax assets are recognised in respect of tax loss carryforwards, where it is probable that the Company will have future taxable profits to which such unused tax losses can be charged. The determination of the amount of deferred tax assets that may be recognised requires that management make estimates of both the period of consumption of tax loss carryforwards and the level of future taxable profits in relation to tax management strategies.
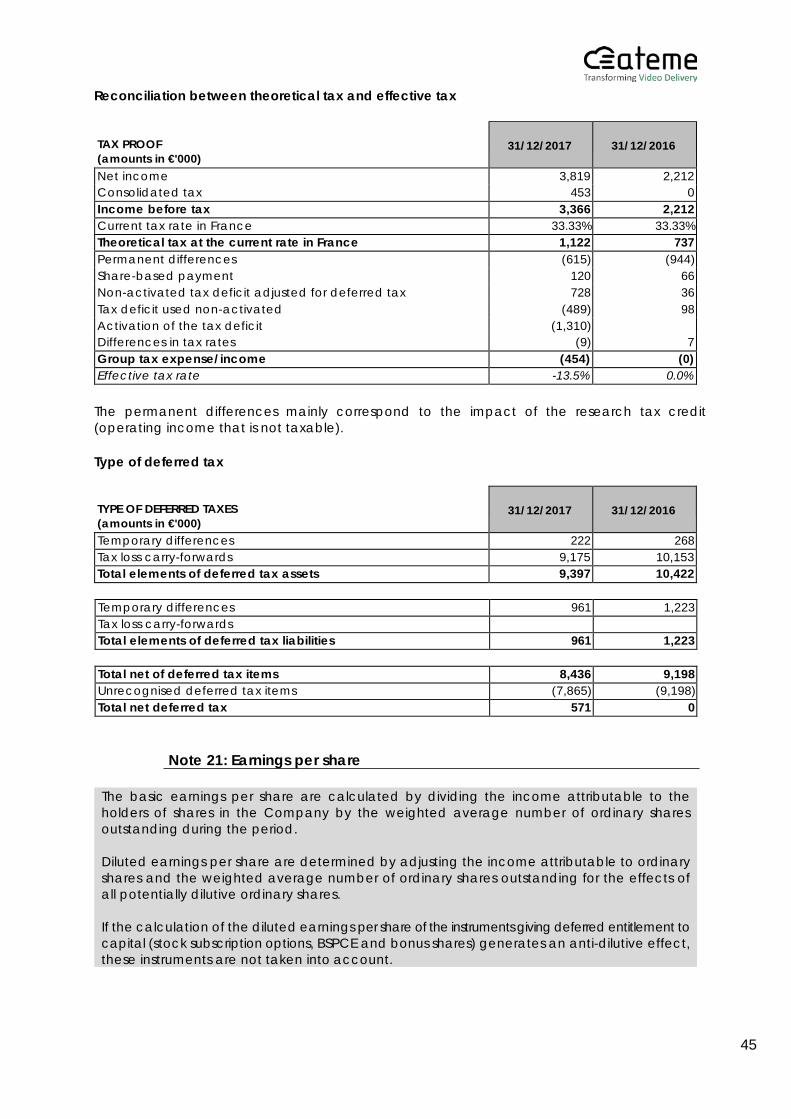
45
Reconciliation between theoretical tax and effective tax TAX PROOF (amounts in €'000)
31/12/2017
31/12/2016
Net income 3,819 2,212 Consolidated tax 453 0 Income before tax 3,366 2,212 Current tax rate in France 33.33% 33.33% Theoretical tax at the current rate in France 1,122 737 Permanent differences (615) (944) Share-based payment 120 66 Non-activated tax deficit adjusted for deferred tax 728 36 Tax deficit used non-activated (489) 98 Activation of the tax deficit (1,310) Differences in tax rates (9) 7 Group tax expense/income (454) (0) Effective tax rate -13.5% 0.0%
The permanent differences mainly correspond to the impact of the research tax credit (operating income that is not taxable).
Type of deferred tax
TYPE OF DEFERRED TAXES (amounts in €'000)
31/12/2017
31/12/2016
Temporary differences 222 268 Tax loss carry-forwards 9,175 10,153 Total elements of deferred tax assets 9,397 10,422
Temporary differences 961 1,223 Tax loss carry-forwards
Total elements of deferred tax liabilities 961 1,223
Total net of deferred tax items 8,436 9,198 Unrecognised deferred tax items (7,865) (9,198) Total net deferred tax 571 0
Note 21: Earnings per share
The basic earnings per share are calculated by dividing the income attributable to the holders of shares in the Company by the weighted average number of ordinary shares outstanding during the period.
Diluted earnings per share are determined by adjusting the income attributable to ordinary shares and the weighted average number of ordinary shares outstanding for the effects of all potentially dilutive ordinary shares.
If the calculation of the diluted earnings per share of the instruments giving deferred entitlement to capital (stock subscription options, BSPCE and bonus shares) generates an anti-dilutive effect, these instruments are not taken into account.
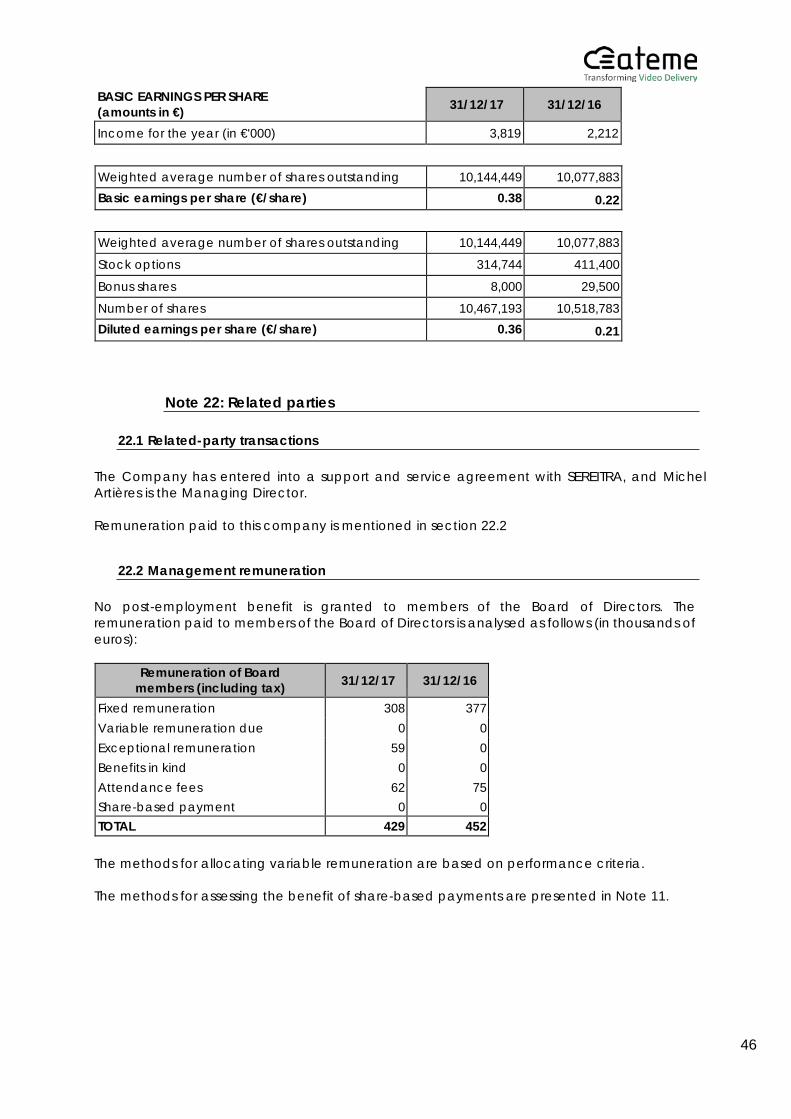
46
BASIC EARNINGS PER SHARE (amounts in €) 31/12/17 31/12/16
Income for the year (in €'000) 3,819 2,212
Weighted average number of shares outstanding 10,144,449 10,077,883 Basic earnings per share (€/share) 0.38 0.22
Weighted average number of shares outstanding 10,144,449 10,077,883
Stock options 314,744 411,400
Bonus shares 8,000 29,500
Number of shares 10,467,193 10,518,783 Diluted earnings per share (€/share) 0.36 0.21
Note 22: Related parties
22.1 Related-party transactions
The Company has entered into a support and service agreement with SEREITRA, and Michel Artières is the Managing Director.
Remuneration paid to this company is mentioned in section 22.2
22.2 Management remuneration
No post-employment benefit is granted to members of the Board of Directors. The remuneration paid to members of the Board of Directors is analysed as follows (in thousands of euros):
Remuneration of Board
members (including tax) 31/12/17 31/12/16
Fixed remuneration 308 377 Variable remuneration due 0 0 Exceptional remuneration 59 0 Benefits in kind 0 0 Attendance fees 62 75 Share-based payment 0 0 TOTAL 429 452
The methods for allocating variable remuneration are based on performance criteria.
The methods for assessing the benefit of share-based payments are presented in Note 11.
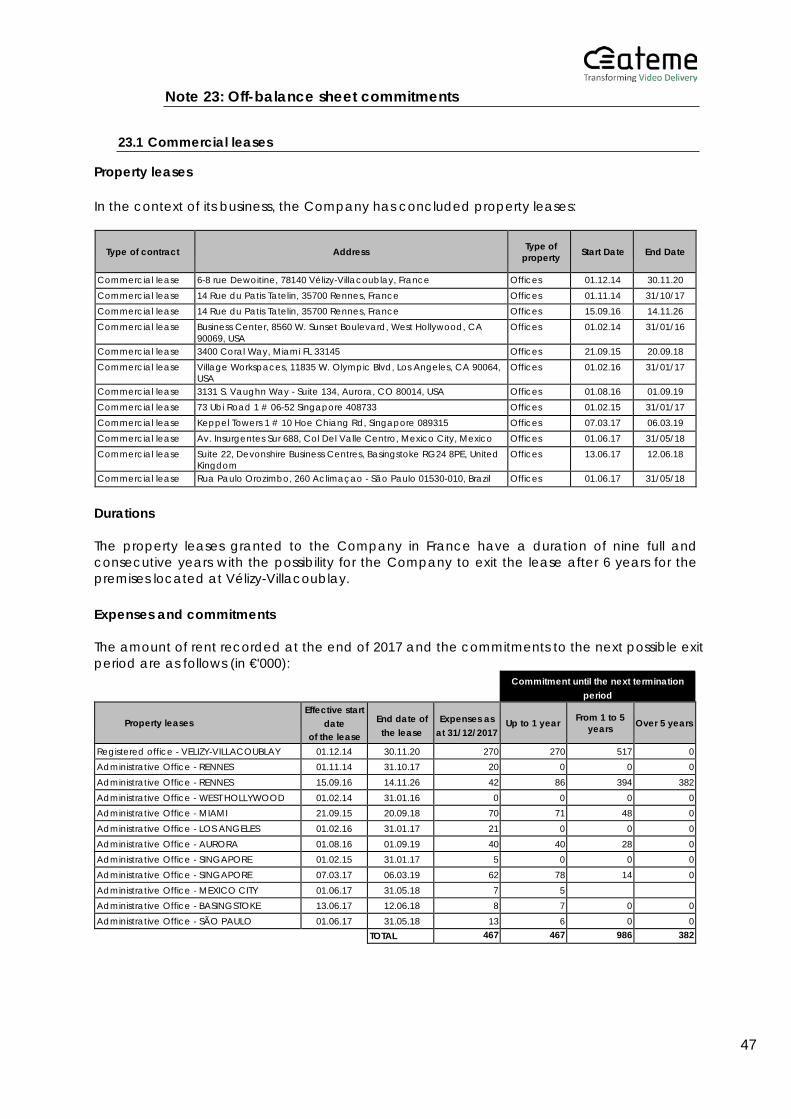
47
Note 23: Off-balance sheet commitments
23.1 Commercial leases
Property leases
In the context of its business, the Company has concluded property leases:
Type of contract
Address Type of property
Start Date
End Date
Commercial lease 6-8 rue Dewoitine, 78140 Vélizy-Villacoublay, France Offices 01.12.14 30.11.20 Commercial lease 14 Rue du Patis Tatelin, 35700 Rennes, France Offices 01.11.14 31/10/17 Commercial lease 14 Rue du Patis Tatelin, 35700 Rennes, France Offices 15.09.16 14.11.26 Commercial lease Business Center, 8560 W. Sunset Boulevard, West Hollywood, CA
90069, USA Offices 01.02.14 31/01/16
Commercial lease 3400 Coral Way, Miami FL 33145 Offices 21.09.15 20.09.18 Commercial lease Village Workspaces, 11835 W. Olympic Blvd, Los Angeles, CA 90064,
USA Offices 01.02.16 31/01/17
Commercial lease 3131 S. Vaughn Way - Suite 134, Aurora, CO 80014, USA Offices 01.08.16 01.09.19 Commercial lease 73 Ubi Road 1 # 06-52 Singapore 408733 Offices 01.02.15 31/01/17 Commercial lease Keppel Towers 1 # 10 Hoe Chiang Rd, Singapore 089315 Offices 07.03.17 06.03.19 Commercial lease Av. Insurgentes Sur 688, Col Del Valle Centro, Mexico City, Mexico Offices 01.06.17 31/05/18 Commercial lease Suite 22, Devonshire Business Centres, Basingstoke RG24 8PE, United
Kingdom Offices 13.06.17 12.06.18
Commercial lease Rua Paulo Orozimbo, 260 Aclimaçao - São Paulo 01530-010, Brazil Offices 01.06.17 31/05/18
Durations
The property leases granted to the Company in France have a duration of nine full and consecutive years with the possibility for the Company to exit the lease after 6 years for the premises located at Vélizy-Villacoublay.
Expenses and commitments
The amount of rent recorded at the end of 2017 and the commitments to the next possible exit period are as follows (in €'000): Commitment until the next termination
period
Property leases Effective start
date of the lease
End date of the lease
Expenses as at 31/12/2017
Up to 1 year From 1 to 5 years Over 5 years
Registered office - VELIZY-VILLACOUBLAY 01.12.14 30.11.20 270 270 517 0 Administrative Office - RENNES 01.11.14 31.10.17 20 0 0 0 Administrative Office - RENNES 15.09.16 14.11.26 42 86 394 382 Administrative Office - WEST HOLLYWOOD 01.02.14 31.01.16 0 0 0 0 Administrative Office - MIAMI 21.09.15 20.09.18 70 71 48 0 Administrative Office - LOS ANGELES 01.02.16 31.01.17 21 0 0 0 Administrative Office - AURORA 01.08.16 01.09.19 40 40 28 0 Administrative Office - SINGAPORE 01.02.15 31.01.17 5 0 0 0 Administrative Office - SINGAPORE 07.03.17 06.03.19 62 78 14 0 Administrative Office - MEXICO CITY 01.06.17 31.05.18 7 5
Administrative Office - BASINGSTOKE 13.06.17 12.06.18 8 7 0 0 Administrative Office - SÃO PAULO 01.06.17 31.05.18 13 6 0 0 TOTAL 467 467 986 382
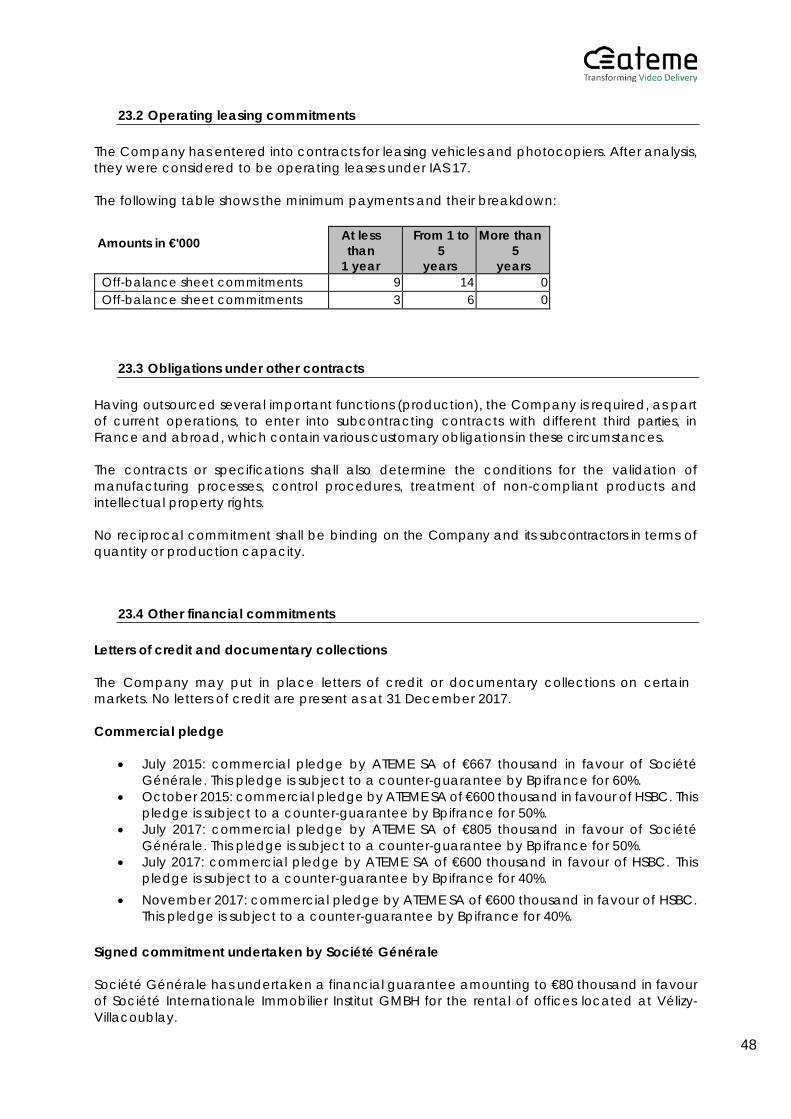
48
23.2 Operating leasing commitments
The Company has entered into contracts for leasing vehicles and photocopiers. After analysis, they were considered to be operating leases under IAS 17.
The following table shows the minimum payments and their breakdown:
Amounts in €'000 At less than
1 year
From 1 to 5
years
More than 5
years Off-balance sheet commitments 9 14 0 Off-balance sheet commitments 3 6 0
23.3 Obligations under other contracts
Having outsourced several important functions (production), the Company is required, as part of current operations, to enter into subcontracting contracts with different third parties, in France and abroad, which contain various customary obligations in these circumstances.
The contracts or specifications shall also determine the conditions for the validation of manufacturing processes, control procedures, treatment of non-compliant products and intellectual property rights.
No reciprocal commitment shall be binding on the Company and its subcontractors in terms of quantity or production capacity.
23.4 Other financial commitments
Letters of credit and documentary collections
The Company may put in place letters of credit or documentary collections on certain markets. No letters of credit are present as at 31 December 2017.
Commercial pledge
• July 2015: commercial pledge by ATEME SA of €667 thousand in favour of Société
Générale. This pledge is subject to a counter-guarantee by Bpifrance for 60%. • October 2015: commercial pledge by ATEME SA of €600 thousand in favour of HSBC. This
pledge is subject to a counter-guarantee by Bpifrance for 50%. • July 2017: commercial pledge by ATEME SA of €805 thousand in favour of Société
Générale. This pledge is subject to a counter-guarantee by Bpifrance for 50%. • July 2017: commercial pledge by ATEME SA of €600 thousand in favour of HSBC. This
pledge is subject to a counter-guarantee by Bpifrance for 40%. • November 2017: commercial pledge by ATEME SA of €600 thousand in favour of HSBC.
This pledge is subject to a counter-guarantee by Bpifrance for 40%.
Signed commitment undertaken by Société Générale
Société Générale has undertaken a financial guarantee amounting to €80 thousand in favour of Société Internationale Immobilier Institut GMBH for the rental of offices located at Vélizy-Villacoublay.
49
Note 24: Financial risk management and assessment
ATEME may be exposed to different types of financial risks: market risk, credit risk and liquidity risk. Where applicable, ATEME implements simple and proportionate means to minimise the potential adverse effects of these risks on financial performance. ATEME's policy is not to underwrite financial instruments for speculation. ATEME does not use financial derivative instruments.
Interest rate risk
ATEME has no significant exposure to interest rate risk, insofar as:
• marketable securities consist of short-term money market funds, • cash includes term deposits, • no variable rate debt has been taken on.
Credit risk
Credit risk is associated with deposits (bank accounts and term deposits) with banks and financial institutions. ATEME relies on leading financial institutions for cash investments and therefore its cash does not bear a significant credit risk.
It has established policies to ensure that its clients have an appropriate credit risk history.
Currency risk
The main risks associated with foreign exchange impacts of sales and purchases carried out i n foreign currency mainly concern sales of goods and expenses in US dollars and the financing of subsidiaries in their local currencies.
The Company has not, at its development stage, made a hedging provision to protect its business against fluctuations in exchange rates. On the other hand, the Company cannot exclude that a significant increase in its business could force it to have greater exposure to currency risk. The Company will then consider using a suitable hedging policy to cover these risks.
Equity risk
The Company does not hold investments or marketable securities on a regulated market.
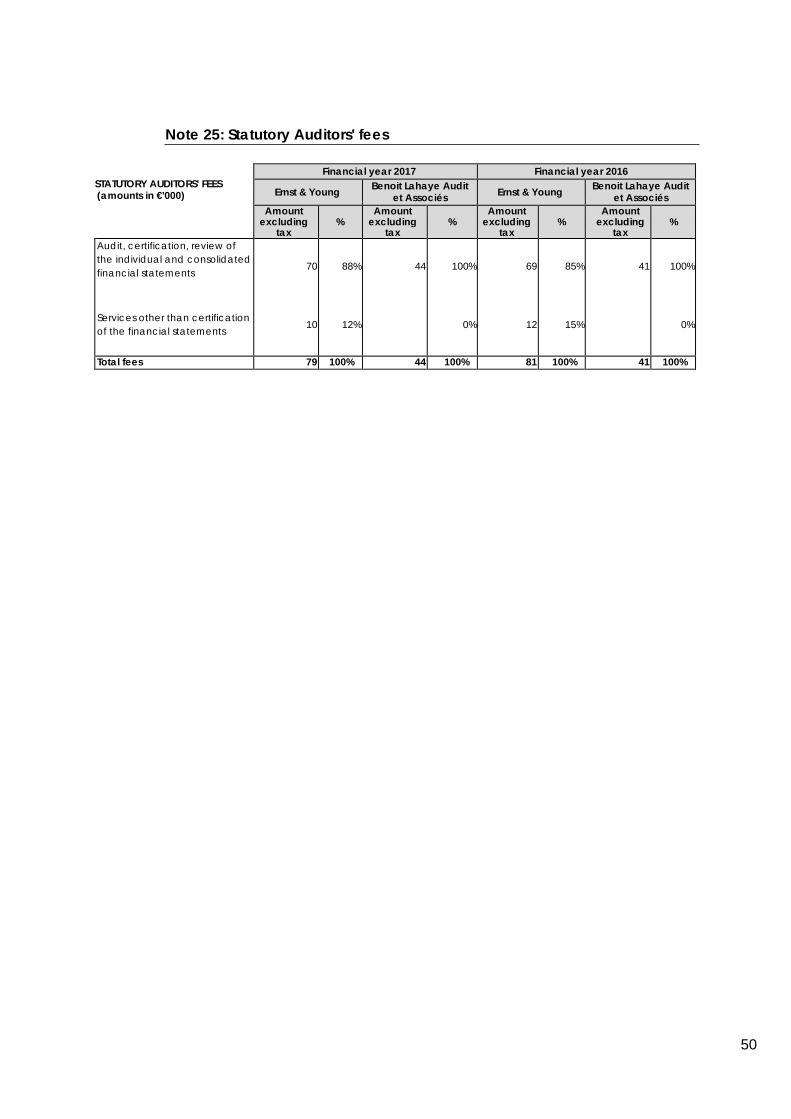
50
Note 25: Statutory Auditors' fees
STATUTORY AUDITORS' FEES (amounts in €'000)
Financial year 2017 Financial year 2016
Ernst & Young Benoit Lahaye Audit et Associés Ernst & Young Benoit Lahaye Audit
et Associés Amount
excluding tax
% Amount
excluding tax
% Amount
excluding tax
% Amount
excluding tax
%
Audit, certification, review of the individual and consolidated financial statements
70
88%
44
100%
69
85%
41
100%
Services other than certification of the financial statements
10
12%
0%
12
15%
0%
Total fees 79 100% 44 100% 81 100% 41 100%