CONSOLIDATED FINANCIAL STATEMENTS - Oryx PetroleumOryx Petroleum Corporation Limited Opinion We have...
40
CONSOLIDATED FINANCIAL STATEMENTS FOR THE YEARS ENDED DECEMBER 31, 2018 AND 2017
Transcript of CONSOLIDATED FINANCIAL STATEMENTS - Oryx PetroleumOryx Petroleum Corporation Limited Opinion We have...

CONSOLIDATED FINANCIAL STATEMENTS
FOR THE YEARS ENDED DECEMBER 31, 2018 AND 2017

ORYX PETROLEUM CORPORATION LIMITED Consolidated Financial Statements
For the years ended December 31, 2018 and 2017
1
Table of contents
Page
Independent auditor’s report 2
Consolidated Statements of Profit / (Loss) and Comprehensive Income / (Loss) 5
Consolidated Statements of Financial Position 6
Consolidated Statements of Changes in Equity 7
Consolidated Statements of Cash Flows 8
Notes to the Consolidated Financial Statements 9
ORYX PETROLEUM CORPORATION LIMITED Consolidated Financial Statements
For the years ended December 31, 2018 and 2017
2
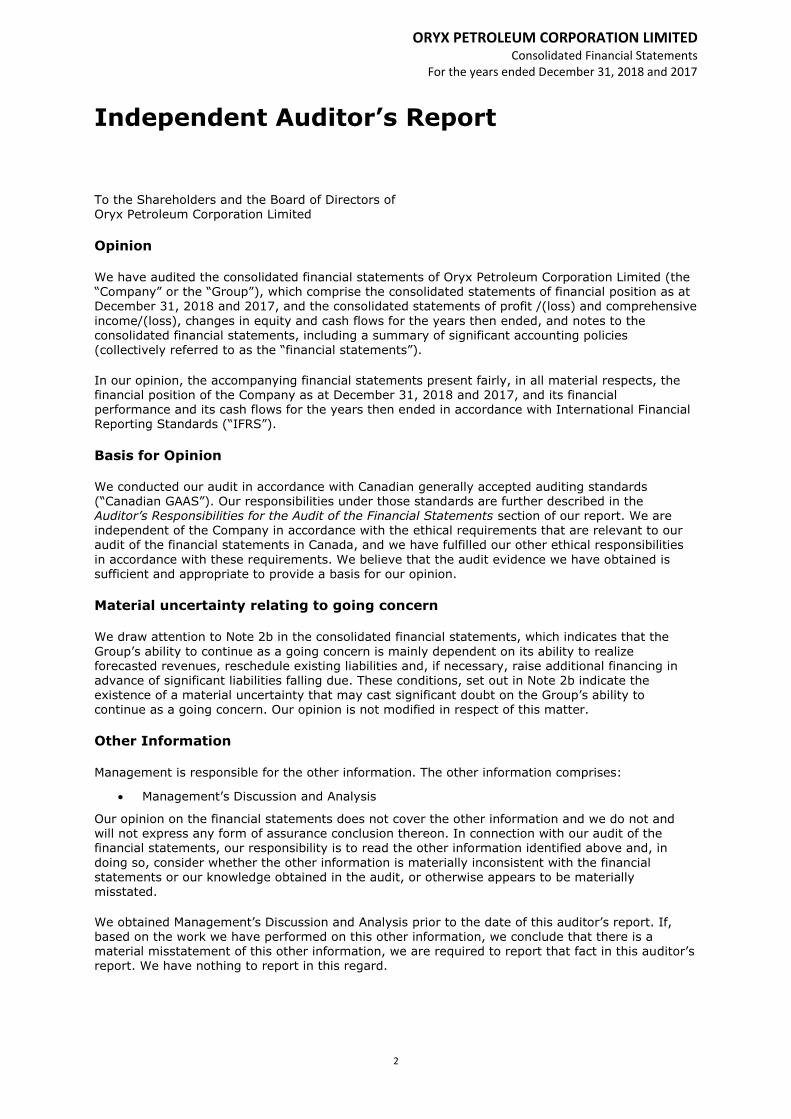
Independent Auditor’s Report
To the Shareholders and the Board of Directors of Oryx Petroleum Corporation Limited
Opinion
We have audited the consolidated financial statements of Oryx Petroleum Corporation Limited (the “Company” or the “Group”), which comprise the consolidated statements of financial position as at December 31, 2018 and 2017, and the consolidated statements of profit /(loss) and comprehensive
income/(loss), changes in equity and cash flows for the years then ended, and notes to the consolidated financial statements, including a summary of significant accounting policies
(collectively referred to as the “financial statements”).
In our opinion, the accompanying financial statements present fairly, in all material respects, the financial position of the Company as at December 31, 2018 and 2017, and its financial performance and its cash flows for the years then ended in accordance with International Financial Reporting Standards (“IFRS”).
Basis for Opinion
We conducted our audit in accordance with Canadian generally accepted auditing standards (“Canadian GAAS”). Our responsibilities under those standards are further described in the Auditor’s Responsibilities for the Audit of the Financial Statements section of our report. We are independent of the Company in accordance with the ethical requirements that are relevant to our audit of the financial statements in Canada, and we have fulfilled our other ethical responsibilities
in accordance with these requirements. We believe that the audit evidence we have obtained is sufficient and appropriate to provide a basis for our opinion.
Material uncertainty relating to going concern
We draw attention to Note 2b in the consolidated financial statements, which indicates that the
Group’s ability to continue as a going concern is mainly dependent on its ability to realize forecasted revenues, reschedule existing liabilities and, if necessary, raise additional financing in advance of significant liabilities falling due. These conditions, set out in Note 2b indicate the existence of a material uncertainty that may cast significant doubt on the Group’s ability to continue as a going concern. Our opinion is not modified in respect of this matter.
Other Information
Management is responsible for the other information. The other information comprises:
Management’s Discussion and Analysis
Our opinion on the financial statements does not cover the other information and we do not and will not express any form of assurance conclusion thereon. In connection with our audit of the financial statements, our responsibility is to read the other information identified above and, in
doing so, consider whether the other information is materially inconsistent with the financial statements or our knowledge obtained in the audit, or otherwise appears to be materially misstated.
We obtained Management’s Discussion and Analysis prior to the date of this auditor’s report. If, based on the work we have performed on this other information, we conclude that there is a material misstatement of this other information, we are required to report that fact in this auditor’s report. We have nothing to report in this regard.

ORYX PETROLEUM CORPORATION LIMITED Consolidated Financial Statements
For the years ended December 31, 2018 and 2017
3
Responsibilities of Management and Those Charged with Governance for the
Financial Statements
Management is responsible for the preparation and fair presentation of the financial statements in
accordance with IFRS, and for such internal control as management determines is necessary to enable the preparation of financial statements that are free from material misstatement, whether due to fraud or error.
In preparing the financial statements, management is responsible for assessing the Company’s ability to continue as a going concern, disclosing, as applicable, matters related to going concern and using the going concern basis of accounting unless management either intends to liquidate the Company or to cease operations, or has no realistic alternative but to do so.
Those charged with governance are responsible for overseeing the Company’s financial reporting
process.
Auditor’s Responsibilities for the Audit of the Financial Statements
Our objectives are to obtain reasonable assurance about whether the financial statements as a whole are free from material misstatement, whether due to fraud or error, and to issue an auditor’s report that includes our opinion. Reasonable assurance is a high level of assurance, but is not a
guarantee that an audit conducted in accordance with Canadian GAAS will always detect a material misstatement when it exists. Misstatements can arise from fraud or error and are considered material if, individually or in the aggregate, they could reasonably be expected to influence the economic decisions of users taken on the basis of these financial statements.
As part of an audit in accordance with Canadian GAAS, we exercise professional judgment and maintain professional skepticism throughout the audit. We also:
Identify and assess the risks of material misstatement of the financial statements, whether
due to fraud or error, design and perform audit procedures responsive to those risks, and
obtain audit evidence that is sufficient and appropriate to provide a basis for our opinion.
The risk of not detecting a material misstatement resulting from fraud is higher than for
one resulting from error, as fraud may involve collusion, forgery, intentional omissions,
misrepresentations, or the override of internal control.
Obtain an understanding of internal control relevant to the audit in order to design audit
procedures that are appropriate in the circumstances, but not for the purpose of expressing
an opinion on the effectiveness of the Company’s internal control.
Evaluate the appropriateness of accounting policies used and the reasonableness of
accounting estimates and related disclosures made by management.
Conclude on the appropriateness of management’s use of the going concern basis of
accounting and, based on the audit evidence obtained, whether a material uncertainty
exists related to events or conditions that may cast significant doubt on the Company’s
ability to continue as a going concern. If we conclude that a material uncertainty exists, we
are required to draw attention in our auditor’s report to the related disclosures in the
financial statements or, if such disclosures are inadequate, to modify our opinion. Our
conclusions are based on the audit evidence obtained up to the date of our auditor’s report.
However, future events or conditions may cause the Company to cease to continue as a
going concern.
Evaluate the overall presentation, structure and content of the financial statements,
including the disclosures, and whether the financial statements represent the underlying
transactions and events in a manner that achieves fair presentation.

ORYX PETROLEUM CORPORATION LIMITED Consolidated Financial Statements
For the years ended December 31, 2018 and 2017
4
Obtain sufficient appropriate audit evidence regarding the financial information of the
entities or business activities within the Company to express an opinion on the financial
statements. We are responsible for the direction, supervision and performance of the group
audit. We remain solely responsible for our audit opinion.
We communicate with those charged with governance regarding, among other matters, the planned scope and timing of the audit and significant audit findings, including any significant deficiencies in internal control that we identify during our audit.
We also provide those charged with governance with a statement that we have complied with relevant ethical requirements regarding independence, and to communicate with them all relationships and other matters that may reasonably be thought to bear on our independence, and
where applicable, related safeguards.
The engagement partner on the audit resulting in this independent auditor’s report is Mark Valentin.
Deloitte SA
Mark Valentin Robert Purdy
Partner Director
Geneva, Switzerland
March 13, 2019

ORYX PETROLEUM CORPORATION LIMITED Consolidated Financial Statements
For the years ended December 31, 2018 and 2017
5
Consolidated Statements of Profit / (Loss) and Comprehensive Income / (Loss) Year ended December 31
$000s Note 2018 2017
Revenue 97,642 37,368
Royalties (42,967) (16,444)
Net revenue 54,675 20,924
Operating expense (19,241) (15,487) Depreciation, depletion and amortisation 6, 7 (13,936) (5,919) Impairment reversal / (expense) 6, 7 54,109 (18,314) Pre‐license and exploration 61 (1,026) General and administration (11,923) (10,683)Other (expense) / income 24 (2,581) 7,030
Profit / (Loss) from operations 61,164 (23,475)
Finance income 142 157
Finance expense 25 (15,380) (13,721)
Foreign exchange gains 47 104
Profit / (Loss) before income tax 45,973 (36,935)
Income tax expense 23 (2,220) (2,115)
Profit / (Loss) for the year 43,753 (39,050)
Other comprehensive income / (loss), net of income tax (Items that will not be subsequently reclassified to profit or loss)
Gain/(loss) on defined benefit obligation 16 967 (134)
Comprehensive income / (loss) for the year 44,720 (39,184)
Profit / (Loss) for the year attributable to: Owners of the Company 43,753 (39,033)
Non‐controlling interest ‐ (17)
43,753 (39,050)
Comprehensive income / (loss) for the year attributable to: Owners of the Company 44,720 (39,167)
Non‐controlling interest ‐ (17)
44,720 (39,184)
Earnings / (Loss) per share (basic and diluted) 20 0.09 (0.11)

ORYX PETROLEUM CORPORATION LIMITED Consolidated Financial Statements
For the years ended December 31, 2018 and 2017
5
Consolidated Statements of Financial Position December 31 December 31
$000s Note 2018 2017
Non‐current assets
Intangible assets 6 99,875 92,207
Property, plant and equipment 7 651,579 582,622
Deferred tax assets 23 236 254
751,690 675,083
Current assets
Inventories 8 9,391 13,444
Trade and other receivables 9 23,019 8,757
Other current assets 10 1,200 942
Cash and cash equivalents 11 14,410 38,572
Assets held for disposal 12 13,266 8,000
61,286 69,715
Total assets 812,976 744,798
Current liabilities
Trade and other payables 13 69,913 42,582
69,913 42,582
Non‐current liabilities
Borrowings 14 76,624 75,854
Trade and other payables 13 37,521 54,242
Retirement benefit obligation 16 2,707 3,148
Decommissioning obligation 17 16,674 14,593
133,526 147,837
Total liabilities 203,439 190,419
Equity
Share capital 18 1,353,220 1,343,186
Reserves 21 16,927 15,879 Accumulated remeasurement of defined benefit obligation, net of income tax (4,753) (5,720)
Accumulated deficit (755,857) (799,610)
Equity attributable to owners of the Company 609,537 553,735
Non‐controlling interest ‐ 644
Total equity 609,537 554,379
Total equity and liabilities 812,976 744,798
The consolidated financial statements were approved by the Board of Directors and authorised for issue on March 13, 2019.
On behalf of the Board of Directors:
Signed Signed Jean Claude Gandur Peter Newman Director Director

ORYX PETROLEUM CORPORATION LIMITED Consolidated Financial Statements
For the years ended December 31, 2018 and 2017
6
Consolidated Statements of Changes in Equity
Attributable to equity holders of the Company
$000s Note Share capital ReservesAccumulated
deficit
Accumulated remeasurement of
defined benefit obligation ‐ gain/
(loss) Total
Non‐controlling
interest Total equity
Balance at January 1, 2017 1,279,655 14,401 (760,577) (5,586) 527,893 661 528,554
Loss for the period ‐ ‐ (39,033) ‐ (39,033) (17) (39,050) Share based payment expense 21 ‐ 2,139 ‐ ‐ 2,139 ‐ 2,139 Private subscription 18 54,100 ‐ ‐ ‐ 54,100 ‐ 54,100 Transaction costs 18 (103) ‐ ‐ ‐ (103) ‐ (103) Issue of shares for debt interest conversion 18 4,024 4,024 4,024 Shares issued to settle trade accounts payable 18 4,750 ‐ ‐ ‐ 4,750 ‐ 4,750 Shares issued for LTIP 18, 21 611 (611) ‐ ‐ ‐ ‐ ‐Shares issued for Directors’ compensation 18, 21 149 (50) ‐ ‐ 99 ‐ 99 Loss on defined benefit obligation, net of income tax 16 ‐ ‐ ‐ (134) (134) ‐ (134)
Balance at December 31, 2017 1,343,186 15,879 (799,610) (5,720) 553,735 644 554,379
Profit for the period
‐ ‐ 43,753 ‐ 43,753 ‐ 43,753
Issue of shares for debt interest conversion 18 7,983 ‐ ‐ ‐ 7,983 ‐ 7,983
Private subscription 18 1,277 ‐ ‐ ‐ 1,277 ‐ 1,277
Share based payment expense 21 ‐ 1,985 ‐ ‐ 1,985 ‐ 1,985
Shares and cash issued for LTIP 18, 21 725 (830) ‐ ‐ (105) ‐ (105)
Increase in ownership of KPAWDE(1) 21 ‐ (57) ‐ ‐ (57) (644) (701)
Shares issued for Directors’ compensation 18, 21 49 (50) ‐ ‐ (1) ‐ (1) Gain on defined benefit obligation, net of income tax 16 ‐ ‐ ‐ 967 967 ‐ 967
Balance at December 31, 2018 1,353,220 16,927 (755,857) (4,753) 609,537 ‐ 609,537
(1) During the first quarter of 2018, the Group acquired the minority ownership interest in KPA Western Desert Energy Limited (“KPAWDE”), thereby increasing its percentage ownership from 80.8% to 100%.

ORYX PETROLEUM CORPORATION LIMITED Consolidated Financial Statements
For the years ended December 31, 2018 and 2017
7
Consolidated Statements of Cash Flows
Year ended December 31
$000s Note 2018 2017
Operating activities
Profit / (Loss) 43,753 (39,050) Items not involving cash 22 (19,732) 33,621Change in retirement benefit obligation (814) (257) Changes in non‐cash working capital 22 (15,106) (4,043)
Net cash generated by / (used in) operating activities 8,101 (9,729)
Investing activities Acquisition of intangible assets (7,494) (4,040)
Acquisition of property, plant and equipment (26,738) (17,235)
Additions to assets held for disposal 12 (5,266) ‐
Changes in non‐cash working capital 22 6,689 (1,053)
Net cash used in investing activities (32,809) (22,328)
Financing activities Proceeds from issuance of common shares 18 1,277 30,000 Increase in ownership of KPAWDE 21 (731) ‐ Transaction costs ‐ (103)
Net cash generated from financing activities 546 29,897
Net decrease in cash and cash equivalents (24,162) (2,160)
Cash and cash equivalents at beginning of the year 38,572 40,732
Cash and cash equivalents at end of the year 14,410 38,572

ORYX PETROLEUM CORPORATION LIMITED Consolidated Financial Statements
For the years ended December 31, 2018 and 2017
8
NOTES TO THE CONSOLIDATED FINANCIAL STATEMENTS
1. General information
Oryx Petroleum Corporation Limited (the “Company” or “OPCL”) is a public company incorporated in Canada under the Canada Business Corporation Act and is the holding company for the Oryx Petroleum group of companies (together the “Group” or “Oryx Petroleum”). The address of the registered office of OPCL is 3400 First Canadian Centre 350, 7th Avenue Southwest, Calgary, Alberta, Canada T2J 2M2. The Group’s indirect controlling shareholder is The Addax and Oryx Group PLC (“AOG”) (incorporated in Malta). The majority of AOG’s outstanding shares are owned by Samsufi Trust, an irrevocable discretionary charitable trust created at the suggestion of Jean Claude Gandur. Mr. Gandur is not one of the beneficiaries of the Samsufi Trust. The Group’s principal activities are to acquire and develop exploration and production assets in order to produce hydrocarbons and to increase oil and gas reserves.
The consolidated financial statements (the “Financial Statements”) were authorised for issue by the Board of Directors on March 13, 2019.
2. Summary of significant accounting policies
a. Basis of preparation
The Financial Statements have been prepared in accordance with International Financial Reporting Standards (IFRS).
The Financial Statements have been prepared under the historical cost convention, as modified by the revaluation of financial assets and liabilities (including derivative instruments) at fair value through profit and loss.
The preparation of Financial Statements in conformity with IFRS, requires the use of critical accounting estimates. It also requires management to exercise its judgment in the process of applying the Group’s accounting policies. The areas involving a higher degree of judgment or complexity, or areas where assumptions and estimates are significant to the consolidated financial statements are disclosed in note 4: Critical accounting estimates and judgments.
The Financial Statements are presented in the US Dollar currency (USD), which is both the presentational and functional currency of the Company.
b. Going concern
These Financial Statements have been prepared on a going concern basis which contemplates the realisation of assets and the satisfaction of liabilities and commitments in the normal course of business for the foreseeable future. During 2018, the Group met its day to day working capital requirements and funded its capital and operating expenditures through funding received from the proceeds of share issuances (note 18) and its share of oil sales revenues from the Hawler license area.
The Group’s ability to continue as a going concern in accordance with management’s estimates and forecasts is primarily dependent on a) the Group’s ability to produce and sell crude oil from the Hawler license area in accordance with its 2019 work program and budget, and b) positive contributions to net cash flow of at least $25 million through a combination of measures described below (see 2.b.iii). These uncertainties may cast significant doubt about the Group’s ability to continue as a going concern.
The Directors expect that cash resources will be sufficient to fund the Group’s capital and operating expenditures and to meet forecast obligations as they fall due in the 15 months following December 31, 2018.
In preparing forecasts supporting the going concern assumption, management has applied the following significant judgments and assumptions:
i) Oil production volumes are based on current gross production rates adjusted to account for production increases expected to result from the execution of the Group’s 2019 work program.
ii) The timing and extent of forecast capital and operating expenditures is based on the Group’s 2019 reforecast budget. The Group retains a high degree of control and flexibility over both the extent and timing of expenditure under its capital investment program.

ORYX PETROLEUM CORPORATION LIMITED Consolidated Financial Statements
For the years ended December 31, 2018 and 2017
9
2. Summary of significant accounting policies (continued)
b. Going concern (continued)
iii) Positive contributions to net cash flow of at least $25 million through a combination of a) rescheduling of currently estimated future cash outflows, b) receipt of proceeds from the sale of assets held for disposal (note 12) and, so far as may be necessary, c) additional financing.
iv) The agreement to amend the terms of the contingent consideration will be executed (note 30).
Management continually monitors the Group’s financing requirements and has plans to secure external funding, if required. Specifically, but not exclusively, management is engaged in discussions with existing principal shareholders regarding a potential financing requirement during the third quarter of 2019. Management further expects that sufficient time is available to clarify precise requirements for additional financing, if any, and to subsequently conclude the arrangements required to fund cash outflows.
Should the Group be unable to meet its obligations as they fall due and to fund its anticipated capital investments and operating expenditures, the preparation of these Financial Statements on a going concern basis may not be appropriate. The Financial Statements do not reflect adjustments that would be necessary if the going concern assumption were not appropriate. Such adjustments may be material.
The directors have considered the judgments, estimates, and related uncertainties discussed above and have concluded that there is a reasonable expectation that the Group will have adequate resources to continue operations for the foreseeable future and, therefore, continue to adopt the going concern basis in preparing these Financial Statements.
c. New and amended standards adopted by the Group
Effective January 1, 2018, the Group adopted the following IFRS as issued or amended by the IASB:
Effective for annual Amendments to Standards periods beginning on or after
IFRS 9 – Financial Instruments: classification and measurement January 1, 2018 IFRS 15 – Revenue from contracts with customers January 1, 2018 IFRS 15 – Clarifications to IFRS 15: Revenue from contracts with customers January 1, 2018 Amendments to IFRS 2 ‐ Classification and measurement of share based payment transactions January 1, 2018 Annual improvements ‐ 2014 – 2016 cycle January 1, 2018
The above amended standards have not had a material impact on the Group’s Financial Statements.
i. IFRS 9 – Financial Instruments
On January 1, 2018, the Group adopted IFRS 9 “Financial Instruments” as issued by the IASB. IFRS 9 includes a new classification and measurement approach for financial assets and a forward looking expected‐credit loss model. The adoption of IFRS 9 did not have an impact on the financial statements of the Group, other than the recognition of an expected credit loss provision on trade receivables (note 9). The Group has revised its accounting policy for financial assets and trade and other receivables to reflect the new approach (note 2 j and l).
i. IFRS 15 – Revenue from contracts with customers
On January 1, 2018, the Group adopted IFRS 15 “Revenue from contracts with customers”. IFRS 15 establishes a comprehensive framework to determine whether, how much, and when revenue from contracts with customers is recognised.
The Group implemented IFRS 15 using the modified retrospective approach with no impact on retained earnings and no changes or adjustments to comparative figures in prior reporting periods. The Group has revised its accounting policy for revenue as described in note 2g)

ORYX PETROLEUM CORPORATION LIMITED Consolidated Financial Statements
For the years ended December 31, 2018 and 2017
10
2. Summary of significant accounting policies (continued)
d. New and amended standards issued but not yet effective
At the date of authorisation of these Financial Statements, the following standards applicable to the Group were issued but not yet effective: Effective for annual New and Amended Standards periods beginning on or after
IFRS 16 – Leases January 1, 2019 Annual Improvements – 2015‐2017 Cycle January 1, 2019 Amendments to IAS 19: Plan amendment, curtailment or settlement January 1, 2019
Management has reviewed the impact of the new and amended standards listed above and expects that the adoption of these standards and amendments will not have a material impact on the Group’s Financial Statements.
e. Consolidation
i. Subsidiaries
Subsidiaries are all entities over which the Group has control. Subsidiaries are consolidated from the date on which control is transferred to the Group. They are deconsolidated from the date that control ceases.
The Group applies the acquisition method to account for business combinations. The consideration transferred for the acquisition of a subsidiary is the fair value of the assets transferred, the liabilities incurred and due to the former owners of the acquiree and the equity interests issued by the Group. The consideration transferred includes the fair value of any asset or liability resulting from a contingent consideration arrangement. Identifiable assets acquired and liabilities and contingent liabilities assumed in a business combination are measured initially at the fair values at the acquisition date. The Group recognises any non‐controlling interest in the acquiree on an acquisition‐by‐acquisition basis, either at fair value or at the non‐controlling interest’s proportionate share of the recognised amounts of the acquiree’s net assets.
If the business combination is achieved in stages, the acquisition date fair value of the acquirer’s previously held equity interest in the acquiree is remeasured to fair value at the acquisition date through profit or loss.
Any contingent consideration to be transferred by the Group is recognised at fair value at the acquisition date. Subsequent changes to the fair value of the contingent consideration are recognised in profit or loss.
Goodwill is initially measured as the excess of the aggregate of the consideration transferred and the fair value of the non‐controlling interest over the net identifiable assets acquired and liabilities assumed. If the consideration is lower than the fair value of the net assets of the subsidiary acquired, the difference is recognised in profit or loss.
Inter‐company transactions, balances, income and expenses on transactions between Group companies are eliminated. Profits and losses resulting from inter‐company transactions are also eliminated.
ii. Changes in ownership interests in subsidiaries without loss of control
Changes in the Group’s interests in subsidiaries that do not result in a loss of control are accounted for as equity transactions – that is, as transactions with the owners in their capacity as owners. The carrying amounts of the Group’s interests and the non‐controlling interests are adjusted to reflect the changes in their relative interests in the subsidiaries. Any difference between the amount by which the non‐controlling interests are adjusted and the fair value of any consideration paid or received is recorded directly in equity.

ORYX PETROLEUM CORPORATION LIMITED Consolidated Financial Statements
For the years ended December 31, 2018 and 2017
11
2. Summary of significant accounting policies (continued)
e. Consolidation (continued)
iii. Disposal of subsidiaries
When the Group ceases to control a subsidiary, any retained interest in the entity is remeasured to its fair value at the date when control is lost, with the change in carrying amount recognised in profit or loss. The fair value is the initial carrying amount for the purposes of subsequently accounting for the retained interest as an associate, joint venture or financial asset. In addition, any amounts previously recognised in other comprehensive income in respect of that entity are accounted for as if the Group had directly disposed of the related assets or liabilities. This may result in amounts previously recognised in other comprehensive income being reclassified to profit or loss.
iv. Interest in joint operations
A joint operation is a joint arrangement whereby the Group has rights to assets, and obligations for the liabilities relating to the arrangement. Interests in joint operations are accounted for by recognising the Group’s share of the assets, liabilities, revenues, and expenses.
f. Foreign currency translation
i. Functional and presentation currency
Items included in the Financial Statements of each of the Group’s entities are measured using the currency of the primary economic environment in which the entity operates (the functional currency). The Financial Statements are presented in US Dollars (USD), which is the functional and presentation currency of the Company and the Group.
ii. Transactions and balances
Foreign currency transactions are translated into the functional currency using the exchange rates prevailing at the dates of the transactions or valuation where these items are remeasured. Foreign exchange gains and losses resulting from the settlement of such transactions and from the translation at year‐end exchange rates of monetary assets and liabilities denominated in foreign currencies are recognised in the statement of loss, except when deferred in other comprehensive income as qualifying cash flow hedges and qualifying net investment hedges.
Translation differences on non‐monetary financial assets and liabilities such as equities held at fair value through profit or loss are recognised in profit or loss as part of the fair value gain or loss. Translation differences on non‐monetary financial assets such as equities classified as available‐for‐sale are included in other comprehensive income.
iii. Group companies
All Group entities have a functional currency of US dollars which is consistent with the presentation currency of these Financial Statements.
Goodwill and fair value adjustments arising on the acquisition of a foreign entity are treated as assets and liabilities of the foreign entity and translated at the closing exchange rate.
g. Revenue
The Group recognises revenue associated with the sale of the Group’s working interest share of oil and natural gas products when control of the product is transferred to its customer(s) at which point the Group has satisfied its performance obligations. Revenue is measured on the basis of the consideration specified in the commercial agreements governing the sale of oil and natural gas products.
The Group incurs operating and capital costs for the exploration and development of various license areas. Agreements governing the exploration and development activities establish terms for the Group to recover these costs from the value of the sales of oil and natural gas products (Cost Recovery Oil) and to share in the value of the remaining oil and natural gas products (Profit Oil). The Group’s revenue includes the value of gross sales representing the sum of Cost Recovery Oil and Profit Oil.

ORYX PETROLEUM CORPORATION LIMITED Consolidated Financial Statements
For the years ended December 31, 2018 and 2017
12
2. Summary of significant accounting policies (continued)
g. Revenue (continued)
All remittances to governments who are party to the applicable Production Sharing Contract (“PSC”) that are directly attributable to the sale of oil and natural gas products during the reporting period including the government share of Profit Oil described above, except for income taxes, are reported as royalties.
Under the terms of certain PSCs, the governments’ share of Profit Oil includes an amount in respect of income taxes payable by the Group under the laws of the respective jurisdiction. As this amount is classified as income tax in accordance with IAS 12, the Group recognises the amount as a deduction to royalties with a corresponding income tax expense when the oil and natural gas products are sold.
h. Exploration and evaluation (“E&E”) assets and property, plant and equipment (“PP&E”)
i. Cost
Oil and gas properties and other property, plant and equipment are recorded at cost including expenditures which are directly attributable to the purchase or development of an asset.
ii. Exploration and evaluation costs
Exploration and evaluation costs incurred following the acquisition of a license are initially capitalised as intangible E&E assets. Payments to acquire the legal rights to explore, costs of technical work, seismic acquisition, education and training fund, production sharing contract costs, exploratory and appraisal drilling, general technical support and directly attributable administrative costs are capitalised as E&E assets.
E&E costs are not amortised prior to the conclusion of appraisal activities.
E&E assets related to each exploration license/prospect are carried forward until the existence (or otherwise) of commercial reserves has been determined subject to quarterly reviews for impairment. If commercial reserves are discovered, the carrying value, less any impairment loss, of the relevant E&E assets is reclassified to property, plant and equipment. If commercial reserves are determined not to exist or if the asset is otherwise deemed to be impaired, the related capitalised costs are charged to expense.
Costs incurred prior to having obtained the legal rights to explore an area are expensed in the period in which they are incurred.
iii. Development costs
Expenditures on the construction, installation and completion of infrastructure facilities and drilling of development wells are capitalised as oil and gas properties. Costs incurred to operate and maintain wells and equipment to lift oil and gas to the surface are expensed.
PP&E assets are stated at historical cost, less any accumulated depletion and any provision for impairment. Cost includes expenditures that are directly attributable to the acquisition of the assets. Subsequent costs are included in the asset’s carrying amount or recognised as a separate asset, as appropriate, when it is probable that future economic benefits associated with the item will flow to the Group and the cost of the item can be measured reliably. Where such subsequent expenditure is to replace previously capitalised equipment, the remaining carrying amount of the replaced part is derecognised. Repairs and maintenance are charged to expense as incurred.
iv. Other property, plant and equipment
Other property, plant and equipment are stated at historical cost, less accumulated depreciation and provisions for impairment. Subsequent costs are included in the asset’s carrying amount or recognised as a separate asset, as appropriate, when it is probable that future economic benefits associated with the item will flow to the Group and the cost of the item can be measured reliably.

ORYX PETROLEUM CORPORATION LIMITED Consolidated Financial Statements
For the years ended December 31, 2018 and 2017
13
2. Summary of significant accounting policies (continued)
h. Exploration and evaluation (“E&E”) assets and property, plant and equipment (“PP&E”) (continued)
v. Depreciation, depletion, and amortisation (“DD&A”)
Cost that are capitalised as oil & gas assets are depleted from the commencement of production on a unit of production basis, which is the ratio of oil and gas production in the period to the estimated quantities of proved plus probable reserves at the end of the period plus the production during the period. The cost base used in the unit of production calculation comprises the net book value of capitalised costs plus the estimated future field development costs. The impact of changes in reserves estimates are accounted for prospectively.
Depreciation on other assets is calculated using the straight‐line method over the estimated useful lives, between 3‐5 years, of the respective assets.
Residual values and useful lives are reviewed, and adjusted if appropriate, at the end of each reporting period.
Assets that are not yet in use are classified as assets under construction and are not depreciated.
Gains and losses on disposals are determined by comparing proceeds with the carrying amount and are included in the statement of loss.
vi. Intangible assets other than oil and gas assets
Intangible assets, other than oil and gas assets, that have finite useful lives, are measured at cost and amortised over their expected useful economic lives on a straight line basis.
i. Impairment of non‐financial assets
Assets that have an indefinite useful life, intangible assets, or assets under construction and not available for use, are not subject to amortisation and are tested annually for impairment. Assets that are subject to DD&A are reviewed for impairment whenever events or changes in circumstances indicate that the carrying value may not be recoverable.
E&E assets are assessed for impairment when facts and circumstances suggest that carrying value may exceed recoverable value. Such indicators include but are not limited to:
the period for which the Group has the right to explore in the specific area has expired or will expire in the near future, and is not expected to be renewed;
substantive expenditure on further exploration for and evaluation of mineral resources in the specific area is neither budgeted or planned;
exploration for and evaluation of resources in the specific area have not led to the discovery of commercially viable quantities of mineral resources and a decision has been taken to discontinue such activities in the specific area;
sufficient data exists to indicate that, although a development in the specific area is likely to proceed, the carrying amount of the E&E asset is unlikely to be recovered in full from successful development or sale;
extended decreases in expected prices or margins for oil & gas commodities or products;
a significant downwards revision in estimated volumes of reserves or resources or an upward revision in future development costs.
For the purpose of impairment testing, assets are aggregated in cash‐generating units (“CGU”). An impairment loss is recognised if the asset’s carrying amount exceeds its recoverable amount. The recoverable amount of a CGU is the greater of its fair value less costs of disposal and its value in use. Previously recorded impairment provisions related to non‐financial assets other than goodwill are reviewed and subject to reversal at each reporting date.

ORYX PETROLEUM CORPORATION LIMITED Consolidated Financial Statements
For the years ended December 31, 2018 and 2017
14
2. Summary of significant accounting policies (continued)
j. Financial assets
The Group classifies its financial assets in the following categories: amortised cost and fair value through profit or loss. The classification depends on the Company’s business model for managing the financial assets and the contractual cash flow characteristics of the financial assets. Management determines the classification of its financial assets upon initial recognition.
Financial assets are derecognised when the rights to receive cash flows from the investments have expired or have been transferred and the Group has transferred substantially all risks and rewards of ownership.
i. Financial assets at amortised cost
Financial assets classified at amortised cost are held to collect contractual cash flows that solely represent repayments of the carrying amount of the asset upon initial recognition and interest, if any. These financial assets are initially measured at fair value and subsequently measured at amortised cost using the effective interest rate method.
ii. Financial assets at fair value through profit or loss
All other financial assets, not classified at amortised cost or at fair value through other comprehensive income, are classified and subsequently measured at fair value through profit or loss.
k. Inventories
i. Materials inventory
Inventories relating to materials acquired for use in the exploration and development of oil and gas activities are stated at the lower of cost and net realisable value, taking into account slow moving inventory and obsolescence. Cost is determined by the first‐in first‐out method. Net realisable value is the estimated selling price in the ordinary course of business, less estimated costs necessary to make the sale. The cost of material inventories comprises all costs of purchase, conversion and other costs incurred in bringing the inventories to their present location and condition.
ii. Oil Inventory
Crude oil inventory is valued at the lower of cost or net realisable value. Cost is determined using the first‐in‐first out method.
l. Trade and other receivables
Trade and other receivables are recognised initially at fair value and subsequently measured at amortised cost using the effective interest method, less provision for impairment. A provision for impairment of trade receivables is established based on the probabilities of possible default scenarios, and on changes in those possible default scenarios at each reporting date.
m. Cash and cash equivalents
Cash and cash equivalents include cash in hand, deposits held at call with banks, and other highly liquid investments with original maturities of three months or less. Bank overdrafts are shown within borrowings in current liabilities.
n. Borrowings
Borrowings are recognised initially at fair value, net of transaction costs incurred. Borrowings are subsequently carried at amortised cost; any difference between the proceeds (net of transaction costs) and the redemption value is recognised in the statement of loss over the period of the borrowings using the effective interest method.
Borrowings are classified as current liabilities unless the Group has an unconditional right to defer settlement of the liability for at least twelve months after the end of the reporting period.

ORYX PETROLEUM CORPORATION LIMITED Consolidated Financial Statements
For the years ended December 31, 2018 and 2017
15
2. Summary of significant accounting policies (continued)
o. Taxation
The Group's contractual arrangements in foreign jurisdictions stipulate that income taxes are collected by the respective government out of its entitlement share of Profit Oil. Such amounts are included in current income tax expense at the statutory rate in effect at the time of production.
The Company determines the amount of deferred income tax assets and liabilities based on the difference between the carrying amounts of the assets and liabilities reported for financial accounting purposes from those reported for tax. Deferred income tax assets and liabilities are measured using the substantively enacted tax rates expected to apply to taxable income in the years in which the temporary differences are expected to be recovered or settled. Deferred income tax assets associated with unused tax losses are recognised to the extent it is probable the Group will have sufficient future taxable earnings available against which the unused tax losses can be utilised.
p. Employee benefits
i. Pension obligations
The Group operates two Swiss defined benefit pension plans. Typically defined benefit plans define an amount of pension benefit that an employee will receive on retirement, usually dependent on one or more factors such as age, years of service and compensation. The pension assets within these Swiss plans consist entirely of investments held by the insurance company that fully reinsures the Group’s pension obligations.
The liability recognised in the statement of financial position in respect of defined benefit pension plans is the present value of the defined benefit obligation at the end of the reporting period less the fair value of plan assets. The defined benefit obligation is calculated annually by independent actuaries using the projected unit credit method. The present value of the defined benefit obligation is determined by discounting the estimated future cash outflows using interest rates of high quality corporate bonds that are denominated in the currency in which the benefits will be paid, and that have terms to maturity approximating to the terms of the related pension obligation.
The retirement benefit obligation recognised in the statement of financial position represents the deficit or surplus in the Group’s defined benefit plans. Any surplus resulting from this calculation is limited to the present value of any economic benefits available in the form of refunds from the plans or reductions in the future contributions to the plans.
ii. Share‐based compensation
The Group issues equity‐settled share‐based payments to employees under a Long Term Incentive Plan (LTIP). Such payments are measured at the fair value of the equity instruments at the grant date. The fair value excludes the effect of any service and non‐market performance vesting conditions.
The fair value of equity‐settled share‐based payments determined at the grant date is expensed over the vesting period, based on the Group’s estimate of equity instruments that will eventually vest. At the end of each reporting period, the Group revises its estimate of the number of equity instruments expected to vest as a result of the effect of non‐market vesting conditions. The impact of the revision of the original estimates, if any, is recognised in profit or loss such that the cumulative expense reflects the revised estimate, with a corresponding adjustment to equity.
q. Trade and other payables
Liabilities for trade and other amounts payable are stated initially at their fair value and subsequently at amortised cost using the effective interest method.
r. Provisions
Provisions are recognised when i) the Group has a present legal or constructive obligation as a result of past events, ii) it is probable that an outflow of resources will be required to settle the obligation, and iii) the amount can be reliably estimated. Provisions are measured using management’s best estimate of the expenditure required to settle the obligation and are discounted to present value as at the date of the statement of financial position.

ORYX PETROLEUM CORPORATION LIMITED Consolidated Financial Statements
For the years ended December 31, 2018 and 2017
16
2. Summary of significant accounting policies (continued)
r. Provisions (continued)
The Group’s activities give rise to dismantling, decommissioning and site disturbance remediation activities. The Group recognises provisions for the estimated cost of site restoration which are capitalised in the relevant asset category.
Decommissioning obligations are measured at the present value of management’s best estimate of the expenditures required to settle the present obligation at the date of the statement of financial position. Over time, the discounted liability is increased for the changes in present value based on current market discount rates and liability specific risks. Decommissioning obligations are recognised as additions to the corresponding assets in the period they arise unless the obligation results directly from production activities, in which case the change is recognised as a production expense. Actual costs incurred upon settlement of the decommissioning obligations are charged against the provision to the extent the provision was established.
s. Interest income
Interest income is recognised as it accrues in profit or loss, using the effective interest method.
t. Leases
Leases where the lessor retains substantially all the risks and rewards of ownership are classified as operating leases. Payments made under operating leases (net of any incentives received from the lessor) are charged to the statement of loss on a straight‐line basis over the period of the lease.
Assets held under finance leases are initially recognised as assets of the Group at their fair value at the inception of the lease or, if lower, at the present value of the minimum lease payments. The corresponding liability to the lessor is included in the statement of financial position as a finance lease obligation.
3. Financial risk management
3.1 Fair values of financial instruments
The Group has classified its cash and cash equivalents as financial assets at fair value through profit or loss. Contingent consideration payable and decommissioning obligation are classified as financial liabilities at fair value through profit or loss. Trade and other receivables are classified as financial assets at amortised cost, and trade and other payables, borrowings, and finance lease obligations are classified as other liabilities.
The carrying and fair values of the Group’s financial instruments are summarised as follows:
Classification ($000s) December 31, 2018 December 31, 2017
Financial assets at fair value through profit or loss 14,410 38,572 Financial assets at amortised cost 23,019 8,757 Financial liabilities at fair value through profit or loss 54,195 68,835 Other liabilities 146,537 118,436
3.2 Financial risk factors
The Group’s activities expose it to a variety of financial risks: market risk (including currency risk, fair value interest rate risk, cash flow interest rate risk and price risk), credit risk and liquidity risk. The Group’s overall risk management objective is to decrease volatility in financial position and cash flow while securing effective and competitive financing. In order to address the impact of these risks, the Group has developed various risk management policies and strategies.
a. Market risk
i. Foreign exchange risk
The Group operates internationally and has foreign exchange risk arising from various currency exposures. Foreign exchange risk arises when future commercial transactions or recognised assets and liabilities are denominated in a currency that is not the entity’s functional currency.

ORYX PETROLEUM CORPORATION LIMITED Consolidated Financial Statements
For the years ended December 31, 2018 and 2017
17
3. Financial risk management (continued)
3.2 Financial risk factors (continued)
a. Market risk (continued)
i. Foreign exchange risk (continued)
The Group’s reporting currency is the US Dollar. Certain elements of general and administrative expenses are transacted in other currencies. The majority of balances are held in US Dollars with transfers to Swiss Francs and other local currencies as required to meet local needs. The Group’s objective is to minimise exposure to foreign exchange risks.
Management estimates that there would have been a $0.9 million impact to the profit for the year ended December 31, 2018 by applying a 10% change in the US Dollar / Swiss Franc exchange rate to transactions denominated in Swiss Francs.
ii. Commodity price risk
The market prices for crude oil and natural gas are subject to significant fluctuations resulting from a variety of factors affecting global supply and demand. An increase or decrease of $10/bbl applied to the Group’s oil sales recognised during 2018 would have resulted in a decrease or increase of $10.5 million to the profit for the year.
iii. Interest rate risk
The Group’s income and operating cash flows are substantially independent of changes in market interest rates with the exception of interest income from bank deposits, with variable interest rates which are exposed to cash flow interest rate risk as market rates change. The objective of the Group’s interest rate risk management is to balance the returns received on interest bearing assets with an acceptable level of access to those assets.
The Group estimates that the impact of applying a 0.5% change to interest rates associated with the Group’s financial instruments that bear interest at a variable rate would not result in a change to the profit for the year ended December 31, 2018.
b. Credit risk
Credit risk is managed on a Group basis. Credit risk arises from cash and cash equivalents and deposits with banks and financial institutions, as well as credit exposures to oil and gas property license partners and customers, including outstanding receivables and committed transactions. For cash and cash equivalents, the Group invests in products that are rated investment grade and above. The credit risk on liquid funds is assessed as limited because the counterparties are banks with good credit‐ratings assigned by international credit‐rating agencies. The Group extends unsecured credit to third party customers in relation to oil sales and the collection of these amounts may be affected by changes in economic or other conditions. The Company has not experienced any material credit losses in the collection of accounts receivable to date. Management has recorded a provision of $1.8 million relating to the revenue receivable balance at December 31, 2018 (2017 ‐ nil).
Where a Group company undertakes its activities under joint arrangements, its joint operations partners are obligated to make cash contributions to fund the joint operations and have historically done so. The balance of joint operations payables (note 13) arises from timing differences between cash calls and the expenditure incurred on behalf of joint operations partners. Although the Group has not experienced delays or losses related to joint operations partners funding cash calls and related expenditures, the Group is exposed to credit risk on cash call balances receivable.

ORYX PETROLEUM CORPORATION LIMITED Consolidated Financial Statements
For the years ended December 31, 2018 and 2017
18
3. Financial risk management (continued)
3.2 Financial risk factors (continued)
b. Credit risk (continued)
The following table presents the credit risk exposure to individual financial institutions:
Credit rating
Cash balance at December 31, 2018
($000s)
Maximum balance with any individual bank
during 2018 ($000s)
Number of banks
A1 13,887 37,896 3 Other / not rated 113 517 3Cash held by Group 410 501 N/A
c. Liquidity risk
Prudent liquidity risk management implies maintaining sufficient cash and marketable securities and the ability to secure sufficient funding on a timely basis to meet capital and operating expenditure obligations. Management uses budgets and cash flow models, which are regularly updated, to monitor liquidity risk. The Group manages liquidity risk through its corporate treasury function using various sources of financing and investing excess liquidity. Refer to note 2b for additional discussion regarding liquidity risk.
The table below details the remaining contractual maturity for non‐derivative financial liabilities of the Group as at December 31, 2018 and December 31, 2017. The amounts disclosed in the table are the estimated undiscounted cash flows.
$000s Less than 1
year Between 1 and 2 years
Between 2 and 5 years
Over 5 years
At December 31, 2018 Trade and other payables 71,554 31,219 14,643 ‐ Borrowings ‐ 77,146 ‐ ‐ Decommissioning obligation ‐ ‐ ‐ 39,000 At December 31, 2017 Trade and other payables 43,363 23,786 45,643 ‐Borrowings ‐ 77,146 ‐ ‐Decommissioning obligation ‐ ‐ ‐ 34,263
3.3 Capital risk management
The Group’s objectives when managing capital are to safeguard the Group’s ability to continue as a going concern in order to provide returns for shareholders and benefits for the other stakeholders and to maintain an optimal capital structure to reduce the cost of capital.
The capital structure of the Group consists of borrowings, issued capital and reserves less accumulated deficits.
4. Critical accounting estimates and judgments
In the process of applying the Group’s accounting policies management makes estimates, judgments and assumptions concerning the future. These accounting estimates, judgments and assumptions may differ from actual results. The estimates and underlying assumptions are reviewed on an ongoing basis.
Information about critical estimates and judgments that have the most significant risk of causing material adjustment to the carrying amounts of assets and liabilities recognised in the Financial Statements within the next financial year are discussed below:
a. Going concern
The estimates and judgments related to the significant Going Concern assumptions are discussed in detail in note 2b.

ORYX PETROLEUM CORPORATION LIMITED Consolidated Financial Statements
For the years ended December 31, 2018 and 2017
19
4. Critical accounting estimates and judgments (continued)
b. Carrying value of E&E assets
Management has made significant estimates and judgments related to the determination of whether impairment indicators are present in respect of each CGU classified as an E&E asset. These critical estimates and judgments are discussed in detail in note 6.
c. Carrying value of oil and gas assets
Note 7 sets out a detailed discussion regarding the critical judgments and estimates used in determining the carrying value of oil and gas assets.
d. Carrying value of assets held for disposal
Note 12 sets out a detailed discussion regarding the critical judgments applied in determining the asset’s carrying value.
e. Joint arrangements
The Group has entered into joint arrangements to facilitate the development and production of oil and gas. The joint arrangements are governed by PSCs and by joint operating agreements. Management has exercised judgment in concluding that joint arrangements are subject to joint control. Specifically, judgment has been used in determining that decisions concerning the relevant activities of each arrangement require the unanimous consent of at least two specified parties. The Group has classified and accounted for each of its interests in joint arrangements as joint operations.
f. Acquisition of subsidiaries
Estimating the fair value of contingent consideration relating to the acquisition of OP Hawler Kurdistan Limited requires significant judgment as described in note 30.
g. Fair value
An assessment of fair value of assets and liabilities is required in accounting for derivative instruments and other items – principally available‐for‐sale financial assets and disclosures related to fair values of financial assets and liabilities. In such instances, fair value measurements are estimated based on the amounts for which the assets and liabilities could be exchanged at the relevant transaction date or reporting period end, and are therefore not necessarily reflective of the likely cash flow upon actual settlements. Where fair value measurements cannot be derived from publicly available information, they are estimated using models and other valuation methods. To the extent possible, the assumptions and inputs used take into account externally verifiable inputs. However, such information is by nature subject to uncertainty, particularly where comparable market based transactions may not exist.
h. Pension benefits
The present value of the pension obligations depends on a number of factors that are determined on an actuarial basis using a number of estimates, as disclosed in note 16. Changes in these estimates impact the carrying amount of pension obligations and the charge to the statement of comprehensive loss.

ORYX PETROLEUM CORPORATION LIMITED Consolidated Financial Statements
For the years ended December 31, 2018 and 2017
20
5. Joint arrangements
The Group has entered into Joint arrangements to facilitate the development and production of oil and gas. No new joint arrangements have been entered into during the year ended December 31, 2018. As at December 31, 2018, the Company was involved in the following joint arrangements:
License Area
Classification Location Participating
interest(1)
Hawler Joint operation Iraq – Kurdistan Region 65% AGC(2) Central Joint operation Senegal and Guinea Bissau 85%Haute Mer B(3) Joint operation Congo (Brazzaville) 30%
(1) Participating interest is the Group’s current interest in the applicable license area. Participating interest differs from working interest which reflects the impact of unexercised back‐in rights or options.
(2) Agence de Gestion et de Coopération entre le Sénégal et la Guinée – Bissau (“AGC”)
(3) On April 23, 2018, the Group entered into an agreement providing for the sale of the Group’s 30% participating interest in the Haute Mer B license to the operator of the license (note 12).
6. Intangible assets
$000s Exploration &
Evaluation costsComputer Software Total
Cost
At January 1, 2017(1) 259,008 2,180 261,188
Additions 940 6 946
Transfer to Assets held for disposal(2) (note 12) (16,425) ‐ (16,425)
Divestiture(3)(4) (151,343) ‐ (151,343)
At December 31, 2017 92,180 2,186 94,366
Additions 7,672 25 7,697
At December 31, 2018 99,852 2,221 102,063
Accumulated amortisation and impairment
At January 1, 2017(1) 169,193 2,078 171,271
Impairment reversal (2)(3) (9,411) ‐ (9,411) Amortisation ‐ 81 81Transfer to Assets held for disposal(2) (note 12) (8,425) ‐ (8,425)Divestiture(3)(4) (151,357) ‐ (151,357)
At December 31, 2017 ‐ 2,159 2,159
Amortisation ‐ 29 29
At December 31, 2018 ‐ 2,188 2,188
Net book value
At December 31, 2018 99,852 23 99,875 At December 31, 2017 92,180 27 92,207
(1) The January 1, 2017 cost and accumulated amortisation and impairment balances have been updated to reflect the derecognition of fully impaired assets prior to January 1, 2017. There is no impact on net book value.
(2) Subsequent to December 31, 2017, the Group entered into an agreement to dispose of its interest in the Haute Mer B license area. Management concluded that the agreement constituted an indication that the net realisable value of the Group’s interest in the Haute Mer B license area as at December 31, 2017 was greater than Nil as previously estimated and consequently recorded an $8.0 million impairment reversal. The Haute Mer B license area’s costs net of accumulated impairment were transferred to Assets held for disposal as at December 31, 2017.
(3) During 2017, the Company divested of and derecognised its interest in the OML 141 license area in Nigeria for nominal consideration. Prior to divesting of its interest in the license area, the Company recorded a credit to additions and an equivalent impairment reversal of $1.5 million due to revisions in costs that had been previously estimated.
(4) During 2017, the Company determined to cease further investment in the Haute Mer A license area, withdrew from the Joint Operating Agreement and Production Sharing Contract for Nil proceeds and consequently derecognised its interest in the license area.

ORYX PETROLEUM CORPORATION LIMITED Consolidated Financial Statements
For the years ended December 31, 2018 and 2017
21
6. Intangible assets (continued)
The carrying amounts of intangible E&E assets relate to:
December 31 December 31 $000s 2018 2017
Middle East 48,397 48,425 West Africa 51,455 43,755
99,852 92,180
The carrying amounts for E&E assets represent costs incurred on exploration projects. For the purpose of impairment assessments and testing, E&E assets are aggregated in cash‐generating units (“CGU”). Determination of what constitutes a CGU is subject to management judgments and the circumstances. Management has determined that each license area constitutes a CGU. The carrying amounts remain capitalised, provided there are no indications of impairment, until the process to determine whether commercial reserves are established is complete. At that stage the relevant costs are either transferred to PP&E or written‐off to the statement of profit and loss as an impairment of oil and gas assets.
During the fourth quarter of 2017, the Group executed an amendment to the AGC Central PSC (“AGC Central Amendment”). Under the terms of the AGC Central Amendment, recoverable costs incurred under the AGC Shallow PSC are recoverable from potential sales of oil produced and sold from the AGC Central license area. Consequently, the Group transferred all costs previously associated with the AGC Shallow CGU to the AGC Central GCU. As a result of the transfer, the carrying value of the AGC Shallow license was reduced to Nil. The Group concurrently relinquished its interest in the AGC Shallow license area.
Management has exercised significant judgment in determining that for the Hawler – Ain al Safra, and AGC Central CGUs, there are no substantive indicators suggesting that the carrying amounts of exploration and evaluation assets exceed their recoverable amounts. Most significantly, assessments regarding the presence of impairment indicators include complex judgments and estimates relating to i) management’s current and future capital allocation priorities, and ii) the Group’s ability to finance its commitments within the time limitations imposed by the agreements governing the Group’s activities in each of the related license areas / CGUs.

ORYX PETROLEUM CORPORATION LIMITED Consolidated Financial Statements
For the years ended December 31, 2018 and 2017
22
7. Property, plant and equipment
The Group’s principal property, plant and equipment comprises its Oil & Gas assets in the Hawler license area in the Kurdistan Region of Iraq. No assets have been pledged as security.
$000s Oil & Gas Assets Finance Lease
Asset Fixtures and Equipment Total
Cost
At January 1, 2017 824,079 47,617 3,326 875,022
Additions 2,392 ‐ ‐ 2,392
Transfers and reclassifications(1) 47,617 (47,617) ‐ ‐
At December 31, 2017 874,088 ‐ 3,326 877,414
Additions 28,504 ‐ 218 28,722
At December 31, 2018 902,592 ‐ 3,544 906,136
Accumulated depreciation, depletion and impairment
At January 1, 2017 257,392 460 3,320 261,172
Impairment expense(2) 27,726 ‐ ‐ 27,726 Depreciation ‐ ‐ 3 3 Depletion 5,891 ‐ ‐ 5,891Transfers and reclassifications(1) 460 (460) ‐ ‐
At December 31, 2017 291,469 ‐ 3,323 294,792
Impairment reversal (54,109) ‐ ‐ (54,109)
Depreciation ‐ ‐ 18 18
Depletion 13,856 ‐ ‐ 13,856
At December 31, 2018 251,216 ‐ 3,341 254,557
Net book value
At December 31, 2018 651,376 ‐ 203 651,579 At December 31, 2017 582,619 ‐ 3 582,622
(1) During the first quarter of 2017, the Group settled a finance lease obligation and assumed ownership of the asset. The facilities previously classified as Finance Lease Assets were concurrently reclassified to Oil & Gas Assets.
(2) As at December 31, 2017, the Group recorded a $27.7 million impairment charge relating to the Hawler license area. The impairment charge represented the difference between the estimated recoverable amount of the Hawler license area CGU and its carrying amount prior to impairment.
(3) As at December 31, 2018, the Group recorded a $54.1 million impairment reversal relating to the Hawler license area. The impairment reversal represents the difference between the estimated recoverable amount of the Hawler license area CGU and its carrying amount prior to the impairment reversal. The carrying value of the Hawler license area CGU at December 31, 2018 is $651.4 million (December 31, 2017: $582.6 million).
The carrying amounts for Oil & Gas assets are subject to impairment assessment and testing in accordance with IAS 36.
For the purpose of impairment assessments and testing, Oil & Gas assets are aggregated in CGUs. Determination of what constitutes a CGU is subject to management judgments and the circumstances. For the purposes of impairment assessments and testing of Oil & Gas assets, management has determined that the Oil & Gas assets in the Hawler license area outside of the Ain al Safra area constitute the group’s single CGU which contains property, plant and equipment.
In conducting impairment assessments and tests, management considers internal and external sources of information regarding the manner in which assets are expected to be used, and indications of economic performance of the assets. Estimates include but are not limited to the determination of expected future cash flows from the asset being tested and the discount rate used to determine the value of the cash flows at the measurement date. Reductions in oil price forecasts, increases in estimated future costs of production, increases in estimated future capital costs, reductions in the amount of recoverable reserves and resources and/or adverse economic conditions can result in estimated carrying amounts exceeding the recoverable amounts of the Group’s Oil & Gas assets. An impairment loss is recognised if and when the carrying amount exceeds the recoverable

ORYX PETROLEUM CORPORATION LIMITED Consolidated Financial Statements
For the years ended December 31, 2018 and 2017
23
7. Property, plant and equipment (continued)
amount. An impairment reversal is recognised if and when there has been a change in the estimates used to determine the asset’s recoverable amount since the last impairment loss was recognised.
Following the presence of indicators that the Hawler license area CGU’s recoverable amount may differ from its carrying amount, management conducted an impairment test as at December 31, 2018.
In performing the impairment test as at December 31, 2018, management used significant assumptions and estimates derived from and consistent with those incorporated in the proved plus probable reserves development case contained in the independent evaluator’s report referenced in the Group’s Material Change Report dated February 13, 2019, adjusted to reflect management’s current assumptions related to future crude oil sale prices and expenditure estimates.
Expected cash inflows from oil sales are based on quoted Brent Crude forward contract prices for 2019, 2020, and 2021. Management’s Brent Crude assumptions beyond 2021 are benchmarked against the forward contract prices and pricing forecasts prepared by external firms. Expected cash inflows assume that all sales of crude oil from the Hawler license area are completed through the Kurdistan Region Export Pipeline. In accordance with management’s best estimate of the terms most likely to govern future sales of Hawler license area crude oil, realized prices are referenced to management’s estimated future Brent Crude prices discounted by approximately $8/bbl for pipeline system tariffs and fees, and adjusted for differences in forecast API gravity and sulphur from standard Brent specifications.
Based on the above, expected cash inflows from oil sales are determined using the following estimated average nominal sales prices:
Year ending December 31, Brent Crude Price
($/bbl) Assumed realised
Price ($/bbl)
2019 60.98 45.972020 60.36 45.072021 59.86 44.80 2022 69.30 54.192023 70.74 54.852024 76.99 60.70 2025 78.86 62.09 2026 80.83 63.65 2027 82.42 65.02 2028 84.06 66.592029 85.70 68.18Thereafter 2% escalation
Expected cash outflows are based on the capital, operating, and abandonment expenditure profiles incorporated in the independent evaluator’s report referenced in the Group’s Material Change Report dated February 13, 2019, adjusted to reflect 30% contingencies on all future estimated expenditures. The additional contingency reflects uncertainty related to the oil field service market conditions expected to apply during the forecast period.
Management has applied the fair value less costs of disposal methodology to establish the net present value of expected after‐tax cash flows associated with proved plus probable reserves as at December 31, 2018 using a 15% nominal after‐tax discount rate. The 15% discount rate is based on management’s estimate of the cost of capital invested in upstream oil & gas assets in the Kurdistan Region of Iraq.
In measuring the recoverable amount of the Hawler license area CGU as defined in IFRS 13, management has relied on i) observable inputs other than quoted prices for identical assets, and ii) inputs that are not publicly observable and are the result of management’s estimates and judgments arising from analysis of internally generated data.
Application of the fair value less costs of disposal methodology using the assumptions described above indicates an estimated recoverable amount of the Hawler license area CGU as at December 31, 2018 to be $564.8 million. Consequently, the Group has recorded a $54.1 million impairment reversal as at December 31, 2018. The impairment reversal represents the difference between the estimated recoverable amount of the Hawler license area CGU and its carrying amount prior to the impairment reversal which includes the carrying values of

ORYX PETROLEUM CORPORATION LIMITED Consolidated Financial Statements
For the years ended December 31, 2018 and 2017
24
7. Property, plant and equipment (continued)
decommissioning obligation (note 17) and the contingent consideration (notes 13 and 30), for which settlement is included in the discounted expected after‐tax cash‐flows.
The net present value of expected after‐tax cash‐flows associated with the proved plus probable reserves development case described above has been subjected to sensitivities arising from changes in crude oil price forecasts and discount rates. The following table indicates the estimated recoverable amounts as at December 31, 2018 that result from applying various crude oil price forecasts and discount rates:
Estimated recoverable amount ($ millions)
Discount rate
12.5% 15% 17.5%
Above prices less $5/bbl 589.0 510.6 449.9 Prices listed above 644.7 564.8 497.5Above prices plus $5/bbl 702.3 620.4 551.2
The following table indicates the estimated recoverable amounts as at December 31, 2018, that result from applying various contingencies on future estimated expenditures.
Estimated recoverable amount ($ millions)
Contingency on future estimated expenditures
0% 10% 30% 50%
Above prices less $5/bbl 554.9 539.4 510.6 472.5 Prices listed above 607.8 595.3 564.8 537.9 Above prices plus $5/bbl 650.2 645.5 620.4 590.1
The net present value of expected cash‐flows associated with the proved plus probable reserves development case is also highly sensitive to the Group’s independently evaluated estimation of proved plus probable reserves and to the production profile associated with the exploitation of these reserves. The estimated recoverable and carrying values of the Group’s Hawler license area CGU are subject to significant adjustment should there be significant changes to estimates of proved plus probable reserves and their production profile.
8. Inventories
$000s
December 31 2018
December 312017
Oil inventory 221 323 Materials 9,170 13,121
9,391 13,444
The cost of oil inventory is expensed through production and depletion expenses in the period during which it is sold. As at December 31, 2018 the Group’s working interest share of oil inventory was 11,720 bbls (December 31, 2017 – 12,100 bbls).
The Group has adjusted the carrying value of materials inventory to management’s estimate of net realisable value. The provision at December 31, 2018 is $8.3 million (December 31, 2017: $7.7 million).
No inventories have been pledged as security during the period.
9. Trade and other receivables
December 31 December 31 $000s 2018 2017
Revenue receivables 21,776 8,085 Other receivables 1,243 672
23,019 8,757
The carrying amounts of trade and other receivables presented above are reasonable approximations of their fair values. Included in the revenue receivable balance at December 31, 2018 is a provision of $1.8 million (December 31, 2017 – nil) which was calculated based on the probabilities of possible default (note 24).
Trade and other receivables are denominated in US dollars. The carrying amounts of trade and other receivables presented above are reasonable approximations of their fair values.

ORYX PETROLEUM CORPORATION LIMITED Consolidated Financial Statements
For the years ended December 31, 2018 and 2017
25
10. Other current assets
December 31 December 31 $000s 2018 2017
Deposits 580 265 Prepaid charges and other current assets 620 677
1,200 942
11. Cash and cash equivalents
Cash and cash equivalents comprise cash and short‐term deposits with an original maturity of three months or less. The carrying amounts are reasonable approximations of the fair value.
Cash and cash equivalents are denominated in the following currencies:
December 31 December 31$000s 2018 2017
US dollar 13,766 37,356Swiss Franc 558 999 Other 86 217
14,410 38,572
12. Assets held for disposal
On April 23, 2018, a subsidiary of Oryx Petroleum (the “Seller”) entered into an agreement providing for the sale of a 30% participating interest in the Haute Mer B exploration license offshore Congo (Brazzaville) (“HMB License”) to a subsidiary of Total S.A. (the “Buyer”) (the “Sale Agreement”). Upon closing, the Seller’s interest in the HMB License is expected to be transferred for cash consideration of $8 million, payable at closing with the sale to be deemed effective from January 1, 2018. The Sale Agreement provides for the Buyer to reimburse the Seller for costs incurred by it in relation to the HMB License between January 1, 2018 and the date of the Sale Agreement and to carry the Seller’s share of costs from the date of the Sale Agreement to the closing of the transaction. This is expected to result in a further payment to the Seller, at closing, of $5.3 million.
The Group’s position that all conditions to closing have been either satisfied or waived notwithstanding, the Buyer has declined to close the transaction and has purported to terminate the Sale Agreement. The Seller has engaged external legal counsel, has initiated arbitration to settle the dispute, believes strongly in the merits of its position, and expects the transaction to close during 2019. Consequently, management estimates that the asset’s recoverable amount continues to be equivalent to its carrying value. Management has assessed that it is improbable that the arbitration panel will rule against the Seller, or that the Group may otherwise be unsuccessful in realizing the contracted amounts. In the event that conditions to closing are determined not to have been met and the Sale Agreement is terminated, the Seller may be adjudged to have an obligation to fund the Seller’s share of HMB License expenditures incurred by the Buyer following the date of the Sale Agreement. As at December 31, 2018, these unrecognised, contingent liabilities amount to approximately $13.4 million including interest charges.

ORYX PETROLEUM CORPORATION LIMITED Consolidated Financial Statements
For the years ended December 31, 2018 and 2017
26
13. Trade and other payables
December 31 December 31 $000s 2018 2017
Trade accounts payable 3,920 4,782 Amounts payable to joint operations partners 3,301 2,934 Amounts payable to related parties 82 4Contingent consideration (notes 25, 30) 33,472 10,545 Other payables and accrued liabilities 29,138 24,317
Current portion 69,913 42,582
Non‐current portion of contingent consideration (notes 25, 30) 37,521 54,242
Total trade and other payables 107,434 96,824
The carrying amounts of trade accounts payables, amounts payable to joint operations partners, amounts payable to related parties, and other payables and accrued liabilities, as presented above are reasonable approximations of their fair values.
As at December 31, 2018, the Group has recognised a liability of $71.0 million (December 31, 2017 ‐ $64.8 million) representing the estimated fair value of liabilities associated with the acquisition of OP Hawler Kurdistan Limited. The portion of the liability estimated to be paid beyond one year of the respective dates of the statements of financial position is classified as a long‐term liability. The contingent consideration liability is presented at fair value estimated by discounting estimated future cash outflows at a rate of 10% (note 30).
14. Borrowings
On March 11, 2015, the Group entered into a committed and unsecured term loan facility agreement (the “Loan Facility”) with a subsidiary of its indirect controlling shareholder The Addax and Oryx Group PLC (the “Lender”). The $100 million Loan Facility has been fully drawn and had an initial maturity of March 10, 2018 (the “Maturity Date”).
On April 28, 2017, the Loan Facility was amended to extend the Maturity Date from March 10, 2018 to July 1, 2019 and to amend interest payment terms (the “Loan Amendment”). Under the terms of the Loan Amendment, interest, which up to and including May 11, 2017 accrued at an annual compound rate of 10.5%, and principal amounts owing to the Lender up to and including May 11, 2017 (the “Loan Amount”) are payable at the Maturity Date or earlier, at the option of the borrower. Interest accrued on the Loan Amount after May 11, 2017 was determined on each of November 11, 2017, May 11, 2018, November 11, 2018, (each, an “Interest Calculation Dates”) and has been settled by way of issuance of common shares (note 18). The numbers of common shares were determined using the issue price per share equal to the volume weighted average trading price for the five trading days immediately preceding the Interest Calculation Dates.
On November 13, 2018, the Group agreed with the Lender to amend the Loan Facility to further extend the Maturity Date from July 1, 2019 to July 1, 2020 and to amend interest provisions (the “2nd Loan Amendment”). That agreement was later amended and superseded on December 31, 2018 whereby the Company agreed to issue warrants to acquire between 3,637,262 and 6,132,804 common shares of the Company to the Lender or one of its affiliates (note 18b). The Loan Amount and interest rate remain unchanged from the terms agreed under the Loan Amendment. Interest accrued on the Loan Amount for the period beginning on November 12, 2018 and ending on July 1, 2019 is to be settled by way of issuance of common shares as contemplated in the Loan Amendment. If cash payments to the Lender are then permitted under the terms of other corporate agreements, interest on the Loan Amount accruing after July 1, 2019 will be payable in cash on January 1, 2020 and July 1, 2020. If interest is not paid in cash, any unpaid interest will be capitalised (“Capitalised Interest”) and added to the Loan Amount and interest on the Loan Amount and Capitalised Interest shall then accrue and be payable at the Maturity Date. The 2nd Loan Amendment was approved by the Toronto Stock Exchange on March 11, 2019.
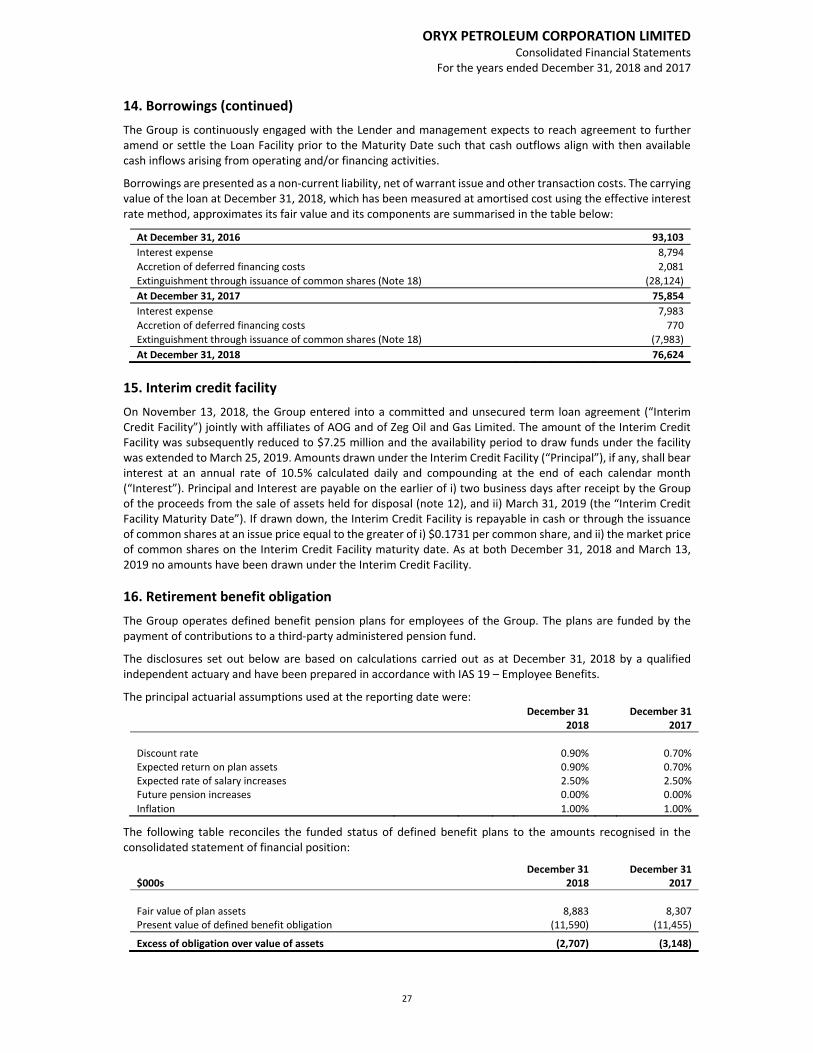
ORYX PETROLEUM CORPORATION LIMITED Consolidated Financial Statements
For the years ended December 31, 2018 and 2017
27
14. Borrowings (continued)
The Group is continuously engaged with the Lender and management expects to reach agreement to further amend or settle the Loan Facility prior to the Maturity Date such that cash outflows align with then available cash inflows arising from operating and/or financing activities.
Borrowings are presented as a non‐current liability, net of warrant issue and other transaction costs. The carrying value of the loan at December 31, 2018, which has been measured at amortised cost using the effective interest rate method, approximates its fair value and its components are summarised in the table below:
At December 31, 2016 93,103
Interest expense 8,794
Accretion of deferred financing costs 2,081
Extinguishment through issuance of common shares (Note 18) (28,124)
At December 31, 2017 75,854
Interest expense 7,983
Accretion of deferred financing costs 770
Extinguishment through issuance of common shares (Note 18) (7,983)
At December 31, 2018 76,624
15. Interim credit facility
On November 13, 2018, the Group entered into a committed and unsecured term loan agreement (“Interim Credit Facility”) jointly with affiliates of AOG and of Zeg Oil and Gas Limited. The amount of the Interim Credit Facility was subsequently reduced to $7.25 million and the availability period to draw funds under the facility was extended to March 25, 2019. Amounts drawn under the Interim Credit Facility (“Principal”), if any, shall bear interest at an annual rate of 10.5% calculated daily and compounding at the end of each calendar month (“Interest”). Principal and Interest are payable on the earlier of i) two business days after receipt by the Group of the proceeds from the sale of assets held for disposal (note 12), and ii) March 31, 2019 (the “Interim Credit Facility Maturity Date”). If drawn down, the Interim Credit Facility is repayable in cash or through the issuance of common shares at an issue price equal to the greater of i) $0.1731 per common share, and ii) the market price of common shares on the Interim Credit Facility maturity date. As at both December 31, 2018 and March 13, 2019 no amounts have been drawn under the Interim Credit Facility.
16. Retirement benefit obligation
The Group operates defined benefit pension plans for employees of the Group. The plans are funded by the payment of contributions to a third‐party administered pension fund.
The disclosures set out below are based on calculations carried out as at December 31, 2018 by a qualified independent actuary and have been prepared in accordance with IAS 19 – Employee Benefits.
The principal actuarial assumptions used at the reporting date were: December 31 December 31 2018 2017
Discount rate 0.90% 0.70% Expected return on plan assets 0.90% 0.70% Expected rate of salary increases 2.50% 2.50%Future pension increases 0.00% 0.00%
Inflation 1.00% 1.00%
The following table reconciles the funded status of defined benefit plans to the amounts recognised in the consolidated statement of financial position:
December 31 December 31 $000s 2018 2017
Fair value of plan assets 8,883 8,307 Present value of defined benefit obligation (11,590) (11,455)
Excess of obligation over value of assets (2,707) (3,148)

ORYX PETROLEUM CORPORATION LIMITED Consolidated Financial Statements
For the years ended December 31, 2018 and 2017
28
16. Retirement benefit obligation (continued)
The change in the defined benefit obligation is as follows:
$000s 2018 2017
Defined benefit obligation, beginning of year (11,455) (11,038) Current service cost (1,287) (1,250) Interest cost (83) (81) Remeasurement gains 786 569Benefits paid 408 739Translation difference and other 41 (394)
Defined benefit obligation, end of year (11,590) (11,455)
The change in the fair value of plan assets is as follows:
$000s 2018 2017
Fair value of plan assets, beginning of year 8,307 8,523 Interest income 59 60 Return on plan assets 180 (187) Employer contributions 814 280 Benefits paid (408) (739) Translation difference (69) 370
Fair value of plan assets, end of year 8,883 8,307
The fair value of the plan assets are comprised of investments held by the insurance company that fully reinsures the Group’s pension obligations.
The Group expects to make contributions of $0.9 million to the defined benefit plan during 2019. Actual contributions for 2018 amounted to $0.8 million (2017 ‐ $0.3 million).
The amounts recognised in profit or loss comprise the following:
Year ended Year ended December 31 December 31 $000s 2018 2017
Current service cost 1,287 1,250 Loss on settlement ‐ 48 Net interest expense 24 21 Other 6 6
Defined benefit cost recognised in the profit / (loss) for the year 1,317 1,325
Defined benefit costs of $1.3 million (2017 ‐ $1.3 million) have been included in general and administrative expenses.
The amounts recognised in other comprehensive income / loss comprise the following:
Year ended Year ended December 31 December 31$000s 2018 2017
Actuarial gain (786) (569)(Return) / loss on plan assets, excluding interest income (181) 188
Defined benefit gain recognised in comprehensive income / (loss) (967) (381)
Deferred tax ‐ 515
Defined benefit (gain) / cost recognised in comprehensive income / (loss), net of income tax (967) 134

ORYX PETROLEUM CORPORATION LIMITED Consolidated Financial Statements
For the years ended December 31, 2018 and 2017
29
16. Retirement benefit obligation (continued)
The following table summarises the present value of the defined benefit obligation if certain changes in the actuarial assumptions were made:
December 31 December 31 $000s 2018 2017
Decrease in discount rate of 0.25% 12,115 12,039 Increase in discount rate of 0.25% 11,100 10,999 Decrease in salary increases of 0.25% 11,456 11,378Increase in salary increases of 0.25% 11,706 11,625Increase in life expectancy of one year 11,787 11,702 Decrease in life expectancy of one year 11,393 11,299 Decrease in interest rate of 0.25% 11,471 11,385 Increase in interest rate of 0.25% 11,712 11,619
17. Decommissioning obligation
The Group has obligations to decommission its oil and gas assets upon cessation of operations.
In calculating the value of the Group’s future decommissioning obligation at December 31, 2018, management has made significant assumptions and estimates based on an assessment of the current economic environment and factors specific to the assets to be decommissioned. These estimates are reviewed annually and when circumstances suggest that such revisions are required. Actual decommissioning costs will ultimately depend upon future market prices for the necessary decommissioning works required which will reflect market conditions at the relevant time. Furthermore, the timing of decommissioning may depend on when the fields cease to produce at economically viable rates. This in turn will depend upon future oil and gas prices, which are inherently uncertain. The assumed inflation rate used in the calculation to determine the carrying value of the decommissioning obligation was reviewed as at June 30, 2018, and no change was made to the 1.4% rate (December 31, 2017 – 1.4%). The assumed discount rate was also reviewed as at June 30, 2018 and was updated to 4.3% (December 31, 2017 – 4.1%). Decommissioning obligations are anticipated to be incurred in 2038.
The estimated net present value of the decommissioning obligation at December 31, 2018 is $16.7 million (December 31, 2017 ‐ $14.6 million) based on the Group’s working interest undiscounted liability of $39.0 million (December 31, 2017 ‐ $34.3 million).
December 31 December 31 $000s 2018 2017
Decommissioning obligation, beginning of the year 14,593 16,664 Property acquisition and development activity 2,278 443
Change in discount rate (618) (4,491)
Change in inflation rate ‐ 1,635
16,253 14,251 Accretion expense 421 342
Decommissioning obligation, end of the year 16,674 14,593

ORYX PETROLEUM CORPORATION LIMITED Consolidated Financial Statements
For the years ended December 31, 2018 and 2017
30
18. Share capital
a. Issued common shares
$000s Number of
shares Share capital
At January 1, 2017 253,361,581 1,279,655
Issue of shares for private placement 161,850,057 54,100
Transaction costs ‐ (103)
Issue of shares to Lender (Note 14) 24,481,049 4,024
Issue of shares to settle trade accounts payable 15,500,000 4,750
Issue of shares for LTIP 2,457,892 611
Issue of shares for directors’ compensation 411,828 149
At December 31, 2017 458,062,407 1,343,186
Issue of shares to Lender (Note 14) 45,240,792 7,983 Issue of shares for private placement 7,312,764 1,277Issue of shares for LTIP 4,054,887 725Issue of shares for directors’ compensation 360,372 49
At December 31, 2018 515,031,222 1,353,220
The Company has unlimited authorised share capital outstanding as December 31, 2018.
2018 share capital transactions
On July 3, 2018, the Group extinguished $4.0 million of accrued interest under the Loan Facility described in note 14, in consideration for 22,188,975 common shares of the Company.
On September 4, 2018, the Group issued 4,054,887 common shares to employees under the Group’s LTIP.
On November 12, 2018, OPCL issued 23,051,817 common shares of the Company to a subsidiary of AOG in satisfaction of $4.0 million of interest accrued under the Loan Facility (note 14).
On December 27, 2018, the Company issued 7,312,764 common shares of the Company to Zeg Oil and Gas Limited for cash consideration of $1.3 million.
During the year ended December 31, 2018, the Group issued 360,372 shares to Directors of the Company as remuneration.
2017 share capital transactions
On March 15, 2017, OPCL issued 15,500,000 common shares of the Company to settle a current trade accounts payable of $4.8 million.
On June 20, 2017, OPCL issued 131,933,226 common shares of the Company to a subsidiary of AOG for consideration of $44.1 million. $24.1 million of the proceeds from the issue and sale of common shares has been applied to extinguish principal and accrued interest under the Loan Facility described in note 14.
On June 20, 2017, the Company also issued 29,916,831 common shares of the Company to Zeg Oil and Gas Limited for consideration of $10.0 million.
On December 8, 2017, the Group extinguished $4.0 million of accrued interest under the Loan Facility described in note 14, in consideration for 24,481,049 common shares of the Company.
During the year ended December 31, 2017, the Group issued 2,457,892 shares to employees under the Group’s LTIP. An additional 411,828 shares were issued to Directors of the Company as remuneration.
b. Warrants
On February 26, 2019, in accordance with the 2nd Loan Amendment described in note 14, the Group issued warrants to an affiliate of the Lender to acquire 3,637,262 common shares of the Company. The exercise price of the issued warrants is $0.2094 per common share. The warrants expire on November 13, 2021.

ORYX PETROLEUM CORPORATION LIMITED Consolidated Financial Statements
For the years ended December 31, 2018 and 2017
31
19. Share based payments
The long term incentive plan (LTIP) was introduced in 2010 to provide long‐term incentives which motivate employees and provide a longer‐term perspective to the total remuneration package. Annual awards under the LTIP comprise common shares of the Company.
During the year ended December 31, 2018, the Company issued 2,036,492 shares relating to the 2017 LTIP and 2,018,395 shares related to the 2016 LTIP. During the year ended December 31, 2017, the Company issued 71,472 shares relating to the 2017 LTIP, 2,065,946 shares relating to the 2016 LTIP and 320,474 shares related to the 2015 LTIP.
The amount of share based payments in respect of officers and employees charged to the statement of loss for the year ended December 31, 2018 was $2.0 million (2017 ‐ $1.9 million). The fair value of shares granted under the LTIP has been determined based on the volume weighted average price of the Company’s publicly traded shares for the five days prior to the grant date.
20. Basic and diluted earnings / (loss) per share
The loss and weighted average number of common shares used in the calculation of the basic and diluted earnings per share are as follows:
Year ended Year ended December 31 December 31$000s 2018 2017
Profit / (loss) for the period attributable to equity holders 43,753 (39,033)
Weighted average number of common shares for basic and diluted loss per share(1) 474,049,061 354,957,180
$
Basic and diluted earnings / (loss) per share 0.09 (0.11)
(1) The unvested LTIP shares are excluded as they are anti‐dilutive.
21. Reserves
$000s Other Reserves Share based payments
Total reserves
At January 1, 2017 2,700 11,701 14,401
Share based payment transactions ‐ 2,139 2,139 Issue of shares for LTIP (611) (611)Share based directors compensation ‐ 99 99Issue of shares for directors’ compensation ‐ (149) (149)
At December 31, 2017 2,700 13,179 15,879
Share based payment transactions ‐ 1,985 1,985 Issue of shares and cash for LTIP (830) (830) Share based directors compensation ‐ (50) (50) Increase in ownership of KPAWDE(1) (57) ‐ (57)
At December 31, 2018 2,643 14,284 16,927
(1) During the first quarter of 2018, the Group acquired the minority ownership interest in KPA Western Desert Energy Limited (“KPAWDE”), thereby increasing its percentage ownership from 80.8% to 100%.

ORYX PETROLEUM CORPORATION LIMITED Consolidated Financial Statements
For the years ended December 31, 2018 and 2017
32
22. Supplemental cash flow information
Items not involving cash Year ended Year ended
December 31 December 31 $000s 2018 2017
Depreciation, depletion and amortization 13,936 5,920 Share based payment expense 1,341 1,417 Impairment (reversal) / expense (54,109) 18,315 Unrealised foreign exchange gains (83) (145)Non‐cash income tax expense 18 1,094Finance expense 15,379 13,664 General and administration 1,381 785
Other expense / (income) 2,405 (7,429)
Items not involving cash (19,732) 33,621
Changes in non‐cash working capital
Year ended
Year ended December 31 December 31 $000s 2018 2017
Inventories 3,437 (32) Trade and other receivables (16,028) (3,362) Other current assets (258) 579Trade and other payables 4,432 (2,281)
Changes in non‐cash working capital (8,417) (5,096)
Changes in operating non‐cash working capital (15,106) (4,043) Changes in investing non‐cash working capital 6,689 (1,053)
Changes in non‐cash working capital (8,417) (5,096)
Other cash flow Information Year ended Year ended December 31 December 31 $000s 2018 2017
Cash interest paid ‐ 444 Cash interest received ‐ 157Cash income taxes paid 213 499
23. Income tax expense
Year ended Year ended December 31 December 31 $000s 2018 2017
Current income tax expense (2,202) (1,020) Deferred tax on LTIP shares (18) (19)Deferred tax on defined benefit obligation ‐ (1,076)
Total deferred tax (2,220) (1,095)
Income tax expense (2,220) (2,115)
The Group is subject to income taxes in certain jurisdictions where it holds interests in exploration and development licenses or has taxable operations. Current income tax expense relates to tax on profits from oil sales in the Kurdistan Region of Iraq and on taxable profits from operations of the Group’s Swiss and Maltese subsidiaries. For the year ended December 31, 2018, income taxes related to oil sales in the Kurdistan Region of Iraq in the amount of $2.0 million (2017 ‐ $0.8 million) were deemed to be collected by the government through its allocation of profit oil under the Hawler PSC.

ORYX PETROLEUM CORPORATION LIMITED Consolidated Financial Statements
For the years ended December 31, 2018 and 2017
33
23. Income tax expense (continued)
Income taxes vary from the amount that would be computed by applying statutory tax rates to income before taxes as follows:
Year ended Year ended December 31 December 31 $000s 2018 2017
Profit / (loss) before income tax 45,973 (36,935)
Combined Canadian federal and provincial income tax recovery at the statutory rate (12,413) 9,972 Effect of losses exempt from taxation (4,718) (4,230) Effect of tax rates of subsidiaries operating in other jurisdictions 908 (366) Effect of non‐taxable gains / non‐deductible expenses 13,723 (4,606)Effect of current year non‐recognition of deferred tax assets 518 (1,532)Other items (238) (1,353)
Income tax expense (2,220) (2,115)
Deferred tax assets related to the benefit of other tax deductions and losses have not been recognised as it is not sufficiently probable that these assets will be realised.
Cumulative unused tax losses unrecognised in deferred tax assets amount to $57.8 million at December 31, 2018 (December 31, 2017 ‐ $102.8 million).
24. Other (expense) / income
The components of other (expense) / income for the periods indicated are as follows:
Year ended Year ended December 31 December 31$000s Note 2018 2017
Impairment of trade and other receivables 9 (1,766) ‐(Impairment) / reversal of materials inventory 8 (671) 694Settlement of finance lease liability ‐ 7,605Restructuring charge release ‐ 63 Relinquishment expense(1) ‐ (1,523) Other (expense) / income (144) 191
Other (expense) / income (2,581) 7,030
(1) During the fourth quarter of 2017, Oryx Petroleum concluded an agreement with the AGC to relinquish its interest in the AGC Shallow license area. In connection with the agreement, Oryx Petroleum has agreed to pay a $1.5 million fee and to accelerate payment of a $1 million renewal fee that is otherwise due under the AGC Central PSC upon entry into the first extension exploration period.
25. Finance expense
The components of finance expense for the periods indicated are as follows:
Year ended Year ended December 31 December 31 $000s Note 2018 2017
Interest expense on borrowings 14 7,983 8,794 Accretion of deferred financing costs 14 770 2,081Change in fair value of contingent consideration 30 2,704 59Interest expense on finance lease obligation ‐ 443 Interest on contingent consideration 30 3,502 2,002 Accretion of decommissioning obligation 17 421 342
Finance expense 15,380 13,721

ORYX PETROLEUM CORPORATION LIMITED Consolidated Financial Statements
For the years ended December 31, 2018 and 2017
34
26. Subsidiaries
Details of the Company’s subsidiaries at December 31, 2018 are included in the table below:
Name of subsidiary Country of incorporation
Principal place of business Principal activity
Proportion of interest / voting rights
Oryx Petroleum Holdings Plc(1) Malta Malta Intermediate holding company 100% Oryx Petroleum Services SA Switzerland Switzerland Administrative / technical
services100%
Oryx Petroleum Middle East Limited
BVI BVI Intermediate holding company 100%
Oryx Petroleum Africa Limited BVI BVI Intermediate holding company 100%OP OML 141 Nigeria Limited Nigeria Nigeria Inactive 100%OP AGC Shallow Limited BVI Senegal / Guinea
BissauInactive 100%
OP AGC Central Limited BVI Senegal / Guinea Bissau
Oil and gas exploration 100%
OP Hawler Kurdistan Limited BVI Iraq – Kurdistan region
Oil and gas exploration 100%
Oryx Petroleum Congo SA Congo Congo Oil and gas exploration 100%OP Congo HMB Limited BVI Congo Oil and gas exploration 100%KPA Western Desert Energy Limited(2)
Cyprus Cyprus Intermediate holding company 100%
(1) Held directly by Oryx Petroleum Corporation Limited. All other subsidiaries are held through subsidiary undertakings.
(2) During the first quarter of 2018, the Group acquired the minority ownership interest in KPAWDE, thereby increasing its percentage ownership from 80.8% to 100%. During the second quarter of 2018, AmiraKPO Limited (incorporated in Cyprus) merged with KPAWDE.
27. Related party transactions
The Group’s indirect majority shareholder is AOG. The majority of AOG’s outstanding shares are owned by Samsufi Trust, an irrevocable discretionary charitable trust created at the suggestion of Jean Claude Gandur, a director and the Chairman of the Company. Mr. Gandur is not one of the beneficiaries of The Samsufi Trust.
The following transactions were carried out with related parties, which are all subsidiaries of AOG.
(a) Loan agreement
On March 11, 2015, the Group entered into a committed and unsecured term loan facility agreement with a subsidiary of its indirect majority shareholder AOG under which $100.0 million in cash was received during the year ended December 31, 2015. Interest and accretion expense of $8.8 million relating to this transaction have been recorded for the year ended December 31, 2018 (2017 – $10.9 million). On November 13, 2018, later amended on December 31, 2018, the Group agreed with the Lender to amend the Loan Facility to further extend the Maturity Date from July 1, 2019 to July 1, 2020 and to amend interest provisions. Refer to note 14 for further information. Management believes the terms and conditions negotiated to be materially comparable to terms applicable to similar market transactions.
(b) Interim credit facility
On November 13, 2018, the Group entered into a committed and unsecured term loan agreement jointly with affiliates of AOG and of Zeg Oil and Gas Limited. The amount of the Interim Credit Facility was subsequently reduced to $7.25 million and the availability period to draw funds under the facility was extended to March 25,
2019. Refer to note 15 for further information. Management believes the terms and conditions to be materially comparable to terms applicable to similar market transactions.

ORYX PETROLEUM CORPORATION LIMITED Consolidated Financial Statements
For the years ended December 31, 2018 and 2017
35
27. Related party transactions (continued)
(c) Purchases of goods and services
Year ended Year ended December 31 December 31 $000s 2018 2017
The Addax and Oryx Group PLC 1,500 1,501 Addax Immobilier SA 198 183Oryx Senegal SA 23 ‐AOG Advisory Services SA 11 6
1,732 1,690
Management exercised judgment, which was based on its industry specific knowledge and experience, to determine that i) the above transactions did not contain unusual commercial terms, and ii) the fees charged under the agreements were reasonable and not materially inconsistent with fees which would normally be associated with broadly comparable agreements.
(d) Payables to related parties
December 31 December 31 $000s 2018 2017
Addax Immobilier SA 54 ‐ Oryx Senegal SA 23 ‐ AOG Advisory Services SA 5 4
82 4
The amounts outstanding are unsecured. No guarantees have been given. Amounts owing to related parties arise from transactions disclosed above in note 27(c) and will be settled in cash.
(e) AOG guarantee
Certain specified contingent liabilities, payable to the Kurdistan Regional Government, pursuant to the Hawler license area PSC, are supported by a guarantee provided by AOG. These payments amount to a maximum of $2.5 million per year during the development period.
(f) Key management compensation
The remuneration of the directors and senior officers, the key management personnel of the Group, in aggregate is set out below.
Year ended Year ended December 31 December 31$000s 2018 2017
Wages, salaries and other short term benefits 2,694 2,309Post‐employment benefits 195 254Share based compensation 408 388
3,297 2,951

ORYX PETROLEUM CORPORATION LIMITED Consolidated Financial Statements
For the years ended December 31, 2018 and 2017
36
28. Segment information
The Group has a single class of business which is to acquire, explore, develop and produce oil from oil and gas assets. The Group operates in two geographical areas. Segmented information related to the two operating segments and corporate activities is as follows:
For the year ended December 31, 2018 $000s Middle East West Africa Corporate Total
Revenue 97,642 ‐ ‐ 97,642
Royalty (42,967) ‐ ‐ (42,967)
Net revenue 54,675 ‐ ‐ 54,675
Operating expense (19,241) ‐ ‐ (19,241) Depreciation, depletion and amortisation (13,890) ‐ (46) (13,936)Impairment recovery 54,109 ‐ ‐ 54,109Pre‐license and exploration ‐ 61 ‐ 61 General and administration (4,293) (472) (7,158) (11,923)
Other income (1,560) (1,021) ‐ (2,581)
Segment result 69,800 (1,432) (7,204) 61,164
Finance income
142
Finance expense (15,380) Foreign exchange gain 47
Profit before income tax 45,973
Income tax expense (2,220)
Profit for the year 43,753
Capital additions 28,476 7,699 243 36,418Segment assets as at December 31, 2018 736,275 69,590 7,111 812,976
Segment liabilities as at December 31, 2018 195,481 1,730 6,211 203,439
For the year ended December 31, 2017 $000s Middle East West Africa Corporate Total
Revenue 37,368 ‐ ‐ 37,368
Royalty (16,444) ‐ ‐ (16,444)
Net revenue 20,924 ‐ ‐ 20,924
Operating expense (15,487) ‐ ‐ (15,487) Depreciation, depletion and amortisation (5,835) ‐ (84) (5,919)Impairment (expense) / reversal (27,726) 9,412 ‐ (18,314)Pre‐license and exploration ‐ (1,026) ‐ (1,026) General and administration (3,781) (227) (6,675) (10,683)
Other income 8,378 (1,524) 176 7,030
Segment result (23,527) 6,635 (6,583) (23,457)
Finance income
157
Finance expense (13,721) Foreign exchange gain 104
Loss before income tax (36,935)
Income tax expense (2,115)
Loss for the year (39,050)
Capital additions 530(1) 2,802 6 3,338 Segment assets as at December 31, 2017 665,212 70,190 9,397 744,798
Segment liabilities as at December 31, 2017 184,027 1,795 4,597 190,419
(1) Includes credits to additions relate to reductions in estimates of expenditures incurred in prior periods and the impact of the updated discount and inflation rates used to calculate the decommissioning obligation.

ORYX PETROLEUM CORPORATION LIMITED Consolidated Financial Statements
For the years ended December 31, 2018 and 2017
37
28. Segment information (continued)
Non‐current assets, aggregated by country, are as follows:
December 31 December 31 $000s 2018 2017
Iraq (Kurdistan Region) 699,771 658,554 Senegal and Guinea Bissau 51,472 41,362 Other 447 2,017
751,690 701,933
29. Commitments
(a) Contractual obligations
The Group has entered into agreements which contain provisions for the following spending commitments:
December 31 December 31 $000s 2018 2017
No later than one year 2,523 6,143 One to five years 38,428 38,546
Greater than five years 14,503 16,100
55,454 60,789
The commitments noted above reflect the Group’s execution of expected and contracted exploration and development activities as at December 31, 2018. Expenditure commitments may be subject to change and may be reduced by selective relinquishments of acreage and/or licenses or by curtailing the execution of activity under existing supplier contracts. Determining expenditure commitments requires the use of estimates and judgments primarily related to expectations that budgeted activities will be executed.
(b) Operating lease commitments – Group company as lessee
The Group leases buildings and equipment under non‐cancellable operating lease agreements with varying terms and renewal rights. The corresponding lease expenditure charged to the statement of profit and loss during the year ended December 31, 2018 was $0.3 million (2017 ‐ $0.2 million).
The future aggregate minimum lease payments under non‐cancellable operating leases are as follows:
December 31 December 31 $000s 2018 2017
No later than one year 296 243
One to five years 26 46
322 289
30. Contingent liabilities and consideration
In the normal course of operations, the Company may be subject to litigation and claims. In management’s estimation, other than as has been recognised or disclosed within these Financial Statements, no such litigation or claim, individually or in aggregate, is expected to result in a liability that would have a significant adverse effect on the financial position or results of operations of the Company.
During 2011, the Group acquired OP Hawler Kurdistan Limited under the terms of a sale and purchase agreement (the “Purchase Agreement”).

ORYX PETROLEUM CORPORATION LIMITED Consolidated Financial Statements
For the years ended December 31, 2018 and 2017
38
30. Contingent liabilities and consideration (continued)
The Purchase Agreement, as amended, provides for additional consideration which becomes payable upon the outcome of exploration activities. The associated liability is presented at management’s estimate of fair value, which as at December 31, 2018, amounted to $71.0 million (December 31, 2017 ‐ $64.8 million) (note 13). During the year ended December 31, 2018, contingent interest accrued at a rate of 5.0% per annum. During the year ended December 31, 2017, contingent interest accrued at a rate of 1.9% per annum until July 31, 2017, and at 5.0% thereafter. For periods beginning on October 1, 2018, if the average price of dated Brent crude oil exceeds $75/bbl during any year ending on September 30, the amended Purchase Agreement prescribes that the annually compounding interest rate increase to 10% per annum for interest calculated during such year.
In November 2018, the Group agreed with the vendor of the Hawler license area to amend terms of the Purchase Agreement (the “2018 Amendment”), with the vendor’s final execution pending. The 2018 Amendment provides for an $11.4 million deferral payment which the Group expects to make upon the vendor’s final execution of the agreement. Subject to the declaration of a second commercial discovery within the Hawler license area, the remaining contingent principal balance plus accrued interest is then to be paid in three annual instalments beginning September 30, 2019. If the Group has not declared a second commercial discovery by September 30, 2019 (previously September 30, 2018), the instalment payment schedule would no longer apply and the contingent consideration obligation, if subsequently triggered by a second commercial discovery, would revert to a single lump‐sum payment obligation.
For the specific purpose of estimating the fair value of the contingent consideration obligation, management’s estimate assumes that the Group will achieve a second declaration of commercial discovery in the Hawler license area, that the contingent consideration will consequently become payable, and that the timing and amount of resulting cash outflows will be consistent with the terms outlined in 2018 Amendment. The fair value of the liability was established using observable inputs other than quoted prices (IFRS 13 Level 2 hierarchy category) and was determined by calculating the present value of estimated future cash flows using the discount rate adjustment technique. The future cash flows have been estimated based on the terms outlined in the agreement with the vendor and discounted using an observed market rate for similar obligations. As at December 31, 2018, management has assumed an interest rate of 5% per annum and a 10% discount rate (December 31, 2017 – 5% interest rate, 10% discount rate).