Consolidated Financial Statements - Itaú...
88
1 Consolidated Financial Statements 1 st Quarter 2001
Transcript of Consolidated Financial Statements - Itaú...

11111
ConsolidatedFinancial
Statements1st Quarter 2001
2
Management Report
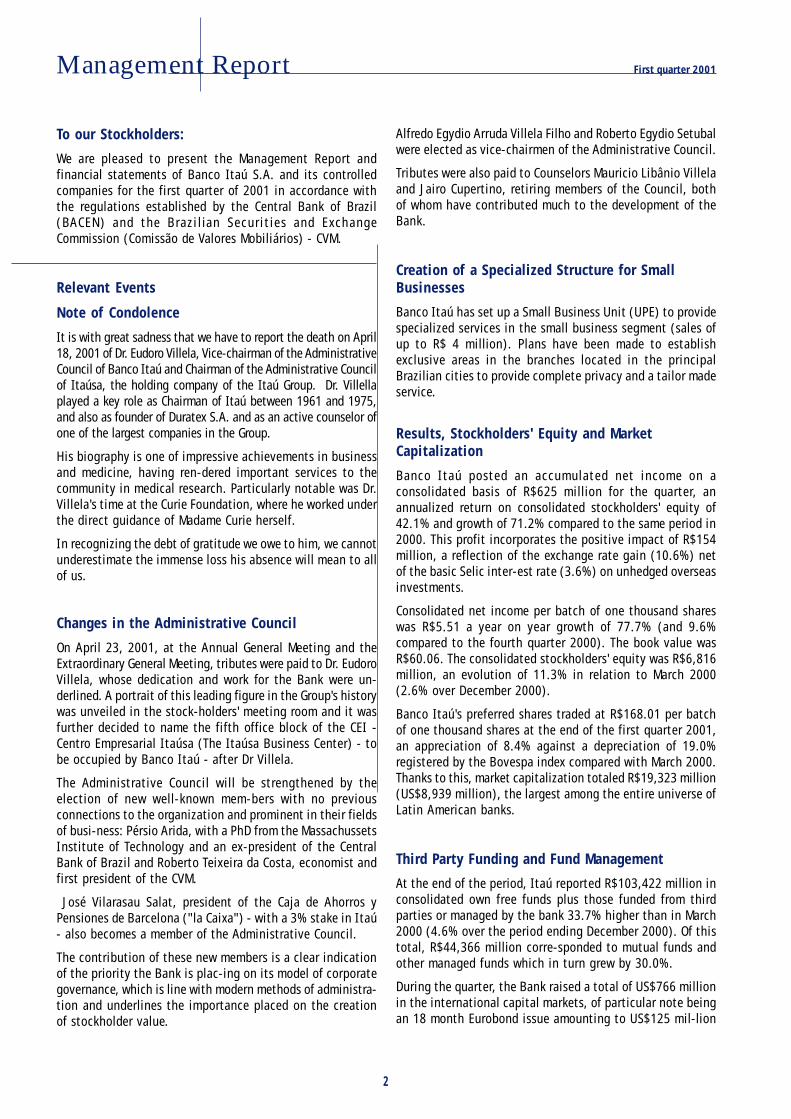
To our Stockholders:
We are pleased to present the Management Report andfinancial statements of Banco Itaú S.A. and its controlledcompanies for the first quarter of 2001 in accordance withthe regulations established by the Central Bank of Brazil(BACEN) and the Brazilian Securities and ExchangeCommission (Comissão de Valores Mobiliários) - CVM.
Relevant Events
Note of Condolence
It is with great sadness that we have to report the death on April18, 2001 of Dr. Eudoro Villela, Vice-chairman of the AdministrativeCouncil of Banco Itaú and Chairman of the Administrative Councilof Itaúsa, the holding company of the Itaú Group. Dr. Villellaplayed a key role as Chairman of Itaú between 1961 and 1975,and also as founder of Duratex S.A. and as an active counselor ofone of the largest companies in the Group.
His biography is one of impressive achievements in businessand medicine, having ren-dered important services to thecommunity in medical research. Particularly notable was Dr.Villela's time at the Curie Foundation, where he worked underthe direct guidance of Madame Curie herself.
In recognizing the debt of gratitude we owe to him, we cannotunderestimate the immense loss his absence will mean to allof us.
Changes in the Administrative Council
On April 23, 2001, at the Annual General Meeting and theExtraordinary General Meeting, tributes were paid to Dr. EudoroVillela, whose dedication and work for the Bank were un-derlined. A portrait of this leading figure in the Group's historywas unveiled in the stock-holders' meeting room and it wasfurther decided to name the fifth office block of the CEI -Centro Empresarial Itaúsa (The Itaúsa Business Center) - tobe occupied by Banco Itaú - after Dr Villela.
The Administrative Council will be strengthened by theelection of new well-known mem-bers with no previousconnections to the organization and prominent in their fieldsof busi-ness: Pérsio Arida, with a PhD from the MassachussetsInstitute of Technology and an ex-president of the CentralBank of Brazil and Roberto Teixeira da Costa, economist andfirst president of the CVM.
José Vilarasau Salat, president of the Caja de Ahorros yPensiones de Barcelona ("la Caixa") - with a 3% stake in Itaú- also becomes a member of the Administrative Council.
The contribution of these new members is a clear indicationof the priority the Bank is plac-ing on its model of corporategovernance, which is line with modern methods of administra-tion and underlines the importance placed on the creationof stockholder value.
Alfredo Egydio Arruda Villela Filho and Roberto Egydio Setubalwere elected as vice-chairmen of the Administrative Council.
Tributes were also paid to Counselors Mauricio Libânio Villelaand Jairo Cupertino, retiring members of the Council, bothof whom have contributed much to the development of theBank.
Creation of a Specialized Structure for SmallBusinesses
Banco Itaú has set up a Small Business Unit (UPE) to providespecialized services in the small business segment (sales ofup to R$ 4 million). Plans have been made to establishexclusive areas in the branches located in the principalBrazilian cities to provide complete privacy and a tailor madeservice.
Results, Stockholders' Equity and MarketCapitalization
Banco Itaú posted an accumulated net income on aconsolidated basis of R$625 million for the quarter, anannualized return on consolidated stockholders' equity of42.1% and growth of 71.2% compared to the same period in2000. This profit incorporates the positive impact of R$154million, a reflection of the exchange rate gain (10.6%) netof the basic Selic inter-est rate (3.6%) on unhedged overseasinvestments.
Consolidated net income per batch of one thousand shareswas R$5.51 a year on year growth of 77.7% (and 9.6%compared to the fourth quarter 2000). The book value wasR$60.06. The consolidated stockholders' equity was R$6,816million, an evolution of 11.3% in relation to March 2000(2.6% over December 2000).
Banco Itaú's preferred shares traded at R$168.01 per batchof one thousand shares at the end of the first quarter 2001,an appreciation of 8.4% against a depreciation of 19.0%registered by the Bovespa index compared with March 2000.Thanks to this, market capitalization totaled R$19,323 million(US$8,939 million), the largest among the entire universe ofLatin American banks.
Third Party Funding and Fund Management
At the end of the period, Itaú reported R$103,422 million inconsolidated own free funds plus those funded from thirdparties or managed by the bank 33.7% higher than in March2000 (4.6% over the period ending December 2000). Of thistotal, R$44,366 million corre-sponded to mutual funds andother managed funds which in turn grew by 30.0%.
During the quarter, the Bank raised a total of US$766 millionin the international capital markets, of particular note beingan 18 month Eurobond issue amounting to US$125 mil-lion
First quarter 2001

3
Management Report
and a Syndicated Loan Facility of US$275 million withmaturities of one and three years.
Assets and Loans
Itaú's consolidated assets were R$74,563 million at the endof the quarter, an increase of 37.8% over March 2000 (and7.2% compared to December 2000).
The credit portfolio grew by 47.9% over March 2000 (9.8%compared to December 2000). The portfolio of majorcorporates continued to grow strongly reporting an increaseof 48.7% over March 2000 (14.2% compared to December2000). The small business and middle market portfolio grewby 68.8% over March 2000 (-3.1%, compared to December2000). The private individual credit segment posted anincrease of 79.2% over March 2000 (20.5% over December2000), with a particularly strong demand coming frompersonal credit operations and consumer goods finance.
There was a 6.0% increase in the number of credit cardsissued while the number of clients accessing the bank viahome or office banking rose by 11.2%. The Itaú-AOL, servicelaunched in January had already surpassed 100,000subscribers by the end of the quarter.
The International structure continued to operate on the basisof separate structures for trade finance and operations fundedthrough overseas lines of credit. The consolidatedportfolio amounted to R$5,603 million (US$ 2,592 million),an increase of 41.5% in relation to March 2000.
Credit portfolio quality remained unchanged. Managementadopted a conservative policy and opted to increase the excessprovision for overdue credits by R$27 million to R$630million. The cost of provisioning for overdue credits fellcompared to the previous quarter in spite of the overallincrease in the outstanding balance of the portfolio.
Insurance, Private Pension Plans andCapitalization
Itauseg and its subsidiaries posted a net income of R$38million for the quarter, an annual-ized return of 23.3%.Earnings from insurance premiums registered R$375 millionwhile technical reserves stood at R$942 million. Itauseg'sclaims index was 59.6%, against 60.9% posted for the sameperiod in 2000. Thanks to this, the combined ratio was 93.2%,an improvement of 4.3 percentage points.
Itaucap and Itauprev posted technical reserves at the end ofthe period of R$821 million and R$971 million, respectively.
International Presence
Banco Itaú Buen Ayre (IBA) closed the period with US$728million in assets and US$319 million in loans. Due to theArgentine economic crisis and a revision of the Bank's creditportfolio using risk management monitoring, IBA decided toadopt a more restrictive ap-proach to credit. This decisionhowever, in no way reflected any relevant event related to adeterioration in the bank's credit portfolio. IBA continues tohave an extremely low expo-sure to the public sector andenjoy very high levels of liquidity. Deposits were US$510mil-lion, an increase of 3.5% over the same period in 2000.
Banco Itaú Europa, S.A. (BIE), controlled by Itaúsa Portugaland regulated by the Bank of Portugal, continues to focuson trade finance and provide support to European companiesinvesting in Brazil. The bank closed the quarter with totalassets of Eur. 1,686 million (US$1,483 million) andstockholders' equity of Eur. 194 million (US$171 million), ayear-on-year growth of 37.3% and 6.7%, respectively. Netincome was Eur. 5 million (US$4 million), an increase of69.3%, representing an annualized return of 10.9% onstockholders' equity.
Banco Itaú Europa Luxembourg, also controlled by Itaúsa Portugaland regulated by the Central Bank of Luxembourg, - a bankwhich operates exclusively in the area of private banking -reported net profits of Eur. 1.9 million (US$1.7 millions) withan annualized return of 28.8% on stockholders' equity. Totalfunds managed by the Bank were in excess of US$796 million.
Human Resources
Payroll (fixed and variable) together with labor charges andfringe benefits amounted to R$612 million. Of this amount,spontaneous benefits were R$34 million, the most notableitem of which were contributions to the SupplementaryPension Plan provided by the Itaubanco Foundation at a totalcost in the quarter of R$7 million.
Acknowledgements
We wish to thank our stockholders and clients for the supportand trust which are indispensable for Itaú's continueddevelopment. To our employees and service suppliers, wealso wish to express our appreciation for their endeavor, whichhas enabled the Bank to achieve outstanding results inaddition to the constant improvement in our products andservices.
(Approved at the Meeting of the AdministrativeCouncil of May 2, 2001)

4
Board of Directors
Administrative Council
Chairman
Olavo Egydio Setubal
Vice Chairmen
Alfredo Egydio Arruda Villela Filho (*)
Eudoro Villela (in Memoriam)
José Carlos Moraes Abreu
Roberto Egydio Setubal
Directors
Ana Lúcia de Mattos Barretto Villela
Carlos da Câmara Pestana
Henri Penchas
Jairo Cupertino
José Vilarasau Salat (*)
Luiz Assumpção Queiroz Guimarães
Luiz de Moraes Barros
Maria de Lourdes Egydio Villela
Maurício Libanio Villela
Pérsio Arida (*)
Roberto Teixeira da Costa (*)
Sergio Silva de Freitas
Executive Board
I - Executive Committee
President and CEO
Roberto Egydio Setubal
Senior Vice Presidents
Henri Penchas
Sergio Silva de Freitas
Executive Vice Presidents
Alberto Dias de Mattos Barretto
Alfredo Egydio Setubal
Antonio Jacinto Matias
Humberto Fábio Fischer Pinotti
Milton Luís Ubach Monteiro
Renato Roberto Cuoco
Legal Advisor
Luciano da Silva Amaro
Executive Officers
Antonio Carlos Barbosa De Oliveira
João Jacó Hazarabedian
Luiz Cristiano de Lima Alves
Rodolfo Henrique Fischer
Ronald Anton de Jongh
Ruy Villela Moraes Abreu
Silvio Aparecido de Carvalho
II - Managing Directors
Senior Managing Directors
Carlos Henrique Mussolini
Cláudio Rudge Ortenblad
Marco Ambrogio Crespi Bonomi
Osvaldo do Nascimento
Paulo Roberto Soares
Managing Directors
Alberto Fernandes
Aldous Albuquerque Galletti
Alexandre de Barros
Alexandre Zákia Albert
Aluísio Paulino da Costa
Anibal Malgueiro Moreira
Antonio Carlos Morelli
Antonio Pedro da Costa
Antonio Sivaldi Roberti Filho
Arnaldo Pereira Pinto
Dieter Rudloff (*)
Edelver Carnovali
Fernando Antonio Neves Lima
Fernando de Assis Pereira
Gian Paolo Aslan
Heli de Andrade
Hitoshi Suzuki
Jackson Ricardo Gomes
Jaime Augusto Chaves
João Antonio Dantas Bezerra Leite
João Batista Videira Martins
João Costa
Joaquim Marcondes De Andrade Westin
José Antonio Lopes
José Caruso Cruz Henriques

5
Board of Directors
José Cláudio Arouca
José Geraldo Borges Ferreira
José Valério Macucci (*)
Júlio Abel de Lima Tabuaço
Luiz Antonio Fernandes Valente
Luiz Antonio Nogueira de França
Luiz Antonio Ribeiro
Luiz Antonio Rodrigues
Luiz Eduardo Zago
Luiz Fernando de Assumpção Faria
Luiz Henrique Campíglia
Manoel Antonio Granado
Marcelo Habice da Motta
Marco Antonio Antunes
Marco Antonio Monteiro Sampaio
Marcus Aurélio Mangini
Maria Cristina Lass
Maria Elizabete Vilaça Lopes
Marta Alves
Máximo Hernández González
Paschoal Pipolo Baptista
Patrick Pierre Delfosse
Pedro de Alcântara Nabuco De Abreu
Ricardo Reisen de Pinho
Ronaldo Fiorini
Vilson Gomes de Brito
Audit Committee
Sitting Members
Gustavo Jorge Laboissiere Loyola
Alberto Sozin Furuguem
Iran Siqueira Lima
Respective Substitute Members
José Marcos Konder Comparato
José Roberto Brant de Carvalho
Walter Dos Santos
Advisory Committee
Daniel Machado de Campos
Fernando de Almeida Nobre Filho
Joaquim Francisco Monteiro De Carvalho
Lício Meirelles Ferreira
Luiz Eduardo Campello
Olavo de Queiroz Guimarães Filho
International Advisory Committee
Olavo Egydio Setubal
Roberto Egydio Setubal
Alberto Dias de Mattos Barretto
Antonio Carlos Barbosa de Oliveira
Artur Eduardo Brochado dos Santos Silva (*)
Carlos da Câmara Pestana
Dieter Rampl
Henri Penchas
Isidro Fainé Casas (*)
José Carlos Moraes Abreu
Keiji Yokooji
Lorenzo David Weisman
Maria de Lourdes Egydio Villela
Renato Roberto Cuoco
Roberto Teixeira da Costa (*)
Sergio Silva De Freitas
Itaubanco Share Options Committee
Chairman
Olavo Egydio Setubal
Sitting Members
Carlos Da Câmara Pestana
José Carlos Moraes De Abreu
Roberto Egydio Setubal
Roberto Teixeira Da Costa (*)
Internal Control Committee
Chairman
Carlos Da Câmara Pestana
Sitting Members
Henri Penchas (*)
Jairo Cupertino
Luiz Assumpção Queiroz Guimarães
(*) Effected by the Shareholder' Meeting and the Board of Directors on April 23, 2001. Awaiting formed registration by the Central Bank of Brazil.
6
Consolidated Balance Sheets Three-month periods ended on March 31, 2001 and 2000(In thousands of reais)
ASSETS 03/31/2001 03/31/2000
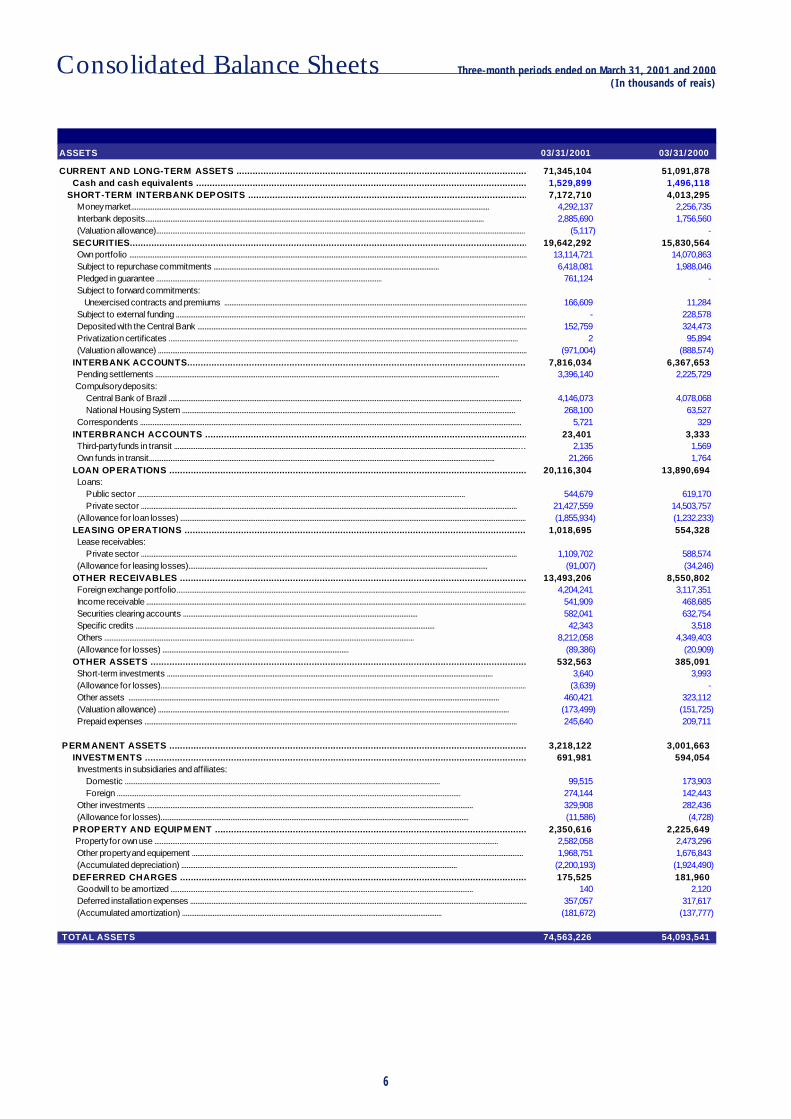
CURRENT AND LONG-TERM ASSETS ............................................................................................................ 71,345,104 51,091,878 Cash and cash equivalents ........................................................................................................................... 1,529,899 1,496,118 SHORT-TERM INTERBANK DEPOSITS ........................................................................................................ 7,172,710 4,013,295 Money market........................................................................................................................................................................................................ 4,292,137 2,256,735 Interbank deposits............................................................................................................................................................................................. 2,885,690 1,756,560 (Valuation allowance).............................................................................................................................................................................................................. (5,117) - SECURITIES.................................................................................................................................................... 19,642,292 15,830,564 Own portfolio .............................................................................................................................................................................................................................. 13,114,721 14,070,863 Subject to repurchase commitments .............................................................................................................................. 6,418,081 1,988,046 Pledged in guarantee .............................................................................................................................. 761,124 - Subject to forward commitments: Unexercised contracts and premiums ......................................................................................................................................................................... 166,609 11,284 Subject to external funding ................................................................................................................................................................................................... - 228,578 Deposited with the Central Bank ........................................................................................................................................................................................ 152,759 324,473 Privatization certificates ................................................................................................................................................................................................... 2 95,894 (Valuation allowance) .............................................................................................................................................................................................................. (971,004) (888,574) INTERBANK ACCOUNTS............................................................................................................................... 7,816,034 6,367,653 Pending settlements ................................................................................................................................................................................................ 3,396,140 2,225,729 Compulsory deposits: Central Bank of Brazil ..................................................................................................................................................................................................... 4,146,073 4,078,068 National Housing System .......................................................................................................................................................................................... 268,100 63,527 Correspondents ..................................................................................................................................................................................................................... 5,721 329 INTERBRANCH ACCOUNTS ........................................................................................................................ 23,401 3,333 Third-party funds in transit ................................................................................................................................................................................................… 2,135 1,569 Own funds in transit................................................................................................................................................................................................. 21,266 1,764 LOAN OPERATIONS ..................................................................................................................................... 20,116,304 13,890,694 Loans: Public sector ....................................................................................................................................................................................... 544,679 619,170 Private sector .................................................................................................................................................................................................................. 21,427,559 14,503,757 (Allowance for loan losses) .................................................................................................................................................................................................. (1,855,934) (1,232,233) LEASING OPERATIONS ................................................................................................................................ 1,018,695 554,328 Lease receivables: Private sector .................................................................................................................................................................................................................. 1,109,702 588,574 (Allowance for leasing losses)....................................................................................................................................................................... (91,007) (34,246) OTHER RECEIVABLES ................................................................................................................................. 13,493,206 8,550,802 Foreign exchange portfolio.................................................................................................................................................................................................... 4,204,241 3,117,351 Income receivable .................................................................................................................................................................................................................... 541,909 468,685 Securities clearing accounts ................................................................................................................................... 582,041 632,754 Specific credits ....................................................................................................................................................................... 42,343 3,518 Others ............................................................................................................................................................................. 8,212,058 4,349,403 (Allowance for losses) ........................................................................................................ (89,386) (20,909) OTHER ASSETS ............................................................................................................................................ 532,563 385,091 Short-term investments ...................................................................................................................................................................................... 3,640 3,993 (Allowance for losses)............................................................................................................................................................................................................. (3,639) - Other assets ............................................................................................................................................................................................................... 460,421 323,112 (Valuation allowance) .................................................................................................................................................................................................... (173,499) (151,725) Prepaid expenses ................................................................................................................................................................................................................ 245,640 209,711
PERM ANENT ASSETS ..................................................................................................................................... 3,218,122 3,001,663 INVESTM ENTS .............................................................................................................................................. 691,981 594,054 Investments in subsidiaries and affiliates: Domestic ................................................................................................................................................................................ 99,515 173,903 Foreign ................................................................................................................................................................................................ 274,144 142,443 Other investments ...................................................................................................................................................................................... 329,908 282,436 (Allowance for losses)............................................................................................................................................................................ (11,586) (4,728) PROPERTY AND EQUIPM ENT .................................................................................................................... 2,350,616 2,225,649 Property for own use ................................................................................................................................................................................................ 2,582,058 2,473,296 Other property and equipement ......................................................................................................................................................................................... 1,968,751 1,676,843 (Accumulated depreciation) .......................................................................................................................................................... (2,200,193) (1,924,490) DEFERRED CHARGES ................................................................................................................................. 175,525 181,960 Goodwill to be amortized ......................................................................................................................................................................... 140 2,120 Deferred installation expenses ............................................................................................................................................................................................ 357,057 317,617 (Accumulated amortization) ................................................................................................................................................. (181,672) (137,777)
TOTAL ASSETS 74,563,226 54,093,541

7
Consolidated Balance Sheets Three-month periods ended on March 31, 2001 and 2000(In thousands of reais)
LIA B ILIT IES A N D ST OC KH OLD ER S' EQUIT Y 03/ 31 / 2001 03/ 31 / 2000
C UR R EN T A N D LON G-T ER M LIA B ILIT IES ..................................................................................................... 64,714 ,650 45,527 ,219
D EP OSIT S ...................................................................................................................................................... 27,158 ,852 22,131 ,021
Demand deposits ..................................................................................................................................................................................................................... 5,875,044 4,163,950
Savings deposits ...................................................................................................................................................................................................................... 15,751,315 14,674,345
Interbank deposits ................................................................................................................................................................................................................... 354,357 16,696
Time deposits ........................................................................................................................................................................................................................... 5,178,136 3,276,030
D EP OSIT S R EC EIVED UN D ER SEC UR IT Y R EP UR C H A SE A GR EEM EN T ............................................... 10,278 ,877 4 ,289,307
Own portfo lio ............................................................................................................................................................................................................................. 6,951,280 2,425,951
Third-party portfo lio ................................................................................................................................................................................................................ 3,327,597 1,863,356
F UN D S F R OM A C C EP T A N C ES A N D ISSUE OF SEC UR IT IES .................................................................. 3 ,114,557 3 ,139,584
M ortgage notes ............................................................................................................................................................................................................... 384,961 -
Debentures............................................................................................................................................................................................................... 742,787 1,140,486
Foreign borrowings in securities ............................................................................................................................................................................. 1,986,809 1,999,098
IN T ER B A N K A C C OUN T S .............................................................................................................................. 3 ,326,220 2 ,170,674
Pending settlement .........................................................................................................................................................................… 3,208,718 2,064,035
Interbank on-lending ...................................................................................................................................................................................... 647 1,026
Correspondents ....................................................................................................................................................................................... 116,855 105,613
IN T ER B R A N C H A C C OUN T S ........................................................................................................................ 427 ,496 332 ,899
Third-party funds in transit ................................................................................................................................................................................................... 420,331 321,753
Own funds in transit ................................................................................................................................................................................................. 7,165 11,146
B OR R OWIN GS ............................................................................................................................................... 5 ,284,300 3 ,570,308
Domestic - public institutions ....................................................................................................................................… 6,498 -
Domestic - other institutions .......................................................................................................................................... 684,774 460,748
Foreign currency trade finance borrowings .................................................................................................................................................................... 4,593,028 3,109,560
ON -LEN D IN G B OR R OWIN GS F R OM P UB LIC IN ST IT UT ION S ............................................................ 3 ,276,598 1 ,899,840
Federal Development Bank - BNDES .............................................................................................................................................................................. 2,324,886 1,226,497
CEF ............................................................................................................................................................................................................................... 131,239 1
Federal Capital Goods Financing Agency - FINAM E ................................................................................................................................................ 819,848 672,535
Other institutions ....................................................................................................................................................................................................................... 625 807
F OR EIGN ON -LEN D IN G................................................................................................................................. - 161
Foreign on-lending ................................................................................................................................................................................................................ - 161
OT H ER LIA B ILIT IES ...................................................................................................................................... 11,847 ,750 7 ,993,425
Co llection of taxes and contributions .............................................................................................................................................................................. 601,636 456,771
Foreign exchange portfo lio ................................................................................................................................................................................................... 2,382,366 1,989,092
Corporate and statutory contributions ............................................................................................................................................................................ 205,127 174,200
Taxes and social security contributions .......................................................................................................................................................................... 1,198,019 817,239
Negotiation and intermediation o f securities ............................................................................................................................................................... 1,111,743 503,904
Technical provisions for insurance, pension plan and capitalization operations - restricted ................................................................... 444,531 331,980
Financial and Development Funds..................................................................................................................................................................................... - 98
Others ........................................................................................................................................................................................................................................... 5,904,328 3,720,141
T EC H N IC A L P R OVISION S F OR IN SUR A N C E, P EN SION P LA N A N D
C A P IT A LIZ A T ION OP ER A T ION S - N ON -R EST R IC T ED ................................................................................. 2 ,344,225 1 ,904,201
D EF ER R ED IN C OM E ......................................................................................................................................... 116 ,609 142 ,581
Deferred income ...................................................................................................................................................................................................................... 116,609 142,581
M IN OR IT Y IN T ER EST IN SUB SID IA R IES ....................................................................................................... 572 ,116 394 ,722
ST OC KH OLD ER S' EQUIT Y ................................................................................................................................ 6 ,815,626 6 ,124,818
Capital:
Domestic ................................................................................................................................................................................................................................. 2,423,350 1,975,208
Foreign ..................................................................................................................................................................................................................................... 576,650 524,792
Capital reserves ....................................................................................................................................................................................................................... 202,219 264,394
Revaluation reserves ............................................................................................................................................................................................................. - 12,434
Retained income ...................................................................................................................................................................................................................... 3,792,455 3,458,703
(Treasury shares)....................................................................................................................................................................................................................... (179,048) (110,713)
T OT A L LIA B ILIT IES A N D ST OC KH OLD ER S' EQUIT Y 74,563 ,226 54,093 ,541

8
Consolidated Balance Sheets Three-month periods ended on March 31, 2001 and 2000(In thousands of reais)
Consolidated Statementsof Income
Three-month periods ended on March 31, 2001 and 2000(In of thousands of reais)
01.01 to 01.01 to03.31.2001 03.31.2000
INCOME FROM FINANCIAL OPERATIONS ....................................................................................................... 3,676,492 1,614,332 Loans.................................................................................................................................................................. 1,823,039 767,978
Leases ............................................................................................................................................................... 180,993 144,576
Securities portfolio ............................................................................................................................................. 1,584,943 651,629
Foreign exchange portfolio ................................................................................................................................ 20,082 1,622
Compulsory deposits ....................................................................................................................................... 67,435 48,527
EXPENSES ON FINANCIAL OPERATIONS ......................................................................................................... (2,446,237) (663,258) Deposits, money market and interbank funds .................................................................................................... (1,615,174) (370,081)
Borrow ings and assignments and on-lendings ................................................................................................. (454,925) (26,622)
Leases ............................................................................................................................................................... (141,856) (115,967)
Provision for loan losses ...................................................................................... (234,282) (150,588)
GROSS PROFIT FROM FINANCIAL OPERATIONS ........................................................................................... 1,230,255 951,074
OTHER FINANCIAL INCOME (EXPENSES) ........................................................................................................ (448,382) (410,056) Banking service fees ......................................................................................................................................... 982,466 801,635
Capitalization, insurance and pension plan premiums ....................................................................................... 624,770 465,884
Expenses on Technical provisions for insurance, pension plan and capitalization operations ........................ (196,557) (103,480)
Insurance Claims ................................................................................................................................................ (199,699) (181,952)
Selling expenses ................................................................................................................................................ (43,182) (50,260)
Pension plan benefit expenses .......................................................................................................................... (53,618) (41,796)
Salaries and benefits to employees ................................................................................................................... (612,390) (516,626)
Other administrative expenses ....................................................................................................................... (789,282) (636,007)
Tax expenses .................................................................................................................................................... (152,616) (141,141)
Equity in income of subsidiaries and aff iliates ........................................................................................... 9,596 11,525
Other operating income ............................................................................................................... 167,646 88,489
Other operating expenses ................................................................................................................ (185,516) (106,327)
OPERATING INCOME ......................................................................................................................................... 781,873 541,018
NON-OPERATING INCOME ................................................................................................................................ 36,043 10,053
INCOME BEFORE INCOME TAX AND SOCIAL CONTRIBUTION AND PROFIT SHARING .................................................................................................................................................... 817,916 551,071
INCOME TAX AND SOCIAL CONTRIBUTION Due on operations for the period .........................................................................................… (163,118) (163,311)
Deferred related to temporary additions ..................................................................................... 86,459 3,864
EXTRAORDINARY RESULTS (Note 15) ........................................................................................................... (25,454) -
PROFIT SHARING ............................................................................................................................................... Employees ...................................................................................................................................................... (53,854) (23,150)
Directors - Statutories ..................................................................................................................................... (6,597) (5,381)
MINORITY INTEREST .................................................................................................................................… (30,139) 2,182
NET INCOME ..................................................................................................................................................... 625,213 365,275
NUMBER OF OUTSTANDING SHARES ............................................................................................................. 113,484,949,140 117,844,337,341 NET INCOME PER THOUSAND SHARES - R$ .............................................................................................. 5.51 3.10 STOCKHOLDERS' EQUITY PER THOUSAND SHARES - R$ ................................................................ 60.06 51.97
RECURRING NET INCOME ...................................................................................... 650,667 365,275
EXTRAORDINARY RESULT ......................................................................................... (25,454)
TOTAL - parent + company 625,213 365,275

9
Notes to the ConsolidatedFinancial Statements
Three-month periods ended on March 31, 2001 and 2000(In thousands of reais)
The financial statements of Banco Itaú S.A. and its subsidiaries(ITAÚ CONSOLIDATED) have been prepared in accordance withaccounting policies derived from the Brazilian Corporate Lawand instructions issued by the Brazilian Securities andExchange Commission (CVM) and the Central Bank of Brazil(BACEN), which include the use of estimates necessary tocalculate accounting provisions.
The consolidated financial statements have been presentedwithout the classification of balances between current andlong-term amounts, consistent with the presentation withthe comparable period.
Management considers the current risk based capital ratio(13.4% based on economic-financial consolidated) to beadequate, considering that:
a) It is higher than the minimum required by authorities(11%);
b) This rate increases to 14.7%, when all of the tax credits ofBANESTADO are recorded in the financial statements basis(ITAÚ) used to establish limits;
c) This ratio would increase to 17.8% after considering theremaining realization values of assets (Note 13 b) and theprovision in excess to the minimum requirements and thetax credits not recorded.
Note 1 - Presentation of the Financial Statements
For comparison purposes, the notes to the financialstatements include information on ITAÚ CONSOLIDATED "withBANESTADO" and "without BANESTADO", with the lattercomparable with the balances at March 31, 2000.
The main indicators at March 31, 2001 obtained from thenon-consolidated financial statements (the initial basis fordetermination of the financial system consolidated amountsand pro forma economic-financial consolidated amounts),according to current legislation are as follows:
(1) In accordance with Note 1 II(2) In accordance with Note 1 III
Financial system Economic-financial
amounts (1) amounts (1)
Stockholders’ equity (2) 7,906,912 7,835,628
Risk based capital ratio 14.4 13.4
Fixed asset ratio 66.5 47.7
Excess capital in relation to f ixed assets 272,776 1,742,778

10
Notes to the ConsolidatedFinancial Statements
Three-month periods ended on March 31, 2001 and 2000(In thousands of reais)
Evolution of Basle rate
(1) In accordance with Note 1 II.(2) In accordance with Note 1 III.(3) In effect as from July 2000.(4) Because of the increased volatility of the interest rate market.
I- Risk based capital ratio (Basle ratio)
At March 31, 2001, the risk based capital ratio was 14.4%(20.8% at March 31, 2000) based on the Financial SystemConsolidated financial statements and 13.4%, based onEconomic-Financial Consolidated financial statementamounts.
The effects resulting from the changes during the last fourquarters, due to changes in the legislation or variation inthe balances are shown below:
Economic-financial consolidated (1) (3)
Referential Weighted Referential Weighted
equity (2) asset Effect equity (2) asset Effect
Rate of March 2000 6,511,659 31,310,707 20.8%
Calculation of interest rate risk (117,152) - -0.4%Quarterly results 427,217 - 1.4%Interest on ow n capital (187,040) - -0.6%Increase in foreign exchange exposure (172,047) - -0.5%Other increases (reductions) in referential equity (1,089) - 0.0%Increase in w eighted tax credit from 200% to 250% - 1,006,305 -0.6%Increase in w eighted asset - 590,830 -0.4%
Rate of June 2000 6,461,548 32,907,842 19.6%
Quarterly results 470,775 - 1.4%Interest on ow n capital (127,947) - -0.4%Increase in foreign exchange exposure 128,841 - 0.4%Other increases (reductions) in referential equity (2,150) - 0.0%Increase in w eighted asset - 1,397,276 -0.9%
Rate of September 2000 6,931,067 34,305,118 20.2% 6,854,989 37,360,184 18.3%
Quarterly results 627,234 - 1.8% 655,085 - 1.8%Interest on ow n capital (175,160) - -0.5% (175,160) - -0.5%Increase in foreign exchange exposure (122,873) - -0.4% (122,873) - -0.3%Purchase of treasury shares (454,842) - -1.3% (454,842) - -1.2%Other increases (reductions) in referential equity 36,619 - 0.1% 18,580 - 0.0%Increase in w eighted tax credit from 250% to 300% - 956,182 -0.5% - 1,107,819 -0.5%Increase in w eighted asset - 8,381,560 -3.7% - 8,652,424 -3.2%
Rate of December 2000 6,842,045 43,642,860 15.7% 6,775,779 47,120,427 14.4%
Quarterly results 602,880 - 1.4% 613,726 - 1.3%Interest on ow n capital (163,369) - -0.4% (163,369) - -0.4%Increase in interest rate risk (4) (252,404) - -0.6% (252,404) - -0.5%Reduction in foreign exchange exposure (5) 297,013 - 0.7% 297,013 - 0.6%Purchase of treasury shares (288,297) - -0.7% (288,297) - -0.6%Other increase (reductions) in referential equity (6,642) - 0.0% (22,462) - 0.0%Increase in w eighted asset - 5,107,794 -1.7% - 4,972,872 -1.4%
Rate of March 2001 7,031,266 48,750,654 14.4% 6,959,986 52,093,299 13.4%
Financial system consolidated (1)
11
Notes to the ConsolidatedFinancial Statements
Three-month periods ended on March 31, 2001 and 2000(In thousands of reais)
II - Resolution Nº2.723/2000
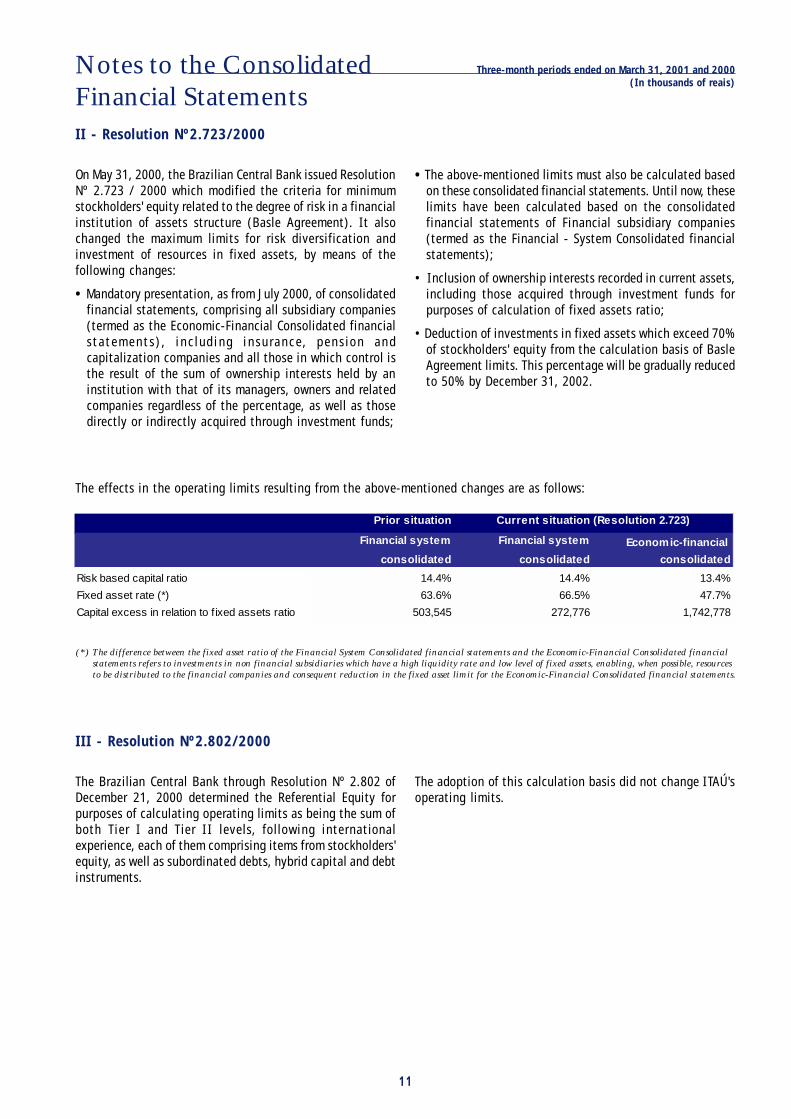
On May 31, 2000, the Brazilian Central Bank issued ResolutionNº 2.723 / 2000 which modified the criteria for minimumstockholders' equity related to the degree of risk in a financialinstitution of assets structure (Basle Agreement). It alsochanged the maximum limits for risk diversification andinvestment of resources in fixed assets, by means of thefollowing changes:
• Mandatory presentation, as from July 2000, of consolidatedfinancial statements, comprising all subsidiary companies(termed as the Economic-Financial Consolidated financialstatements), including insurance, pension andcapitalization companies and all those in which control isthe result of the sum of ownership interests held by aninstitution with that of its managers, owners and relatedcompanies regardless of the percentage, as well as thosedirectly or indirectly acquired through investment funds;
The effects in the operating limits resulting from the above-mentioned changes are as follows:
• The above-mentioned limits must also be calculated basedon these consolidated financial statements. Until now, theselimits have been calculated based on the consolidatedfinancial statements of Financial subsidiary companies(termed as the Financial - System Consolidated financialstatements);
• Inclusion of ownership interests recorded in current assets,including those acquired through investment funds forpurposes of calculation of fixed assets ratio;
• Deduction of investments in fixed assets which exceed 70%of stockholders' equity from the calculation basis of BasleAgreement limits. This percentage will be gradually reducedto 50% by December 31, 2002.
III - Resolution Nº2.802/2000
The Brazilian Central Bank through Resolution Nº 2.802 ofDecember 21, 2000 determined the Referential Equity forpurposes of calculating operating limits as being the sum ofboth Tier I and Tier II levels, following internationalexperience, each of them comprising items from stockholders'equity, as well as subordinated debts, hybrid capital and debtinstruments.
The adoption of this calculation basis did not change ITAÚ'soperating limits.
(*) The difference between the fixed asset ratio of the Financial System Consolidated financial statements and the Economic-Financial Consolidated financialstatements refers to investments in non financial subsidiaries which have a high liquidity rate and low level of fixed assets, enabling, when possible, resourcesto be distributed to the financial companies and consequent reduction in the fixed asset limit for the Economic-Financial Consolidated financial statements.
Prior situation
Financial system Financial system Economic-financial
consolidated consolidated consolidated
Risk based capital ratio 14.4% 14.4% 13.4%
Fixed asset rate (*) 63.6% 66.5% 47.7%
Capital excess in relation to f ixed assets ratio 503,545 272,776 1,742,778
Current situation (Resolution 2.723)
12
Notes to the ConsolidatedFinancial Statements
Three-month periods ended on March 31, 2001 and 2000(In thousands of reais)
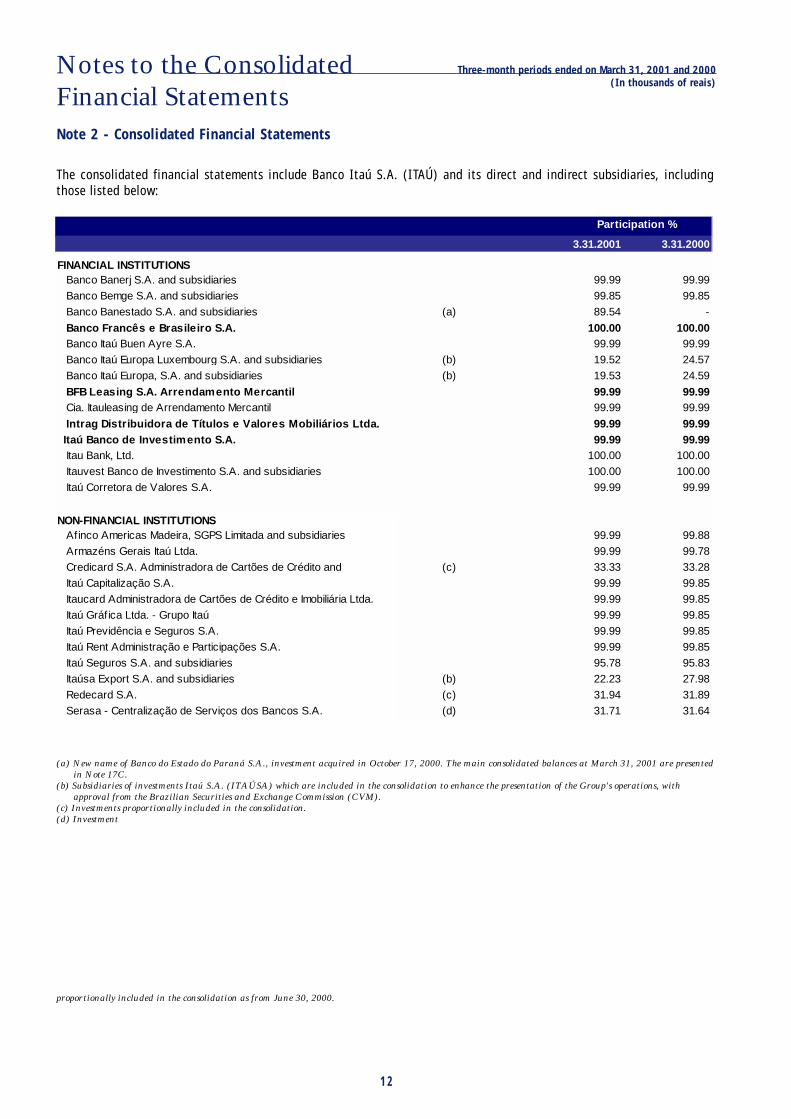
The consolidated financial statements include Banco Itaú S.A. (ITAÚ) and its direct and indirect subsidiaries, includingthose listed below:
Note 2 - Consolidated Financial Statements
(a) New name of Banco do Estado do Paraná S.A., investment acquired in October 17, 2000. The main consolidated balances at March 31, 2001 are presentedin Note 17C.
(b) Subsidiaries of investments Itaú S.A. (ITAÚSA) which are included in the consolidation to enhance the presentation of the Group's operations, withapproval from the Brazilian Securities and Exchange Commission (CVM).
(c) Investments proportionally included in the consolidation.(d) Investment
proportionally included in the consolidation as from June 30, 2000.
3.31.2001 3.31.2000
FINANCIAL INSTITUTIONS Banco Banerj S.A. and subsidiaries 99.99 99.99
Banco Bemge S.A. and subsidiaries 99.85 99.85
Banco Banestado S.A. and subsidiaries (a) 89.54 -
Banco Francês e Brasileiro S.A. 100.00 100.00 Banco Itaú Buen Ayre S.A. 99.99 99.99
Banco Itaú Europa Luxembourg S.A. and subsidiaries (b) 19.52 24.57
Banco Itaú Europa, S.A. and subsidiaries (b) 19.53 24.59
BFB Leasing S.A. Arrendamento Mercantil 99.99 99.99 Cia. Itauleasing de Arrendamento Mercantil 99.99 99.99
Intrag Distribuidora de Títulos e Valores Mobiliários Ltda. 99.99 99.99 Itaú Banco de Investimento S.A. 99.99 99.99 Itau Bank, Ltd. 100.00 100.00
Itauvest Banco de Investimento S.A. and subsidiaries 100.00 100.00
Itaú Corretora de Valores S.A. 99.99 99.99
NON-FINANCIAL INSTITUTIONS Afinco Americas Madeira, SGPS Limitada and subsidiaries 99.99 99.88
Armazéns Gerais Itaú Ltda. 99.99 99.78
Credicard S.A. Administradora de Cartões de Crédito and (c) 33.33 33.28
Itaú Capitalização S.A. 99.99 99.85
Itaucard Administradora de Cartões de Crédito e Imobiliária Ltda. 99.99 99.85
Itaú Gráf ica Ltda. - Grupo Itaú 99.99 99.85
Itaú Previdência e Seguros S.A. 99.99 99.85
Itaú Rent Administração e Participações S.A. 99.99 99.85
Itaú Seguros S.A. and subsidiaries 95.78 95.83
Itaúsa Export S.A. and subsidiaries (b) 22.23 27.98
Redecard S.A. (c) 31.94 31.89
Serasa - Centralização de Serviços dos Bancos S.A. (d) 31.71 31.64
Participation %

13
Notes to the ConsolidatedFinancial Statements
Three-month periods ended on March 31, 2001 and 2000(In thousands of reais)
a) Basis of consolidation - All material intercompany profits,transactions and balances have been eliminated onconsolidation.
The difference between Itaú and Itaú Consolidated in netincome and Shareholders' Equity results from the effectson the differing policies for the amortization of goodwillon acquisitions, the recognition of deferred tax assetsand the elimination of unrealized results of a transactionsanong group companies, together with correspondingdeferred taxation effects.
b) Interbank funds applied, loans, discounted tradereceivables, financing, remunerated deposits, fundsobtained in the open market and other receivablesand payables - Transactions subject to monetarycorrection or foreign exchange rates are recorded at presentvalue, calculated "pro rata die" based on the variation ofcontracted index. Real estate loans are adjusted to presentvalue of future installments. Transactions withpredetermined remuneration rates are recorded at theirredemption value, adjusted for any unearned income/expenses.
Note 3 - Summary of Significant Accounting Policies
c) Securities - These are recorded at restated cost andadjusted by a provision to reflect its market value, whenthis is lower.
d) Allowance for loan losses - The balance of the allowancefor loan losses was constituted based on an analysis ofthe credit risk in the loan portfolio, in amounts consideredsufficient to cover loan losses.
e) Investments - In subsidiary and associated companies,investments are using the equity method. The financialstatements of foreign branches and subsidiaries, includedin ITAÚ CONSOLIDATED, are adapted to comply withBrazilian accounting policies and converted into reais.Other investments are recorded at cost, restated up toDecember 31, 1995.
f) Fixed assets - These are stated at cost of acquisition orconstruction, less accumulated depreciation, restated upto December 31, 1995. For insurance operations, privatepension and capitalization, property and equipment areadjusted to market value supported by appraisal reports.Depreciation is calculated using the straight line method,based on monetarily corrected cost at the following annualrates:
g) Deferred expenses - Deferred organization and expansionexpenses represent improvements in third party propertiesand are amortized on a straight line over the respectiverental periods, and acquisition and development of logisticare amortized on a straight line basis over five years.
h) Income tax and social contribution, PIS and COFINSThe provisions were calculated according to the currentlegislation at the rates shown below.
(*) Period from May 1, 1999 to January 31, 2000 calculated at the rate of4%. As from February 1, 2000 up to December 31, 2002 the rate wasreduced to 1%.
Amounts subject to litigation have been fully provided.
%
Buildings in use 4
Installations, furnishings, equipment and security and communication systems 10 to 25
EDP systems 20 to 50
Income tax 15.00%
Additional income tax 10.00%
Social contribution 8.00%
Additional social contribution (*) 1.00%
PIS 0.65%
COFINS 3.00%
14
Notes to the ConsolidatedFinancial Statements
Three-month periods ended on March 31, 2001 and 2000(In thousands of reais)
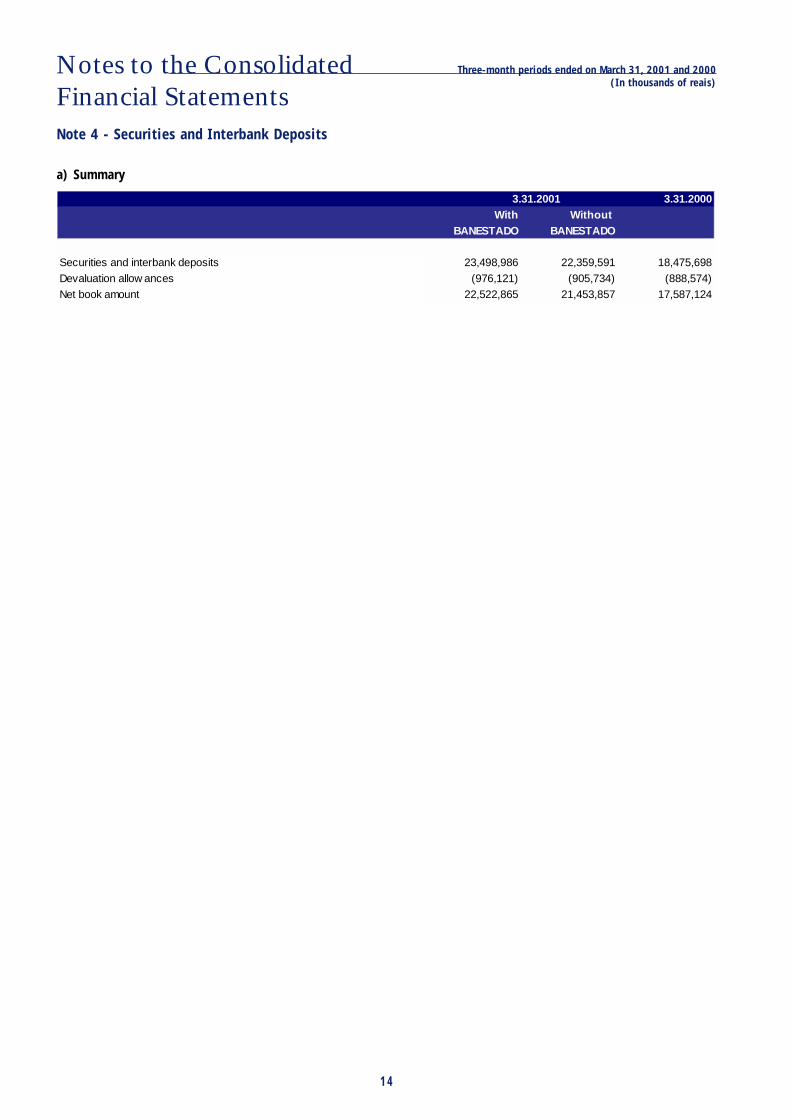
a) Summary
Note 4 - Securities and Interbank Deposits
3.31.2001 3.31.2000With Without
BANESTADO BANESTADO
Securities and interbank deposits 23,498,986 22,359,591 18,475,698
Devaluation allow ances (976,121) (905,734) (888,574)
Net book amount 22,522,865 21,453,857 17,587,124
15
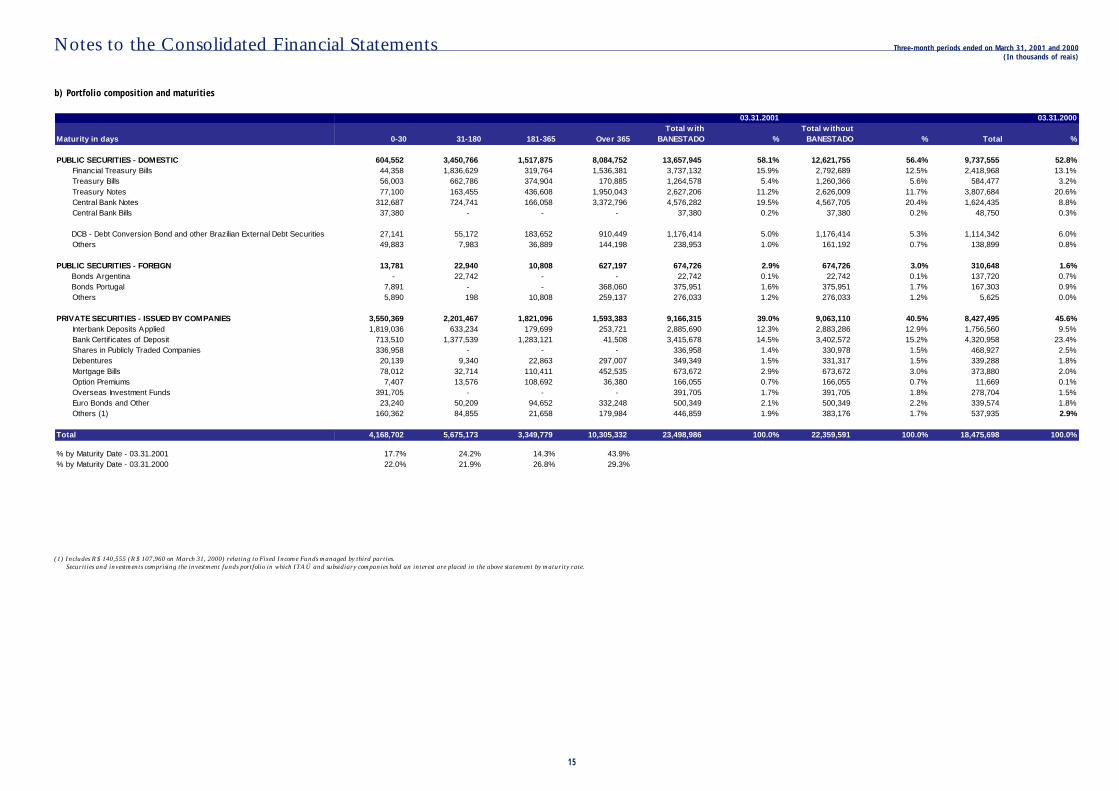
b) Portfolio composition and maturities
Notes to the Consolidated Financial Statements
(1) Includes R$ 140,555 (R$ 107,960 on March 31, 2000) relating to Fixed Income Funds managed by third parties.Securities and investments comprising the investment funds portfolio in which ITAÚ and subsidiary companies hold an interest are placed in the above statement by maturity rate.
Maturity in days
PUBLIC SECURITIES - DOMESTIC Financial Treasury Bills Treasury Bills Treasury Notes Central Bank Notes Central Bank Bills
DCB - Debt Conversion Bond and other Brazilian External Debt Securities Others
PUBLIC SECURITIES - FOREIGN Bonds Argentina Bonds Portugal Others
PRIVATE SECURITIES - ISSUED BY COMPANIES Interbank Deposits Applied Bank Certif icates of Deposit Shares in Publicly Traded Companies Debentures Mortgage Bills Option Premiums Overseas Investment Funds Euro Bonds and Other Others (1)
Total
% by Maturity Date - 03.31.2001% by Maturity Date - 03.31.2000
Total w ith Total w ithout0-30 31-180 181-365 Over 365 BANESTADO % BANESTADO % Total %
604,552 3,450,766 1,517,875 8,084,752 13,657,945 58.1% 12,621,755 56.4% 9,737,555 52.8%44,358 1,836,629 319,764 1,536,381 3,737,132 15.9% 2,792,689 12.5% 2,418,968 13.1%56,003 662,786 374,904 170,885 1,264,578 5.4% 1,260,366 5.6% 584,477 3.2%77,100 163,455 436,608 1,950,043 2,627,206 11.2% 2,626,009 11.7% 3,807,684 20.6%
312,687 724,741 166,058 3,372,796 4,576,282 19.5% 4,567,705 20.4% 1,624,435 8.8%37,380 - - - 37,380 0.2% 37,380 0.2% 48,750 0.3%
27,141 55,172 183,652 910,449 1,176,414 5.0% 1,176,414 5.3% 1,114,342 6.0%49,883 7,983 36,889 144,198 238,953 1.0% 161,192 0.7% 138,899 0.8%
13,781 22,940 10,808 627,197 674,726 2.9% 674,726 3.0% 310,648 1.6%- 22,742 - - 22,742 0.1% 22,742 0.1% 137,720 0.7%
7,891 - - 368,060 375,951 1.6% 375,951 1.7% 167,303 0.9%5,890 198 10,808 259,137 276,033 1.2% 276,033 1.2% 5,625 0.0%
3,550,369 2,201,467 1,821,096 1,593,383 9,166,315 39.0% 9,063,110 40.5% 8,427,495 45.6%1,819,036 633,234 179,699 253,721 2,885,690 12.3% 2,883,286 12.9% 1,756,560 9.5%
713,510 1,377,539 1,283,121 41,508 3,415,678 14.5% 3,402,572 15.2% 4,320,958 23.4%336,958 - - - 336,958 1.4% 330,978 1.5% 468,927 2.5%20,139 9,340 22,863 297,007 349,349 1.5% 331,317 1.5% 339,288 1.8%78,012 32,714 110,411 452,535 673,672 2.9% 673,672 3.0% 373,880 2.0%7,407 13,576 108,692 36,380 166,055 0.7% 166,055 0.7% 11,669 0.1%
391,705 - - - 391,705 1.7% 391,705 1.8% 278,704 1.5%23,240 50,209 94,652 332,248 500,349 2.1% 500,349 2.2% 339,574 1.8%
160,362 84,855 21,658 179,984 446,859 1.9% 383,176 1.7% 537,935 2.9%
4,168,702 5,675,173 3,349,779 10,305,332 23,498,986 100.0% 22,359,591 100.0% 18,475,698 100.0%
17.7% 24.2% 14.3% 43.9%22.0% 21.9% 26.8% 29.3%
03.31.2001 03.31.2000
Three-month periods ended on March 31, 2001 and 2000(In thousands of reais)

Notes to the ConsolidatedFinancial Statements
Three-month periods ended on March 31, 2001 and 2000(In thousands of reais)
16
c) Changes in the valuation allowance for securities
Note 5 - Loan and Lease Portfolio
a) Summary
(1) Includes honored endorsements and sureties, receivables from advances, commissions from co-obligations receivable, debtors on purchase of assets andreceivables.
(2) Recorded in other liabilities.(3) Recorded in memorandum accounts.
(*) Additional allowance was recorded to cover risks of future price fluctuation.
With Without
BANESTADO BANESTADO
Balance at December 31, 1999 902,301 902,301Write-offs (13,727) (13,727)
Reversal (11,695) (11,695)
Losses on sales (2,032) (2,032)
Balance at March 31, 2000 888,574 888,574 Minimum allow ance required 142,674 142,674
Additional allow ance (*) 745,900 745,900
Balance at December 31, 2000 972,774 905,247Increase 6,565 3,703
Write-offs (3,218) (3,216)
Reversal (2,083) (2,081)
Loss on sales (1,135) (1,135)
Balance at March 31, 2001 976,121 905,734 Minimum allow ance required 321,121 250,734
Additional allow ance (*) 655,000 655,000
03.31.2000
With Without
BANESTADO BANESTADO Loan operations 21,972,238 20,717,601 15,122,927
Leasing operations 1,109,702 1,080,992 588,574
Other receivables (1) 685,650 141,392 168,491
Advances on exchange contracts (2) 1,739,754 1,734,487 1,512,988
Total 25,507,344 23,674,472 17,392,980
Endorsements and sureties (3) 4,423,856 4,406,682 2,847,560
Total w ith endorsements and sureties 29,931,200 28,081,154 20,240,540
03.31.2001
Notes to the ConsolidatedFinancial Statements
Three-month periods ended on March 31, 2001 and 2000(In thousands of reais)
17
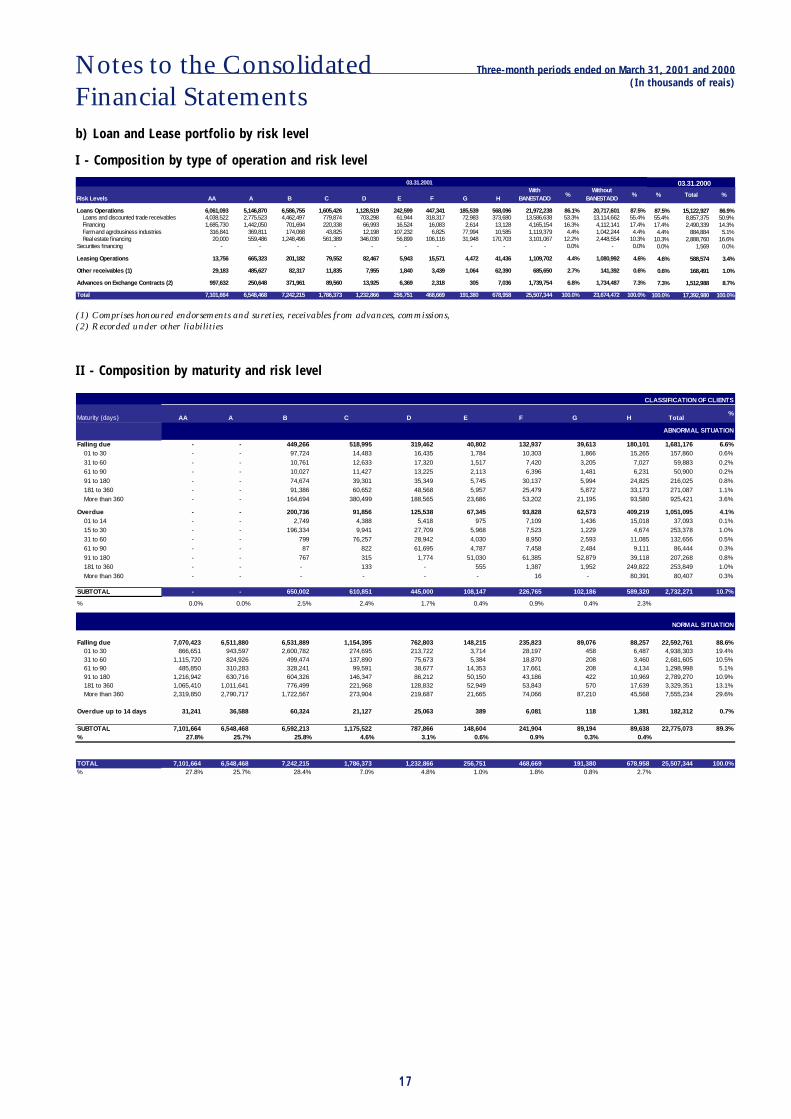
I - Composition by type of operation and risk level
(1) Comprises honoured endorsements and sureties, receivables from advances, commissions,(2) Recorded under other liabilities
b) Loan and Lease portfolio by risk level
II - Composition by maturity and risk level
03.31.2001 03.31.2000
Maturity (days) AA A B C D E F G H Total%
Falling due - - 449,266 518,995 319,462 40,802 132,937 39,613 180,101 1,681,176 6.6%01 to 30 - - 97,724 14,483 16,435 1,784 10,303 1,866 15,265 157,860 0.6%
31 to 60 - - 10,761 12,633 17,320 1,517 7,420 3,205 7,027 59,883 0.2%61 to 90 - - 10,027 11,427 13,225 2,113 6,396 1,481 6,231 50,900 0.2%
91 to 180 - - 74,674 39,301 35,349 5,745 30,137 5,994 24,825 216,025 0.8%181 to 360 - - 91,386 60,652 48,568 5,957 25,479 5,872 33,173 271,087 1.1%More than 360 - - 164,694 380,499 188,565 23,686 53,202 21,195 93,580 925,421 3.6%
Overdue - - 200,736 91,856 125,538 67,345 93,828 62,573 409,219 1,051,095 4.1%01 to 14 - - 2,749 4,388 5,418 975 7,109 1,436 15,018 37,093 0.1%15 to 30 - - 196,334 9,941 27,709 5,968 7,523 1,229 4,674 253,378 1.0%
31 to 60 - - 799 76,257 28,942 4,030 8,950 2,593 11,085 132,656 0.5%61 to 90 - - 87 822 61,695 4,787 7,458 2,484 9,111 86,444 0.3%
91 to 180 - - 767 315 1,774 51,030 61,385 52,879 39,118 207,268 0.8%181 to 360 - - - 133 - 555 1,387 1,952 249,822 253,849 1.0%
More than 360 - - - - - - 16 - 80,391 80,407 0.3%
SUBTOTAL - - 650,002 610,851 445,000 108,147 226,765 102,186 589,320 2,732,271 10.7%
% 0.0% 0.0% 2.5% 2.4% 1.7% 0.4% 0.9% 0.4% 2.3%
Falling due 7,070,423 6,511,880 6,531,889 1,154,395 762,803 148,215 235,823 89,076 88,257 22,592,761 88.6%01 to 30 866,651 943,597 2,600,782 274,695 213,722 3,714 28,197 458 6,487 4,938,303 19.4%31 to 60 1,115,720 824,926 499,474 137,890 75,673 5,384 18,870 208 3,460 2,681,605 10.5%61 to 90 485,850 310,283 328,241 99,591 38,677 14,353 17,661 208 4,134 1,298,998 5.1%91 to 180 1,216,942 630,716 604,326 146,347 86,212 50,150 43,186 422 10,969 2,789,270 10.9%181 to 360 1,065,410 1,011,641 776,499 221,968 128,832 52,949 53,843 570 17,639 3,329,351 13.1%More than 360 2,319,850 2,790,717 1,722,567 273,904 219,687 21,665 74,066 87,210 45,568 7,555,234 29.6%
Overdue up to 14 days 31,241 36,588 60,324 21,127 25,063 389 6,081 118 1,381 182,312 0.7%
SUBTOTAL 7,101,664 6,548,468 6,592,213 1,175,522 787,866 148,604 241,904 89,194 89,638 22,775,073 89.3%% 27.8% 25.7% 25.8% 4.6% 3.1% 0.6% 0.9% 0.3% 0.4%
TOTAL 7,101,664 6,548,468 7,242,215 1,786,373 1,232,866 256,751 468,669 191,380 678,958 25,507,344 100.0%% 27.8% 25.7% 28.4% 7.0% 4.8% 1.0% 1.8% 0.8% 2.7%
CLASSIFICATION OF CLIENTS
NORMAL SITUATION
ABNORMAL SITUATION
Risk Levels AA A B C D E F G HWith
BANESTADO%
Without BANESTADO
%
Loans Operations 6,061,093 5,146,870 6,586,755 1,605,426 1,128,519 242,599 447,341 185,539 568,096 21,972,238 86.1% 20,717,601 87.5% Loans and discounted trade receivables 4,038,522 2,775,523 4,462,497 779,874 703,298 61,944 318,317 72,983 373,680 13,586,638 53.3% 13,114,662 55.4% Financing 1,685,730 1,442,050 701,694 220,338 66,993 16,524 16,083 2,614 13,128 4,165,154 16.3% 4,112,141 17.4% Farm and agrobusiness industries 316,841 369,811 174,068 43,825 12,198 107,232 6,825 77,994 10,585 1,119,379 4.4% 1,042,244 4.4% Real estate financing 20,000 559,486 1,248,496 561,389 346,030 56,899 106,116 31,948 170,703 3,101,067 12.2% 2,448,554 10.3%Securities financing - - - - - - - - - - 0.0% - 0.0%
Leasing Operations 13,756 665,323 201,182 79,552 82,467 5,943 15,571 4,472 41,436 1,109,702 4.4% 1,080,992 4.6%
Other receivables (1) 29,183 485,627 82,317 11,835 7,955 1,840 3,439 1,064 62,390 685,650 2.7% 141,392 0.6%
Advances on Exchange Contracts (2) 997,632 250,648 371,961 89,560 13,925 6,369 2,318 305 7,036 1,739,754 6.8% 1,734,487 7.3%
Total 7,101,664 6,548,468 7,242,215 1,786,373 1,232,866 256,751 468,669 191,380 678,958 25,507,344 100.0% 23,674,472 100.0%
03.31.2001
% Total %
87.5% 15,122,927 86.9%55.4% 8,857,375 50.9%17.4% 2,490,339 14.3%4.4% 884,884 5.1%
10.3% 2,888,760 16.6%0.0% 1,569 0.0%
4.6% 588,574 3.4%
0.6% 168,491 1.0%
7.3% 1,512,988 8.7%
100.0% 17,392,980 100.0%

Notes to the ConsolidatedFinancial Statements
Three-month periods ended on March 31, 2001 and 2000(In thousands of reais)
18
c) Composition by Business Sector
With BANESTADO %
Without BANESTADO % Sectors %
PUBLIC SECTOR 1,012,813 4.0% 516,254 2.2% 658,782 3.8% INDUSTRY 1,012,813 4.0% 516,254 2.2% 658,782 3.8% Chemical and Petrochemical 491,420 1.9% 491,420 2.1% 658,325 3.8% Other 521,393 2.0% 24,834 0.1% 457 0.0%PRIVATE SECTOR 24,494,531 96.0% 23,158,218 97.8% 16,734,198 96.2% INDUSTRY 6,248,384 24.5% 6,183,919 26.1% 4,899,589 28.2% Steel, Metallurgy and Heavy Industry 1,064,487 4.2% 1,058,363 4.5% 861,091 5.0% Chemical and Petrochemical 1,110,782 4.4% 1,107,692 4.7% 778,873 4.5% Food and Beverages 1,066,407 4.2% 1,053,827 4.5% 1,011,415 5.8% Paper and Pulp 573,329 2.2% 568,350 2.4% 487,818 2.8% Light and Heavy Vehicles 371,499 1.5% 371,421 1.6% 274,673 1.6% Electrical and Eletronic 496,087 1.9% 493,944 2.1% 298,617 1.7% Textiles and Clothing 236,500 0.9% 229,760 1.0% 176,178 1.0% Autoparts and Accessories 118,832 0.5% 117,766 0.5% 108,907 0.6% Fertilizers, Insecticides and Crop Protection 245,767 1.0% 239,850 1.0% 198,669 1.1% Pharmaceuticals 49,894 0.2% 49,738 0.2% 90,951 0.5% Other 914,800 3.6% 893,208 3.8% 612,397 3.5% COMMERCE 1,635,385 6.4% 1,579,920 6.7% 870,749 5.0% SERVICES 5,120,335 20.1% 4,937,883 20.9% 3,087,641 17.8% Financial 632,475 2.5% 629,871 2.7% 771,907 4.4% Telecommunications 1,774,070 7.0% 1,773,664 7.5% 632,028 3.6% Public Services Concessionaires 637,252 2.5% 636,853 2.7% 395,584 2.3% Holding and Service Companies 990,707 3.9% 952,917 4.0% 378,691 2.2% Civil Construction 285,746 1.1% 214,133 0.9% 400,949 2.3% Contractors and Real Estate Agents 265,035 1.0% 237,237 1.0% 174,931 1.0% Transportation 137,899 0.5% 124,308 0.5% 89,989 0.5% Others 397,151 1.6% 368,900 1.6% 243,562 1.4% PRIMARY SECTOR 865,958 3.4% 859,530 3.6% 656,847 3.8% Farming and Livestock 436,343 1.7% 431,243 1.8% 348,505 2.0% Mining 429,615 1.7% 428,287 1.8% 308,342 1.8% OTHER - INDIVIDUALS 10,225,137 40.1% 9,228,815 39.0% 6,923,345 39.8% Credit Cards 2,006,812 7.9% 1,974,819 8.3% 1,441,690 8.3% Real estate f inancings 2,815,321 11.0% 2,234,421 9.4% 2,487,811 14.3% Consumer Loans/Vehicles/Overdraft 5,403,004 21.2% 5,019,575 21.2% 2,993,844 17.2% OTHER - CORPORATE ENTITIES 399,332 1.6% 368,151 1.6% 296,027 1.7%
TOTAL 25,507,344 100.0% 23,674,472 100.0% 17,392,980 100.0%
03.31.2001 03.31.2000

Notes to the ConsolidatedFinancial Statements
Three-month periods ended on March 31, 2001 and 2000(In thousands of reais)
19
d) Concentration of credit (*)
(*) Amounts include endorsements and sureties.
e) Allowance for loan losses
The allowance for loan losses complies with the rulesdetermined by BACEN Resolution No. 2.682 of December 21,1999, among which are:
• Provisions are recorded from the date of the loandisbursements, based on periodic analysis of the qualityof the client/loan and not just in the event of default;
I- Changes in the allowance for loan losses
• Based exclusively on delinquency, write-offs can be made360 days after the due date of the credit or 720 days foroperations that mature after a period of 36 months. Otherfactors related to analysis of the quality of the client/loanmay generate write-offs before these periods, however,never before 180 days of the due date.
At March 31, 2001, the balance of the allowance was equivalent to 8.0% of the loan portfolio in ITAÚ CONSOLIDATED withBANESTADO and 7.4% in ITAÚ CONSOLIDATED without BANESTADO (7.4% at March 31, 2000).
(1) For operations for which installments are overdue more than 14 days, with renegotiations made or under the responsibility of companies in the process of debtrehabilitation or bankruptcy.
(2) For operations not covered by the previous item due to the classification of the client or the operation.(3) Refers to the provision in excess of the minimum requirement, recorded based on the conservative criteria adopted by management, in accordance with good
banking practice, in order to cover any unexpected losses resulting from oscillations in the credit risks quantified based on historic data considering marketvolatility and economic casis situations.
Risk w ith % of Total Risk w ithout % of Total Risk % of Total
BANESTADO BANESTADO
Largest debtor 658,831 2.2% 658,831 2.3% 695,469 3.4%
20 largest debtors 6,803,122 22.7% 6,488,693 23.1% 4,128,400 20.4%
50 largest debtors 9,993,303 33.4% 9,599,681 34.2% 6,398,700 31.6%
100 largest debtors 12,532,042 41.9% 12,088,821 43.0% 8,279,648 40.9%
03.31.2001 03.31.2000
With Without
BANESTADO BANESTADO
Balance at December 31, 1999 1,253,371 1,253,371
Increase in the period 150,588 150,588
Write-offs (116,571) (116,571)
Balance at March 31, 2000 1,287,388 1,287,388
Specif ic allow ance (1) 321,599 321,599
Generic allow ance (2) 341,162 341,162
Excess allow ance (3) 624,627 624,627
Specif ic allow ance (1) 929,374 647,517
Generic allow ance (2) 501,101 430,632
Excess allow ance (3) 602,616 602,616
Balance at December 31, 2000 2,033,091 1,680,765
Increase in the period 234,282 209,432
Write-offs (231,046) (126,654)
Balance at March 31, 2001 2,036,327 1,763,543
Specif ic allow ance (1) 876,003 669,930
Generic allow ance (2) 530,324 463,613
Excess allow ance (3) 630,000 630,000

20
Three-month periods ended march 31, 2001 and 2000(In of thousands of reais)
Notes to the Consolidated Financial Statements
II- Allowance for Loan Losses by Risk Levels at December 31, 2000
(1) Operations in abnormal situation are considered to be those with installments overdue for more than 14 days, assumed by or theresponsibility of companies undergoing debt rehabilitation or in process of bankruptcy.
(2) At Bacen's request, the provision was allocated to make explicit, in each risk level, the exceeding amounts quantified using thestatistical models so as to evaluate the "stressed" portfolios in the market.
Risk Levels % Minimum Normal Situation
Provision RequiredFalling Due
Operations and Installments
Overdue Installments
Subtotal Falling Due Operations
AA 0.0% - - - 6,407,430 6,407,430 A 0.5% - - - 5,526,513 5,526,513 B 1.0% 138,158 183,732 321,890 6,636,677 6,958,567 C 3.0% 362,586 90,691 453,277 1,282,482 1,735,759 D 10.0% 334,381 109,319 443,700 1,003,212 1,446,912 E 30.0% 47,987 63,355 111,342 163,169 274,511 F 50.0% 211,548 93,628 305,176 119,513 424,689 G 70.0% 36,088 55,712 91,800 100,535 192,335 H 100.0% 172,887 445,050 617,937 89,224 707,161
Total 1,303,635 1,041,487 2,345,122 21,328,755 23,673,877
Portfolio Balance
Abnormal Situation (1)
Total Falling Due Overdue Subtotal
Excess Allow ance (2)
Existing Allowance
- - - - - - - - - - 27,633 27,633 20,509 48,142 1,381 1,837 3,218 66,366 69,584 124,817 194,401 10,878 2,720 13,598 38,474 52,072 91,315 143,387 33,438 10,932 44,370 100,321 144,691 231,355 376,046 14,396 19,007 33,403 48,951 82,354 45,851 128,205 105,774 46,814 152,588 59,757 212,345 59,282 271,627 25,262 38,998 64,260 70,375 134,635 29,487 164,122 172,887 445,050 617,937 89,224 707,161 - 707,161 364,016 565,358 929,374 501,101 1,430,475 602,616 2,033,091
Total Allowance BACEN Resolution 2682/1999
Specific
Total Generic
Risk Levels % Minimum Normal Situation
Provision RequiredFalling Due
Operations and Installments
Overdue Installments
Subtotal Falling Due Operations
AA 0.0% - - - 6,316,369 6,316,369 A 0.5% - - - 4,839,339 4,839,339 B 1.0% 113,717 181,555 295,272 6,416,823 6,712,095 C 3.0% 316,573 82,330 398,903 1,007,603 1,406,506 D 10.0% 144,797 91,184 235,981 980,160 1,216,141 E 30.0% 37,203 60,521 97,724 137,707 235,431 F 50.0% 158,716 77,461 236,177 81,137 317,314 G 70.0% 25,398 50,436 75,834 99,941 175,775 H 100.0% 91,020 317,490 408,510 62,183 470,693
Total 887,424 860,977 1,748,401 19,941,262 21,689,663
Total
Portfolio Balance
Abnormal Situation (1)
Falling Due Overdue Subtotal
Excess Allow ance (2)
Existing Allowance
- - - - - - - - - - 24,197 24,197 20,509 44,706 1,137 1,816 2,953 64,168 67,121 127,817 191,938 9,497 2,470 11,967 30,228 42,195 91,315 133,510 14,480 9,118 23,598 98,016 121,614 231,355 352,969 11,161 18,156 29,317 41,312 70,629 4,585 116,480 79,358 38,730 118,088 40,569 158,657 59,282 217,939 17,779 35,305 53,084 69,959 123,043 29,487 152,530 91,020 317,490 408,510 62,183 470,693 - 470,693 224,432 423,085 647,517 430,632 1,078,149 602,616 1,680,765
Specific
Generic Total
Total Allowance BACEN Resolution 2682/1999

21
III- Alowance for Loan Losses by Risk Levels
(1) Operations in abnormal situation are considered to be those with installments overdue for more than 14 days, assumed by or theresponsibility of companies undergoing debt rehabilitation or in process of bankruptcy.
(2) At Bacen's request, the provision was allocated to make explicit, in each risk level, the exceeding amounts quantified using thestatistical models so as to evaluate the "stressed" portfolios in the market.
Risk % Minimum Normal Situation
At levels Allowance
RequiredFalling Due
Operations and installments
Overdue installments
Subtotal Falling Due Operations
03.31.2000
AA 0.0% - - - 7,101,664 7,101,664 4,906,983 A 0.5% - - - 6,548,468 6,548,468 6,021,657 B 1.0% 449,266 200,736 650,002 6,592,213 7,242,215 3,506,932 C 3.0% 518,995 91,856 610,851 1,175,522 1,786,373 1,530,268 D 10.0% 319,462 125,538 445,000 787,866 1,232,866 723,475 E 30.0% 40,802 67,345 108,147 148,604 256,751 90,347 F 50.0% 132,937 93,828 226,765 241,904 468,669 298,218 G 70.0% 39,613 62,573 102,186 89,194 191,380 39,920 H 100.0% 180,101 409,219 589,320 89,638 678,958 275,180
Total 1,681,176 1,051,095 2,732,271 22,775,073 25,507,344 17,392,980
At 03.31.2001
Portfolio balance
Abnormal Situation (1)
Total
Exceeding 03.31.2001 03.31.2000
Specific At 03.31.2000 At 03.31.2000
Falling Due Overdue Subtotal Generic TotalExces Allowance
(2) Existing
Allowance Existing
Allowance
- - - - - 12,732 12,732 184,090 - 12,732.00 - - - - 32,742 32,742 24,620 57,362 59,614 121,090 145,710 207,341 4,492 2,007 6,499 65,922 72,421 129,315 201,736 104,857 340,322 469,637 316,884 15,570 2,756 18,326 35,266 53,592 98,087 151,679 152,874 57,611 155,698 104,558 31,946 12,554 44,500 78,787 123,287 201,866 325,153 216,970 76,434 278,300 145,956 12,241 20,204 32,445 44,581 77,026 43,658 120,684 45,164 7,385 51,043 34,326 66,469 46,914 113,383 120,952 234,335 67,412 301,747 208,723 20,730 88,142 169,644 27,729 43,801 71,530 62,436 133,966 52,310 186,276 39,916 6,428 58,738 33,499 180,101 409,219 589,320 89,638 678,958 - 678,958 275,180 - - 275,180 338,548 537,455 876,003 530,324 1,406,327 630,000 2,036,327 1,287,388 630,000 1,260,000 1,287,388
Total Allowance Minimum Required
At 03.31.2001
Notes to the Consolidated Financial Statements Three-month periods ended on March 31, 2001 and 2000(In thousands of reais)
Exceeding 03.31.2001 03.31.2000
Specific At 03.31.2000 At 03.31.2000
Falling Due Overdue Subtotal Generic TotalExces Allowance
(2) Existing
Allowance Existing
Allowance
- - - - - 12,732 12,732 184,090 - 12,732 - - - - 28,927 28,927 24,620 53,547 59,614 121,090 145,710 207,341 3,780 1,993 5,773 64,346 70,119 129,315 199,434 104,857 340,322 469,637 316,884 9,130 2,653 11,783 33,831 45,614 98,087 143,701 152,874 57,611 155,698 104,558 21,597 11,735 33,332 74,835 108,167 201,866 310,033 216,970 76,434 278,300 145,956 9,482 19,395 28,877 38,394 67,271 43,658 110,929 45,164 7,385 51,043 34,326 43,390 41,331 84,721 98,270 182,991 67,412 250,403 208,723 20,730 88,142 169,644 20,542 41,019 61,561 62,249 123,810 52,310 176,120 39,916 6,428 58,738 33,499 119,176 324,707 443,883 62,761 506,644 - 506,644 275,180 - - 275,180 227,097 442,833 669,930 463,613 1,133,543 630,000 1,763,543 1,287,388 630,000 1,260,000 1,287,388
Total Allowance Minimum Required
At 03.31.2001
Risk % Minimum Normal Situation
At levels Allowance
RequiredFalling Due
Operations and installments
Overdue installments
Subtotal Falling Due Operations
03.31.2000
AA 0.0% - - - 7,001,466 7,001,466 4,906,983 A 0.5% - - - 5,785,300 5,785,300 6,021,657 B 1.0% 378,005 199,285 577,290 6,434,562 7,011,852 3,506,932 C 3.0% 304,341 88,417 392,758 1,127,685 1,520,443 1,530,268 D 10.0% 215,965 117,355 333,320 748,353 1,081,673 723,475 E 30.0% 31,608 64,649 96,257 127,981 224,238 90,347 F 50.0% 86,779 82,663 169,442 196,541 365,983 298,218 G 70.0% 29,346 58,599 87,945 88,928 176,873 39,920 H 100.0% 119,176 324,707 443,883 62,761 506,644 275,180
Total 1,165,220 935,675 2,100,895 21,573,577 23,674,472 17,392,980
At 03.31.2001
Portfolio balance
Abnormal Situation (1)
Total
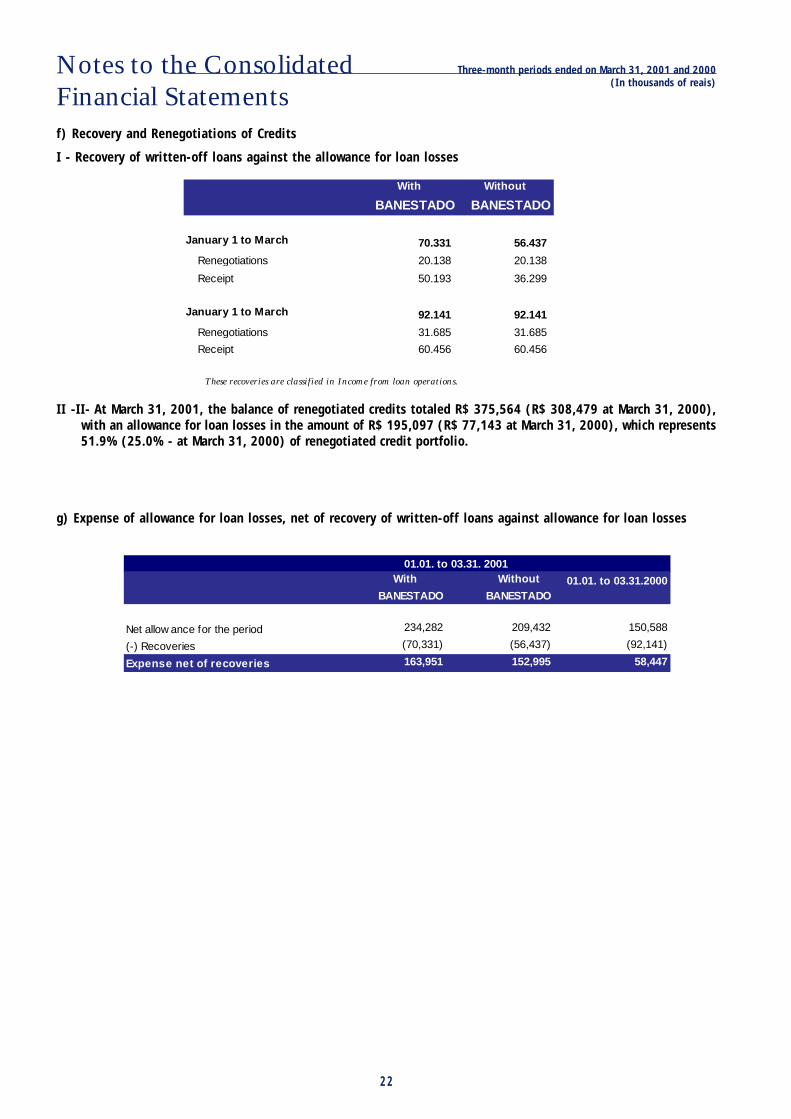
Notes to the ConsolidatedFinancial Statements
Three-month periods ended on March 31, 2001 and 2000(In thousands of reais)
22
f) Recovery and Renegotiations of Credits
I - Recovery of written-off loans against the allowance for loan losses
II -II- At March 31, 2001, the balance of renegotiated credits totaled R$ 375,564 (R$ 308,479 at March 31, 2000),with an allowance for loan losses in the amount of R$ 195,097 (R$ 77,143 at March 31, 2000), which represents51.9% (25.0% - at March 31, 2000) of renegotiated credit portfolio.
g) Expense of allowance for loan losses, net of recovery of written-off loans against allowance for loan losses
These recoveries are classified in Income from loan operations.
With Without
BANESTADO BANESTADO
January 1 to March 70.331 56.437
Renegotiations 20.138 20.138
Receipt 50.193 36.299
January 1 to March 92.141 92.141
Renegotiations 31.685 31.685
Receipt 60.456 60.456
With Without 01.01. to 03.31.2000BANESTADO BANESTADO
Net allow ance for the period 234,282 209,432 150,588
(-) Recoveries (70,331) (56,437) (92,141)
Expense net of recoveries 163,951 152,995 58,447
01.01. to 03.31. 2001

Notes to the ConsolidatedFinancial Statements
Three-month periods ended on March 31, 2001 and 2000(In thousands of reais)
23
Note 6 - Investments - Composition
(1) At March 31, 2000, includes investments in Duraflora S.A., which was sold on June 29, 2000, in União Car-bide do Brasil S.A., sold on December 28,2000, and in SERASA, which has been proportionally consolidated as from June 30, 2000.
(2) Participation increased from 12.5% to 15.0%.
03.31.2001 03.31.2000
Investments in subsidiaries and affiliated - Domestic 99,515 173,903AGF BRASIL SEGUROS S.A. 98,600 77,196
Other (1) 915 96,707
Investments in subsidiaries and affiliated - Foreign 274,144 142,443BPI - SGPS S.A. (BPI) (2) 270,147 142,443
Other 3,997 -
Other investments 329,908 282,436Tax incentive investments 236,106 217,978
Equity securities 18,017 17,977
Shares and quotas 46,681 26,419
Other 29,104 20,062

24
Note 7 – Deposits and funding - composition by maturity
a) Deposits
b) Money market funds
Notes to the Consolidated Financial Statements
M a t u r i t y in d a y s 0 - 3 0 3 1 - 1 8 0 1 8 1 - 3 6 5 O v e r 3 6 5T o t a l w i t h
B A N ES T A D O %T o t a l w i t h o u t
B A N ES T A D O % T o t a l %
D e m a n d d e p o s its 5 ,8 7 5 ,0 4 4 - - - 5 ,8 7 5 ,0 4 4 2 1 .6 % 5 ,2 1 9 ,0 4 9 2 0 .7 % 4 ,1 6 3 ,9 5 0 1 8 .8 % S a v in g s a c c o u n ts 1 5 ,7 3 1 ,7 7 5 1 9 ,5 4 0 - - 1 5 ,7 5 1 ,3 1 5 5 8 .0 % 1 4 ,3 3 8 ,3 4 7 5 6 .9 % 1 4 ,6 7 4 ,3 4 5 6 6 .3 % In te r b a n k 2 0 5 ,2 0 4 1 2 9 ,1 4 7 1 9 ,1 1 4 8 9 2 3 5 4 ,3 5 7 1 .3 % 1 ,5 0 8 ,5 6 7 6 .0 % 1 6 ,6 9 6 0 .1 % T im e d e p o s its 2 ,6 7 7 ,7 6 6 1 ,9 9 2 ,0 0 0 3 8 5 ,9 5 0 1 2 2 ,4 2 0 5 ,1 7 8 ,1 3 6 1 9 .1 % 4 ,1 3 3 ,7 4 7 1 6 .4 % 3 ,2 7 6 ,0 3 0 1 4 .8 %T O T A L 2 4 ,4 8 9 ,7 8 9 2 ,1 4 0 ,6 8 7 4 0 5 ,0 6 4 1 2 3 ,3 1 2 2 7 ,1 5 8 ,8 5 2 1 0 0 .0 % 2 5 ,1 9 9 ,7 1 0 1 0 0 .0 % 2 2 ,1 3 1 ,0 2 1 1 0 0 .0 %% b y m a tu r ity d a te 0 3 .3 1 .2 0 0 1 9 0 .2 % 7 .9 % 1 .5 % 0 .5 % 0 3 .3 1 .2 0 0 0 9 1 .4 % 7 .2 % 1 .3 % 0 .1 %
0 3 .3 1 .2 0 0 00 3 .3 1 .2 0 0 1
M a t u r i t y in D a y s 0 - 3 0 3 1 - 1 8 0 1 8 1 - 3 6 5 O v e r 3 6 5T o t a l w i t h
B A N ES T A D O% o f t o t a l p o r t f o l io
T o t a l w i t h o u t B A N ES T A D O
% o f t o t a l p o r t f o l io T o t a l
% o f t o t a l p o r t f o l io
F in a n c ia l in s t itu t io n s 1 ,0 8 8 ,4 5 0 4 1 5 ,6 6 5 2 6 5 ,6 0 5 6 6 4 ,1 4 8 2 ,4 3 3 ,8 6 8 2 3 .7 % 2 ,2 2 9 ,4 5 6 2 2 .1 % 1 ,8 1 0 ,8 2 4 4 2 .2 % N o n f in a n c ia l c o m p a n ie s 1 ,8 8 4 ,5 9 6 4 ,8 1 5 ,9 4 1 4 7 7 ,8 7 5 6 3 1 ,4 2 0 7 ,8 0 9 ,8 3 2 7 6 .0 % 7 ,7 8 1 ,3 8 6 7 7 .5 % 2 ,4 7 7 ,1 1 5 5 7 .8 % In d iv id u a ls - - 1 ,9 6 0 3 3 ,2 1 7 3 5 ,1 7 7 0 .3 % 3 5 ,1 7 7 0 .4 % 1 ,3 6 8 0 .0 %
T O T A L 2 ,9 7 3 ,0 4 6 5 ,2 3 1 ,6 0 6 7 4 5 ,4 4 0 1 ,3 2 8 ,7 8 5 1 0 ,2 7 8 ,8 7 7 1 0 0 .0 % 1 0 ,0 4 6 ,0 1 9 1 0 0 .0 % 4 ,2 8 9 ,3 0 7 1 0 0 .0 %
% b y m a tu r ity d a te 0 3 .3 1 .2 0 0 1 2 8 .9 % 5 0 .9 % 7 .3 % 1 2 .9 % 0 3 .3 1 .2 0 0 0 6 0 .9 % 3 .4 % 2 0 .9 % 1 4 .8 %
0 3 .3 1 .2 0 0 00 3 .3 1 .2 0 0 1
Three-month periods ended on March 31, 2001 and 2000(In thousands of reais)

Notes to the ConsolidatedFinancial Statements
Three-month periods ended on March 31, 2001 and 2000(In thousands of reais)
25
Note 8 - Foreign Exchange Portfolio
c) Foreign Borrowings in Securities
03.31.2001 03.31.2000
With Without BANESTADO BANESTADO
ASSETS - OTHER RECEIVABLES 4,204,241 4,337,201 3,117,351
Exchange purchase pending settlement 3,163,476 3,239,969 2,300,321
Foreign currency bills exchange and term documents 25,628 25,627 20,484
Exchange sales right 1,136,519 1,192,684 1,140,461
(-) Local currency advances received (155,809) (154,330) (371,706)
Income receivable on advances granted 34,427 33,251 27,791
LIABILITIES - OTHER LIABILITIES 2,382,366 2,520,473 1,989,092
Exchange sales pending settlement 1,134,326 1,191,035 1,138,468
Exchange purchase obligations 2,981,307 3,059,794 2,349,244
(-) Advances on exchange contracts (1,739,754) (1,734,487) (1,512,988)
Other 6,487 4,131 14,368
MEMORANDUM ACCOUNTS 134,781 133,938 60,749
Import credits outstanding 109,370 108,527 23,803
Confirmed export credits 25,411 25,411 36,946
Maturity in days0-30 31-180 181-365 Over 365 Total % Total %
Non-Trade Related 6,412 33,372 175,713 350,257 779,444 39.2% 761,833 38.1%
Issued in Brazil 6,412 33,372 175,713 158,592 587,779 29.6% 721,961 36.1%Commercial Paper 1,143 24,360 175,713 122,478 323,694 16.3% 271,333 13.6%Fixed Rate Notes 5,269 9,012 - 249,804 264,085 13.3% 450,628 22.5%
Issued abroad - - - 191,665 191,665 9.6% 39,872 2.0%Commercial Paper - - - - - 0.0% 39,872 2.0%Fixed Rate Notes - - - 191,665 191,665 9.6% - 0.0%
Trade Related 25,439 479,406 432,320 270,200 1,207,365 60.8% 1,237,265 61.9%
Issued abroad 25,439 479,406 432,320 270,200 1,207,365 60.8% 1,237,265 61.9%Euronotes - 318,955 432,320 270,200 1,021,475 51.4% 1,122,197 56.1%Bankers Acceptance 25,439 160,451 - - 185,890 9.4% 114,531 5.7%Fixed Rate Notes - - - - - 0.0% 537 0.0%
TOTAL 31,851 512,778 608,033 834,147 1,986,809 100.0% 1,999,098 100.0%
% by maturity date 03.31.2001 1.6% 25.8% 30.6% 42.0% 03.31.2000 23.0% 21.9% 33.7% 21.4%
03.31.2001 03.31.2000

Notes to the ConsolidatedFinancial Statements
Three-month periods ended on March 31, 2001 and 2000(In thousands of reais)
26
Note 9 - Income tax and social contribution
a) Income tax and social contribution due on operations for the period are shown below:
b) The composition of accounting adjustments, which refer to temporary additions to deferred income tax and socialcontribution is shown below:
(*) In accordance with Note 3 h.
01.01 to 03.31.2001
01.01 to 03.31.2000
Net incom e before tax and social contribution 817,916 551,071
Taxes payable (Incom e tax and social contribution) at rates of 25% and 9% (*) respectively (278,092) (187,364)
Increases /Decreases in incom e tax and social contribution payable as the result of:
Perm anent (Inclusions) Exclusions 152,894 43,816
Equity in income of subsidiaries and af f iliates 3,263 3,918
Non-deductible expenses and provisions 95,189 (6,950)
Interest on capital 54,442 46,848
Tem porary (Inclusions) Exclusions (30,517) (8,348)
Allow ance for loan losses (16,020) 19,084
Labor provisions, tax contingencies and other expenses (14,497) (27,432)
Other adjustm ents: (7,403) (11,415)
Income tax of foreign branches and subsidiaries (7,403) (11,415)
Incom e tax and social contribution from operations of the year (163,118) (163,311)
Withholding tax on distribution of interest on capital (24,505) (20,793)
Total incom e tax and social contribution (187,623) (184,104)
01.01 to 03.31.2001
01.01 to 03.31.2000
Incom e tax and social contribution related to tem porary adjustm ents 86,459 3,864
Tax credits:
Increase (reversal) over temporary inclusions/exclusions 17,874 3,508
Increase (reversal) over tax loss carryforw ard 53,229 10,537
Increase (reversal) over initial balance of tax loss carryforw ard/w rite-of fs and other (15,356) (10,181)
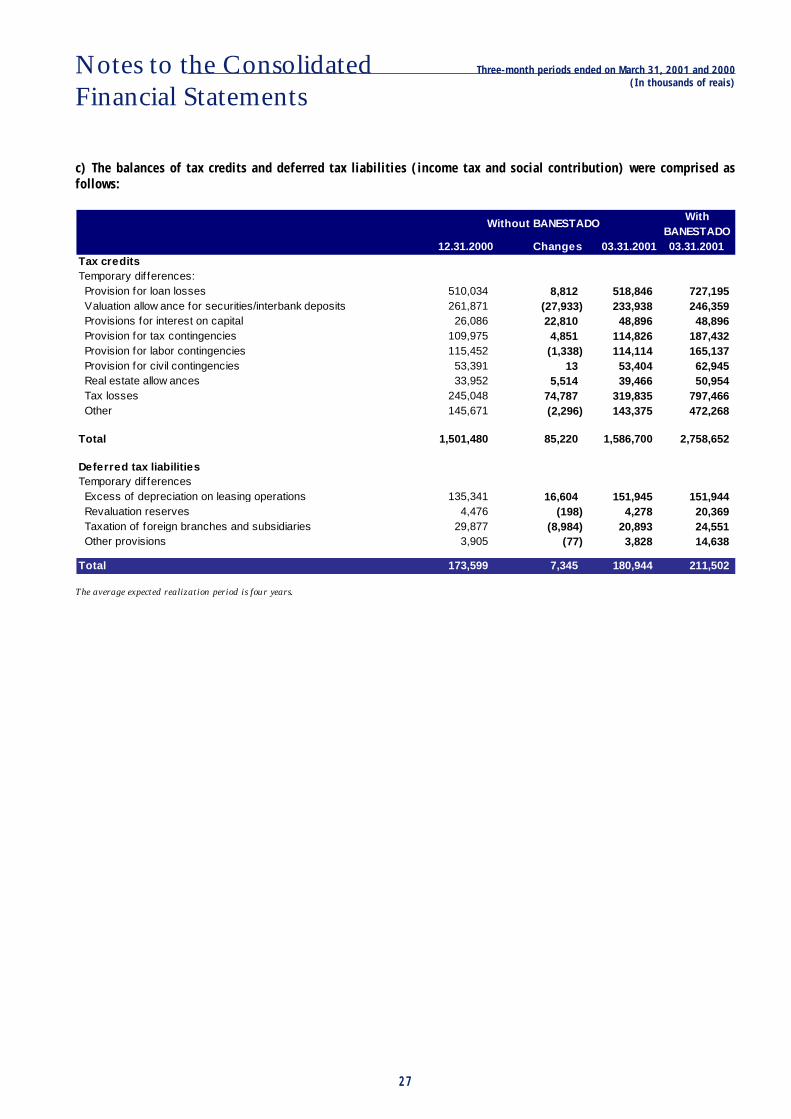
Notes to the ConsolidatedFinancial Statements
Three-month periods ended on March 31, 2001 and 2000(In thousands of reais)
27
c) The balances of tax credits and deferred tax liabilities (income tax and social contribution) were comprised asfollows:
The average expected realization period is four years.
Without BANESTADOWith
BANESTADO12.31.2000 Changes 03.31.2001 03.31.2001
Tax creditsTemporary dif ferences:
510,034 8,812 518,846 727,195 261,871 (27,933) 233,938 246,359 26,086 22,810 48,896 48,896 109,975 4,851 114,826 187,432 115,452 (1,338) 114,114 165,137 53,391 13 53,404 62,945 33,952 5,514 39,466 50,954 245,048 74,787 319,835 797,466 145,671 (2,296) 143,375 472,268
Total 1,501,480 85,220 1,586,700 2,758,652
Deferred tax liabilities
135,341 16,604 151,945 151,944 4,476 (198) 4,278 20,369 29,877 (8,984) 20,893 24,551 3,905 (77) 3,828 14,638
Total 173,599 7,345 180,944 211,502
Excess of depreciation on leasing operations Revaluation reserves
Provision for civil contingencies Real estate allow ances Tax losses
Other provisions
Provision for loan losses Valuation allow ance for securities/interbank deposits
Other
Temporary dif ferences
Provision for labor contingencies
Provisions for interest on capital Provision for tax contingencies
Taxation of foreign branches and subsidiaries
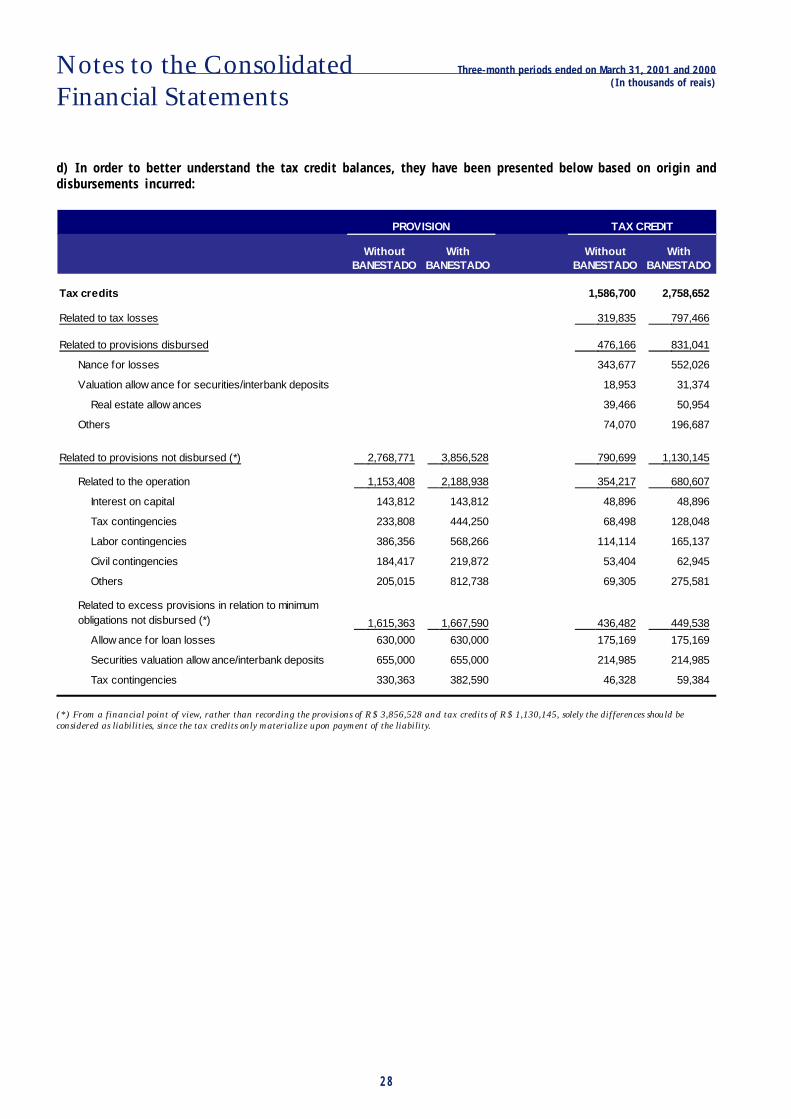
Notes to the ConsolidatedFinancial Statements
Three-month periods ended on March 31, 2001 and 2000(In thousands of reais)
28
d) In order to better understand the tax credit balances, they have been presented below based on origin anddisbursements incurred:
(*) From a financial point of view, rather than recording the provisions of R$ 3,856,528 and tax credits of R$ 1,130,145, solely the differences should beconsidered as liabilities, since the tax credits only materialize upon payment of the liability.
Without With Without WithBANESTADO BANESTADO BANESTADO BANESTADO
Tax credits 1,586,700 2,758,652
319,835 797,466
476,166 831,041
Nance for losses 343,677 552,026
Valuation allow ance for securities/interbank deposits 18,953 31,374
Real estate allow ances 39,466 50,954
Others 74,070 196,687
Related to provisions not disbursed (*) 2,768,771 3,856,528 790,699 1,130,145
Related to the operation 1,153,408 2,188,938 354,217 680,607
Interest on capital 143,812 143,812 48,896 48,896
Tax contingencies 233,808 444,250 68,498 128,048
Labor contingencies 386,356 568,266 114,114 165,137
Civil contingencies 184,417 219,872 53,404 62,945
Others 205,015 812,738 69,305 275,581
1,615,363 1,667,590 436,482 449,538
Allow ance for loan losses 630,000 630,000 175,169 175,169
Securities valuation allow ance/interbank deposits 655,000 655,000 214,985 214,985
Tax contingencies 330,363 382,590 46,328 59,384
Related to tax losses
Related to provisions disbursed
Related to excess provisions in relation to minimum obligations not disbursed (*)
TAX CREDITPROVISION
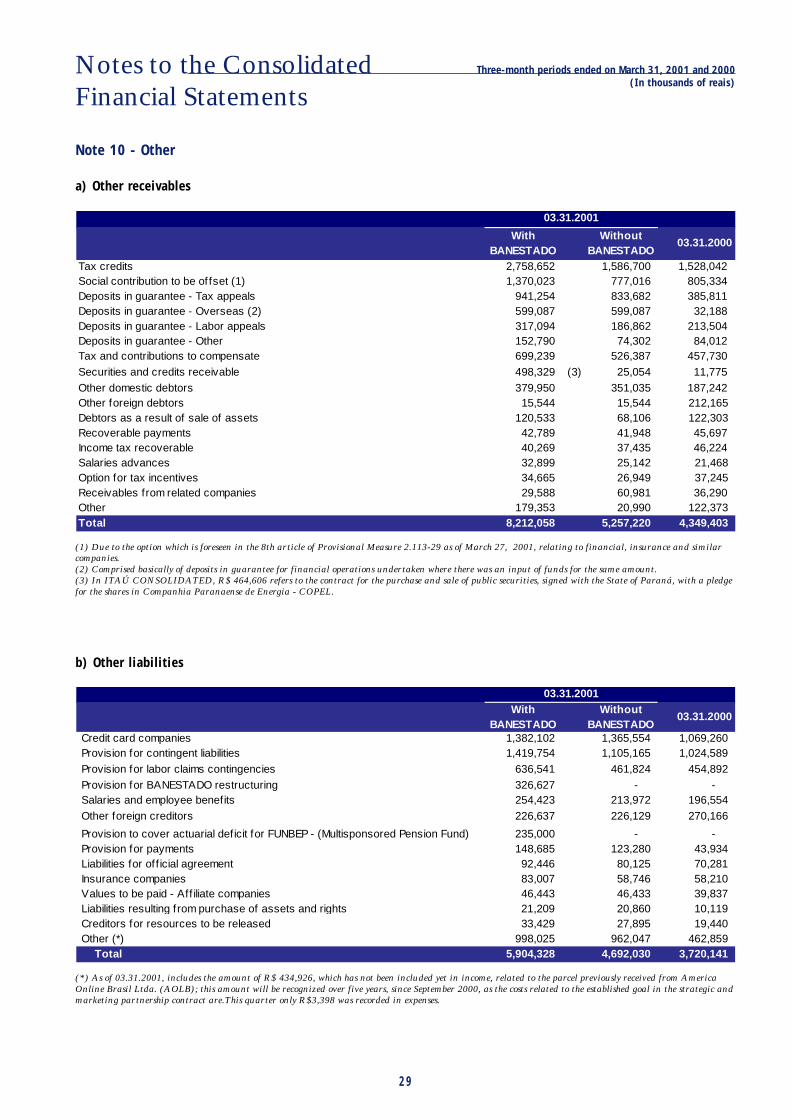
Notes to the ConsolidatedFinancial Statements
Three-month periods ended on March 31, 2001 and 2000(In thousands of reais)
29
Note 10 - Other
a) Other receivables
b) Other liabilities
(1) Due to the option which is foreseen in the 8th article of Provisional Measure 2.113-29 as of March 27, 2001, relating to financial, insurance and similarcompanies.(2) Comprised basically of deposits in guarantee for financial operations undertaken where there was an input of funds for the same amount.(3) In ITAÚ CONSOLIDATED, R$ 464,606 refers to the contract for the purchase and sale of public securities, signed with the State of Paraná, with a pledgefor the shares in Companhia Paranaense de Energia - COPEL.
(*) As of 03.31.2001, includes the amount of R$ 434,926, which has not been included yet in income, related to the parcel previously received from AmericaOnline Brasil Ltda. (AOLB); this amount will be recognized over five years, since September 2000, as the costs related to the established goal in the strategic andmarketing partnership contract are.This quarter only R$3,398 was recorded in expenses.
With BANESTADO
Without BANESTADO
03.31.2000
Tax credits 2,758,652 1,586,700 1,528,042 Social contribution to be of fset (1) 1,370,023 777,016 805,334 Deposits in guarantee - Tax appeals 941,254 833,682 385,811 Deposits in guarantee - Overseas (2) 599,087 599,087 32,188 Deposits in guarantee - Labor appeals 317,094 186,862 213,504 Deposits in guarantee - Other 152,790 74,302 84,012 Tax and contributions to compensate 699,239 526,387 457,730
Securities and credits receivable 498,329 (3) 25,054 11,775
Other domestic debtors 379,950 351,035 187,242 Other foreign debtors 15,544 15,544 212,165 Debtors as a result of sale of assets 120,533 68,106 122,303 Recoverable payments 42,789 41,948 45,697 Income tax recoverable 40,269 37,435 46,224 Salaries advances 32,899 25,142 21,468 Option for tax incentives 34,665 26,949 37,245 Receivables from related companies 29,588 60,981 36,290 Other 179,353 20,990 122,373 Total 8,212,058 5,257,220 4,349,403
03.31.2001
With BANESTADO
Without BANESTADO
03.31.2000
Credit card companies 1,382,102 1,365,554 1,069,260 Provision for contingent liabilities 1,419,754 1,105,165 1,024,589
Provision for labor claims contingencies 636,541 461,824 454,892
Provision for BANESTADO restructuring 326,627 - - Salaries and employee benefits 254,423 213,972 196,554
Other foreign creditors 226,637 226,129 270,166
235,000 - - Provision for payments 148,685 123,280 43,934 Liabilities for of f icial agreement 92,446 80,125 70,281 Insurance companies 83,007 58,746 58,210 Values to be paid - Aff iliate companies 46,443 46,433 39,837 Liabilities resulting from purchase of assets and rights 21,209 20,860 10,119 Creditors for resources to be released 33,429 27,895 19,440 Other (*) 998,025 962,047 462,859
Total 5,904,328 4,692,030 3,720,141
03.31.2001
Provision to cover actuarial deficit for FUNBEP - (Multisponsored Pension Fund)
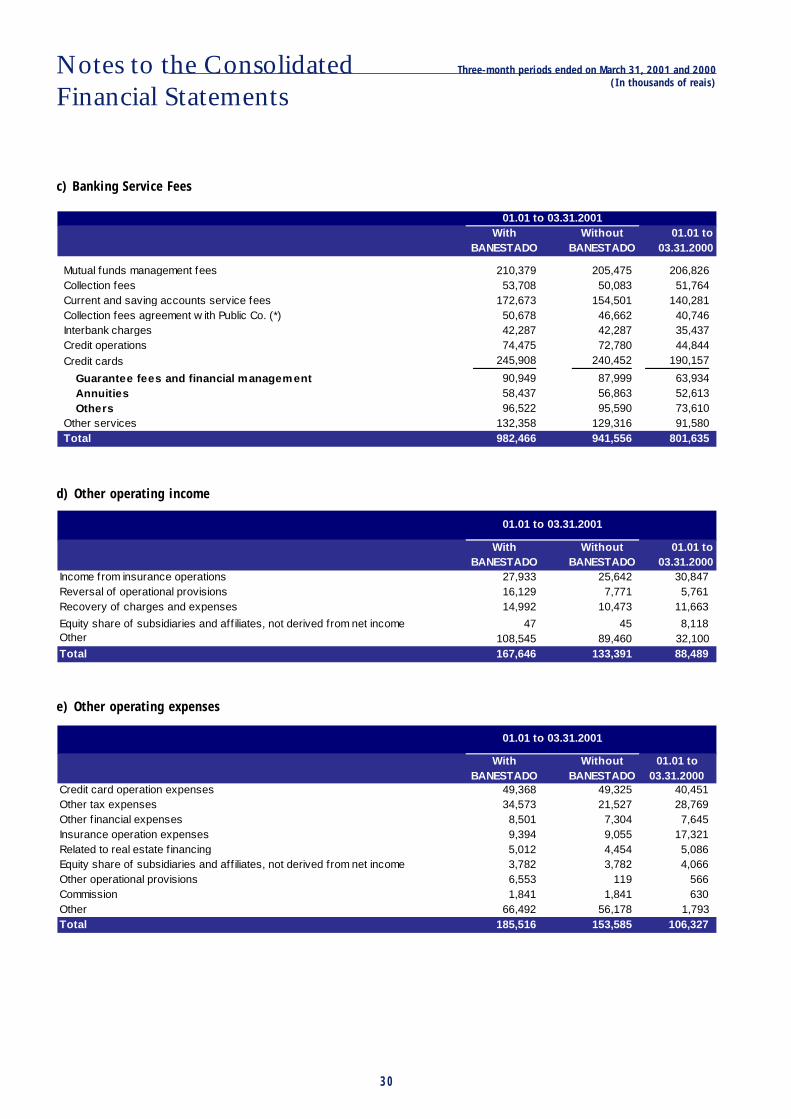
Notes to the ConsolidatedFinancial Statements
Three-month periods ended on March 31, 2001 and 2000(In thousands of reais)
30
c) Banking Service Fees
d) Other operating income
e) Other operating expenses
With BANESTADO
Without BANESTADO
01.01 to 03.31.2000
Mutual funds management fees 210,379 205,475 206,826 Collection fees 53,708 50,083 51,764 Current and saving accounts service fees 172,673 154,501 140,281 Collection fees agreement w ith Public Co. (*) 50,678 46,662 40,746 Interbank charges 42,287 42,287 35,437 Credit operations 74,475 72,780 44,844
Credit cards 245,908 240,452 190,157
Guarantee fees and financial managem ent 90,949 87,999 63,934 Annuities 58,437 56,863 52,613 Others 96,522 95,590 73,610
Other services 132,358 129,316 91,580 Total 982,466 941,556 801,635
01.01 to 03.31.2001
With BANESTADO
Without BANESTADO
01.01 to 03.31.2000
Income from insurance operations 27,933 25,642 30,847 Reversal of operational provisions 16,129 7,771 5,761 Recovery of charges and expenses 14,992 10,473 11,663
47 45 8,118 108,545 89,460 32,100
Total 167,646 133,391 88,489
01.01 to 03.31.2001
Equity share of subsidiaries and aff iliates, not derived from net incomeOther
With BANESTADO
Without BANESTADO
01.01 to 03.31.2000
Credit card operation expenses 49,368 49,325 40,451 Other tax expenses 34,573 21,527 28,769 Other f inancial expenses 8,501 7,304 7,645 Insurance operation expenses 9,394 9,055 17,321 Related to real estate f inancing 5,012 4,454 5,086
3,782 3,782 4,066 Other operational provisions 6,553 119 566 Commission 1,841 1,841 630 Other 66,492 56,178 1,793 Total 185,516 153,585 106,327
Equity share of subsidiaries and aff iliates, not derived from net income
01.01 to 03.31.2001

Notes to the ConsolidatedFinancial Statements
Three-month periods ended on March 31, 2001 and 2000(In thousands of reais)
31
Note 11 - Stockholders' Equity - Itaú
a) Shares
As decided at the Extraordinary Stockholders' Meeting onFebruary 12, 2001 and March 29, 2001 (this latter in processof review and approval by the Brazilian Central Bank),1,251,143,434 and 1,102,035,249 common book entry sharesheld in treasury were cancelled without reducing capital. Asa result, capital (pending the mentioned registration by theBrazilian Central Bank) is represented by 115,596,984,021nominal book entry shares, of which 64,237,562,351 arecommon shares and 51,359,421,670 are preferred shares.
Pursuant to authorization of the Board of Directors, ITAÚrepurchased its own shares to be held in treasury, for
The purchase of 1,634,902,691 shares during the period, at a disbursement of R$ 288,297, was car-ried out due to ITAÚ'sexcess capital and after technical studies which demonstrated that this would result in benefits to the shareholders asfollows:
f) Outras Despesas Administrativas Personnel and Other Administrative Expenses
subsequent cancellation or future resale. The shares wererepurchased at the minimum weighted average and maximumprices, in reais, per thousand shares, of R$ 35.23, R$ 176.19and R$ 203.08 respectively, for common shares and R$ 39.03,R$ 87.74 and R$ 194.13 for preferred shares. The averagemarket value of these shares at March 31, 2001 is R$ 172.00and R$ 166.91 re-spectively, per thousand shares.
Treasury share movements are shown below:
Quantity
Common Preferred Total
Treasury shares at December 31, 2000 1,114,342,903 1,715,967,970 2,830,310,873
Purchases during the period 1,238,835,780 396,066,911 1,634,902,691
(-) Cancellation in the period (2,353,178,683) - (2,353,178,683)
Treasury shares at March 31, 2001 - 2,112,034,881 2,112,034,881
With BANESTADO
Without BANESTADO
01.01 to 03.31.2000
Personnel 612,390 507,625 516,626 Other administrative expenses 789,282 744,260 636,007 Facilities 102,595 90,762 77,247 Materials 26,565 25,341 22,365 Data processing and telecommunications 134,691 134,401 110,015 Transport 44,033 41,133 45,056 Third party services 106,196 95,777 75,804 Security 29,878 26,889 22,444 Advertising, promotions and publications 67,189 65,268 49,963 Contributions and donations 11,065 11,012 8,246 Depreciation and amortization 122,194 118,253 97,393 Financial system services costs 60,631 59,669 57,850 Other 84,245 75,755 69,624 Total 1,401,672 1,251,885 1,152,633
01.01 to 03.31.2001

Notes to the ConsolidatedFinancial Statements
Three-month periods ended on March 31, 2001 and 2000(In thousands of reais)
32
The increase in the return on shareholders' equity and the profit per thousand shares is due to the fact that the loss offinancial income from the cost disbursed, corresponding to the market interest rate of 15.4% before taxes or 10.1% aftertaxes, are lower than the return on equity before the purchase of 37.3%.
b) Dividends
Stockholders are entitled to a minimum mandatory dividendof 25% of net income which is adjusted ac-cording to rulesset forth in the Brazilian Corporate Law. Both types of sharesparticipate equally, after common shares have beenguaranteed payments equal to the minimum preferentialpayments to pre-ferred shares.
Position prior to Purchase of Position afterthe purchase shares purchase
Net prof it 628,110 (2,897) 625,213
Stockholders’ equity 7,103,923 (288,297) 6,815,626
Return on equity 40.3% - 42.1%
Number of outstanding shares (thousand) 115,119,852 (1,634,903) 113,484,949
Net prof it per thousand shares 5.46 - 5.51
Notes to the ConsolidatedFinancial Statements
Three-month periods ended on March 31, 2001 and 2000(In thousands of reais)
33
Note 12 - Related Parties
Transactions between related parties were carried out at amountsand terms in accordance with normal market practices as well asunder reciprocal conditions. Transactions with consolidated
Note 13 - Financial Instruments
a) Derivatives
In relation to transactions involving derivatives, ITAÚ has beenmeeting the principal needs of its cor-porate customers to managemarket risks, arising mainly from fluctuations in interest andexchange rates. In order to monitor these risks on a timely basis,ITAÚ has invested in the development of inter-nal control systems.
ITAÚ's policy is to minimize market risks resulting from derivativeoperations. As such, the bank avoids taking positions whichare subject to fluctuations due to market factors and onlyoperates instruments that permit risk control which is theresponsibility of an independent area within ITAÚ.
Most derivative contracts negotiated with customers are swapand future operations, which are all reg-istered with the
companies were eliminated from the consolidated financialstatements. Other transactions with non-consolidated companiesare not significant in the overall context of ITAÚ's operations.
BM&F or CETIP and involve pre-fixed rates, interbank depositrates, exchange varia-tions or price indices. BM&F futurecontracts involving interbank rates and U.S. dollars are mainlyused to hedge financing operations offered to customerswith maturities or in currencies which are mis-matched withthe resources used to fund these operations.
The notional values for these financial instruments arerecorded in memorandum accounts, and the ad-justments/premiums are recorded in balance sheet accounts.
The amounts related to positions in future, swap and optionsoperations are as follows:

Notes to the ConsolidatedFinancial Statements
Three-month periods ended on March 31, 2001 and 2000(In thousands of reais)
34
MEMORANDUM ACCOUNT BALANCE SHEET ACCOUNT
NOTIONAL VALUE RECEIVABLE/RECEIVED
(PAYABLE/PAID)
03.31.2001 03.31.2000 03.31.2001 03.31.2000
Future contracts 26,890,330 6,953,822 (115,714) 12,567
Purchase commitments 12,778,562 3,421,765 (116,659) (2,737)
Foreign currency 1,039,259 456,075 (49,543) (1,133)
Interbank market 10,124,853 2,716,909 (90,152) (18)
Indices 1,443,083 243,474 21,772 (1,562)
Others 171,367 5,307 1,264 (24)
Commitments to sell 14,111,768 3,532,057 945 15,304
Foreign currency 1,272,332 1,658,012 3,341 7,070
Interbank market 10,514,952 581,549 31,610 79
Indices 2,289,608 1,040,893 (34,651) 5,640
Shares 26,918 246,432 569 2,480
Others 7,958 5,171 76 35
Sw ap contracts (141,759) 124,684
Assets position 10,316,856 8,014,411 173,127 192,599
Foreign currency 1,167,010 597,718 80,085 623
Interbank market 4,968,997 3,435,029 2,025 98,745
Pref ixed 2,586,343 3,550,918 40,311 68,466
Indices 548,480 32,454 886 -
Others 1,046,026 398,292 49,820 24,765
Liability position 10,458,615 7,889,727 (314,886) (67,915)
Foreign currency 3,575,663 2,279,858 (259,836) (4,272)
Interbank 3,116,372 3,682,302 (8,833) (27,271)
Pref ixed 1,778,985 1,513,485 (36,376) (27,532)
Indices 768,221 193,680 (5,301) (8,135)
Others 1,219,374 220,402 (4,540) (705)
Options contracts 4,227,568 815,546 (112,648) (6,176)
Purchase commitments- call position 1,034,945 373,285 (44,215) (7,304)
Foreign currency 31,375 88,344 (322) (729)
Pref ixed 212,017 173,848 - -
Indices 138,570 - (246) -
Shares 618,067 82,087 (42,560) (6,575)
Others 34,916 29,006 (1,087) -
Commitments to sell - call position 907,162 77,843 (121,839) (3,980)
Foreign currency 741,685 15,726 111,173 (1,461)
Indices 17,091 14,575 (1,004) (1,051)
Shares 104,877 9,800 (8,737) (1,468)
Others 43,509 37,742 925 -
Purchase commitments - put position 1,443,685 184,678 10,657 4,729
Foreign currency 35,125 62,625 510 58
Interbank market 1,236,073 - - -
Indices 43,246 63,310 948 1,302
Shares 118,326 58,743 9,010 3,369
Others 10,915 - 189 -
Commitments to sell - put position 841,776 179,740 42,749 379
Foreign currency - 3,652 - 11
Pref ixed 212,017 173,848 - -
Shares 624,618 2,240 42,625 368
Others 5,141 - 124 -

Notes to the ConsolidatedFinancial Statements
Three-month periods ended on March 31, 2001 and 2000(In thousands of reais)
35
Contracts of futures, options and swaps mature as follows:
b) Market Value
The financial statements were prepared in conformity withaccounting principles, based on the assumption of normalcontinuity in the operations of ITAÚ and its subsidiaries.
The recorded values of each financial instrument whether
included or not in the balance sheet, when compared withthe values that might be obtained in an active market, or inthe absence of such markets, using the net present value ofadjusted discounted:
To obtain the market values for these financial instruments,the following criteria were adopted:
- Interbank deposits, certificates of bank deposit andmortgage securities, the latter two included in Se-curitieswere determined on the basis of their nominal values,monetarily corrected to maturity dates and discounted
at present value at interest future market rates and swapmarket rates for pre-fixed securities and fixed interestsecurities rates for post-fixed securities published in theGazeta Mercantil on April 2, 2001.
- Public securities included in Securities were determinedbased on market rates valued through com-parison with
(1) Includes unrealized gains relating to minority interests amounting to R$ 152,995 (R$ 148,934 at March 31, 2000).
31 - 180 181 - 365 More than 365 03.31.2001 03.31.2000
9,553,881 6,983,490 7,238,068 26,890,330 6,953,822
4,409,358 1,611,305 2,447,805 10,143,729 7,821,812
1,777,138 994,711 1,012,913 4,227,568 815,546
ITAÚ CONSOLIDATED
03.31.2001 03.31.2000 03.31.2001 03.31.2000 03.31.2001 03.31.2000
Short-term interbank investments 2,880,573 1,756,560 2,882,199 1,778,179 1,626 21,619
Securities and derivatives 19,592,724 15,950,382 20,500,363 16,899,964 907,639 949,582
Loan operations 20,024,449 13,895,649 19,998,023 13,913,562 (26,426) 17,913
Investment in BPI - SGPS, S.A. (BPI) 270,147 142,443 609,579 455,043 339,432 312,600
Other investments 318,322 277,708 317,391 279,940 (931) 2,232
Time and interbank deposits and funds from acceptances and issuance of securities
8,647,384 6,432,400 8,526,056 6,291,073 121,328 141,327
Treasury shares 179,048 110,713 352,520 275,864 173,472 165,151
Total unrealized gain/(loss) 1,516,140 1,610,424
Recorded value Market value Unrealized income/(loss)(1)
•

Notes to the ConsolidatedFinancial Statements
Three-month periods ended on March 31, 2001 and 2000(In thousands of reais)
36
The foreign exchange effects on foreign investments have been allocated to the line items of the Statement of Income, inaccordance with the nature of the corresponding asset and liability accounts.
In order to make the March 31, 2001 financial statements comparable to other periods, the March 31, 2000 accounts havebeen reclassified as shown below:
lists held by National Association of Open MarketInstitutions (ANDIMA).
- Investment fund quotas included in Securities weredetermined based on net value per quota on the balancesheet date.
- Publicly traded shares when included in Securities werevalued using the average price quota of the last tradingday of the month, if available, or on the most recentquotations for the companies shares published in thedaily bulletin of each Stock Exchange.
- Loans with maturity dates over 90 days, when available,were calculated based on their net present value of futurecash flows discounted at market interest rates on thebalance sheet date, also consid-ering the effects ofhedges (swap contracts).
- Other investments and equity shares in foreign subsidiaryand affiliated companies are determined on the basis ofstock market quotations, book value per share andauction quotation.
- Time and interbank deposits, and funds from acceptancesand issuance of securitie when available, were calculatedbased on their present value deter-mined by means offuture cash flows discounted using interest futures marketrates, 367-day swap market for pre-fixed securities, andfixed income securities market rates for post-fixedsecurities pub-lished in the Gazeta Mercantil on April 2,2001; the effects of the hedges (swap contracts) arealso taking into account.
- Derivatives related to swaps contracted to hedge otherassets and liabilities are determined based on referencevalues for each parameter set forth in the contracts (bothparties), monetarily corrected through maturity anddiscounted to present value using interest future marketrates, according to the characteristics of each contract.
- Treasury shares are valued according to the averagequotation available on the last trading day of the month,or if this is not available, according to the most recentquotation on prior trading days, published in dailybulletin of each Stock Exchange.
Note 14 - Reclassification for Comparability Purposes
03.31.2000
Previously ReclassifiedDisclosed Reclassification Balances
Income from financial operations Loans 901,801 (133,823) 767,978
Leases 144,630 (54) 144,576
Securities portfolio 862,624 (210,995) 651,629
Foreign exchange portfolio 7,351 (5,729) 1,622
Expenses on financial operations Deposits, money market and interbank funds (588,277) 218,196 (370,081)
Borrow ings and assignments and on-lendings (81,721) 55,099 (26,622)
Provision for loan losses (152,752) 2,164 (150,588)
Gross profit from financial operations 1,026,216 (75,142) 951,074 Other financial income (expenses) (486,285) 76,229 (410,056) Other administrative expenses (639,026) 3,019 (636,007)
Equity in income of subsidiaries and aff iliates (53,074) 64,599 11,525
Other operating income 99,786 (11,297) 88,489
Other operating expenses (126,235) 19,908 (106,327)
Operating income 539,931 1,087 541,018 Non-operating income 9,884 169 10,053 Income tax and social contribution Due on operations for the period (162,055) (1,256) (163,311)
Net income 365,275 - 365,275
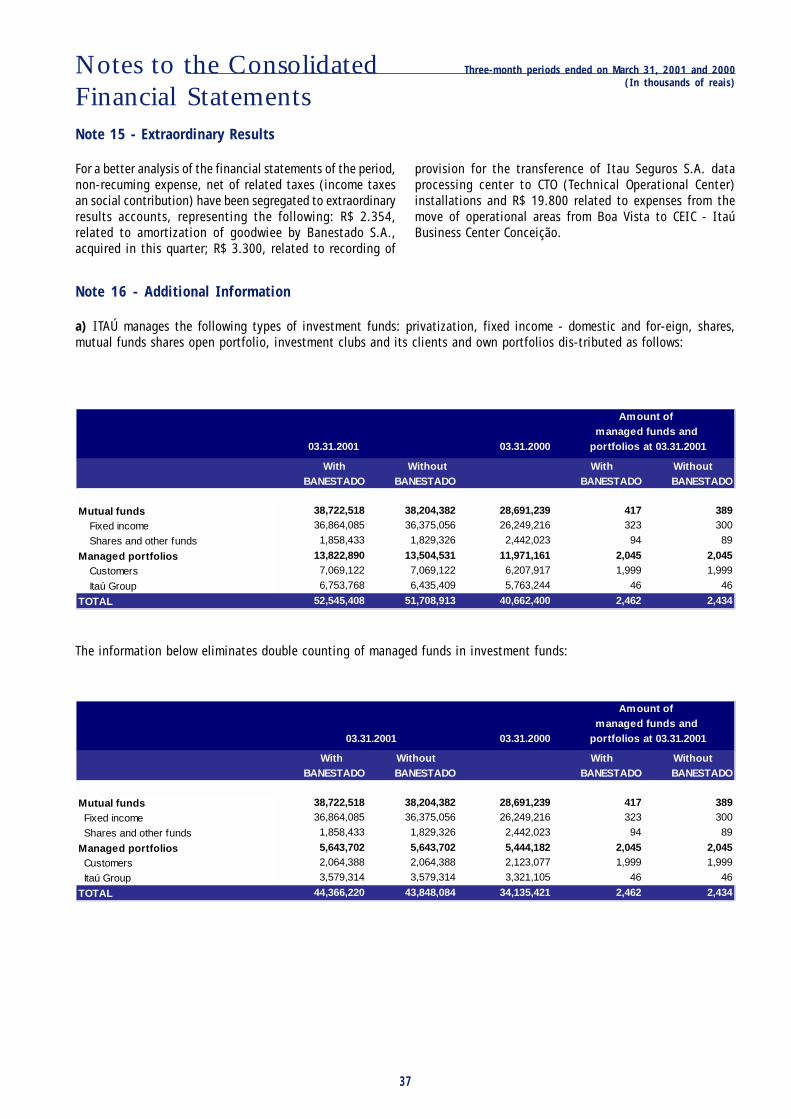
Notes to the ConsolidatedFinancial Statements
Three-month periods ended on March 31, 2001 and 2000(In thousands of reais)
37
Note 15 - Extraordinary Results
For a better analysis of the financial statements of the period,non-recuming expense, net of related taxes (income taxesan social contribution) have been segregated to extraordinaryresults accounts, representing the following: R$ 2.354,related to amortization of goodwiee by Banestado S.A.,acquired in this quarter; R$ 3.300, related to recording of
Note 16 - Additional Information
a) ITAÚ manages the following types of investment funds: privatization, fixed income - domestic and for-eign, shares,mutual funds shares open portfolio, investment clubs and its clients and own portfolios dis-tributed as follows:
The information below eliminates double counting of managed funds in investment funds:
Amount of managed funds and
03.31.2001 03.31.2000 portfolios at 03.31.2001
With Without With Without BANESTADO BANESTADO BANESTADO BANESTADO
Mutual funds 38,722,518 38,204,382 28,691,239 417 389
Fixed income 36,864,085 36,375,056 26,249,216 323 300
Shares and other funds 1,858,433 1,829,326 2,442,023 94 89
Managed portfolios 13,822,890 13,504,531 11,971,161 2,045 2,045
Customers 7,069,122 7,069,122 6,207,917 1,999 1,999
Itaú Group 6,753,768 6,435,409 5,763,244 46 46
TOTAL 52,545,408 51,708,913 40,662,400 2,462 2,434
Amount of managed funds and
03.31.2000 portfolios at 03.31.2001
With Without With Without BANESTADO BANESTADO BANESTADO BANESTADO
Mutual funds 38,722,518 38,204,382 28,691,239 417 389
Fixed income 36,864,085 36,375,056 26,249,216 323 300
Shares and other funds 1,858,433 1,829,326 2,442,023 94 89
Managed portfolios 5,643,702 5,643,702 5,444,182 2,045 2,045
Customers 2,064,388 2,064,388 2,123,077 1,999 1,999
Itaú Group 3,579,314 3,579,314 3,321,105 46 46
TOTAL 44,366,220 43,848,084 34,135,421 2,462 2,434
03.31.2001
provision for the transference of Itau Seguros S.A. dataprocessing center to CTO (Technical Operational Center)installations and R$ 19.800 related to expenses from themove of operational areas from Boa Vista to CEIC - ItaúBusiness Center Conceição.
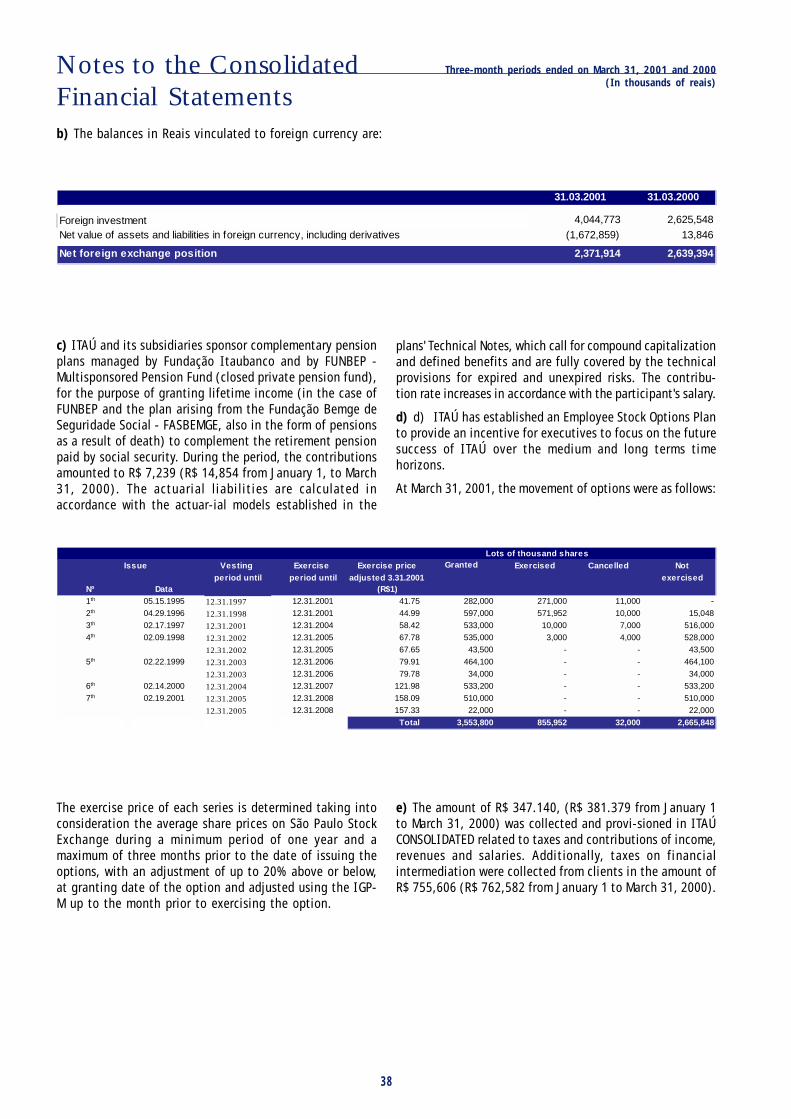
Notes to the ConsolidatedFinancial Statements
Three-month periods ended on March 31, 2001 and 2000(In thousands of reais)
38
b) The balances in Reais vinculated to foreign currency are:
c) ITAÚ and its subsidiaries sponsor complementary pensionplans managed by Fundação Itaubanco and by FUNBEP -Multisponsored Pension Fund (closed private pension fund),for the purpose of granting lifetime income (in the case ofFUNBEP and the plan arising from the Fundação Bemge deSeguridade Social - FASBEMGE, also in the form of pensionsas a result of death) to complement the retirement pensionpaid by social security. During the period, the contributionsamounted to R$ 7,239 (R$ 14,854 from January 1, to March31, 2000). The actuarial liabilities are calculated inaccordance with the actuar-ial models established in the
plans' Technical Notes, which call for compound capitalizationand defined benefits and are fully covered by the technicalprovisions for expired and unexpired risks. The contribu-tion rate increases in accordance with the participant's salary.
d) d) ITAÚ has established an Employee Stock Options Planto provide an incentive for executives to focus on the futuresuccess of ITAÚ over the medium and long terms timehorizons.
At March 31, 2001, the movement of options were as follows:
The exercise price of each series is determined taking intoconsideration the average share prices on São Paulo StockExchange during a minimum period of one year and amaximum of three months prior to the date of issuing theoptions, with an adjustment of up to 20% above or below,at granting date of the option and adjusted using the IGP-M up to the month prior to exercising the option.
e) The amount of R$ 347.140, (R$ 381.379 from January 1to March 31, 2000) was collected and provi-sioned in ITAÚCONSOLIDATED related to taxes and contributions of income,revenues and salaries. Additionally, taxes on financialintermediation were collected from clients in the amount ofR$ 755,606 (R$ 762,582 from January 1 to March 31, 2000).
31.03.2001 31.03.2000
Foreign investment 4,044,773 2,625,548
Net value of assets and liabilities in foreign currency, including derivatives (1,672,859) 13,846
Net foreign exchange position 2,371,914 2,639,394
Lots of thousand sharesVesting Exercise Exercise price Granted Exercised Cancelled Not
period until period until adjusted 3.31.2001 exercisedNº Data (R$1)1th 05.15.1995 12.31.1997 12.31.2001 41.75 282,000 271,000 11,000 -
2th 04.29.1996 12.31.1998 12.31.2001 44.99 597,000 571,952 10,000 15,048
3th 02.17.1997 12.31.2001 12.31.2004 58.42 533,000 10,000 7,000 516,000
4th 02.09.1998 12.31.2002 12.31.2005 67.78 535,000 3,000 4,000 528,000
12.31.2002 12.31.2005 67.65 43,500 - - 43,500
5th 02.22.1999 12.31.2003 12.31.2006 79.91 464,100 - - 464,100
12.31.2003 12.31.2006 79.78 34,000 - - 34,000
6th 02.14.2000 12.31.2004 12.31.2007 121.98 533,200 - - 533,200
7th 02.19.2001 12.31.2005 12.31.2008 158.09 510,000 - - 510,000
12.31.2005 12.31.2008 157.33 22,000 - - 22,000
Total 3,553,800 855,952 32,000 2,665,848
Issue

Notes to the ConsolidatedFinancial Statements
Three-month periods ended on March 31, 2001 and 2000(In thousands of reais)
39
a) Consolidated credit card companies and insurance, capitalization and pension funds companies information
(1) Includes Banerjcard Administradora de Cartões de Crédito Ltda., Itaú Personnalité Administradora de Cartões de Crédito e Serviços Ltda., Itaucard Administradorade Cartões de Crédito e Imobiliária Ltda., Bemge Administradora de Cartões de Crédito Ltda., Banestado Admnistradora de Cartões de Crédito Ltda. (only at March31, 2001) and proportionally, Credicard Comercial e Importadora Ltda., Credicard S.A. Administradora de Cartões de Crédito, Redecard S.A. and Orbitall Serviçose Processamento de Informações Comerciais Ltda. (only at March 31, 2001).
(2) Includes Banerj Seguros S.A., Itaú Capitalização S.A., Itaú Previdência e Seguros S.A., Itaú Seguros S.A., Bemge Seguradora S.A., Investprev Seguros e Previdência S.A.(consolidated up to March 31, 2000) and, only at March 31, 2001, Capitaliza - Empresa de Capitalização S.A., Cia. de Seguros Gralha Azul and Paraná Cia. deSeguros - companies regulated by the Insurance Company Regulatory Agency (SUSEP).
03.31.2001 03.31.2000 03.31.2001 03.31.2000Asse ts
Current and long-term asse ts Cash and cash equivalents 7,432 5,685 13,587 9,059 Securities 381,471 282,285 3,039,366 2,316,992 Insurance receivable - - 421,471 354,982 Card holder purchases 1,715,857 1,373,710 - -
Other receivables 562,234 244,113 180,653 155,559 Deposits for tax incentives 26,790 37,117 - - Other assets 11,602 9,777 212,562 175,551
Perm anent asse tsInvestments 1,774,216 8,269 2,022,347 1,782,999
Property and equipment 41,985 35,425 214,880 228,723 Deferred charges 16,611 15,841 7,542 6,496
Total 4,538,198 2,012,222 6,112,408 5,030,361
Liabilities and s tockholders ' equity
Current and long-term liabilities Technical provisions - restricted - - 444,531 332,158
Insurance operations payable - - 73,430 68,233 Borrow ings 209,586 124,782 - - Taxes and social security contributions 133,968 33,623 204,701 117,938 Payable amounts - stores 1,057,856 737,764 - - Banking f inancing - card holders 608,338 536,297 - - Credit Card - annuity revenues 98,607 82,398 - - Other 287,048 157,856 127,664 106,703
Technical provis ions - not restr icte d - - 2,344,225 1,904,201
M inority interest in consolidated s ubsidiarie s - - 405 1,199
Stockholders ' equityCapital and reserves 2,021,218 267,346 2,817,516 2,438,934 Income for the period 121,577 72,156 99,936 60,995
Total 4,538,198 2,012,222 6,112,408 5,030,361
Credit card com paniesIns urance, capitalization and
pension funds com panies
(1) (2)
Note 17 - Additional Information on Affiliates and Subsidiaries
In order to permit a better analysis of the financial situation of the group, we present below a summary of accountinginformation, which has been consolidated according to the activities of the respective companies, as well as branches andfinancial institutions and main financial institutions in the country.
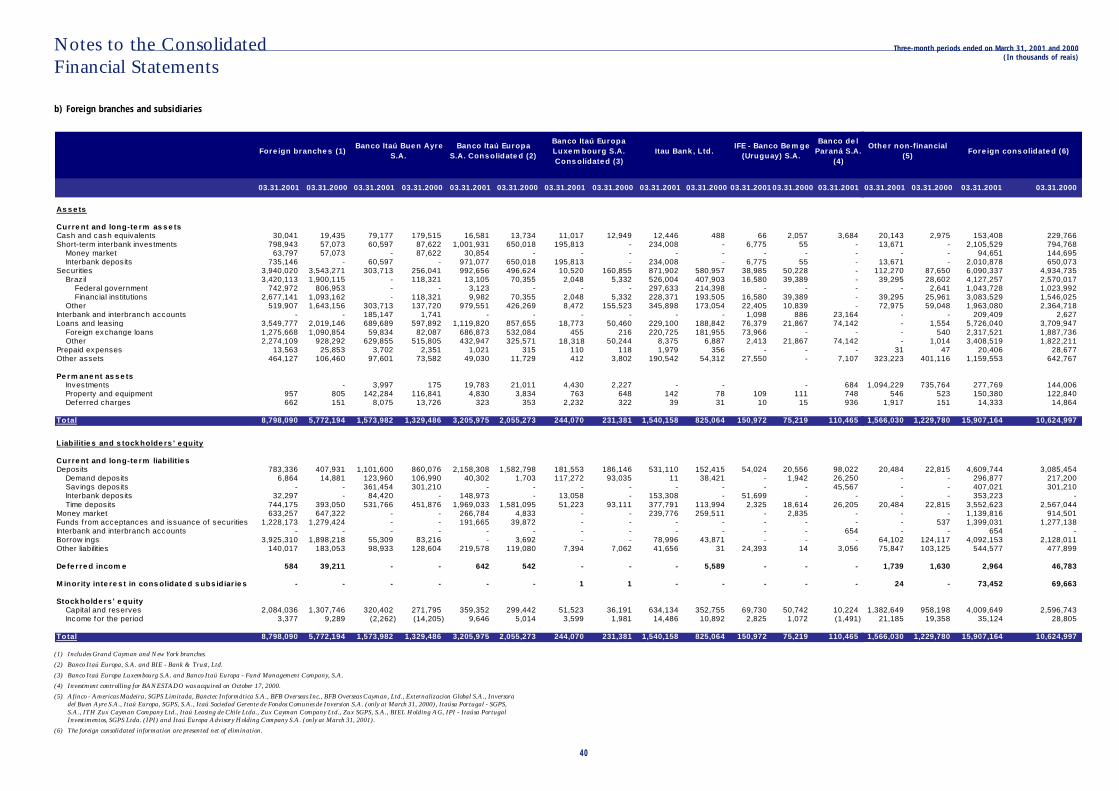
Notes to the ConsolidatedFinancial Statements
40
Three-month periods ended on March 31, 2001 and 2000(In thousands of reais)
b) Foreign branches and subsidiaries
(1) Includes Grand Cayman and New York branches.
(2) Banco Itaú Europa, S.A. and BIE - Bank & Trust, Ltd.
(3) Banco Itaú Europa Luxembourg S.A. and Banco Itaú Europa - Fund Management Company, S.A.
(4) Investment controlling for BANESTADO was acquired on October 17, 2000.
(5) Afinco - Americas Madeira, SGPS Limitada, Banctec Informática S.A., BFB Overseas Inc., BFB Overseas Cayman, Ltd., Externalizacion Global S.A., Inversoradel Buen Ayre S.A., Itaú Europa, SGPS, S.A., Itaú Sociedad Gerente de Fondos Comunes de Inversion S.A. (only at March 31, 2000), Itaúsa Portugal - SGPS,S.A., ITH Zux Cayman Company Ltd., Itaú Leasing de Chile Ltda., Zux Cayman Company Ltd., Zux SGPS, S.A., BIEL Holding AG, IPI - Itaúsa PortugalInvestimentos, SGPS Ltda. (IPI) and Itaú Europa Advisory Holding Company S.A. (only at March 31, 2001).
(6) The foreign consolidated information are presented net of elimination.
Banco de l Paraná S.A.
(4)
03.31.2001 03.31.2000 03.31.2001 03.31.2000 03.31.2001 03.31.2000 03.31.2001 03.31.2000 03.31.2001 03.31.2000 03.31.2001 03.31.2000 03.31.2001
As s e ts
Curre nt and long-te rm as s e tsCash and cash equivalents 30,041 19,435 79,177 179,515 16,581 13,734 11,017 12,949 12,446 488 66 2,057 3,684 Short-term interbank investments 798,943 57,073 60,597 87,622 1,001,931 650,018 195,813 - 234,008 - 6,775 55 -
Money market 63,797 57,073 - 87,622 30,854 - - - - - - - - Interbank depos its 735,146 - 60,597 - 971,077 650,018 195,813 - 234,008 - 6,775 55 -
Securities 3,940,020 3,543,271 303,713 256,041 992,656 496,624 10,520 160,855 871,902 580,957 38,985 50,228 - Braz il 3,420,113 1,900,115 - 118,321 13,105 70,355 2,048 5,332 526,004 407,903 16,580 39,389 -
Federal government 742,972 806,953 - - 3,123 - - - 297,633 214,398 - - - Financ ial ins titutions 2,677,141 1,093,162 - 118,321 9,982 70,355 2,048 5,332 228,371 193,505 16,580 39,389 -
Other 519,907 1,643,156 303,713 137,720 979,551 426,269 8,472 155,523 345,898 173,054 22,405 10,839 - Interbank and interbranch accounts - - 185,147 1,741 - - - - - - 1,098 886 23,164 Loans and leasing 3,549,777 2,019,146 689,689 597,892 1,119,820 857,655 18,773 50,460 229,100 188,842 76,379 21,867 74,142
Foreign exchange loans 1,275,668 1,090,854 59,834 82,087 686,873 532,084 455 216 220,725 181,955 73,966 - - Other 2,274,109 928,292 629,855 515,805 432,947 325,571 18,318 50,244 8,375 6,887 2,413 21,867 74,142
Prepaid expenses 13,563 25,853 3,702 2,351 1,021 315 110 118 1,979 356 - - - Other assets 464,127 106,460 97,601 73,582 49,030 11,729 412 3,802 190,542 54,312 27,550 - 7,107
Pe rm ane nt as s e tsInvestments - 3,997 175 19,783 21,011 4,430 2,227 - - - 684 Property and equipment 957 805 142,284 116,841 4,830 3,834 763 648 142 78 109 111 748 Deferred charges 662 151 8,075 13,726 323 353 2,232 322 39 31 10 15 936
Total 8,798,090 5,772,194 1,573,982 1,329,486 3,205,975 2,055,273 244,070 231,381 1,540,158 825,064 150,972 75,219 110,465
Liabilitie s and s tock holde rs ' e quity
Curre nt and long-te rm liabilit ie sDepos its 783,336 407,931 1,101,600 860,076 2,158,308 1,582,798 181,553 186,146 531,110 152,415 54,024 20,556 98,022
Demand depos its 6,864 14,881 123,960 106,990 40,302 1,703 117,272 93,035 11 38,421 - 1,942 26,250 Sav ings depos its - - 361,454 301,210 - - - - - - - - 45,567 Interbank depos its 32,297 - 84,420 - 148,973 - 13,058 - 153,308 - 51,699 - - Time depos its 744,175 393,050 531,766 451,876 1,969,033 1,581,095 51,223 93,111 377,791 113,994 2,325 18,614 26,205
Money market 633,257 647,322 - - 266,784 4,833 - - 239,776 259,511 - 2,835 - Funds f rom acceptances and issuance of securities 1,228,173 1,279,424 - - 191,665 39,872 - - - - - - - Interbank and interbranch accounts - - - - - - - - - - - - 654 Borrow ings 3,925,310 1,898,218 55,309 83,216 - 3,692 - - 78,996 43,871 - - - Other liabilities 140,017 183,053 98,933 128,604 219,578 119,080 7,394 7,062 41,656 31 24,393 14 3,056
De fe rre d incom e 584 39,211 - - 642 542 - - - 5,589 - - -
M inor ity inte re s t in cons olidate d s ubs idiar ie s - - - - - - 1 1 - - - - -
Stock holde rs ' e quityCapital and reserves 2,084,036 1,307,746 320,402 271,795 359,352 299,442 51,523 36,191 634,134 352,755 69,730 50,742 10,224 Income for the period 3,377 9,289 (2,262) (14,205) 9,646 5,014 3,599 1,981 14,486 10,892 2,825 1,072 (1,491)
Total 8,798,090 5,772,194 1,573,982 1,329,486 3,205,975 2,055,273 244,070 231,381 1,540,158 825,064 150,972 75,219 110,465
Banco Itaú Bue n Ayre S.A.
Banco Itaú Europa S.A. Cons olidate d (2)
Banco Itaú Europa Luxe m bourg S.A. Cons olidate d (3)
Itau Bank , Ltd. IFE - Banco Be m ge
(Uruguay) S.A.Fore ign branche s (1)
03.31.2001 03.31.2000 03.31.2001 03.31.2000
20,143 2,975 153,408 229,766 13,671 - 2,105,529 794,768
- - 94,651 144,695 13,671 - 2,010,878 650,073
112,270 87,650 6,090,337 4,934,735 39,295 28,602 4,127,257 2,570,017
- 2,641 1,043,728 1,023,992 39,295 25,961 3,083,529 1,546,025 72,975 59,048 1,963,080 2,364,718
- - 209,409 2,627 - 1,554 5,726,040 3,709,947 - 540 2,317,521 1,887,736 - 1,014 3,408,519 1,822,211
31 47 20,406 28,677 323,223 401,116 1,159,553 642,767
1,094,229 735,764 277,769 144,006 546 523 150,380 122,840
1,917 151 14,333 14,864
1,566,030 1,229,780 15,907,164 10,624,997
20,484 22,815 4,609,744 3,085,454 - - 296,877 217,200 - - 407,021 301,210 - - 353,223 -
20,484 22,815 3,552,623 2,567,044 - - 1,139,816 914,501 - 537 1,399,031 1,277,138 - - 654 -
64,102 124,117 4,092,153 2,128,011 75,847 103,125 544,577 477,899
1,739 1,630 2,964 46,783
24 - 73,452 69,663
1,382,649 958,198 4,009,649 2,596,743 21,185 19,358 35,124 28,805
1,566,030 1,229,780 15,907,164 10,624,997
Othe r non-financial (5)
Fore ign cons olidate d (6)

Notes to the ConsolidatedFinancial Statements
Three-month periods ended on March 31, 2001 and 2000(In thousands of reais)
41
c) Main financial institutions in the country
(1) Includes Banco Banerj S.A., Banerjcard Administradora de Cartões de Crédito Ltda., Banco Itaú Buen Ayre S.A., Externalizacion Global S.A., Inversora del Buen AyreS.A., Figueira Administração e Participações Ltda. (only at March 31, 2001) and also, at March 31, 2000, Itaú Sociedad Gerente de Fondos Comunes de Inversion S.A.
(2) Includes Banco Bemge S.A., Bemge Administradora de Cartões de Crédito Ltda., Itaucard Financeira S.A. Crédito, Financiamento e Investimento, Financeira BemgeS.A. – Crédito, Financiamento e Investimento, Guaxinim Administração e Participações Ltda. (only at March 31, 2001) IFE - Banco Bemge (Uruguay) S.A. and also, atMarch 31, 2000, Bemge Part Ltda. and its subsidiries.
(3) Includes Banco Banestado S.A., Asban S.A. Participações, Banco Del Paraná S.A., Banestado Administradora de Cartões de Crédito Ltda., Banestado Leasing S.A. -Arrendamento Mercantil, Banestado Corretora de Valores Mobiliários S.A., Banestado S.A. - Participações, Administração e Serviços and Capitaliza - Empresa deCapitalização S.A.
BANESTADO(3)
3.31.2001 3.31.2000 3.31.2001 3.31.2000 3.31.2001Assets
Current and long-term assetsCash and cash equivalents 132,558 234,451 9,824 50,196 93,814 Short-term interbank investments 1,287,319 2,069,656 1,524,532 796,761 1,157,724 Securities 871,403 481,186 794,514 4,453,125 920,762 Interbank accounts 627,027 431,934 105,387 149,792 919,080 Interbranch accounts 10,207 1,758 10 23 3,222 Loand and leasing operations 1,108,212 825,829 120,325 2,316,290 1,062,441 Other receivables 310,461 294,519 743,844 1,959,305 1,862,436 Other assets 7,155 7,275 24,323 184,183 65,239
Permanent assetsInvestments 13,813 8,899 13,555 309,331 26,999 Property and equipment 159,519 145,661 16,880 859,335 137,647 Deferred charges 97,655 131,309 1,906 93,731 10,127
Total 4,625,329 4,632,477 3,355,100 11,172,072 6,259,491
Liabilities and stockholders' equity
Current and long-term liabilitiesDeposits 3,151,031 2,765,124 739,890 3,376,347 3,115,470 Deposits received under security repurchase agreement 69,484 510,148 418,970 127,603 232,858 Funds from acceptances and issuance of securities - - - 484,324 214,381 Interbank accounts 151,954 136,957 10,483 38,318 206,360 Interbranch accounts 11,130 5,106 309 1,107 14,974 Borrowings 56,651 95,573 - 223,119 17,538
On-lending borrowings from public institutions 625 808 - 2,748 348,165 Technical provisions for insurance operations - restricted - - - 331,980 - Other liabilities 357,015 406,020 395,246 2,398,200 1,626,053
- - - 1,904,201 -
Deferred income 340 728 63 89,020 3,516
Minority interest in consolidated subsidiaries 176,838 141,059 11,746 495,120 2,596
Stockholders' equityCapital and reserves 604,185 553,998 1,755,105 1,651,388 474,933 Net income for the period 46,076 16,956 23,288 48,597 2,647
Total 4,625,329 4,632,477 3,355,100 11,172,072 6,259,491
BANERJ(1)
BEMGE(2)
Technical provisions for insurance operations - non-restricted
� �
Report of Independent Accountants onthe Limited Review
1. We have carried out a limited review of the accountinginformation included in the Quarterly Information ofBanco Itaú S.A. and subsidiary companies for the threemonth period ended March 31, 2001, including theconsolidated balance sheet and the correspondingconsolidated statement of operations prepared inconformity with accounting principles determined byBrazilian corporate law. This information is theresponsibility of the management of the Bank.
2 Our review was performed in accordance with specificstandards established by the Brazilian Institute ofAccountants - IBRACON in conjunction with the FederalAccounting Council - CFC and mainly comprised: (a)enquiries of and discussions with managementresponsible for the accounting, financial and operatingareas of Bank Itaú S.A. and subsidiary companies withregard to the main criteria adopted for the preparationof the quarterly information and (b) a review of thesignificant information and of the subsequent eventswhich have, or could have, significant effects on thefinancial position and operations of Banco Itaú andsubsidiary companies.
3 Based on our limited review we are not aware of anysignificant adjustments which should be made to theaccounting information included in the QuarterlyInformation of Banco Itaú S.A. and Subsidiary companiesfor the three month period ended March 31, 2001 for itto be stated in conformity with accounting principlesdetermined by the Brazilian corporate law applicable tothe preparation of quarterly information and incompliance with the regulations of the Brazilian SecuritiesCommission - CVM.
4 The limited review of the accounting information forthe three month period ended March 31, 2000, presentedfor comparison purposes, was conducted by otherindependent accountants, who issued their report datedMay 8, 2000 with no exceptions noted.
April 30, 2001
To the Board of Directors and StockholdersBanco Itaú S.A.
PricewaterhouseCoopers
Auditores Independentes
CRC 2SP000160/O-5
Ricardo Baldin
Partner
Contador CRC 1SP110374/O-0

Management Discussion and Analysis
1st Quarter 2001
Banco Itaú S.A.

43
Banco Itaú S.A.First Quarter of 2001Executive Summary
Highlights
(*) JCP ( Interests on Capital ).(**) Efficiency Ratio was calculated using the recurring net income.
R$ Million (except w here indicated)
Consolidated Balance Sheet Mar 31, 01 Dec 31, 00 Mar 31, 00
Total Assets 74,563 69,555 54,094 Loan and Leasing Portfolio + Advances on Exchange Contracts 25,507 23,674 17,393 Sureties, Endorsements and Guarantees 4,424 3,579 2,848 Securities + Interbank Accounts 23,499 24,132 18,476 Stockholder's Equity of Itaú Consolidated 6,816 6,642 6,125
Statements of Income 1ST Q./01 4T H Q./00 1ST Q./00
Net Income Recurring 651 620 365 Extraordinary Net Income (25) (41) -
Net Income 625 579 365 Financial Margin 1,465 1,633 1,102 Net Income from Financial Operations 1,230 1,339 951 Bank Service Fees 982 958 802
Income per Shares ( R$ ) Consolidated Net Income ( per thousand shares) 5.51 5.03 3.10 Number of Outstanding Shares ( in million) 113,485 115,120 117,844 Book Value ( per thousand shares) 60.06 57.70 51.97 Dividends / JCP * ( R$ Million ) 163 182 139 Dividends / JCP * per thousand shares 1.44 1.58 1.18 Market Capitalization ( R$ Million ) 19,323 21,297 16,566 Market Capitalization ( US$ Million ) 8,939 10,891 9,481
Performance Ratio ( % ) ROE Recurring Annualized 44.0% 42.9% 26.1% ROE Extraordinary Annualized -1.5% -2.4% 0.0%
ROE Annualized 42.1% 39.7% 26.1% ROA Annualized 3.4% 3.4% 2.7% Risk - Based Capital Ratio 13.4% 14.4% 20.8% Efficiency Ratio * * 54.7% 59.7% 58.4%
Relevant Data Mar 31, 01 Dec 31, 00 Mar 31, 00
Assets Under Management 44,366 42,025 34,135 Employees (units) 46,694 47,524 39,072 Active Customers ( Million ) 7.6 7.5 6.9 Branches 2,127 2,118 1,761 Customer Site Branches 870 877 757 Automated Teller Machines 12,033 12,064 11,746
Ratings Fitch ( London ) National International
Short Term F1+ BLong Term AA+ BB-Individual B/CLegal 2T
Moody's ( New York )Financial Strength C+Long Term Bank Deposits B2Short Term Local Currency P2Long Term Local Currency A2Long Term Deposit Aaa.brShort Term Deposit BR-1
Standard & Poor's ( New York ) BBpi Atlantic Rating ( Rio de Janeiro ) AAA

44
Banco Itaú S.A.First Quarter of 2001Executive Summary
Net Income ( R$ Million )
26.1%
30.7%
39.7%
42.1%
Return on Equity ( % )
30.3%
The net income of Banco Itaú in the first quarter of 2001 was R$ 625 million, an8.0% increase as compared to the prior quarter. The recurring net income reachedR$ 651 million, an increase of 5.0%. The Stockholder’s Equity was R$ 6,816million, resulting in an annualized ROE of 42.1%. Total assets reached R$ 74,563million, resulting in a annualized ROA of 3.4%.
The BIS Ratio reached 13.4% as compared to 14.4% in the prior quarter.
The market capitalization of Banco Itaú was R$ 19,323 million at March 31, 2001.
The balance of credit operations, including guarantees and sureties, reached R$29,931 million, an increase of 9.8% as compared to the prior quarter. The largestnominal growth occurred in the large companies segment with an increase of R$2,154 million. Personal loans and financing recorded the highest percentagevariation with an 18.9% increase.
The balance of deposits, funds and portfolios under management reached R$71,525 million, a growth of 2.3% in the quarter.
The annualized financial margin rate decreased from 15.5% in the fourth quarter of2000 to 12.4% in the first quarter of 2001. The R$ 168 million decrease in thefinancial margin in the period reflects the changes in the macroeconomic scenarioin the first quarter of 2001.
The quality of the loan portfolio remained stable. Management opted conservativelyto increase by R$ 27 million the balance of surplus allowances for loan losses, toR$ 630 million. The expense for the Allowance for Loan Losses decreased R$ 59 millionas compared to the prior quarter, even considering the increase in the portfolio.
The Non Accrual Loans Index (a new index)(2) has been showing a falling trend inloans overdue for more than 60 days and without accrual of income, with adecrease from 3.66% to 3.55% in the quarter. With the inclusion of Banestado,this index decreased from 4.45% in December 2000 to 4.21% at the end of March2001.
Credit Operations ( R$ Billion )
20.2
21.6 22.2
27.3
29.9
Mar 31, 00 Jun 30, 00 Sep 30, 00 Dec 31, 00 Mar 31, 01
(2) Loans overdue for more than 60 days and without generation of revenues on the accrual method/total creditoperations of the Itaú conglomerate.(3) Banestado credit operations started to be included.
(1) Cost Asset Ratio: Administrative expenses/average assets
Return on Total Assets ( R$ Billion )
Mar 31, 00 Jun 30, 00 Sep 30, 00 Dec 31, 00 Mar 31, 01
54.1 54.5
57.2
69.5
74.6
44
Indice of Non Accrual Loans (2)( % )
Jun 30, 00 Sep 30, 00 Dec 31, 00 Mar 31, 01
3.77%
3.66% 3.55%3.74%
4.45% (3)
4.21% (3)
365
435
462
579
625
1st Q./00 2nd Q./00 3rd Q./00 4th Q./00 1st Q./01
1st Q./00 2nd Q./00 3rd Q./00 4th Q./00 1st Q./01
1st Q./ 01
625
5.51
6,816
42.1%
3.4%
74,563
13.4%
8.0%
Relevant Data ( R$ million )
Net Income
Net Income per thousand shares ( R$ )
Stockholder's Equity
ROE annualized
ROA annualized
Total Assets
BIS Ratio
Cost Asset Ratio annualized (1)
4th Q./ 00
579
5.03
6,642
39.7%
3.4%
69,555
14.4%
10.3%
1st Q./ 00
365
3.10
6,125
26.1%
2.7%
54,094
20.8%
9.0%
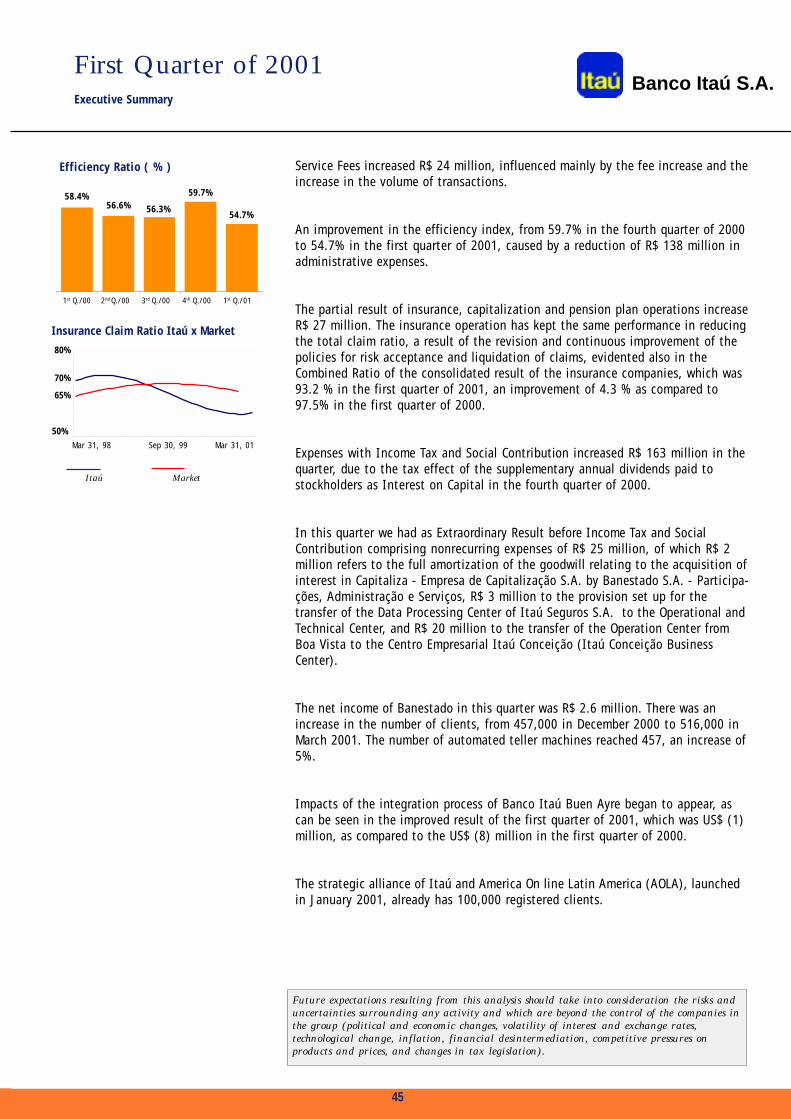
45
Efficiency Ratio ( % ) Service Fees increased R$ 24 million, influenced mainly by the fee increase and theincrease in the volume of transactions.
An improvement in the efficiency index, from 59.7% in the fourth quarter of 2000to 54.7% in the first quarter of 2001, caused by a reduction of R$ 138 million inadministrative expenses.
The partial result of insurance, capitalization and pension plan operations increaseR$ 27 million. The insurance operation has kept the same performance in reducingthe total claim ratio, a result of the revision and continuous improvement of thepolicies for risk acceptance and liquidation of claims, evidented also in theCombined Ratio of the consolidated result of the insurance companies, which was93.2 % in the first quarter of 2001, an improvement of 4.3 % as compared to97.5% in the first quarter of 2000.
Expenses with Income Tax and Social Contribution increased R$ 163 million in thequarter, due to the tax effect of the supplementary annual dividends paid tostockholders as Interest on Capital in the fourth quarter of 2000.
In this quarter we had as Extraordinary Result before Income Tax and SocialContribution comprising nonrecurring expenses of R$ 25 million, of which R$ 2million refers to the full amortization of the goodwill relating to the acquisition ofinterest in Capitaliza - Empresa de Capitalização S.A. by Banestado S.A. - Participa-ções, Administração e Serviços, R$ 3 million to the provision set up for thetransfer of the Data Processing Center of Itaú Seguros S.A. to the Operational andTechnical Center, and R$ 20 million to the transfer of the Operation Center fromBoa Vista to the Centro Empresarial Itaú Conceição (Itaú Conceição BusinessCenter).
The net income of Banestado in this quarter was R$ 2.6 million. There was anincrease in the number of clients, from 457,000 in December 2000 to 516,000 inMarch 2001. The number of automated teller machines reached 457, an increase of5%.
Impacts of the integration process of Banco Itaú Buen Ayre began to appear, ascan be seen in the improved result of the first quarter of 2001, which was US$ (1)million, as compared to the US$ (8) million in the first quarter of 2000.
The strategic alliance of Itaú and America On line Latin America (AOLA), launchedin January 2001, already has 100,000 registered clients.
Banco Itaú S.A.First Quarter of 2001Executive Summary
45
Insurance Claim Ratio Itaú x Market
58.4%56.6% 56.3%
59.7%
54.7%
1st Q./00 2nd Q./00 3rd Q./00 4th Q./00 1st Q./01
Mar 31, 98 Sep 30, 99 Mar 31, 01
50%
80%
65%
70%
Itaú Market
Future expectations resulting from this analysis should take into consideration the risks anduncertainties surrounding any activity and which are beyond the control of the companies inthe group (political and economic changes, volatility of interest and exchange rates,technological change, inflation, financial desintermediation, competitive pressures onproducts and prices, and changes in tax legislation).

46
Banco Itaú S.A.First Quarter of 2001Executive Summary
Consolidated Balance Sheet
R$ Million
ASSETS Mar 31, 01 Dec 31, 00 Mar 31, 00Variation
Mar01/Dec00Variation
Mar01/Mar00
CURRENT AND LONG-TERM ASSETS 71,345 66,358 51,092 4,987 20,253
CASH AND CASH EQUIVALENTS 1,530 1,562 1,496 (32) 34 INTERBANK FUNDS APPLIED 7,173 8,725 4,013 (1,553) 3,159 SECURITIES 19,642 19,938 15,831 (296) 3,812 Own Portifolio 13,115 14,050 14,071 (935) (956) Others 6,528 5,888 1,760 640 4,768 INTERBANK AND INTERBRANCH ACCOUNTS 7,839 4,366 6,371 3,474 1,468 LOANS 20,116 19,017 13,891 1,099 6,226 Loans: 21,972 20,874 15,123 1,098 6,849 (Provision for Loan Losses) (1,856) (1,857) (1,232) 1 (624) LEASES 1,019 863 554 155 464 OTHER ASSETS 14,026 11,887 8,936 2,139 5,090 Foreign Exchange Portfolio 4,204 2,171 3,117 2,034 1,087 Other 9,822 9,716 5,819 106 4,003
PERMANENT ASSETS 3,218 3,197 3,002 21 216 INVESTIMENTS 692 681 594 11 98 PROPERTY AND EQUIPMENT 2,351 2,335 2,226 16 125 DEFERRED CHARGES 176 181 182 (5) (6)
TOTAL ASSETS 74,563 69,555 54,094 5,008 20,470
LIABILITIES Mar 31, 01 Dec 31, 00 Mar 31, 00Variation
Mar01/Dec00Variation
Mar01/Mar00
CURRENT AND LONG-TERM LIABILITIES 64,715 59,892 45,527 4,822 19,187 DEPOSITS 27,159 27,875 22,131 (716) 5,028 Demand Deposits 5,875 6,398 4,164 (523) 1,711 Savings Deposits 15,751 16,099 14,674 (347) 1,077 Interbank Deposits 354 230 17 124 338 Time Deposits 5,178 5,148 3,276 30 1,902 MONEY MARKET REPURCHASE COMMITMENTS 10,279 11,173 4,289 (894) 5,990 FUNDS FROM ACCEPTANCES AND DEBENTURES 3,115 2,967 3,140 148 (25) INTERBANK AND INTERBRANCH ACCOUNTS 3,754 540 2,504 3,214 1,250 BORROWINGS 5,284 3,652 3,570 1,632 1,714 ON-LENDING BORROWINGS 3,277 3,220 1,900 56 1,377 OTHERS 11,848 10,466 7,993 1,382 3,854 TECHNICAL PROVISIONS OF INSURANCE, PENSION PLANS AND CAP. 2,344 2,337 1,904 8 440
DEFERRED INCOME 117 138 143 (21) (26)
MINORY INTEREST IN SUBSIDARIES 572 546 395 26 177
STOCKHOLDER'S EQUITY 6,816 6,642 6,125 174 691
TOTAL LIABILITIES AND STOCKHOLDER'S EQUITY 74,563 69,555 54,094 5,008 20,470
DEPOSITS 27,159 27,875 22,131 (716) 5,028 FUNDS + PORTFOLIO UNDER MANAGEMENT 44,366 42,025 34,135 2,341 10,231
TOTAL 71,525 69,900 56,266 1,625 15,258

47
Banco Itaú S.A.First Quarter of 2001Executive Summary
R$ Million
Statements of Income
The effects of exchange variation on foreign investments are distributed in the Statement of Income according to thenature of the corresponding accounts.
1ST Q./01 4T H Q./00 1ST Q./00Variation
1Q.01/4Q.00Variation
1Q.01/1Q.00
INTEREST INCOME 3,676 3,422 1,614 255 2,062 Loans 1,823 1,603 768 220 1,055 Leases 181 184 145 (3) 36 Securities 1,585 1,561 652 24 933 Trade Finace and Foreign Portifolio 20 32 2 (12) 18 Compulsory Deposits 67 43 49 25 19
INTEREST EXPENSES (2,446) (2,083) (663) (364) (1,783) Deposits, Money Market and Interbank Funds (1,615) (1,343) (370) (272) (1,245) Borrowings, Assignments and On -Lending (455) (297) (27) (158) (428) Leases (142) (149) (116) 7 (26) Provision for Loan Losses (234) (294) (151) 59 (84)
NET INCOME AFTER PROVISION FOR LOAN LOSSES 1,230 1,339 951 (109) 279
OTHER OPERATING INCOME (EXPENSES) (448) (731) (410) 283 (38) Bank Service Fees 982 958 802 25 181 Capitalization, Insurance and Pension Plans Premiums 625 581 466 44 159 Expenses on Techinical Provisions for Insurance, Pension Plan and Capitalization Operations (197) (179) (103) (17) (93) Insurance Claims (200) (200) (182) 0 (18) Selling Expenses - Insurance (43) (53) (50) 10 7 Pension Plans Benefits Expenses (54) (44) (42) (10) (12) Salaries and Employee Benefits (612) (725) (517) 113 (96) Other Administrative Expenses (789) (814) (636) 25 (153) Tax Expenses (153) (163) (141) 11 (11) Equity Share in Income of Subsidarie and Affiliates 10 25 12 (15) (2) Other Operating Income 168 181 88 (13) 79 Other Operating Expenses (186) (296) (106) 111 (79)
Operating Income 782 608 541 174 241
Non-Operating Income 36 (23) 10 59 26
Income before income Tax and Social Contribution and Profit Sharing 818 585 551 233 267
INCOME TAX AND SOCIAL CONTRIBUTION (77) 86 (159) (163) 83
EXTRAORDINARY RESULTS (25) (41) - 16 (25)
PROFIT SHARING (60) (12) (29) (48) (32)
MINORITY INTERESTS (30) (39) 2 9 (32)
NET INCOME 625 579 365 47 260
NUMBER OF OUTSTANDING SHARES * (in thousands) 113,484,949 115,119,852 117,844,337 (1,634,903) (4,359,388)
BOOK VALUE PER THOUSAND SHARES - R$ 60.06 57.70 51.97 2.36 8.08
NET INCOME PER THOUSAND SHARES - R$ 5.51 5.03 3.10 0.48 2.40
(*) Redution by the repurchase of share program.
The Management Discussion and Analysis and the Consolidated Financial Statements are available on the website:http:// www.itau.com.br
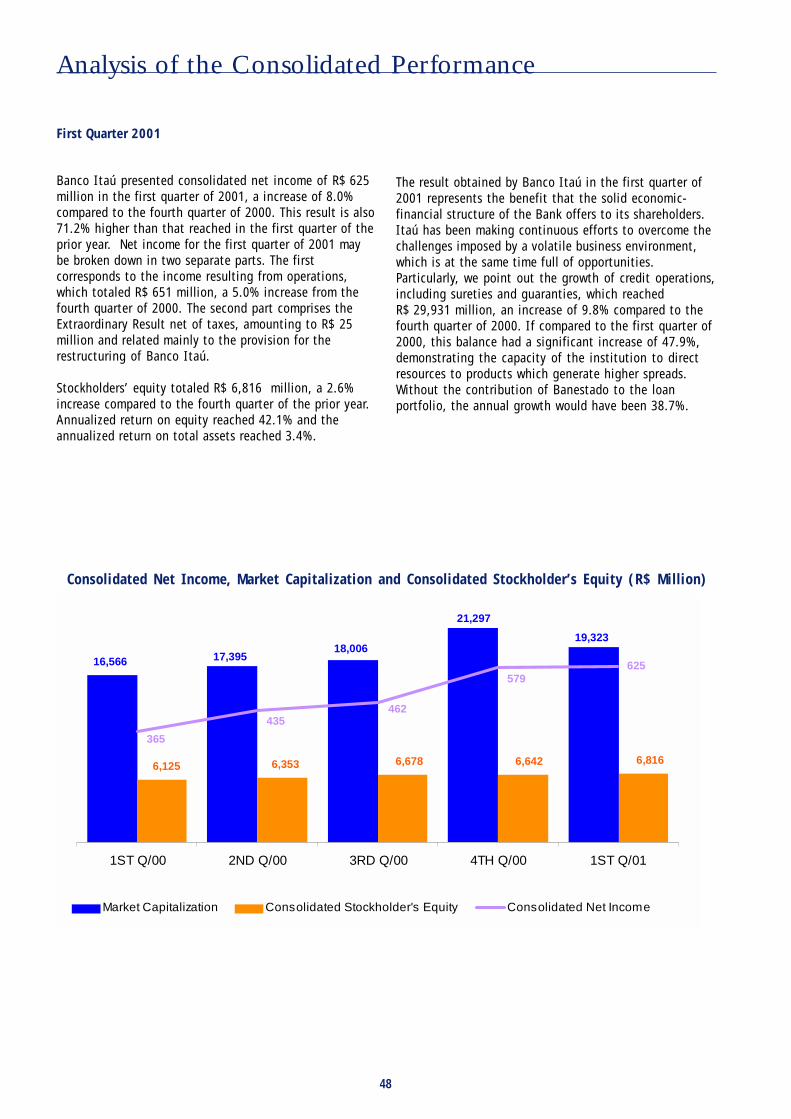
48
16,566 17,39518,006
21,297
19,323
6,816 6,6426,6786,3536,125
625
365
435462
579
1ST Q/00 2ND Q/00 3RD Q/00 4TH Q/00 1ST Q/01
Market Capitalization Consolidated Stockholder's Equity Consolidated Net Income
Consolidated Net Income, Market Capitalization and Consolidated Stockholder’s Equity (R$ Million)
First Quarter 2001
Banco Itaú presented consolidated net income of R$ 625million in the first quarter of 2001, a increase of 8.0%compared to the fourth quarter of 2000. This result is also71.2% higher than that reached in the first quarter of theprior year. Net income for the first quarter of 2001 maybe broken down in two separate parts. The firstcorresponds to the income resulting from operations,which totaled R$ 651 million, a 5.0% increase from thefourth quarter of 2000. The second part comprises theExtraordinary Result net of taxes, amounting to R$ 25million and related mainly to the provision for therestructuring of Banco Itaú.
Stockholders’ equity totaled R$ 6,816 million, a 2.6%increase compared to the fourth quarter of the prior year.Annualized return on equity reached 42.1% and theannualized return on total assets reached 3.4%.
The result obtained by Banco Itaú in the first quarter of2001 represents the benefit that the solid economic-financial structure of the Bank offers to its shareholders.Itaú has been making continuous efforts to overcome thechallenges imposed by a volatile business environment,which is at the same time full of opportunities.Particularly, we point out the growth of credit operations,including sureties and guaranties, which reachedR$ 29,931 million, an increase of 9.8% compared to thefourth quarter of 2000. If compared to the first quarter of2000, this balance had a significant increase of 47.9%,demonstrating the capacity of the institution to directresources to products which generate higher spreads.Without the contribution of Banestado to the loanportfolio, the annual growth would have been 38.7%.
Analysis of the Consolidated Performance
49
Analysis of the Consolidated Performance
Significant Events
The first quarter of 2001 was marked by several events, whichhave strengthened the leading position of Banco Itaú. Amongthem, we point out:
The Institution
The adoption of the Code of Ethics to be followed by allmanagement and employees, including those of the subsidiarycompanies, represents an important improvement in thepractice of good corporate governance in our country.
Internet
The launching of the new Itaú Internet portal, offering anew site for the communication of products and services ofthe Bank.
Launching of the Itaumotors site, which facilitate thebuying, selling and exchange of vehicles between ourcustomers, besides offering consultation and use of variousproducts and financial services for the automotive market.
The enlargement of the services and products available onthe Internet, with the creation of Investnet Viva-Voz andPersonalization of Information. Investnet Viva-Voz is a servicewhich permits the Internet user to speak by computer directlywith the bank investment analysts. The Bank also offered toclients the option of paying the DARF (Document for Receiptof Collection of Federal Income) and consulting PaymentOrders by Internet.
Investor Relations
During an event carried out in the Bovespa auditorium(São Paulo’s StockMarket) on February 1, 2001, thespecialized consulting company MZ Consult presented Itaúwith two important awards:
a) Best Investor Relations Website in Brazil (This award wasgranted to Itaú for the second consecutive time).
b) Best On line Annual Report.
New Business
Banco Itaú, together with HSBC and BNP-Paribas banks, wasthe winner of the bid carried out by Complementary PensionSecretariat (SPC) to form a pool that will manage R$ 500million of funds belonging to 22 pension funds underintervention and settlement.
Banco Itaú was the only Latin American institution chosento take part in the “.NET Enterprise Early Adopter” programdeveloped by Microsoft. The advantages of this program forBanco Itaú and other companies include support for allproducts and technology of the “.NET” platform and anexclusive beta site, among others.
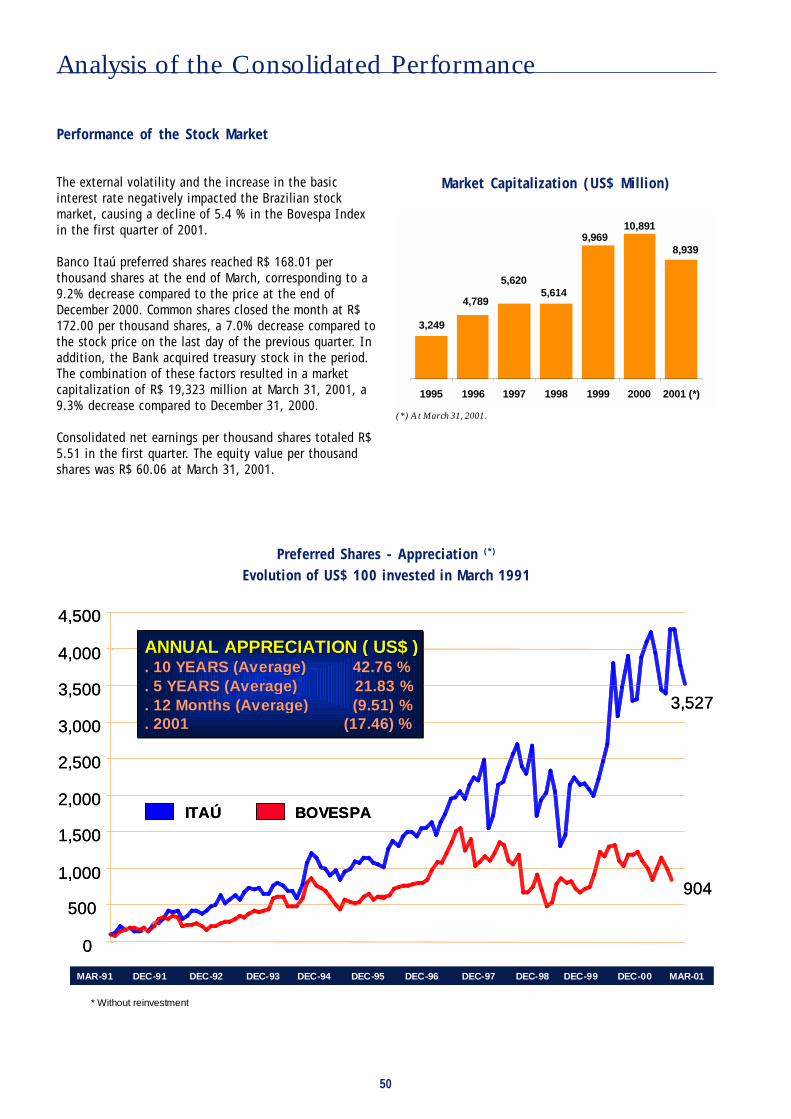
50
Preferred Shares - Appreciation (*)
Evolution of US$ 100 invested in March 1991
Market Capitalization (US$ Million)
(*) At March 31, 2001.
Performance of the Stock Market
The external volatility and the increase in the basicinterest rate negatively impacted the Brazilian stockmarket, causing a decline of 5.4 % in the Bovespa Indexin the first quarter of 2001.
Banco Itaú preferred shares reached R$ 168.01 perthousand shares at the end of March, corresponding to a9.2% decrease compared to the price at the end ofDecember 2000. Common shares closed the month at R$172.00 per thousand shares, a 7.0% decrease compared tothe stock price on the last day of the previous quarter. Inaddition, the Bank acquired treasury stock in the period.The combination of these factors resulted in a marketcapitalization of R$ 19,323 million at March 31, 2001, a9.3% decrease compared to December 31, 2000.
Consolidated net earnings per thousand shares totaled R$5.51 in the first quarter. The equity value per thousandshares was R$ 60.06 at March 31, 2001.
8,939
10,8919,969
5,6145,620
4,789
3,249
1995 1996 1997 1998 1999 2000 2001 (*)
Analysis of the Consolidated Performance
0
500
1,000
1,500
2,000
2,500
3,000
3,500
4,000
4,500
MAR-91 DEC-91 DEC-92 DEC-93 DEC-94 DEC-95 DEC-96 DEC-97 DEC-98 DEC-99 DEC-00 MAR-01
ANNUAL APPRECIATION ( US$ ). 10 YEARS (Average) 42.76 %. 5 YEARS (Average) 21.83 %. 12 Months (Average) (9.51) %. 2001 (17.46) %
ANNUAL APPRECIATION ( US$ )ANNUAL APPRECIATION ( US$ ). 10 YEARS (. 10 YEARS (AverageAverage)) 42.76 %42.76 %. 5 YEARS (. 5 YEARS (AverageAverage) 21.83 %) 21.83 %. 12 . 12 MonthsMonths ((AverageAverage)) (9.51) %(9.51) %. 2001 (17.46) % . 2001 (17.46) %
ITAÚ BOVESPA
3,527
904
* Without reinvestment

51
Financial Margin
Analysis of the Consolidated Net Income for the First Quarter of 2001
We analyze below the various factors which gave rise to the income for the first quarter of 2001 compared to the fourthquarter of 2000.
Financial Margin
Foreign exchange gains/losses related to foreign permanentinvestments of Banco Itaú were recorded as Equity in incomeof affiliated and subsidiary companies up to December 2000.However, as from this quarter, we have reclassified these gains/losses (including prior periods) to better reflect the incomefor the period, by allocating them to revenue and expensescorresponding to the assets and liabilities from which theyoriginated.
Furthermore, for a better analysis of the financial margin,we have also reclassified accounts within the revenue andexpenses from financial intermediation, permitting theanalysis of the financial margin from a standpoint that iscloser to management’s point of view. The accounts havebeen regrouped in the following items:
Credit Operations
Because Credit Operations represents the result of grantingloans and financings to third parties, we have added toCredit Operations the net balance between the revenue andexpenses from leasing operations. The financial income fromforeign trade financing was also added to credit operations.
Income from Securities
We added repurchase commitment expenses, previouslyrecorded in funding expenses, to income from securities, inorder to better reflect the results of negotiation of publicsecurities, fixed and variable income securities, investmentfund shares and derivatives.
Analysis of the Consolidated Performance
R$ Million 1ST Q./01 4T H Q./00 1ST Q./00Variation
1Q.01/4Q.00Variation
1Q.01/1Q.00
Interest Income 3,676 3,422 1,614 255 2,062
Loans 1,823 1,603 768 220 1,055
Leases 181 184 145 (3) 36
Securities Portfolio 1,585 1,561 652 24 933
Trade Finance and Foreign Portifolio 20 32 2 (12) 18
Compulsory Deposits 67 43 49 25 19
Interest Expenses ( * ) (2,212) (1,789) (513) (423) (1,699)
Deposits, Money Market and Interbank Funds (1,615) (1,343) (370) (272) (1,245)
Borrowings, Assignments and On-Lending (455) (297) (27) (158) (428)
Leases (142) (149) (116) 7 (26)
Financial Margin ( * * ) 1,465 1,633 1,102 (168) 363
Provision for Loan Losses (234) (294) (151) 59 (84)
Net Interest Income after Provision for Loan Losses 1,230 1,339 951 (109) 279
(*) Expenses from Financial Operation exclude Provision for Loan Losses.
(**) Financial Margin is the result of the diference between Financial Income and Expenses of Financial Operation.

52
Reallocated Financial Margin
The financial margin in the first quarter of 2001 was R$1,465 million, a R$ 168 million decrease compared to the fourthquarter of 2000. The reduction is associated with higher volatility in the markets, arising from uncertainties related to theperformance of the North American and Argentinian economies.
Reallocated Financial Margin
R$ Million 1ST Q./01 4TH Q./00 1ST Q./00Variation
1Q.01/4Q.00Variation
1Q.01/1Q.00
Loans 1,823 1,603 768 220 1,055
Leases Income 39 35 29 4 11
Foreign Trade Financing 35 22 20 13 15
Total Loans 1,897 1,660 817 238 1,081
Securities Portfolio 1,585 1,561 652 24 933
Forward Market Operations (10) 15 (5) (25) (5)
Expenses from Committed Operations (344) (325) (163) (20) (181)
Total Securities 1,231 1,251 483 (21) 748
Foreign Exchange Portfolio 20 32 2 (12) 18
Foreign Trade Financing/ Foward Market (16) (27) 3 11 (19)
Total Foreign Exchange 4 5 5 (0) (0)
Funding Expenses (1,615) (1,343) (370) (272) (1,245)
Borrowings, Assignments and On-Lending (455) (297) (27) (158) (428)
Expenses from Committed Operations 344 325 163 20 181
Result from Compulsory Deposits 67 43 49 25 19
Foreign Trade Financing (9) (10) (18) 1 9
Total of Funding Expenses (1,668) (1,283) (203) (385) (1,465)
Financial Margin 1,465 1,633 1,102 (168) 363
Income from Foreign Exchange
The financial income and expenses from foreign tradefinancing operations, formerly recorded in income fromforeign exchange, have been reclassified and now areincluded in the balances of credit operations and marketfunding operations, respectively.
Market Funding Operations
Market funding operations expenses and expenses onborrowings and on-lendings were added together, because
they are the result of the same effort of market funding. Wesubtracted the repurchase commitment expenses from marketfunding operations and added it to income from securities,as described above.
The Central Bank determines that part of the fundingperformed by the Bank should be unavailable for use, makingup the compulsory deposits. Therefore, we have reclassifiedthe income from compulsory deposits to funding operations,in order to reflect a more accurate funding cost. Lastly, wedebited the financial expenses associated with the foreignexchange financing operations.
Analysis of the Consolidated Performance

53
From the composition of the financial margin we firsthighlight Credit operation revenues. The increase in thebalance of credit operations positively contributed to netincome for the period. This growth is being ensured bythe strategy to reduce interest rates, together with theeffort to increase the share of more profitable productsamong total products sold. In addition, the extension ofpayment terms has increased these products’competitiveness, resulting in increased revenues within acontext of lower spread. Accordingly, credit operationsrevenues increased 14.3% in the period, totaling R$ 238million.
On the other hand, the adjusted result from securitiesshowed a slight decrease to R$ 1,231 million, from R$1,251 million in prior quarter. We should emphasize thenegative impact of R$ 200 million in derivatives resultingfrom significant changes in the macroeconomic scenario,especially relating to asset positions in the interest
forward market. These positions are used to manage thestructural risk to reduce the gap caused by the Bank’sdeposit volume, mainly in Savings Accounts.
This negative impact was offset by the R$ 162 millionexchange variation gain on Securities portfolio investedabroad. We emphasize that this result does not representthe margin on foreign investments since it does notinclude exchange variation allocated to other income andexpense accounts. For analysis purposes and based onInterbank Deposit Certificate rate (CDI) as a benchmark foropportunity costs, we present below the following resultof foreign operations:
Finally, we emphasize that no provision for securitydevaluation was set up in March for the aforementionedchanges in the economic scenario, since the Bank alreadyhad set up provisions for this purpose.
Result of Foreign Operations
On the other hand, impelled by foreign exchange variation,market funding expenses increased 30.0% in the first quarterof 2001, corresponding to a variation of R$ 385 million.
(*) Equivalent the atualization of investment balance abroad in december 31, 2000 accrued by cupom rate (3.6% ).
Analysis of the Consolidated Performance
R$ Million 1ST Q./01
Foreign Exchange Variation on Investments Abroad 374
Effect from Foreign Exchange Risk Management on Inv. Abroad (87)
Results Abroad 287
Funding Expenses (CDI) * (133)
Management Margin - Investiments Abroad 154
The interaction of the factors described above results inan annualized financial margin rate of 12.4% in the firstquarter of 2001 against 15.5% in the prior quarter.
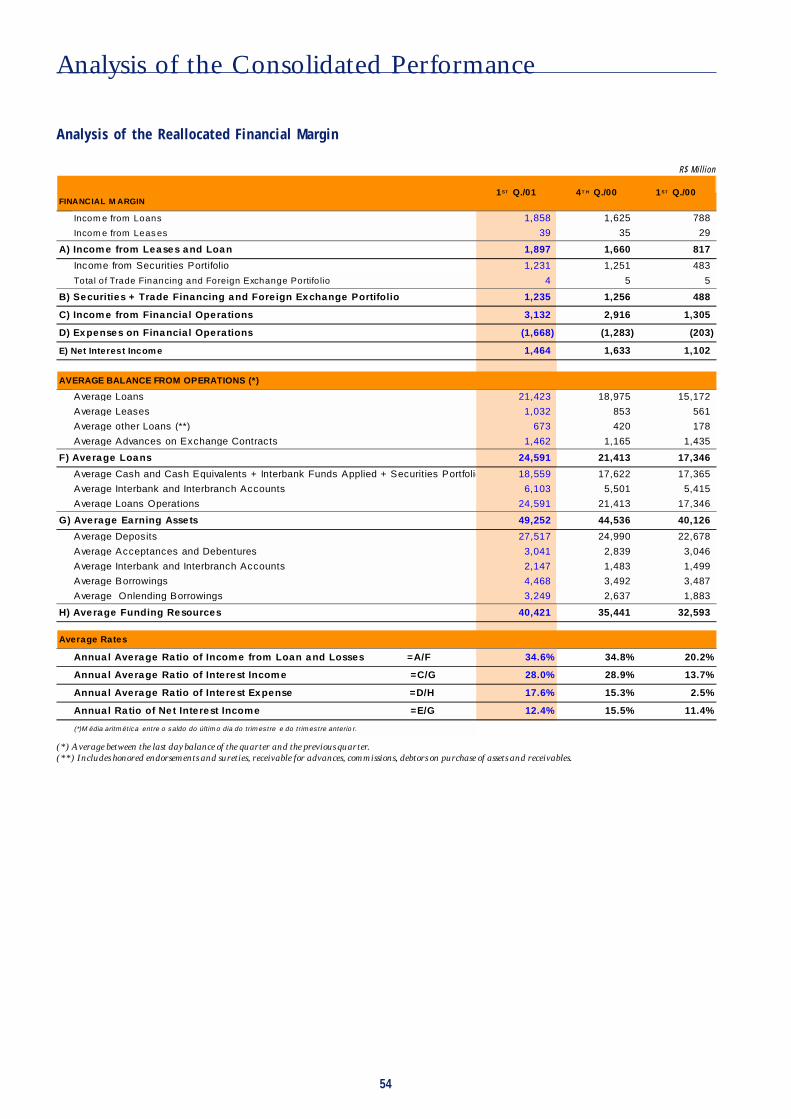
54
Analysis of the Reallocated Financial Margin
R$ Million
(*) Average between the last day balance of the quarter and the previous quarter.(**) Includes honored endorsements and sureties, receivable for advances, commissions, debtors on purchase of assets and receivables.
Analysis of the Consolidated Performance
FINANCIAL M ARGIN
Incom e from Loans 1,858 1,625 788
Incom e from Leas es 39 35 29
A) Incom e from Leases and Loan 1,897 1,660 817
Income from Securities Portifolio 1,231 1,251 483
Total of Trade Financing and Foreign Exchange Portifo lio 4 5 5
B) Securities + Trade Financing and Foreign Exchange Portifolio 1,235 1,256 488
C) Incom e from Financia l Operations 3,132 2,916 1,305
D) Expenses on Financia l Operations (1,668) (1,283) (203)
E) Net Interest Incom e 1,464 1,633 1,102
AVERAGE BALANCE FROM OPERATIONS (*)
Average Loans 21,423 18,975 15,172
Average Leases 1,032 853 561
Average other Loans (**) 673 420 178
Average Advances on Exchange Contracts 1,462 1,165 1,435
F) Average Loans 24,591 21,413 17,346
Average Cash and Cash Equivalents + Interbank Funds Applied + Securities Portfolio 18,559 17,622 17,365
Average Interbank and Interbranch Accounts 6,103 5,501 5,415
Average Loans Operations 24,591 21,413 17,346
G) Average Earning Assets 49,252 44,536 40,126
Average Deposits 27,517 24,990 22,678
Average Acceptances and Debentures 3,041 2,839 3,046
Average Interbank and Interbranch Accounts 2,147 1,483 1,499
Average Borrowings 4,468 3,492 3,487
Average Onlending Borrowings 3,249 2,637 1,883
H) Average Funding Resources 40,421 35,441 32,593
Average Rates
Annua l Average Ratio of Income from Loan and Losses =A/F 34.6% 34.8% 20.2%
Annua l Average Ratio of Inte rest Incom e =C/G 28.0% 28.9% 13.7%
Annua l Average Ratio of Inte rest Expense =D/H 17.6% 15.3% 2.5%
Annua l Ra tio of Ne t Interest Income =E/G 12.4% 15.5% 11.4%
(*)M édia aritm ét ica entre o s aldo do últim o dia do trim estre e do t rim estre anterio r.
1ST Q./01 4T H Q./00 1ST Q./00

55
Results of First Quarter of 2001, by Segment
1ST Q./01 Banking Credit Cards
Insurance, Capitalization and Pension
Plans
Mutual Funds and Portfolio under Management
Corporation CONSOLIDATED
INTEREST INCOME 3,502 114 61 - - 3,676 Loans 1,724 99 1,823 Leases 181 181 Securities Portfolio 1,509 15 61 1,585 Trade Finance and Foreign Exchange 20 20 Compulsory Deposits 67 67
INTEREST EXPENSES (2,211) (1) - - - (2,212) Deposits, Money Market and Interbank Funds (1,615) (1,615) Borrowing, Assignments and On-Lending (454) (1) (455) Leases (142) (142)
FINANCIAL MARGIN 1,291 113 61 - - 1,464
Provision for Loan Losses (161) (74) 1 (234)
NET INCOME AFTER PROVISION FOR LOAN LOSSES 1,130 39 63 - - 1,231
OTHER INCOME (EXPENSES) OPERATIONAL (631) 56 (2) 70 58 (448) Banking Service Fees 532 246 1 210 (7) 982 Transfers to Banking 86 (86) 0 Earned Premiums of Capitalization, Insurance and Pension Plans 23 108 131 Administrative Expenses (1,197) (107) (108) (48) 57 (1,401) Tax Expenses (113) (27) (12) (7) 7 (153) Equity Share in income of Subsidaries and Affiliates 10 10 Other Operating Income/Expenses 28 (56) 9 (18)
OPERATING RESULT 499 95 61 70 58 782
NON-OPERATING RESULT 34 3 37
INCOME BEFORE TAX 533 95 64 70 58 818
INCOME TAX AND SOCIAL CONTRIBUTION (178) (32) (22) (24) 179 (77)
EXTRAORDINARY RESULT (25) (25)
PROFIT SHARING (53) (2) (5) (60)
MINORITY INTEREST IN SUBSIDARIES (30) (30)
NET INCOME 302 60 42 41 181 625
The results broken down by segment show thecontributions of the different activity areas of theconglomerate to net income for the first quarter of 2001.
The Bank has eliminated revenue and expenses arisingfrom operations between segments.Equity in the income of companies not relating to thesegment was reallocated to the proper segment.Taxes on income were calculated at the rate of 34% ineach segment while the increase or decrease of tax arisingfrom temporary differences and other tax effects wasreallocated to the Bank.
The results in each segment differ from the accountingresults presented in other notes, due to the effectsmentioned above.
Analysis of the Consolidated Performance
�����������
����� �������
��� �
����������
��
��� �����������
�������������
��
� ����
��
���
�� �� �����
���
��� ���
!"�
R$ Million

56
Allowance for Loan Losses
The expenses for the allowance for loan losses in the first quarter of 2001 totaled R$ 234 million, a 20.2% decreasecompared to the prior quarter.
We present below the changes in the allowance for loan losses per risk level. Note that R$ 151 million of total expense refersto Contracts (new operations), R$ 62 million of which refer to levels F, G and H and are basically formed by composition ofdebts.
Allowance for Loan Losses by Risk Levels
March 31,01 R$ Million
Risk Level Normal Course
Falling Due Past Due Falling Due Falling Due Past Due
AA 0.0% - - 7,102 7,102 - - - 13 13
A 0.5% - - 6,548 6,548 - - 33 25 57
B 1.0% 449 201 6,592 7,242 4 2 66 129 202
C 3.0% 519 92 1,176 1,786 16 3 35 98 152
D 10.0% 319 126 788 1,233 32 13 79 202 325
E 30.0% 41 67 149 257 12 20 45 44 121
F 50.0% 133 94 242 469 66 47 121 67 302
G 70.0% 40 63 89 191 28 44 62 52 186
H 100.0% 180 409 90 679 180 409 90 - 679
TOTAL 1,681 1,051 22,775 25,507 339 537 530 630 2,036
December 31,00 R$ Million
Risk Level Normal Course
Falling Due Past Due Falling Due Falling Due Past Due
AA 0.0% - - 6,407 6,407 - - - - -
A 0.5% - - 5,527 5,527 - - 28 155 183
B 1.0% 138 184 6,637 6,959 1 2 67 288 358
C 3.0% 363 91 1,282 1,736 11 3 38 58 110
D 10.0% 334 109 1,003 1,447 33 11 100 68 213
E 30.0% 48 63 163 275 14 19 49 8 90
F 50.0% 211 94 119 425 105 47 60 20 232
G 70.0% 36 56 101 192 25 39 70 6 140
H 100.0% 173 445 89 707 173 445 89 - 707
TOTAL 1,304 1,041 21,329 23,674 364 565 501 603 2,033
Existing Provision
Credit Portfolio% Provision
Required
Minimum Provison Required
SpecificGeneric
Excess Provision
Abnormal CourseTotal
Minimum Provison Required
Abnormal CourseTotal
Specific Existing Provision
GenericExcess
Provision
% Provision Required
Credit Portfolio
Changes in Provision for Loan Losses by Risk Level
New ContractsRisk Level
TransferSettlement TOTAL
AA - - - - - - -
A 28 10 (0) (5) 5 - 33
B 70 18 (2) (12) 3 - 73
C 52 16 (3) (11) 2 - 54
D 145 39 (31) (30) (21) - 123
E 82 4 (4) (5) (5) - 77
F 212 42 (3) (17) 22 - 234
G 135 2 2 (4) (1) - 134
H 707 18 202 (18) 203 (231) 679
Adtional 603 - 27 - 27 - 630
TOTAL 2,033 151 186 (103) 234 (231) 2,036
BALANCE Mar 31,01RISK LEVEL
BALANCE Dec 31,00
CREDIT PORTFOLIO
WRITE-OFF
R$ Million
Analysis of the Consolidated Performance

57
The table below shows the changes in the loan portfolio per risk level, showing a 7.7% increase as compared to December31, 2000. Of these changes, we highlight Contracts (new operations) in the amount of R$ 7,592 million and Settlements(fully written off) totaling R$ 4,981 million.
The quality of the loan portfolio remained stable in the period.However, management decided to increase the surplusprovisions set up to cover market stress situations in R$ 27million, driven by prudence and conservatism.
The write-offs carried out during the first quarter of 2001totaled R$ 231 million, a 123.6% increase compared to theprior quarter. Resolution 2,682 changed the term forrecording doubtful loans in the balance sheet, restrainingthe write-offs. After a year of the enactment of this resolution,we noted the significant growth in the total write-offs forthe period.
Movements of Credit Portfolio by Risk LevelR$ Million
Analysis of the Consolidated Performance
In the first quarter of 2001, R$ 70 million of creditspreviously written-off against the provision for loans losseswere renegotiated or recovered, and these gains wereclassified as Income from Credit Operations.
The balance of the allowance for loan losses at the end ofthe first quarter of 2001 totaled R$ 2,036 million, a 0.2%variation compared to the balance of the prior quarter. Therelation between this balance and the total credit portfoliodecreased, corresponding to 8.0% at March 31 against 8.6%at the end of December 2000. The quality of the creditportfolio remained stable, with 82.0% of the balance at risklevels better than C.
BALANCE Dec 31,00
New Contracts Transfers Settlement WRITE-OFFBALANCE Dec 31,01
AA 6,407 2,674 (9) (2,002) - 7,071
A 5,527 2,094 (66) (999) - 6,556
B 6,959 1,776 (234) (1,234) - 7,266
C 1,736 533 (107) (376) - 1,786
D 1,447 394 (308) (300) - 1,233
E 275 15 (15) (18) - 257
F 425 84 (6) (34) - 469
G 192 3 2 (6) - 191
H 707 18 196 (12) (231) 679
TOTAL 23,674 7,592 (546) (4,981) (231) 25,507
RISK LEVEL
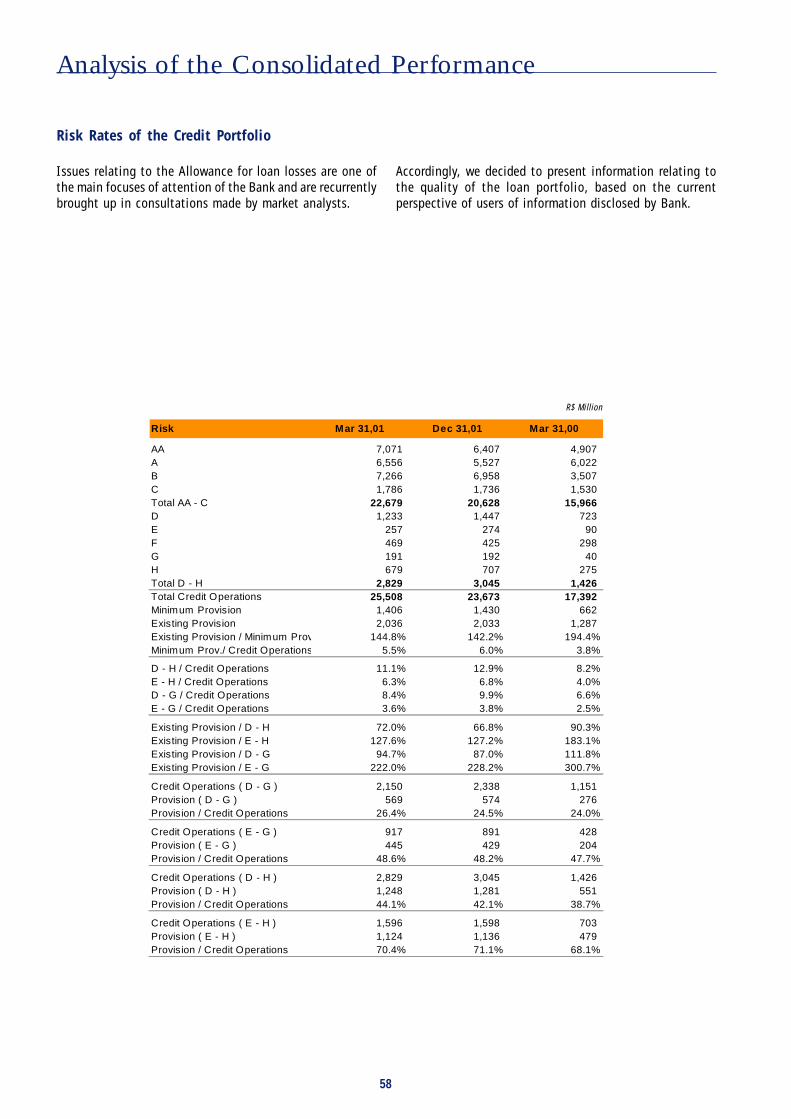
58
Risk Mar 31,01 Dec 31,01 Mar 31,00
AA 7,071 6,407 4,907 A 6,556 5,527 6,022 B 7,266 6,958 3,507 C 1,786 1,736 1,530 Total AA - C 22,679 20,628 15,966 D 1,233 1,447 723 E 257 274 90 F 469 425 298 G 191 192 40 H 679 707 275 Total D - H 2,829 3,045 1,426 Total Credit Operations 25,508 23,673 17,392 Minimum Provision 1,406 1,430 662 Existing Provision 2,036 2,033 1,287 Existing Provision / Minimum Prov 144.8% 142.2% 194.4%Minimum Prov./ Credit Operations 5.5% 6.0% 3.8%
D - H / Credit Operations 11.1% 12.9% 8.2%E - H / Credit Operations 6.3% 6.8% 4.0%D - G / Credit Operations 8.4% 9.9% 6.6%E - G / Credit Operations 3.6% 3.8% 2.5%
Existing Provision / D - H 72.0% 66.8% 90.3%Existing Provision / E - H 127.6% 127.2% 183.1%Existing Provision / D - G 94.7% 87.0% 111.8%Existing Provision / E - G 222.0% 228.2% 300.7%
Credit Operations ( D - G ) 2,150 2,338 1,151 Provision ( D - G ) 569 574 276 Provision / Credit Operations 26.4% 24.5% 24.0%
Credit Operations ( E - G ) 917 891 428 Provision ( E - G ) 445 429 204 Provision / Credit Operations 48.6% 48.2% 47.7%
Credit Operations ( D - H ) 2,829 3,045 1,426 Provision ( D - H ) 1,248 1,281 551 Provision / Credit Operations 44.1% 42.1% 38.7%
Credit Operations ( E - H ) 1,596 1,598 703 Provision ( E - H ) 1,124 1,136 479 Provision / Credit Operations 70.4% 71.1% 68.1%
R$ Million
Risk Rates of the Credit Portfolio
Analysis of the Consolidated Performance
Issues relating to the Allowance for loan losses are one ofthe main focuses of attention of the Bank and are recurrentlybrought up in consultations made by market analysts.
Accordingly, we decided to present information relating tothe quality of the loan portfolio, based on the currentperspective of users of information disclosed by Bank.
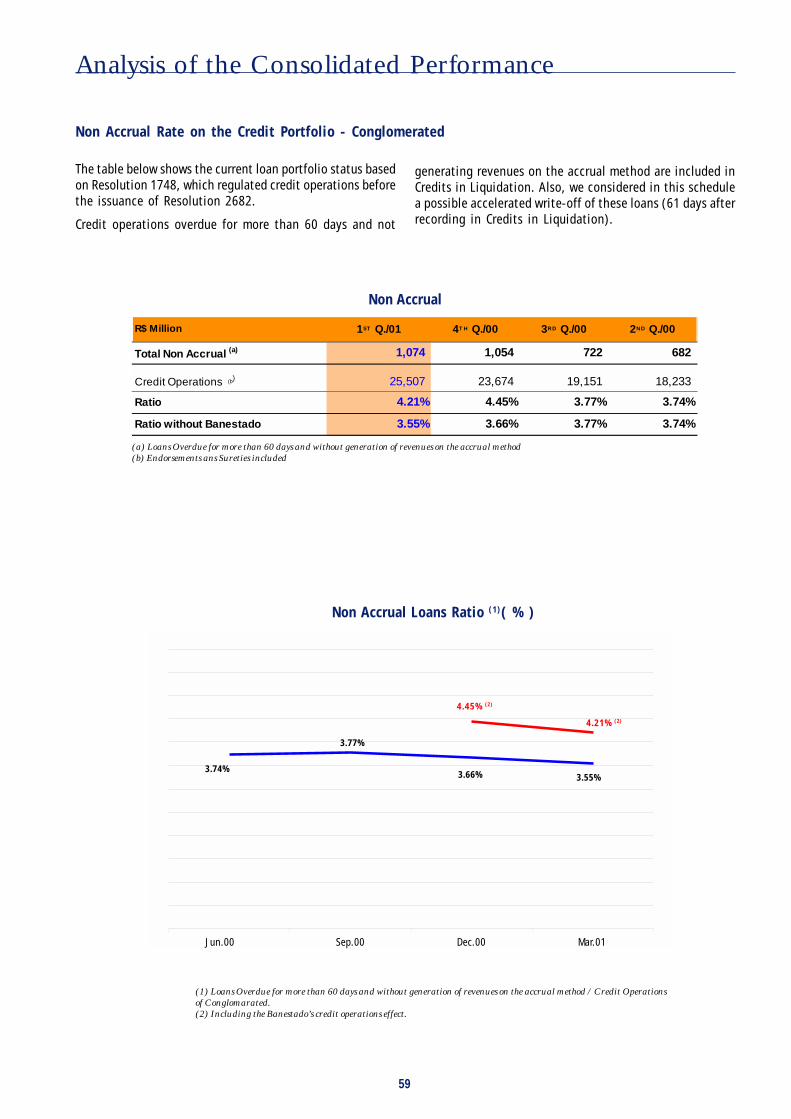
59
(a) Loans Overdue for more than 60 days and without generation of revenues on the accrual method(b) Endorsements ans Sureties included
Non Accrual Rate on the Credit Portfolio - Conglomerated
Non Accrual
R$ Million 1ST Q./01 4T H Q./00 3RD Q./00 2ND Q./00
Total Non Accrual (a) 1,074 1,054 722 682
Credit Operations (b) 25,507 23,674 19,151 18,233
Ratio 4.21% 4.45% 3.77% 3.74%
Ratio without Banestado 3.55% 3.66% 3.77% 3.74%
Non Accrual Loans Ratio (1)( % )
(1) Loans Overdue for more than 60 days and without generation of revenues on the accrual method / Credit Operationsof Conglomarated.(2) Including the Banestado’s credit operations effect.
Jun.00 Sep.00 Dec.00 Mar.01
3.77%
3.66% 3.55%3.74%
4.45% (2)
4.21% (2)
Analysis of the Consolidated Performance
The table below shows the current loan portfolio status basedon Resolution 1748, which regulated credit operations beforethe issuance of Resolution 2682.
Credit operations overdue for more than 60 days and not
generating revenues on the accrual method are included inCredits in Liquidation. Also, we considered in this schedulea possible accelerated write-off of these loans (61 days afterrecording in Credits in Liquidation).

60
Analysis of the Consolidated Performance
Banking Service Fees
In the first quarter of 2001, Banking Service Fees totaledR$ 982 million, representing a R$ 24 million increase ascompared to the R$ 958 million generated in the fourthquarter of 2000, and a R$ 180 million increase in relationto the first quarter of 2000.
The R$ 180 million variation was mainly due to theinclusion in the Consolidated Statements of Banestado asfrom October 2000 (R$ 40 million) and Serasa - Centraliza-ção de Serviços Bancários - as from June 2000 (R$ 22million), as well as the R$ 56 million increase in CreditCard revenues and the R$ 30 million increase in revenuesfrom Credit Operation fees.
The coverage ratio (Banking Service Fees/TotalAdministrative Expenses (Salaries and BenefitsExpenses+Other)), was 70% in the first quarter of 2001, asshown in the following chart. Considering only Salariesand Benefits Expenses, this ratio is 160%.
Products and Services
Itaú has been developing new products and services andenhancing existing ones to meet its clients’ needs. The Bank’sconsolidated position in March 2001 totals 7.6 million ac-tive clients.
The evolution in the number of products by type of clientis represented as follows:
Banking Service Fees Coverage Index overAdministrative Expenses (*) Conceptually, a client(represented by a CPF/CGC) is considered active when performing one
or more transactions in current account per month or has an average 3-month balance not null incash deposits.
Investment Fund Management
Investment Fund Management revenues totaled R$ 210 mil-lion in the first quarter of 2001, a 2.9% increase as com-pared to the fourth quarter of 2000 (R$ 204 million). Thisincrease is chiefly due to the 5.7% increase in the volumeof the funds managed, which totaled R$ 44.4 billion in thefirst quarter.
Quantity of Products byType of Active Client* - Banco Itaú
R$ Million 1st Q.2001 4th Q.2000 1st Q.2000 1st Q.01x4th Q.00 1st Q.01x1st Q.00
Fund Management Fees 210 204 207 6 3 Collection Fees 54 58 52 (4) 2 Current account Fees 173 168 140 5 33 Tax Collection Fees 51 42 41 9 10 Interbank Fees (bills, checks and documents) 42 43 35 (1) 7 Credit Operations 74 58 45 16 29 Credit Cards 246 245 190 1 56 Other Services 132 140 92 (8) 40
Total 982 958 802 24 180
155%165%
154%
132%
160%
69% 71% 67% 70%63%
1st Q /00 2nd Q /00 3rd Q /00 4th Q /00 1st Q /01
Total Administrative Expenses Salaries and Benefits Expenses
100%
4.7 4.8 4.85.05.0
3.6
4.24.3 4.4
4.6
1st Q /00 2nd Q /00 3rd Q /00 4th Q /00 1st Q /01
Individuals Corporate

61
Analysis of the Consolidated Performance
Credit Operations
In the first quarter of 2001 Credit Operation Services Rev-enues totaled R$ 74 million, a R$ 16 million and R$ 29million increase as compared to the R$ 58 million gener-ated in the fourth quarter of 2000 and the R$ 45 million inthe first quarter of 2000, respectively. These increases aremainly due to the increase in the sale of personal creditproducts, especially pre-approved credit to clients, andleases, as well as the increase in some service fees relatingto current account loans, as from January 2001.
Current and Savings Accounts
Current Account revenues totaled R$ 173 million in the firstquarter of 2001, a 3.0% increase as compared to the R$ 168million generated during the fourth quarter of 2000. Thisincrease is due to the changes in fees charged for returnedchecks and other documents due to lack of funds, BasicMaxiConta monthly fees and MaxiConta Overdraft fees.
Accordingly, the R$ 33 million increase, obtained by com-paring the first quarters of 2001 and 2000, is the result ofthe aforementioned effects, together with the acquisitionof Banestado, which accounted for R$ 18 million.
The campaign “Itaú has everything but you”, launched inApril 2000, is the reason behind the constant expansion ofthe client base, evidenced by the increase in the number ofcurrent accounts, which in March 2001 totaled 11.0 millionversus 9.4 million in the previous year.
Tax Collections
In the first quarter of 2001 Tax Collection Service Revenuesposted a R$ 9 million increase as compared to the fourthquarter of 2000. This increase is mainly due to the VehicleTax (IPVA) and Municipal Real Estate Tax (IPTU) paid in ourbranches, which increase significantly at the beginning ofthe year.
The 63 million payment documents processed in the firstquarter of 2001 represent a 23.5% increase as compared tothe fourth quarter of 2000.
��� �������
Resources Under Management
Collection
In the first quarter of 2001 Collection revenues decreased6.9% to R$ 54 million as compared to the fourth quarter of2000 (R$ 58 million). The settlement volume in the firstquarter of 2001 totaled R$ 27,438 million, a 1.1% decreasein relation to the fourth quarter of 2000. In addition, thenumber of processed documents decreased 2.9% in the pe-riod under analysis. This is due to the seasonal increaserecorded in the prior quarter.
Credit Cards
In the first quarter of 2001 service revenues related to creditcards administration and processing totaled R$ 246 mil-lion, practically unchanged as compared to revenues gen-erated in the fourth quarter of 2000. It should be empha-sized that by comparing these results to the first quarter of2000 we note a R$ 56 million increase, basically due to theincrease in the credit card base.
Itaú, Banerj, Bemge and Banestado (begining in the 4th Q./00 )
Quantity of Credit Cards x Market Share
R$ Million 1st Q. 2001 4th Q. 2000
Collateral Income and Financial Management Services 91 87Annual Fees 58 57
Other Services 97 101
Total 246 245
6.65.8
5.55.6
36.533.9
30.728.725.8
17.013.8
38.86.2
3.94.1
5.4
Dec.97 Dec.98 Dec.99 Mar.00 Jun.00 Sep.00 Dec.00 Mar.01
Investment funds Managed portfolios
42.0
17.7
34.132.0
21.1
37.339.7
44.4
3,5213,3212,811
2,5562,4072,2792,0391,8751,870
11.6%11.9%
10.7%10.3%10.0%9.7%
9.1%8.4%8.4%
0
500
1,000
1,500
2,000
2,500
3,000
3,500
4,000
Mar/99 Jun/99 Sep/99 Dec/99 Mar/00 Jun/00 Sep/00 Dec/00 Mar/01
Mil
0%
2%
4%
6%
8%
10%
12%
14%
Number of cards (thousands) Market share(%)

62
Analysis of the Consolidated Performance
In March 2001 Itaú launched the Itaucard Mastercard creditcard containing a computer chip with enough memory tostore a series of information and new functions. The Bankissued 40,000 cards as part of a pilot project, which isintended to be extended to the entire credit card base.
Itaú holds a 33.33% stake in Credicard, the leading creditcard management company in Brazil, which accounts for32.4% of total credit card service revenues in the firstquarter of 2001.
At March 31, 2001 Itaú was entitled to 35.7% of Credicard’snet income, considering the Bank’s stake in this companyand the special dividends paid - a portion of net incomedistributed as a result of the performance of each partner’scredit card base.
Strategic Alliance with America On LineLatin America (AOLA)
About the strategic alliance stablished between Itaú andAmerica On Line Latin America (AOLA), it is important tohighlight two things: services started on january, 2001with 38 thousand registered customers; and, on may, 2001,we reached more than 100 thousand active customers reg-istered, performing more than a 163% increase.
Internet
Itaú continues to intensively enhance its web sites be-cause it considers the Internet to be a channel for com-municating and distributing financial services and prod-ucts, which can be used to strengthen the Bank’s rela-tionship with its client base.
In the first quarter of 2001 we can highlight the launch-ing of the new Itaú Home Page, the new Bankline Internetof Itaú, Personnalité and Banerj, as well as the web sitesItaumotors, Itaú/AOL, Private Bank and the new versionof Itaú Shopline.
These measures resulted in an 11.2% increase in the num-ber of clients registered in the Home & Office Bankingservice, from 1.43 million in the fourth quarter of 2000 to1.59 million in the first quarter of 2001. If we comparethis figure with the first quarter of 2000, the number ofregistered clients increased 35.9%.
Such increase in the number of registered clients also re-flects in the volume of transactions which, in the firstquarter of 2001, totaled 28 milion, 21.7% higher thanthe one registered in the 4th quarter of 2000 and 154.6%higher compared to the same period of 2000.
Itaú, Banerj, Bemge and Banestado (as from 4th quarter/00)
Volume of Transactions on Home & Office Banking���� ���� � ����� ��� �������
Home & Office Banking Transactionsby Client Type
��������� ����� ����������
10.0
8.77.6
7.06.7
5.85.04.74.7
4.0
7.1
6.2
5.75.5
5.35.2
4.74.44.4
3.9
Dec/98 Mar/99 Jun/99 Sep/99 Dec/99 Mar/00 Jun/00 Sep/00 Dec/00 Mar-01
Corporate
Individuals
2 0 2 2 2 2 2 2 2 2 2 2 2 2 2 1 1 9
45
7
1 51 8
2 3 2 8
8 1 1
�������� ������ ������� ������� �������� ������ ������� ������� ��������
Direct connection Internet Banking
1.6
1.4 1.3 1.2
1.0 1.0 0.9
1.4
1.1
Clients registered in Home & Office Banking
(mill ion)
Itaú, Banerj, Bemge and Banestado (since the 4th Quarter/00)

63
Insurance, Capitalization and Pension Plan Operations
Technical Provisions of Insurance, Capitalization andPension Plans - Uncommitted
Technical Provisions of Insurance, Capitalization andPension Plans - Committed
Analysis of the Consolidated Performance
R$ Million 1ST Q/01 4TH Q/00 1ST Q/00 1STQ/01 x 4THQ/00 1THQ/01 x 1THQ/00
Revenues from Insurance, Capitalization and Pension Plans 625 581 466 44 159 Revenues from Insurance 313 293 281 20 32 Revenues from Capitalization 197 137 109 60 88 Revenues from Pension Plans 115 151 76 (36) 39 Changes in Technical Provisions (197) (179) (103) (17) (93) Retained Claims (200) (200) (182) 0 (18) Selling Expenses (43) (53) (50) 10 7 Pension Plan Benefits Expenses (54) (44) (42) (10) (12)
Partial Result of Insurance, Capitalization and Pension Plans 132 104 88 27 43
The table above shows the evolution of the partial result ofInsurance, Capitalization and Pension Plans from R$ 104million in the fourth quarter of 2000 to R$ 132 million inthe first quarter of 2001, an increase of R$ 27 million or26% in relation to the fourth quarter of 2000.
We should also highlight the R$ 43 million or 49% growthin results for the first quarter of 2001 as compared to thesame period last year.
We emphasize that these amounts do not reflect the involvedcompanies’ net income, since financial income arising fromthe investment of reserves is allocated to the financialmargin, and administrative expenses are consolidated withthose of the other companies of the conglomerate.
We present below the evolution of the insurance,capitalization and pension plan technical provisions, wherewe highlight the 8.3% increase in pension plan technicalprovisions in the first quarter of 2001 as compared to thefourth quarter of 2000 and the 61.3% increase in relationto the same period last year.
R$ Million 03/31/2001 12/31/2000 03/31/2000
Insurance 574 595 525
Capitalization 871 911 822
Pension Plans 900 831 558
Total 2,344 2,337 1,904
R$ Million 03/31/2001 12/31/2000 03/31/2000
Insurance 368 353 268
Capitalization 2 2 1
Pension Plans 75 71 63
Total 445 425 332
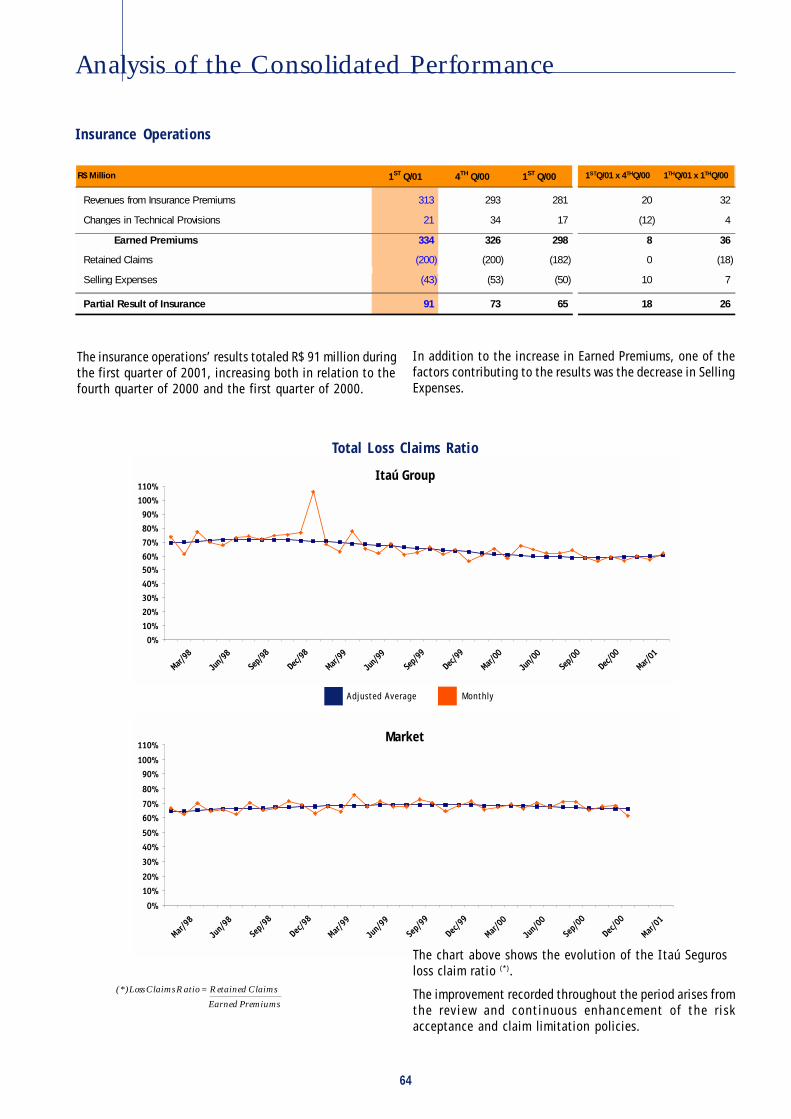
64
��
���
���
���
���
���
���
��
��
���
����
����
� ���
�����
�����
�����
� ����
������
������
������
� ����
������
������
������
� ����
��
���
���
���
���
���
���
��
��
���
����
����
� ���
�����
�����
�����
� ����
������
������
������
� ����
������
������
������
� ����
R$ Million 1ST Q/01 4TH Q/00 1ST Q/00 1STQ/01 x 4THQ/00 1THQ/01 x 1THQ/00
Revenues from Insurance Premiums 313 293 281 20 32
Changes in Technical Provisions 21 34 17 (12) 4
Earned Premiums 334 326 298 8 36
Retained Claims (200) (200) (182) 0 (18)
Selling Expenses (43) (53) (50) 10 7
Partial Result of Insurance 91 73 65 18 26
Itaú Group
Insurance Operations
Total Loss Claims Ratio
Analysis of the Consolidated Performance
Monthly
The chart above shows the evolution of the Itaú Segurosloss claim ratio (*).
The improvement recorded throughout the period arises fromthe review and continuous enhancement of the riskacceptance and claim limitation policies.
The insurance operations’ results totaled R$ 91 million duringthe first quarter of 2001, increasing both in relation to thefourth quarter of 2000 and the first quarter of 2000.
In addition to the increase in Earned Premiums, one of thefactors contributing to the results was the decrease in SellingExpenses.
Market
(*)Loss Claims Ratio = Retained Claims
Earned Premiums
Adjusted Average

65
Itaú Seguros Consolidated(*)
Itaú Seguros/Banerj Seguros/Bemge Seguradora/Gralha Azul/Paraná Seguros(Corporate Legislation)
Composition of Earned Premiums - Itaú Group
The vehicle portfolio represented 41% of Itaú group insurance companies’ total Earned Premiums in the first quarter of 2001.The strategies to sell Itauvida and PPI products via the Bank channel resulted in a change in the mix of the portfolio, withthe reduction of the vehicle segment share as compared to the first quarter of 2000.
(*) Itaú Seguros Consolidated includes Gralha Azul and Paraná Seguros as from February 2001. These companiescontributed R$ 41 million in Earned Premiums and R$ 33 million in claims in this period. In the insuranceoperations of Itaú conglomerate, these companies have been consolidated since October 2000.
Analysis of the Consolidated Performance
Vehicle Life Property Transportation
1st Quarter/2001 4th Quarter/2000 1st Quarter/2000
���
���
��
��
���
���
���
��
�
���
��
��
��
�
���
(**) Combined Ratio = Retained Claims + Selling Expenses + Administrative Expenses + Other Operating Income (Expenses) Earned Premiums
Others
R$ Million
4TH Q/001ST Q/01 1ST Q/00
312
21
333
(199)
(54)
(59)
1
23
30
53
(0)
(18)
(0)
3
(0)
38
702
23.3%
59.6%
16.3%
17.2%
93.2%
574
2,284
512
1,469
303
262
21
283
(162)
(55)
(51)
0
15
44
59
(2)
4
(5)
-
(0)
56
663
23.7%
57.3%
19.5%
18.0%
94.8%
549
2,207
540
1,388
279
278
18
297
(181)
(60)
(45)
(3)
8
39
47
(1)
(17)
(0)
-
(0)
29
615
20.3%
60.9%
20.3%
16.2%
97.5%
525
2,192
560
1,354
278
Statement of Income
Retained Premiums
Changes in Technical Provisions
Earned Premiums
Retained Claims
Selling Expenses
Administrative Expenses
Other Operating Income ( Expenses )
Result from Insurance Operations
Financial and Equity Income and Taxes
Operating Income
Other Non Operating Income (Expenses)
Income Tax and Social Contribution
Management and Employees’ Profit Sharing
Income of Gralha Azul/Paraná Results (January 2001)
Minority Interest in Subsidiaries
Net Income
Stockholders’ Equity
ROE (Annualized) - Calculated with Accumulated Results
Retained Claims/Earned Premiums
Selling Expenses/Earned Premiums
Administrative Expenses and Other Operating Expenses/Earned Premiums
Combined Ratio (**)
Uncommitted Technical Provisions of Insurance
Current Policies (Itaú Seguros) - Main Lines (thousand)
Vehicles
Life + Personal Injury
Residential

66
�
���
���
���
��
�����
�����
�����
�����
����
������
� ���
�����
�����
�����
� ���
�����
�����
�����
� ����
������
������
������
� ����
������
������
������
� ����
1.6141.5941.562
1.3471.210
1.576
�
���
���
���
���
���
���
��
��
���
������
� ���
�����
�����
�����
� ���
�����
�����
�����
� ����
������
������
������
� ����
������
������
������
� ����
841836
683651
770811
Capitalization Operations
Partial results for Capitalization in the first quarter of 2001show a 40% increase as compared to the fourth quarter of2000.
First quarter of 2001 highlights were the PIC Carnaval andSuper PIC Carnaval campaigns, which resulted in the sale of178,000 and 75,000 premium bonds, respectively, andcontributed to the 1.2% and 2.4% increase in the numberof outstanding bonds as compared to December 31, 2000and March 31, 2000, respectively. As from March 2001 theinstallment on monthly contribution premium bondsincreased from R$ 35 to R$ 50.
In relation to the first quarter of 2000, capitalizationoperations also recorded a better performance in the firstquarter of 2001, with an R$ 88 million increase in revenues.
In the last 12 months Itaú Capitalização awarded 539capitalization bond premiums, distributing a total of R$21.5 million in cash premiums.
Capitaliza - Empresa de Capitalização (acquired upon theprivatization of Banestado) contributed R$ 12 million inthe fourth quarter of 2000 and R$7 million in the first quarterof 2001 to Capitalization revenues. Its total TechnicalProvisions amounted to R$ 52 million on March 31, 2001.
Analysis of the Consolidated Performance
R$ Million 1ST Q/01 4TH Q/00 1ST Q/00 1STQ/01 x 4THQ/00 1THQ/01 x 1THQ/00
Capitalization Premiums 197 137 109 60 88
Changes in Technical Provisions (158) (109) (87) (49) (71)
Partial Result of Capitalization 39 28 22 11 17
Technical Provisions - Itaucap(Only Capitalization Plans)
R $ M il l io n (e xce p t w h e re in d ic a te d )
Ita ú C a p ita liz a ç ã o S .A . M a r 3 1 , 2 0 0 1 D e c 3 1 , 2 0 0 0 M a r 3 1 , 2 0 0 0
To ta l A s s e ts 3 ,0 5 7 3 ,0 4 2 2 ,7 4 4
S to c k ho ld e r's E qu it y 2 ,2 0 1 2 ,1 4 0 1 ,8 8 5
N e t In c o m e (q ua rte rly ) 6 1 1 66 3 2
R O E (A n nu a liz e d ) - C a lc u la te d w it h A c um u la ted R es u lts 1 1 .6 % 1 5 .6 % 6 .9 %
N u m b er o f P la ns (in t h ou s a nd ) 1 ,6 1 4 1 ,5 9 4 1 ,5 7 6
Number of Capitalizations Plans - Itaucap
R$ Million
In Thousand

67
���
���
��
��
���
��
��
��
���
��
Pension Plan Operations
Partial results for Pension Plan Operations in the first quarterof 2001 were higher than results in the same period last year.In comparison to the fourth quarter of 2000, there was adecrease because of the campaign conducted at the end of2000, when contract and contribution volumes are historicallyhigher, in view of the tax benefits participants can obtainthrough their income tax returns.
In addition to intense telemarketing activities, ItaúPrevidência has been devoting its efforts to the sale of pension
Analysis of the Consolidated Performance
R$ Million 1ST Q/01 4TH Q/00 1ST Q/00 1STQ/01 x 4THQ/00 1THQ/01 x 1THQ/00
Revenues from Pension Plans 115 151 76 (36) 39
Changes in Technical Provisions (60) (104) (34) 44 (26)
Pension Plan Benefits Expenses (54) (44) (42) (10) (12)
Partial Result of Pension Plans 2 4 1 (2) 1
plans via the Internet, in order to increase the quality ofservices provided and to facilitate client access.
In the last twelve months the investment portfolioadministered by Itaú Previdência increased 58%. Wehighlight the 628% increase in the PGBL (Free BenefitGenerating Plan) assets, to R$ 212 million.
Composition of Pension Plan Revenues
1st Quarter / 2001
4th Quarter / 2000
1st Quarter / 2000
��
��
��
���
���
Flexprev Itaú PGBL PF PGBL PJ Itauprev Invest Others

68
�
���
���
���
���
���
���
��
��
���
�����
������
� ���
�����
�����
�����
� ���
�����
�����
�����
� ����
������
������
������
� ����
������
������
������
� ����
896
971
569
318
165
620
-
50
100
150
200
250
300
Dec-9
6
Mar-9
7
Jun-9
7
Sep-9
7
Dec-9
7
Mar-9
8
Jun-9
8
Sep-9
8
Dec-9
8
Mar-9
9
Jun-9
9
Sep-9
9
Dec-9
9
Mar-0
0
Jun-0
0
Sep-0
0
Dec-0
0
Mar-0
1
281 275259
240
193
246
Number of Pension Plans - Itauprev
Technical Provisions - Itauprev
In March 2001, the Itaú Previdênciaportfolio comprised 275,000pension plans, a 12% increase ascompared to March 2000.
Analysis of the Consolidated Performance
R $ Mil l io n (e xce p t w h e re in d ic a te d )
Ita ú P re v id ê n c ia e S e g u ro s S .A . M a r 3 1 , 2 0 0 1 De c 3 1 , 2 0 0 0 M a r 3 1 , 2 0 0 0
To ta l A s s e ts 1 ,054 973 673
S toc k ho lde r's E qu it y 67 62 52
N e t Inc om e (qua rte rly ) 5 16 11
R O E (A nnua liz ed ) - C a lc u la ted w ith A c um u la ted R es u lts 35.3% 43.6% 112 .0%
N um ber o f P lans (in thous and ) 275 281 246
Technical Provisions - Average per Plan - Itauprev
The average of Technical Provisionsper bond reached R$ 3,528 at March31, 2001 as compared to R$ 2,520at March 31, 2000.
In March 2001 Itaú Previdênciareached R$ 971 million in technicalprovisions, a 57% increase ascompared to March 2000 (R$ 620million).
-
50 0
1,0 00
1,5 00
2,0 00
2,5 00
3,0 00
3,5 00
4,0 00
������
� ���
�����
�����
�����
� ���
�����
�����
�����
� ����
������
������
������
� ����
������
������
������
� ����
R$ Million
In Thousands
Em Reais

69
Analysis of the Consolidated Performance
Administrative Expenses
Total administrative expenses decreased by R$ 138 millionfrom the fourth quarter of 2000 to the first quarter of 2001.Salaries and Benefits Expenses accounted for 82% of thisdifference.
When comparing the first quarters of 2000 and 2001, a R$248 million increase may be observed, of which the inclusionof Banestado in the Consolidated Statements explains R$ 149million.
Human Resources Development Programs
Salaries and Benefits Expenses
The most significant factors responsible for the R$ 113 milliondecrease in Salaries and Benefits Expenses occurred duringthe fourth quarter of 2000. The principal factor refers to thecomputation criteria adopted to set up labor provisions,accounting for 58% of the reported variation.
Another impact relates to the collective bargainingagreement, basically due to the difference between theestimated and the effectively 7.2% agreed balances ofaccruals for vacation pay and thirteenth salary.
As compared to the first quarter of 2001, the higher numberof employees on vacations and the drop in the number ofemployees also contributed to the decrease in Salaries andBenefits Expenses and related social charges.
In the first quarter of 2001, the number of Itaú employeesdropped by 830 to 46,694 from 47,524 in the fourth quarterof 2000, chiefly due to Banestado’s restructuring process,which started after the acquisition date in the fourth quarterof 2000.
Number of Employees
In the first quarter of 2001 the Bank contracted 208university students and recent graduates from the bestuniversities in Brazil and conducted 23,160 training courseswith special emphasis on the implementation of the SmallBusiness Unit, Internet and management development. TheBank invested R$ 8 million in these programs, versus R$ 9million in the prior quarter.
Benefits
In the first quarter of 2001, benefits offered to the Bank’semployees totaled R$ 109.5 million, of which R$ 34.5 millionrelate to voluntary benefits, including medical assistance,supplementary retirement plan and training activities, aspreviously mentioned.
R$ Million 1st Q./01 4th Q./00 1st Q./00 1st Q01x 4thQ00 1st Q01x 1st Q00
Salaries and Benefits Expenses 612 725 517 (113) 95
Other Administrative Expenses 789 814 636 (25) 153
Facilities 103 102 77 1 26
Materials 27 28 22 (1) 5
Data Processing and Telecommunications 147 142 110 5 37
Transportation 44 46 45 (2) (1)
Third Party Services 106 118 76 (12) 30
Travel 11 12 6 (1) 5
Security 30 30 22 0 8
Advertising, Promotions and Publications 67 77 50 (10) 17
Contributions and Donations 11 13 8 (2) 3
Depreciation and Amortization 122 124 97 (2) 25 Financial System Services 61 59 58 2 3 Other 60 63 65 (3) (5)
Total 1,401 1,539 1,153 (138) 248
47 ,524
40 ,493 39 ,430 39 ,162 39 ,011 39 ,072 39 ,230 39 ,101
46 ,694
1stQ99
2ndQ99
3rdQ99
4thQ99
1stQ00
2ndQ00
3rdQ00
4thQ00
1stQ01
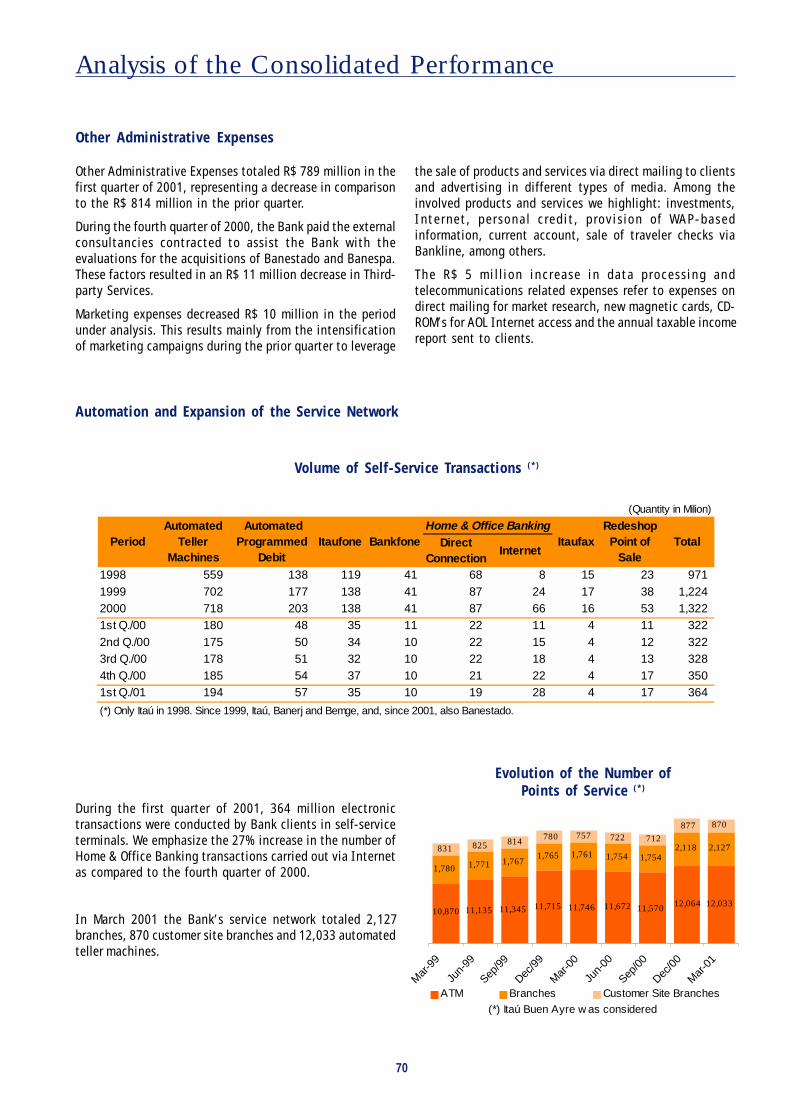
70
Analysis of the Consolidated Performance
Other Administrative Expenses
the sale of products and services via direct mailing to clientsand advertising in different types of media. Among theinvolved products and services we highlight: investments,Internet, personal credit, provision of WAP-basedinformation, current account, sale of traveler checks viaBankline, among others.
The R$ 5 million increase in data processing andtelecommunications related expenses refer to expenses ondirect mailing for market research, new magnetic cards, CD-ROM’s for AOL Internet access and the annual taxable incomereport sent to clients.
Automation and Expansion of the Service Network
Volume of Self-Service Transactions (*)
During the first quarter of 2001, 364 million electronictransactions were conducted by Bank clients in self-serviceterminals. We emphasize the 27% increase in the number ofHome & Office Banking transactions carried out via Internetas compared to the fourth quarter of 2000.
In March 2001 the Bank’s service network totaled 2,127branches, 870 customer site branches and 12,033 automatedteller machines.
Evolution of the Number ofPoints of Service (*)
(Quantity in Milion)
Direct Connection
Internet
1998 559 138 119 41 68 8 15 23 971 1999 702 177 138 41 87 24 17 38 1,224 2000 718 203 138 41 87 66 16 53 1,322 1st Q./00 180 48 35 11 22 11 4 11 322 2nd Q./00 175 50 34 10 22 15 4 12 322 3rd Q./00 178 51 32 10 22 18 4 13 328 4th Q./00 185 54 37 10 21 22 4 17 350 1st Q./01 194 57 35 10 19 28 4 17 364
(*) Only Itaú in 1998. Since 1999, Itaú, Banerj and Bemge, and, since 2001, also Banestado.
PeriodAutomated
Teller Machines
Automated Programmed
DebitItaufone TotalBankfone
Home & Office BankingItaufax
Redeshop Point of
Sale
Other Administrative Expenses totaled R$ 789 million in thefirst quarter of 2001, representing a decrease in comparisonto the R$ 814 million in the prior quarter.
During the fourth quarter of 2000, the Bank paid the externalconsultancies contracted to assist the Bank with theevaluations for the acquisitions of Banestado and Banespa.These factors resulted in an R$ 11 million decrease in Third-party Services.
Marketing expenses decreased R$ 10 million in the periodunder analysis. This results mainly from the intensificationof marketing campaigns during the prior quarter to leverage
12,033
1,7801,767
1,765 1,761 1,754 1,7542,118 2,127
870
11,71511,34511,13510,870 11,746 12,06411,57011,672
1,771
877
712722757780814825831
Mar
-99
Jun-
99
Sep/9
9
Dec/9
9
Mar
-00
Jun-
00
Sep/0
0
Dec/0
0
Mar
-01
ATM Branches Customer Site Branches
(*) Itaú Buen Ayre w as considered
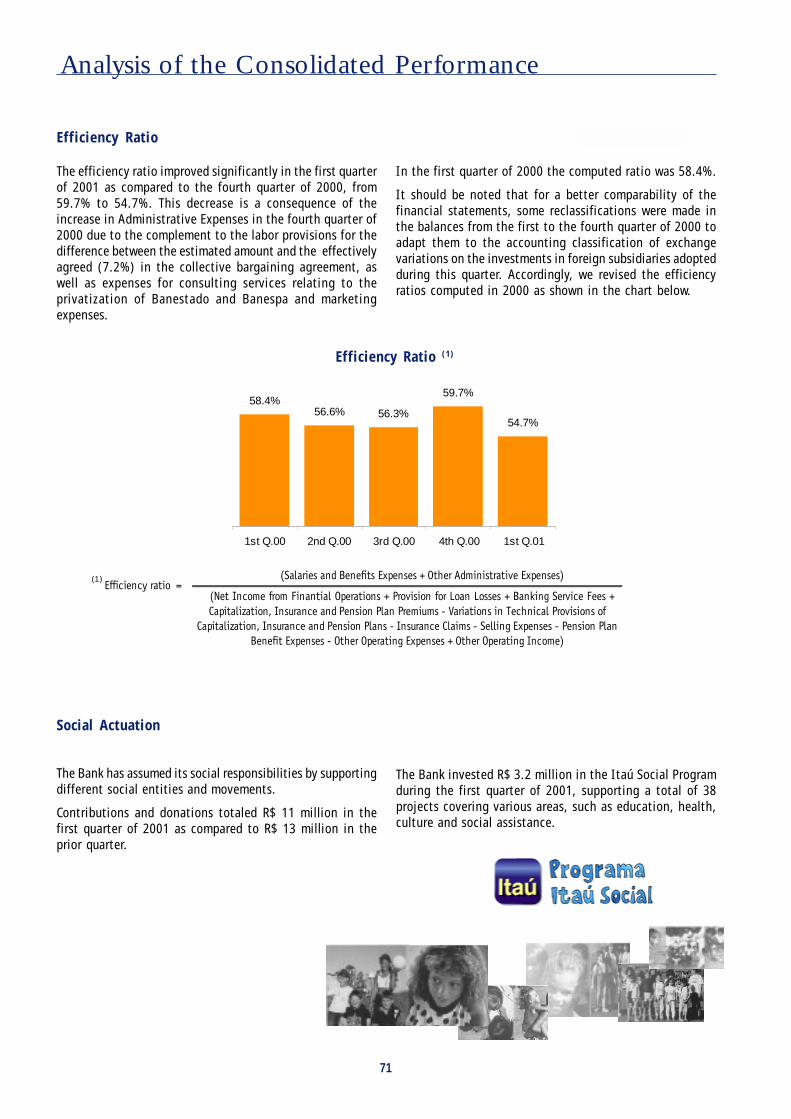
71
Analysis of the Consolidated Performance
Social Actuation
The Bank has assumed its social responsibilities by supportingdifferent social entities and movements.
Contributions and donations totaled R$ 11 million in thefirst quarter of 2001 as compared to R$ 13 million in theprior quarter.
Efficiency Ratio
Efficiency Ratio (1)
In the first quarter of 2000 the computed ratio was 58.4%.
It should be noted that for a better comparability of thefinancial statements, some reclassifications were made inthe balances from the first to the fourth quarter of 2000 toadapt them to the accounting classification of exchangevariations on the investments in foreign subsidiaries adoptedduring this quarter. Accordingly, we revised the efficiencyratios computed in 2000 as shown in the chart below.
The efficiency ratio improved significantly in the first quarterof 2001 as compared to the fourth quarter of 2000, from59.7% to 54.7%. This decrease is a consequence of theincrease in Administrative Expenses in the fourth quarter of2000 due to the complement to the labor provisions for thedifference between the estimated amount and the effectivelyagreed (7.2%) in the collective bargaining agreement, aswell as expenses for consulting services relating to theprivatization of Banestado and Banespa and marketingexpenses.
The Bank invested R$ 3.2 million in the Itaú Social Programduring the first quarter of 2001, supporting a total of 38projects covering various areas, such as education, health,culture and social assistance.
58.4%56.6% 56.3%
59.7%
54.7%
1st Q.00 2nd Q.00 3rd Q.00 4th Q.00 1st Q.01
�������������� �������������������������������������
��������� ���������������������������� �������������� �!������������
"�������#����$��%�������������������%��&'���������(�����������������
"�������#����$��%���������������&��%����"�����&�����!�������&��������
��� ���������&������������!��������������������!������
� �����)�����*(1)
72
Tax Expenses
Tax expenses in the first quarter of 2001 totaled R$ 153million, a 6.4% decrease as compared to the fourth quarterof 2000, basically by reason of the decrease of the calculationbases for the Contribution to the Social Integration Program(PIS) and Social Contribution on Revenues (COFINS), chieflydue to the higher financial margin in the fourth quarter of2000.
Other Revenues/Other Operating Expenses
Other revenues/Other Operating Expenses varied R$ 97million between the two periods.
The main event causing this impact was the need to adaptthe accounting criteria adopted by Banestado to theBanco Itaú model, which increased expenses in the fourthquarter of 2001 by R$ 63 million.
Income Tax and Social Contribution
Contrary to the fourth quarter of 2000, in the first quarterof 2001 there was a net expense for Income Tax and SocialContribution on Net Income of R$ 77 million, due to thetax effect of the supplementary annual dividends paid tostockholders as Interest on Own Capital in the prior quarter.
Extraordinary Result
To permit an adequate analysis of the financial statementsof the period, we segregated an Extraordinary Expensebefore Income Tax and Social Contribution comprisingnonrecurring expenses of R$ 25 million, of which R$ 2million refers to the full amortization of the goodwillrelating to the acquisition of the interest in Capitaliza -Empresa de Capitalização S.A. by Banestado S.A. -Participações, Administração e Serviços, R$ 3 million tothe provision set up for the transfer of the Data ProcessingCenter of Itaú Seguros S.A. to the Operational andTechnical Center, and R$ 20 million to the transfer of theOperation Center from Boa Vista to the Centro EmpresarialItaú Conceição - CEIC (Itaú Conceição Business Center ).
Itaú Corretora
At the beginning of the year Itaú Corretora launched theHome Broker web site, www.itautrade.com.br. This web sitecontains graphic and fundamental analyses complementedwith recommendations prepared by Itaú Corretora
professionals and also obtained in the market. The website offers a differentiated real-time service as an “onlineconsultant” to solve clients’ doubts. The web site alreadyhas a large number of active clients and this quarter’s growthis well above expectations.
At the end of 2000 Itaú Corretora acquired Lineinvest,considered one of the best investment portals in themarket. In the first quarter the company defined its newstrategic positioning to be implemented at the beginningof the second half of the year.
In addition, Itaú Corretora finished the structuring of itsinvestment analysis team, currently with 11 professionalscovering roughly 100 publicly-traded companies. Allanalyses are directed to both local and foreign individualand institutional clients. Itaú Corretora also offerseconomic and fixed-income analyses for assets traded inthe domestic and international markets.
The company’s Broker Dealer in New York, Itaú Securities,should start up in the second half this year.
In the first quarter Itaú Corretora intermediated over R$2.8 billion of trades in the São Paulo Stock Exchange -Bovespa, significantly increasing the number ofinstitutional clients as compared to 2000.
In the first quarter only, over 1.8 million contracts weretraded in the São Paulo Commodities Futures Exchange -BM&F, amounting to R$ 194 billion. These are significantfigures as compared to total traded contracts in 1999 and2000, 1.4 million and 5.5 million, respectively.
Private Bank
In 2001, Banco Itaú’s private banking area completes tenyears dedicated to offering high-level financial advisoryand tailor-made solutions in Brazil and abroad to high-net worth clients. The bank has an unrivaled position inthis segment. At March 31, 2001 Itaú Private Bank managesthe resources of 3,124 clients, totaling R$ 4,200 million.
This quarter the volume managed grew 10% and 170 newclients were gained.
Itaú Private Bank clients have exclusive access to over 30funds, managed by Itaú or other financial institutions.These funds were formed to meet a wide range of riskprofiles. The product portfolio also includes fixed-incomesecurities and all their modalities, structured operations,private pension funds and insurance, among others.
Analysis of the Consolidated Performance

73
US$ Million
ASSETS Pesos US$ Total Total TotalCurrent Assets and Long-Term Assets 144 540 684 675 686 Cash and Cash Equivalents 21 101 122 97 78 Securities - 25 25 24 82 Loans 88 266 354 397 407 Provisions (20) (13) (32) (34) (40) Other Credits 42 161 203 178 145 Other Assets 12 0 12 14 15 Permanent 70 - 70 70 75
Total Assets 214 540 753 745 761
LIABILITIESCurrent Liabilities and Long-Term Liabilities 220 386 606 597 613 Deposits 175 296 471 475 463 Other Liabilities - Financial 26 90 116 102 131 Other Liabilities 19 0 20 20 19 Stockholder's Equity 147 - 147 148 147 Capital and Reserves 148 - 148 181 156 Result of the period (1) - (1) (32) (8)
Total Liabilities 367 386 753 745 761
Mar 31, 00Mar 31, 01 Dec 31, 00
Balance Sheet
Relevant Data
In view of the growing interest on information relatingto Banco Itaú operations in Argentina, we have begunto include the Balance Sheet of Banco Itaú Buen Ayre,detailing its main accounts in US$ and Argentine pesosand other information which may also be considered ofgeneral interest.
The management of Banco Itaú Buen Ayre has beenfavoring the liquidity of its operations and has adopteda very conservative position in relation to the credit
Analysis of the Consolidated Balance Sheet
Itaú Buen Ayre
Mar 31, 01 Dec 31, 00 Mar 31, 00
Net Income (US$ Million) (1) (9) (8) Net Distribution Branches 84 90 94 CSBs 29 26 22 Automated Teller Machines 328 339 352 Active Costumers (thousand) 162 156 150 Saving Accounts (thousand) 183 171 159 Employees 1,417 1,433 1,655
granting policy, even though the deterioration of itsloan and financing portfolio has not occurred. In viewof the current instability scenario, adequate riskmanagement is of crucial importance.
Banco Itaú Buen Ayre is close to the breakeven pointand in the first quarter of 2001, its results show asignificant improvement, as a result of the carefulallocation of funds and cost streamlining.
U$ Million Total
AA A B C D E F G H Portfolio
Credit Portfolio 129 16 144 25 6 1 6 1 26 354 Provision for loan losses - 0 1 1 1 0 3 0 26 32
Mar 31, 01
Credit Portfolio Composition by Risk Level
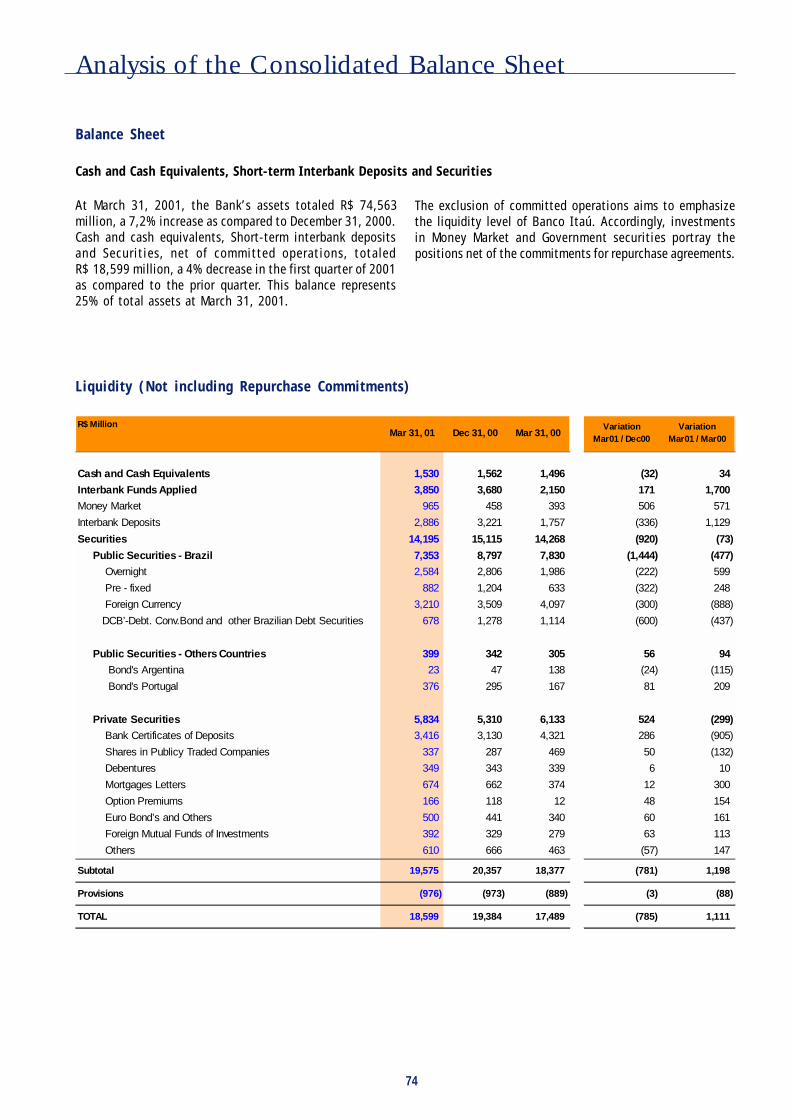
74
Analysis of the Consolidated Balance Sheet
Balance Sheet
Liquidity (Not including Repurchase Commitments)
At March 31, 2001, the Bank’s assets totaled R$ 74,563million, a 7,2% increase as compared to December 31, 2000.Cash and cash equivalents, Short-term interbank depositsand Securities, net of committed operations, totaledR$ 18,599 million, a 4% decrease in the first quarter of 2001as compared to the prior quarter. This balance represents25% of total assets at March 31, 2001.
Cash and Cash Equivalents, Short-term Interbank Deposits and Securities
R$ Million
Cash and Cash Equivalents 1,530 1,562 1,496 (32) 34
Interbank Funds Applied 3,850 3,680 2,150 171 1,700
Money Market 965 458 393 506 571
Interbank Deposits 2,886 3,221 1,757 (336) 1,129
Securities 14,195 15,115 14,268 (920) (73)
Public Securities - Brazil 7,353 8,797 7,830 (1,444) (477)
Overnight 2,584 2,806 1,986 (222) 599
Pre - fixed 882 1,204 633 (322) 248
Foreign Currency 3,210 3,509 4,097 (300) (888)
DCB’-Debt. Conv.Bond and other Brazilian Debt Securities 678 1,278 1,114 (600) (437)
Public Securities - Others Countries 399 342 305 56 94
Bond's Argentina 23 47 138 (24) (115)
Bond's Portugal 376 295 167 81 209
Private Securities 5,834 5,310 6,133 524 (299)
Bank Certificates of Deposits 3,416 3,130 4,321 286 (905)
Shares in Publicy Traded Companies 337 287 469 50 (132)
Debentures 349 343 339 6 10
Mortgages Letters 674 662 374 12 300
Option Premiums 166 118 12 48 154
Euro Bond’s and Others 500 441 340 60 161
Foreign Mutual Funds of Investments 392 329 279 63 113
Others 610 666 463 (57) 147
Subtotal 19,575 20,357 18,377 (781) 1,198
Provisions (976) (973) (889) (3) (88)
TOTAL 18,599 19,384 17,489 (785) 1,111
VariationMar01 / Dec00
VariationMar01 / Mar00
Mar 31, 01 Dec 31, 00 Mar 31, 00
The exclusion of committed operations aims to emphasizethe liquidity level of Banco Itaú. Accordingly, investmentsin Money Market and Government securities portray thepositions net of the commitments for repurchase agreements.

75
Analysis of the Consolidated Balance Sheet
Liquidity (Not including Repurchase Commitments)
Reconciliation
R$ M illion Mar 31, 01 Dec 31, 00 Mar 31, 00
Securities + In terbank D epos its 23 ,499 24 ,132 18 ,476
(+) Cas h and Cas h Equiva lents 1,530 1 ,562 1 ,496
(+) Money Market 4 ,292 5 ,504 2 ,257
Total Liquidity 29 ,321 31 ,198 22 ,229
(-) Money Market - R epurchas e pend ing s ettlem ent (3 ,328) (5 ,046) (1 ,863)
(-) Pub lic Securities - Sub ject to repurchas e com m itm ents (6 ,418) (5 ,795) (1 ,988)
Total Liquidity (not including repurchase com m itm ents ) 19 ,575 20 ,357 18 ,377
R$ Million
Brazil Abroad Total Brazil Abroad Total Brazil Abroad Total
Cash and Cash Equivalents 1,376 153 1,530 1,462 100 1,562 1,266 230 1,496
Interbank Funds Applied 1,740 2,106 3,845 1,349 2,331 3,680 1,355 795 2,150
Money Market 870 95 965 257 202 458 249 145 393
Interbank Deposits 870 2,011 2,881 1,092 2,129 3,221 1,106 650 1,757
Securities 10,856 3,344 14,200 12,283 2,832 15,115 10,968 3,763 14,731
Total 13,972 5,603 19,575 15,094 5,263 20,357 13,590 4,788 18,377
Total (US$ Million) 2,592 2,691 2,740
Mar 31, 01 Dec 31, 00 Mar 31, 00
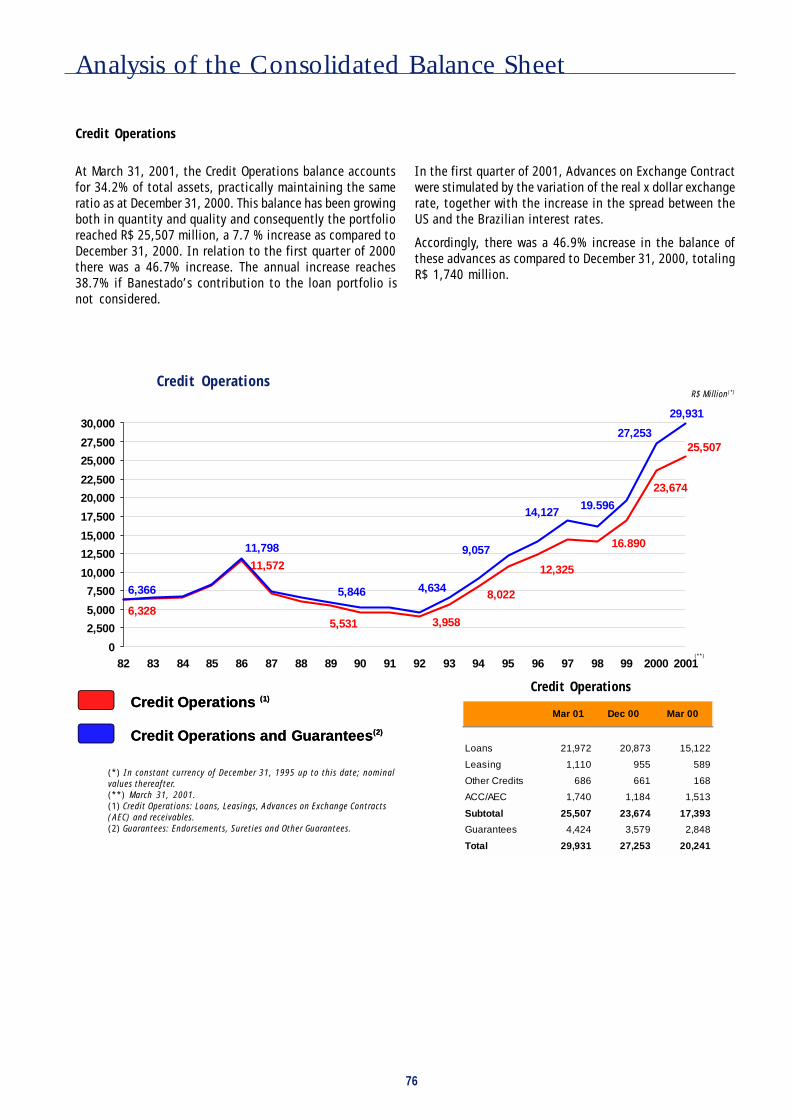
76
Analysis of the Consolidated Balance Sheet
25,507
6,328
11,572
5,531 3,958
8,022
12,325
16.890
23,674
29,931
6,366
11,798
5,846 4,634
9,057
14,12719.596
27,253
0
2,500
5,000
7,500
10,000
12,500
15,000
17,500
20,000
22,500
25,000
27,500
30,000
82 83 84 85 86 87 88 89 90 91 92 93 94 95 96 97 98 99 2000 2001
Credit OperationsR$ Million(*)
(*) In constant currency of December 31, 1995 up to this date; nominalvalues thereafter.(**) March 31, 2001.(1) Credit Operations: Loans, Leasings, Advances on Exchange Contracts(AEC) and receivables.(2) Guarantees: Endorsements, Sureties and Other Guarantees.
Credit Operations
At March 31, 2001, the Credit Operations balance accountsfor 34.2% of total assets, practically maintaining the sameratio as at December 31, 2000. This balance has been growingboth in quantity and quality and consequently the portfolioreached R$ 25,507 million, a 7.7 % increase as compared toDecember 31, 2000. In relation to the first quarter of 2000there was a 46.7% increase. The annual increase reaches38.7% if Banestado’s contribution to the loan portfolio isnot considered.
In the first quarter of 2001, Advances on Exchange Contractwere stimulated by the variation of the real x dollar exchangerate, together with the increase in the spread between theUS and the Brazilian interest rates.
Accordingly, there was a 46.9% increase in the balance ofthese advances as compared to December 31, 2000, totalingR$ 1,740 million.
Credit Operations
(**)
Mar 01 Dec 00 Mar 00
Loans 21,972 20,873 15,122
Leasing 1,110 955 589
Other Credits 686 661 168
ACC/AEC 1,740 1,184 1,513
Subtotal 25,507 23,674 17,393
Guarantees 4,424 3,579 2,848
Total 29,931 27,253 20,241
Credit Operations (1)
Credit Operations and Guarantees(2)
Credit Operations (1)
Credit Operations and Guarantees(2)

77
Analysis of the Consolidated Balance Sheet
We present below the composition of the loan portfolio per industry, concentration of the largest debtors, credit operationsper level of risk and the composition per maturity period and risk.
Comparison of the Portfolio by Business Sector(*)
(*) Endorsements and sureties included
R$ Million Dec 31,00 Mar 31, 00
Loans ACC/AEC Leases Endo rsements Consolidated Consolidated Consolidated
Public Sector Industry Chemicals and Petrochemicals 491 0 0 36 528 590 688
Others 521 0 0 0 521 501 12
Total of Public Sector 1,013 0 0 36 1,049 1,091 699
Private Sector 26,162 Industry Siderurgy, Metalurgy and Mechanics 793 265 6 959 2,024 1,497 1,426
Chemicals and Petrochemicals 924 177 10 329 1,440 1,080 936
Food and Beverage 934 129 3 163 1,229 1,110 1,065
Pulping and Paper 342 227 4 64 637 496 507
Light and Heavy Vehicles 202 169 1 213 584 685 452
Electronic 452 42 2 167 663 489 427
Textile and Clothing 182 52 3 37 274 311 199
Autoparts and Accessories 75 43 1 15 134 116 121
Fertilizer, Insecticide and Defensive 239 7 0 39 285 243 218
Pharmacetical 48 1 1 32 81 74 99
Others 751 152 11 183 1,097 1,031 692
Subtotal 4,944 1,262 42 2,201 8,449 7,132 6,141 Commerce 1,562 48 25 132 1,767 1,868 996
Services Finance 632 0 0 369 1,001 947 1,077
Telecommunications 1,771 0 4 533 2,307 2,285 721
Public Services Provider 637 0 0 289 926 932 732
Holding and Services Provider 954 8 28 185 1,176 801 562
Real State Financing (Companie) 286 0 0 0 286 326 401
Construction and Real State Companies 257 0 8 94 359 345 224
Transports 122 0 16 39 177 187 139
Others 386 1 10 222 619 501 300
Subtotal 5,044 10 66 1,731 6,851 6,323 4,156 Primary Sector Agriculture 367 69 1 57 493 479 400
Mining 78 351 1 231 660 474 546
Subtotal 445 419 2 288 1,154 953 946 Others Individuals Credit Cards 2,007 0 0 0 2,007 2,130 1,442
Real State Financing 2,815 0 0 0 2,815 2,979 2,488
CDC/Vehicles/ Current Account 4,449 0 954 1 5,404 4,486 3,016
Subtotal 9,271 0 954 1 10,227 9,595 6,945 Others Businesses 379 0 20 35 434 290 357
Total of Private Sector 21,645 1,740 1,110 4,388 28,882 26,162 19,541
GENERAL TOTAL 22,658 1,740 1,110 4,424 29,931 27,253 20,241
Mar 31,01

78
Analysis of the Consolidated Balance Sheet
Composition by Type of Operation and Risk Level (*)
Composition by Maturity and Risk Level (*)
(*)Endorsements and sureties included
(*) Endorsements and sureties included
The table below shows the risk classification of the different types of credits and guarantees.
We present below the loan portfolio risk composition per maturity period and the portfolio composition classified betweenIndividual/Businesses and Region.
R$ Million Dec 31, 00 Mar 31, 00
AA A B C D E F G H Consolidated Consolidated Consolidated
Loans Operations 6,061 5,147 6,587 1,605 1,129 243 447 186 568 21,972 20,874 15,123
Loans and Trade Receivables Discounted 4,039 2,776 4,462 780 703 62 318 73 374 13,587 12,589 8,857
Financing 1,686 1,442 702 220 67 17 16 3 13 4,165 3,835 2,490
Farm and Agribusiness Financing 317 370 174 44 12 107 7 78 11 1,119 1,143 885
Real State Financing 20 559 1,248 561 346 57 106 32 171 3,101 3,305 2,889
Securities Financing 1 2
Leasing Operations 14 665 201 80 82 6 16 4 41 1,110 955 589
Other Credits 29 486 82 12 8 2 3 1 62 686 661 168
Advances on Exchange Contracts 998 251 372 90 14 6 2 0 7 1,740 1,184 1,513
Total 7,102 6,548 7,242 1,786 1,233 257 469 191 679 25,507 23,674 17,393
Endorsements and Sureties 2,672 824 479 302 41 70 34 0 1 4,424 3,579 2,848
Total with Endorsements and Sureties 9,774 7,372 7,722 2,089 1,274 327 503 192 680 29,931 27,253 20,241
Mar 31, 01
R$ Million
Region Individuals Businesses Total
Center - West 460 367 827North 93 139 232North - East 342 658 1,059South 946 2,784 3,730South - East 5,931 14,029 19,960Argentina 343 417 759Credit Cards 2,028 1 2,028Cayman 0 222 222Europe 0 637 637New York 0 431 431Paraguay 84 1 85Uruguay 0 20 20Total 10,226 19,705 29,931
Composition by Individuals/Businesses and Region
R$ Million Dec 31, 00 Mar 31, 00
AA A B C D E F G H Consolidated Consolidated Consolidated
Amounts Coming Due
0 to 30 946 1,057 2,709 291 230 6 39 2 22 5,303 6,078 4,378
31 to 60 1,345 904 533 152 93 7 26 3 10 3,074 2,070 1,834
61 to 90 946 318 366 112 53 16 24 2 10 1,847 1,363 1,373
91 to 180 1,553 708 750 187 126 59 73 6 36 3,499 3,839 2,541
181 to 360 1,231 1,081 1,027 300 178 59 79 6 51 4,013 3,364 3,133
over 360 3,721 3,266 2,076 934 444 112 161 109 140 10,962 9,310 6,299
Subtotal 9,743 7,335 7,461 1,976 1,123 259 403 129 269 28,698 26,023 19,557
Amounts Past Due
1 to 14 31 37 63 26 30 1 13 2 16 219 249 95
15 toa 30 0 0 196 10 28 6 8 1 5 253 228 215
31 to 60 0 0 1 76 29 4 9 3 11 133 113 98
61 to 90 0 0 0 1 62 5 7 2 9 86 82 63
91 to 120 0 0 0 0 1 50 7 3 12 74 77 54
121 to 180 0 0 0 0 1 1 54 50 28 133 119 35
181 to 360 0 0 0 0 0 1 1 2 250 254 137 19
over 360 0 0 0 0 0 0 0 0 80 81 136 84
Subtotal 31 37 261 113 151 68 100 63 411 1,233 1,230 664
Total 9,774 7,372 7,722 2,089 1,274 327 503 192 680 29,931 27,253 20,241
Mar 31, 01
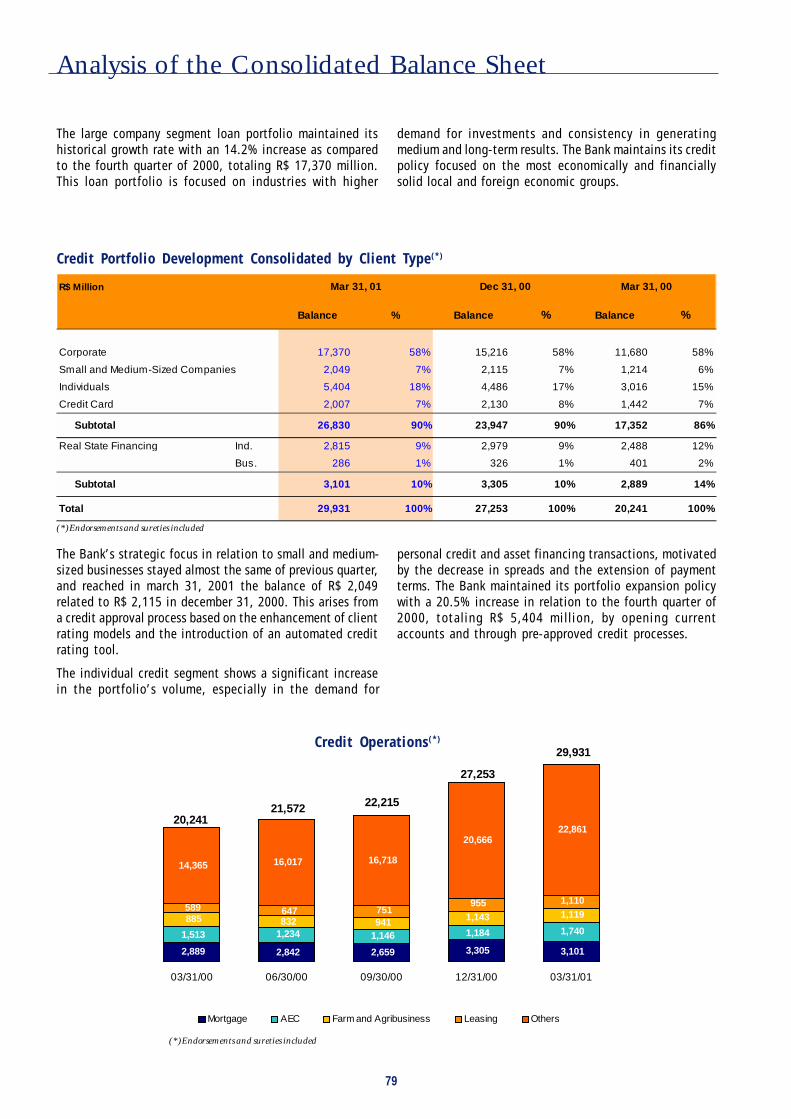
79
Analysis of the Consolidated Balance Sheet
2,889 2,842 2,659 3,305 3,101
1,740 1,184 1,146 1,234 1,513
1,119 1,143 941 832 885 589 647 751
955 1,110
14,365 16,017 16,718
20,666 22,861
03/31/00 06/30/00 09/30/00 12/31/00 03/31/01
Mortgage AEC Farm and Agribusiness Leasing Others
22,215
20,241 21,572
27,253
29,931
Credit Portfolio Development Consolidated by Client Type(*)
Credit Operations(*)
(*)Endorsements and sureties included
R$ Million
Balance % Balance % Balance %
Corporate 17,370 58% 15,216 58% 11,680 58%
Small and Medium-Sized Companies 2,049 7% 2,115 7% 1,214 6%
Individuals 5,404 18% 4,486 17% 3,016 15%
Credit Card 2,007 7% 2,130 8% 1,442 7%
Subtotal 26,830 90% 23,947 90% 17,352 86%
Real State Financing Ind. 2,815 9% 2,979 9% 2,488 12%
Bus. 286 1% 326 1% 401 2%
Subtotal 3,101 10% 3,305 10% 2,889 14%
Total 29,931 100% 27,253 100% 20,241 100%
Mar 31, 01 Dec 31, 00 Mar 31, 00
The large company segment loan portfolio maintained itshistorical growth rate with an 14.2% increase as comparedto the fourth quarter of 2000, totaling R$ 17,370 million.This loan portfolio is focused on industries with higher
demand for investments and consistency in generatingmedium and long-term results. The Bank maintains its creditpolicy focused on the most economically and financiallysolid local and foreign economic groups.
The Bank’s strategic focus in relation to small and medium-sized businesses stayed almost the same of previous quarter,and reached in march 31, 2001 the balance of R$ 2,049related to R$ 2,115 in december 31, 2000. This arises froma credit approval process based on the enhancement of clientrating models and the introduction of an automated creditrating tool.
The individual credit segment shows a significant increasein the portfolio’s volume, especially in the demand for
personal credit and asset financing transactions, motivatedby the decrease in spreads and the extension of paymentterms. The Bank maintained its portfolio expansion policywith a 20.5% increase in relation to the fourth quarter of2000, totaling R$ 5,404 million, by opening currentaccounts and through pre-approved credit processes.
(*)Endorsements and sureties included
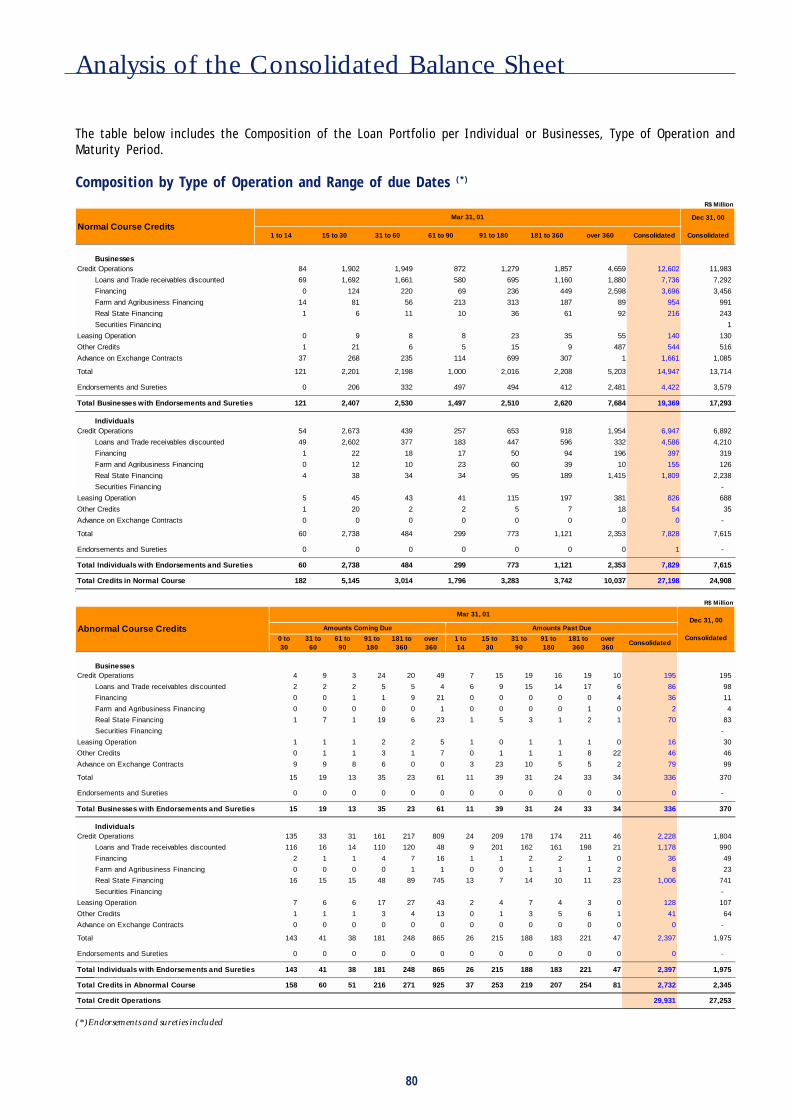
80
Analysis of the Consolidated Balance Sheet
Composition by Type of Operation and Range of due Dates (*)
R$ Million
Abnormal Course Credits0 to30
31 to 60
61 to 90
91 to 180
181 to 360
over 360
1 to14
15 to 30
31 to90
91 to180
181 to360
over 360
Consolidated
BusinessesCredit Operations 4 9 3 24 20 49 7 15 19 16 19 10 195 195
Loans and Trade receivables discounted 2 2 2 5 5 4 6 9 15 14 17 6 86 98
Financing 0 0 1 1 9 21 0 0 0 0 0 4 36 11
Farm and Agribusiness Financing 0 0 0 0 0 1 0 0 0 0 1 0 2 4
Real State Financing 1 7 1 19 6 23 1 5 3 1 2 1 70 83
Securities Financing -
Leasing Operation 1 1 1 2 2 5 1 0 1 1 1 0 16 30
Other Credits 0 1 1 3 1 7 0 1 1 1 8 22 46 46
Advance on Exchange Contracts 9 9 8 6 0 0 3 23 10 5 5 2 79 99
Total 15 19 13 35 23 61 11 39 31 24 33 34 336 370
Endorsements and Sureties 0 0 0 0 0 0 0 0 0 0 0 0 0 -
Total Businesses with Endorsements and Sureties 15 19 13 35 23 61 11 39 31 24 33 34 336 370
IndividualsCredit Operations 135 33 31 161 217 809 24 209 178 174 211 46 2,228 1,804
Loans and Trade receivables discounted 116 16 14 110 120 48 9 201 162 161 198 21 1,178 990
Financing 2 1 1 4 7 16 1 1 2 2 1 0 36 49
Farm and Agribusiness Financing 0 0 0 0 1 1 0 0 1 1 1 2 8 23
Real State Financing 16 15 15 48 89 745 13 7 14 10 11 23 1,006 741
Securities Financing -
Leasing Operation 7 6 6 17 27 43 2 4 7 4 3 0 128 107
Other Credits 1 1 1 3 4 13 0 1 3 5 6 1 41 64
Advance on Exchange Contracts 0 0 0 0 0 0 0 0 0 0 0 0 0 -
Total 143 41 38 181 248 865 26 215 188 183 221 47 2,397 1,975
Endorsements and Sureties 0 0 0 0 0 0 0 0 0 0 0 0 0 -
Total Individuals with Endorsements and Sureties 143 41 38 181 248 865 26 215 188 183 221 47 2,397 1,975
Total Credits in Abnormal Course 158 60 51 216 271 925 37 253 219 207 254 81 2,732 2,345
Total Credit Operations 29,931 27,253
Mar 31, 01Dec 31, 00
ConsolidatedAmounts Coming Due Amounts Past Due
R$ Million
Dec 31, 00
1 to 14 15 to 30 31 to 60 61 to 90 91 to 180 181 to 360 over 360 Consolidated Consolidated
BusinessesCredit Operations 84 1,902 1,949 872 1,279 1,857 4,659 12,602 11,983
Loans and Trade receivables discounted 69 1,692 1,661 580 695 1,160 1,880 7,736 7,292
Financing 0 124 220 69 236 449 2,598 3,696 3,456
Farm and Agribusiness Financing 14 81 56 213 313 187 89 954 991
Real State Financing 1 6 11 10 36 61 92 216 243
Securities Financing 1
Leasing Operation 0 9 8 8 23 35 55 140 130
Other Credits 1 21 6 5 15 9 487 544 516
Advance on Exchange Contracts 37 268 235 114 699 307 1 1,661 1,085
Total 121 2,201 2,198 1,000 2,016 2,208 5,203 14,947 13,714
Endorsements and Sureties 0 206 332 497 494 412 2,481 4,422 3,579
Total Businesses with Endorsements and Sureties 121 2,407 2,530 1,497 2,510 2,620 7,684 19,369 17,293
IndividualsCredit Operations 54 2,673 439 257 653 918 1,954 6,947 6,892
Loans and Trade receivables discounted 49 2,602 377 183 447 596 332 4,586 4,210
Financing 1 22 18 17 50 94 196 397 319
Farm and Agribusiness Financing 0 12 10 23 60 39 10 155 126
Real State Financing 4 38 34 34 95 189 1,415 1,809 2,238
Securities Financing -
Leasing Operation 5 45 43 41 115 197 381 826 688
Other Credits 1 20 2 2 5 7 18 54 35
Advance on Exchange Contracts 0 0 0 0 0 0 0 0 -
Total 60 2,738 484 299 773 1,121 2,353 7,828 7,615
Endorsements and Sureties 0 0 0 0 0 0 0 1 -
Total Individuals with Endorsements and Sureties 60 2,738 484 299 773 1,121 2,353 7,829 7,615
Total Credits in Normal Course 182 5,145 3,014 1,796 3,283 3,742 10,037 27,198 24,908
Mar 31, 01
Normal Course Credits
The table below includes the Composition of the Loan Portfolio per Individual or Businesses, Type of Operation andMaturity Period.
(*)Endorsements and sureties included

81
Analysis of the Consolidated Balance Sheet
Credits and Guarantees in Foreign Currency
The Tables below show Credits and Guarantees in Local Currency and in Foreign Currency.
Credits and Guarantees in Local Currency
(1) Include: Securities (except public securities), endorsements and sureties and income receivable.
R$ Million Mar 31, 01 Dec 31, 00 Mar 31, 00Variation
Mar01 / Dec00Variation
Mar01 / Mar00
Loans/Financing 9,036 8,394 5,479 642 3,557
Loans/Financing - Real State 3,044 3,253 2,885 (209) 159
Farm Financing 1,107 1,132 885 (25) 222
Leasing Operations 1,107 950 566 157 541
On-Lending BNDES 2,399 2,314 1,364 85 1,035
Other Credits (1) 6,984 6,153 4,847 831 2,137
Interbank Fund Applied 845 1,067 1,089 (222) (244)
Public Securitiesand Money Market 9,094 11,350 4,681 (2,256) 4,413
Endorsements and Sureties 2,610 2,650 2,300 (40) 310
Total 36,226 37,263 24,096 (1,037) 12,130
US$ Million Mar 31, 01 Dec 31, 00 Mar 31, 00Variation
Mar01 / Dec00Variation
Mar01 / Mar00
Financing and Guarantees to Trade -Related - Export 1,903 1,671 1,615 232 288
Financing and Guarantees to Trade -Related - Import 689 636 651 53 38
Other Local Financing of Foreign Subs idaries 544 651 544 (107) (0)
Bond's Portugal 175 172 95 3 80
Private Securities (OECD) 78 72 79 6 (1)
Interbank Deposits (OECD) 1,184 1,179 1,291 4 (107)
DCB's / EIB's / IDU's / Globals Bond's 458 599 553 (140) (95)
Bonus / CD's / Securities and Investment Funds 979 776 490 202 489
Bond's Argentina 25 24 79 1 (54)
On-Lending - Resolution 63 1,179 726 757 453 422
Clients 734 556 260 178 777
Availability to invest in the market 303 - - 303 -
NTN-D - - 295 - (295)
Bonus / Clients 142 170 202 (28) (60)
Total 7,214 6,505 6,154 708 1,060
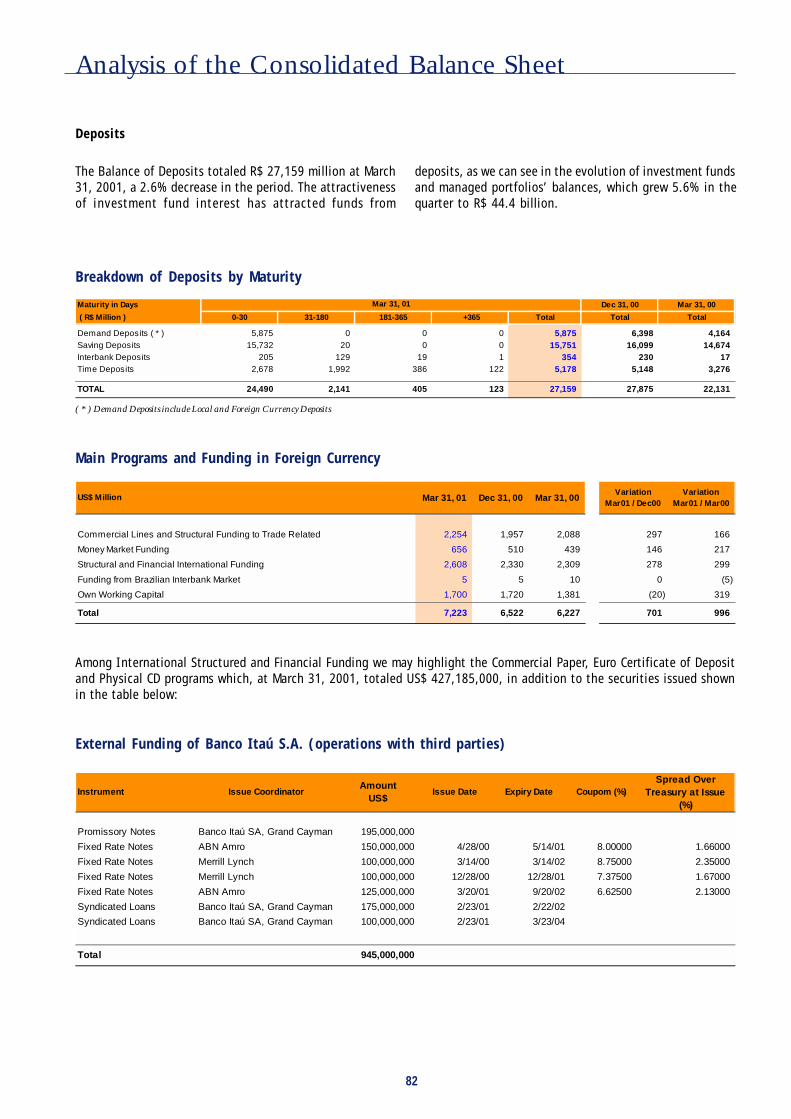
82
Analysis of the Consolidated Balance Sheet
Main Programs and Funding in Foreign Currency
Breakdown of Deposits by Maturity
( * ) Demand Deposits include Local and Foreign Currency Deposits
External Funding of Banco Itaú S.A. (operations with third parties)
The Balance of Deposits totaled R$ 27,159 million at March31, 2001, a 2.6% decrease in the period. The attractivenessof investment fund interest has attracted funds from
deposits, as we can see in the evolution of investment fundsand managed portfolios’ balances, which grew 5.6% in thequarter to R$ 44.4 billion.
Deposits
Among International Structured and Financial Funding we may highlight the Commercial Paper, Euro Certificate of Depositand Physical CD programs which, at March 31, 2001, totaled US$ 427,185,000, in addition to the securities issued shownin the table below:
Maturity in Days Dec 31, 00 Mar 31, 00
( R$ Million ) 0-30 31-180 181-365 +365 Total Total Total
Demand Deposits ( * ) 5,875 0 0 0 5,875 6,398 4,164 Saving Deposits 15,732 20 0 0 15,751 16,099 14,674 Interbank Deposits 205 129 19 1 354 230 17 Time Deposits 2,678 1,992 386 122 5,178 5,148 3,276
TOTAL 24,490 2,141 405 123 27,159 27,875 22,131
Mar 31, 01
US$ Million Mar 31, 01 Dec 31, 00 Mar 31, 00Variation
Mar01 / Dec00Variation
Mar01 / Mar00
Commercial Lines and Structural Funding to Trade Related 2,254 1,957 2,088 297 166
Money Market Funding 656 510 439 146 217
Structural and Financial International Funding 2,608 2,330 2,309 278 299
Funding from Brazilian Interbank Market 5 5 10 0 (5)
Own Working Capital 1,700 1,720 1,381 (20) 319
Total 7,223 6,522 6,227 701 996
Instrument Issue CoordinatorAmount
US$Issue Date Expiry Date Coupom (%)
Spread Over Treasury at Issue
(%)
Promissory Notes Banco Itaú SA, Grand Cayman 195,000,000
Fixed Rate Notes ABN Amro 150,000,000 4/28/00 5/14/01 8.00000 1.66000
Fixed Rate Notes Merrill Lynch 100,000,000 3/14/00 3/14/02 8.75000 2.35000
Fixed Rate Notes Merrill Lynch 100,000,000 12/28/00 12/28/01 7.37500 1.67000
Fixed Rate Notes ABN Amro 125,000,000 3/20/01 9/20/02 6.62500 2.13000
Syndicated Loans Banco Itaú SA, Grand Cayman 175,000,000 2/23/01 2/22/02
Syndicated Loans Banco Itaú SA, Grand Cayman 100,000,000 2/23/01 3/23/04
Total 945,000,000

83
Analysis of the Consolidated Balance Sheet
US$ Million 1ST Q./01 4T H Q./00 1ST Q./00Variation
1Q.01/4Q.00Variation
1Q.01/1Q.00
Export - Foreign Exchange 1,150 849 759 301 391 Import - Foreign Exchange 1,173 1,144 1,060 29 113 Financial Transactions - Foreign Exchange 2,434 2,148 1,986 286 448
Subtotal 4,757 4,141 3,805 616 952
Interbank (R$ &US$) 25,072 18,874 24,130 6,198 942 Interbank (Other currencies) 2,382 2,741 4,037 (359) (1,655)
Subtotal 27,454 21,615 28,167 5,839 (713)
Total of Foreign Exchange Transactions 32,211 25,756 31,972 6,455 239
Pre-export Loans (ACC/ACE) 707 507 484 200 223
Off-shore Financing 192 304 145 (112) 47
Import Financing 250 328 88 (78) 162
Export Pre-payment Financing 84 191 60 (107) 24
Subtotal 1,233 1,330 777 (97) 456
PROEX 18 13 1 5 17
BNDES EXIM (Pre Shipment) 30 91 41 (61) (11)
BNDES EXIM (Pos Shipment) 12 86 9 (74) 3
Subtotal 60 190 51 (130) 9
Total of Financing (*) 1,293 1,520 828 (227) 465
Geografic distribution of Trade Lines (at March 31, 2001)
The funding of Itaú Trade Lines has maintained a broadgeographic distribution of funding sources, aimed atincreasing the number of correspondent banks, even aftertaking into consideration the effects of the merger andacquisition processes in the world banking industry,naturally resulting in a decrease in the total number ofbanks.
Total of correspondents Banks : 145
Foreign Exchange and Foreign Trade Financing Highlights
Foreign Banking Activities
Obs.: (*) The negociated volumes of Banestado were not considered
United States28,1%
Germany14,4%
Others4,7%
Asia7,6%
The Netherland 2,1%
Spain4,3%
Canada3,4%
Latin America9,9%
France5,1%
England16,4%
Portugal4,0%
Assets Sto ckho lder's Equity Assets Sto ckho lder's
Equity Assets Sto ckho lder's Equity Assets Sto ckho lder's
Equity Assets Sto ckho lder's Equity
1,648 1,678 1,335 (30) 313
Grand Cayman and New York branches 4,070 966 3,506 993 3,303 754 564 (27) 767 212
Itaú Buen Ayre S.A. 728 147 721 148 761 147 7 (1) (33) (0)
Itaú Bank Ltd. 713 300 604 292 472 208 109 8 241 92
Banco Itaú Europa Luxembourg S.A. 113 26 115 24 132 22 (2) 2 (19) 4
Banco Itaú Europa S.A. 1,483 171 1,438 184 1,176 174 45 (13) 307 (3)
IFE - Bemge - Uruguay S.A. 70 34 65 32 43 30 5 2 27 4
Banco Del Paraná S.A. 51 4 57 5 - - (6) (1) 51 4
Variation Variation
US$ MillionMar01 / Mar00Mar 31, 01 Dec 31, 00 Mar 31, 00 Mar01 / Dec00
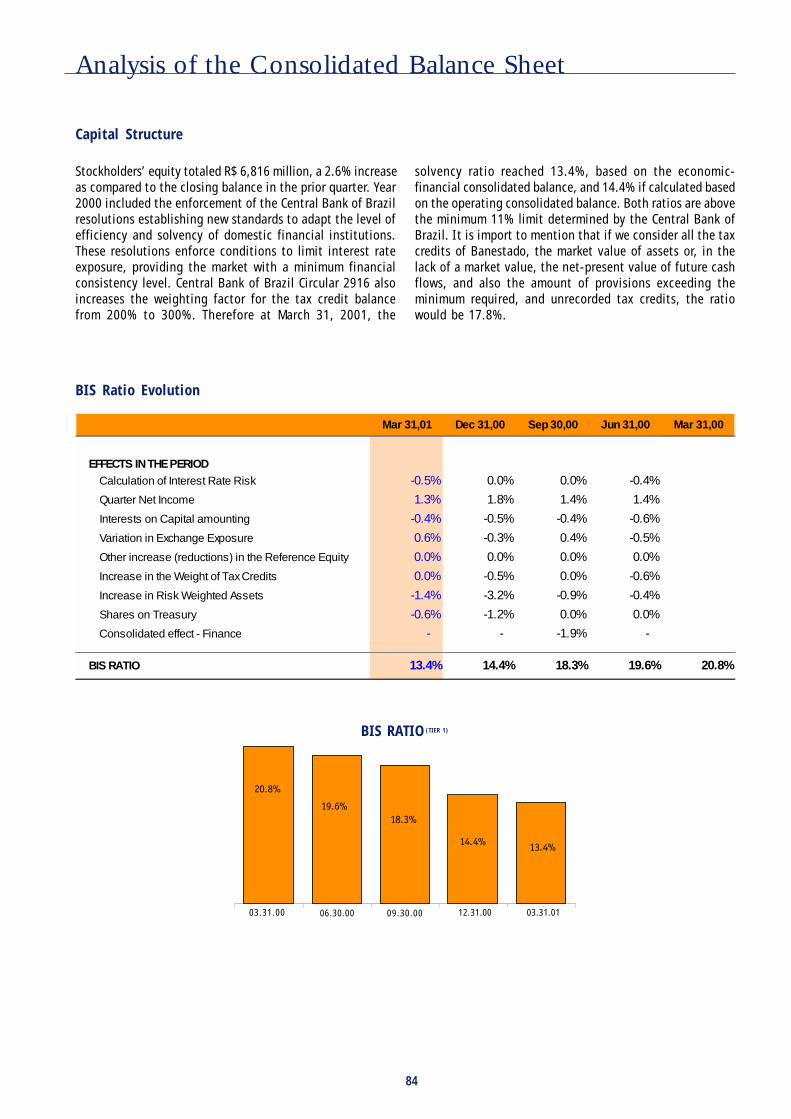
84
Analysis of the Consolidated Balance Sheet
Capital Structure
Stockholders’ equity totaled R$ 6,816 million, a 2.6% increaseas compared to the closing balance in the prior quarter. Year2000 included the enforcement of the Central Bank of Brazilresolutions establishing new standards to adapt the level ofefficiency and solvency of domestic financial institutions.These resolutions enforce conditions to limit interest rateexposure, providing the market with a minimum financialconsistency level. Central Bank of Brazil Circular 2916 alsoincreases the weighting factor for the tax credit balancefrom 200% to 300%. Therefore at March 31, 2001, the
BIS RATIO (TIER 1)
solvency ratio reached 13.4%, based on the economic-financial consolidated balance, and 14.4% if calculated basedon the operating consolidated balance. Both ratios are abovethe minimum 11% limit determined by the Central Bank ofBrazil. It is import to mention that if we consider all the taxcredits of Banestado, the market value of assets or, in thelack of a market value, the net-present value of future cashflows, and also the amount of provisions exceeding theminimum required, and unrecorded tax credits, the ratiowould be 17.8%.
BIS Ratio Evolution
Mar 31,01 Dec 31,00 Sep 30,00 Jun 31,00 Mar 31,00
EFFECTS IN THE PERIODCalculation of Interest Rate Risk -0.5% 0.0% 0.0% -0.4%
Quarter Net Income 1.3% 1.8% 1.4% 1.4%
Interests on Capital amounting -0.4% -0.5% -0.4% -0.6%
Variation in Exchange Exposure 0.6% -0.3% 0.4% -0.5%
Other increase (reductions) in the Reference Equity 0.0% 0.0% 0.0% 0.0%
Increase in the Weight of Tax Credits 0.0% -0.5% 0.0% -0.6%
Increase in Risk Weighted Assets -1.4% -3.2% -0.9% -0.4%
Shares on Treasury -0.6% -1.2% 0.0% 0.0%
Consolidated effect - Finance - - -1.9% -
BIS RATIO 13.4% 14.4% 18.3% 19.6% 20.8%
����������
�����
�����
���
03.31.00 06.30.00 09.30.00 12.31.00 03.31.01

85
Analysis of the Consolidated Balance Sheet
Balance Sheet by Currency(*)
(*) It does not exclude transactions between local and foreign business
We present below the balance sheet per currency, highlighting the balance sheet accounts denominated in local currencyand those denominated in foreign currencies. The foreign exchange position at March 31, 2001 totaled R$ 2,372 million,including investments abroad.
Mar 31,01
TOTALLOCAL
CURRENCY FOREIGN
CURRENCY
Cash and Cash Equivalents 1,530 1,384 683 701
Interbanks Funds Applied 7,173 5,067 5,042 25Money Market 4,292 4,197 4,197 0Interbank Deposits 2,881 870 845 25
Securities 19,642 16,296 10,723 5,573
Interbank and Interbranch Accounts 7,839 7,630 7,630 0
Loan and Leasing Operations 21,135 17,696 14,837 2,859
Other Assets 14,026 13,233 10,047 3,186Foreign Exchange Portifolio 4,204 4,122 984 3,139Others 9,822 9,111 9,063 47
Permanent Assets 3,218 6,823 2,778 4,045Investiments 692 4,462 417 4,045Fixed Assets 2,351 2,200 2,200 0Deferred Expenses 176 161 161 0
74,563 68,129 51,740 16,389
DERIVATIVES - CALL POSITIONFutures 1,459Options 5Swaps 787
18,640TOTAL ASSETS AFTER ADJUSTAMENTS (a)
R$ Million
ASSETS
TOTAL ASSETS
CONSOLIDATED
BUSINESS IN BRAZIL
Dec 31,00 Mar 31,00
153 1,562 1,496
2,106 8,725 4,01395 5,504 2,257
2,011 3,221 1,757
6,090 19,938 15,831
209 4,366 6,371
5,726 19,881 14,445
1,180 11,887 8,936121 2,171 3,117
1,059 9,716 5,819
442 3,197 3,002278 681 594150 2,335 2,226
14 181 182
15,907 69,555 54,094
CONSOLIDATEDBUSINESS ABROAD
CONSOLIDATED
Mar 31,01
TOTALLOCAL
CURRENCY FOREIGN
CURRENCY
Deposits 27,159 22,557 22,556 1Demand Deposits 5,875 5,580 5,580 1Savings 15,751 15,344 15,344 0Interbank 354 1 1 0Time Deposits 5,178 1,631 1,631 0
Money Market Repurchase Commitment 10,279 9,139 9,139 0
Acceptances and Debentures 3,115 4,462 1,131 3,331
Interbank and Interbranch accounts 3,754 3,753 3,605 148
Borrowings 5,284 3,404 205 3,199
On-Lending Borrowings 3,277 3,277 2,742 534
Other Liabilities 11,848 11,766 9,964 1,802Foreign Exchange Portfolio 2,382 2,334 1,157 1,177Others 9,465 9,432 8,807 625
Technical Provisions of Insurance, Pension Plansand Capitalization -Not Vinculated 2,344 2,344 2,344 0
Deferred Income 117 114 114 0
Minoritary Interest in Consolidated Subsidaries 572 499 499 0
Stockholder's Equity 6,816 6,816 6,816 0Capital and Reserves 6,190 6,190 6,190 0Net Income 625 625 625 0
74,563 68,129 59,114 9,016
DERIVATIVES - PUT POSITIONSFutures (Include Funds under Management) 3,389Options 398Swap (Included Funds under Management) 3,466
16,268
2,372FOREIGN EXCHANGE POSITION (a - b)
TOTAL LIABILITIES
TOTAL LIABILITIES AFTER ADJUSTMENT (b)
LIABILITIESCONSOLIDATED
BUSINESS IN BRAZIL
Dec 31,00 Mar 31,00
4,610 27,875 22,131297 6,398 4,164407 16,099 14,674353 230 17
3,553 5,148 3,276
1,140 11,173 4,289
1,399 2,967 3,140
1 540 2,504
4,092 3,652 3,570
0 3,220 1,900
545 10,466 7,99392 1,025 1,989
452 9,441 6,004
0 2,337 1,904
3 138 143
73 546 395
4,045 6,642 6,1254,010 4,802 5,760
35 1,841 365
15,907 69,555 54,094
CONSOLIDATEDBUSINESS ABROAD
CONSOLIDATED
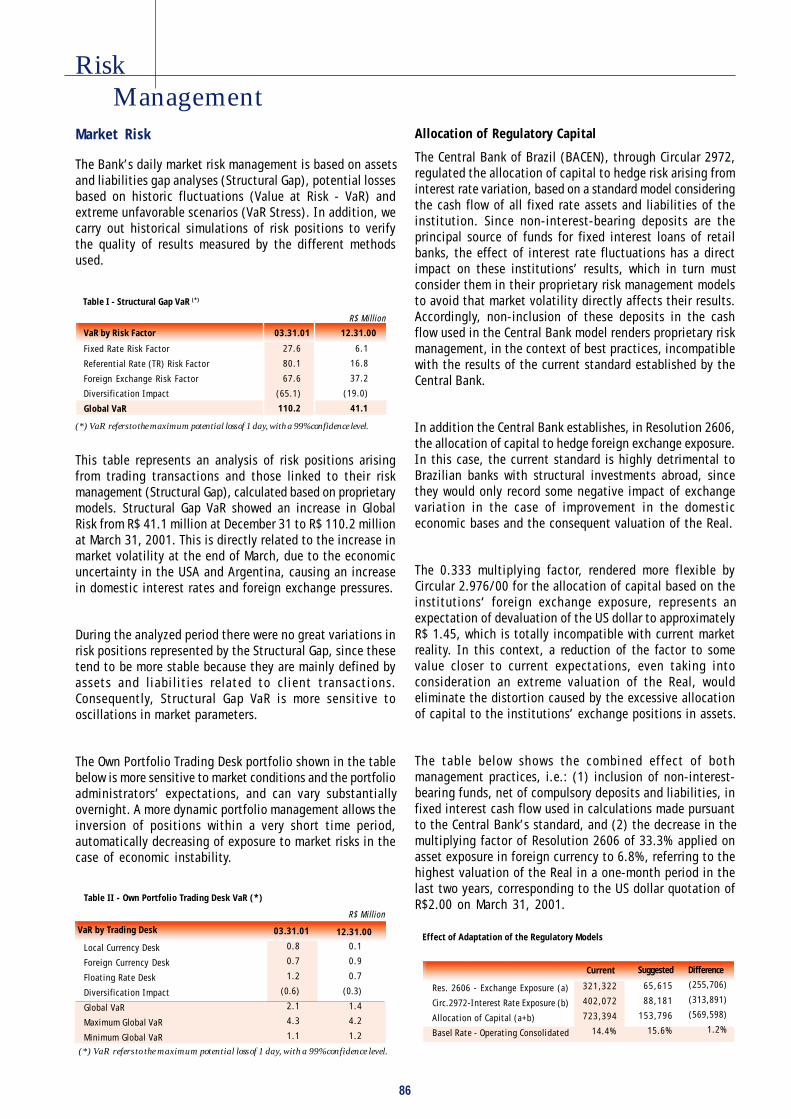
86
Fixed Rate Risk Factor
Referential Rate (TR) Risk Factor
Foreign Exchange Risk Factor
Diversification Impact
Global VaR
6.1
16.8
37.2
(19.0)
41.1
27.6
80.1
67.6
(65.1)
110.2
12.31.0003.31.01VaR by Risk Factor
Table I - Structural Gap VaR (*)
R$ Million
(*) VaR refers to the maximum potential loss of 1 day, with a 99% confidence level.
Market Risk
The Bank’s daily market risk management is based on assetsand liabilities gap analyses (Structural Gap), potential lossesbased on historic fluctuations (Value at Risk - VaR) andextreme unfavorable scenarios (VaR Stress). In addition, wecarry out historical simulations of risk positions to verifythe quality of results measured by the different methodsused.
This table represents an analysis of risk positions arisingfrom trading transactions and those linked to their riskmanagement (Structural Gap), calculated based on proprietarymodels. Structural Gap VaR showed an increase in GlobalRisk from R$ 41.1 million at December 31 to R$ 110.2 millionat March 31, 2001. This is directly related to the increase inmarket volatility at the end of March, due to the economicuncertainty in the USA and Argentina, causing an increasein domestic interest rates and foreign exchange pressures.
During the analyzed period there were no great variations inrisk positions represented by the Structural Gap, since thesetend to be more stable because they are mainly defined byassets and liabilities related to client transactions.Consequently, Structural Gap VaR is more sensitive tooscillations in market parameters.
The Own Portfolio Trading Desk portfolio shown in the tablebelow is more sensitive to market conditions and the portfolioadministrators’ expectations, and can vary substantiallyovernight. A more dynamic portfolio management allows theinversion of positions within a very short time period,automatically decreasing of exposure to market risks in thecase of economic instability.
Allocation of Regulatory Capital
The Central Bank of Brazil (BACEN), through Circular 2972,regulated the allocation of capital to hedge risk arising frominterest rate variation, based on a standard model consideringthe cash flow of all fixed rate assets and liabilities of theinstitution. Since non-interest-bearing deposits are theprincipal source of funds for fixed interest loans of retailbanks, the effect of interest rate fluctuations has a directimpact on these institutions’ results, which in turn mustconsider them in their proprietary risk management modelsto avoid that market volatility directly affects their results.Accordingly, non-inclusion of these deposits in the cashflow used in the Central Bank model renders proprietary riskmanagement, in the context of best practices, incompatiblewith the results of the current standard established by theCentral Bank.
In addition the Central Bank establishes, in Resolution 2606,the allocation of capital to hedge foreign exchange exposure.In this case, the current standard is highly detrimental toBrazilian banks with structural investments abroad, sincethey would only record some negative impact of exchangevariation in the case of improvement in the domesticeconomic bases and the consequent valuation of the Real.
The 0.333 multiplying factor, rendered more flexible byCircular 2.976/00 for the allocation of capital based on theinstitutions‘ foreign exchange exposure, represents anexpectation of devaluation of the US dollar to approximatelyR$ 1.45, which is totally incompatible with current marketreality. In this context, a reduction of the factor to somevalue closer to current expectations, even taking intoconsideration an extreme valuation of the Real, wouldeliminate the distortion caused by the excessive allocationof capital to the institutions’ exchange positions in assets.
The table below shows the combined effect of bothmanagement practices, i.e.: (1) inclusion of non-interest-bearing funds, net of compulsory deposits and liabilities, infixed interest cash flow used in calculations made pursuantto the Central Bank’s standard, and (2) the decrease in themultiplying factor of Resolution 2606 of 33.3% applied onasset exposure in foreign currency to 6.8%, referring to thehighest valuation of the Real in a one-month period in thelast two years, corresponding to the US dollar quotation ofR$2.00 on March 31, 2001.
Table II - Own Portfolio Trading Desk VaR (*)
Local Currency Desk
Foreign Currency Desk
Floating Rate Desk
Diversification Impact
Global VaR
Maximum Global VaR
Minimum Global VaR
0.1
0.9
0.7
(0.3)
1.4
4.2
1.2
12.31.0003.31.01VaR by Trading Desk
(*) VaR refers to the maximum potential loss of 1 day, with a 99% confidence level.
R$ Million
0.8
0.7
1.2
(0.6)
2.1
4.3
1.1
Effect of Adaptation of the Regulatory Models
Res. 2606 - Exchange Exposure (a)
Circ.2972-Interest Rate Exposure (b)
Allocation of Capital (a+b)
Basel Rate - Operating Consolidated
DifferenceSuggestedCurrent
321,322
402,072
723,394
14.4%
65,615
88,181
153,796
15.6%
(255,706)
(313,891)
(569,598)
1.2%
RiskManagement

87
Report of Independent Accountants on Supplementary Information
April 30, 2001
To the Board of Directors and StockholdersBanco Itaú S.A.
1 We have carried out a limited review of the accounting information included in the Quarterly Information of BancoItaú S.A. and Banco Itaú S.A. and subsidiary companies for the quarter ended March 31, 2001. Our report on thelimited review, dated April 30, 2001, included no exceptions.
2 Our review was performed in accordance with specific standards established by the Brazilian Institute of Accountants -IBRACON, in conjunction with the Federal Accounting Council with the objective of reviewing the consolidatedinformation of Banco Itaú S.A. and subsidiary companies included in the Quarterly Information of Banco Itaú S.A.The supplementary information included in the Management Analysis of the Operation is presented in order toprovide an additional analysis without being an integral part of the quarterly information. This supplementaryinformation was subjected to the same procedures applied during the limited review of the Quarterly Information.
3 Based on our limited review, we are not aware of any significant adjustments which should be made to thissupplementary information for it to be fairly stated, in all material respects, in relation to the Quarterly Informationtaken as a whole.
4 The limited review of the supplementary information included in the Management Analysis of the Operation for thequarter ended March 31, 2000, presented for comparison purposes, was conducted by other independentaccountants, whose report, dated May 8, 2000, included no exceptions.
PricewaterhouseCoopers Ricardo BaldinAuditores Independentes PartnerCRC 2SP000160/O-5 Contador CRC 1SP110374/O-0