
Consolidated Financial Statements for the First Three ... · PDF fileConsolidated Financial...
13
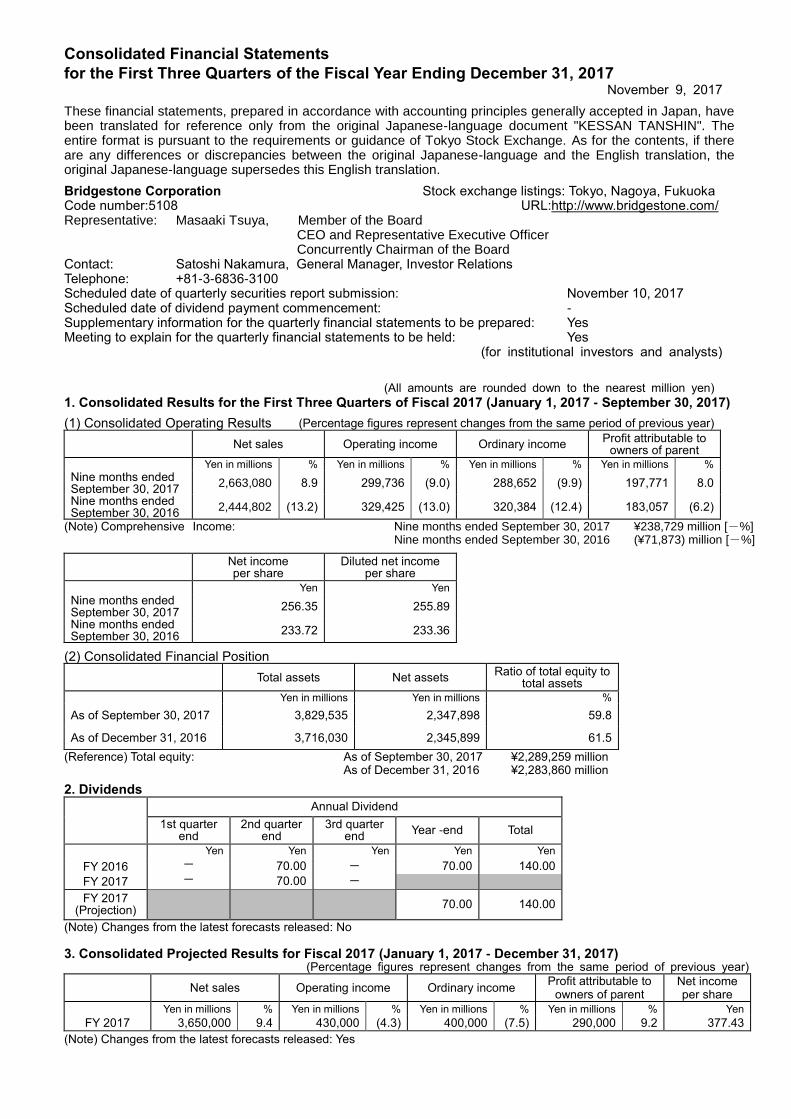
Consolidated Financial Statements for the First Three Quarters of the Fiscal Year Ending December 31, 2017 November 9, 2017 These financial statements, prepared in accordance with accounting principles generally accepted in Japan, have been translated for reference only from the original Japanese-language document "KESSAN TANSHIN". The entire format is pursuant to the requirements or guidance of Tokyo Stock Exchange. As for the contents, if there are any differences or discrepancies between the original Japanese-language and the English translation, the original Japanese-language supersedes this English translation. Bridgestone Corporation Stock exchange listings: Tokyo, Nagoya, Fukuoka Code number:5108 URL:http://www.bridgestone.com/ Representative: Masaaki Tsuya, Member of the Board CEO and Representative Executive Officer Concurrently Chairman of the Board Contact: Satoshi Nakamura, General Manager, Investor Relations Telephone: +81-3-6836-3100 Scheduled date of quarterly securities report submission: November 10, 2017 Scheduled date of dividend payment commencement: - Supplementary information for the quarterly financial statements to be prepared: Yes Meeting to explain for the quarterly financial statements to be held: Yes (for institutional investors and analysts) (All amounts are rounded down to the nearest million yen) 1. Consolidated Results for the First Three Quarters of Fiscal 2017 (January 1, 2017 - September 30, 2017) (1) Consolidated Operating Results (Percentage figures represent changes from the same period of previous year) Net sales Operating income Ordinary income Profit attributable to owners of parent Yen in millions % Yen in millions % Yen in millions % Yen in millions % Nine months ended September 30, 2017 2,663,080 8.9 299,736 (9.0) 288,652 (9.9) 197,771 8.0 Nine months ended September 30, 2016 2,444,802 (13.2) 329,425 (13.0) 320,384 (12.4) 183,057 (6.2) (Note) Comprehensive Income: Nine months ended September 30, 2017 ¥238,729 million [-%] Nine months ended September 30, 2016 (¥71,873) million [-%] Net income per share Diluted net income per share Yen Yen Nine months ended September 30, 2017 256.35 255.89 Nine months ended September 30, 2016 233.72 233.36 (2) Consolidated Financial Position Total assets Net assets Ratio of total equity to total assets Yen in millions Yen in millions % As of September 30, 2017 3,829,535 2,347,898 59.8 As of December 31, 2016 3,716,030 2,345,899 61.5 (Reference) Total equity: As of September 30, 2017 ¥2,289,259 million As of December 31, 2016 ¥2,283,860 million 2. Dividends Annual Dividend 1st quarter end 2nd quarter end 3rd quarter end Year -end Total Yen Yen Yen Yen Yen FY 2016 - 70.00 - 70.00 140.00 FY 2017 - 70.00 - FY 2017 (Projection) 70.00 140.00 (Note) Changes from the latest forecasts released: No 3. Consolidated Projected Results for Fiscal 2017 (January 1, 2017 - December 31, 2017) (Percentage figures represent changes from the same period of previous year) Net sales Operating income Ordinary income Profit attributable to owners of parent Net income per share Yen in millions % Yen in millions % Yen in millions % Yen in millions % Yen FY 2017 3,650,000 9.4 430,000 (4.3) 400,000 (7.5) 290,000 9.2 377.43 (Note) Changes from the latest forecasts released: Yes
Transcript of Consolidated Financial Statements for the First Three ... · PDF fileConsolidated Financial...
Consolidated Financial Statements
for the First Three Quarters of the Fiscal Year Ending December 31, 2017 November 9, 2017
These financial statements, prepared in accordance with accounting principles generally accepted in Japan, have been translated for reference only from the original Japanese-language document "KESSAN TANSHIN". The entire format is pursuant to the requirements or guidance of Tokyo Stock Exchange. As for the contents, if there are any differences or discrepancies between the original Japanese-language and the English translation, the original Japanese-language supersedes this English translation.
Bridgestone Corporation Stock exchange listings: Tokyo, Nagoya, Fukuoka Code number:5108 URL:http://www.bridgestone.com/ Representative: Masaaki Tsuya, Member of the Board
CEO and Representative Executive Officer Concurrently Chairman of the Board
Contact: Satoshi Nakamura, General Manager, Investor Relations Telephone: +81-3-6836-3100 Scheduled date of quarterly securities report submission: November 10, 2017 Scheduled date of dividend payment commencement: - Supplementary information for the quarterly financial statements to be prepared: Yes Meeting to explain for the quarterly financial statements to be held: Yes
(for institutional investors and analysts)
(All amounts are rounded down to the nearest million yen)
1. Consolidated Results for the First Three Quarters of Fiscal 2017 (January 1, 2017 - September 30, 2017)
(1) Consolidated Operating Results (Percentage figures represent changes from the same period of previous year)
Net sales Operating income Ordinary income Profit attributable to
owners of parent Yen in millions % Yen in millions % Yen in millions % Yen in millions %
Nine months ended September 30, 2017
2,663,080 8.9 299,736 (9.0) 288,652 (9.9) 197,771 8.0
Nine months ended September 30, 2016
2,444,802 (13.2) 329,425 (13.0) 320,384 (12.4) 183,057 (6.2)
(Note) Comprehensive Income: Nine months ended September 30, 2017 ¥238,729 million [-%] Nine months ended September 30, 2016 (¥71,873) million [-%]
Net income per share
Diluted net income per share
Yen Yen
Nine months ended September 30, 2017
256.35 255.89
Nine months ended September 30, 2016
233.72 233.36
(2) Consolidated Financial Position
Total assets Net assets Ratio of total equity to
total assets Yen in millions Yen in millions %
As of September 30, 2017 3,829,535 2,347,898 59.8
As of December 31, 2016 3,716,030 2,345,899 61.5
(Reference) Total equity: As of September 30, 2017 ¥2,289,259 million As of December 31, 2016 ¥2,283,860 million
2. Dividends
Annual Dividend
1st quarter end
2nd quarter end
3rd quarter end
Year -end Total
Yen Yen Yen Yen Yen
FY 2016 - 70.00 - 70.00 140.00
FY 2017 - 70.00 -
FY 2017 (Projection)
70.00 140.00
(Note) Changes from the latest forecasts released: No
3. Consolidated Projected Results for Fiscal 2017 (January 1, 2017 - December 31, 2017)(Percentage figures represent changes from the same period of previous year)
Net sales Operating income Ordinary income Profit attributable to
owners of parent Net income per share
Yen in millions % Yen in millions % Yen in millions % Yen in millions % Yen
FY 2017 3,650,000 9.4 430,000 (4.3) 400,000 (7.5) 290,000 9.2 377.43
(Note) Changes from the latest forecasts released: Yes
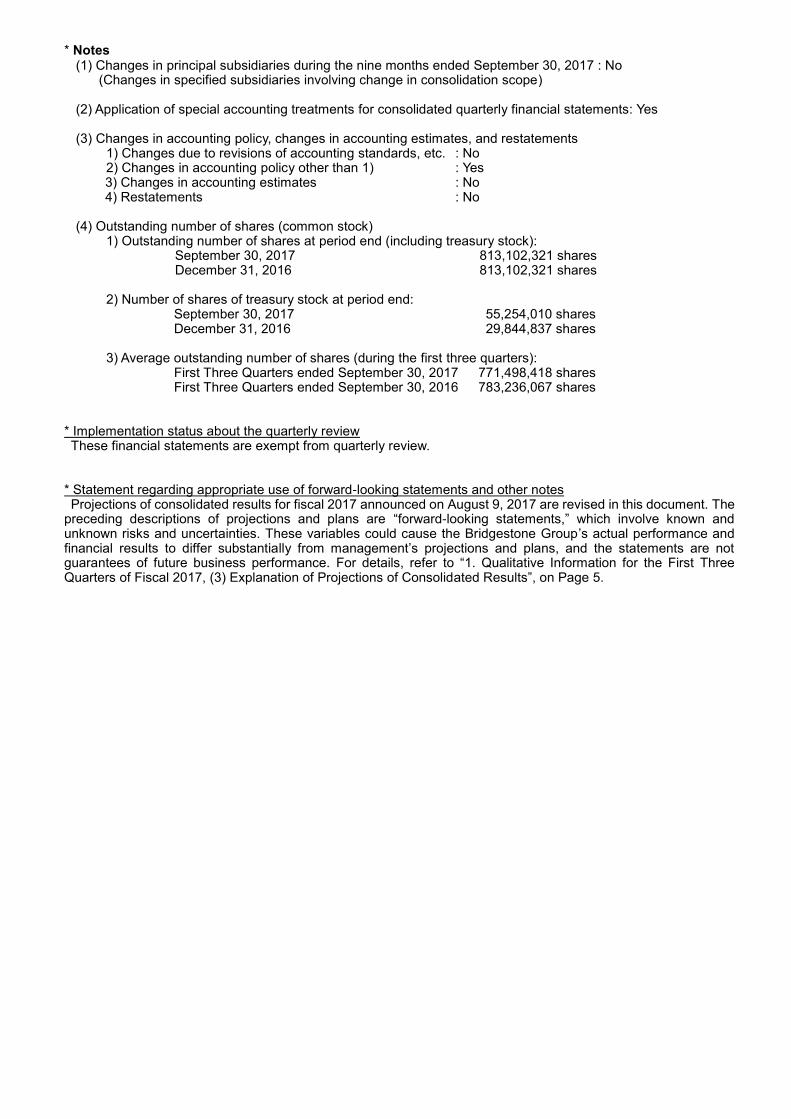
* Notes (1) Changes in principal subsidiaries during the nine months ended September 30, 2017 : No
(Changes in specified subsidiaries involving change in consolidation scope)
(2) Application of special accounting treatments for consolidated quarterly financial statements: Yes
(3) Changes in accounting policy, changes in accounting estimates, and restatements 1) Changes due to revisions of accounting standards, etc. : No 2) Changes in accounting policy other than 1) : Yes
3) Changes in accounting estimates : No 4) Restatements : No (4) Outstanding number of shares (common stock)
1) Outstanding number of shares at period end (including treasury stock): September 30, 2017 813,102,321 shares December 31, 2016 813,102,321 shares
2) Number of shares of treasury stock at period end:
September 30, 2017 55,254,010 shares December 31, 2016 29,844,837 shares
3) Average outstanding number of shares (during the first three quarters):
First Three Quarters ended September 30, 2017 771,498,418 shares First Three Quarters ended September 30, 2016 783,236,067 shares
* Implementation status about the quarterly review These financial statements are exempt from quarterly review.
* Statement regarding appropriate use of forward-looking statements and other notes Projections of consolidated results for fiscal 2017 announced on August 9, 2017 are revised in this document. The
preceding descriptions of projections and plans are “forward-looking statements,” which involve known and unknown risks and uncertainties. These variables could cause the Bridgestone Group’s actual performance and financial results to differ substantially from management’s projections and plans, and the statements are not guarantees of future business performance. For details, refer to “1. Qualitative Information for the First Three Quarters of Fiscal 2017, (3) Explanation of Projections of Consolidated Results”, on Page 5.

Bridgestone Corporation (5108) First three quarters results of fiscal 2017
1
[Index]
1. Qualitative Information for the First Three Quarters of Fiscal 2017 …P2
(1) Explanation of Consolidated Operating Results …P2
(2) Explanation of Consolidated Financial Position …P4
(3) Explanation of Projections of Consolidated Results …P5
2. Other Information (Notes) …P6
(1) Application of Special Accounting Treatments for Consolidated Quarterly Financial Statements …P6
(2) Changes in Accounting Policy, Changes in Accounting Estimates, and Restatements …P6
3. Consolidated Quarterly Financial Statements …P7
(1) Consolidated Balance Sheet …P7
(2) Consolidated Statement of Income and Consolidated Statement of Comprehensive Income …P9
Consolidated Statement of Income …P9
Consolidated Statement of Comprehensive Income …P10
(3) Notes to the Consolidated Financial Statements …P11
(Notes regarding going concern assumption) …P11
(Notes regarding significant changes in the amount of shareholders’ equity) …P11
(Segment Information) …P11

Bridgestone Corporation (5108) First three quarters results of fiscal 2017
2
FY 2017 3Q FY 2016 3Q
(Nine months ended
September 30, 2017)
(Nine months ended
September 30, 2016)
Yen in billions Yen in billions Yen in billions %
Net sales 2,663.0 2,444.8 218.2 9
Operating income 299.7 329.4 (29.6) (9)
Ordinary income 288.6 320.3 (31.7) (10)
Profit attributable to owners of parent 197.7 183.0 14.7 8
Increase
(Decrease)
1. Qualitative Information for the First Three Quarters of Fiscal 2017
The Bridgestone Corporation is referred to as the “Company”, and the Company and its subsidiaries are referred
to as the “Companies”.
(1) Explanation of Consolidated Operating Results
1) Sales and earnings
In the first three quarters of fiscal 2017 (January 1 to September 30, 2017), the operating environment
surrounding the Companies was as follows: an unclear situation continued due to the uncertainty of the global
economy while the Japanese domestic economy continued gradual recovery. The United States economy
continued steady recovery. The European economy continued to show gradual recovery but remained unstable as
a result of the United Kingdom leaving the European Union and related issues. In Asia, the Chinese economic
growth had shown the signs of recovery. Overall, overseas economies were gradually recovering but still weak
while the political and economic situation remained unstable. In addition, tire demand for mining vehicles increased
along with rising commodity prices.
Under these operating conditions, the Companies continued their work to realize the ultimate goal of becoming “a
truly global company” and achieving “Dan-Totsu in all aspects of its business.” Stepping up efforts on a global scale,
we focused on promoting brand strategies through sponsorship and support activities for the Olympic and
Paralympic Games Tokyo 2020. The Companies also expanded sales of highly competitive products and services
in global markets through promoting innovation, while building and enhancing a solutions business that extends
beyond the mere sales of products. Moreover, the Companies continuously strives to implement various measures
for management reform, aimed at reforming governance structure and effectively utilizing management resources
by investing appropriate costs.
As a result, net sales in the first three quarters of fiscal 2017 were ¥2,663.0 billion, an increase of 9% from the first
three quarters of fiscal 2016; operating income was ¥299.7 billion, a decrease of 9%, ordinary income was ¥288.6
billion, a decrease of 10%, due in part to increasing raw material costs; and profit attributable to owners of parent
was ¥197.7 billion, an increase of 8%.
Bridgestone Corporation (5108) First three quarters results of fiscal 2017
3
FY 2017 3Q FY 2016 3Q
(Nine months ended (Nine months ended
September 30, 2017) September 30, 2016)
Yen in billions Yen in billions Yen in billions %
Tires Net Sales 2,207.4 2,013.0 194.4 10
Operating income 274.4 300.3 (25.9) (9)
Net Sales 467.2 442.5 24.6 6
Operating income 25.3 29.0 (3.6) (13)
Net Sales 2,663.0 2,444.8 218.2 9
Operating income 299.7 329.4 (29.6) (9)
Diversified
Products
Consolidated
Results
Increase
(Decrease)
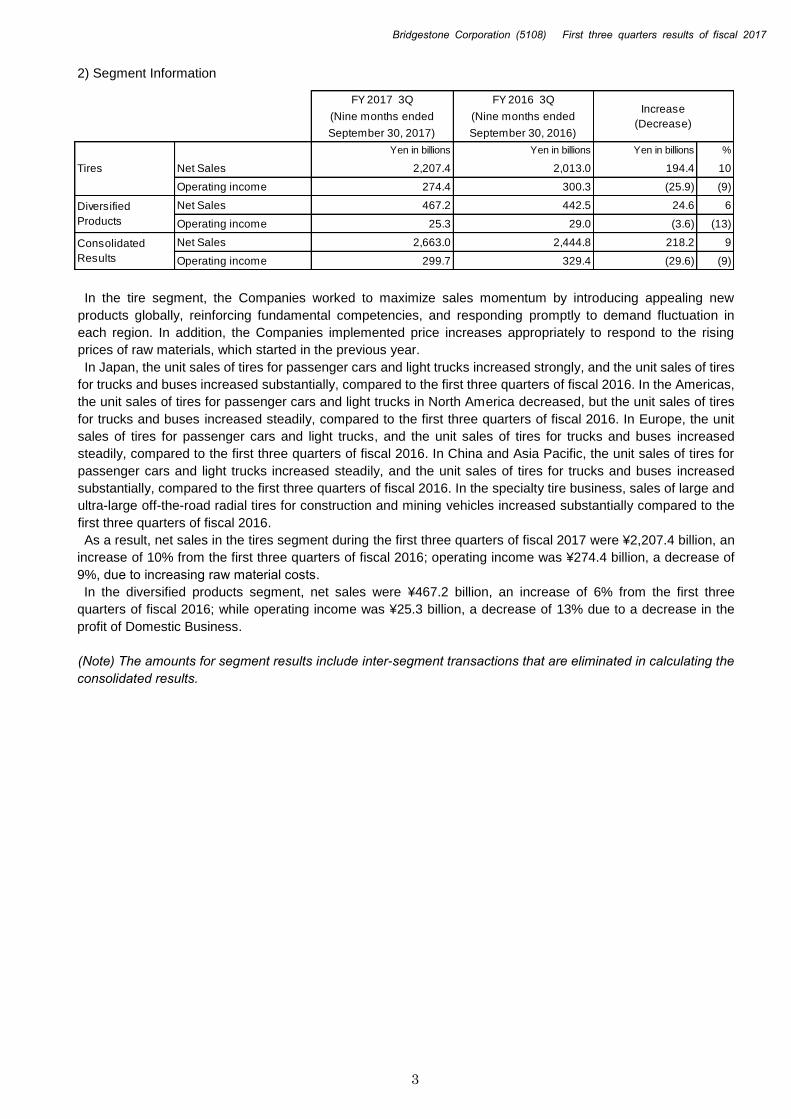
2) Segment Information
In the tire segment, the Companies worked to maximize sales momentum by introducing appealing new
products globally, reinforcing fundamental competencies, and responding promptly to demand fluctuation in
each region. In addition, the Companies implemented price increases appropriately to respond to the rising
prices of raw materials, which started in the previous year.
In Japan, the unit sales of tires for passenger cars and light trucks increased strongly, and the unit sales of tires
for trucks and buses increased substantially, compared to the first three quarters of fiscal 2016. In the Americas,
the unit sales of tires for passenger cars and light trucks in North America decreased, but the unit sales of tires
for trucks and buses increased steadily, compared to the first three quarters of fiscal 2016. In Europe, the unit
sales of tires for passenger cars and light trucks, and the unit sales of tires for trucks and buses increased
steadily, compared to the first three quarters of fiscal 2016. In China and Asia Pacific, the unit sales of tires for
passenger cars and light trucks increased steadily, and the unit sales of tires for trucks and buses increased
substantially, compared to the first three quarters of fiscal 2016. In the specialty tire business, sales of large and
ultra-large off-the-road radial tires for construction and mining vehicles increased substantially compared to the
first three quarters of fiscal 2016.
As a result, net sales in the tires segment during the first three quarters of fiscal 2017 were ¥2,207.4 billion, an
increase of 10% from the first three quarters of fiscal 2016; operating income was ¥274.4 billion, a decrease of
9%, due to increasing raw material costs.
In the diversified products segment, net sales were ¥467.2 billion, an increase of 6% from the first three
quarters of fiscal 2016; while operating income was ¥25.3 billion, a decrease of 13% due to a decrease in the
profit of Domestic Business.
(Note) The amounts for segment results include inter-segment transactions that are eliminated in calculating the
consolidated results.

Bridgestone Corporation (5108) First three quarters results of fiscal 2017
4
(2) Explanation of Consolidated Financial Position
Assets, liabilities, and net assets positions at the end of the first three quarters of fiscal 2017 were as follows.
(Assets)
In assets, notes and accounts receivable, merchandise and finished products, and intangible fixed assets
increased by ¥30.7 billion, ¥38.2 billion and ¥35.6 billion respectively. As a result, assets increased by ¥113.5
billion compared with the end of the previous fiscal year, to ¥3,829.5 billion.
(Liabilities)
In liabilities, while short-term borrowings decreased by ¥51.8 billion, bonds increased by ¥150.0 billion. As a
result, liabilities increased by ¥111.5 billion compared with the end of the previous fiscal year, to ¥1,481.6 billion.
(Net assets)
In net assets, while cash dividends paid were ¥108.4 billion and a decline due to the acquisition of treasury stock
was ¥118.2 billion, profit attributable to owners of parent was ¥197.7 billion, net unrealized gain on
available-for-sale securities, foreign currency translation adjustments and remeasurements of defined benefit
plans increased by ¥12.2 billion, ¥7.0 billion and ¥14.0 billion respectively. As a result, net assets increased by
¥1.9 billion compared with the end of the previous fiscal year, to ¥2,347.8 billion.
Due to an increase of assets by ¥113.5 billion, the ratio of total equity to total assets decreased by 1.7 points
compared with the end of the previous fiscal year, to 59.8%.

Bridgestone Corporation (5108) First three quarters results of fiscal 2017
5
FY 2017 Projections
(Revised)
FY 2017 Projections
(Previous)
(Ref.)
FY 2016 Results
Yen in billions Yen in billions Yen in billions % Yen in billions
3,650.0 3,700.0 (50.0) (1) 3,337.0
430.0 464.0 (34.0) (7) 449.5
400.0 439.0 (39.0) (9) 432.5
290.0 289.0 1.0 - 265.5
Yen Yen % Yen
yen/dollar 111 111 - 109
yen/euro 126 122 3 120
Increase
(Decrease)
Net sales
Operating income
Ordinary income
Profit attributable to owners of parent
Exchange
Rate―
(3) Explanation of Projections of Consolidated Results
The Companies' operating environment will continue to require careful attention due to such factors as
fluctuations in exchange rates and the prices of raw materials and feedstock, an ongoing lack of clarity in the
global economic situation and international political conditions that remain unstable.
Amid such a challenging business environment, the Companies project the following results through the
implementation of Mid-Term Management Plan initiatives.
.
FY 2017 projections (Fiscal Year ending December 31, 2017)
(Revision of the projections)
Based on the operating performance of the first three quarters of fiscal 2017, the Company revised its full-year
consolidated financial projections for the fiscal year ending December 31, 2017, which were previously announced
on August 9, 2017.
Forward-Looking Statements
The preceding descriptions of projections and plans are “forward-looking statements,” which involve known and
unknown risks and uncertainties. These variables could cause the Bridgestone Group’s actual performance and
results to differ substantially from management’s projections and plans, and the statement are not guarantees of
future business performance.

Bridgestone Corporation (5108) First three quarters results of fiscal 2017
6
2. Other Information (Notes)
(1) Application of Special Accounting Treatments for Consolidated Quarterly Financial Statements
(Calculation for income tax expense)
Income tax expense was calculated based upon an estimated effective tax rate for fiscal 2017.
(2) Changes in Accounting Policy, Changes in Accounting Estimates, and Restatements
Changes in accounting policy
(Application of International Financial Reporting Standards (IFRS) to Foreign Subsidiaries)
BRIDGESTONE EUROPE NV/SA (BSEU) has applied IFRS from the first quarter of fiscal 2017, formerly
"Generally Accepted Accounting Principles (US GAAP)". In determining initial application of IFRS in BSEU,
the Company comprehensively evaluates factors including accounting trends and the plan for voluntary
application of IFRS as the Companies.
As BSEU applied the revision in this policy retrospectively and the cumulative effect of the revision was
reflected on the net assets at the beginning of fiscal 2016, the consolidated financial statements for the
previous fiscal year changed. The main changes were as follows: retained earnings at the beginning of
previous fiscal year decreased ¥7,280 million and foreign currency translation adjustments increased ¥7,667
million.

Bridgestone Corporation (5108) First three quarters results of fiscal 2017
7
Assets
Current Assets
Cash and deposits 483,006 421,951
Notes and accounts receivable 455,218 485,944
Short-term investments 167,697 194,998
Merchandise and finished products 377,412 415,617
Work in process 35,469 41,863
Raw materials and supplies 144,527 157,293
Other 174,997 197,128
Allowance for doubtful accounts (16,179) (18,274)
Total Current Assets 1,822,150 1,896,522
Fixed Assets
Tangible fixed assets
Buildings and structures, net 526,688 522,477
Machinery, equipment and vehicles, net 505,685 488,473
Other, net 416,752 412,626
Total Tangible Fixed Assets 1,449,126 1,423,578
Intangible fixed assets
Goodwill 22,935 44,068
Other 51,208 65,735
Total Intangible fixed assets 74,144 109,803
Investments and other assets
Investments in securities 263,549 288,309
Other 108,790 113,138
Allowance for doubtful accounts (1,730) (1,816)
Total Investments and Other Assets 370,609 399,631
Total Fixed Assets 1,893,880 1,933,012
Total Assets 3,716,030 3,829,535
(As of September 30, 2017)
FY 2016 FY 2017 3Q
(As of December 31, 2016)
3. Consolidated Quarterly Financial Statements
(1) Consolidated Balance Sheet
(Yen in millions)

Bridgestone Corporation (5108) First three quarters results of fiscal 2017
8
Liabilities
Current Liabilities
Notes and accounts payable 195,603 224,073
Short-term borrowings 174,678 122,779
Commercial paper ― 18,429
Current portion of bonds ― 20,000
Lease obligations 1,017 1,159
Income taxes payable 22,722 45,500
Provision for reorganization of R&D
and manufacturing base― 8,908
Accounts payable-other 168,714 125,964
Other 287,099 287,206
Total Current Liabilities 849,834 854,022
Long-term Liabilities
Bonds 90,000 220,000
Long-term borrowings 70,458 65,852
Lease obligations 6,616 6,930
Provision for reorganization of R&D
and manufacturing base13,951 ―
Net defined benefit liability 215,072 200,198
Other 124,198 134,631
Total Long-term Liabilities 520,296 627,614
Total Liabilities 1,370,130 1,481,636
Net Assets
Shareholders' Equity
Common stock 126,354 126,354
Capital surplus 123,005 122,988
Retained earnings 2,163,115 2,252,319
Treasury stock-at cost (56,151) (174,447)
Total Shareholders’ Equity 2,356,323 2,327,214
Accumulated Other Comprehensive Income
Net unrealized gain(loss) on
available-for-sale securities
Deferred gain(loss) on derivative instruments (1,720) (586)
Foreign currency translation adjustments (107,242) (100,188)
Remeasurements of defined benefit plans (137,698) (123,639)
Total Accumulated Other Comprehensive
Income(72,463) (37,955)
Stock Acquisition Rights 2,975 3,665
Non-controlling Interests 59,063 54,973
Total Net Assets 2,345,899 2,347,898
Total Liabilities and Net Assets 3,716,030 3,829,535
174,197 186,458
FY 2016 FY 2017 3Q
(As of December 31, 2016) (As of September 30, 2017)
(Yen in millions)

Bridgestone Corporation (5108) First three quarters results of fiscal 2017
9
Net Sales 2,444,802 2,663,080
Cost of Sales 1,437,975 1,653,396
Gross Profit 1,006,827 1,009,683
Goods freightage expenses 109,063 124,841
Advertising and promotion expenses 86,051 85,660
Salaries, allowances and bonuses 184,319 193,823
Retirement benefit expenses 14,125 18,681
Depreciation 23,335 24,719
Research and development expenses 71,097 73,035
Other 189,408 189,185
Total Selling, General and
Administrative Expenses677,401 709,947
Operating Income 329,425 299,736
Non-operating Income
Interest income 3,215 3,924
Dividend income 6,382 6,202
Gain on sales of investment securities 4,769 ―
Other 9,009 12,293
Total Non-operating Income 23,376 22,420
Non-operating Expenses
Interest expense 7,967 7,881
Foreign currency exchange loss 10,193 7,082
Other 14,256 18,539
Total Non-operating Expenses 32,418 33,504
Ordinary Income 320,384 288,652
Extraordinary Income
Gain on sales of investment securities ― 10,441
Total Extraordinary Income ― 10,441
Extraordinary Loss
Loss related to civil litigation in the Americas ― 4,484
Expenses related to relocation of head office
of Americas Operations― 3,831
17,649 ―
Total Extraordinary Loss 17,649 8,316
Income before Income Taxes and
Non-controlling Interests302,735 290,777
Income Taxes 112,454 86,296
Income before Non-Controlling Interests 190,280 204,480
Profit Attributable to Non-controlling Interests 7,223 6,709
Profit Attributable to Owners of Parent 183,057 197,771
FY 2016 3Q
(Nine months ended
September 30, 2016)
Loss related to reorganization of R&D
and manufacturing base
FY 2017 3Q
(Nine months ended
September 30, 2017)
Selling, General and Administrative Expenses
(2) Consolidated Statement of Income and Consolidated Statement of Comprehensive Income
Consolidated Statement of Income
First Three Quarters (Yen in millions)

Bridgestone Corporation (5108) First three quarters results of fiscal 2017
10
Income before Non-controlling Interests 190,280 204,480
Other Comprehensive Income (loss)
Unrealized gain (loss) on available-for-sale
securities(44,908) 12,244
Deferred gain (loss) on derivative instruments 461 1,356
Foreign currency translation adjustments (244,257) 7,496
Remeasurements of defined benefit plans 28,832 13,668
Share of other comprehensive income in
affiliates(2,281) (516)
Total Other Comprehensive Income (262,154) 34,248
Comprehensive Income (71,873) 238,729
Comprehensive income attributable to:
Owners of parent (71,453) 232,279
Non-controlling interests (420) 6,449
FY 2016 3Q
(Nine months ended
September 30, 2016)
FY 2017 3Q
(Nine months ended
September 30, 2017)
Consolidated Statement of Comprehensive Income
First Three Quarters (Yen in millions)

Bridgestone Corporation (5108) First three quarters results of fiscal 2017
11
Adjustments
(Note)
Net sales:
External customers 2,008,284 436,518 2,444,802 ― 2,444,802
Inter-segment 4,756 6,007 10,764 (10,764) ―
Total 2,013,040 442,525 2,455,566 (10,764) 2,444,802
Segment income
(Operating income)300,395 29,016 329,411 14 329,425
TiresDiversified
ProductsTotal Consolidated
Adjustments
(Note)
Net sales:
External customers 2,199,930 463,150 2,663,080 ― 2,663,080
Inter-segment 7,515 4,052 11,567 (11,567) ―
Total 2,207,445 467,202 2,674,648 (11,567) 2,663,080
Segment income
(Operating income)274,453 25,337 299,791 (54) 299,736
TiresDiversified
ProductsTotal Consolidated
(3) Notes to the Consolidated Financial Statements
(Notes regarding going concern assumption)
Not applicable
(Notes regarding significant changes in the amount of shareholders’ equity)
The company acquired its own shares (25,439,900 shares) based on the resolution at the board of directors
held on February 17, 2017. Due mainly to the acquisition, treasury stock - at cost increased by ¥118,296 million
compared with the end of the previous fiscal year, to ¥174,447 million.
(Segment Information)
Information about Sales and Income (Loss) by reportable segment
FY 2016 First Three Quarters (Nine months ended September 30, 2016) (Yen in millions)
(Note) Adjustments of segment income refer to elimination of intersegment transactions.
FY 2017 First Three Quarters (Nine months ended September 30, 2017) (Yen in millions)
(Note) Adjustments of segment income refer to elimination of intersegment transactions.


