Consolidated financial statements December 31, 2017...FINANCIAL STATEMENTS CONSOLIDATED FINANCIAL...
141
FINANCIAL STATEMENTS CONSOLIDATED FINANCIAL STATEMENTS - DECEMBER 31, 2017 / VEOLIA ENVIRONNEMENT 1 Consolidated financial statements December 31, 2017 Version under review by the statutory auditors
Transcript of Consolidated financial statements December 31, 2017...FINANCIAL STATEMENTS CONSOLIDATED FINANCIAL...
FINANCIAL STATEMENTS
CONSOLIDATED FINANCIAL STATEMENTS - DECEMBER 31, 2017 / VEOLIA ENVIRONNEMENT 1
Consolidated financial statements
December 31, 2017 Version under review by the statutory auditors
FINANCIAL STATEMENTS
2 VEOLIA ENVIRONNEMENT / CONSOLIDATED FINANCIAL STATEMENTS - DECEMBER 31, 2017
Contents
Consolidated Financial Statements
Consolidated Statement of Financial Position
Consolidated Income Statement
Consolidated Statement of Comprehensive Income
Consolidated Cash Flow Statement
Statement of Changes in Equity
Notes to the consolidated financial statements
FINANCIAL STATEMENTS
CONSOLIDATED FINANCIAL STATEMENTS - DECEMBER 31, 2017 / VEOLIA ENVIRONNEMENT 3
Consolidated financial statements
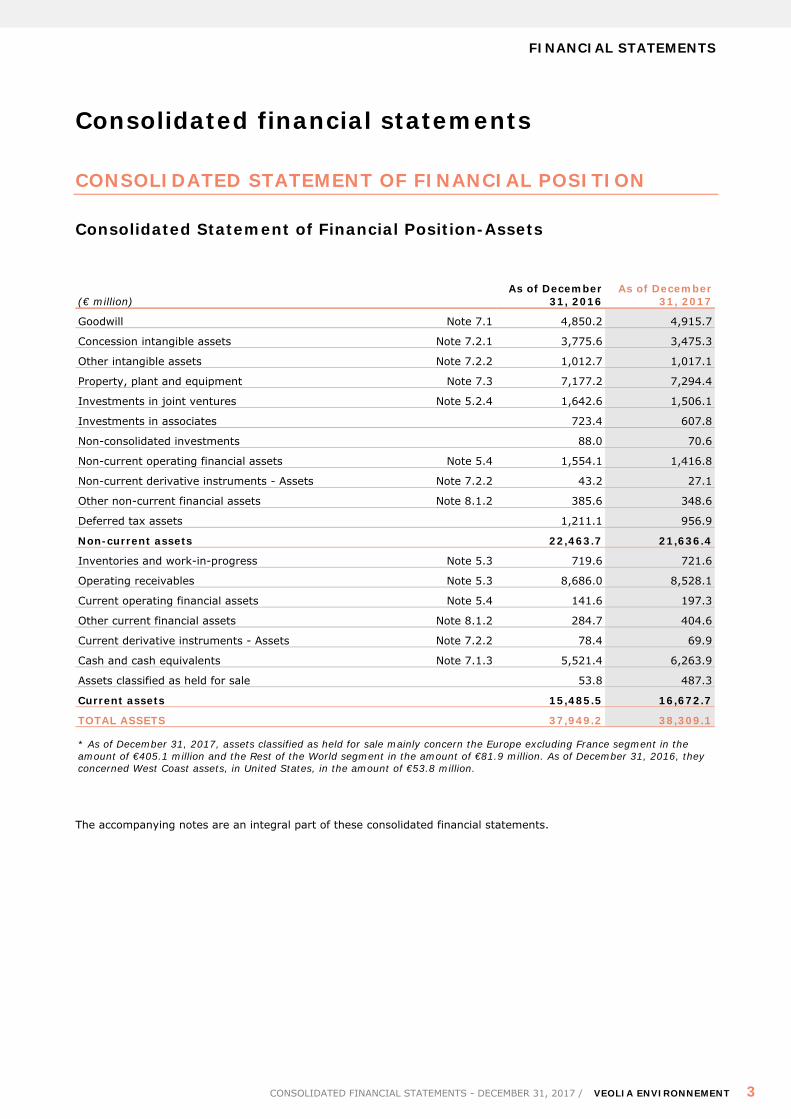
CONSOLIDATED STATEMENT OF FINANCIAL POSITION
Consolidated Statement of Financial Position-Assets
(€ million) As of December
31, 2016 As of December
31, 2017
Goodwill Note 7.1 4,850.2 4,915.7
Concession intangible assets Note 7.2.1 3,775.6 3,475.3
Other intangible assets Note 7.2.2 1,012.7 1,017.1
Property, plant and equipment Note 7.3 7,177.2 7,294.4
Investments in joint ventures Note 5.2.4 1,642.6 1,506.1
Investments in associates 723.4 607.8
Non-consolidated investments 88.0 70.6
Non-current operating financial assets Note 5.4 1,554.1 1,416.8
Non-current derivative instruments - Assets Note 7.2.2 43.2 27.1
Other non-current financial assets Note 8.1.2 385.6 348.6
Deferred tax assets 1,211.1 956.9
Non-current assets 22,463.7 21,636.4
Inventories and work-in-progress Note 5.3 719.6 721.6
Operating receivables Note 5.3 8,686.0 8,528.1
Current operating financial assets Note 5.4 141.6 197.3
Other current financial assets Note 8.1.2 284.7 404.6
Current derivative instruments - Assets Note 7.2.2 78.4 69.9
Cash and cash equivalents Note 7.1.3 5,521.4 6,263.9
Assets classified as held for sale 53.8 487.3
Current assets 15,485.5 16,672.7
TOTAL ASSETS 37,949.2 38,309.1
* As of December 31, 2017, assets classified as held for sale mainly concern the Europe excluding France segment in the amount of €405.1 million and the Rest of the World segment in the amount of €81.9 million. As of December 31, 2016, they concerned West Coast assets, in United States, in the amount of €53.8 million.
The accompanying notes are an integral part of these consolidated financial statements.
FINANCIAL STATEMENTS
4 VEOLIA ENVIRONNEMENT / CONSOLIDATED FINANCIAL STATEMENTS - DECEMBER 31, 2017
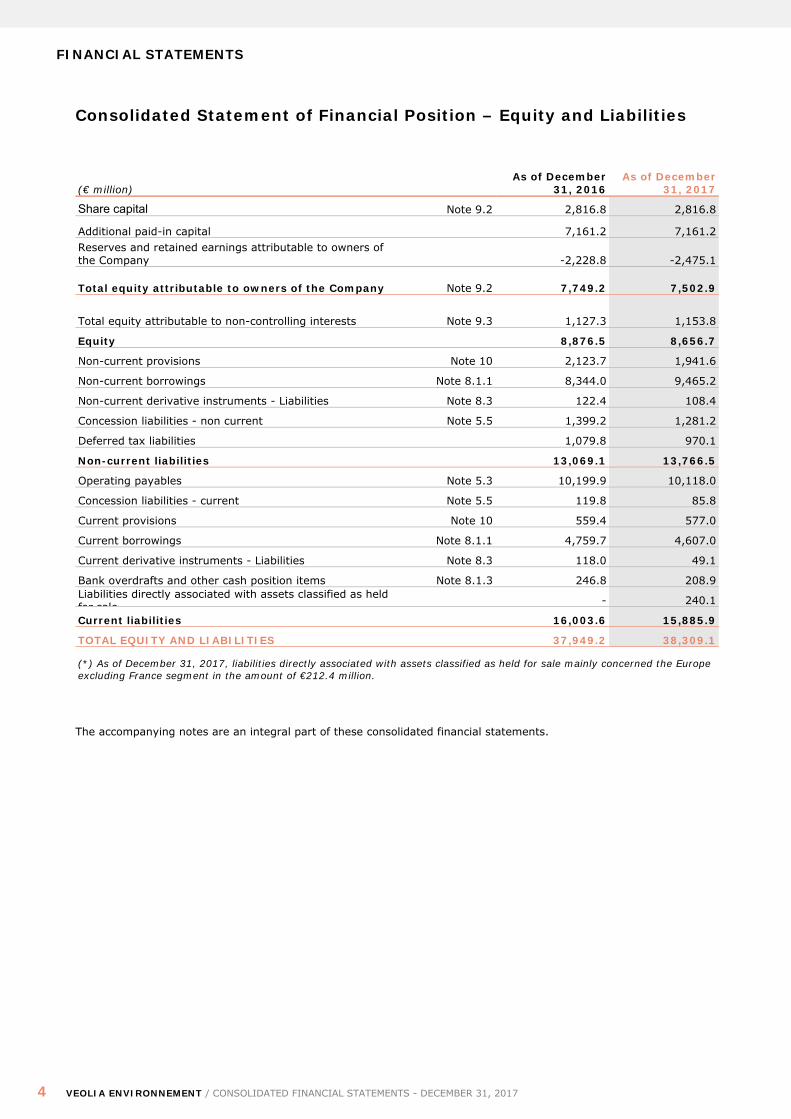
Consolidated Statement of Financial Position – Equity and Liabilities
(€ million) As of December
31, 2016 As of December
31, 2017
Share capital Note 9.2 2,816.8 2,816.8
Additional paid-in capital 7,161.2 7,161.2 Reserves and retained earnings attributable to owners of the Company -2,228.8 -2,475.1
Total equity attributable to owners of the Company Note 9.2 7,749.2 7,502.9
Total equity attributable to non-controlling interests Note 9.3 1,127.3 1,153.8
Equity 8,876.5 8,656.7
Non-current provisions Note 10 2,123.7 1,941.6
Non-current borrowings Note 8.1.1 8,344.0 9,465.2
Non-current derivative instruments - Liabilities Note 8.3 122.4 108.4
Concession liabilities - non current Note 5.5 1,399.2 1,281.2
Deferred tax liabilities 1,079.8 970.1
Non-current liabilities 13,069.1 13,766.5
Operating payables Note 5.3 10,199.9 10,118.0
Concession liabilities - current Note 5.5 119.8 85.8
Current provisions Note 10 559.4 577.0
Current borrowings Note 8.1.1 4,759.7 4,607.0
Current derivative instruments - Liabilities Note 8.3 118.0 49.1
Bank overdrafts and other cash position items Note 8.1.3 246.8 208.9 Liabilities directly associated with assets classified as held for sale - 240.1
Current liabilities 16,003.6 15,885.9
TOTAL EQUITY AND LIABILITIES 37,949.2 38,309.1
(*) As of December 31, 2017, liabilities directly associated with assets classified as held for sale mainly concerned the Europe excluding France segment in the amount of €212.4 million.
The accompanying notes are an integral part of these consolidated financial statements.
FINANCIAL STATEMENTS
CONSOLIDATED FINANCIAL STATEMENTS - DECEMBER 31, 2017 / VEOLIA ENVIRONNEMENT 5
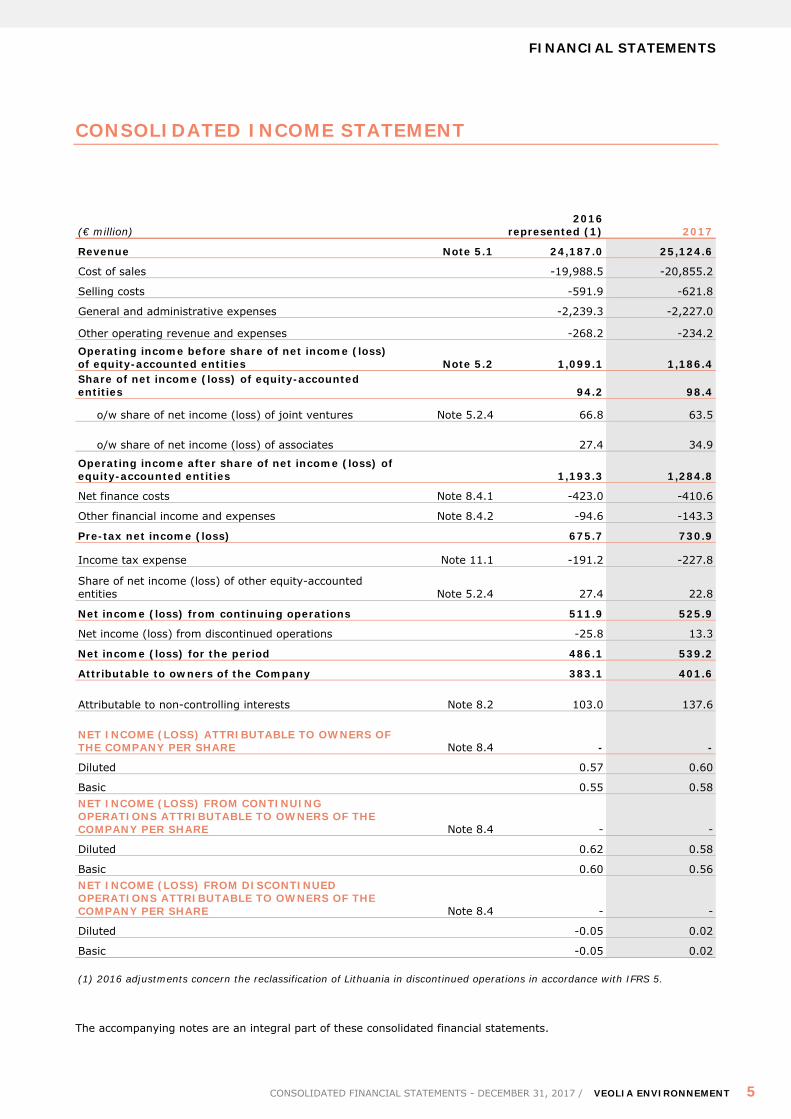
CONSOLIDATED INCOME STATEMENT
(€ million) 2016
represented (1) 2017
Revenue Note 5.1 24,187.0 25,124.6
Cost of sales -19,988.5 -20,855.2
Selling costs -591.9 -621.8
General and administrative expenses -2,239.3 -2,227.0
Other operating revenue and expenses -268.2 -234.2 Operating income before share of net income (loss) of equity-accounted entities Note 5.2 1,099.1 1,186.4 Share of net income (loss) of equity-accounted entities 94.2 98.4
o/w share of net income (loss) of joint ventures Note 5.2.4 66.8 63.5
o/w share of net income (loss) of associates 27.4 34.9
Operating income after share of net income (loss) of equity-accounted entities 1,193.3 1,284.8
Net finance costs Note 8.4.1 -423.0 -410.6
Other financial income and expenses Note 8.4.2 -94.6 -143.3
Pre-tax net income (loss) 675.7 730.9
Income tax expense Note 11.1 -191.2 -227.8
Share of net income (loss) of other equity-accounted entities Note 5.2.4 27.4 22.8
Net income (loss) from continuing operations 511.9 525.9
Net income (loss) from discontinued operations -25.8 13.3
Net income (loss) for the period 486.1 539.2
Attributable to owners of the Company 383.1 401.6
Attributable to non-controlling interests Note 8.2 103.0 137.6
NET INCOME (LOSS) ATTRIBUTABLE TO OWNERS OF THE COMPANY PER SHARE Note 8.4 - -
Diluted 0.57 0.60
Basic 0.55 0.58 NET INCOME (LOSS) FROM CONTINUING OPERATIONS ATTRIBUTABLE TO OWNERS OF THE COMPANY PER SHARE Note 8.4 - -
Diluted 0.62 0.58
Basic 0.60 0.56 NET INCOME (LOSS) FROM DISCONTINUED OPERATIONS ATTRIBUTABLE TO OWNERS OF THE COMPANY PER SHARE Note 8.4 - -
Diluted -0.05 0.02
Basic -0.05 0.02
(1) 2016 adjustments concern the reclassification of Lithuania in discontinued operations in accordance with IFRS 5.
The accompanying notes are an integral part of these consolidated financial statements.
FINANCIAL STATEMENTS
6 VEOLIA ENVIRONNEMENT / CONSOLIDATED FINANCIAL STATEMENTS - DECEMBER 31, 2017
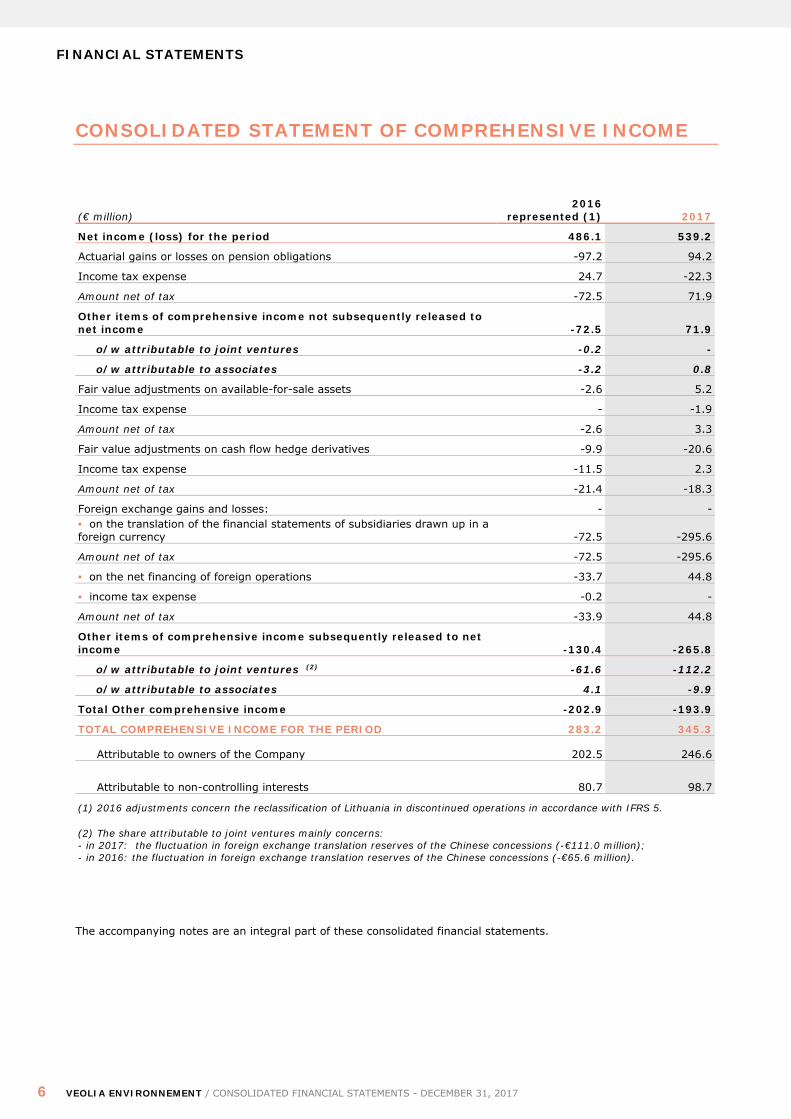
CONSOLIDATED STATEMENT OF COMPREHENSIVE INCOME
(€ million) 2016
represented (1) 2017
Net income (loss) for the period 486.1 539.2
Actuarial gains or losses on pension obligations -97.2 94.2
Income tax expense 24.7 -22.3
Amount net of tax -72.5 71.9
Other items of comprehensive income not subsequently released to net income -72.5 71.9
o/w attributable to joint ventures -0.2 -
o/w attributable to associates -3.2 0.8
Fair value adjustments on available-for-sale assets -2.6 5.2
Income tax expense - -1.9
Amount net of tax -2.6 3.3
Fair value adjustments on cash flow hedge derivatives -9.9 -20.6
Income tax expense -11.5 2.3
Amount net of tax -21.4 -18.3
Foreign exchange gains and losses: - - • on the translation of the financial statements of subsidiaries drawn up in a foreign currency -72.5 -295.6
Amount net of tax -72.5 -295.6
• on the net financing of foreign operations -33.7 44.8
• income tax expense -0.2 -
Amount net of tax -33.9 44.8
Other items of comprehensive income subsequently released to net income -130.4 -265.8
o/w attributable to joint ventures (2) -61.6 -112.2
o/w attributable to associates 4.1 -9.9
Total Other comprehensive income -202.9 -193.9
TOTAL COMPREHENSIVE INCOME FOR THE PERIOD 283.2 345.3
Attributable to owners of the Company 202.5 246.6
Attributable to non-controlling interests 80.7 98.7
(1) 2016 adjustments concern the reclassification of Lithuania in discontinued operations in accordance with IFRS 5.
(2) The share attributable to joint ventures mainly concerns: - in 2017: the fluctuation in foreign exchange translation reserves of the Chinese concessions (-€111.0 million); - in 2016: the fluctuation in foreign exchange translation reserves of the Chinese concessions (-€65.6 million).
The accompanying notes are an integral part of these consolidated financial statements.
FINANCIAL STATEMENTS
CONSOLIDATED FINANCIAL STATEMENTS - DECEMBER 31, 2017 / VEOLIA ENVIRONNEMENT 7
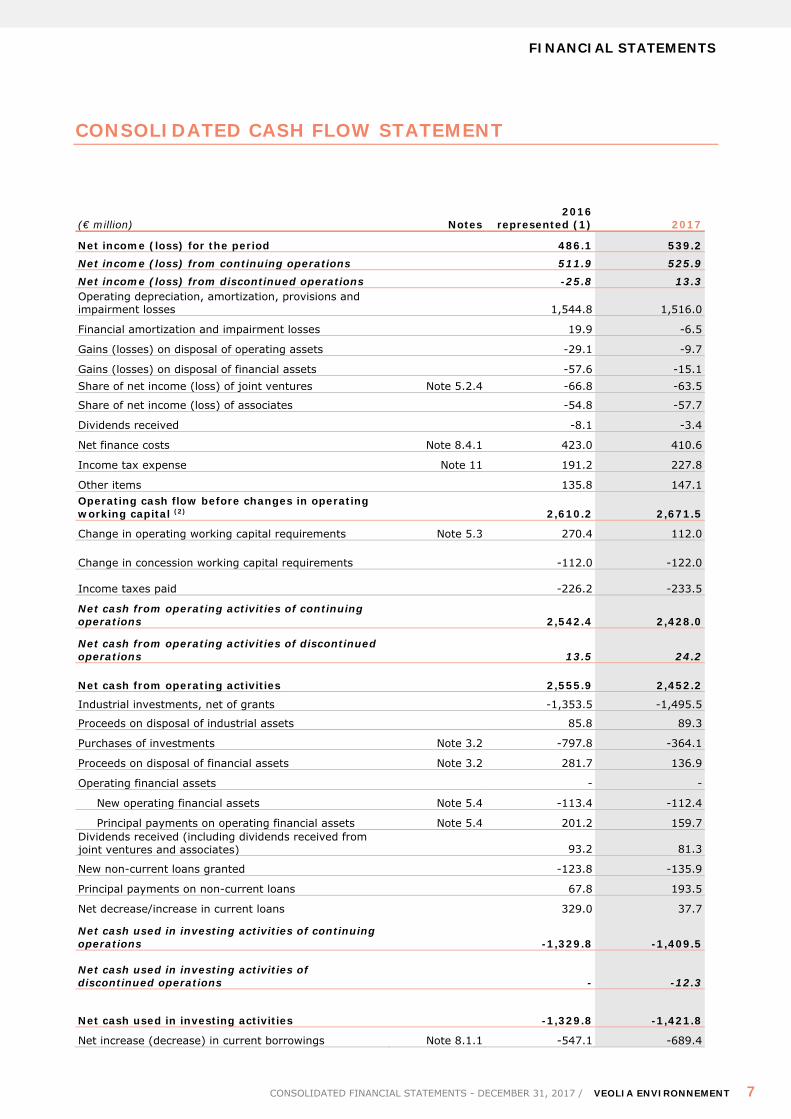
CONSOLIDATED CASH FLOW STATEMENT
(€ million) Notes 2016
represented (1) 2017
Net income (loss) for the period 486.1 539.2 Net income (loss) from continuing operations 511.9 525.9 Net income (loss) from discontinued operations -25.8 13.3 Operating depreciation, amortization, provisions and impairment losses 1,544.8 1,516.0
Financial amortization and impairment losses 19.9 -6.5
Gains (losses) on disposal of operating assets -29.1 -9.7
Gains (losses) on disposal of financial assets -57.6 -15.1 Share of net income (loss) of joint ventures Note 5.2.4 -66.8 -63.5
Share of net income (loss) of associates -54.8 -57.7
Dividends received -8.1 -3.4
Net finance costs Note 8.4.1 423.0 410.6
Income tax expense Note 11 191.2 227.8
Other items 135.8 147.1 Operating cash flow before changes in operating working capital (2) 2,610.2 2,671.5
Change in operating working capital requirements Note 5.3 270.4 112.0
Change in concession working capital requirements -112.0 -122.0
Income taxes paid -226.2 -233.5
Net cash from operating activities of continuing operations 2,542.4 2,428.0
Net cash from operating activities of discontinued operations 13.5 24.2
Net cash from operating activities 2,555.9 2,452.2
Industrial investments, net of grants -1,353.5 -1,495.5
Proceeds on disposal of industrial assets 85.8 89.3
Purchases of investments Note 3.2 -797.8 -364.1
Proceeds on disposal of financial assets Note 3.2 281.7 136.9
Operating financial assets - -
New operating financial assets Note 5.4 -113.4 -112.4
Principal payments on operating financial assets Note 5.4 201.2 159.7 Dividends received (including dividends received from joint ventures and associates) 93.2 81.3
New non-current loans granted -123.8 -135.9
Principal payments on non-current loans 67.8 193.5
Net decrease/increase in current loans 329.0 37.7
Net cash used in investing activities of continuing operations -1,329.8 -1,409.5
Net cash used in investing activities of discontinued operations - -12.3
Net cash used in investing activities -1,329.8 -1,421.8
Net increase (decrease) in current borrowings Note 8.1.1 -547.1 -689.4

FINANCIAL STATEMENTS
8 VEOLIA ENVIRONNEMENT / CONSOLIDATED FINANCIAL STATEMENTS - DECEMBER 31, 2017
(€ million) Notes 2016
represented (1) 2017
New non-current borrowings and other debts Note 8.1.1 2,049.9 1,886.0 Principal payments on non-current borrowings and other debts Note 8.1.1 -176.2 -109.2
Change in liquid assets and financing financial assets Note 8.1.2 -9.0 -163.3
Proceeds on issue of shares Note 9.2 14.5 15.3
Share capital reduction - -
Transactions with non-controlling interests: partial purchases -5.3 -6.7
Transactions with non-controlling interests: partial sales 0.4 1.5
Proceeds on issue of deeply subordinated securities - -
Coupons on deeply subordinated securities Note 9.4.1 -68.8 -67.8
Purchases of/proceeds from treasury shares Note 9.2 -22.0 23.9
Dividends paid Note 9.2 -521.7 -580.5
Interest paid Note 8.4.1 -430.5 -439.0
Interest on operating assets - IFRIC 12 -90.3 -94.3
Net cash from (used in) financing activities of continuing operations 193.9 -223.5
Net cash from financing activities of discontinued operations -0.6 -0.3
Net cash from (used in) financing activities 193.3 -223.8
Effect of foreign exchange rate changes and other -2.5 -25.1 Increase (decrease) in external net cash of discontinued operations - -1.1
Net cash at the beginning of the year 3,857.7 5,274.6
Net cash at the end of the year 5,274.6 6,055.0
Cash and cash equivalents Note 8.1.3 5,521.4 6,263.9
Bank overdrafts and other cash position items Note 8.1.3 246.8 208.9
Net cash at the end of the year 5,274.6 6,055.0
(1) 2016 adjustments concern the reclassification of Lithuania in discontinued operations in accordance with IFRS 5.
The accompanying notes are an integral part of these consolidated financial statements.
FINANCIAL STATEMENTS
CONSOLIDATED FINANCIAL STATEMENTS - DECEMBER 31, 2017 / VEOLIA ENVIRONNEMENT 9
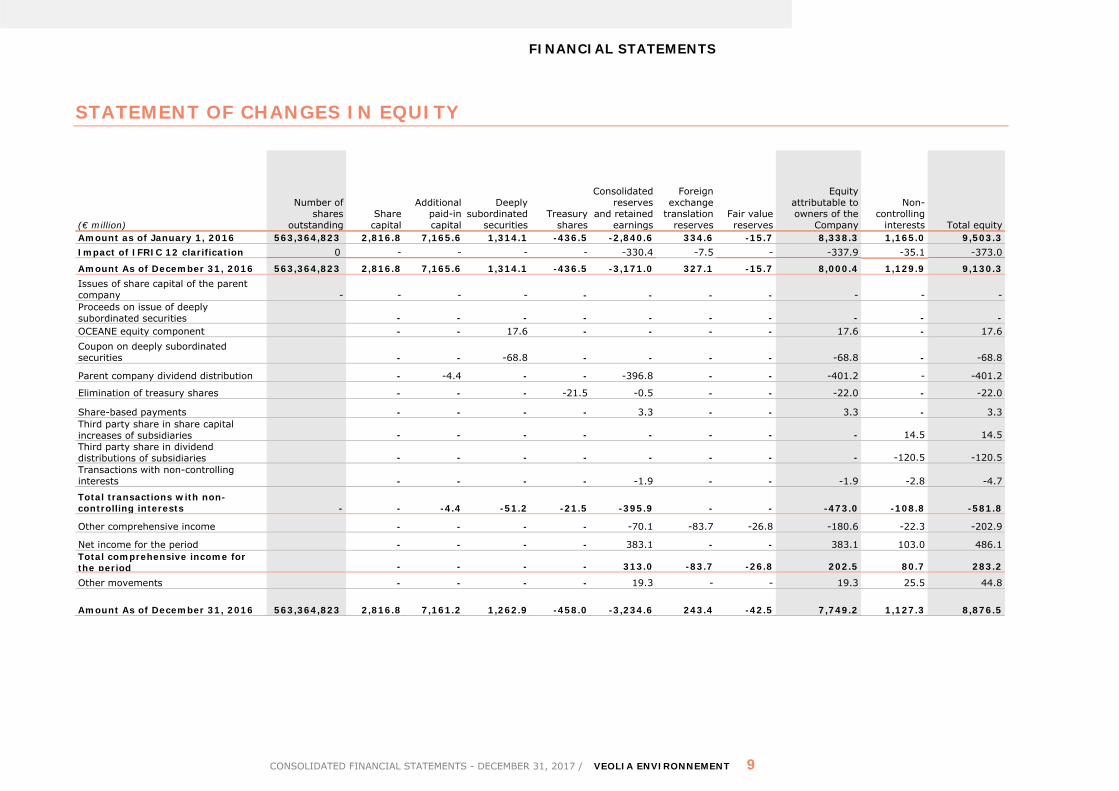
STATEMENT OF CHANGES IN EQUITY
(€ million)
Number of shares
outstanding Share capital
Additional paid-in capital
Deeply subordinated
securities Treasury
shares
Consolidated reserves
and retained earnings
Foreign exchange
translation reserves
Fair value reserves
Equity attributable to owners of the
Company
Non-controlling
interests Total equity Amount as of January 1, 2016 563,364,823 2,816.8 7,165.6 1,314.1 -436.5 -2,840.6 334.6 -15.7 8,338.3 1,165.0 9,503.3 Impact of IFRIC 12 clarification 0 - - - - -330.4 -7.5 - -337.9 -35.1 -373.0
Amount As of December 31, 2016 563,364,823 2,816.8 7,165.6 1,314.1 -436.5 -3,171.0 327.1 -15.7 8,000.4 1,129.9 9,130.3 Issues of share capital of the parent company - - - - - - - - - - - Proceeds on issue of deeply subordinated securities - - - - - - - - - - OCEANE equity component - - 17.6 - - - - 17.6 - 17.6 Coupon on deeply subordinated securities - - -68.8 - - - - -68.8 - -68.8
Parent company dividend distribution - -4.4 - - -396.8 - - -401.2 - -401.2
Elimination of treasury shares - - - -21.5 -0.5 - - -22.0 - -22.0
Share-based payments - - - - 3.3 - - 3.3 - 3.3 Third party share in share capital increases of subsidiaries - - - - - - - - 14.5 14.5 Third party share in dividend distributions of subsidiaries - - - - - - - - -120.5 -120.5 Transactions with non-controlling interests - - - - -1.9 - - -1.9 -2.8 -4.7
Total transactions with non-controlling interests - - -4.4 -51.2 -21.5 -395.9 - - -473.0 -108.8 -581.8
Other comprehensive income - - - - -70.1 -83.7 -26.8 -180.6 -22.3 -202.9
Net income for the period - - - - 383.1 - - 383.1 103.0 486.1 Total comprehensive income for the period - - - - 313.0 -83.7 -26.8 202.5 80.7 283.2
Other movements - - - - 19.3 - - 19.3 25.5 44.8
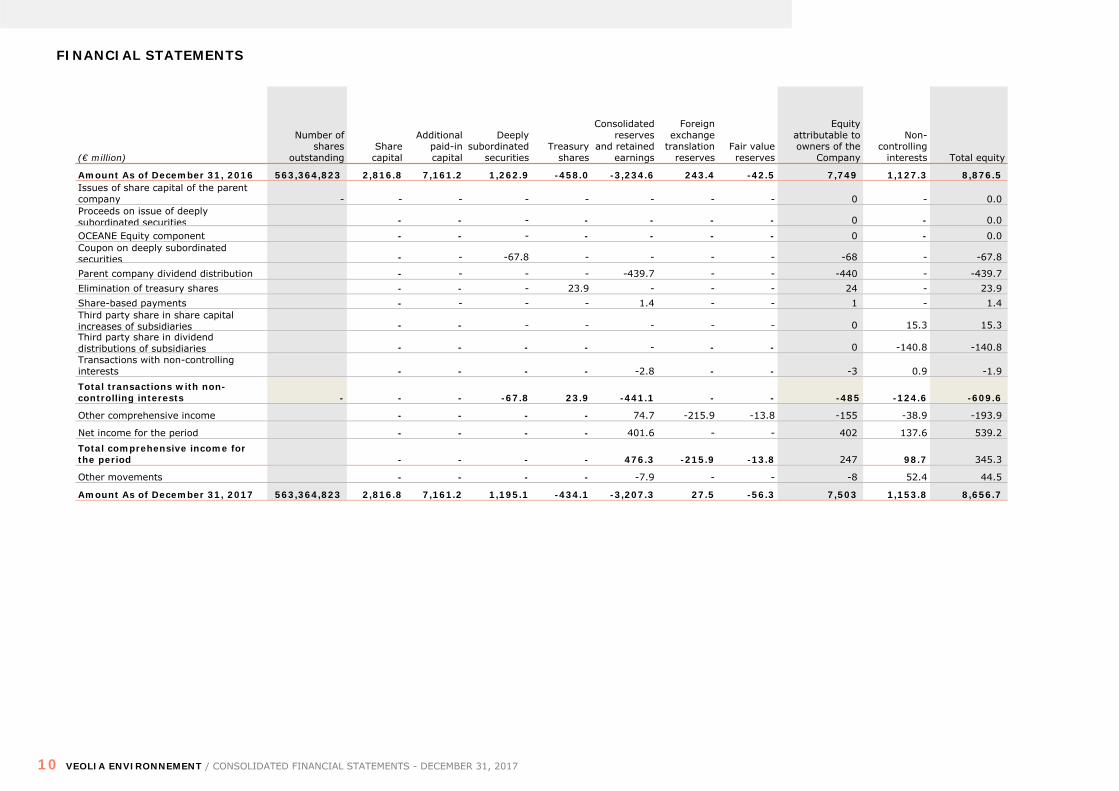
Amount As of December 31, 2016 563,364,823 2,816.8 7,161.2 1,262.9 -458.0 -3,234.6 243.4 -42.5 7,749.2 1,127.3 8,876.5
FINANCIAL STATEMENTS
10 VEOLIA ENVIRONNEMENT / CONSOLIDATED FINANCIAL STATEMENTS - DECEMBER 31, 2017
(€ million)
Number of shares
outstanding Share capital
Additional paid-in capital
Deeply subordinated
securities Treasury
shares
Consolidated reserves
and retained earnings
Foreign exchange
translation reserves
Fair value reserves
Equity attributable to owners of the
Company
Non-controlling
interests Total equity
Amount As of December 31, 2016 563,364,823 2,816.8 7,161.2 1,262.9 -458.0 -3,234.6 243.4 -42.5 7,749 1,127.3 8,876.5 Issues of share capital of the parent company - - - - - - - - 0 - 0.0 Proceeds on issue of deeply subordinated securities - - - - - - - 0 - 0.0 OCEANE Equity component - - - - - - - 0 - 0.0 Coupon on deeply subordinated securities - - -67.8 - - - - -68 - -67.8
Parent company dividend distribution - - - - -439.7 - - -440 - -439.7 Elimination of treasury shares - - - 23.9 - - - 24 - 23.9 Share-based payments - - - - 1.4 - - 1 - 1.4 Third party share in share capital increases of subsidiaries - - - - - - - 0 15.3 15.3 Third party share in dividend distributions of subsidiaries - - - - - - - 0 -140.8 -140.8 Transactions with non-controlling interests - - - - -2.8 - - -3 0.9 -1.9 Total transactions with non-controlling interests - - - -67.8 23.9 -441.1 - - -485 -124.6 -609.6
Other comprehensive income - - - - 74.7 -215.9 -13.8 -155 -38.9 -193.9
Net income for the period - - - - 401.6 - - 402 137.6 539.2 Total comprehensive income for the period - - - - 476.3 -215.9 -13.8 247 98.7 345.3
Other movements - - - - -7.9 - - -8 52.4 44.5
Amount As of December 31, 2017 563,364,823 2,816.8 7,161.2 1,195.1 -434.1 -3,207.3 27.5 -56.3 7,503 1,153.8 8,656.7
FINANCIAL STATEMENTS
CONSOLIDATED FINANCIAL STATEMENTS - DECEMBER 31, 2017 / VEOLIA ENVIRONNEMENT 11
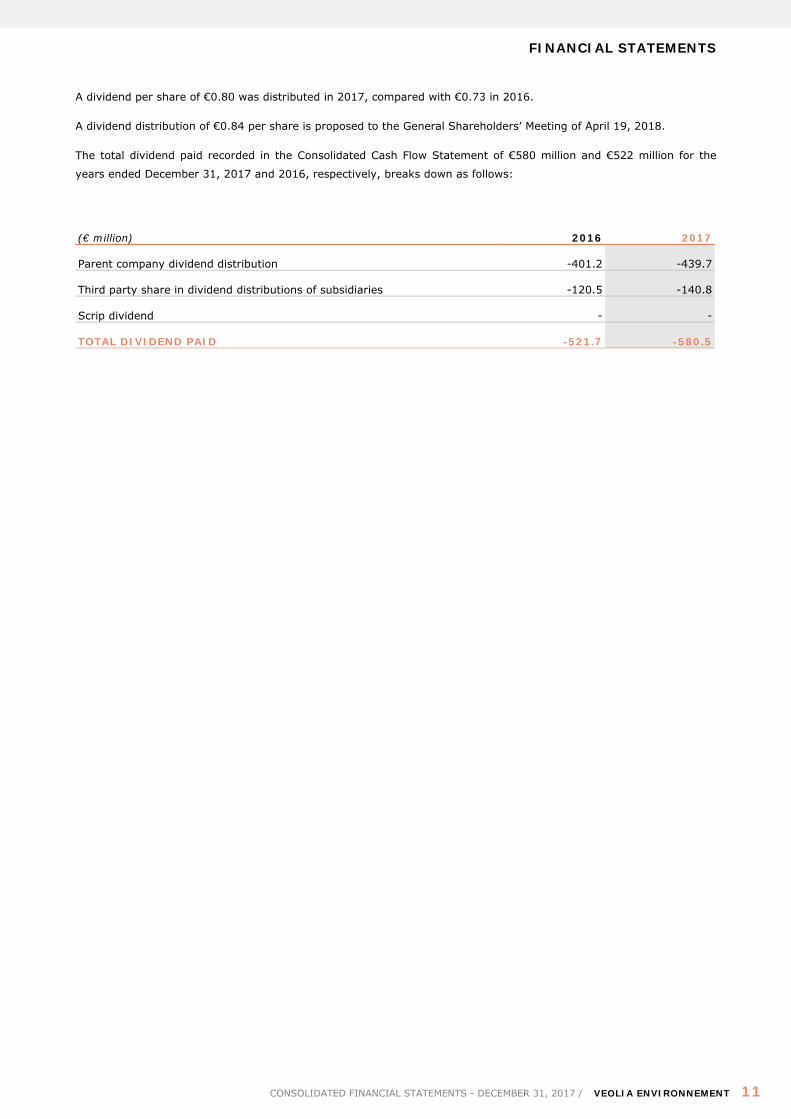
A dividend per share of €0.80 was distributed in 2017, compared with €0.73 in 2016.
A dividend distribution of €0.84 per share is proposed to the General Shareholders’ Meeting of April 19, 2018.
The total dividend paid recorded in the Consolidated Cash Flow Statement of €580 million and €522 million for the
years ended December 31, 2017 and 2016, respectively, breaks down as follows:
(€ million) 2016 2017
Parent company dividend distribution -401.2 -439.7
Third party share in dividend distributions of subsidiaries -120.5 -140.8
Scrip dividend - -
TOTAL DIVIDEND PAID -521.7 -580.5
FINANCIAL STATEMENTS
12 VEOLIA ENVIRONNEMENT / CONSOLIDATED FINANCIAL STATEMENTS - DECEMBER 31, 2017
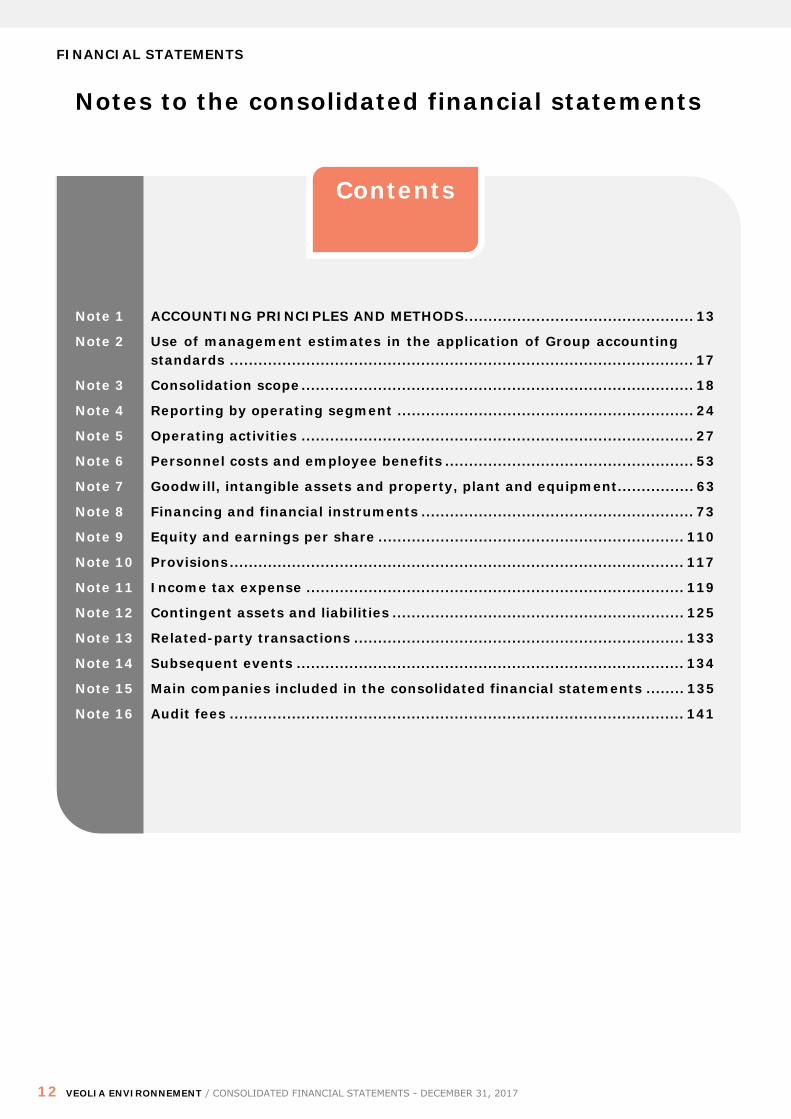
Notes to the consolidated financial statements
Contents
Note 1 ACCOUNTING PRINCIPLES AND METHODS ................................................ 13
Note 2 Use of management estimates in the application of Group accounting standards ................................................................................................. 17
Note 3 Consolidation scope .................................................................................. 18
Note 4 Reporting by operating segment .............................................................. 24
Note 5 Operating activities .................................................................................. 27
Note 6 Personnel costs and employee benefits .................................................... 53
Note 7 Goodwill, intangible assets and property, plant and equipment ................ 63
Note 8 Financing and financial instruments ......................................................... 73
Note 9 Equity and earnings per share ................................................................ 110
Note 10 Provisions ............................................................................................... 117
Note 11 Income tax expense ............................................................................... 119
Note 12 Contingent assets and liabilities ............................................................. 125
Note 13 Related-party transactions ..................................................................... 133
Note 14 Subsequent events ................................................................................. 134
Note 15 Main companies included in the consolidated financial statements ........ 135
Note 16 Audit fees ............................................................................................... 141
FINANCIAL STATEMENTS
CONSOLIDATED FINANCIAL STATEMENTS - DECEMBER 31, 2017 / VEOLIA ENVIRONNEMENT 13
NOTE 1 ACCOUNTING PRINCIPLES AND METHODS
1.1 General principles underlying the preparation of the financial statements
The accounting methods presented in these notes to the consolidated financial statements have been applied
consistently for all periods presented in the consolidated financial statements.
The consolidated financial statements are presented on a historical cost basis, with the exception of assets and
liabilities held for sale measured in accordance with IFRS 5 and assets and liabilities recognized at fair value:
derivatives, financial instruments held for trading, financial instruments designated at fair value and available-for-sale
financial instruments (in accordance with IAS 32 and IAS 39).
The Veolia Environnement consolidated financial statements for the year ended December 31, 2017 were adopted by
the Board of Directors on February 21, 2018 and will be presented for approval at the General Shareholders’ Meeting
on April 19, 2018.
1.2 Accounting standards framework
1.2.1 Basis underlying the preparation of the financial information
Pursuant to Regulation no.1606/2002 of July 19, 2002, as amended by European Regulation no.297/2008 of March 11,
2008, the consolidated financial statements are presented in accordance with IFRS (International Financial Reporting
Standards) as adopted by the European Union. These standards may be consulted at the following European Union
website: http://ec.europa.eu/internal_market/accounting/ias/index_en.htm.
In the absence of IFRS standards or interpretations and in accordance with IAS 8, Accounting Policies, Changes in
Accounting Estimates and Errors, Veolia refers to other IFRS dealing with similar or related issues and the conceptual
framework.
The consolidated financial statements are presented in millions of euros, unless stated otherwise.
The consolidated financial statements comprise the financial statements of Veolia Environnement, the entities it
controls (its subsidiaries) and the entities equity accounted. The financial statements of subsidiaries are drawn up for
the same reference period as those of the parent company, from January 1, to December 31, 2017, in accordance with
uniform accounting policies and methods.
ACCOUNTING PRINCIPLES AND METHODS
14 VEOLIA ENVIRONNEMENT / CONSOLIDATED FINANCIAL STATEMENTS - DECEMBER 31, 2017
Note 1
1.2.2 Standards, standard amendments and interpretations applicable from fiscal year 2017
The accounting principles and valuation rules applied by the Group in preparing the consolidated financial statements
for the year ended December 31, 2017 are identical to those applied by the Group as of December 31, 2016 with the
exception of:
the amendment to IAS 7, Statement of Cash Flows, pursuant to the disclosure initiative;
the amendment to IAS 12, Income taxes, recognition of deferred tax assets for unrealized losses.
The impact of the first-time application of these texts is not material for the Group.
1.2.3 Texts which enter into mandatory effect after December 31, 2017 and not adopted early by the Group:
IFRS 15, Revenue from Contracts with Customers:
On May 28, 2014, the IASB published IFRS 15, Revenue from Contracts with Customers. IFRS 15 introduces a new
revenue recognition model for customer contracts. This standard will replace IAS 11, IAS 18 and the related IFRIC and
SIC interpretations on revenue recognition. It is applicable to fiscal years beginning on or after January 1, 2018.
The Group has therefore performed an inventory and analysis of the differences introduced by the new standard. An
assessment was initially prepared, based on identified differences compared with the current standard and taking
account of existing contractual models in the Group's various businesses.
This assessment was validated by a review of major contracts and/or contacts representative of the Group's activities.
Work performed during this phase identified the main issues likely to create differences with the Group’s accounting
policies: obligations to maintain or renew installations, construction activities, variable remuneration and the Agent -
Principal analysis.
The quantified impacts assessed during this phase for each of the potential sources of difference did not identify a
material impact at the date of first-time application of the standard, due to the terms and conditions of the Group
current contracts:
Principal-Agent analysis: the nature of the Group’s businesses raises few questions in this regard. The rare
instances identified concern the purchase and distribution of energy and are not material at the transition date;
Construction business: the Group’s construction activities are recognized on a completion basis which complies
with IFRS 15 requirements;
Maintenance services: the Group’s current contracts contain few separate performance obligations for
maintenance services; While analyses performed did not identify a material impact at the transition date, this
issue will be closely monitored going forward;
Variable remuneration: Group contracts contain a variety of mechanisms that vary the amount of remuneration.
Analyses performed did not identify any material differences compared with current treatment at the transition
date. This issue will, however, be closely monitored going forward.
The Group’s accounting policies must, nonetheless, be updated to take account of the revenue recognition principles
introduced by IFRS 15 and training sessions will be provided to ensure the communication and proper understanding
of any changes
ACCOUNTING PRINCIPLES AND METHODS
CONSOLIDATED FINANCIAL STATEMENTS - DECEMBER 31, 2017 / VEOLIA ENVIRONNEMENT 15
Note 1
The Group continues to closely monitor the application issues still under discussion.
IFRS 9, Financial Instruments:
This new standard on financial instruments will be effective in the Group from January 1, 2018. The Group has
launched an inventory and analysis of the differences resulting from the provisions of this new standard.
These procedures primarily identified two differences concerning the impairment methodology for trade receivables
and the recognition of debt swaps. Work to quantify these differences is currently being finalized and the expected
impacts are not material.
IFRS 16, Leases:
IFRS 17, Insurance contracts;
Amendment to IFRS 2 on the classification and measurement of certain share based payment transactions;
Amendments resulting from the IFRS annual improvement process (2014-2016 cycle);
IFRIC 22, Foreign Currency Transactions and Advance Consideration;
IFRIC 23, Uncertainty over Income Tax Treatments;
Amendment to IFRS 9, Financial Instruments, regarding prepayment features with negative compensation;
Amendment to IAS 28 regarding long-term interests in associates and joint ventures;
Amendments resulting from the IFRS annual improvement process (2015-2017 cycle).
Subject to their definitive adoption by the European Union, these standards and standard amendments are of
mandatory application for fiscal years beginning on or after January 1, 2018. The Group is currently assessing the
potential impact of the first-time application of these texts.
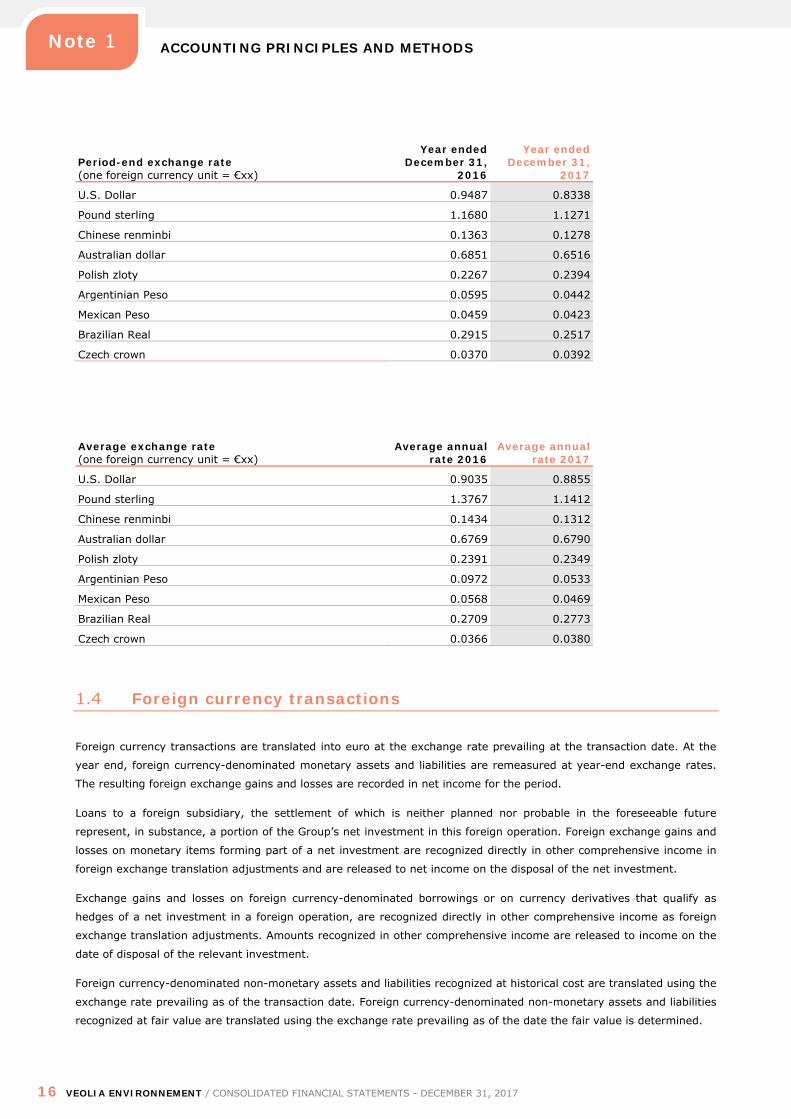
1.3 Translation of foreign subsidiaries’ financial statements
Statements of financial position, income statements and cash flow statements of subsidiaries whose functional
currency is different from the presentation currency of the Group are translated into the presentation currency at the
applicable rate of exchange (i.e. the year-end rate for statement of financial position items and the average annual
rate for income statement and cash flow items). Foreign exchange translation gains and losses are recorded in other
comprehensive income in equity. The exchange rates of the major currencies of non-euro countries used in the
preparation of the consolidated financial statements were as follows:
ACCOUNTING PRINCIPLES AND METHODS
16 VEOLIA ENVIRONNEMENT / CONSOLIDATED FINANCIAL STATEMENTS - DECEMBER 31, 2017
Note 1
Period-end exchange rate (one foreign currency unit = €xx)
Year ended December 31,
2016
Year ended December 31,
2017
U.S. Dollar 0.9487 0.8338
Pound sterling 1.1680 1.1271
Chinese renminbi 0.1363 0.1278
Australian dollar 0.6851 0.6516
Polish zloty 0.2267 0.2394
Argentinian Peso 0.0595 0.0442
Mexican Peso 0.0459 0.0423
Brazilian Real 0.2915 0.2517
Czech crown 0.0370 0.0392
Average exchange rate (one foreign currency unit = €xx)
Average annual rate 2016
Average annual rate 2017
U.S. Dollar 0.9035 0.8855
Pound sterling 1.3767 1.1412
Chinese renminbi 0.1434 0.1312
Australian dollar 0.6769 0.6790
Polish zloty 0.2391 0.2349
Argentinian Peso 0.0972 0.0533
Mexican Peso 0.0568 0.0469
Brazilian Real 0.2709 0.2773
Czech crown 0.0366 0.0380
1.4 Foreign currency transactions
Foreign currency transactions are translated into euro at the exchange rate prevailing at the transaction date. At the
year end, foreign currency-denominated monetary assets and liabilities are remeasured at year-end exchange rates.
The resulting foreign exchange gains and losses are recorded in net income for the period.
Loans to a foreign subsidiary, the settlement of which is neither planned nor probable in the foreseeable future
represent, in substance, a portion of the Group’s net investment in this foreign operation. Foreign exchange gains and
losses on monetary items forming part of a net investment are recognized directly in other comprehensive income in
foreign exchange translation adjustments and are released to net income on the disposal of the net investment.
Exchange gains and losses on foreign currency-denominated borrowings or on currency derivatives that qualify as
hedges of a net investment in a foreign operation, are recognized directly in other comprehensive income as foreign
exchange translation adjustments. Amounts recognized in other comprehensive income are released to income on the
date of disposal of the relevant investment.
Foreign currency-denominated non-monetary assets and liabilities recognized at historical cost are translated using the
exchange rate prevailing as of the transaction date. Foreign currency-denominated non-monetary assets and liabilities
recognized at fair value are translated using the exchange rate prevailing as of the date the fair value is determined.
USE OF MANAGEMENT ESTIMATES IN THE APPLICATION OF GROUP ACCOUNTING STANDARDS
CONSOLIDATED FINANCIAL STATEMENTS - DECEMBER 31, 2017 / VEOLIA ENVIRONNEMENT 17
Note 2
NOTE 2 USE OF MANAGEMENT ESTIMATES IN THE APPLICATION OF GROUP ACCOUNTING STANDARDS
Veolia may be required to make estimates and assumptions that affect the reported amounts of assets, liabilities,
revenue and expenses, and the disclosures of contingent assets and liabilities. Future results may be different from
these estimates.
Underlying estimates and assumptions are determined based on past experience and other factors considered as
reasonable given the circumstances. They act as a basis for making judgments necessary to the determination of the
carrying amount of assets and liabilities, which cannot be obtained directly from other sources. Future values could
differ from these estimates.
All these estimates are based on organized procedures for the collection of forecast information on future flows,
validated by operating management, and on expected market data based on external indicators and used in
accordance with consistent and documented methodologies.
Underlying estimates and assumptions are reviewed on an ongoing basis. The impact of changes in accounting
estimates is recognized in the period the change is made if it affects this period only and in the period the change is
made and prior periods if they are also affected by the change. With regards to Brexit and the outcome of the June 23,
2016 referendum, and beyond the macro-economic effects which still remain uncertain, the Group's exposure to
foreign exchange transactional risks appears limited as of December 31, 2017, Group's activities being performed by
subsidiaries operating in their own country and their own currency. Concerning the foreign exchange risk on assets,
the Group has developed a policy which seeks to back foreign-currency financing and foreign currency derivatives
with net foreign investments and ensuring that Group companies do not have a material balance sheet foreign
exchange position that could generate significant volatility in foreign exchange gains and losses.
Estimates made by the Group in preparing the consolidated financial statements primarily concern:
determining the recoverable amount of goodwill, intangible assets and property, plant and equipment: notes 5.2
and 7 presents future flow assumptions and the discount rates used to measure the recoverable amount of these
assets. Sensitivity analyses were also performed and are presented in the aforementioned note;
measuring provisions and the employee benefit obligation as well as contingent assets and liabilities (notes 6, 10
and 12): Veolia took account of the best estimate of these obligations when measuring these provisions;
determining the fair value of financial instruments (Note 8.3) including derivatives; Veolia measured these
derivative instruments and performed the necessary efficiency tests;
the amount of deferred tax assets and liabilities and the tax expense recognized (Note 11.2): these balances
represent the tax position of the Group and are based, primarily in France and in the United States, on best
estimates available to the Group of results of tax audits in progress and trends in future tax results;
methods used for determining identifiable assets acquired and liabilities assumed in business combinations.
In addition, pursuant to the provisions of IFRS 5, Non-Current Assets Held for Sale and Discontinued Operations, the
Group must exercise judgment in determining whether the criteria for recognizing an asset or group of assets as held
for sale are met. Furthermore, discontinued operations are identified with respect to criteria also defined in IFRS 5.
These assessments are reviewed at each period end taking account of any changes in facts or circumstances.
CONSOLIDATION SCOPE
18 VEOLIA ENVIRONNEMENT / CONSOLIDATED FINANCIAL STATEMENTS - DECEMBER 31, 2017
Note 3
Finally, Veolia must make assumptions and judgments when assessing the level of control exercised over certain
investments and particularly when defining relevant activities and identifying substantial rights. These judgments are
reassessed when the facts and circumstances change.
The Group used the following discount rate calculation methodology for the purpose of these estimates:
application of IAS 36, Impairment of assets: in accordance with Group practice, the discount rates used
correspond to the weighted-average cost of capital, calculated annually. A specific risk premium is included in the
calculation of the weighted average cost of capital of entities located in countries outside the euro area and the
following euro area countries: Spain, Italy, Portugal and Slovenia.
application of IAS 37, Provisions, Contingent Liabilities and Contingent Assets: the discount rates used consist of a
risk-free interest rate and a risk premium specific to the underlying assets and liabilities;
application of IAS 19 revised, Employee Benefits: commitments were measured using a range of market indices
and, in particular, the Iboxx index and data provided by actuaries. The same method was used year-on-year.
NOTE 3 CONSOLIDATION SCOPE
3.1 Accounting principles relating to the consolidation scope
3.1.1 Consolidation principles
CONTROLLED ENTITIES
Veolia Environnement fully consolidates all entities over which it exercises control.
Definition of control
Control exists when the Group (i) holds power over an entity, (ii) is exposed or has rights to variable returns from its
involvement with the entity and (iii) has the ability to use its power over the entity to effect the amount of its returns.
The Group reassesses whether or not it controls an entity if facts and circumstances indicate that there are changes to
one or more of the elements of control.
Full consolidation
The Group consolidates a subsidiary in its consolidated financial statements from the date it obtains control of the
entity to the date it ceases to control the entity.
Interests that are not directly or indirectly attributable to the Group are recorded in non-controlling interests.
Net income and each component of other comprehensive income of subsidiaries are attributed to owners of the
Company and to non-controlling interests. Total comprehensive income of subsidiaries is attributed to owners of the
Company and to non-controlling interests, even if this results in non-controlling interests having a deficit balance.
Change in ownership interests in consolidated subsidiaries
CONSOLIDATION SCOPE
CONSOLIDATED FINANCIAL STATEMENTS - DECEMBER 31, 2017 / VEOLIA ENVIRONNEMENT 19
Note 3
Changes in the Group’s ownership interests in subsidiaries that do not result in a change in control over the
subsidiaries are accounted for as equity transactions, as they are transactions performed by shareholders acting in this
capacity.
The effects of these transactions are recognized in equity at their net-of-tax amount and do not therefore impact the
Consolidated Income Statement of the Group.
These transactions are presented in financing activities in the Consolidated Cash Flow Statement.
INVESTMENTS IN JOINT VENTURES AND ASSOCIATES
Definition
An associate is an entity over which the Group has significant influence. Significant influence is the power to
participate in the financial and operating policy decisions of the entity but is not control or joint control of those
policies.
A joint venture is a joint arrangement whereby the parties that have joint control of the entity have rights to its net
assets.
Joint control is the contractually agreed sharing of control of an arrangement, which exists only when decisions about
the relevant activities require the unanimous consent of the parties sharing control.
Accounting for joint ventures and associates
The results and assets and liabilities of associates or joint ventures are incorporated in the Group consolidated financial
statements using the equity method of accounting, except when the investment is classified as held for sale, in which
case it is accounted for in accordance with the provisions of IFRS 5, Non-Current Assets Held for Sale and Discontinued
Operations.
Under the equity method, the investment in the associate or joint venture is initially recognized at acquisition cost and
subsequently adjusted to recognize the Group’s share of the net income and other comprehensive income of the
associate or joint venture.
When a Group entity transacts with an associate or joint venture of the Group, profits and losses resulting from the
transaction with the associate or joint venture are recognized in the Group consolidated financial statements only to
the extent of interests in the associate or joint venture.
The share of net income (loss) of equity-accounted entities is included in the Group Consolidated Income Statement.
Pursuant to recommendation no. 2013-01 issued by the French Accounting Standards Authority (Autorité des Normes
Comptables, ANC) on April 4, 2013, the share of net income (loss) of equity-accounted entities must be included in
“Operating income after share of net income (loss) of equity-accounted entities” or presented in a separate line “Share
of net income (loss) of other equity-accounted entities” depending on whether the activities of such entities represent
an extension of the Group’s businesses.
Impairment tests
The requirements of IAS 39, Financial Instruments: Recognition and Measurement, are applied to determine whether it
is necessary to test an investment in an associate or joint venture for impairment. When necessary, the entire carrying
amount of the investment (including goodwill) is tested for impairment in accordance with IAS 36, Impairment of
Assets.
CONSOLIDATION SCOPE
20 VEOLIA ENVIRONNEMENT / CONSOLIDATED FINANCIAL STATEMENTS - DECEMBER 31, 2017
Note 3
Loss of significant influence or joint control
The equity method is discontinued from the date the investment ceases to be an associate or a joint venture. Where
the Group retains a residual interest in the entity and that interest is a financial asset, the financial asset is measured
at fair value at the date the investment ceases to be an associate or a joint venture.
Where an investment in an associate becomes an investment in a joint venture, or vice versa, the equity method
continues to be applied and the change in ownership interest does not trigger remeasurement to fair value.
INVESTMENTS IN JOINT OPERATIONS
Definition
A joint operation is a joint arrangement whereby the parties that have joint control of the arrangement have direct
rights to the assets, and obligations for the liabilities, relating to the arrangement.
Accounting for joint operations
As a joint operator in a joint operation, the Group recognizes in relation to its interest in the joint operation:
its assets, including its share of any assets held jointly;
its liabilities, including its share of any liabilities incurred jointly;
its revenue from the sale of its share of the output arising from the joint operation;
its expenses, including its share of any expenses incurred jointly.
3.1.2 Transactions impacting the consolidation scope
BUSINESS COMBINATIONS AND GOODWILL
Business combinations are recorded in accordance with the acquisition method as defined in IFRS 3, revised.
Under this method, identifiable assets acquired and liabilities assumed of the acquiree are recorded at fair value at the
acquisition date.
The goodwill arising from the business combination is measured as the excess of the aggregate of the consideration
transferred, the amount of any non-controlling interest and, where applicable, the fair value of any previously held
interest, over the net of the acquisition-date amounts of the identifiable assets acquired and liabilities assumed.
This goodwill is measured in the functional currency of the company acquired and recognized in assets in the
Consolidated Statement of Financial Position.
The Group may elect, on an individual transaction basis, at the acquisition date, to measure non-controlling interests
either at fair value (full goodwill) or at the share in the fair value of the identifiable net assets of the company acquired
(partial goodwill).
Pursuant to IFRS, goodwill is not amortized but is subject to impairment tests performed annually or more frequently
where there is evidence calling into question the net carrying amount recorded in assets in the Statement of Financial
Position.
Where the terms and conditions of a business combination are advantageous, negative goodwill arises. The
corresponding profit is recognized in net income at the acquisition date.
CONSOLIDATION SCOPE
CONSOLIDATED FINANCIAL STATEMENTS - DECEMBER 31, 2017 / VEOLIA ENVIRONNEMENT 21
Note 3
Acquisition-related costs are expensed in the period in which the costs are incurred and the services received.
Pursuant to the provisions of IFRS 3 revised, the Group may finalize the recognition of the business combination
during the measurement period. This period ends when all the necessary information has been obtained and no later
than one year after the acquisition date.
ASSETS/LIABILITIES CLASSIFIED AS HELD FOR SALE, DISCONTINUED OPERATIONS
IFRS 5, Non-Current Assets Held for Sale and Discontinued Operations, sets out the accounting treatment applicable to
assets held for sale and presentation and disclosure requirements for discontinued operations.
The standard notably requires the separate presentation of assets held for sale in the Consolidated Statement of
Financial Position at the lower of net carrying amount and fair value less costs to sell, where the criteria set-out in the
standard are satisfied.
When the Group is committed to a sales process leading to the loss of control of a subsidiary, all assets and liabilities
of that subsidiary are reclassified as held for sale where the standard classification criteria are met, irrespective of
whether the Group retains a residual interest in the entity after sale.
In addition, the standard requires the separate presentation in the Consolidated Income Statement of the results of
discontinued operations for all comparative periods on a retrospective basis.
A discontinued operation is a component of an entity that either has been disposed of or is classified as held for sale
and:
represents a separate major line of business or geographical area of operations;
is part of a single coordinated plan to dispose of a separate major line of business or major geographical area of
operations or;
is a subsidiary acquired exclusively with a view to resale.
3.2 Changes in Group structure
ACQUISITION OF UNIKEN
On February 28, 2017, Veolia completed the acquisition of Uniken, a specialist in industrial and hazardous waste
processing located in the Ulsan region in Korea, for an enterprise value of €66 million.
ACQUISITION OF VAN SCHERPEZEEL GROEP BV
On November 1, 2017, the Group acquired the Van Scherpenzeel group, a Waste specialist in the Netherlands, for an
enterprise value of €56 million.
ACQUISITION OF CORVARA ABD HANS HANDERSSON
The Group strengthened its presence in Sweden with the acquisition of Corvara’s industrial cleaning business
(September 1, 2017) and the recycling specialist, the Hans Andersson Group (August 31, 2017), for an enterprise
value of €42 million and €101 million, respectively.
CONSOLIDATION SCOPE
22 VEOLIA ENVIRONNEMENT / CONSOLIDATED FINANCIAL STATEMENTS - DECEMBER 31, 2017
Note 3
OTHER OPERATIONS
The Group also performed less significant transactions in the period and particularly:
Veolia acquired the Eurologistik group, a specialist in waste collection and recycling and the production of
RDF, operating in Northern and Eastern Germany. The acquisition was completed on September 11, 2017 for
an enterprise value of €40.5 million;
On January 9, 2017, the Group acquired Enovity, a building energy services company based in San Francisco,
for an enterprise value of €26 million.
The Group sold its investment in Affinity Water in the United Kingdom for €40 million;
Energy business assets and asset contracts on the West Coast of the United States were sold for €52 million;
Building energy services assets in Sweden were sold for €56 million, net of sale fees.
OTHER CHANGES
The Vilnius contract was affected by several major events in 2017: Veolia's 15-year contract for the operation of the
Lithuanian capital's heating system ended on March 29, 2017. The city of Vilnius filed a compensation claim with
Veolia Environnement and its subsidiary Vilnius Energija (Vilnius Energy) for damage to assets incurred during the
period of delegated management. The Group fully contests this claim. The city of Vilnius recently announced that this
claim should amount to €200 million. As a result, the municipal company issued a warranty claim for €200 million to
Veolia on March 29, 2017 (Notice of Default) and the Vilnius Municipal Council filed a request for arbitration before the
Stockholm Chamber of Commerce (SCC) on April 25, 2017 for this amount.
It is recalled that in January 2016, the Group filed a request for arbitration against Lithuania before the International
Centre for Settlement of Investment Disputes (ICSID) for unfair treatment and expropriation, based on a
compensation claim of around €100 million. In addition, following a request for arbitration filed with the Stockholm
Chamber of Commerce on November 30, 2016, the Group secured the nomination of an independent expert,
appointed to assess the condition of the assets at the end of the contract.
As of December 31, 2017, the ongoing withdrawal from Lithuania, motivated by the end of a major contract and the
sales process for other activities, led the Group to transfer its Lithuanian activities to discontinued operations in
accordance with IFRS 5.
The Group received €47 million in 2017 in respect of trade receivables, inventories and asset transfers.
For further information, see note 12.
3.3 Off-balance sheet commitments relating to the consolidation scope
3.3.1 Commitments given
Off-balance sheet commitments given break down as follows:
CONSOLIDATION SCOPE
CONSOLIDATED FINANCIAL STATEMENTS - DECEMBER 31, 2017 / VEOLIA ENVIRONNEMENT 23
Note 3
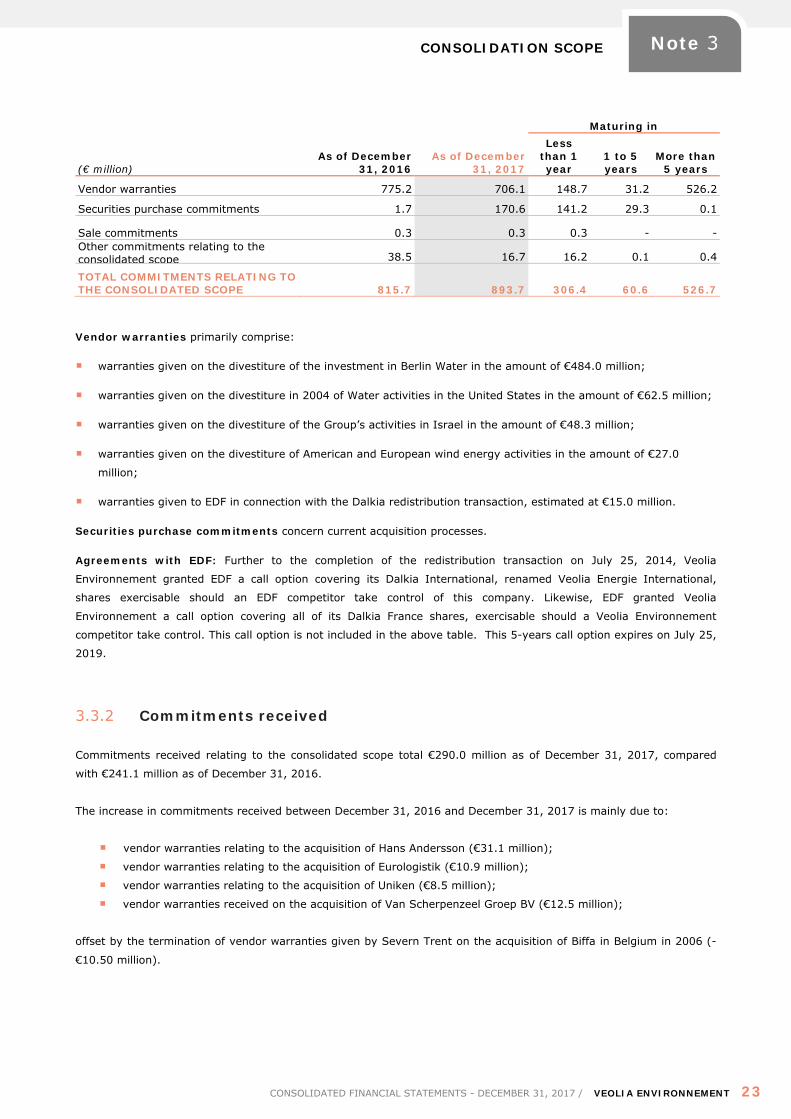
(€ million)
Maturing in
As of December 31, 2016
As of December 31, 2017
Less than 1 year
1 to 5 years
More than 5 years
Vendor warranties 775.2 706.1 148.7 31.2 526.2
Securities purchase commitments 1.7 170.6 141.2 29.3 0.1
Sale commitments 0.3 0.3 0.3 - - Other commitments relating to the consolidated scope 38.5 16.7 16.2 0.1 0.4
TOTAL COMMITMENTS RELATING TO THE CONSOLIDATED SCOPE 815.7 893.7 306.4 60.6 526.7
Vendor warranties primarily comprise:
warranties given on the divestiture of the investment in Berlin Water in the amount of €484.0 million;
warranties given on the divestiture in 2004 of Water activities in the United States in the amount of €62.5 million;
warranties given on the divestiture of the Group’s activities in Israel in the amount of €48.3 million;
warranties given on the divestiture of American and European wind energy activities in the amount of €27.0
million;
warranties given to EDF in connection with the Dalkia redistribution transaction, estimated at €15.0 million.
Securities purchase commitments concern current acquisition processes.
Agreements with EDF: Further to the completion of the redistribution transaction on July 25, 2014, Veolia
Environnement granted EDF a call option covering its Dalkia International, renamed Veolia Energie International,
shares exercisable should an EDF competitor take control of this company. Likewise, EDF granted Veolia
Environnement a call option covering all of its Dalkia France shares, exercisable should a Veolia Environnement
competitor take control. This call option is not included in the above table. This 5-years call option expires on July 25,
2019.
3.3.2 Commitments received
Commitments received relating to the consolidated scope total €290.0 million as of December 31, 2017, compared
with €241.1 million as of December 31, 2016.
The increase in commitments received between December 31, 2016 and December 31, 2017 is mainly due to:
vendor warranties relating to the acquisition of Hans Andersson (€31.1 million);
vendor warranties relating to the acquisition of Eurologistik (€10.9 million);
vendor warranties relating to the acquisition of Uniken (€8.5 million);
vendor warranties received on the acquisition of Van Scherpenzeel Groep BV (€12.5 million);
offset by the termination of vendor warranties given by Severn Trent on the acquisition of Biffa in Belgium in 2006 (-
€10.50 million).
REPORTING BY OPERATING SEGMENT
24 VEOLIA ENVIRONNEMENT / CONSOLIDATED FINANCIAL STATEMENTS - DECEMBER 31, 2017
Note 4
NOTE 4 REPORTING BY OPERATING SEGMENT
The operating segments are components of the Group that engage in activities and whose operating results are
reviewed by the Group Chairman and Chief Executive Officer (Chief Operating Decision Maker) to make decisions
about resources to be allocated to the segment and assess its performance. Information presented to the Chief
Operating Decision Maker is taken from the Group internal reporting system.
Financial information by operating segment is prepared in accordance with the same rules used to prepare the
Consolidated Financial Statements.
In accordance with the provisions of IFRS 8 on the identification of operating segments and after taking account of
regrouping criteria, the following segments are presented :
France ;
Europe excluding France;
Rest of the World;
Global Businesses;
Other, including the various Group holding companies.
The main financial aggregates, in Group share, are also presented for the Chinese Water concessions.
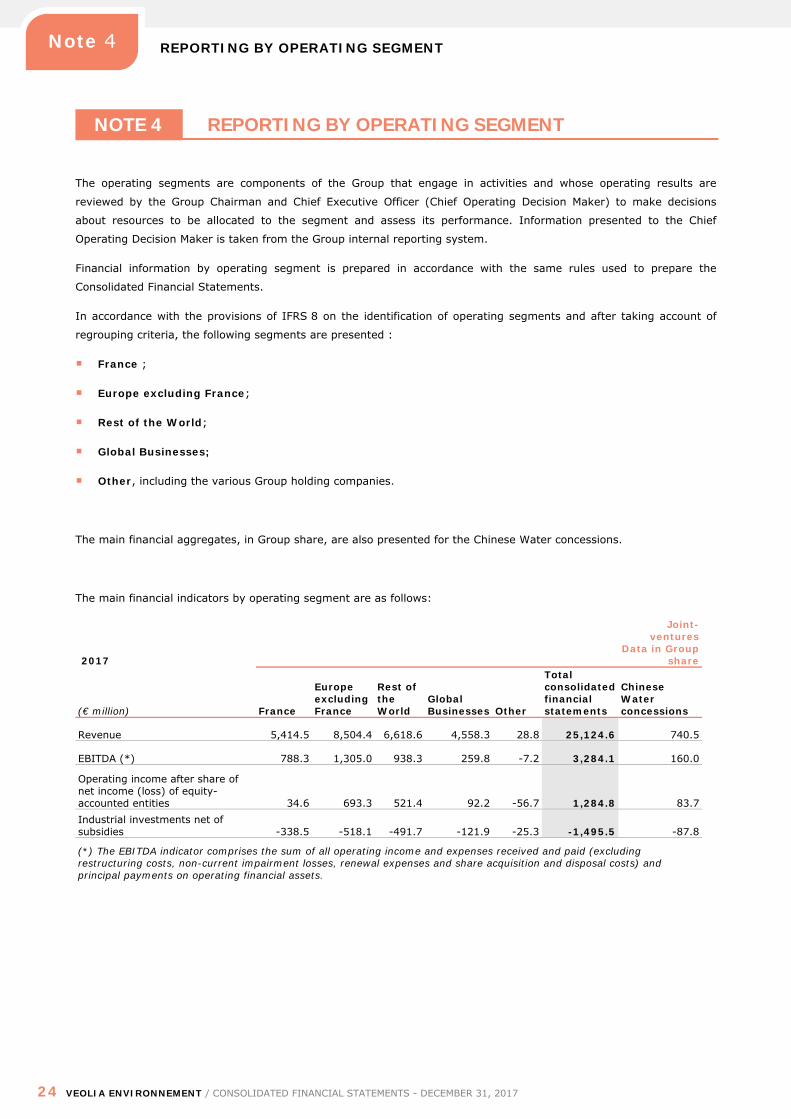
The main financial indicators by operating segment are as follows:
2017
Joint-ventures
Data in Group share
(€ million) France
Europe excluding France
Rest of the World
Global Businesses Other
Total consolidated financial statements
Chinese Water concessions
Revenue 5,414.5 8,504.4 6,618.6 4,558.3 28.8 25,124.6 740.5
EBITDA (*) 788.3 1,305.0 938.3 259.8 -7.2 3,284.1 160.0
Operating income after share of net income (loss) of equity-accounted entities 34.6 693.3 521.4 92.2 -56.7 1,284.8 83.7 Industrial investments net of subsidies -338.5 -518.1 -491.7 -121.9 -25.3 -1,495.5 -87.8
(*) The EBITDA indicator comprises the sum of all operating income and expenses received and paid (excluding restructuring costs, non-current impairment losses, renewal expenses and share acquisition and disposal costs) and principal payments on operating financial assets.
REPORTING BY OPERATING SEGMENT
CONSOLIDATED FINANCIAL STATEMENTS - DECEMBER 31, 2017 / VEOLIA ENVIRONNEMENT 25
Note 4
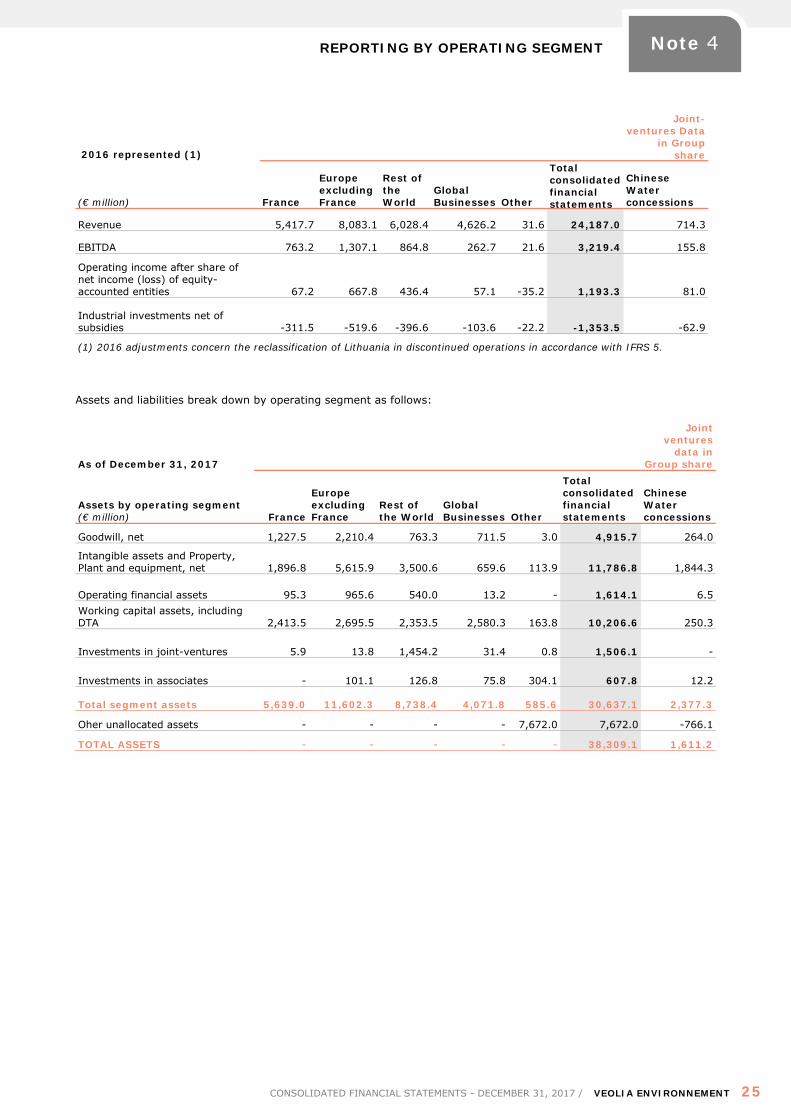
2016 represented (1)
Joint-ventures Data
in Group share
(€ million) France
Europe excluding France
Rest of the World
Global Businesses Other
Total consolidated financial statements
Chinese Water concessions
Revenue 5,417.7 8,083.1 6,028.4 4,626.2 31.6 24,187.0 714.3
EBITDA 763.2 1,307.1 864.8 262.7 21.6 3,219.4 155.8
Operating income after share of net income (loss) of equity-accounted entities 67.2 667.8 436.4 57.1 -35.2 1,193.3 81.0
Industrial investments net of subsidies -311.5 -519.6 -396.6 -103.6 -22.2 -1,353.5 -62.9
(1) 2016 adjustments concern the reclassification of Lithuania in discontinued operations in accordance with IFRS 5.
Assets and liabilities break down by operating segment as follows:
As of December 31, 2017
Joint ventures
data in Group share
Assets by operating segment (€ million) France
Europe excluding France
Rest of the World
Global Businesses Other
Total consolidated financial statements
Chinese Water concessions
Goodwill, net 1,227.5 2,210.4 763.3 711.5 3.0 4,915.7 264.0
Intangible assets and Property, Plant and equipment, net 1,896.8 5,615.9 3,500.6 659.6 113.9 11,786.8 1,844.3
Operating financial assets 95.3 965.6 540.0 13.2 - 1,614.1 6.5 Working capital assets, including DTA 2,413.5 2,695.5 2,353.5 2,580.3 163.8 10,206.6 250.3
Investments in joint-ventures 5.9 13.8 1,454.2 31.4 0.8 1,506.1 -
Investments in associates - 101.1 126.8 75.8 304.1 607.8 12.2
Total segment assets 5,639.0 11,602.3 8,738.4 4,071.8 585.6 30,637.1 2,377.3
Oher unallocated assets - - - - 7,672.0 7,672.0 -766.1
TOTAL ASSETS - - - - - 38,309.1 1,611.2
REPORTING BY OPERATING SEGMENT
26 VEOLIA ENVIRONNEMENT / CONSOLIDATED FINANCIAL STATEMENTS - DECEMBER 31, 2017
Note 4
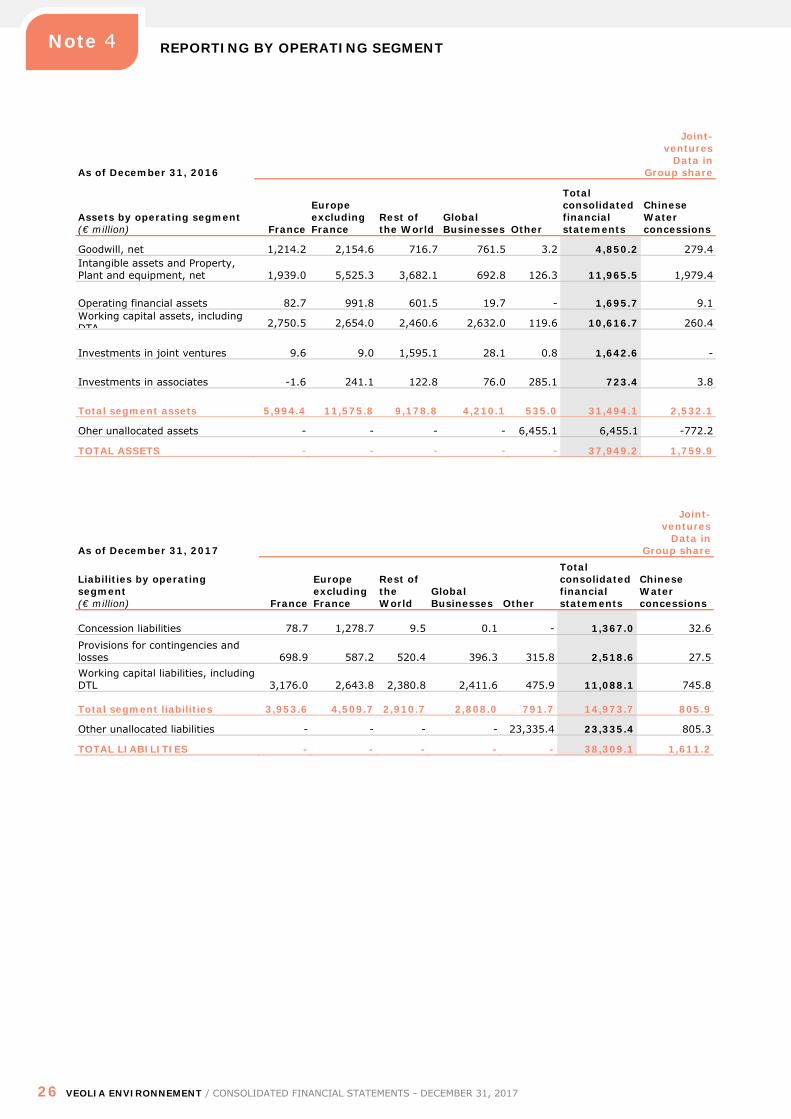
As of December 31, 2016
Joint-ventures
Data in Group share
Assets by operating segment (€ million) France
Europe excluding France
Rest of the World
Global Businesses Other
Total consolidated financial statements
Chinese Water concessions
Goodwill, net 1,214.2 2,154.6 716.7 761.5 3.2 4,850.2 279.4 Intangible assets and Property, Plant and equipment, net 1,939.0 5,525.3 3,682.1 692.8 126.3 11,965.5 1,979.4
Operating financial assets 82.7 991.8 601.5 19.7 - 1,695.7 9.1 Working capital assets, including DTA 2,750.5 2,654.0 2,460.6 2,632.0 119.6 10,616.7 260.4
Investments in joint ventures 9.6 9.0 1,595.1 28.1 0.8 1,642.6 -
Investments in associates -1.6 241.1 122.8 76.0 285.1 723.4 3.8
Total segment assets 5,994.4 11,575.8 9,178.8 4,210.1 535.0 31,494.1 2,532.1
Oher unallocated assets - - - - 6,455.1 6,455.1 -772.2
TOTAL ASSETS - - - - - 37,949.2 1,759.9
As of December 31, 2017
Joint-ventures
Data in Group share
Liabilities by operating segment (€ million) France
Europe excluding France
Rest of the World
Global Businesses Other
Total consolidated financial statements
Chinese Water concessions
Concession liabilities 78.7 1,278.7 9.5 0.1 - 1,367.0 32.6 Provisions for contingencies and losses 698.9 587.2 520.4 396.3 315.8 2,518.6 27.5 Working capital liabilities, including DTL 3,176.0 2,643.8 2,380.8 2,411.6 475.9 11,088.1 745.8
Total segment liabilities 3,953.6 4,509.7 2,910.7 2,808.0 791.7 14,973.7 805.9
Other unallocated liabilities - - - - 23,335.4 23,335.4 805.3
TOTAL LIABILITIES - - - - - 38,309.1 1,611.2
OPERATING ACTIVITIES
CONSOLIDATED FINANCIAL STATEMENTS - DECEMBER 31, 2017 / VEOLIA ENVIRONNEMENT 27
Note 5
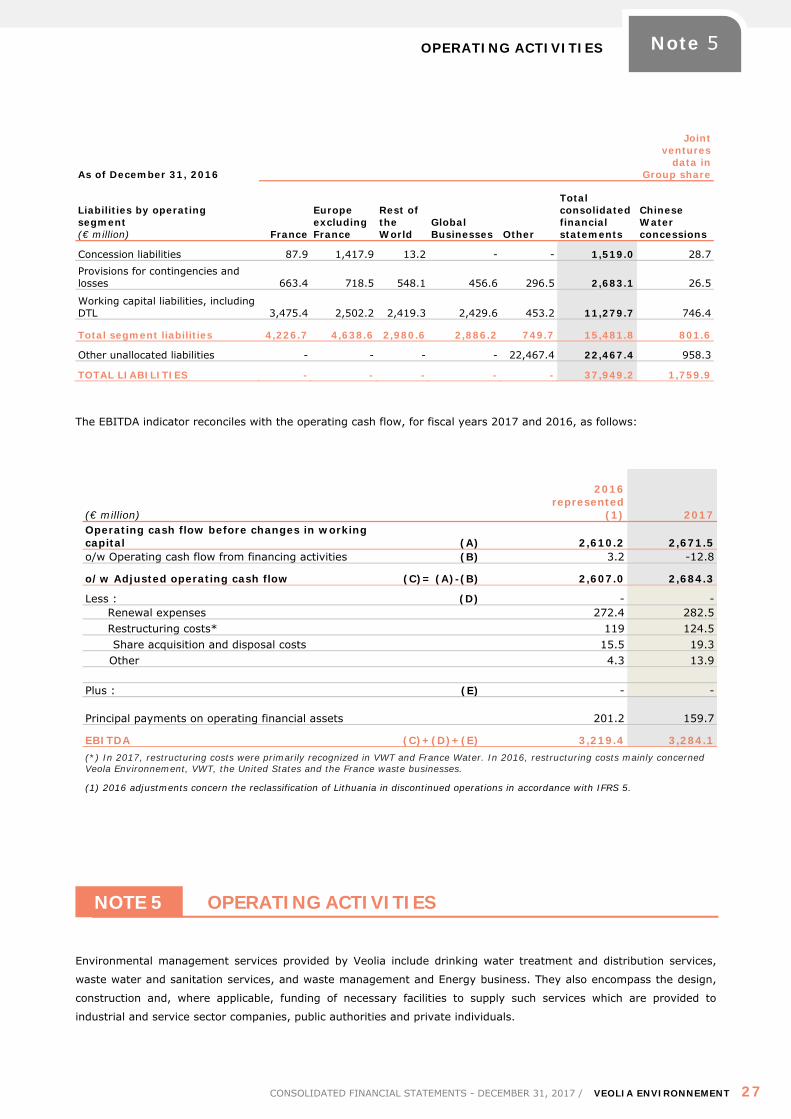
As of December 31, 2016
Joint ventures
data in Group share
Liabilities by operating segment (€ million) France
Europe excluding France
Rest of the World
Global Businesses Other
Total consolidated financial statements
Chinese Water concessions
Concession liabilities 87.9 1,417.9 13.2 - - 1,519.0 28.7 Provisions for contingencies and losses 663.4 718.5 548.1 456.6 296.5 2,683.1 26.5
Working capital liabilities, including DTL 3,475.4 2,502.2 2,419.3 2,429.6 453.2 11,279.7 746.4
Total segment liabilities 4,226.7 4,638.6 2,980.6 2,886.2 749.7 15,481.8 801.6
Other unallocated liabilities - - - - 22,467.4 22,467.4 958.3
TOTAL LIABILITIES - - - - - 37,949.2 1,759.9
The EBITDA indicator reconciles with the operating cash flow, for fiscal years 2017 and 2016, as follows:
(€ million)
2016 represented
(1) 2017 Operating cash flow before changes in working capital (A) 2,610.2 2,671.5 o/w Operating cash flow from financing activities (B) 3.2 -12.8
o/w Adjusted operating cash flow (C)= (A)-(B) 2,607.0 2,684.3
Less : (D) - - Renewal expenses 272.4 282.5 Restructuring costs* 119 124.5
Share acquisition and disposal costs 15.5 19.3 Other 4.3 13.9
Plus : (E) - -
Principal payments on operating financial assets 201.2 159.7
EBITDA (C)+(D)+(E) 3,219.4 3,284.1 (*) In 2017, restructuring costs were primarily recognized in VWT and France Water. In 2016, restructuring costs mainly concerned Veola Environnement, VWT, the United States and the France waste businesses.
(1) 2016 adjustments concern the reclassification of Lithuania in discontinued operations in accordance with IFRS 5.
NOTE 5 OPERATING ACTIVITIES
Environmental management services provided by Veolia include drinking water treatment and distribution services,
waste water and sanitation services, and waste management and Energy business. They also encompass the design,
construction and, where applicable, funding of necessary facilities to supply such services which are provided to
industrial and service sector companies, public authorities and private individuals.
OPERATING ACTIVITIES
28 VEOLIA ENVIRONNEMENT / CONSOLIDATED FINANCIAL STATEMENTS - DECEMBER 31, 2017
Note 5
The range of business models used by the Group results in a variety of contractual forms specific to each business and
adapted to local jurisdiction constraints and the nature and needs of customers (public or private).
The Group primarily conducts its activities under concession, construction (non-concession), lease and operation and
maintenance contracts.
Concession arrangements (IFRIC 12)
In the conduct of activities, Veolia provides collective general interest services (distribution of drinking water and
heating, household waste collection and/or treatment, etc.). These services are generally managed by Veolia under
contracts entered into at the request of public sector bodies, which retain control over these collective services.
Concession arrangements involve the transfer of operating rights for a limited period, under the control of the local
authority, using dedicated facilities built by Veolia, or made available to it for or without consideration:
These contracts define "public service obligations" in return for remuneration. The remuneration is based on
operating conditions, continuity of service, price rules and obligations with respect to the
maintenance/replacement of installations. The contract determines the conditions for the transfer of installations
to the local authority or a successor at its term;
Veolia can, in certain cases, be responsible for a given service as it holds the service support network (water/heat
distribution network, wastewater treatment network). Such situations are the result of full or partial privatizations.
Provisions impose public service obligations and the means by which the local authority may recover control of the
concession holder.
These contracts generally include price review clauses. These clauses are mainly based on cost trends, inflation,
changes in tax and/or other legislation and occasionally on changes in volumes and/or the occurrence of specific
events changing the profitability of the contract.
In addition, the Group generally assumes a contractual obligation to maintain and repair facilities managed under
public service contracts.
The nature and extent of the Group’s rights and obligations under these different contracts differ according to the
public services rendered by the different Group businesses: Water, Waste, Energy.
WATER
Veolia manages municipal drinking water and/or waste water services, which are described in Chapter 1 Section 1.3 of
the Registration Document.
In France, these services are primarily rendered under public service delegation “affermage” contracts with a term of 8
to 20 years. They can use specific assets, such as distribution or wastewater treatment networks and drinking water or
wastewater treatment plants, which are generally provided by the concession grantor and returned to it at the end of
the contract.
Abroad, Veolia renders its services under contracts which reflect local legislation, the economic situation of the country
and the investment needs of each partner. These contracts generally have a term of between 7 and 40 years.
Contracts can also be entered into with public entities in which Veolia purchased an interest on their partial
privatization. The profitability of these contracts is not fundamentally different from other contracts, but operations are
based on a partnership agreement with the local authority.
OPERATING ACTIVITIES
CONSOLIDATED FINANCIAL STATEMENTS - DECEMBER 31, 2017 / VEOLIA ENVIRONNEMENT 29
Note 5
WASTE
Both in France and abroad, the main concession arrangements entered into by Veolia concern the treatment and
recovery of waste in sorting units, landfills and incineration. These contracts have an average term of 10 to 30 years.
ENERGY
Veolia has developed a range of energy management activities: heating and cooling networks, thermal and multi-
technical services, industrial utilities, installation and maintenance of production equipment, and integration services
for the comprehensive management of buildings.
The main contracts concern the management of heating and air-conditioning networks under urban concessions or on
behalf of local authorities.
In Eastern Europe, Veolia provides services under mixed partial privatizations or through public-private partnerships
with local authorities responsible for the production and distribution of thermal energy.
The characteristics of these contracts vary significantly depending on the country and activities concerned.
“Financial asset model”
The Group applies the financial asset model for the accounting recognition of these concession arrangements,
independently of the service or infrastructure use by customers, when the concession grantor contractually guarantees
the payment of amounts specified or determined in the contract or the shortfall, if any, between amounts received
from users of the public service and amounts specified or determined in the contract.
Financial assets resulting from the application of IFRIC 12 are recorded in the Consolidated Statement of Financial
Position under the heading "Operating financial assets" and recognized at amortized cost.
Unless otherwise indicated in the contract, the effective interest rate is equal to the weighted average cost of capital of
the entities carrying the assets concerned.
Cash flows relating to these operating financial assets are included in Net cash from (used in) investing activities in the
Consolidated Cash Flow Statement.
Pursuant to IAS 39, an impairment loss is recognized if the carrying amount of these assets exceeds the present value
of future cash flows discounted at the initial EIR.
Revenue associated with this financial model includes:
revenue recorded on a completion basis, in the case of construction operating financial assets (in accordance with
IAS 11);
the remuneration of the operating financial asset recorded in Revenue from operating financial assets (excluding
principal payments);
service remuneration.
“Intangible asset model”
The intangible asset model applies where the Group is paid by the users or where the concession grantor has not
provided a contractual guarantee in respect of the recoverable amount, regardless of the service or infrastructure use
by customers. The intangible asset corresponds to the right granted by the concession grantor to the operator to
OPERATING ACTIVITIES
30 VEOLIA ENVIRONNEMENT / CONSOLIDATED FINANCIAL STATEMENTS - DECEMBER 31, 2017
Note 5
charge users of the public service in remuneration of concession services provided by the operator under the
concession arrangement.
Intangible assets resulting from the application of IFRIC 12 are recorded in the Consolidated Statement of Financial
Position under the heading "Concession intangible assets”, as described in note 1.2.4, and generally amortized on a
straight-line basis over the term of the agreement.
Cash outflows, that is disbursements, relating to the construction of infrastructures under concession arrangements
accounted using the “intangible asset model” are presented in “Net cash from / (used in) investing activities” in the
Consolidated Cash Flow Statement, while cash inflows are presented in “Net cash from operating activities”.
Under the intangible asset model, Revenue includes:
revenue recorded on a completion basis for assets and infrastructure under construction (in accordance with
IAS 11);
service remuneration.
“Mixed or bifurcation model”
The choice of the financial asset or intangible asset model depends on the existence, or not, of payment guarantees
granted by the concession grantor, independently of the service or infrastructure use by customers.
However, certain contracts may include a payment commitment on the part of the concession grantor covering only
part of the investment, with the remaining balance covered by the remuneration from services charged to users.
Where this is the case, the investment amount guaranteed by the concession grantor is recognized under the financial
asset model and the residual balance is recognized under the intangible asset model.
Recognition of concession arrangements where existing infrastructures are made available to the Group by the concession authority in return for payment of fees
On the signature of certain concession arrangements, the infrastructures necessary to the operation of the concession
already exist and are owned by the delegating authority. In such cases, the infrastructures are generally made
available to the concession holder for the term of the concession arrangement in return for payments to the delegating
authority for the right to use these infrastructures under the concession.
In July 2016, the IFRS Interpretations Committee clarified the appropriate accounting treatment when the concession
holder is required to make fixed payments to the delegating authority for the provision of pre-existing infrastructure.
These fixed payments give rise to:
the recognition of a liability equal to the present value of payments over the term of the concession
arrangement;
the recognition of an intangible asset, where the concession arrangement is recognized using the intangible
asset model, representing the right to charge users of the public service.
Payments satisfying this definition within the Group mainly concern concession arrangements recognized using the
intangible asset model in Central Europe.
OPERATING ACTIVITIES
CONSOLIDATED FINANCIAL STATEMENTS - DECEMBER 31, 2017 / VEOLIA ENVIRONNEMENT 31
Note 5
Regulated activities
Veolia provides drinking water and heating production and distribution services in certain legal jurisdictions where the
public authorities have performed privatizations. Accordingly, Veolia owns the production and/or distribution of assets
but remains subject to pricing regulations imposed by public authorities.
This is particularly the case in Eastern Europe where Veolia exercises this activity under mixed partial privatizations or
public service management agreements between local subsidiaries and public authorities in charge of the production
and distribution of thermal energy.
Revenue from these activities is recognized in accordance with IAS 18.
Construction contracts (IAS 11)
A construction contract is a contract specifically negotiated for the construction of an asset or a combination of assets
(complex sections of installations, equipment) that are closely interrelated or interdependent in terms of their design,
technology and function or their ultimate purpose.
This type of contract is often used for design and build contracts for infrastructure necessary for water
treatment/distribution and wastewater treatment activities.
Veolia recognizes income and expenses associated with construction contracts in accordance with the percentage of
completion method defined in IAS 11.
These contracts are entered into with local authorities or private partners for the construction of infrastructures. They
are generally fixed-price contracts as defined by IAS 11. Revenue generated by construction services rendered by the
Group is measured at the fair value of the consideration received or receivable, where total income and expenses
associated with the construction contract and the stage of completion can be determined reliably.
A breakdown of the recognition of construction contracts is presented in Note 5.6.
Service contracts including an asset lease (IFRIC 4)
These contracts generally concern outsourcing services performed for industrial/private customers either under, BOT
(Build, Operate and Transfer) contracts, or incineration or cogeneration contracts under which, notably, demand or
volume risk is, in substance, transferred to the prime contractor.
Services include the design, construction and financing of the construction of a specific asset/installation on behalf of
the customer and the operation of the asset concerned.
These contracts are recognized in accordance with the principles set out in IFRIC 4.
Accordingly, construction revenue is recognized in accordance with the percentage of completion method and, more
generally, the principles set out in IAS 11.
OPERATING ACTIVITIES
32 VEOLIA ENVIRONNEMENT / CONSOLIDATED FINANCIAL STATEMENTS - DECEMBER 31, 2017
Note 5
The service invoiced to the customer includes a component representing the operation of the specific asset/installation
concerned and a second component representing the financing of the construction.
Revenue relating to the operation of the asset is recognized on delivery of the goods or performance of the
service, in accordance with IAS 18;
The financing of construction work involves finance costs that are invoiced to the customer and recognized in
Revenue, under the heading “Revenue from operating financial assets”. These interests are recognized as Revenue
from the start of construction work and represents remuneration received by the builder/lender.
Operation and maintenance contracts
The services rendered by Veolia do not systematically require the construction or acquisition of new infrastructure and
can be provided through a variety of contractual forms tailored to the objectives and choices of customers. These
services may particularly take the form of contracts for the operation and/or maintenance of installations already
owned by the customer or service contracts aimed at improving the performance of these installations.
Accordingly, Veolia operates waste-to-energy plants, water production and/or distribution installations and heating
networks under this type of contract recognized in accordance with IAS 18.
5.1 Revenue
Revenue represents sales of goods and services measured at the fair value of the consideration received or receivable.
Revenue from the sales of goods or services is recognized when the requisite conditions set out in IAS 18 are satisfied.
Sales of services
The provision of services represents the majority of Group activities such as the processing of waste, water distribution
and related services, network operation and Energy business (heat distribution and thermal services).
Revenue from these activities is recognized when the service is rendered and it is probable that the economic benefits
will flow to Group entities.
These activities involve the performance of a service agreed contractually (nature, price) with a public sector or
industrial customer, within a timeframe. Billing is therefore based on the waste tonnage processed/incinerated, the
volume of water distributed or the thermal power delivered, multiplied by the contractually agreed price.
It should be noted that fees and taxes collected on behalf of local authorities are excluded from Revenue when the
Group does not bear the risk of payment default by third parties.
Buildings
Construction contracts mainly concern the design and construction of the infrastructures necessary for water
treatment and distribution and wastewater treatment activities.
The related revenue is recognized in accordance with IAS 11, “Construction Contracts”. To a lesser extent, the
majority of Group concession agreements also include a construction phase (see above).
OPERATING ACTIVITIES
CONSOLIDATED FINANCIAL STATEMENTS - DECEMBER 31, 2017 / VEOLIA ENVIRONNEMENT 33
Note 5
Sales of goods
Sales of goods mainly concern the sale of technological procedures and solutions relating to the treatment of water
(drinking water and wastewater treatment) in Veolia Water Technologies (VWT) and sales of products related to
recycling activities in the Waste business.
Revenue relating to these sales is recognized on physical delivery of the goods, which represents the transfer of the
inherent risks of ownership of these goods.
As for other Income Statement headings, Revenue does not include amounts relating to discontinued operations in
accordance with IFRS 5, “Non-Current Assets Held for Sale and Discontinued Operations”. The results of these
activities are presented in a separate line, “Net income (loss) from discontinued operations”, for fiscal year 2017 and
fiscal year 2016 presented for comparison purposes (see Note 3.4).
Revenue breaks down as follows:
(€ million) 2016
represented 2017
Sales of services 19,036.2 19,769.5
Construction 3,161.7 3,107.7
Sales of goods 1,842.5 2,114.2
Revenue from operating financial assets 146.6 133.2
REVENUE 24,187.0 25,124.6
Sales of services are primarily generated in Europe excluding France (€7,360.0 million), France (€4,567.0 million) and
the Rest of the World (€6,043.3 million).
Sales of goods are primarily generated in France (€490.0 million), Germany (€525.7 million) and the United Kingdom
(€263.1 million) and by Global Businesses (€377.2 million). The increase in sales of services between 2016 and 2017
is mainly due to entries into the scope of consolidation and particularly: Chemours in the United States for €102,6
million, Hans Andersson in Sweden for €52.3 million and Uniken in Korea for €23.1 million.
A breakdown of revenue by operating segment is presented in Note 4.
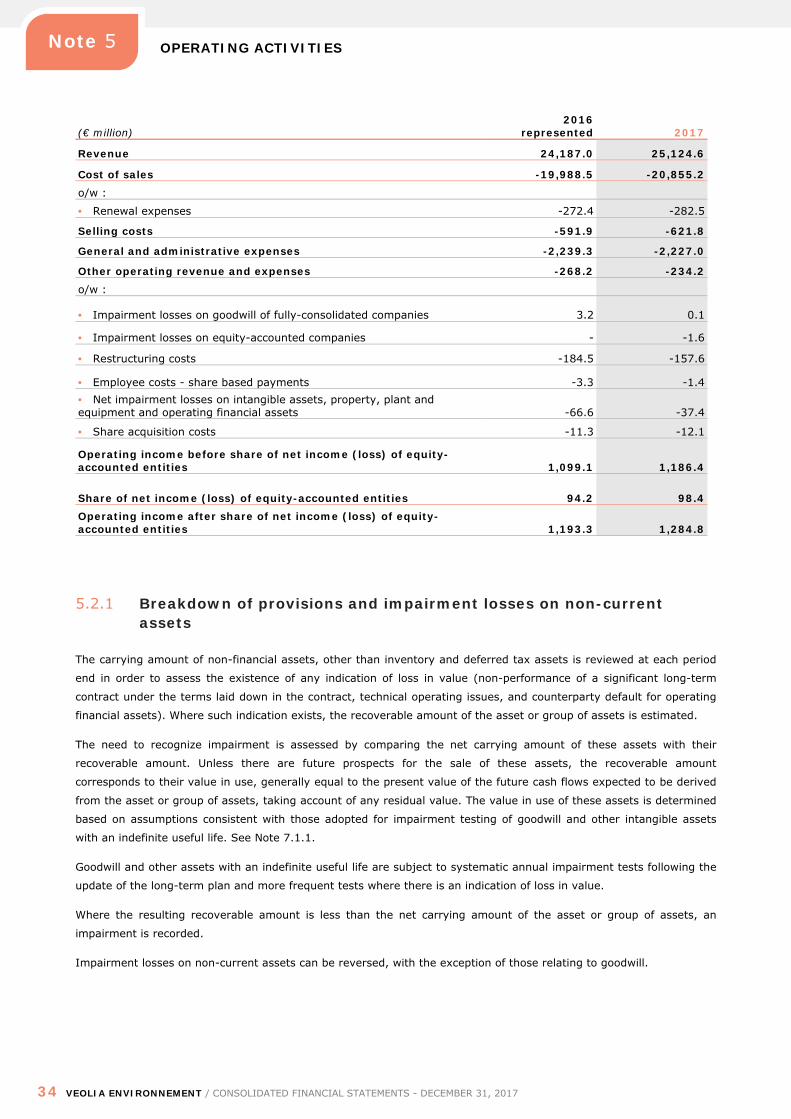
5.2 Operating income
Operating income breaks down as follows:
OPERATING ACTIVITIES
34 VEOLIA ENVIRONNEMENT / CONSOLIDATED FINANCIAL STATEMENTS - DECEMBER 31, 2017
Note 5
(€ million) 2016
represented 2017
Revenue 24,187.0 25,124.6
Cost of sales -19,988.5 -20,855.2
o/w :
• Renewal expenses -272.4 -282.5
Selling costs -591.9 -621.8
General and administrative expenses -2,239.3 -2,227.0
Other operating revenue and expenses -268.2 -234.2 o/w :
• Impairment losses on goodwill of fully-consolidated companies 3.2 0.1
• Impairment losses on equity-accounted companies - -1.6
• Restructuring costs -184.5 -157.6
• Employee costs - share based payments -3.3 -1.4 • Net impairment losses on intangible assets, property, plant and equipment and operating financial assets -66.6 -37.4
• Share acquisition costs -11.3 -12.1
Operating income before share of net income (loss) of equity-accounted entities 1,099.1 1,186.4
Share of net income (loss) of equity-accounted entities 94.2 98.4 Operating income after share of net income (loss) of equity-accounted entities 1,193.3 1,284.8
5.2.1 Breakdown of provisions and impairment losses on non-current assets
The carrying amount of non-financial assets, other than inventory and deferred tax assets is reviewed at each period
end in order to assess the existence of any indication of loss in value (non-performance of a significant long-term
contract under the terms laid down in the contract, technical operating issues, and counterparty default for operating
financial assets). Where such indication exists, the recoverable amount of the asset or group of assets is estimated.
The need to recognize impairment is assessed by comparing the net carrying amount of these assets with their
recoverable amount. Unless there are future prospects for the sale of these assets, the recoverable amount
corresponds to their value in use, generally equal to the present value of the future cash flows expected to be derived
from the asset or group of assets, taking account of any residual value. The value in use of these assets is determined
based on assumptions consistent with those adopted for impairment testing of goodwill and other intangible assets
with an indefinite useful life. See Note 7.1.1.
Goodwill and other assets with an indefinite useful life are subject to systematic annual impairment tests following the
update of the long-term plan and more frequent tests where there is an indication of loss in value.
Where the resulting recoverable amount is less than the net carrying amount of the asset or group of assets, an
impairment is recorded.
Impairment losses on non-current assets can be reversed, with the exception of those relating to goodwill.
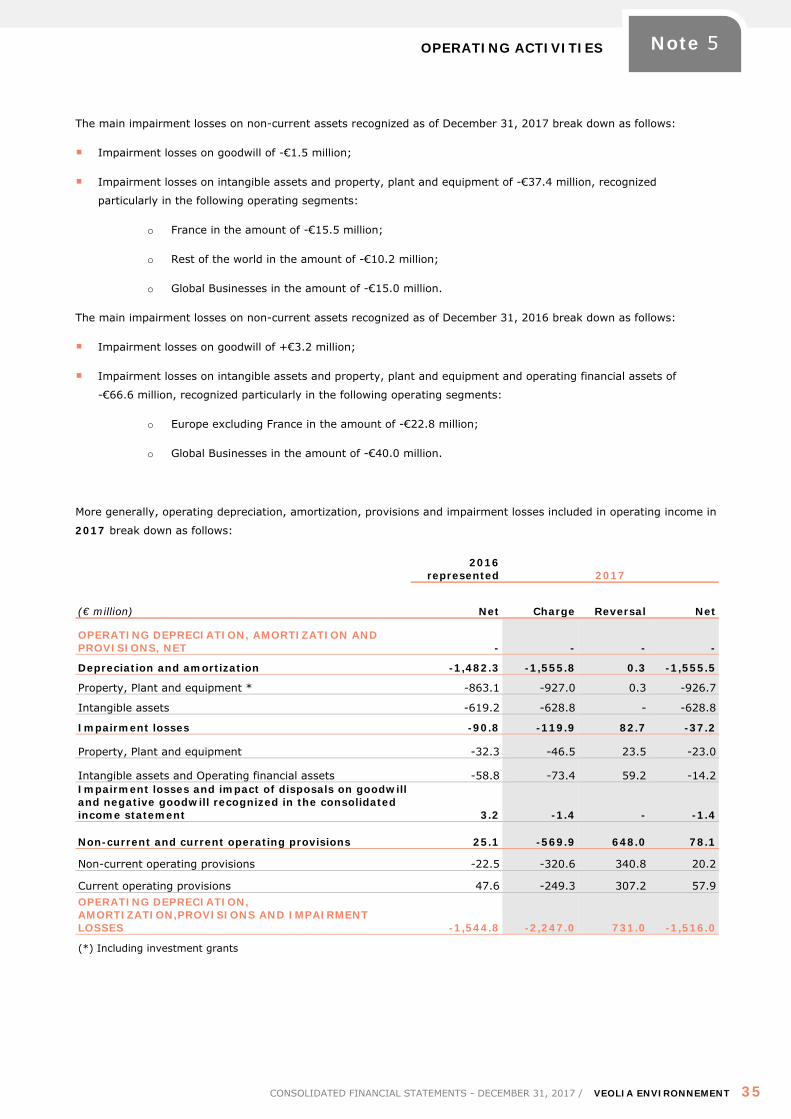
OPERATING ACTIVITIES
CONSOLIDATED FINANCIAL STATEMENTS - DECEMBER 31, 2017 / VEOLIA ENVIRONNEMENT 35
Note 5
The main impairment losses on non-current assets recognized as of December 31, 2017 break down as follows:
Impairment losses on goodwill of -€1.5 million;
Impairment losses on intangible assets and property, plant and equipment of -€37.4 million, recognized
particularly in the following operating segments:
o France in the amount of -€15.5 million;
o Rest of the world in the amount of -€10.2 million;
o Global Businesses in the amount of -€15.0 million.
The main impairment losses on non-current assets recognized as of December 31, 2016 break down as follows:
Impairment losses on goodwill of +€3.2 million;
Impairment losses on intangible assets and property, plant and equipment and operating financial assets of
-€66.6 million, recognized particularly in the following operating segments:
o Europe excluding France in the amount of -€22.8 million;
o Global Businesses in the amount of -€40.0 million.
More generally, operating depreciation, amortization, provisions and impairment losses included in operating income in
2017 break down as follows:
2016
represented 2017
(€ million) Net Charge Reversal Net
OPERATING DEPRECIATION, AMORTIZATION AND PROVISIONS, NET - - - -
Depreciation and amortization -1,482.3 -1,555.8 0.3 -1,555.5
Property, Plant and equipment * -863.1 -927.0 0.3 -926.7
Intangible assets -619.2 -628.8 - -628.8
Impairment losses -90.8 -119.9 82.7 -37.2
Property, Plant and equipment -32.3 -46.5 23.5 -23.0
Intangible assets and Operating financial assets -58.8 -73.4 59.2 -14.2 Impairment losses and impact of disposals on goodwill and negative goodwill recognized in the consolidated income statement 3.2 -1.4 - -1.4
Non-current and current operating provisions 25.1 -569.9 648.0 78.1
Non-current operating provisions -22.5 -320.6 340.8 20.2
Current operating provisions 47.6 -249.3 307.2 57.9 OPERATING DEPRECIATION, AMORTIZATION,PROVISIONS AND IMPAIRMENT LOSSES -1,544.8 -2,247.0 731.0 -1,516.0
(*) Including investment grants
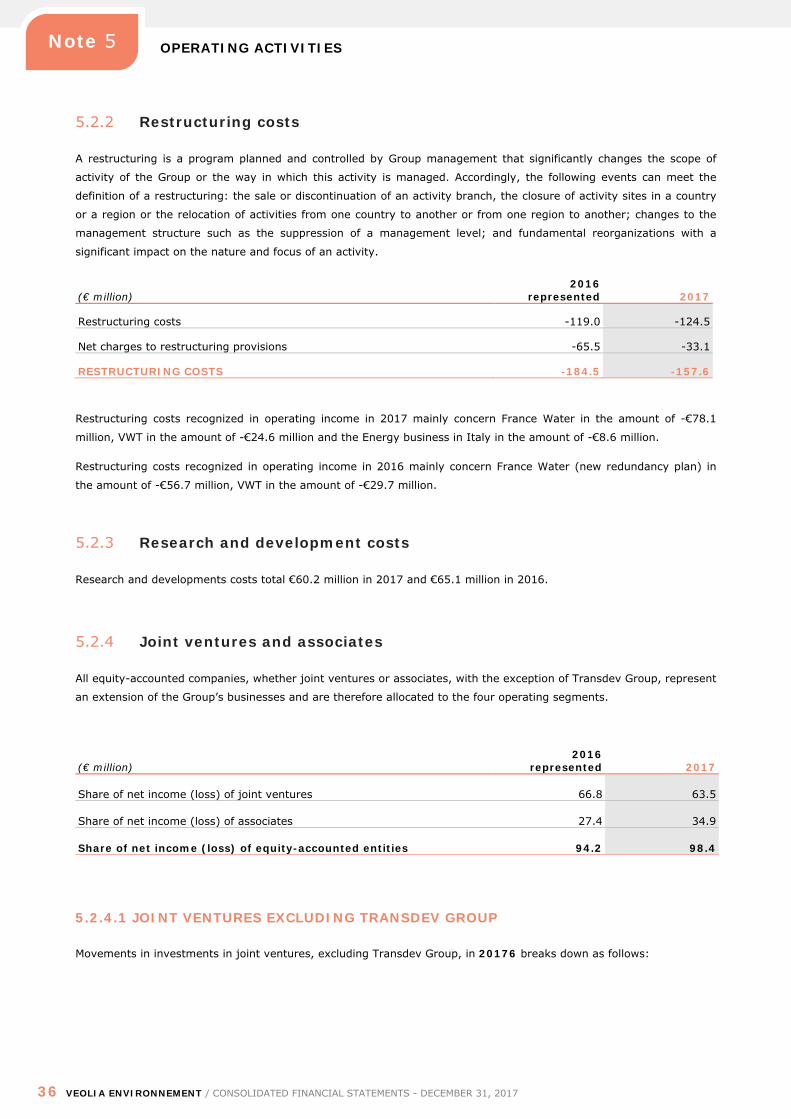
OPERATING ACTIVITIES
36 VEOLIA ENVIRONNEMENT / CONSOLIDATED FINANCIAL STATEMENTS - DECEMBER 31, 2017
Note 5
5.2.2 Restructuring costs
A restructuring is a program planned and controlled by Group management that significantly changes the scope of
activity of the Group or the way in which this activity is managed. Accordingly, the following events can meet the
definition of a restructuring: the sale or discontinuation of an activity branch, the closure of activity sites in a country
or a region or the relocation of activities from one country to another or from one region to another; changes to the
management structure such as the suppression of a management level; and fundamental reorganizations with a
significant impact on the nature and focus of an activity.
(€ million) 2016
represented 2017
Restructuring costs -119.0 -124.5
Net charges to restructuring provisions -65.5 -33.1
RESTRUCTURING COSTS -184.5 -157.6
Restructuring costs recognized in operating income in 2017 mainly concern France Water in the amount of -€78.1
million, VWT in the amount of -€24.6 million and the Energy business in Italy in the amount of -€8.6 million.
Restructuring costs recognized in operating income in 2016 mainly concern France Water (new redundancy plan) in
the amount of -€56.7 million, VWT in the amount of -€29.7 million.
5.2.3 Research and development costs
Research and developments costs total €60.2 million in 2017 and €65.1 million in 2016.
5.2.4 Joint ventures and associates
All equity-accounted companies, whether joint ventures or associates, with the exception of Transdev Group, represent
an extension of the Group’s businesses and are therefore allocated to the four operating segments.
(€ million) 2016
represented 2017
Share of net income (loss) of joint ventures 66.8 63.5
Share of net income (loss) of associates 27.4 34.9
Share of net income (loss) of equity-accounted entities 94.2 98.4
5.2.4.1 JOINT VENTURES EXCLUDING TRANSDEV GROUP
Movements in investments in joint ventures, excluding Transdev Group, in 20176 breaks down as follows:
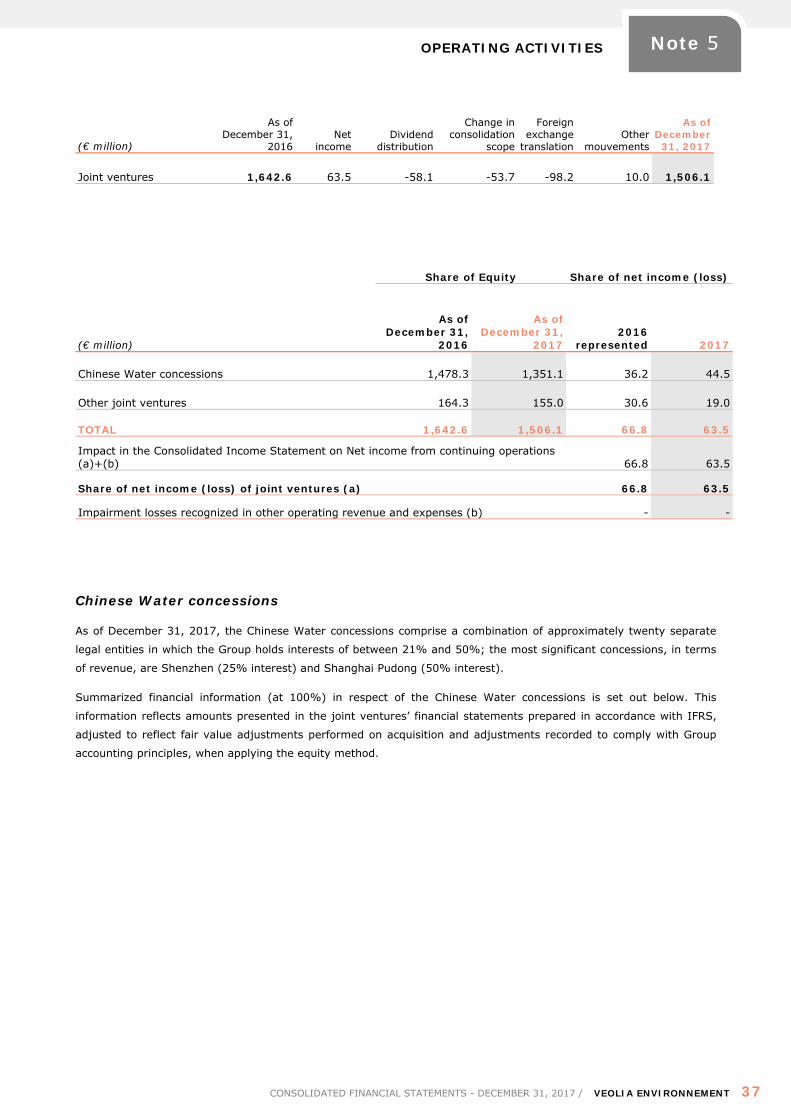
OPERATING ACTIVITIES
CONSOLIDATED FINANCIAL STATEMENTS - DECEMBER 31, 2017 / VEOLIA ENVIRONNEMENT 37
Note 5
(€ million)
As of December 31,
2016 Net
income Dividend
distribution
Change in consolidation
scope
Foreign exchange
translation Other
mouvements
As of December
31, 2017
Joint ventures 1,642.6 63.5 -58.1 -53.7 -98.2 10.0 1,506.1
Share of Equity Share of net income (loss)
(€ million)
As of December 31,
2016
As of December 31,
2017 2016
represented 2017
Chinese Water concessions 1,478.3 1,351.1 36.2 44.5
Other joint ventures 164.3 155.0 30.6 19.0
TOTAL 1,642.6 1,506.1 66.8 63.5
Impact in the Consolidated Income Statement on Net income from continuing operations (a)+(b) 66.8 63.5
Share of net income (loss) of joint ventures (a) 66.8 63.5
Impairment losses recognized in other operating revenue and expenses (b) - -
Chinese Water concessions
As of December 31, 2017, the Chinese Water concessions comprise a combination of approximately twenty separate
legal entities in which the Group holds interests of between 21% and 50%; the most significant concessions, in terms
of revenue, are Shenzhen (25% interest) and Shanghai Pudong (50% interest).
Summarized financial information (at 100%) in respect of the Chinese Water concessions is set out below. This
information reflects amounts presented in the joint ventures’ financial statements prepared in accordance with IFRS,
adjusted to reflect fair value adjustments performed on acquisition and adjustments recorded to comply with Group
accounting principles, when applying the equity method.
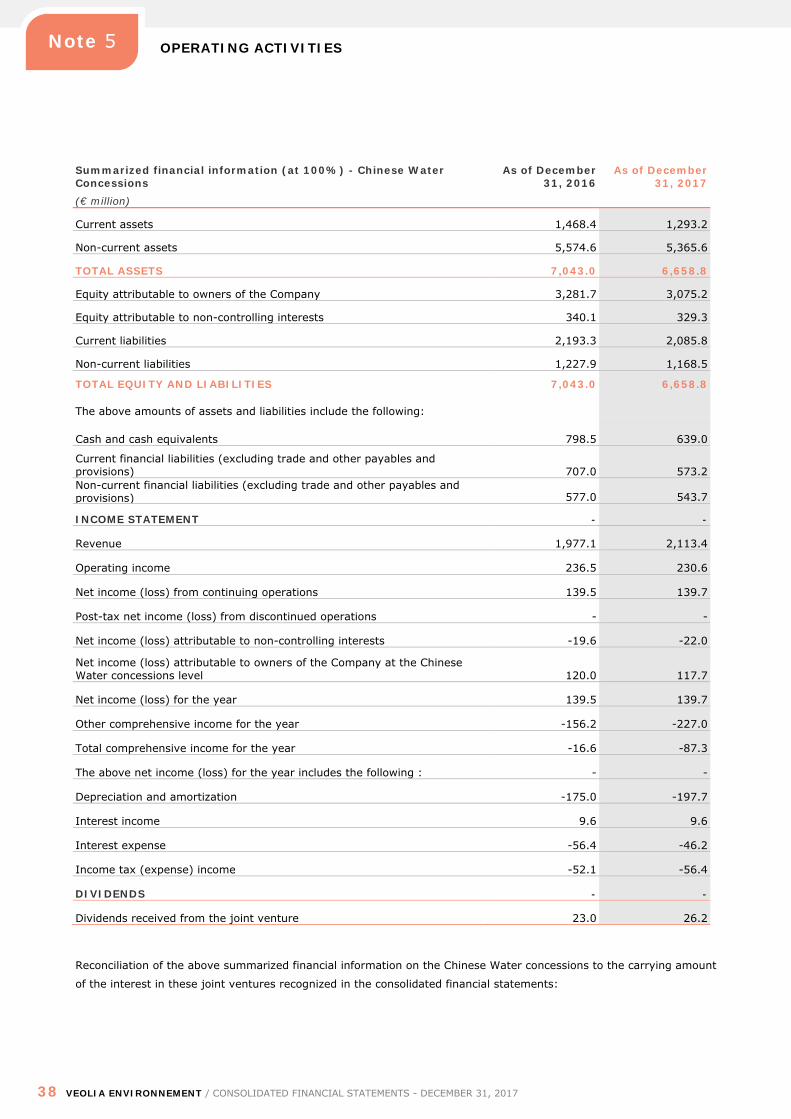
OPERATING ACTIVITIES
38 VEOLIA ENVIRONNEMENT / CONSOLIDATED FINANCIAL STATEMENTS - DECEMBER 31, 2017
Note 5
Summarized financial information (at 100%) - Chinese Water Concessions
As of December 31, 2016
As of December 31, 2017
(€ million)
Current assets 1,468.4 1,293.2
Non-current assets 5,574.6 5,365.6
TOTAL ASSETS 7,043.0 6,658.8
Equity attributable to owners of the Company 3,281.7 3,075.2
Equity attributable to non-controlling interests 340.1 329.3
Current liabilities 2,193.3 2,085.8
Non-current liabilities 1,227.9 1,168.5
TOTAL EQUITY AND LIABILITIES 7,043.0 6,658.8
The above amounts of assets and liabilities include the following:
Cash and cash equivalents 798.5 639.0
Current financial liabilities (excluding trade and other payables and provisions) 707.0 573.2 Non-current financial liabilities (excluding trade and other payables and provisions) 577.0 543.7
INCOME STATEMENT - -
Revenue 1,977.1 2,113.4
Operating income 236.5 230.6
Net income (loss) from continuing operations 139.5 139.7
Post-tax net income (loss) from discontinued operations - -
Net income (loss) attributable to non-controlling interests -19.6 -22.0
Net income (loss) attributable to owners of the Company at the Chinese Water concessions level 120.0 117.7
Net income (loss) for the year 139.5 139.7
Other comprehensive income for the year -156.2 -227.0
Total comprehensive income for the year -16.6 -87.3
The above net income (loss) for the year includes the following : - -
Depreciation and amortization -175.0 -197.7
Interest income 9.6 9.6
Interest expense -56.4 -46.2
Income tax (expense) income -52.1 -56.4
DIVIDENDS - -
Dividends received from the joint venture 23.0 26.2
Reconciliation of the above summarized financial information on the Chinese Water concessions to the carrying amount
of the interest in these joint ventures recognized in the consolidated financial statements:
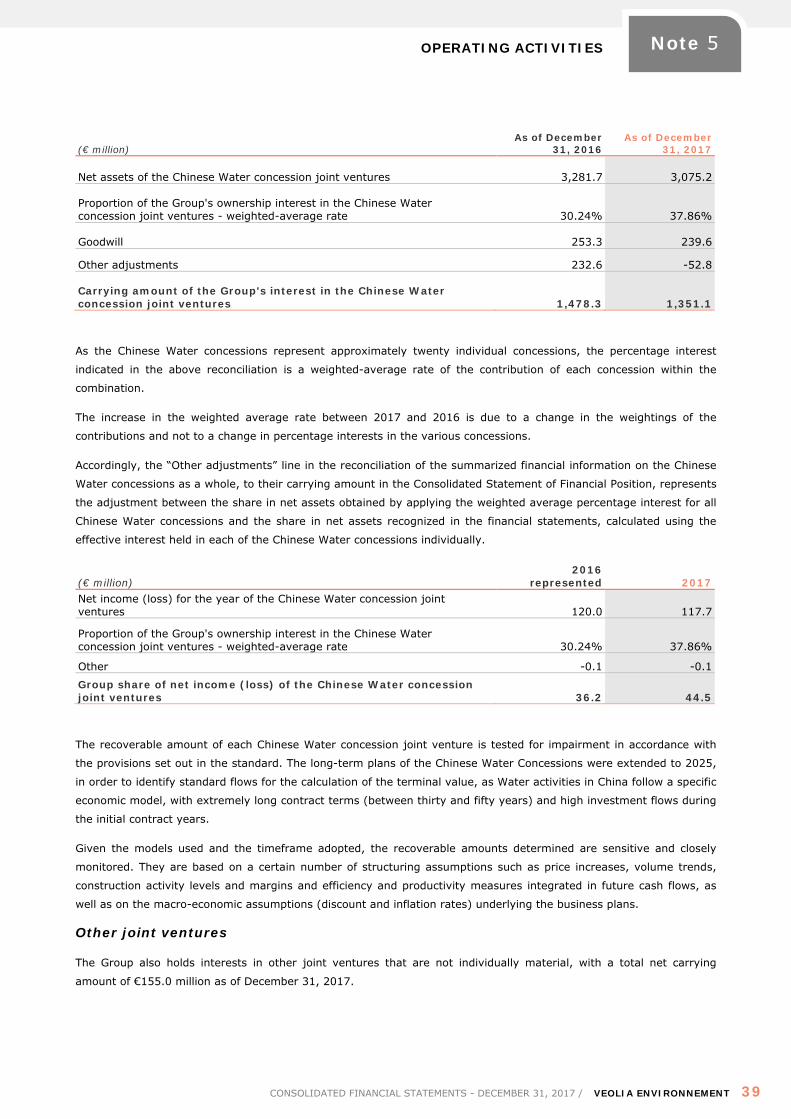
OPERATING ACTIVITIES
CONSOLIDATED FINANCIAL STATEMENTS - DECEMBER 31, 2017 / VEOLIA ENVIRONNEMENT 39
Note 5
(€ million) As of December
31, 2016 As of December
31, 2017
Net assets of the Chinese Water concession joint ventures 3,281.7 3,075.2
Proportion of the Group's ownership interest in the Chinese Water concession joint ventures - weighted-average rate 30.24% 37.86%
Goodwill 253.3 239.6
Other adjustments 232.6 -52.8
Carrying amount of the Group's interest in the Chinese Water concession joint ventures 1,478.3 1,351.1
As the Chinese Water concessions represent approximately twenty individual concessions, the percentage interest
indicated in the above reconciliation is a weighted-average rate of the contribution of each concession within the
combination.
The increase in the weighted average rate between 2017 and 2016 is due to a change in the weightings of the
contributions and not to a change in percentage interests in the various concessions.
Accordingly, the “Other adjustments” line in the reconciliation of the summarized financial information on the Chinese
Water concessions as a whole, to their carrying amount in the Consolidated Statement of Financial Position, represents
the adjustment between the share in net assets obtained by applying the weighted average percentage interest for all
Chinese Water concessions and the share in net assets recognized in the financial statements, calculated using the
effective interest held in each of the Chinese Water concessions individually.
(€ million) 2016
represented 2017 Net income (loss) for the year of the Chinese Water concession joint ventures 120.0 117.7
Proportion of the Group's ownership interest in the Chinese Water concession joint ventures - weighted-average rate 30.24% 37.86%
Other -0.1 -0.1
Group share of net income (loss) of the Chinese Water concession joint ventures 36.2 44.5
The recoverable amount of each Chinese Water concession joint venture is tested for impairment in accordance with
the provisions set out in the standard. The long-term plans of the Chinese Water Concessions were extended to 2025,
in order to identify standard flows for the calculation of the terminal value, as Water activities in China follow a specific
economic model, with extremely long contract terms (between thirty and fifty years) and high investment flows during
the initial contract years.
Given the models used and the timeframe adopted, the recoverable amounts determined are sensitive and closely
monitored. They are based on a certain number of structuring assumptions such as price increases, volume trends,
construction activity levels and margins and efficiency and productivity measures integrated in future cash flows, as
well as on the macro-economic assumptions (discount and inflation rates) underlying the business plans.
Other joint ventures
The Group also holds interests in other joint ventures that are not individually material, with a total net carrying
amount of €155.0 million as of December 31, 2017.
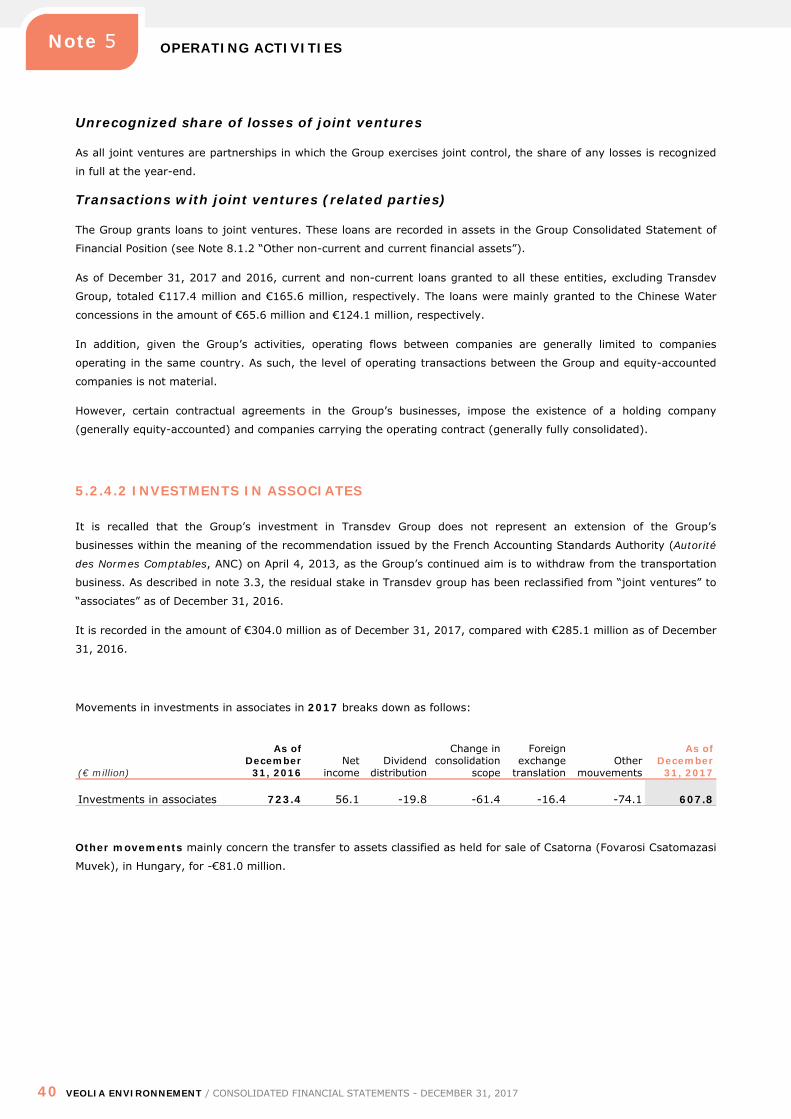
OPERATING ACTIVITIES
40 VEOLIA ENVIRONNEMENT / CONSOLIDATED FINANCIAL STATEMENTS - DECEMBER 31, 2017
Note 5
Unrecognized share of losses of joint ventures
As all joint ventures are partnerships in which the Group exercises joint control, the share of any losses is recognized
in full at the year-end.
Transactions with joint ventures (related parties)
The Group grants loans to joint ventures. These loans are recorded in assets in the Group Consolidated Statement of
Financial Position (see Note 8.1.2 “Other non-current and current financial assets”).
As of December 31, 2017 and 2016, current and non-current loans granted to all these entities, excluding Transdev
Group, totaled €117.4 million and €165.6 million, respectively. The loans were mainly granted to the Chinese Water
concessions in the amount of €65.6 million and €124.1 million, respectively.
In addition, given the Group’s activities, operating flows between companies are generally limited to companies
operating in the same country. As such, the level of operating transactions between the Group and equity-accounted
companies is not material.
However, certain contractual agreements in the Group’s businesses, impose the existence of a holding company
(generally equity-accounted) and companies carrying the operating contract (generally fully consolidated).
5.2.4.2 INVESTMENTS IN ASSOCIATES
It is recalled that the Group’s investment in Transdev Group does not represent an extension of the Group’s
businesses within the meaning of the recommendation issued by the French Accounting Standards Authority (Autorité
des Normes Comptables, ANC) on April 4, 2013, as the Group’s continued aim is to withdraw from the transportation
business. As described in note 3.3, the residual stake in Transdev group has been reclassified from “joint ventures” to
“associates” as of December 31, 2016.
It is recorded in the amount of €304.0 million as of December 31, 2017, compared with €285.1 million as of December
31, 2016.
Movements in investments in associates in 2017 breaks down as follows:
(€ million)
As of December
31, 2016 Net
income Dividend
distribution
Change in consolidation
scope
Foreign exchange
translation Other
mouvements
As of December
31, 2017
Investments in associates 723.4 56.1 -19.8 -61.4 -16.4 -74.1 607.8
Other movements mainly concern the transfer to assets classified as held for sale of Csatorna (Fovarosi Csatomazasi
Muvek), in Hungary, for -€81.0 million.
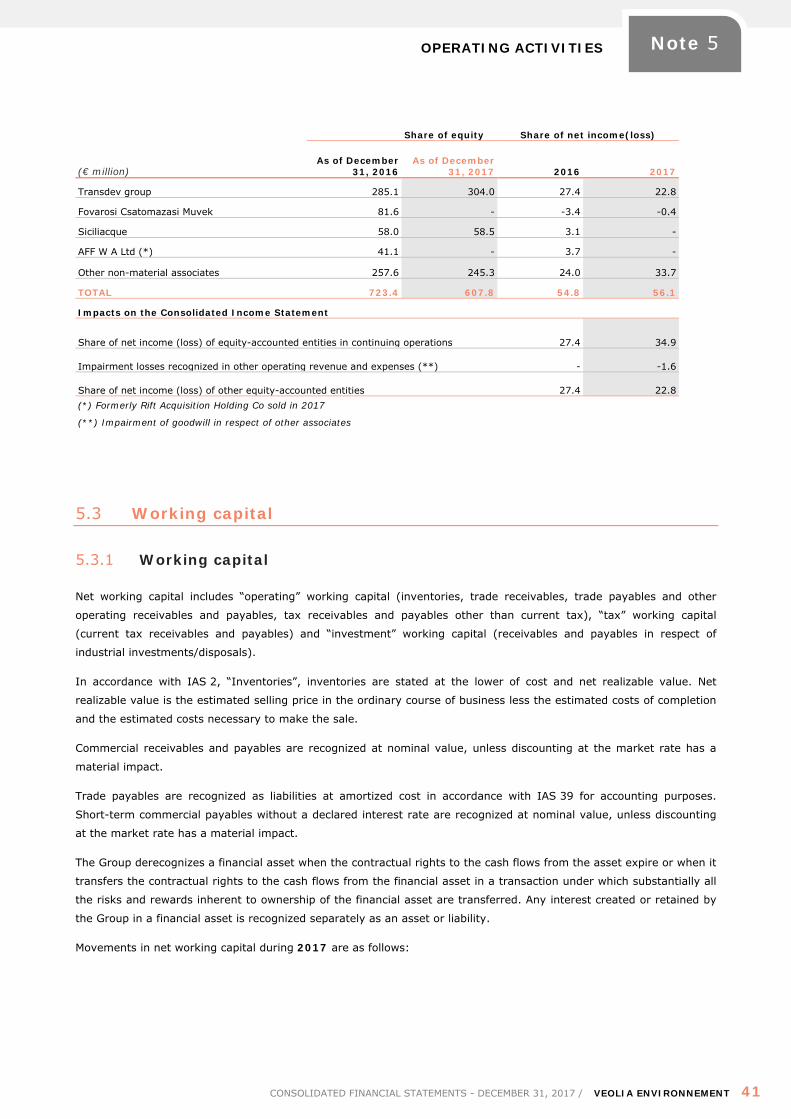
OPERATING ACTIVITIES
CONSOLIDATED FINANCIAL STATEMENTS - DECEMBER 31, 2017 / VEOLIA ENVIRONNEMENT 41
Note 5
Share of equity Share of net income(loss)
(€ million) As of December
31, 2016 As of December
31, 2017 2016 2017
Transdev group 285.1 304.0 27.4 22.8
Fovarosi Csatomazasi Muvek 81.6 - -3.4 -0.4
Siciliacque 58.0 58.5 3.1 -
AFF W A Ltd (*) 41.1 - 3.7 -
Other non-material associates 257.6 245.3 24.0 33.7
TOTAL 723.4 607.8 54.8 56.1
Impacts on the Consolidated Income Statement
Share of net income (loss) of equity-accounted entities in continuing operations 27.4 34.9
Impairment losses recognized in other operating revenue and expenses (**) - -1.6
Share of net income (loss) of other equity-accounted entities 27.4 22.8 (*) Formerly Rift Acquisition Holding Co sold in 2017
(**) Impairment of goodwill in respect of other associates
5.3 Working capital
5.3.1 Working capital
Net working capital includes “operating” working capital (inventories, trade receivables, trade payables and other
operating receivables and payables, tax receivables and payables other than current tax), “tax” working capital
(current tax receivables and payables) and “investment” working capital (receivables and payables in respect of
industrial investments/disposals).
In accordance with IAS 2, “Inventories”, inventories are stated at the lower of cost and net realizable value. Net
realizable value is the estimated selling price in the ordinary course of business less the estimated costs of completion
and the estimated costs necessary to make the sale.
Commercial receivables and payables are recognized at nominal value, unless discounting at the market rate has a
material impact.
Trade payables are recognized as liabilities at amortized cost in accordance with IAS 39 for accounting purposes.
Short-term commercial payables without a declared interest rate are recognized at nominal value, unless discounting
at the market rate has a material impact.
The Group derecognizes a financial asset when the contractual rights to the cash flows from the asset expire or when it
transfers the contractual rights to the cash flows from the financial asset in a transaction under which substantially all
the risks and rewards inherent to ownership of the financial asset are transferred. Any interest created or retained by
the Group in a financial asset is recognized separately as an asset or liability.
Movements in net working capital during 2017 are as follows:
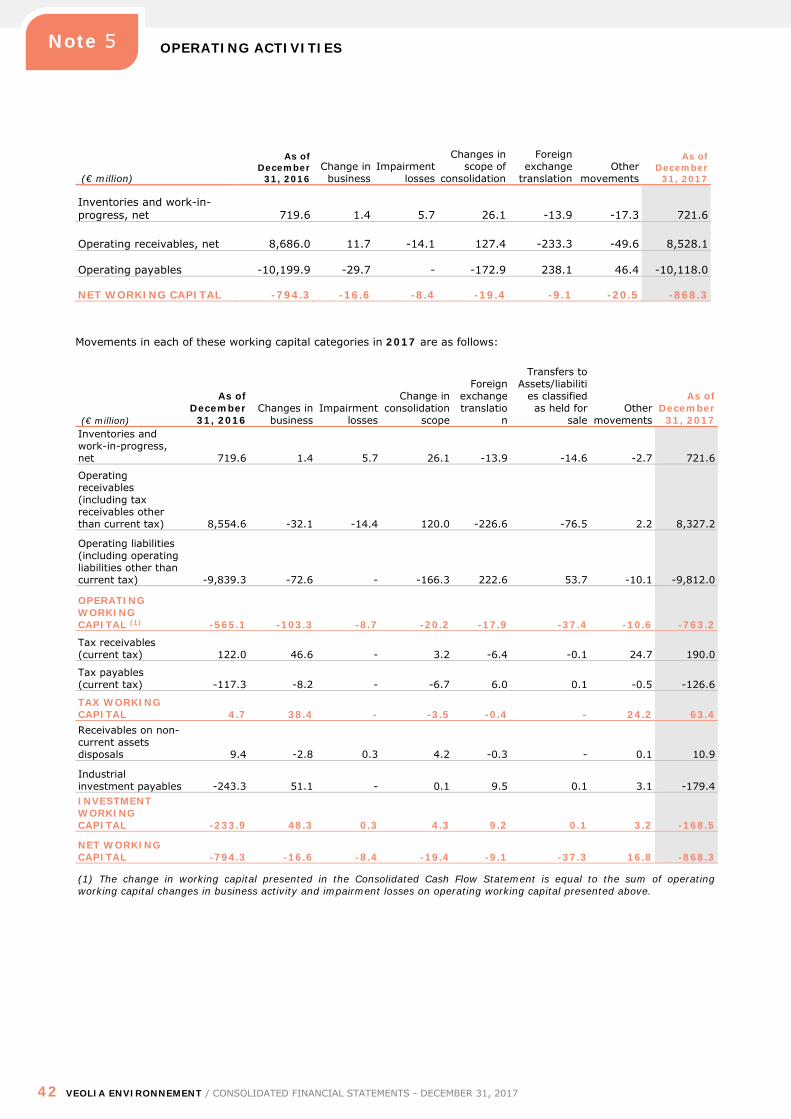
OPERATING ACTIVITIES
42 VEOLIA ENVIRONNEMENT / CONSOLIDATED FINANCIAL STATEMENTS - DECEMBER 31, 2017
Note 5
(€ million)
As of December
31, 2016 Change in
business Impairment
losses
Changes in scope of
consolidation
Foreign exchange
translation Other
movements
As of December
31, 2017
Inventories and work-in-progress, net 719.6 1.4 5.7 26.1 -13.9 -17.3 721.6
Operating receivables, net 8,686.0 11.7 -14.1 127.4 -233.3 -49.6 8,528.1
Operating payables -10,199.9 -29.7 - -172.9 238.1 46.4 -10,118.0
NET WORKING CAPITAL -794.3 -16.6 -8.4 -19.4 -9.1 -20.5 -868.3
Movements in each of these working capital categories in 2017 are as follows:
(€ million)
As of December
31, 2016 Changes in
business Impairment
losses
Change in consolidation
scope
Foreign exchange translatio
n
Transfers to Assets/liabiliti
es classified as held for
sale Other
movements
As of December
31, 2017 Inventories and work-in-progress, net 719.6 1.4 5.7 26.1 -13.9 -14.6 -2.7 721.6
Operating receivables (including tax receivables other than current tax) 8,554.6 -32.1 -14.4 120.0 -226.6 -76.5 2.2 8,327.2
Operating liabilities (including operating liabilities other than current tax) -9,839.3 -72.6 - -166.3 222.6 53.7 -10.1 -9,812.0
OPERATING WORKING CAPITAL (1) -565.1 -103.3 -8.7 -20.2 -17.9 -37.4 -10.6 -763.2
Tax receivables (current tax) 122.0 46.6 - 3.2 -6.4 -0.1 24.7 190.0
Tax payables (current tax) -117.3 -8.2 - -6.7 6.0 0.1 -0.5 -126.6
TAX WORKING CAPITAL 4.7 38.4 - -3.5 -0.4 - 24.2 63.4 Receivables on non-current assets disposals 9.4 -2.8 0.3 4.2 -0.3 - 0.1 10.9
Industrial investment payables -243.3 51.1 - 0.1 9.5 0.1 3.1 -179.4 INVESTMENT WORKING CAPITAL -233.9 48.3 0.3 4.3 9.2 0.1 3.2 -168.5
NET WORKING CAPITAL -794.3 -16.6 -8.4 -19.4 -9.1 -37.3 16.8 -868.3
(1) The change in working capital presented in the Consolidated Cash Flow Statement is equal to the sum of operating working capital changes in business activity and impairment losses on operating working capital presented above.
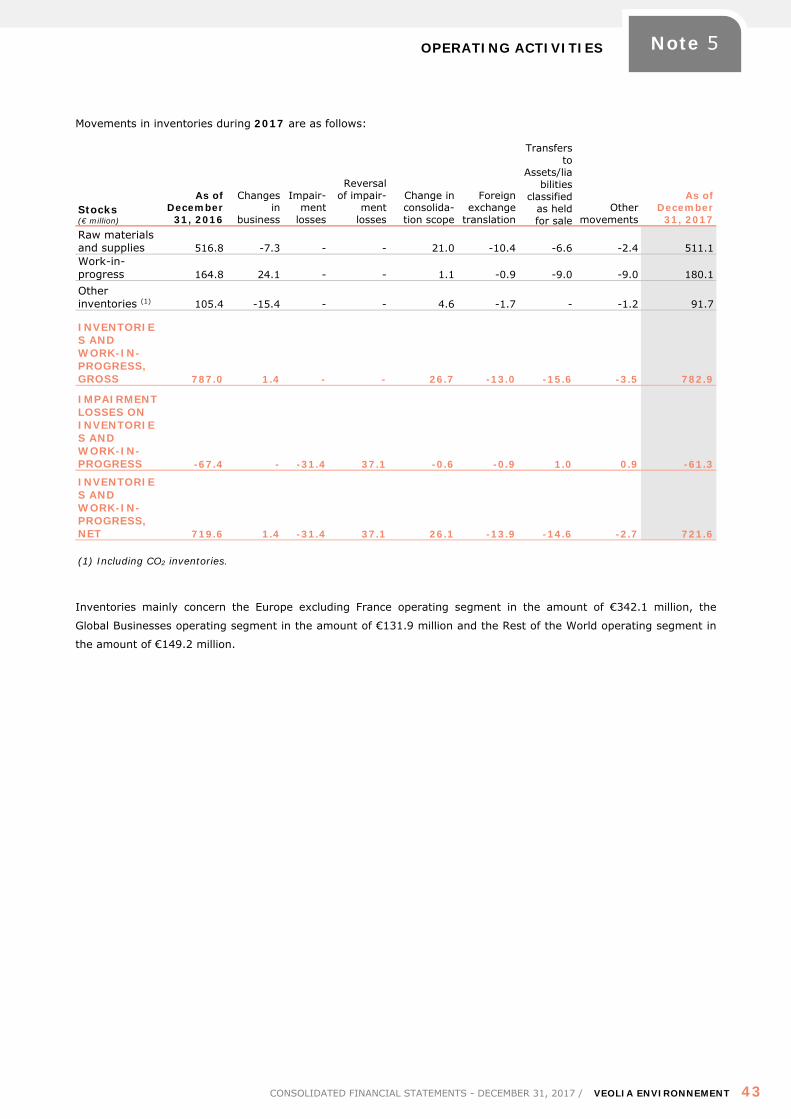
OPERATING ACTIVITIES
CONSOLIDATED FINANCIAL STATEMENTS - DECEMBER 31, 2017 / VEOLIA ENVIRONNEMENT 43
Note 5
Movements in inventories during 2017 are as follows:
Stocks (€ million)
As of December
31, 2016
Changes in
business
Impair-ment
losses
Reversal of impair-
ment losses
Change in consolida-tion scope
Foreign exchange
translation
Transfers to
Assets/liabilities
classified as held for sale
Other movements
As of December
31, 2017 Raw materials and supplies 516.8 -7.3 - - 21.0 -10.4 -6.6 -2.4 511.1 Work-in-progress 164.8 24.1 - - 1.1 -0.9 -9.0 -9.0 180.1 Other inventories (1) 105.4 -15.4 - - 4.6 -1.7 - -1.2 91.7
INVENTORIES AND WORK-IN-PROGRESS, GROSS 787.0 1.4 - - 26.7 -13.0 -15.6 -3.5 782.9
IMPAIRMENT LOSSES ON INVENTORIES AND WORK-IN-PROGRESS -67.4 - -31.4 37.1 -0.6 -0.9 1.0 0.9 -61.3
INVENTORIES AND WORK-IN-PROGRESS, NET 719.6 1.4 -31.4 37.1 26.1 -13.9 -14.6 -2.7 721.6
(1) Including CO2 inventories.
Inventories mainly concern the Europe excluding France operating segment in the amount of €342.1 million, the
Global Businesses operating segment in the amount of €131.9 million and the Rest of the World operating segment in
the amount of €149.2 million.
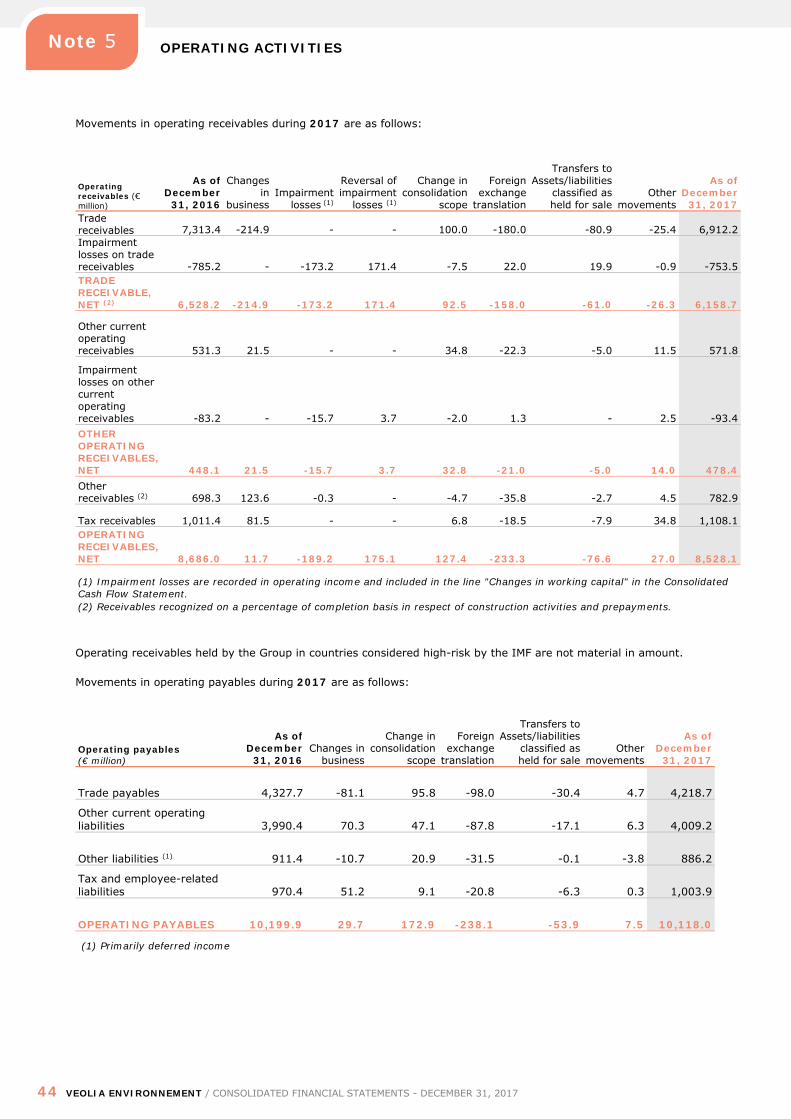
OPERATING ACTIVITIES
44 VEOLIA ENVIRONNEMENT / CONSOLIDATED FINANCIAL STATEMENTS - DECEMBER 31, 2017
Note 5
Movements in operating receivables during 2017 are as follows:
Operating receivables (€ million)
As of December
31, 2016
Changes in
business Impairment
losses (1)
Reversal of impairment
losses (1)
Change in consolidation
scope
Foreign exchange
translation
Transfers to Assets/liabilities
classified as held for sale
Other movements
As of December
31, 2017 Trade receivables 7,313.4 -214.9 - - 100.0 -180.0 -80.9 -25.4 6,912.2 Impairment losses on trade receivables -785.2 - -173.2 171.4 -7.5 22.0 19.9 -0.9 -753.5 TRADE RECEIVABLE, NET (2) 6,528.2 -214.9 -173.2 171.4 92.5 -158.0 -61.0 -26.3 6,158.7
Other current operating receivables 531.3 21.5 - - 34.8 -22.3 -5.0 11.5 571.8
Impairment losses on other current operating receivables -83.2 - -15.7 3.7 -2.0 1.3 - 2.5 -93.4 OTHER OPERATING RECEIVABLES, NET 448.1 21.5 -15.7 3.7 32.8 -21.0 -5.0 14.0 478.4 Other receivables (2) 698.3 123.6 -0.3 - -4.7 -35.8 -2.7 4.5 782.9
Tax receivables 1,011.4 81.5 - - 6.8 -18.5 -7.9 34.8 1,108.1 OPERATING RECEIVABLES, NET 8,686.0 11.7 -189.2 175.1 127.4 -233.3 -76.6 27.0 8,528.1
(1) Impairment losses are recorded in operating income and included in the line "Changes in working capital" in the Consolidated Cash Flow Statement. (2) Receivables recognized on a percentage of completion basis in respect of construction activities and prepayments.
Operating receivables held by the Group in countries considered high-risk by the IMF are not material in amount.
Movements in operating payables during 2017 are as follows:
Operating payables (€ million)
As of December
31, 2016 Changes in
business
Change in consolidation
scope
Foreign exchange
translation
Transfers to Assets/liabilities
classified as held for sale
Other movements
As of December
31, 2017
Trade payables 4,327.7 -81.1 95.8 -98.0 -30.4 4.7 4,218.7
Other current operating liabilities 3,990.4 70.3 47.1 -87.8 -17.1 6.3 4,009.2
Other liabilities (1) 911.4 -10.7 20.9 -31.5 -0.1 -3.8 886.2
Tax and employee-related liabilities 970.4 51.2 9.1 -20.8 -6.3 0.3 1,003.9
OPERATING PAYABLES 10,199.9 29.7 172.9 -238.1 -53.9 7.5 10,118.0
(1) Primarily deferred income
OPERATING ACTIVITIES
CONSOLIDATED FINANCIAL STATEMENTS - DECEMBER 31, 2017 / VEOLIA ENVIRONNEMENT 45
Note 5
5.3.2 Working capital management transactions
Veolia had several programs for the assignment of receivables through factoring, discounting and assignment by way
of security, still in progress in 2017.
FACTORING
Under these programs, certain subsidiaries have agreed to assign, on a renewable basis, trade receivables by
contractual subrogation or assignment of receivables (such as “Dailly” programs in France) without recourse against
the risk of default by the debtor. The analysis of the risks and rewards as defined by IAS 39 led the Group to
derecognize almost all the receivables assigned under these factoring programs. In addition, the transferor
subsidiaries remain, in certain cases, responsible for invoicing and debt recovery, for which they receive remuneration
but do not retain control.
Accordingly, receivables totaling €2,507.5 million were assigned under these programs in 2016, compared with
€1,640.7 million in 2016. Receivables derecognized as of December 31, 2017 total €498.8 million, compared with
€413.7 million as of December 31, 2016.
DISCOUNTING AND ASSIGNMENT BY WAY OF SECURITY
Under Public-Private partnerships, Veolia subsidiaries can assign the fraction of future payments guaranteed by public
authorities / private customers (recognized in financial receivables pursuant to IFRIC 12 or IFRIC 4-IAS 17) to the
bodies funding the project, through discounting or assignment by way of security programs (such as Dailly programs
in France). For the majority of partnerships concerned by these financial receivable assignments, the assignment
agreements negotiated and the contractual clauses agreed between the stakeholders are sufficient to satisfy the
derecognition criteria set out in IAS 39. The residual risk retained by the companies (considered immaterial) is
generally tied solely to late customer payment due to late/deferred invoicing of services by Group subsidiaries. Group
subsidiaries are mandated by the financial institutions to manage the invoicing and recovery of the receivables covered
by these programs. Veolia analyzed the management and recovery procedures falling to Group subsidiaries and
concluded that these services did not constitute continuing involvement.
Two assignments by way of security performed in 2005 and 2006 in connection with the specific terms and conditions
of finance lease agreements entered into by the Waste activities operate differently and do not permit the
derecognition of the receivables assigned. The assignment terms provide for the provision of a joint surety by the
subsidiaries and their partners to the assignee financial institutions. Receivables of €59.8 million and finance lease
obligations maturing in 2025 and 2026 of €58.8 million are recognized in Veolia’s balance sheet as of December 31,
2017 in respect of these contracts (€64.7 million and €65.9 million, respectively, as of December 31, 2016).
In 2017, the Group also assigned tax credits totaling €68.8 million (Competitiveness and Employment tax credit and
Research tax credit), through discounting. These receivables were derecognized in the Statement of Financial Position
at the end of 2017.
5.4 Non-current and current operating financial assets
Operating financial assets comprise financial assets resulting from the application of IFRIC 12 on accounting for
concession arrangements and from the application of IFRIC 4 on accounting for leases.
OPERATING ACTIVITIES
46 VEOLIA ENVIRONNEMENT / CONSOLIDATED FINANCIAL STATEMENTS - DECEMBER 31, 2017
Note 5
Concession arrangements
Pursuant to IFRIC 12, when the operator has an unconditional right to receive cash or another financial asset from the
grantor in remuneration for concession services, the financial asset model applies. In this context, the infrastructures
managed under these contracts cannot be recorded in assets of the operator as property, plant and equipment, but
are recorded as financial assets.
Investment grants received in respect of concession arrangements are generally definitively earned and, therefore, are
not repayable. In accordance with the option offered by IAS 20, these grants are presented as a deduction from
intangible assets or financial assets depending on the applicable model following an analysis of each concession
arrangement (IFRIC 12). Under the financial asset model, investment grants are equated to a means of repaying the
operating financial asset.
During the construction phase, a financial receivable is recognized in the Consolidated Statement of Financial Position
and revenue in the Consolidated Income Statement, in accordance with the percentage of completion method laid
down in IAS 11 on construction contracts.
Financial receivables are initially measured at the lower of fair value and the sum of discounted future cash flows and
subsequently recognized at amortized cost using the effective interest method.
After a review of the contract and its financing, the implied interest rate on the financial receivable is based on either
the Group financing rate and /or the borrowing rate associated with the contract.
Leases
IFRIC 4 seeks to identify the contractual terms and conditions of agreements which, without taking the legal form of a
lease, convey a right to use a group of assets in return for payments included in the overall contract remuneration. It
identifies in such agreements a lease contract which is then analyzed and accounted for in accordance with the criteria
laid down in IAS 17, based on the allocation of the risks and rewards of ownership between the lessor and the lessee.
The contract operator therefore becomes the lessor with respect to its customers. Where the lease transfers the risks
and rewards of ownership of the asset in accordance with IAS 17 criteria, the operator recognizes a financial asset to
reflect the corresponding financing, rather than an item of property, plant and equipment.
Movements in the net carrying amount of non-current and current operating financial assets during 2016 are as
follows:
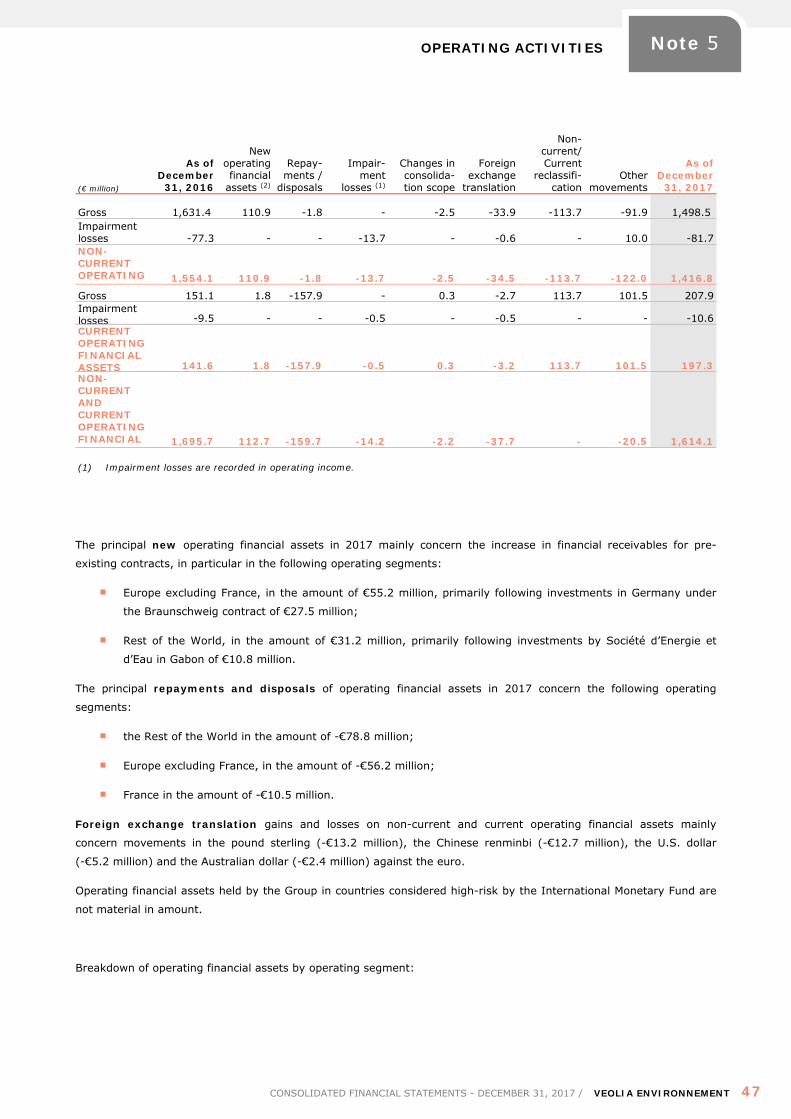
OPERATING ACTIVITIES
CONSOLIDATED FINANCIAL STATEMENTS - DECEMBER 31, 2017 / VEOLIA ENVIRONNEMENT 47
Note 5
(€ million)
As of December
31, 2016
New operating financial
assets (2)
Repay-ments /
disposals
Impair-ment
losses (1)
Changes in consolida-tion scope
Foreign exchange
translation
Non-current/ Current
reclassifi-cation
Other movements
As of December
31, 2017
Gross 1,631.4 110.9 -1.8 - -2.5 -33.9 -113.7 -91.9 1,498.5 Impairment losses -77.3 - - -13.7 - -0.6 - 10.0 -81.7 NON-CURRENT OPERATING FINANCIAL
1,554.1 110.9 -1.8 -13.7 -2.5 -34.5 -113.7 -122.0 1,416.8
Gross 151.1 1.8 -157.9 - 0.3 -2.7 113.7 101.5 207.9 Impairment losses -9.5 - - -0.5 - -0.5 - - -10.6 CURRENT OPERATING FINANCIAL ASSETS 141.6 1.8 -157.9 -0.5 0.3 -3.2 113.7 101.5 197.3 NON-CURRENT AND CURRENT OPERATING FINANCIAL 1,695.7 112.7 -159.7 -14.2 -2.2 -37.7 - -20.5 1,614.1 (1) Impairment losses are recorded in operating income.
The principal new operating financial assets in 2017 mainly concern the increase in financial receivables for pre-
existing contracts, in particular in the following operating segments:
Europe excluding France, in the amount of €55.2 million, primarily following investments in Germany under
the Braunschweig contract of €27.5 million;
Rest of the World, in the amount of €31.2 million, primarily following investments by Société d’Energie et
d’Eau in Gabon of €10.8 million.
The principal repayments and disposals of operating financial assets in 2017 concern the following operating
segments:
the Rest of the World in the amount of -€78.8 million;
Europe excluding France, in the amount of -€56.2 million;
France in the amount of -€10.5 million.
Foreign exchange translation gains and losses on non-current and current operating financial assets mainly
concern movements in the pound sterling (-€13.2 million), the Chinese renminbi (-€12.7 million), the U.S. dollar
(-€5.2 million) and the Australian dollar (-€2.4 million) against the euro.
Operating financial assets held by the Group in countries considered high-risk by the International Monetary Fund are
not material in amount.
Breakdown of operating financial assets by operating segment:
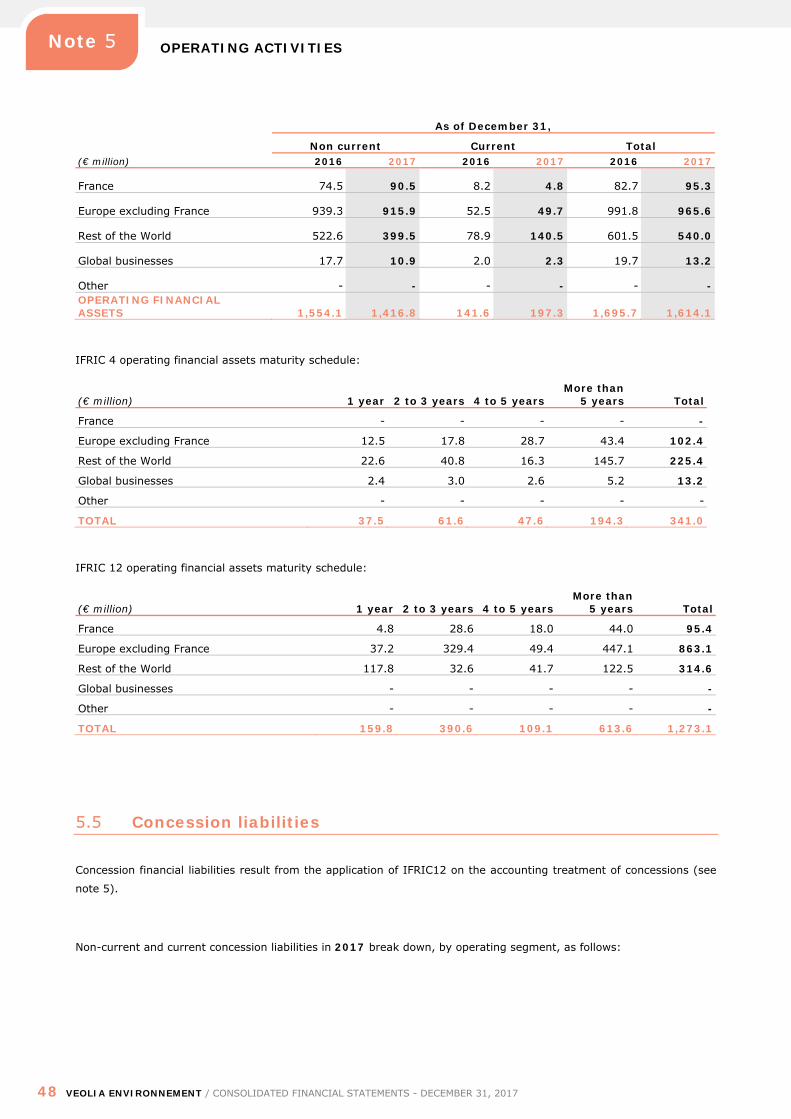
OPERATING ACTIVITIES
48 VEOLIA ENVIRONNEMENT / CONSOLIDATED FINANCIAL STATEMENTS - DECEMBER 31, 2017
Note 5
As of December 31,
Non current Current Total (€ million) 2016 2017 2016 2017 2016 2017
France 74.5 90.5 8.2 4.8 82.7 95.3
Europe excluding France 939.3 915.9 52.5 49.7 991.8 965.6
Rest of the World 522.6 399.5 78.9 140.5 601.5 540.0
Global businesses 17.7 10.9 2.0 2.3 19.7 13.2
Other - - - - - - OPERATING FINANCIAL ASSETS 1,554.1 1,416.8 141.6 197.3 1,695.7 1,614.1
IFRIC 4 operating financial assets maturity schedule:
(€ million) 1 year 2 to 3 years 4 to 5 years More than
5 years Total
France - - - - -
Europe excluding France 12.5 17.8 28.7 43.4 102.4
Rest of the World 22.6 40.8 16.3 145.7 225.4
Global businesses 2.4 3.0 2.6 5.2 13.2
Other - - - - -
TOTAL 37.5 61.6 47.6 194.3 341.0
IFRIC 12 operating financial assets maturity schedule:
(€ million) 1 year 2 to 3 years 4 to 5 years More than
5 years Total
France 4.8 28.6 18.0 44.0 95.4
Europe excluding France 37.2 329.4 49.4 447.1 863.1
Rest of the World 117.8 32.6 41.7 122.5 314.6
Global businesses - - - - -
Other - - - - -
TOTAL 159.8 390.6 109.1 613.6 1,273.1
5.5 Concession liabilities
Concession financial liabilities result from the application of IFRIC12 on the accounting treatment of concessions (see
note 5).
Non-current and current concession liabilities in 2017 break down, by operating segment, as follows:
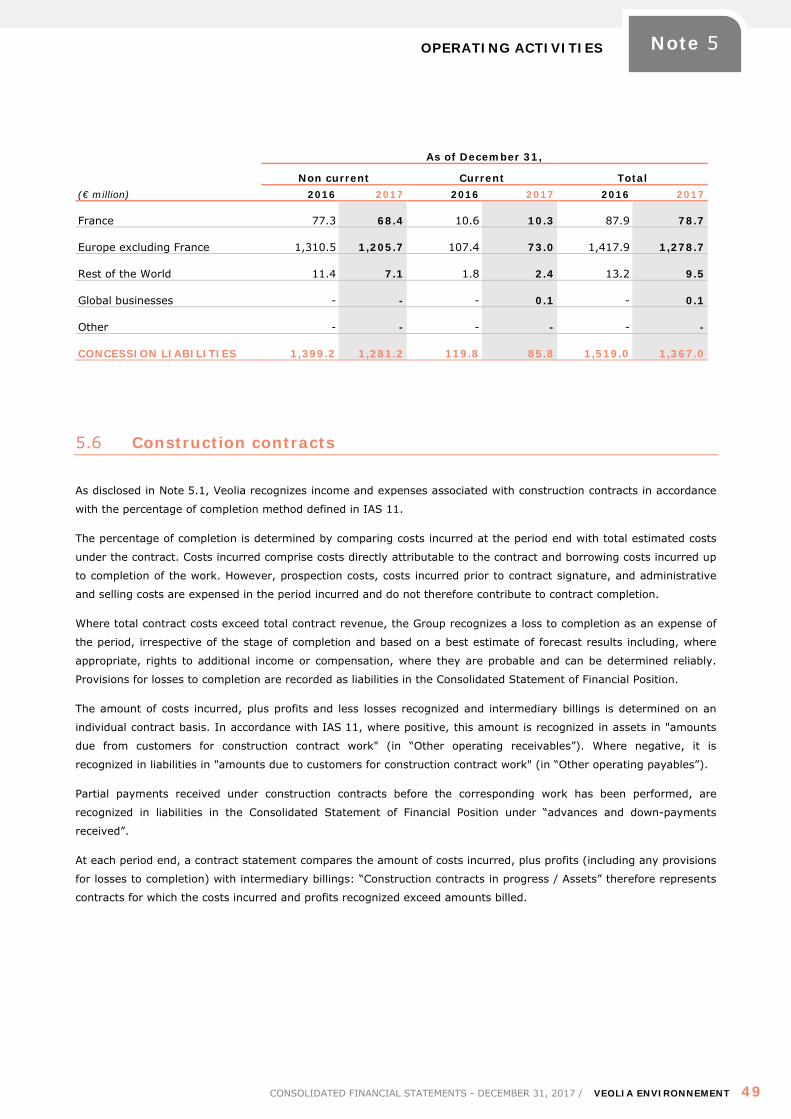
OPERATING ACTIVITIES
CONSOLIDATED FINANCIAL STATEMENTS - DECEMBER 31, 2017 / VEOLIA ENVIRONNEMENT 49
Note 5
As of December 31,
Non current Current Total (€ million) 2016 2017 2016 2017 2016 2017
France 77.3 68.4 10.6 10.3 87.9 78.7
Europe excluding France 1,310.5 1,205.7 107.4 73.0 1,417.9 1,278.7
Rest of the World 11.4 7.1 1.8 2.4 13.2 9.5
Global businesses - - - 0.1 - 0.1
Other - - - - - -
CONCESSION LIABILITIES 1,399.2 1,281.2 119.8 85.8 1,519.0 1,367.0
5.6 Construction contracts
As disclosed in Note 5.1, Veolia recognizes income and expenses associated with construction contracts in accordance
with the percentage of completion method defined in IAS 11.
The percentage of completion is determined by comparing costs incurred at the period end with total estimated costs
under the contract. Costs incurred comprise costs directly attributable to the contract and borrowing costs incurred up
to completion of the work. However, prospection costs, costs incurred prior to contract signature, and administrative
and selling costs are expensed in the period incurred and do not therefore contribute to contract completion.
Where total contract costs exceed total contract revenue, the Group recognizes a loss to completion as an expense of
the period, irrespective of the stage of completion and based on a best estimate of forecast results including, where
appropriate, rights to additional income or compensation, where they are probable and can be determined reliably.
Provisions for losses to completion are recorded as liabilities in the Consolidated Statement of Financial Position.
The amount of costs incurred, plus profits and less losses recognized and intermediary billings is determined on an
individual contract basis. In accordance with IAS 11, where positive, this amount is recognized in assets in "amounts
due from customers for construction contract work" (in “Other operating receivables”). Where negative, it is
recognized in liabilities in "amounts due to customers for construction contract work" (in “Other operating payables”).
Partial payments received under construction contracts before the corresponding work has been performed, are
recognized in liabilities in the Consolidated Statement of Financial Position under “advances and down-payments
received”.
At each period end, a contract statement compares the amount of costs incurred, plus profits (including any provisions
for losses to completion) with intermediary billings: “Construction contracts in progress / Assets” therefore represents
contracts for which the costs incurred and profits recognized exceed amounts billed.
OPERATING ACTIVITIES
50 VEOLIA ENVIRONNEMENT / CONSOLIDATED FINANCIAL STATEMENTS - DECEMBER 31, 2017
Note 5
(€ million) As of December
31, 2016 As of December
31, 2017
Construction contracts in progress / Assets (A) 291.8 187.3
Construction contracts in progress / Liabilities (B) 88.3 57.0
Construction contracts in progress / Net (A) – (B) 203.5 130.3
Costs incurred plus income and losses recognized to date (C) 2,876.3 2,824.3
Amounts billed (D) -2,672.8 -2,694.0
Construction contracts in progress / Net (C) + (D) 203.5 130.3
Customer advances 48.3 52.9
5.7 Management of supply risks
As part of supply management and cost optimization measures or to hedge future production, certain Group
subsidiaries may be required, depending on their activities, to contract forward purchases or sales of commodities and
set-up derivatives to fix the cost of commodities supply or the selling price of commodities produced (electricity).
Commodity risks are described in Note 8.3.1.3.
5.8 Commitments relating to operating activities
5.8.1 Commitments given
Commitments given relating to operating activities comprise operating guarantees and purchase commitments.
Operational or operating guarantees encompass all commitments not relating to the financing of operations, required
in respect of contracts or markets and generally given in respect of the operations and activities of Group companies.
Such guarantees include bid bonds accompanying tender offers, advance payment bonds and completion or
performance bonds given on the signature of contracts or concession arrangements.
The main categories of commitments include:
Commitments related to site rehabilitation:
Pursuant to environmental texts and legislation concerning the operation of landfill sites, the Group is obliged to
provide financial guarantees to local authorities/government agencies. These guarantees notably encompass the
rehabilitation and supervision of the site during 30 years or more, depending on national legislation (currently 60
years in the United Kingdom), following its operation.
In this context, performance bonds and letters of credit are issued to local authorities and other public bodies.
Depending on the contract, these guarantees cover the costs necessary for the supervision and rehabilitation of all
or part of the site.
OPERATING ACTIVITIES
CONSOLIDATED FINANCIAL STATEMENTS - DECEMBER 31, 2017 / VEOLIA ENVIRONNEMENT 51
Note 5
These guarantees are quantified in accordance with legal or contractually-defined procedures. These guarantees,
which are given in their total amount from the start of operations, expire at the end of the commitment
(termination of rehabilitation work and site supervision).
Therefore, the amount of our commitment for the rehabilitation and supervision of landfill sites is in general
different from the amount of the provision recorded in the Group accounts (see Note 10). Provisions calculated by
the Group are based on different valuations (based on internal policies regarding site security and designed for
optimal environmental protection), which take into account the progressive nature of the obligation: operation of
the landfill sites results in progressive damage to the site and, as such, a related liability is recognized as the
facility is operated (see Note 10).
If the amount of the commitment is less than the provision at the balance sheet date, an off-balance sheet
commitment is not disclosed. Conversely, if the amount of the commitment is greater than the provision, an off-
balance sheet commitment is disclosed in the amount not provided.
Commitments related to engineering and construction activities:
Commitments relating to engineering and construction activities primarily comprise commitments given and
received in respect of Veolia Water Technologies construction activities. Commitments given in respect of the five
main contracts account for approximately 56% of Veolia Water Technologies total commitments.
Commitments relating to concession arrangements:
Pursuant to public service contracts with a public entity, the Group may be called on/obliged to invest in
infrastructures that will then be operated and remunerated in accordance with contractual terms and conditions.
The contractual commitment may concern both the financing of installations and infrastructures to be used in
operations and also the maintenance and replacement of infrastructures necessary to operations.
Expenditure relating to the replacement or rehabilitation of installations is monitored and recognized through any
timing differences between the total contractual commitment over the contract term and its realization, in
accordance with IAS 37 on Provisions.
Expenditure relating to the construction, maintenance and restoration of concession assets is reviewed with respect
to IFRIC 12 and detailed in Note 5.5.
Firm commodity purchase and sale commitments:
As part of supply management and cost optimization, certain Group subsidiaries may be required, depending on
their activities, to set-up derivatives to fix the cost of commodity supplies where the contracts do not offer
appropriate protection or contract forward purchases or sales of commodities.
Firm commodity purchase commitments, excluding derivatives, mainly concern:
Gas in Energy activities (mainly in Central Europe) and Water activities. Most commitments mature in less than 5
years;
Electricity in Energy activities (purchase commitments mature in less than 3 years due to poor liquidity in the
electricity market for longer maturities);
Biomass and coal in Energy activities.
In parallel, firm electricity sales contracts, excluding derivatives, are entered into to secure selling prices over a period
of less than 3 years. These commitments concern production activities exposed to the electricity wholesale market and
primarily Waste activities in the UK (electricity produced by waste incineration) and Energy activities in Central Europe.
Off-balance sheet commitments given break down as follows:
OPERATING ACTIVITIES
52 VEOLIA ENVIRONNEMENT / CONSOLIDATED FINANCIAL STATEMENTS - DECEMBER 31, 2017
Note 5
As of December 31, 2016
As of December 31, 2017
Maturing in
Less than 1 year
1 to 5 years
More than 5 years
Operational guarantees including performance bonds 9,591.0 7,941.9 3,943.9 2,410.9 1,587.1
Purchase commitments 153.7 146.4 124.8 17.1 4.5
TOTAL COMMITMENTS RELATING TO OPERATING ACTIVITIES 9,744.7 8,088.3 4,068.7 2,428.0 1,591.6
Commitments given break down by operating segment as follows:
As of December 31, 2016
As of December 31, 2017
France 216.4 221.1
Europe excluding France 1,246.5 1,296.9
Rest of the World 1,573.5 1,489.2
Global businesses 3,881.8 2,488.0
Other 2,826.5 2,593.1
TOTAL COMMITMENTS RELATING TO OPERATING ACTIVITIES 9,744.7 8,088.3
The decrease in commitments given between December 31, 2016 and December 31, 2017 (-€1,656.4 million) is
mainly due to the lifting of performance bonds given by Veolia Water Technologies on the Al Hidd
(-€315.0 million) and Fujeirah (-€682.0 million) projects.
In addition to the commitments given quantified above, Veolia has also granted commitments of an unlimited amount
in respect of completion or performance bonds and a waste construction and treatment contract in Hong Kong, in the
Waste and Water businesses.
These commitments are limited to the duration of the related contracts and were approved in advance by the Board of
Directors of Veolia Environnement.
Total commitments given in respect of construction activities of Veolia Water Technologies amount to €2,039.0 million
as of December 31, 2016, compared with €3,425.4 million as of December 31, 2016.
Commitments given in respect of joint ventures (at 100%) total €593.3 million as of December 31, 2017 compared
with €705.1 million as of December 31, 2016 and mainly consist of performance bonds given to Al Wathba VB in the
amount of €392.6 million and to Glen Water Holding in the amount of €81.1 million.
5.8.2 Commitments received
These commitments mainly consist of commitments received from our partners in respect of construction contracts.
They total €1,035.7 million as of December 31, 2017, compared with €1,121.7 million as of December 31, 2016.
Total commitments received in respect of Veolia Water Technologies activities amount to €518.6 million as of
December 31, 2017, compared with €581.1 million as of December 31, 2016.
PERSONNEL COSTS AND EMPLOYEE BENEFITS
CONSOLIDATED FINANCIAL STATEMENTS - DECEMBER 31, 2017 / VEOLIA ENVIRONNEMENT 53
Note 6
NOTE 6 PERSONNEL COSTS AND EMPLOYEE BENEFITS
6.1 Personnel costs and employee numbers
Personnel costs break down as follows:
(€ million) 2016 represented 2017
Employee costs -6,952.9 -7,000.8
Profit-sharing and incentive schemes -111.5 -118.4
Share-based compensation (IFRS2) (*) -4.7 -9.0
PERSONNEL COSTS -7,069.1 -7,128.2
(*) As disclosed in note 6.2, share-based compensation concerns the Management Incentive Plan and the Employee Savings Plan.
Average consolidated employees* break down as follows:
By operating segment 2016 2017
France 30,575 30,779
Europe excluding France 52,786 57,598
Rest of the World 42,516 46,862
Global businesses 28,350 27,252
Other 1,998 1,894
CONSOLIDATED EMPLOYEES * 156,225 164,385
By company 2016 2017
Fully-consolidated companies 156,204 164,325 Joint operations 21 60 CONSOLIDATED EMPLOYEES * 156,225 164,385
* Consolidated employees, excluding employees of equity-accounted subsidiaries.
6.2 Share-based compensation
6.2.1 Accounting principles
Pursuant to IFRS 2, Share-based Payment, an expense is recorded in respect of share purchase or subscription plans
and other share-based compensation granted by the Group to its employees. When the plans are equity settled, the
fair value of these plans at grant date is expensed in the Consolidated Income Statement and recognized directly in
equity in the period in which the benefit vests and the service is rendered.
PERSONNEL COSTS AND EMPLOYEE BENEFITS
54 VEOLIA ENVIRONNEMENT / CONSOLIDATED FINANCIAL STATEMENTS - DECEMBER 31, 2017
Note 6
The fair value of instruments granted is calculated using the Black and Scholes model, taking into account their
expected life, the risk-free interest rate, expected volatility, determined based on observed volatility in the past and
dividends expected on the shares.
With regard to Group Savings Plans (GSP), the Veolia Group applies CNC recommendations (press release of
December 21, 2004 in respect of Company Savings Plans and complement of February 2, 2007).
The GSP compensation expense corresponds to the difference between the subscription price and the average share
price at each subscription date and to the Company’s contribution to subscribers. It also takes account of the
requirement to hold shares for five years. The discount for non-transferability is calculated as the difference in the
value between a five-year forward sale of shares and the spot purchase of the same number of shares, financed by a
loan. The whole plan expense is recognized at the end of the subscription period.
6.2.2 Veolia Environnement share purchase and subscription option plans
Veolia Environnement has implemented several standard fixed share purchase and subscription option plans, as well
as a variable plan for management.
Current option plans at the end of 2016 were as follows:
N° 8
2010
Grant date 9/28/2010
Number of options granted 2,462,800
Number of options not exercised 0 (*)
Plan term 8 years
Vesting conditions 4 years 'service plus performance
conditions
Vesting method After 4 years
Trike price (in euros) 22.50
* Given the failure to achieve performance criteria, validated by the Board of Directors' meeting of March 14, 2013. In the event of a public offer for the Company's shares, 2,127,400 options would become available for exercise.
In 2010, Veolia Environnement granted 2,462,800 share options to members of the Executive Committee (excluding
the Chief Executive Officer) and three employee groups. The first group comprised Group key management, including
members of the Executive Committee. The second group comprised other Group management members and the third
one included high-performing executive and non-executive employees.
The options granted under the plan could only be exercised after a period of four years commencing the grant date,
that is from September 29, 2014, provided the Group return on capital employed as of December 31, 2012 was at
least equal to 8.4 % (application of this performance criteria varies according to the employee category).
As this condition was not satisfied at the 2012 year-end, the Board of Directors’ meeting of March 14, 2013 duly noted
that the options could not be exercised. In the event of a public offer for the Company’s shares, 2,127,400 options
would become available for exercise.
PERSONNEL COSTS AND EMPLOYEE BENEFITS
CONSOLIDATED FINANCIAL STATEMENTS - DECEMBER 31, 2017 / VEOLIA ENVIRONNEMENT 55
Note 6
6.2.3 Employee savings plans
Veolia Environnement has set-up standard and leveraged savings plans which enable a large number of employees of
Veolia Environnement and its subsidiaries to subscribe for Veolia Environnement shares. Shares subscribed by
employees under these plans are subject to certain restrictions regarding their sale or transfer by employees.
No savings plans were set up in 2016 or 2017.
6.2.4 Management Incentive Plan
In October 2014, the Group introduced a long-term incentive plan, the “Management Incentive Plan” (MIP), for the
Group's top executives (including the Chief Executive Officer and Executive Committee members).
This plan is based on a joint investment approach with a personal investment by the beneficiary in the company’s
shares, accompanied by the grant, subject to performance conditions, of an “additional” share bonus financed by the
Group (primarily through the grant of treasury shares held by the Company).
The initial investment by the beneficiary gives rise to a limited guarantee representing 80% of the value of the
investment (excluding any taxes or duties payable by the beneficiary), except for the Chief Executive Officer and
Executive Committee members.
The share bonus, granted in three tranches, is tied to the achievement of performance criteria (increase in the share
price compared with the acquisition price on initial investment and current net income attributable to owners of the
Company per share) determined at three dates (March 2016, March 2017 and March 2018) relating to the publication
of the Company’s 2015, 2016 and 2017 annual accounts. The three tranches do not vest until expiry of the plan in
April 2018, subject to the confirmation at this date of the presence of the beneficiaries concerned and the retention by
them of the shares initially invested.
The estimated fair values of the instruments are €1.59, €1.86 and €2.01 for each of the three leveraged tranches.
These values were calculated using the Black and Scholes model based on the following underlying assumptions: share
price and strike price of €13.04, implicit volatility of 33.94%, expected annual yield of 5.37%, risk-free interest rate of
between 0.14% and 0.31% and exercise maturity of 3.5 years.
The 2015 and 2016 performance conditions were achieved. The 2017 performance condition was taken into account in
calculating the number of instruments and the compensation expense.
As of December 31, 2017, 400,479 shares are invested in this plan.
An IFRS 2 expense of €9.0 million is recognized in operating income in 2017.
6.3 Pension plans and other post-employment benefits
The following disclosures relate to the pension plans offered by fully consolidated entities.
6.3.1 Accounting principles
Veolia Environnement and its subsidiaries have several pension plans.
PERSONNEL COSTS AND EMPLOYEE BENEFITS
56 VEOLIA ENVIRONNEMENT / CONSOLIDATED FINANCIAL STATEMENTS - DECEMBER 31, 2017
Note 6
Defined contribution plans: plans under which the Group (or a Group entity) pays an agreed contribution to a
separate entity, relieving it of any liability for future payments.
These obligations are expensed in the Consolidated Income Statement when due.
Defined benefit plans: all plans which do not meet the definition of a defined contribution plan. The net obligations
of each Group entity are calculated for each plan based on an estimate of the amount employees will receive in
exchange for services rendered during the current and past periods. The amount of the obligation is discounted to
present value and the fair value of plan assets is deducted.
Where the calculation shows a plan surplus, the asset recognized is capped at the total of the discounted present value
of profits, in the form of future repayments or reductions in plan contributions. The plan surplus is recognized in non-
current financial assets.
Certain obligations of the Group or Group entities may enjoy a right to reimbursement, corresponding to a
commitment by a third party to repay in full or in part the expenses relating to these obligations. This right to
reimbursement is recognized in non-current financial assets.
The financing of defined benefit pension plans may lead the Group to make voluntary contributions to pension funds.
Where applicable, these voluntary contributions are presented in Net cash from operating activities in the Consolidated
Cash Flow Statement, in the same way as other employer contributions.
Employee obligations of the Group are calculated using the projected unit credit method. This method is based on the
probability of personnel remaining with companies in the Group until retirement, the foreseeable changes in future
compensation, and the appropriate discount rate. Specific discount rates are adopted for each monetary area. They
are determined based on the yield offered by bonds issued by leading companies (rated AA) or treasury bonds where
the market is not liquid, with maturities equivalent to the average term of the plans valued in the relevant region. This
results in the recognition of pension-related assets or provisions in the Consolidated Statement of Financial Position
and the recognition of the related net expenses.
Pursuant to IAS 19, Employee Benefits, actuarial gains and losses are recognized in other comprehensive income.
6.3.2 Description of plans
In accordance with the regulatory environment and collective agreements, the Group has established defined benefit
and defined contribution pension plans (companies or multi-employer) in favor of employees and other post-
employment benefits.
DEFINED CONTRIBUTION PLANS:
Supplemental pension defined contribution plans have been set up in certain subsidiaries. Expenses incurred by the
Group under these plans totaled €87 million in 2017 and €84 million in 2016.
DEFINED BENEFIT PLANS:
The tables in Note 6.3.3 present the obligations in respect of defined benefit pension plans and other post-employment
benefits.
The measurement of these obligations is reflected by the DBO (Defined Benefit Obligation). These future outflow
commitments may be partially or fully funded (“plan assets”).
The most significant obligations are located in the United Kingdom and France.
PERSONNEL COSTS AND EMPLOYEE BENEFITS
CONSOLIDATED FINANCIAL STATEMENTS - DECEMBER 31, 2017 / VEOLIA ENVIRONNEMENT 57
Note 6
United Kingdom
The defined benefit obligation in the United Kingdom is €1,112.6 million as of December 31, 2017 (compared with
€1,187.9 million as of December 2016) and is funded by plan assets of €1,073.3 million at this date (compared with
€1,069.2 million as of December 31, 2016). The increase in the defined benefit obligation is presented in the table
below in Note 6.3.3.
The average duration of these plans is approximately 18 years.
In the United Kingdom, defined benefit pension plans are mainly final salary plans. Most of these plans are closed to
new employees and the majority are also closed to the accrual of new rights. These plans are financed by employer
contributions, or even employee contributions paid to an independent pension fund (managed by a Trustee). Local
regulations ensure the independence of the pension funds, which has 9 members (including 5 employer
representatives, 3 representatives of active and retired employees and 1 independent member).
Plan rules authorize the employer to recover excess funds paid at the end of the plans.
These plans allow retirees to take part of the benefit as a lump-sum and the balance as a pension. In the case of a
pension, the related risk is tied to the longevity of beneficiaries.
France
In France, the defined benefit obligation for all plans totaled €409.4 million as of December 31, 2017 (€412.5 million
as of December 31, 2016) and is funded by plan assets of €89.6 million at this date (€94.9 million as of December 31,
2016). The increase in the defined benefit obligation is presented in the table below in Note 6.3.3.
Nearly 80% of the obligation relates to retirement indemnities (legally required payments) paid in a lump sum. These
indemnities represent a number of months’ salary based on Group seniority and are legally required by the applicable
collective-bargaining agreement to be paid on an employee’s retirement. A portion of these obligations is covered by
insurance contracts, but this funding is at the discretion of the employer. The average duration of these plans is
approximately 12 years.
The risk associated with this type of plan is legislative risk, in terms of potential adjustments to redundancy payments
to which retirement indemnities are linked in certain collective bargaining agreements. Furthermore, the renegotiation
of collective bargaining agreements could also generate adjustments to indemnities granted.
MULTI-EMPLOYER PLANS
Under collective agreements, some Group companies participate in multi-employer defined benefit pension plans.
However, these plans are unable to provide a consistent and reliable basis for the allocation of the obligation, assets
and costs between the different participating entities. They are therefore recorded as defined contribution plans in
accordance with IAS 19. The multi-employer plans concern approximately 1,700 employees in 2017 and are mainly
located in Germany, where such plans are generally funded by redistribution.
The corresponding expense recorded in the Consolidated Income Statement is equal to annual contributions and totals
approximately €6 million in 2017, stable as compared with 2016.
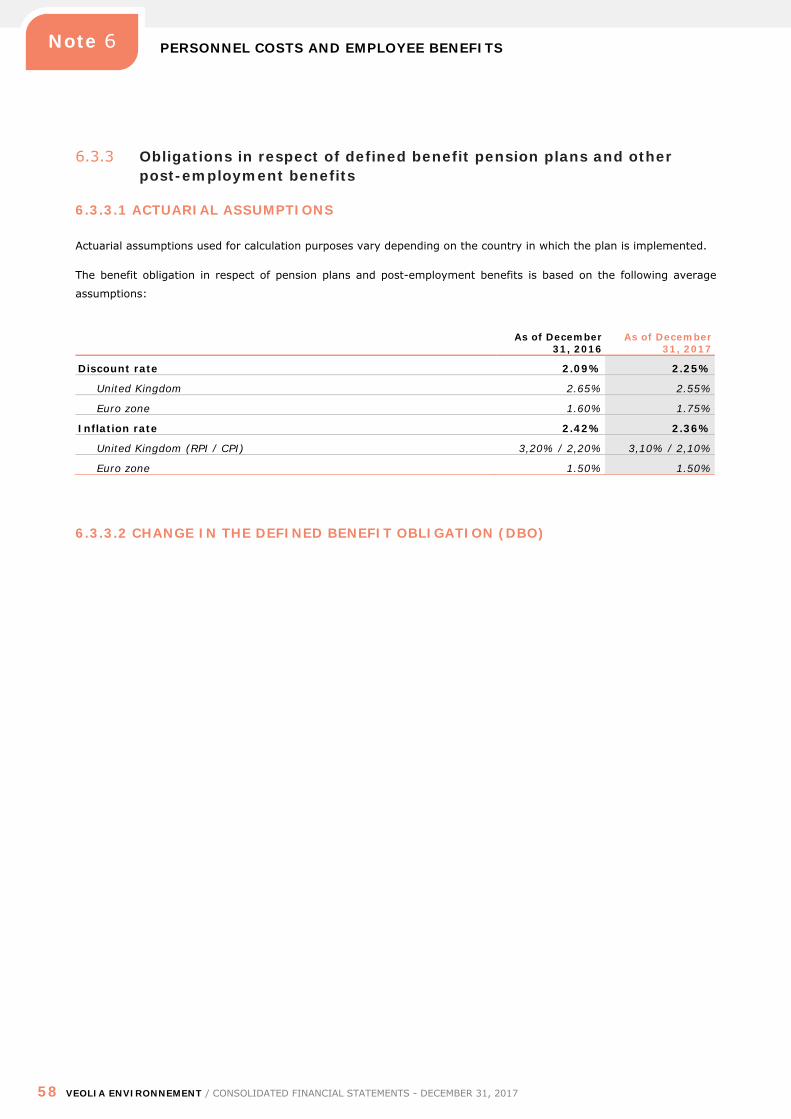
PERSONNEL COSTS AND EMPLOYEE BENEFITS
58 VEOLIA ENVIRONNEMENT / CONSOLIDATED FINANCIAL STATEMENTS - DECEMBER 31, 2017
Note 6
6.3.3 Obligations in respect of defined benefit pension plans and other post-employment benefits
6.3.3.1 ACTUARIAL ASSUMPTIONS
Actuarial assumptions used for calculation purposes vary depending on the country in which the plan is implemented.
The benefit obligation in respect of pension plans and post-employment benefits is based on the following average
assumptions:
As of December 31, 2016
As of December 31, 2017
Discount rate 2.09% 2.25%
United Kingdom 2.65% 2.55%
Euro zone 1.60% 1.75%
Inflation rate 2.42% 2.36%
United Kingdom (RPI / CPI) 3,20% / 2,20% 3,10% / 2,10%
Euro zone 1.50% 1.50%
6.3.3.2 CHANGE IN THE DEFINED BENEFIT OBLIGATION (DBO)
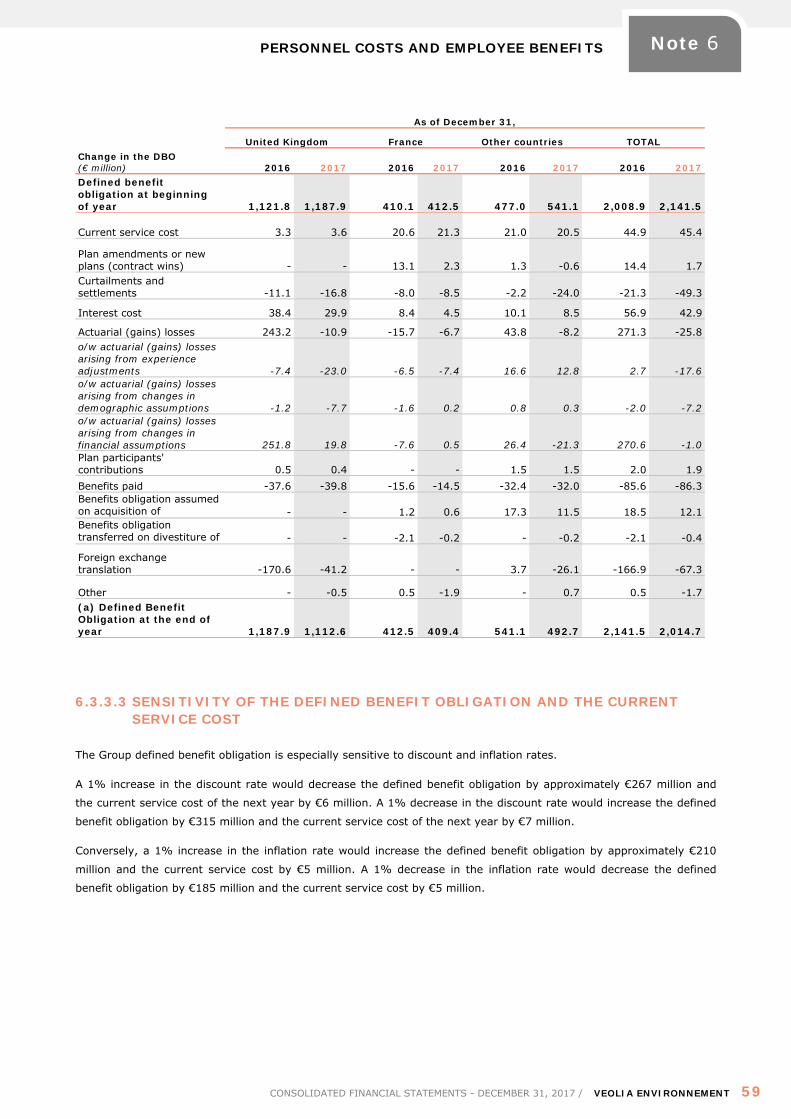
PERSONNEL COSTS AND EMPLOYEE BENEFITS
CONSOLIDATED FINANCIAL STATEMENTS - DECEMBER 31, 2017 / VEOLIA ENVIRONNEMENT 59
Note 6
As of December 31,
United Kingdom France Other countries TOTAL Change in the DBO (€ million) 2016 2017 2016 2017 2016 2017 2016 2017 Defined benefit obligation at beginning of year 1,121.8 1,187.9 410.1 412.5 477.0 541.1 2,008.9 2,141.5
Current service cost 3.3 3.6 20.6 21.3 21.0 20.5 44.9 45.4
Plan amendments or new plans (contract wins) - - 13.1 2.3 1.3 -0.6 14.4 1.7 Curtailments and settlements -11.1 -16.8 -8.0 -8.5 -2.2 -24.0 -21.3 -49.3
Interest cost 38.4 29.9 8.4 4.5 10.1 8.5 56.9 42.9
Actuarial (gains) losses 243.2 -10.9 -15.7 -6.7 43.8 -8.2 271.3 -25.8 o/w actuarial (gains) losses arising from experience adjustments -7.4 -23.0 -6.5 -7.4 16.6 12.8 2.7 -17.6 o/w actuarial (gains) losses arising from changes in demographic assumptions -1.2 -7.7 -1.6 0.2 0.8 0.3 -2.0 -7.2 o/w actuarial (gains) losses arising from changes in financial assumptions 251.8 19.8 -7.6 0.5 26.4 -21.3 270.6 -1.0 Plan participants' contributions 0.5 0.4 - - 1.5 1.5 2.0 1.9 Benefits paid -37.6 -39.8 -15.6 -14.5 -32.4 -32.0 -85.6 -86.3 Benefits obligation assumed on acquisition of - - 1.2 0.6 17.3 11.5 18.5 12.1 Benefits obligation transferred on divestiture of - - -2.1 -0.2 - -0.2 -2.1 -0.4
Foreign exchange translation -170.6 -41.2 - - 3.7 -26.1 -166.9 -67.3
Other - -0.5 0.5 -1.9 - 0.7 0.5 -1.7 (a) Defined Benefit Obligation at the end of year 1,187.9 1,112.6 412.5 409.4 541.1 492.7 2,141.5 2,014.7
6.3.3.3 SENSITIVITY OF THE DEFINED BENEFIT OBLIGATION AND THE CURRENT SERVICE COST
The Group defined benefit obligation is especially sensitive to discount and inflation rates.
A 1% increase in the discount rate would decrease the defined benefit obligation by approximately €267 million and
the current service cost of the next year by €6 million. A 1% decrease in the discount rate would increase the defined
benefit obligation by €315 million and the current service cost of the next year by €7 million.
Conversely, a 1% increase in the inflation rate would increase the defined benefit obligation by approximately €210
million and the current service cost by €5 million. A 1% decrease in the inflation rate would decrease the defined
benefit obligation by €185 million and the current service cost by €5 million.
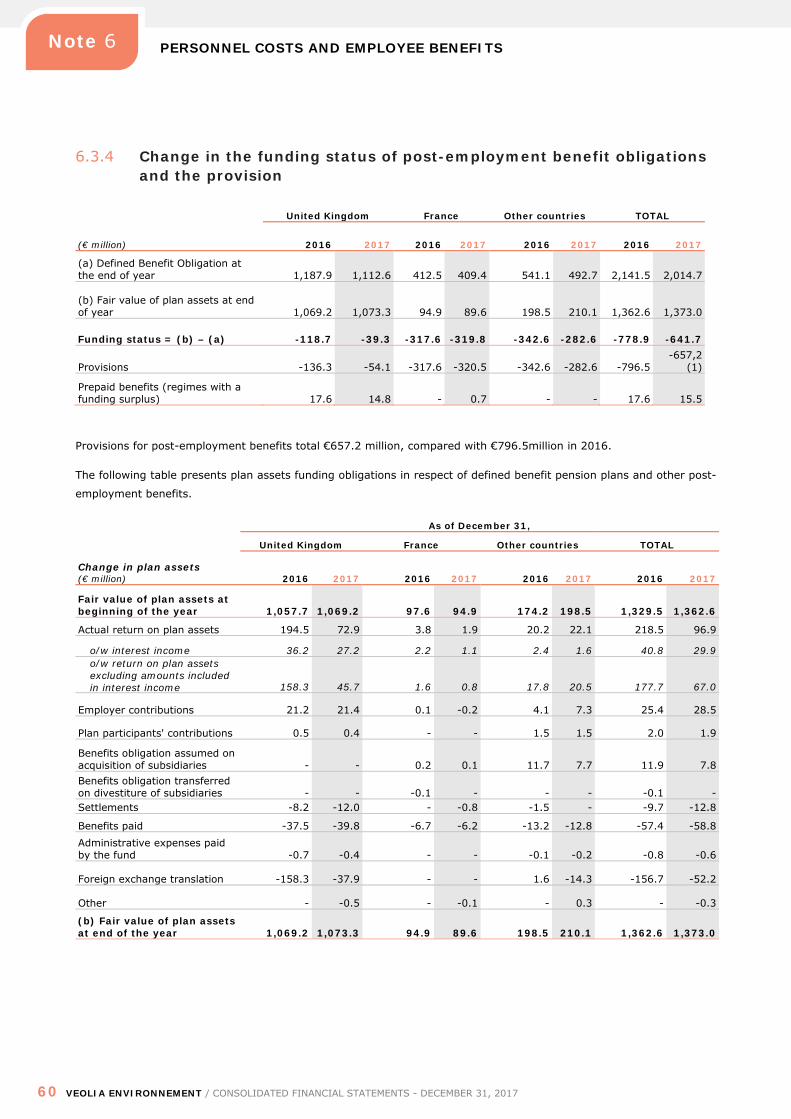
PERSONNEL COSTS AND EMPLOYEE BENEFITS
60 VEOLIA ENVIRONNEMENT / CONSOLIDATED FINANCIAL STATEMENTS - DECEMBER 31, 2017
Note 6
6.3.4 Change in the funding status of post-employment benefit obligations and the provision
United Kingdom France Other countries TOTAL
(€ million) 2016 2017 2016 2017 2016 2017 2016 2017
(a) Defined Benefit Obligation at the end of year 1,187.9 1,112.6 412.5 409.4 541.1 492.7 2,141.5 2,014.7
(b) Fair value of plan assets at end of year 1,069.2 1,073.3 94.9 89.6 198.5 210.1 1,362.6 1,373.0
Funding status = (b) – (a) -118.7 -39.3 -317.6 -319.8 -342.6 -282.6 -778.9 -641.7
Provisions -136.3 -54.1 -317.6 -320.5 -342.6 -282.6 -796.5 -657,2
(1)
Prepaid benefits (regimes with a funding surplus) 17.6 14.8 - 0.7 - - 17.6 15.5
Provisions for post-employment benefits total €657.2 million, compared with €796.5million in 2016.
The following table presents plan assets funding obligations in respect of defined benefit pension plans and other post-
employment benefits.
As of December 31, United Kingdom France Other countries TOTAL
Change in plan assets (€ million) 2016 2017 2016 2017 2016 2017 2016 2017
Fair value of plan assets at beginning of the year 1,057.7 1,069.2 97.6 94.9 174.2 198.5 1,329.5 1,362.6
Actual return on plan assets 194.5 72.9 3.8 1.9 20.2 22.1 218.5 96.9
o/w interest income 36.2 27.2 2.2 1.1 2.4 1.6 40.8 29.9 o/w return on plan assets excluding amounts included in interest income 158.3 45.7 1.6 0.8 17.8 20.5 177.7 67.0
Employer contributions 21.2 21.4 0.1 -0.2 4.1 7.3 25.4 28.5
Plan participants' contributions 0.5 0.4 - - 1.5 1.5 2.0 1.9
Benefits obligation assumed on acquisition of subsidiaries - - 0.2 0.1 11.7 7.7 11.9 7.8 Benefits obligation transferred on divestiture of subsidiaries - - -0.1 - - - -0.1 - Settlements -8.2 -12.0 - -0.8 -1.5 - -9.7 -12.8
Benefits paid -37.5 -39.8 -6.7 -6.2 -13.2 -12.8 -57.4 -58.8
Administrative expenses paid by the fund -0.7 -0.4 - - -0.1 -0.2 -0.8 -0.6
Foreign exchange translation -158.3 -37.9 - - 1.6 -14.3 -156.7 -52.2
Other - -0.5 - -0.1 - 0.3 - -0.3
(b) Fair value of plan assets at end of the year 1,069.2 1,073.3 94.9 89.6 198.5 210.1 1,362.6 1,373.0
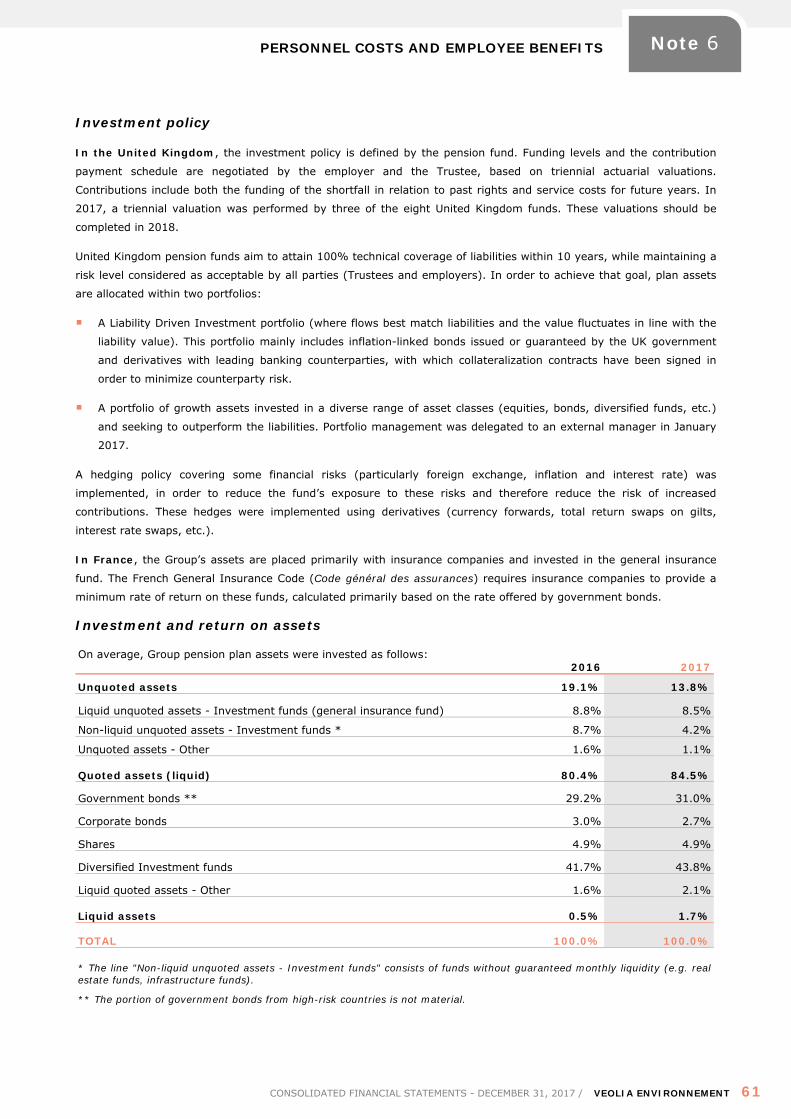
PERSONNEL COSTS AND EMPLOYEE BENEFITS
CONSOLIDATED FINANCIAL STATEMENTS - DECEMBER 31, 2017 / VEOLIA ENVIRONNEMENT 61
Note 6
Investment policy
In the United Kingdom, the investment policy is defined by the pension fund. Funding levels and the contribution
payment schedule are negotiated by the employer and the Trustee, based on triennial actuarial valuations.
Contributions include both the funding of the shortfall in relation to past rights and service costs for future years. In
2017, a triennial valuation was performed by three of the eight United Kingdom funds. These valuations should be
completed in 2018.
United Kingdom pension funds aim to attain 100% technical coverage of liabilities within 10 years, while maintaining a
risk level considered as acceptable by all parties (Trustees and employers). In order to achieve that goal, plan assets
are allocated within two portfolios:
A Liability Driven Investment portfolio (where flows best match liabilities and the value fluctuates in line with the
liability value). This portfolio mainly includes inflation-linked bonds issued or guaranteed by the UK government
and derivatives with leading banking counterparties, with which collateralization contracts have been signed in
order to minimize counterparty risk.
A portfolio of growth assets invested in a diverse range of asset classes (equities, bonds, diversified funds, etc.)
and seeking to outperform the liabilities. Portfolio management was delegated to an external manager in January
2017.
A hedging policy covering some financial risks (particularly foreign exchange, inflation and interest rate) was
implemented, in order to reduce the fund’s exposure to these risks and therefore reduce the risk of increased
contributions. These hedges were implemented using derivatives (currency forwards, total return swaps on gilts,
interest rate swaps, etc.).
In France, the Group’s assets are placed primarily with insurance companies and invested in the general insurance
fund. The French General Insurance Code (Code général des assurances) requires insurance companies to provide a
minimum rate of return on these funds, calculated primarily based on the rate offered by government bonds.
Investment and return on assets
On average, Group pension plan assets were invested as follows: 2016 2017
Unquoted assets 19.1% 13.8%
Liquid unquoted assets - Investment funds (general insurance fund) 8.8% 8.5%
Non-liquid unquoted assets - Investment funds * 8.7% 4.2%
Unquoted assets - Other 1.6% 1.1%
Quoted assets (liquid) 80.4% 84.5%
Government bonds ** 29.2% 31.0%
Corporate bonds 3.0% 2.7%
Shares 4.9% 4.9%
Diversified Investment funds 41.7% 43.8%
Liquid quoted assets - Other 1.6% 2.1%
Liquid assets 0.5% 1.7%
TOTAL 100.0% 100.0%
* The line "Non-liquid unquoted assets - Investment funds" consists of funds without guaranteed monthly liquidity (e.g. real estate funds, infrastructure funds).
** The portion of government bonds from high-risk countries is not material.
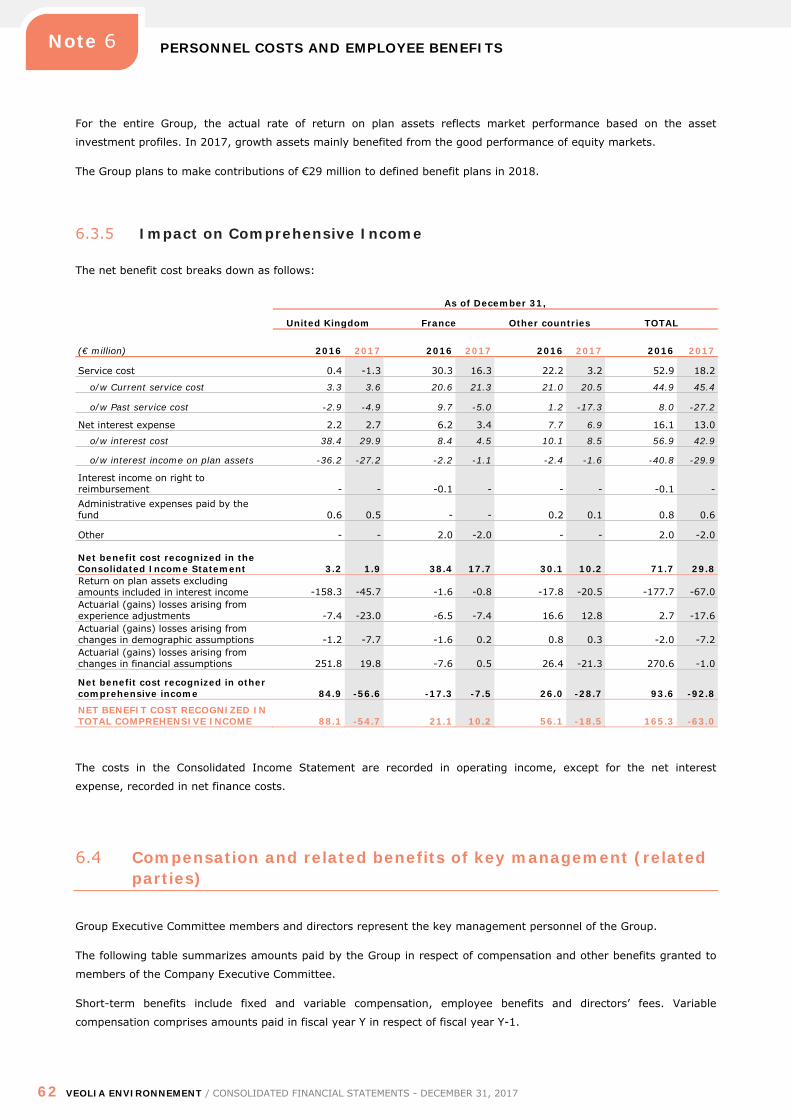
PERSONNEL COSTS AND EMPLOYEE BENEFITS
62 VEOLIA ENVIRONNEMENT / CONSOLIDATED FINANCIAL STATEMENTS - DECEMBER 31, 2017
Note 6
For the entire Group, the actual rate of return on plan assets reflects market performance based on the asset
investment profiles. In 2017, growth assets mainly benefited from the good performance of equity markets.
The Group plans to make contributions of €29 million to defined benefit plans in 2018.
6.3.5 Impact on Comprehensive Income
The net benefit cost breaks down as follows:
As of December 31,
United Kingdom France Other countries TOTAL
(€ million) 2016 2017 2016 2017 2016 2017 2016 2017
Service cost 0.4 -1.3 30.3 16.3 22.2 3.2 52.9 18.2
o/w Current service cost 3.3 3.6 20.6 21.3 21.0 20.5 44.9 45.4
o/w Past service cost -2.9 -4.9 9.7 -5.0 1.2 -17.3 8.0 -27.2
Net interest expense 2.2 2.7 6.2 3.4 7.7 6.9 16.1 13.0
o/w interest cost 38.4 29.9 8.4 4.5 10.1 8.5 56.9 42.9
o/w interest income on plan assets -36.2 -27.2 -2.2 -1.1 -2.4 -1.6 -40.8 -29.9
Interest income on right to reimbursement - - -0.1 - - - -0.1 - Administrative expenses paid by the fund 0.6 0.5 - - 0.2 0.1 0.8 0.6
Other - - 2.0 -2.0 - - 2.0 -2.0
Net benefit cost recognized in the Consolidated Income Statement 3.2 1.9 38.4 17.7 30.1 10.2 71.7 29.8 Return on plan assets excluding amounts included in interest income -158.3 -45.7 -1.6 -0.8 -17.8 -20.5 -177.7 -67.0 Actuarial (gains) losses arising from experience adjustments -7.4 -23.0 -6.5 -7.4 16.6 12.8 2.7 -17.6 Actuarial (gains) losses arising from changes in demographic assumptions -1.2 -7.7 -1.6 0.2 0.8 0.3 -2.0 -7.2 Actuarial (gains) losses arising from changes in financial assumptions 251.8 19.8 -7.6 0.5 26.4 -21.3 270.6 -1.0
Net benefit cost recognized in other comprehensive income 84.9 -56.6 -17.3 -7.5 26.0 -28.7 93.6 -92.8
NET BENEFIT COST RECOGNIZED IN TOTAL COMPREHENSIVE INCOME 88.1 -54.7 21.1 10.2 56.1 -18.5 165.3 -63.0
The costs in the Consolidated Income Statement are recorded in operating income, except for the net interest
expense, recorded in net finance costs.
6.4 Compensation and related benefits of key management (related parties)
Group Executive Committee members and directors represent the key management personnel of the Group.
The following table summarizes amounts paid by the Group in respect of compensation and other benefits granted to
members of the Company Executive Committee.
Short-term benefits include fixed and variable compensation, employee benefits and directors’ fees. Variable
compensation comprises amounts paid in fiscal year Y in respect of fiscal year Y-1.
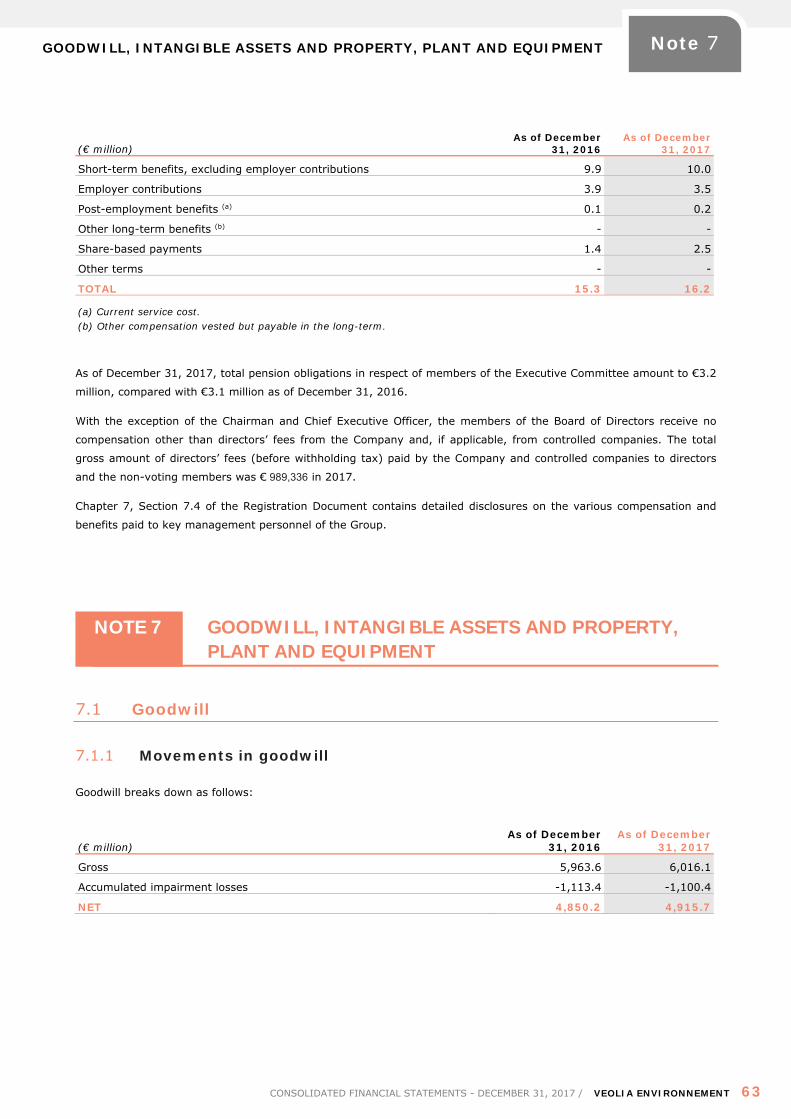
GOODWILL, INTANGIBLE ASSETS AND PROPERTY, PLANT AND EQUIPMENT
CONSOLIDATED FINANCIAL STATEMENTS - DECEMBER 31, 2017 / VEOLIA ENVIRONNEMENT 63
Note 7
(€ million) As of December
31, 2016 As of December
31, 2017
Short-term benefits, excluding employer contributions 9.9 10.0
Employer contributions 3.9 3.5
Post-employment benefits (a) 0.1 0.2
Other long-term benefits (b) - -
Share-based payments 1.4 2.5
Other terms - -
TOTAL 15.3 16.2
(a) Current service cost. (b) Other compensation vested but payable in the long-term.
As of December 31, 2017, total pension obligations in respect of members of the Executive Committee amount to €3.2
million, compared with €3.1 million as of December 31, 2016.
With the exception of the Chairman and Chief Executive Officer, the members of the Board of Directors receive no
compensation other than directors’ fees from the Company and, if applicable, from controlled companies. The total
gross amount of directors’ fees (before withholding tax) paid by the Company and controlled companies to directors
and the non-voting members was € 989,336 in 2017.
Chapter 7, Section 7.4 of the Registration Document contains detailed disclosures on the various compensation and
benefits paid to key management personnel of the Group.
NOTE 7 GOODWILL, INTANGIBLE ASSETS AND PROPERTY, PLANT AND EQUIPMENT
7.1 Goodwill
7.1.1 Movements in goodwill
Goodwill breaks down as follows:
(€ million) As of December
31, 2016 As of December
31, 2017
Gross 5,963.6 6,016.1
Accumulated impairment losses -1,113.4 -1,100.4
NET 4,850.2 4,915.7
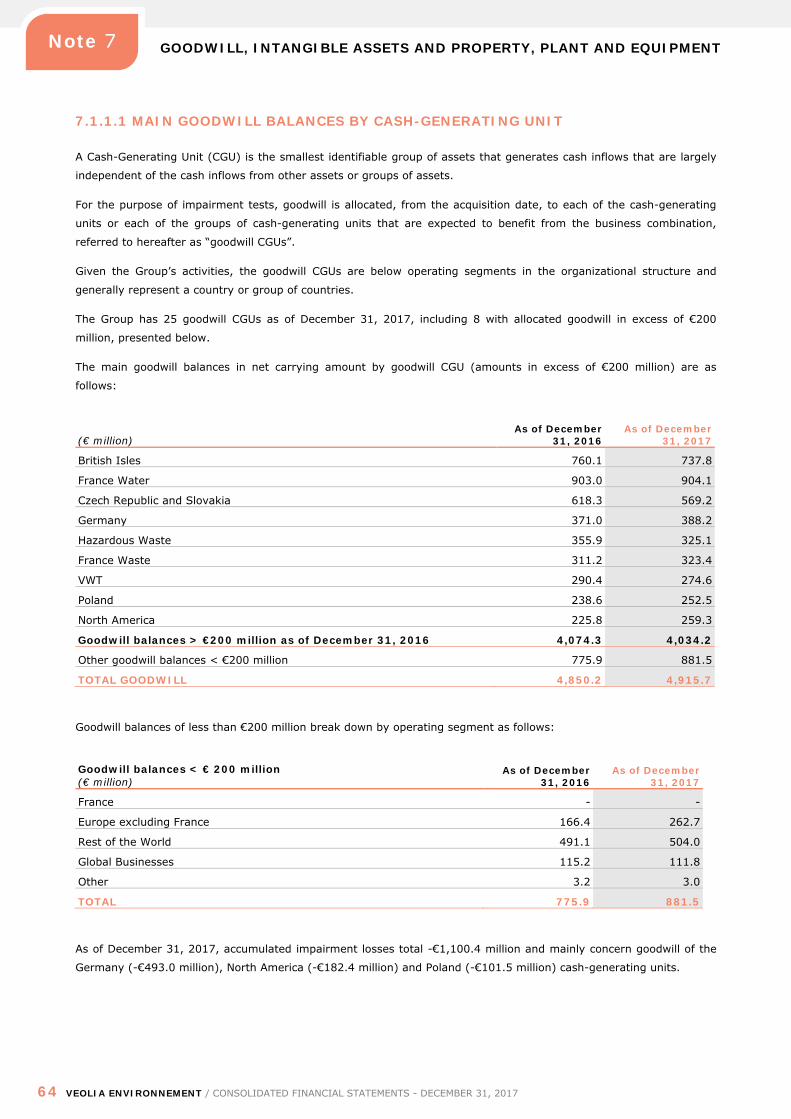
GOODWILL, INTANGIBLE ASSETS AND PROPERTY, PLANT AND EQUIPMENT
64 VEOLIA ENVIRONNEMENT / CONSOLIDATED FINANCIAL STATEMENTS - DECEMBER 31, 2017
Note 7
7.1.1.1 MAIN GOODWILL BALANCES BY CASH-GENERATING UNIT
A Cash-Generating Unit (CGU) is the smallest identifiable group of assets that generates cash inflows that are largely
independent of the cash inflows from other assets or groups of assets.
For the purpose of impairment tests, goodwill is allocated, from the acquisition date, to each of the cash-generating
units or each of the groups of cash-generating units that are expected to benefit from the business combination,
referred to hereafter as “goodwill CGUs”.
Given the Group’s activities, the goodwill CGUs are below operating segments in the organizational structure and
generally represent a country or group of countries.
The Group has 25 goodwill CGUs as of December 31, 2017, including 8 with allocated goodwill in excess of €200
million, presented below.
The main goodwill balances in net carrying amount by goodwill CGU (amounts in excess of €200 million) are as
follows:
(€ million) As of December
31, 2016 As of December
31, 2017
British Isles 760.1 737.8
France Water 903.0 904.1
Czech Republic and Slovakia 618.3 569.2
Germany 371.0 388.2
Hazardous Waste 355.9 325.1
France Waste 311.2 323.4
VWT 290.4 274.6
Poland 238.6 252.5
North America 225.8 259.3
Goodwill balances > €200 million as of December 31, 2016 4,074.3 4,034.2
Other goodwill balances < €200 million 775.9 881.5
TOTAL GOODWILL 4,850.2 4,915.7
Goodwill balances of less than €200 million break down by operating segment as follows:
Goodwill balances < € 200 million (€ million)
As of December 31, 2016
As of December 31, 2017
France - -
Europe excluding France 166.4 262.7
Rest of the World 491.1 504.0
Global Businesses 115.2 111.8
Other 3.2 3.0
TOTAL 775.9 881.5
As of December 31, 2017, accumulated impairment losses total -€1,100.4 million and mainly concern goodwill of the
Germany (-€493.0 million), North America (-€182.4 million) and Poland (-€101.5 million) cash-generating units.
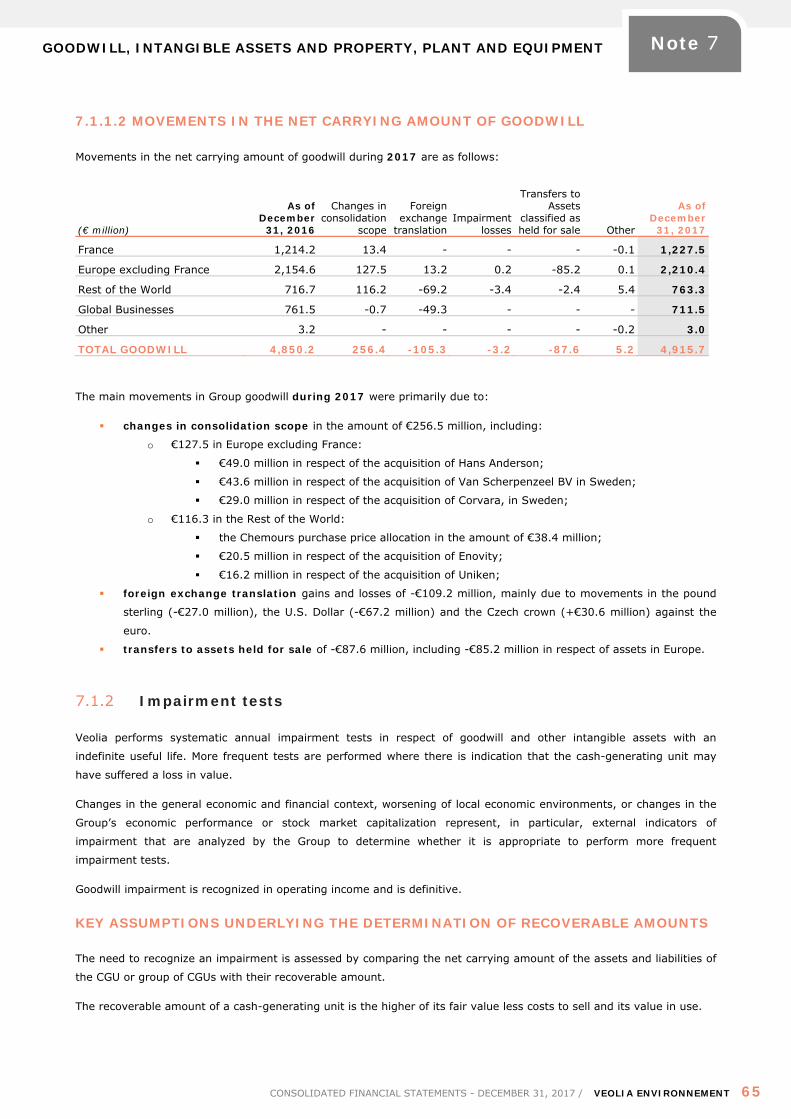
GOODWILL, INTANGIBLE ASSETS AND PROPERTY, PLANT AND EQUIPMENT
CONSOLIDATED FINANCIAL STATEMENTS - DECEMBER 31, 2017 / VEOLIA ENVIRONNEMENT 65
Note 7
7.1.1.2 MOVEMENTS IN THE NET CARRYING AMOUNT OF GOODWILL
Movements in the net carrying amount of goodwill during 2017 are as follows:
(€ million)
As of December
31, 2016
Changes in consolidation
scope
Foreign exchange
translation Impairment
losses
Transfers to Assets
classified as held for sale Other
As of December
31, 2017
France 1,214.2 13.4 - - - -0.1 1,227.5
Europe excluding France 2,154.6 127.5 13.2 0.2 -85.2 0.1 2,210.4
Rest of the World 716.7 116.2 -69.2 -3.4 -2.4 5.4 763.3
Global Businesses 761.5 -0.7 -49.3 - - - 711.5
Other 3.2 - - - - -0.2 3.0
TOTAL GOODWILL 4,850.2 256.4 -105.3 -3.2 -87.6 5.2 4,915.7
The main movements in Group goodwill during 2017 were primarily due to:
changes in consolidation scope in the amount of €256.5 million, including:
o €127.5 in Europe excluding France:
€49.0 million in respect of the acquisition of Hans Anderson;
€43.6 million in respect of the acquisition of Van Scherpenzeel BV in Sweden;
€29.0 million in respect of the acquisition of Corvara, in Sweden;
o €116.3 in the Rest of the World:
the Chemours purchase price allocation in the amount of €38.4 million;
€20.5 million in respect of the acquisition of Enovity;
€16.2 million in respect of the acquisition of Uniken;
foreign exchange translation gains and losses of -€109.2 million, mainly due to movements in the pound
sterling (-€27.0 million), the U.S. Dollar (-€67.2 million) and the Czech crown (+€30.6 million) against the
euro.
transfers to assets held for sale of -€87.6 million, including -€85.2 million in respect of assets in Europe.
7.1.2 Impairment tests
Veolia performs systematic annual impairment tests in respect of goodwill and other intangible assets with an
indefinite useful life. More frequent tests are performed where there is indication that the cash-generating unit may
have suffered a loss in value.
Changes in the general economic and financial context, worsening of local economic environments, or changes in the
Group’s economic performance or stock market capitalization represent, in particular, external indicators of
impairment that are analyzed by the Group to determine whether it is appropriate to perform more frequent
impairment tests.
Goodwill impairment is recognized in operating income and is definitive.
KEY ASSUMPTIONS UNDERLYING THE DETERMINATION OF RECOVERABLE AMOUNTS
The need to recognize an impairment is assessed by comparing the net carrying amount of the assets and liabilities of
the CGU or group of CGUs with their recoverable amount.
The recoverable amount of a cash-generating unit is the higher of its fair value less costs to sell and its value in use.
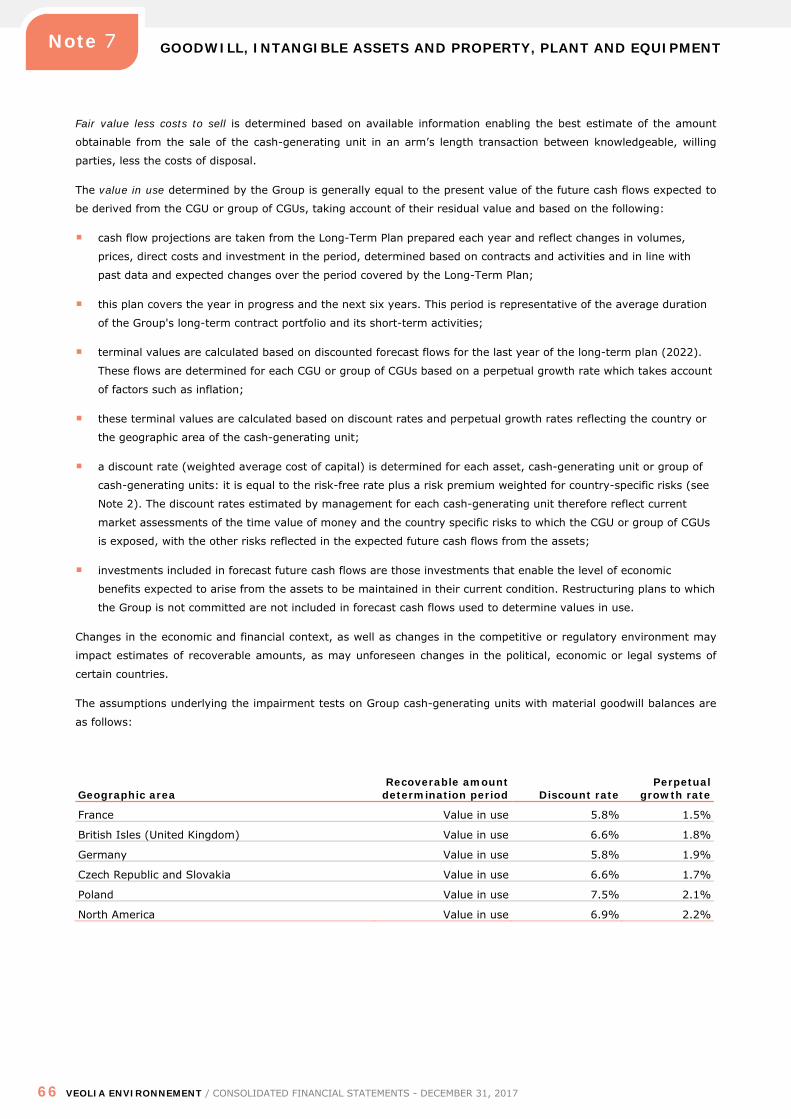
GOODWILL, INTANGIBLE ASSETS AND PROPERTY, PLANT AND EQUIPMENT
66 VEOLIA ENVIRONNEMENT / CONSOLIDATED FINANCIAL STATEMENTS - DECEMBER 31, 2017
Note 7
Fair value less costs to sell is determined based on available information enabling the best estimate of the amount
obtainable from the sale of the cash-generating unit in an arm’s length transaction between knowledgeable, willing
parties, less the costs of disposal.
The value in use determined by the Group is generally equal to the present value of the future cash flows expected to
be derived from the CGU or group of CGUs, taking account of their residual value and based on the following:
cash flow projections are taken from the Long-Term Plan prepared each year and reflect changes in volumes,
prices, direct costs and investment in the period, determined based on contracts and activities and in line with
past data and expected changes over the period covered by the Long-Term Plan;
this plan covers the year in progress and the next six years. This period is representative of the average duration
of the Group's long-term contract portfolio and its short-term activities;
terminal values are calculated based on discounted forecast flows for the last year of the long-term plan (2022).
These flows are determined for each CGU or group of CGUs based on a perpetual growth rate which takes account
of factors such as inflation;
these terminal values are calculated based on discount rates and perpetual growth rates reflecting the country or
the geographic area of the cash-generating unit;
a discount rate (weighted average cost of capital) is determined for each asset, cash-generating unit or group of
cash-generating units: it is equal to the risk-free rate plus a risk premium weighted for country-specific risks (see
Note 2). The discount rates estimated by management for each cash-generating unit therefore reflect current
market assessments of the time value of money and the country specific risks to which the CGU or group of CGUs
is exposed, with the other risks reflected in the expected future cash flows from the assets;
investments included in forecast future cash flows are those investments that enable the level of economic
benefits expected to arise from the assets to be maintained in their current condition. Restructuring plans to which
the Group is not committed are not included in forecast cash flows used to determine values in use.
Changes in the economic and financial context, as well as changes in the competitive or regulatory environment may
impact estimates of recoverable amounts, as may unforeseen changes in the political, economic or legal systems of
certain countries.
The assumptions underlying the impairment tests on Group cash-generating units with material goodwill balances are
as follows:
Geographic area Recoverable amount
determination period Discount rate Perpetual
growth rate
France Value in use 5.8% 1.5%
British Isles (United Kingdom) Value in use 6.6% 1.8%
Germany Value in use 5.8% 1.9%
Czech Republic and Slovakia Value in use 6.6% 1.7%
Poland Value in use 7.5% 2.1%
North America Value in use 6.9% 2.2%
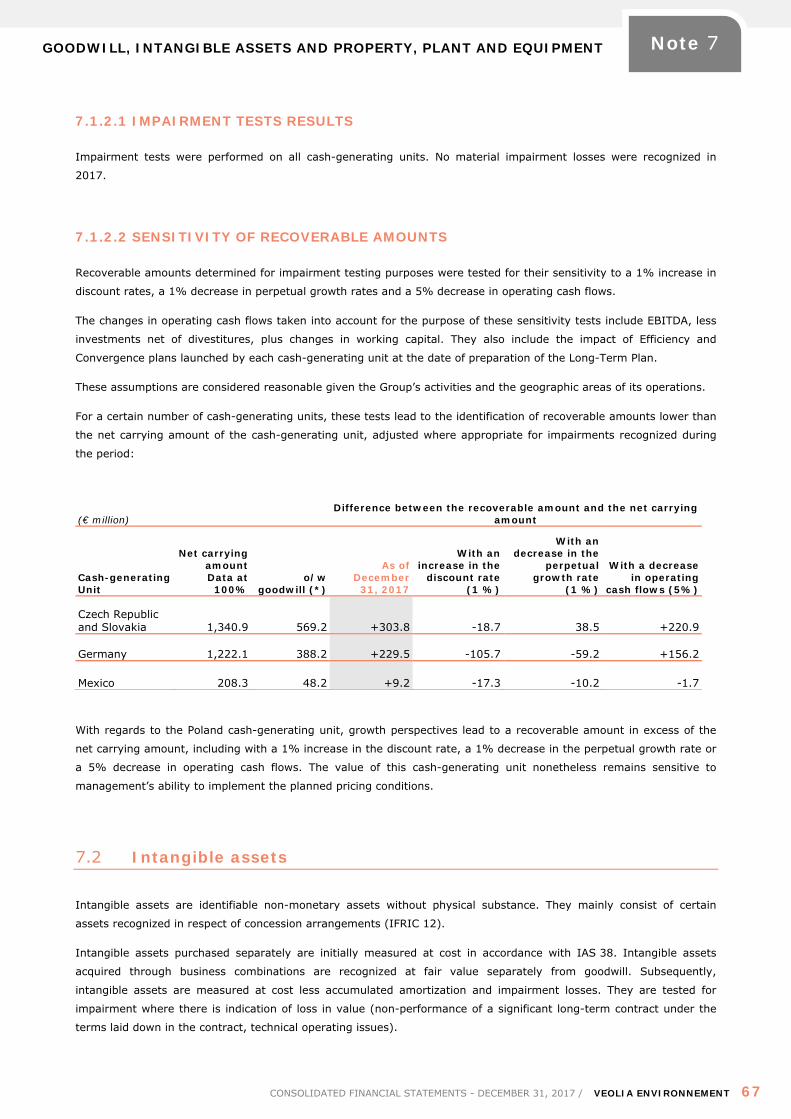
GOODWILL, INTANGIBLE ASSETS AND PROPERTY, PLANT AND EQUIPMENT
CONSOLIDATED FINANCIAL STATEMENTS - DECEMBER 31, 2017 / VEOLIA ENVIRONNEMENT 67
Note 7
7.1.2.1 IMPAIRMENT TESTS RESULTS
Impairment tests were performed on all cash-generating units. No material impairment losses were recognized in
2017.
7.1.2.2 SENSITIVITY OF RECOVERABLE AMOUNTS
Recoverable amounts determined for impairment testing purposes were tested for their sensitivity to a 1% increase in
discount rates, a 1% decrease in perpetual growth rates and a 5% decrease in operating cash flows.
The changes in operating cash flows taken into account for the purpose of these sensitivity tests include EBITDA, less
investments net of divestitures, plus changes in working capital. They also include the impact of Efficiency and
Convergence plans launched by each cash-generating unit at the date of preparation of the Long-Term Plan.
These assumptions are considered reasonable given the Group’s activities and the geographic areas of its operations.
For a certain number of cash-generating units, these tests lead to the identification of recoverable amounts lower than
the net carrying amount of the cash-generating unit, adjusted where appropriate for impairments recognized during
the period:
Difference between the recoverable amount and the net carrying amount (€ million)
Cash-generating Unit
Net carrying amount Data at
100% o/w
goodwill (*)
As of December
31, 2017
With an increase in the
discount rate (1 %)
With an decrease in the
perpetual growth rate
(1 %)
With a decrease in operating
cash flows (5%)
Czech Republic and Slovakia 1,340.9 569.2 +303.8 -18.7 38.5 +220.9
Germany 1,222.1 388.2 +229.5 -105.7 -59.2 +156.2
Mexico 208.3 48.2 +9.2 -17.3 -10.2 -1.7
With regards to the Poland cash-generating unit, growth perspectives lead to a recoverable amount in excess of the
net carrying amount, including with a 1% increase in the discount rate, a 1% decrease in the perpetual growth rate or
a 5% decrease in operating cash flows. The value of this cash-generating unit nonetheless remains sensitive to
management’s ability to implement the planned pricing conditions.
7.2 Intangible assets
Intangible assets are identifiable non-monetary assets without physical substance. They mainly consist of certain
assets recognized in respect of concession arrangements (IFRIC 12).
Intangible assets purchased separately are initially measured at cost in accordance with IAS 38. Intangible assets
acquired through business combinations are recognized at fair value separately from goodwill. Subsequently,
intangible assets are measured at cost less accumulated amortization and impairment losses. They are tested for
impairment where there is indication of loss in value (non-performance of a significant long-term contract under the
terms laid down in the contract, technical operating issues).
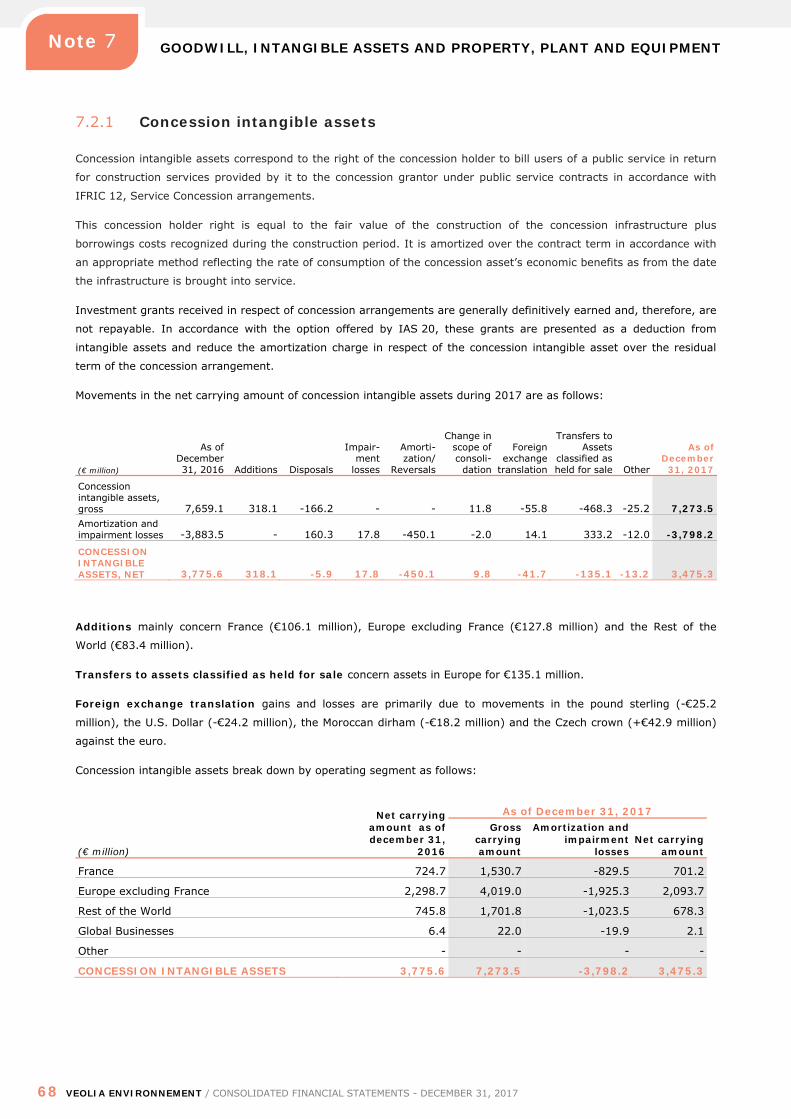
GOODWILL, INTANGIBLE ASSETS AND PROPERTY, PLANT AND EQUIPMENT
68 VEOLIA ENVIRONNEMENT / CONSOLIDATED FINANCIAL STATEMENTS - DECEMBER 31, 2017
Note 7
7.2.1 Concession intangible assets
Concession intangible assets correspond to the right of the concession holder to bill users of a public service in return
for construction services provided by it to the concession grantor under public service contracts in accordance with
IFRIC 12, Service Concession arrangements.
This concession holder right is equal to the fair value of the construction of the concession infrastructure plus
borrowings costs recognized during the construction period. It is amortized over the contract term in accordance with
an appropriate method reflecting the rate of consumption of the concession asset’s economic benefits as from the date
the infrastructure is brought into service.
Investment grants received in respect of concession arrangements are generally definitively earned and, therefore, are
not repayable. In accordance with the option offered by IAS 20, these grants are presented as a deduction from
intangible assets and reduce the amortization charge in respect of the concession intangible asset over the residual
term of the concession arrangement.
Movements in the net carrying amount of concession intangible assets during 2017 are as follows:
(€ million)
As of December 31, 2016 Additions Disposals
Impair- ment
losses
Amorti- zation/
Reversals
Change in scope of consoli-
dation
Foreign exchange
translation
Transfers to Assets
classified as held for sale Other
As of December
31, 2017
Concession intangible assets, gross 7,659.1 318.1 -166.2 - - 11.8 -55.8 -468.3 -25.2 7,273.5 Amortization and impairment losses -3,883.5 - 160.3 17.8 -450.1 -2.0 14.1 333.2 -12.0 -3,798.2
CONCESSION INTANGIBLE ASSETS, NET 3,775.6 318.1 -5.9 17.8 -450.1 9.8 -41.7 -135.1 -13.2 3,475.3
Additions mainly concern France (€106.1 million), Europe excluding France (€127.8 million) and the Rest of the
World (€83.4 million).
Transfers to assets classified as held for sale concern assets in Europe for €135.1 million.
Foreign exchange translation gains and losses are primarily due to movements in the pound sterling (-€25.2
million), the U.S. Dollar (-€24.2 million), the Moroccan dirham (-€18.2 million) and the Czech crown (+€42.9 million)
against the euro.
Concession intangible assets break down by operating segment as follows:
Net carrying
amount as of december 31,
2016
As of December 31, 2017
(€ million)
Gross carrying amount
Amortization and impairment
losses Net carrying
amount
France 724.7 1,530.7 -829.5 701.2
Europe excluding France 2,298.7 4,019.0 -1,925.3 2,093.7
Rest of the World 745.8 1,701.8 -1,023.5 678.3
Global Businesses 6.4 22.0 -19.9 2.1
Other - - - -
CONCESSION INTANGIBLE ASSETS 3,775.6 7,273.5 -3,798.2 3,475.3
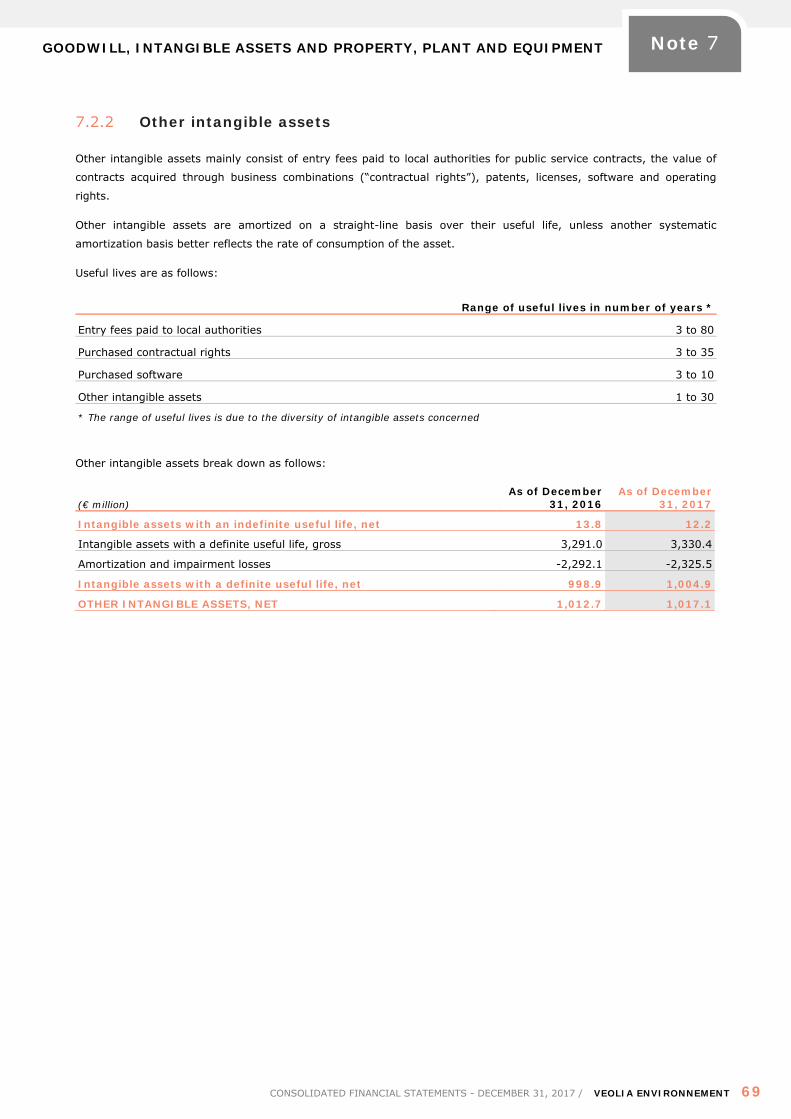
GOODWILL, INTANGIBLE ASSETS AND PROPERTY, PLANT AND EQUIPMENT
CONSOLIDATED FINANCIAL STATEMENTS - DECEMBER 31, 2017 / VEOLIA ENVIRONNEMENT 69
Note 7
7.2.2 Other intangible assets
Other intangible assets mainly consist of entry fees paid to local authorities for public service contracts, the value of
contracts acquired through business combinations (“contractual rights”), patents, licenses, software and operating
rights.
Other intangible assets are amortized on a straight-line basis over their useful life, unless another systematic
amortization basis better reflects the rate of consumption of the asset.
Useful lives are as follows:
Range of useful lives in number of years *
Entry fees paid to local authorities 3 to 80
Purchased contractual rights 3 to 35
Purchased software 3 to 10
Other intangible assets 1 to 30
* The range of useful lives is due to the diversity of intangible assets concerned
Other intangible assets break down as follows:
(€ million) As of December
31, 2016 As of December
31, 2017
Intangible assets with an indefinite useful life, net 13.8 12.2
Intangible assets with a definite useful life, gross 3,291.0 3,330.4
Amortization and impairment losses -2,292.1 -2,325.5
Intangible assets with a definite useful life, net 998.9 1,004.9
OTHER INTANGIBLE ASSETS, NET 1,012.7 1,017.1
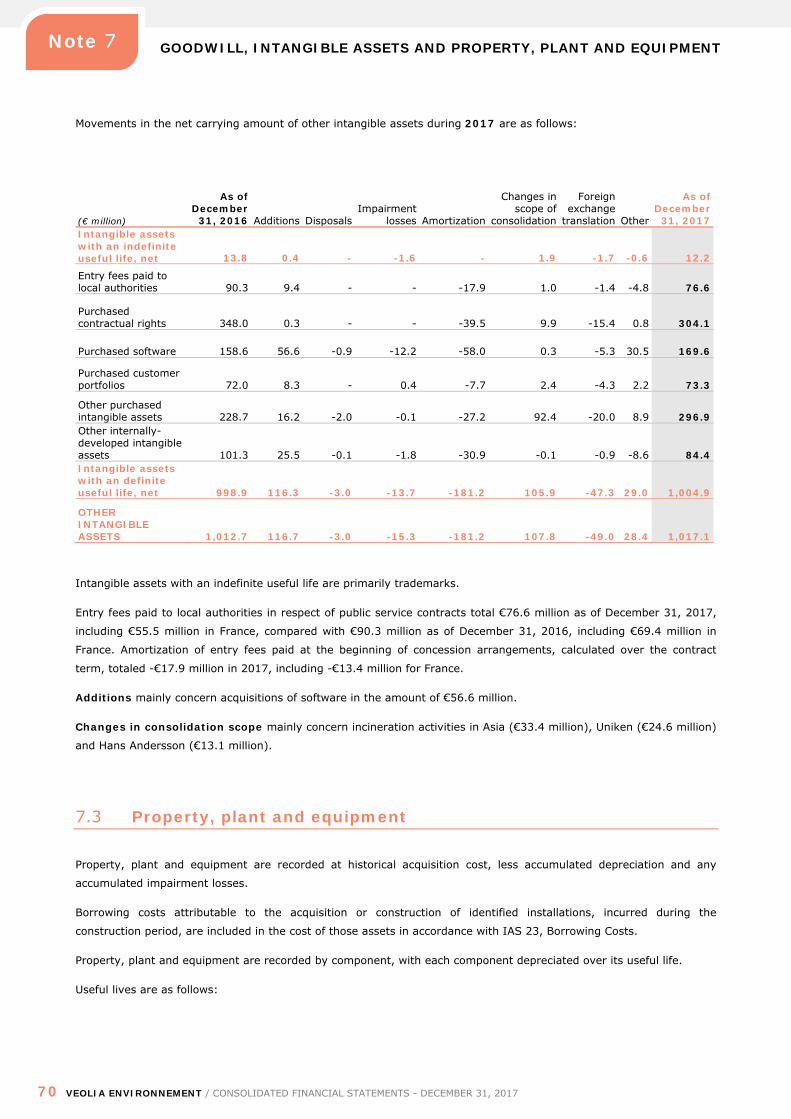
GOODWILL, INTANGIBLE ASSETS AND PROPERTY, PLANT AND EQUIPMENT
70 VEOLIA ENVIRONNEMENT / CONSOLIDATED FINANCIAL STATEMENTS - DECEMBER 31, 2017
Note 7
Movements in the net carrying amount of other intangible assets during 2017 are as follows:
(€ million)
As of December
31, 2016 Additions Disposals Impairment
losses Amortization
Changes in scope of
consolidation
Foreign exchange
translation Other
As of December
31, 2017 Intangible assets with an indefinite useful life, net 13.8 0.4 - -1.6 - 1.9 -1.7 -0.6 12.2
Entry fees paid to local authorities 90.3 9.4 - - -17.9 1.0 -1.4 -4.8 76.6
Purchased contractual rights 348.0 0.3 - - -39.5 9.9 -15.4 0.8 304.1
Purchased software 158.6 56.6 -0.9 -12.2 -58.0 0.3 -5.3 30.5 169.6
Purchased customer portfolios 72.0 8.3 - 0.4 -7.7 2.4 -4.3 2.2 73.3
Other purchased intangible assets 228.7 16.2 -2.0 -0.1 -27.2 92.4 -20.0 8.9 296.9 Other internally-developed intangible assets 101.3 25.5 -0.1 -1.8 -30.9 -0.1 -0.9 -8.6 84.4 Intangible assets with an definite useful life, net 998.9 116.3 -3.0 -13.7 -181.2 105.9 -47.3 29.0 1,004.9
OTHER INTANGIBLE ASSETS 1,012.7 116.7 -3.0 -15.3 -181.2 107.8 -49.0 28.4 1,017.1
Intangible assets with an indefinite useful life are primarily trademarks.
Entry fees paid to local authorities in respect of public service contracts total €76.6 million as of December 31, 2017,
including €55.5 million in France, compared with €90.3 million as of December 31, 2016, including €69.4 million in
France. Amortization of entry fees paid at the beginning of concession arrangements, calculated over the contract
term, totaled -€17.9 million in 2017, including -€13.4 million for France.
Additions mainly concern acquisitions of software in the amount of €56.6 million.
Changes in consolidation scope mainly concern incineration activities in Asia (€33.4 million), Uniken (€24.6 million)
and Hans Andersson (€13.1 million).
7.3 Property, plant and equipment
Property, plant and equipment are recorded at historical acquisition cost, less accumulated depreciation and any
accumulated impairment losses.
Borrowing costs attributable to the acquisition or construction of identified installations, incurred during the
construction period, are included in the cost of those assets in accordance with IAS 23, Borrowing Costs.
Property, plant and equipment are recorded by component, with each component depreciated over its useful life.
Useful lives are as follows:
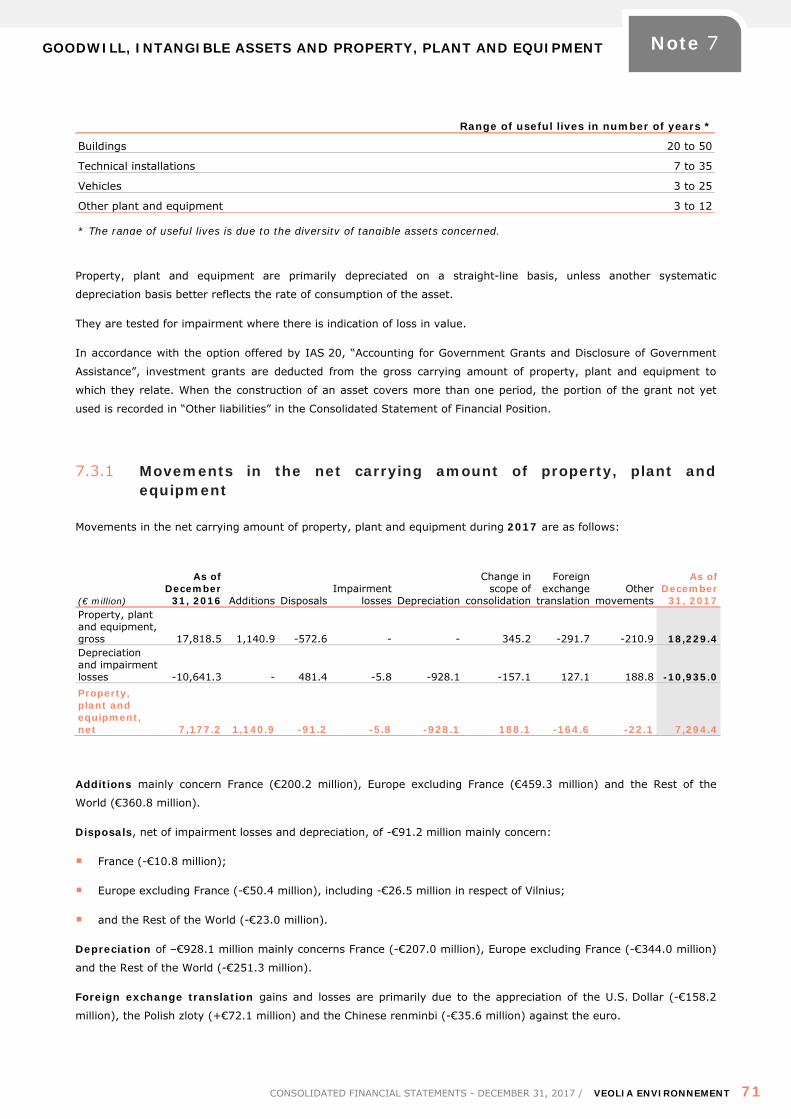
GOODWILL, INTANGIBLE ASSETS AND PROPERTY, PLANT AND EQUIPMENT
CONSOLIDATED FINANCIAL STATEMENTS - DECEMBER 31, 2017 / VEOLIA ENVIRONNEMENT 71
Note 7
Range of useful lives in number of years *
Buildings 20 to 50
Technical installations 7 to 35
Vehicles 3 to 25
Other plant and equipment 3 to 12 * The range of useful lives is due to the diversity of tangible assets concerned.
Property, plant and equipment are primarily depreciated on a straight-line basis, unless another systematic
depreciation basis better reflects the rate of consumption of the asset.
They are tested for impairment where there is indication of loss in value.
In accordance with the option offered by IAS 20, “Accounting for Government Grants and Disclosure of Government
Assistance”, investment grants are deducted from the gross carrying amount of property, plant and equipment to
which they relate. When the construction of an asset covers more than one period, the portion of the grant not yet
used is recorded in “Other liabilities” in the Consolidated Statement of Financial Position.
7.3.1 Movements in the net carrying amount of property, plant and equipment
Movements in the net carrying amount of property, plant and equipment during 2017 are as follows:
(€ million)
As of December
31, 2016 Additions Disposals Impairment
losses Depreciation
Change in scope of
consolidation
Foreign exchange
translation Other
movements
As of December
31, 2017 Property, plant and equipment, gross 17,818.5 1,140.9 -572.6 - - 345.2 -291.7 -210.9 18,229.4 Depreciation and impairment losses -10,641.3 - 481.4 -5.8 -928.1 -157.1 127.1 188.8 -10,935.0
Property, plant and equipment, net 7,177.2 1,140.9 -91.2 -5.8 -928.1 188.1 -164.6 -22.1 7,294.4
Additions mainly concern France (€200.2 million), Europe excluding France (€459.3 million) and the Rest of the
World (€360.8 million).
Disposals, net of impairment losses and depreciation, of -€91.2 million mainly concern:
France (-€10.8 million);
Europe excluding France (-€50.4 million), including -€26.5 million in respect of Vilnius;
and the Rest of the World (-€23.0 million).
Depreciation of –€928.1 million mainly concerns France (-€207.0 million), Europe excluding France (-€344.0 million)
and the Rest of the World (-€251.3 million).
Foreign exchange translation gains and losses are primarily due to the appreciation of the U.S. Dollar (-€158.2
million), the Polish zloty (+€72.1 million) and the Chinese renminbi (-€35.6 million) against the euro.
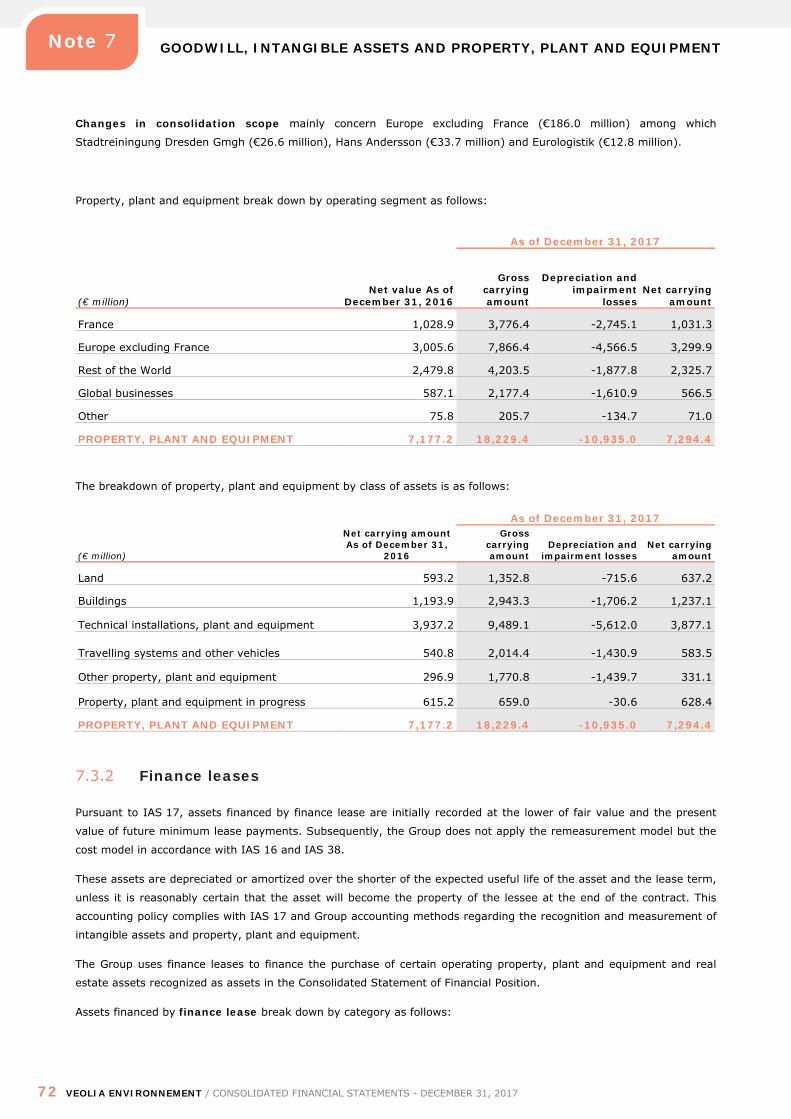
GOODWILL, INTANGIBLE ASSETS AND PROPERTY, PLANT AND EQUIPMENT
72 VEOLIA ENVIRONNEMENT / CONSOLIDATED FINANCIAL STATEMENTS - DECEMBER 31, 2017
Note 7
Changes in consolidation scope mainly concern Europe excluding France (€186.0 million) among which
Stadtreiningung Dresden Gmgh (€26.6 million), Hans Andersson (€33.7 million) and Eurologistik (€12.8 million).
Property, plant and equipment break down by operating segment as follows:
As of December 31, 2017
(€ million) Net value As of
December 31, 2016
Gross carrying amount
Depreciation and impairment
losses Net carrying
amount
France 1,028.9 3,776.4 -2,745.1 1,031.3
Europe excluding France 3,005.6 7,866.4 -4,566.5 3,299.9
Rest of the World 2,479.8 4,203.5 -1,877.8 2,325.7
Global businesses 587.1 2,177.4 -1,610.9 566.5
Other 75.8 205.7 -134.7 71.0
PROPERTY, PLANT AND EQUIPMENT 7,177.2 18,229.4 -10,935.0 7,294.4
The breakdown of property, plant and equipment by class of assets is as follows:
Net carrying amount As of December 31,
2016
As of December 31, 2017
(€ million)
Gross carrying amount
Depreciation and impairment losses
Net carrying amount
Land 593.2 1,352.8 -715.6 637.2
Buildings 1,193.9 2,943.3 -1,706.2 1,237.1
Technical installations, plant and equipment 3,937.2 9,489.1 -5,612.0 3,877.1
Travelling systems and other vehicles 540.8 2,014.4 -1,430.9 583.5
Other property, plant and equipment 296.9 1,770.8 -1,439.7 331.1
Property, plant and equipment in progress 615.2 659.0 -30.6 628.4
PROPERTY, PLANT AND EQUIPMENT 7,177.2 18,229.4 -10,935.0 7,294.4
7.3.2 Finance leases
Pursuant to IAS 17, assets financed by finance lease are initially recorded at the lower of fair value and the present
value of future minimum lease payments. Subsequently, the Group does not apply the remeasurement model but the
cost model in accordance with IAS 16 and IAS 38.
These assets are depreciated or amortized over the shorter of the expected useful life of the asset and the lease term,
unless it is reasonably certain that the asset will become the property of the lessee at the end of the contract. This
accounting policy complies with IAS 17 and Group accounting methods regarding the recognition and measurement of
intangible assets and property, plant and equipment.
The Group uses finance leases to finance the purchase of certain operating property, plant and equipment and real
estate assets recognized as assets in the Consolidated Statement of Financial Position.
Assets financed by finance lease break down by category as follows:
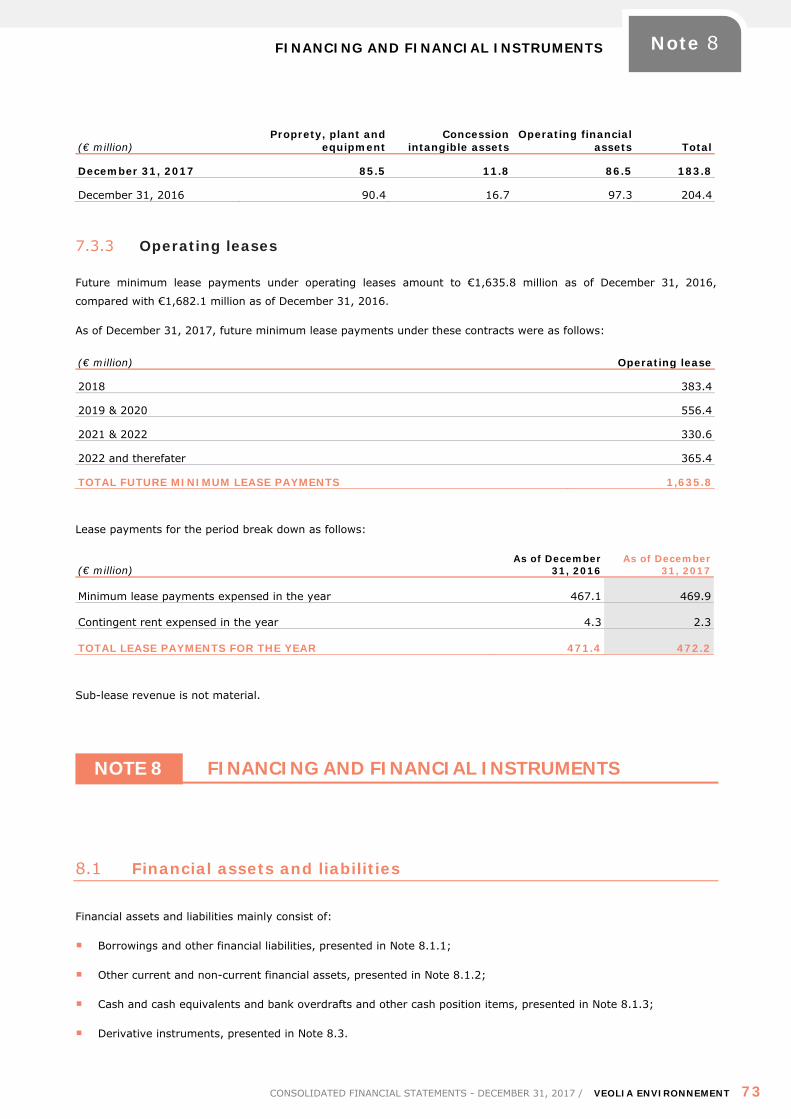
FINANCING AND FINANCIAL INSTRUMENTS
CONSOLIDATED FINANCIAL STATEMENTS - DECEMBER 31, 2017 / VEOLIA ENVIRONNEMENT 73
Note 8
(€ million) Proprety, plant and
equipment Concession
intangible assets Operating financial
assets Total
December 31, 2017 85.5 11.8 86.5 183.8
December 31, 2016 90.4 16.7 97.3 204.4
7.3.3 Operating leases
Future minimum lease payments under operating leases amount to €1,635.8 million as of December 31, 2016,
compared with €1,682.1 million as of December 31, 2016.
As of December 31, 2017, future minimum lease payments under these contracts were as follows:
(€ million) Operating lease
2018 383.4
2019 & 2020 556.4
2021 & 2022 330.6
2022 and therefater 365.4
TOTAL FUTURE MINIMUM LEASE PAYMENTS 1,635.8
Lease payments for the period break down as follows:
(€ million) As of December
31, 2016 As of December
31, 2017
Minimum lease payments expensed in the year 467.1 469.9
Contingent rent expensed in the year 4.3 2.3
TOTAL LEASE PAYMENTS FOR THE YEAR 471.4 472.2
Sub-lease revenue is not material.
NOTE 8 FINANCING AND FINANCIAL INSTRUMENTS
8.1 Financial assets and liabilities
Financial assets and liabilities mainly consist of:
Borrowings and other financial liabilities, presented in Note 8.1.1;
Other current and non-current financial assets, presented in Note 8.1.2;
Cash and cash equivalents and bank overdrafts and other cash position items, presented in Note 8.1.3;
Derivative instruments, presented in Note 8.3.
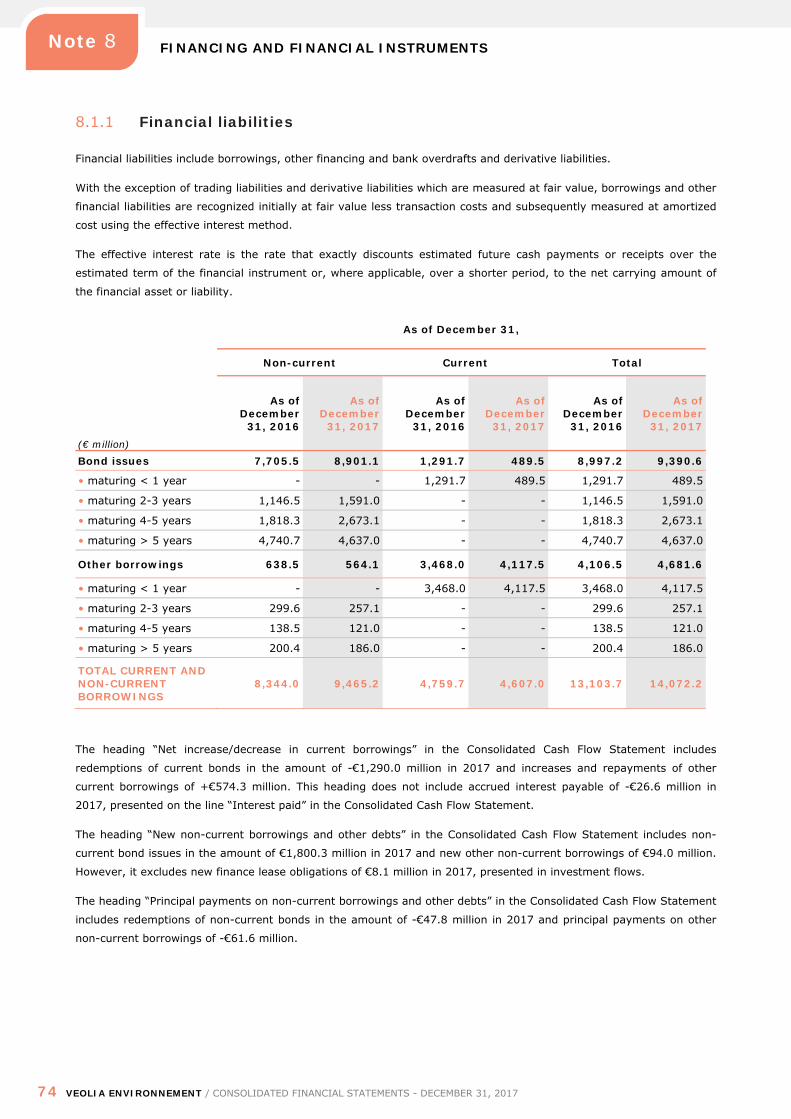
FINANCING AND FINANCIAL INSTRUMENTS
74 VEOLIA ENVIRONNEMENT / CONSOLIDATED FINANCIAL STATEMENTS - DECEMBER 31, 2017
Note 8
8.1.1 Financial liabilities
Financial liabilities include borrowings, other financing and bank overdrafts and derivative liabilities.
With the exception of trading liabilities and derivative liabilities which are measured at fair value, borrowings and other
financial liabilities are recognized initially at fair value less transaction costs and subsequently measured at amortized
cost using the effective interest method.
The effective interest rate is the rate that exactly discounts estimated future cash payments or receipts over the
estimated term of the financial instrument or, where applicable, over a shorter period, to the net carrying amount of
the financial asset or liability.
(€ million)
As of December 31,
Non-current Current Total
As of December
31, 2016
As of December
31, 2017
As of December
31, 2016
As of December
31, 2017
As of December
31, 2016
As of December
31, 2017
Bond issues 7,705.5 8,901.1 1,291.7 489.5 8,997.2 9,390.6
• maturing < 1 year - - 1,291.7 489.5 1,291.7 489.5
• maturing 2-3 years 1,146.5 1,591.0 - - 1,146.5 1,591.0
• maturing 4-5 years 1,818.3 2,673.1 - - 1,818.3 2,673.1
• maturing > 5 years 4,740.7 4,637.0 - - 4,740.7 4,637.0
Other borrowings 638.5 564.1 3,468.0 4,117.5 4,106.5 4,681.6
• maturing < 1 year - - 3,468.0 4,117.5 3,468.0 4,117.5
• maturing 2-3 years 299.6 257.1 - - 299.6 257.1
• maturing 4-5 years 138.5 121.0 - - 138.5 121.0
• maturing > 5 years 200.4 186.0 - - 200.4 186.0
TOTAL CURRENT AND NON-CURRENT BORROWINGS
8,344.0 9,465.2 4,759.7 4,607.0 13,103.7 14,072.2
The heading “Net increase/decrease in current borrowings” in the Consolidated Cash Flow Statement includes
redemptions of current bonds in the amount of -€1,290.0 million in 2017 and increases and repayments of other
current borrowings of +€574.3 million. This heading does not include accrued interest payable of -€26.6 million in
2017, presented on the line “Interest paid” in the Consolidated Cash Flow Statement.
The heading “New non-current borrowings and other debts” in the Consolidated Cash Flow Statement includes non-
current bond issues in the amount of €1,800.3 million in 2017 and new other non-current borrowings of €94.0 million.
However, it excludes new finance lease obligations of €8.1 million in 2017, presented in investment flows.
The heading “Principal payments on non-current borrowings and other debts” in the Consolidated Cash Flow Statement
includes redemptions of non-current bonds in the amount of -€47.8 million in 2017 and principal payments on other
non-current borrowings of -€61.6 million.
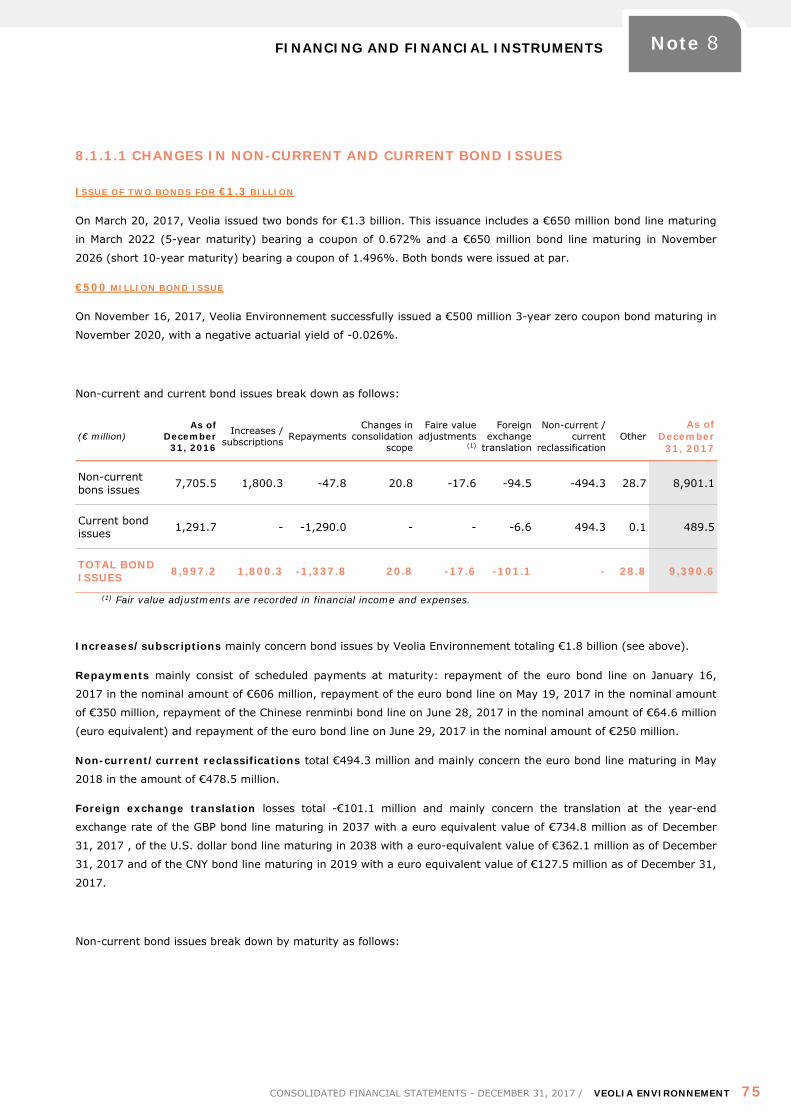
FINANCING AND FINANCIAL INSTRUMENTS
CONSOLIDATED FINANCIAL STATEMENTS - DECEMBER 31, 2017 / VEOLIA ENVIRONNEMENT 75
Note 8
8.1.1.1 CHANGES IN NON-CURRENT AND CURRENT BOND ISSUES
ISSUE OF TWO BONDS FOR €1.3 BILLION
On March 20, 2017, Veolia issued two bonds for €1.3 billion. This issuance includes a €650 million bond line maturing
in March 2022 (5-year maturity) bearing a coupon of 0.672% and a €650 million bond line maturing in November
2026 (short 10-year maturity) bearing a coupon of 1.496%. Both bonds were issued at par.
€500 MILLION BOND ISSUE
On November 16, 2017, Veolia Environnement successfully issued a €500 million 3-year zero coupon bond maturing in
November 2020, with a negative actuarial yield of -0.026%.
Non-current and current bond issues break down as follows:
(€ million) As of
December 31, 2016
Increases / subscriptions Repayments
Changes in consolidation
scope
Faire value adjustments
(1)
Foreign exchange
translation
Non-current / current
reclassification Other
As of December
31, 2017
Non-current bons issues 7,705.5 1,800.3 -47.8 20.8 -17.6 -94.5 -494.3 28.7 8,901.1
Current bond issues 1,291.7 - -1,290.0 - - -6.6 494.3 0.1 489.5
TOTAL BOND ISSUES 8,997.2 1,800.3 -1,337.8 20.8 -17.6 -101.1 - 28.8 9,390.6
(1) Fair value adjustments are recorded in financial income and expenses.
Increases/subscriptions mainly concern bond issues by Veolia Environnement totaling €1.8 billion (see above).
Repayments mainly consist of scheduled payments at maturity: repayment of the euro bond line on January 16,
2017 in the nominal amount of €606 million, repayment of the euro bond line on May 19, 2017 in the nominal amount
of €350 million, repayment of the Chinese renminbi bond line on June 28, 2017 in the nominal amount of €64.6 million
(euro equivalent) and repayment of the euro bond line on June 29, 2017 in the nominal amount of €250 million.
Non-current/current reclassifications total €494.3 million and mainly concern the euro bond line maturing in May
2018 in the amount of €478.5 million.
Foreign exchange translation losses total -€101.1 million and mainly concern the translation at the year-end
exchange rate of the GBP bond line maturing in 2037 with a euro equivalent value of €734.8 million as of December
31, 2017 , of the U.S. dollar bond line maturing in 2038 with a euro-equivalent value of €362.1 million as of December
31, 2017 and of the CNY bond line maturing in 2019 with a euro equivalent value of €127.5 million as of December 31,
2017.
Non-current bond issues break down by maturity as follows:
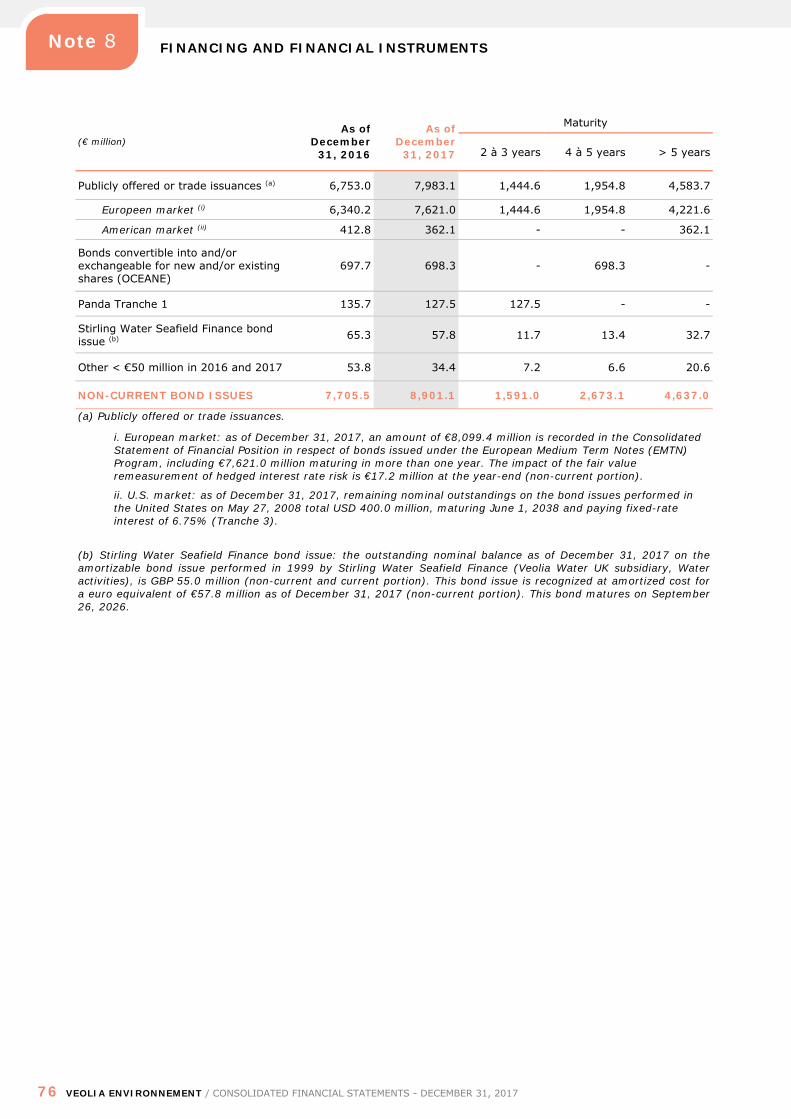
FINANCING AND FINANCIAL INSTRUMENTS
76 VEOLIA ENVIRONNEMENT / CONSOLIDATED FINANCIAL STATEMENTS - DECEMBER 31, 2017
Note 8
(€ million) As of
December 31, 2016
As of December
31, 2017
Maturity
2 à 3 years 4 à 5 years > 5 years
Publicly offered or trade issuances (a) 6,753.0 7,983.1 1,444.6 1,954.8 4,583.7
Europeen market (i) 6,340.2 7,621.0 1,444.6 1,954.8 4,221.6
American market (ii) 412.8 362.1 - - 362.1
Bonds convertible into and/or exchangeable for new and/or existing shares (OCEANE)
697.7 698.3 - 698.3 -
Panda Tranche 1 135.7 127.5 127.5 - -
Stirling Water Seafield Finance bond issue (b) 65.3 57.8 11.7 13.4 32.7
Other < €50 million in 2016 and 2017 53.8 34.4 7.2 6.6 20.6
NON-CURRENT BOND ISSUES 7,705.5 8,901.1 1,591.0 2,673.1 4,637.0
(a) Publicly offered or trade issuances.
i. European market: as of December 31, 2017, an amount of €8,099.4 million is recorded in the Consolidated Statement of Financial Position in respect of bonds issued under the European Medium Term Notes (EMTN) Program, including €7,621.0 million maturing in more than one year. The impact of the fair value remeasurement of hedged interest rate risk is €17.2 million at the year-end (non-current portion).
ii. U.S. market: as of December 31, 2017, remaining nominal outstandings on the bond issues performed in the United States on May 27, 2008 total USD 400.0 million, maturing June 1, 2038 and paying fixed-rate interest of 6.75% (Tranche 3).
(b) Stirling Water Seafield Finance bond issue: the outstanding nominal balance as of December 31, 2017 on the amortizable bond issue performed in 1999 by Stirling Water Seafield Finance (Veolia Water UK subsidiary, Water activities), is GBP 55.0 million (non-current and current portion). This bond issue is recognized at amortized cost for a euro equivalent of €57.8 million as of December 31, 2017 (non-current portion). This bond matures on September 26, 2026.
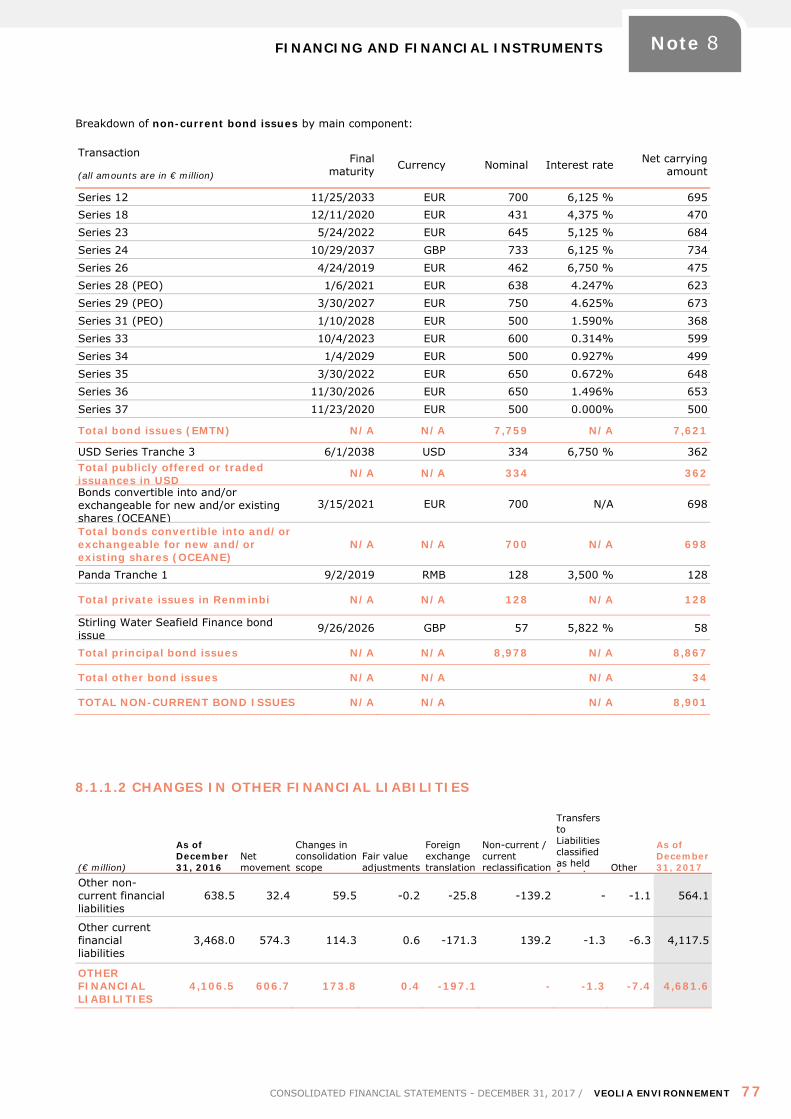
FINANCING AND FINANCIAL INSTRUMENTS
CONSOLIDATED FINANCIAL STATEMENTS - DECEMBER 31, 2017 / VEOLIA ENVIRONNEMENT 77
Note 8
Breakdown of non-current bond issues by main component:
Transaction Final maturity Currency Nominal Interest rate Net carrying
amount (all amounts are in € million)
Series 12 11/25/2033 EUR 700 6,125 % 695 Series 18 12/11/2020 EUR 431 4,375 % 470 Series 23 5/24/2022 EUR 645 5,125 % 684 Series 24 10/29/2037 GBP 733 6,125 % 734 Series 26 4/24/2019 EUR 462 6,750 % 475 Series 28 (PEO) 1/6/2021 EUR 638 4.247% 623 Series 29 (PEO) 3/30/2027 EUR 750 4.625% 673 Series 31 (PEO) 1/10/2028 EUR 500 1.590% 368 Series 33 10/4/2023 EUR 600 0.314% 599 Series 34 1/4/2029 EUR 500 0.927% 499 Series 35 3/30/2022 EUR 650 0.672% 648 Series 36 11/30/2026 EUR 650 1.496% 653 Series 37 11/23/2020 EUR 500 0.000% 500
Total bond issues (EMTN) N/A N/A 7,759 N/A 7,621
USD Series Tranche 3 6/1/2038 USD 334 6,750 % 362 Total publicly offered or traded issuances in USD
N/A N/A 334 362
Bonds convertible into and/or exchangeable for new and/or existing shares (OCEANE)
3/15/2021 EUR 700 N/A 698
Total bonds convertible into and/or exchangeable for new and/or existing shares (OCEANE)
N/A N/A 700 N/A 698
Panda Tranche 1 9/2/2019 RMB 128 3,500 % 128
Total private issues in Renminbi N/A N/A 128 N/A 128
Stirling Water Seafield Finance bond issue
9/26/2026 GBP 57 5,822 % 58
Total principal bond issues N/A N/A 8,978 N/A 8,867
Total other bond issues N/A N/A N/A 34
TOTAL NON-CURRENT BOND ISSUES N/A N/A N/A 8,901
8.1.1.2 CHANGES IN OTHER FINANCIAL LIABILITIES
(€ million)
As of December 31, 2016
Net movement
Changes in consolidation scope
Fair value adjustments
Foreign exchange translation
Non-current / current reclassification
Transfers to Liabilities classified as held fo sale
Other
As of December 31, 2017
Other non-current financial liabilities
638.5 32.4 59.5 -0.2 -25.8 -139.2 - -1.1 564.1
Other current financial liabilities
3,468.0 574.3 114.3 0.6 -171.3 139.2 -1.3 -6.3 4,117.5
OTHER FINANCIAL LIABILITIES
4,106.5 606.7 173.8 0.4 -197.1 - -1.3 -7.4 4,681.6
FINANCING AND FINANCIAL INSTRUMENTS
78 VEOLIA ENVIRONNEMENT / CONSOLIDATED FINANCIAL STATEMENTS - DECEMBER 31, 2017
Note 8
Movements in financial liabilities during 2017 are as follows:
Other non-current financial liabilities mainly comprise:
finance lease obligations (€135.7 million as of December 31, 2017 and €154.3 million as of December 31, 2016);
the non-recourse debt carried by Redal and Amendis in Morocco (Water) of €36.9 million and €23.9 million,
respectively, as of December 31, 2017 against €73.0 million and €34.2 million, respectively, as of December 31,
2016;
debt carried by:
(i) International Water Services Guayaquil Interagua in Ecuador (Water) of €52.0 million as of
December 31, 2017 and €33.6 million as of December 31, 2016;
(ii) Veolia Sunshine (Harbin) Heat Power in China (Energy) of €23.5 million as of December 31, 2017
and €37.5 million as of December 31, 2016;
(iii) Veolia Energy North America (United States) of €28.5 million as of December 31, 2017 and €34.2
million as of December 31, 2016;
(iv) Stadtwerke Gorlitz (Germany) of €29.7 million and €27.0 million as of December 31, 2016.
Changes in consolidation scope mainly concern the acquisition of control of Hangzhou in China in the amount of
€12.2 million and SRD in Germany in the amount of €14.6 million.
Other current financial liabilities total €4,117.5 million as of December 31, 2017, compared with €3,468.0 million
as of December 31, 2016.
Net movements in other current financial liabilities in 2017 mainly reflect the increase in treasury notes issued in the
amount of €726.8 million.
Changes in consolidation scope mainly concern the acquisition of a plastic recycling business in Sweden (Hans
Andersson) in the amount of €16.1 million and in the Netherlands (Van Scherpenzeel) in the amount of €17.3 million
and debts recognized following the full consolidation of two Italian companies in the amount of €28.5 million.
As of December 31, 2017, other current financial liabilities mainly concern:
Veolia Environnement for €3,636.4 million (including treasury notes of €3,491.6 million and accrued interest on
debt of €142.7 million);
certain subsidiaries of the “Other” segment in the amount of €26.5 million;
France in the amount of €59.5 million;
Europe excluding France in the amount of €144.1 million;
the Rest of the World segment in the amount of €223.1 million;
Global Businesses in the amount of €27.9 million.
The current portion of Group finance lease obligations is €35.8 million as of December 31, 2017, compared with €33.2
million as of December 31, 2016.
FINANCING AND FINANCIAL INSTRUMENTS
CONSOLIDATED FINANCIAL STATEMENTS - DECEMBER 31, 2017 / VEOLIA ENVIRONNEMENT 79
Note 8
8.1.1.3 BREAKDOWN OF NON-CURRENT AND CURRENT FINANCIAL LIABILITIES BY CURRENCY
Financial liabilities are primarily denominated in euro, pound sterling and US Dollar.
Financial liabilities break down by original currency (before currency swaps) as follows:
euro-denominated debts total €12,015.3 million as of December 31, 2017 and €10,716.3 million as of December
31, 2016;
pound sterling-denominated debts total €835.1 million as of December 31, 2017 and €893.2 million as of
December 31, 2016;
US dollar-denominated debts total €667.9 million as of December 31, 2017 and €858.6 million as of December 31,
2016.
8.1.2 Non-current and current financial assets
Financial assets include assets classified as available-for-sale and held-to maturity, assets at fair value through profit
or loss, derivative assets, loans and receivables and cash and cash equivalents.
Financial assets are initially recognized at fair value plus transaction costs, where the assets concerned are not
subsequently measured at fair value through profit or loss. Where the assets are measured at fair value through profit
or loss, transaction costs are expensed directly to net income.
The Group classifies financial assets in one of the four categories identified by IAS 39 on the acquisition date.
HELD-TO MATURITY ASSETS
Held-to-maturity assets are exclusively financial assets with fixed or determinable payments and fixed maturities,
other than loans and receivables that the Group acquires with the positive intention and ability to hold to maturity.
After initial recognition at fair value, held-to-maturity assets are recognized and measured at amortized cost using the
effective interest rate method (EIR).
Held-to-maturity assets are reviewed for objective evidence of impairment. An impairment loss is recognized if the
carrying amount of the financial asset exceeds the present value of future cash flows discounted at the initial effective
interest rate (EIR). The impairment loss is recognized in profit or loss.
Net gains and losses on held-to-maturity assets consist of interest income and impairment losses.
AVAILABLE-FOR-SALE ASSETS
Available-for-sale assets mainly consist of non-consolidated investments and marketable securities that do not qualify
for inclusion in other financial asset categories. They are measured at fair value, with fair value movements recognized
directly in other comprehensive income, except where there is a material or long-term unrealized capital loss. This can
arise when future cash flows decrease to such an extent that the fair value of these assets falls materially or long-term
below the historical cost. Where this is the case, the impairment loss is recognized in the Consolidated Income
Statement. Impairment reversals are recognized in profit or loss for debt securities only (receivables and bonds).
Amounts recognized in other comprehensive income are reclassified to profit or loss on the sale of the available-for-
sale assets. Fair value is equal to market value in the case of quoted securities and to an estimate of the fair value in
FINANCING AND FINANCIAL INSTRUMENTS
80 VEOLIA ENVIRONNEMENT / CONSOLIDATED FINANCIAL STATEMENTS - DECEMBER 31, 2017
Note 8
the case of unquoted securities, determined based on financial criteria most appropriate to the specific situation of
each security. Non-consolidated investments which are not quoted in an active market and for which the fair value
cannot be measured reliably, are recorded by the Group at historical cost less any accumulated impairment losses.
Net gains and losses on available-for-sale assets consist of interest income, dividends, impairment losses and capital
gains and losses on disposals.
LOANS AND RECEIVABLES
This category includes loans to non-consolidated investments, operating financial assets, other loans and receivables
and trade receivables. After initial recognition at fair value, these instruments are recognized and measured at
amortized cost using the effective interest rate method.
An impairment loss is recognized if, where there exists an indication of impairment, the carrying amount of these
assets exceeds the present value of future cash flows discounted at the initial EIR. The impairment loss is recognized
in profit or loss.
The impairment of trade receivables is calculated using two methods:
a statistical method: this method is based on past losses and involves the application of a provision rate by
category of aged receivables. The analysis is performed for a group of similar receivables, presenting similar credit
characteristics as a result of belonging to a customer category and country;
an individual method: the probability and amount of the loss is assessed on an individual case basis in particular
for non-State public debtors (past due period, other receivables or payables with the counterparty, rating issued
by an external rating agency, geographical location).
Net gains and losses on loans and receivables consist of interest income and impairment losses.
ASSETS AND LIABILITIES AT FAIR VALUE THROUGH PROFIT OR LOSS
This category includes:
trading assets and liabilities acquired by the Group for the purpose of selling them in the near term and which
form part of a portfolio of identified financial instruments that are managed together and for which there is
evidence of a recent actual pattern of short-term profit-taking. Derivatives not qualifying for hedge accounting are
also considered trading assets and liabilities;
assets designated at fair value and primarily the portfolio of cash UCITS whose performance and management is
based on fair value.
Changes in the value of these assets are recognized in the Consolidated Income Statement.
Net gains and losses on assets at fair value through the Consolidated Income Statement consist of interest income,
dividends and fair value adjustments.
Net gains and losses on derivatives entered into for trading purposes consist of swapped flows and the change in the
value of the instrument.
8.1.2.1 OTHER NON-CURRENT AND CURRENT FINANCIAL ASSETS
Other non-current and current financial assets break down as follows:
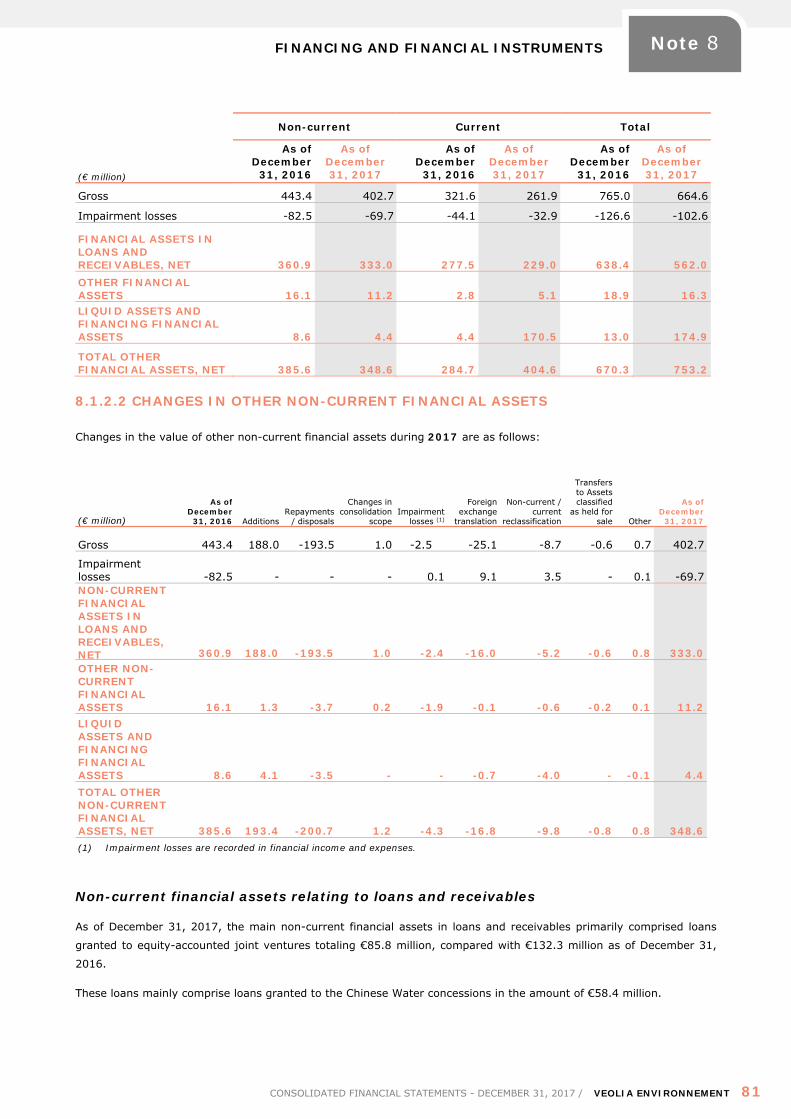
FINANCING AND FINANCIAL INSTRUMENTS
CONSOLIDATED FINANCIAL STATEMENTS - DECEMBER 31, 2017 / VEOLIA ENVIRONNEMENT 81
Note 8
(€ million)
Non-current Current Total
As of December
31, 2016
As of December 31, 2017
As of December
31, 2016
As of December 31, 2017
As of December
31, 2016
As of December 31, 2017
Gross 443.4 402.7 321.6 261.9 765.0 664.6
Impairment losses -82.5 -69.7 -44.1 -32.9 -126.6 -102.6
FINANCIAL ASSETS IN LOANS AND RECEIVABLES, NET 360.9 333.0 277.5 229.0 638.4 562.0 OTHER FINANCIAL ASSETS 16.1 11.2 2.8 5.1 18.9 16.3 LIQUID ASSETS AND FINANCING FINANCIAL ASSETS 8.6 4.4 4.4 170.5 13.0 174.9
TOTAL OTHER FINANCIAL ASSETS, NET 385.6 348.6 284.7 404.6 670.3 753.2
8.1.2.2 CHANGES IN OTHER NON-CURRENT FINANCIAL ASSETS
Changes in the value of other non-current financial assets during 2017 are as follows:
(€ million)
As of December
31, 2016 Additions Repayments
/ disposals
Changes in consolidation
scope Impairment
losses (1)
Foreign exchange
translation
Non-current / current
reclassification
Transfers to Assets classified
as held for sale Other
As of December
31, 2017
Gross 443.4 188.0 -193.5 1.0 -2.5 -25.1 -8.7 -0.6 0.7 402.7
Impairment losses -82.5 - - - 0.1 9.1 3.5 - 0.1 -69.7 NON-CURRENT FINANCIAL ASSETS IN LOANS AND RECEIVABLES, NET 360.9 188.0 -193.5 1.0 -2.4 -16.0 -5.2 -0.6 0.8 333.0 OTHER NON-CURRENT FINANCIAL ASSETS 16.1 1.3 -3.7 0.2 -1.9 -0.1 -0.6 -0.2 0.1 11.2 LIQUID ASSETS AND FINANCING FINANCIAL ASSETS 8.6 4.1 -3.5 - - -0.7 -4.0 - -0.1 4.4 TOTAL OTHER NON-CURRENT FINANCIAL ASSETS, NET 385.6 193.4 -200.7 1.2 -4.3 -16.8 -9.8 -0.8 0.8 348.6 (1) Impairment losses are recorded in financial income and expenses.
Non-current financial assets relating to loans and receivables
As of December 31, 2017, the main non-current financial assets in loans and receivables primarily comprised loans
granted to equity-accounted joint ventures totaling €85.8 million, compared with €132.3 million as of December 31,
2016.
These loans mainly comprise loans granted to the Chinese Water concessions in the amount of €58.4 million.
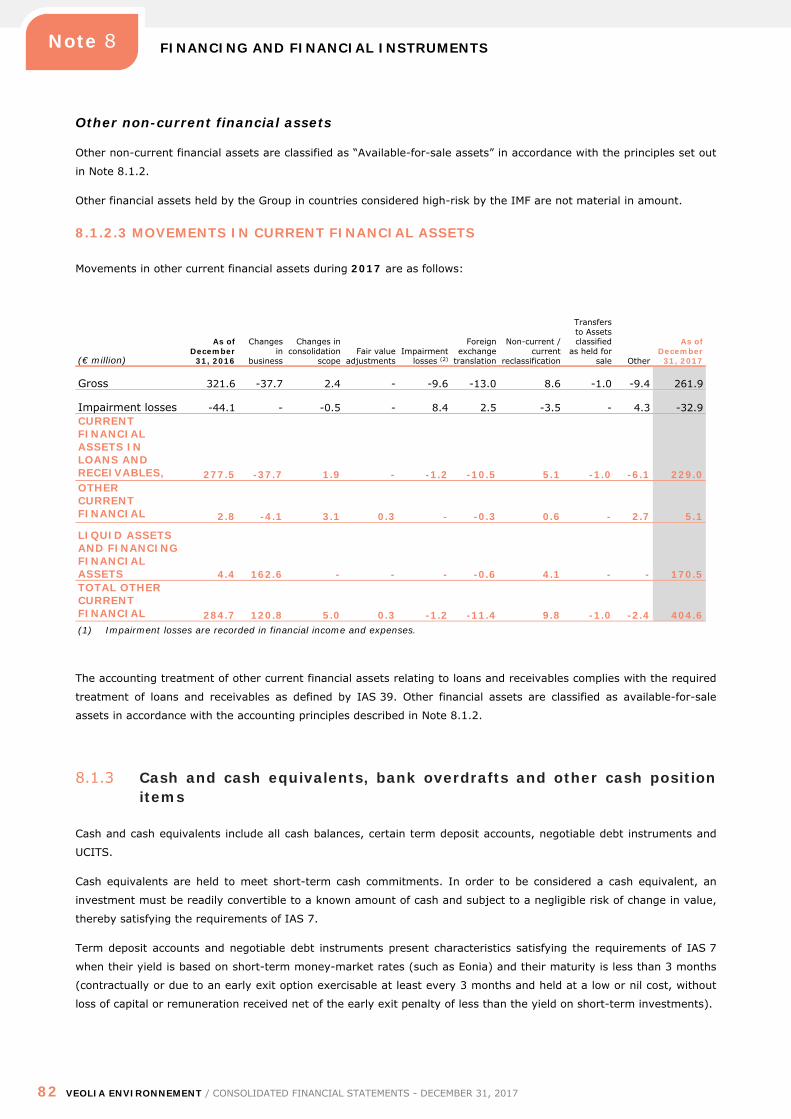
FINANCING AND FINANCIAL INSTRUMENTS
82 VEOLIA ENVIRONNEMENT / CONSOLIDATED FINANCIAL STATEMENTS - DECEMBER 31, 2017
Note 8
Other non-current financial assets
Other non-current financial assets are classified as “Available-for-sale assets” in accordance with the principles set out
in Note 8.1.2.
Other financial assets held by the Group in countries considered high-risk by the IMF are not material in amount.
8.1.2.3 MOVEMENTS IN CURRENT FINANCIAL ASSETS
Movements in other current financial assets during 2017 are as follows:
(€ million)
As of December
31, 2016
Changes in
business
Changes in consolidation
scope Fair value
adjustments Impairment
losses (2)
Foreign exchange
translation
Non-current / current
reclassification
Transfers to Assets classified
as held for sale Other
As of December
31, 2017
Gross 321.6 -37.7 2.4 - -9.6 -13.0 8.6 -1.0 -9.4 261.9
Impairment losses -44.1 - -0.5 - 8.4 2.5 -3.5 - 4.3 -32.9 CURRENT FINANCIAL ASSETS IN LOANS AND RECEIVABLES, 277.5 -37.7 1.9 - -1.2 -10.5 5.1 -1.0 -6.1 229.0 OTHER CURRENT FINANCIAL 2.8 -4.1 3.1 0.3 - -0.3 0.6 - 2.7 5.1
LIQUID ASSETS AND FINANCING FINANCIAL ASSETS 4.4 162.6 - - - -0.6 4.1 - - 170.5 TOTAL OTHER CURRENT FINANCIAL 284.7 120.8 5.0 0.3 -1.2 -11.4 9.8 -1.0 -2.4 404.6 (1) Impairment losses are recorded in financial income and expenses.
The accounting treatment of other current financial assets relating to loans and receivables complies with the required
treatment of loans and receivables as defined by IAS 39. Other financial assets are classified as available-for-sale
assets in accordance with the accounting principles described in Note 8.1.2.
8.1.3 Cash and cash equivalents, bank overdrafts and other cash position items
Cash and cash equivalents include all cash balances, certain term deposit accounts, negotiable debt instruments and
UCITS.
Cash equivalents are held to meet short-term cash commitments. In order to be considered a cash equivalent, an
investment must be readily convertible to a known amount of cash and subject to a negligible risk of change in value,
thereby satisfying the requirements of IAS 7.
Term deposit accounts and negotiable debt instruments present characteristics satisfying the requirements of IAS 7
when their yield is based on short-term money-market rates (such as Eonia) and their maturity is less than 3 months
(contractually or due to an early exit option exercisable at least every 3 months and held at a low or nil cost, without
loss of capital or remuneration received net of the early exit penalty of less than the yield on short-term investments).
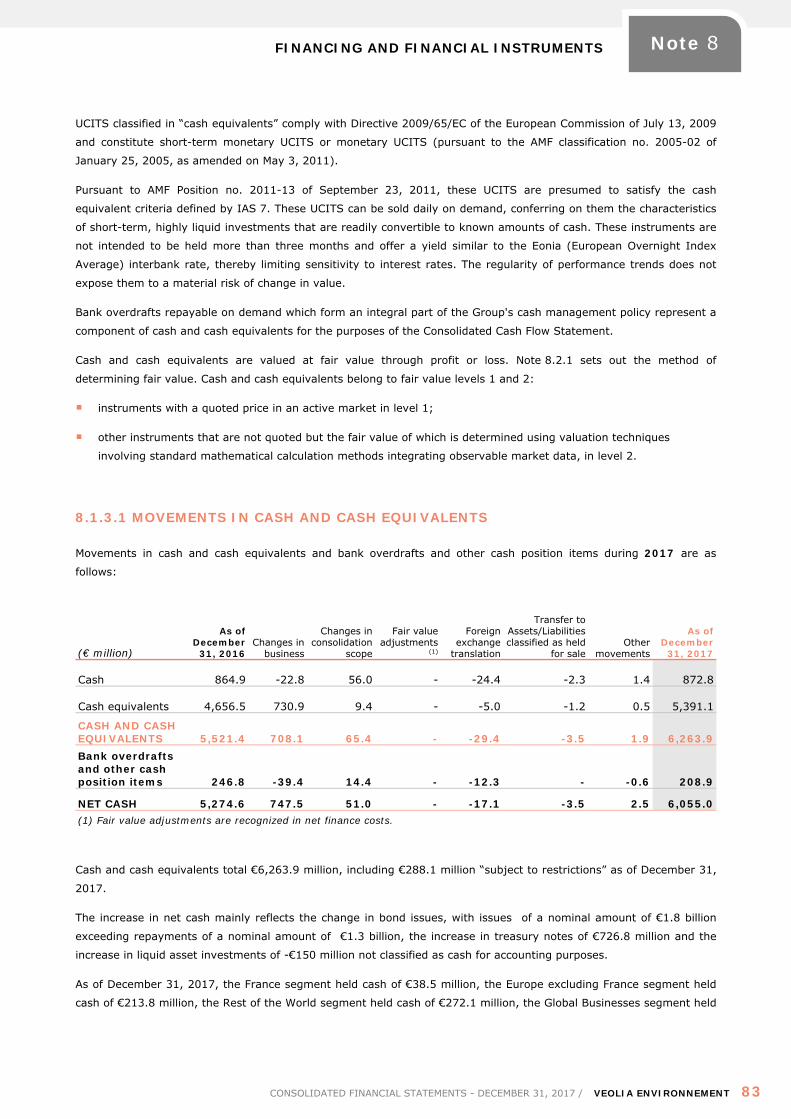
FINANCING AND FINANCIAL INSTRUMENTS
CONSOLIDATED FINANCIAL STATEMENTS - DECEMBER 31, 2017 / VEOLIA ENVIRONNEMENT 83
Note 8
UCITS classified in “cash equivalents” comply with Directive 2009/65/EC of the European Commission of July 13, 2009
and constitute short-term monetary UCITS or monetary UCITS (pursuant to the AMF classification no. 2005-02 of
January 25, 2005, as amended on May 3, 2011).
Pursuant to AMF Position no. 2011-13 of September 23, 2011, these UCITS are presumed to satisfy the cash
equivalent criteria defined by IAS 7. These UCITS can be sold daily on demand, conferring on them the characteristics
of short-term, highly liquid investments that are readily convertible to known amounts of cash. These instruments are
not intended to be held more than three months and offer a yield similar to the Eonia (European Overnight Index
Average) interbank rate, thereby limiting sensitivity to interest rates. The regularity of performance trends does not
expose them to a material risk of change in value.
Bank overdrafts repayable on demand which form an integral part of the Group's cash management policy represent a
component of cash and cash equivalents for the purposes of the Consolidated Cash Flow Statement.
Cash and cash equivalents are valued at fair value through profit or loss. Note 8.2.1 sets out the method of
determining fair value. Cash and cash equivalents belong to fair value levels 1 and 2:
instruments with a quoted price in an active market in level 1;
other instruments that are not quoted but the fair value of which is determined using valuation techniques
involving standard mathematical calculation methods integrating observable market data, in level 2.
8.1.3.1 MOVEMENTS IN CASH AND CASH EQUIVALENTS
Movements in cash and cash equivalents and bank overdrafts and other cash position items during 2017 are as
follows:
(€ million)
As of December
31, 2016 Changes in
business
Changes in consolidation
scope
Fair value adjustments
(1)
Foreign exchange
translation
Transfer to Assets/Liabilities classified as held
for sale Other
movements
As of December
31, 2017
Cash 864.9 -22.8 56.0 - -24.4 -2.3 1.4 872.8
Cash equivalents 4,656.5 730.9 9.4 - -5.0 -1.2 0.5 5,391.1
CASH AND CASH EQUIVALENTS 5,521.4 708.1 65.4 - -29.4 -3.5 1.9 6,263.9 Bank overdrafts and other cash position items 246.8 -39.4 14.4 - -12.3 - -0.6 208.9
NET CASH 5,274.6 747.5 51.0 - -17.1 -3.5 2.5 6,055.0 (1) Fair value adjustments are recognized in net finance costs.
Cash and cash equivalents total €6,263.9 million, including €288.1 million “subject to restrictions” as of December 31,
2017.
The increase in net cash mainly reflects the change in bond issues, with issues of a nominal amount of €1.8 billion
exceeding repayments of a nominal amount of €1.3 billion, the increase in treasury notes of €726.8 million and the
increase in liquid asset investments of -€150 million not classified as cash for accounting purposes.
As of December 31, 2017, the France segment held cash of €38.5 million, the Europe excluding France segment held
cash of €213.8 million, the Rest of the World segment held cash of €272.1 million, the Global Businesses segment held
FINANCING AND FINANCIAL INSTRUMENTS
84 VEOLIA ENVIRONNEMENT / CONSOLIDATED FINANCIAL STATEMENTS - DECEMBER 31, 2017
Note 8
cash of €136.7 million and the Other segment held cash of €211.7 million (including €89.3 million held by Veolia
Environnement).
Surplus cash balances of other Group subsidiaries, not pooled at Veolia Environnement level, are invested in
accordance with procedures defined by the Group. Note 8.3.2, “Management of liquidity risk”, presents a breakdown of
investments by nature.
As of December 31, 2017, cash equivalents were primarily held by Veolia Environnement in the amount of €5,266.7
million, including UCITS of €4,314.3 million and term deposit accounts of €950.1 million.
Bank overdrafts and other cash position items consist of credit balances on bank accounts and related accrued interest
payable, corresponding to brief overdrafts.
8.1.3.2 MANAGEMENT OF EQUITY RISK
As part of its cash management strategy, Veolia Environnement holds UCITS. These UCITS have the characteristics of
monetary UCITS and are not subject to equity risk.
8.2 Fair value of financial assets and liabilities
8.2.1 Principles
The recognition and measurement of financial assets and liabilities is governed by IAS 39. Fair value measurement
incorporates, in particular, the risk of non-performance by the Group or its counterparties, determined based on
default probabilities taken from rating agency tables.
The fair value of all financial assets and liabilities is determined at the period end; either for recognition in the
accounts or disclosure in the notes to the financial statements.
Fair value is determined:
i. Based on quoted prices in an active market (level 1);
ii. Using internal valuation techniques involving standard mathematical calculation methods integrating observable
market data (forward rates, interest rate curves, etc.). Valuations produced by these models are adjusted to take
account of a reasonable change in the credit risk of the Group or the counterparty (level 2);
iii. Using internal valuation techniques integrating factors estimated by the Group in the absence of observable market
data (level 3).
QUOTED PRICES IN AN ACTIVE MARKET (LEVEL 1)
When quoted prices in an active market are available, they are used in priority for the determination of the market
value. Marketable securities and certain quoted bond issues are valued in this way.
FINANCING AND FINANCIAL INSTRUMENTS
CONSOLIDATED FINANCIAL STATEMENTS - DECEMBER 31, 2017 / VEOLIA ENVIRONNEMENT 85
Note 8
FAIR VALUES DETERMINED USING MODELS INTEGRATING OBSERVABLE MARKET DATA (LEVEL 2)
The majority of derivative instruments (swaps, caps, floors, etc.) are traded over the counter and, as such, there are
no quoted prices. Valuations are therefore determined using models commonly used by market participants to value
such financial instruments.
Valuations calculated internally in respect of derivative instruments are tested every six months for consistency with
valuations issued by our counterparties.
The fair value of unquoted borrowings is calculated by discounting contractual flows at the market rate of interest.
The net carrying amount of receivables and payables falling due within less than one year and certain floating-rate
receivables and payables is considered a reasonable estimate of their fair value, due to the short payment and
settlement periods applied by the Group.
The fair value of fixed-rate loans and receivables depends on movements in interest rates and the credit risk of the
counterparty.
Valuations produced by these models are adjusted to take account of changes in Group credit risk.
FAIR VALUES DETERMINED USING MODELS INTEGRATING CERTAIN NON-OBSERVABLE DATA (LEVEL 3)
Derivative instruments valued using internal models integrating certain non-observable data include certain electricity
derivative instruments for which there are no quoted prices in an active market (notably for electricity purchase
options with extremely long maturity) or observable market data (forward prices for component materials, interest-
rate curves, etc.), in particular for distant maturities.
8.2.2 Financial assets
The following tables present the net carrying amount and fair value of Group financial assets as of December 31, 2017,
grouped together in accordance with IFRS 7 categories.
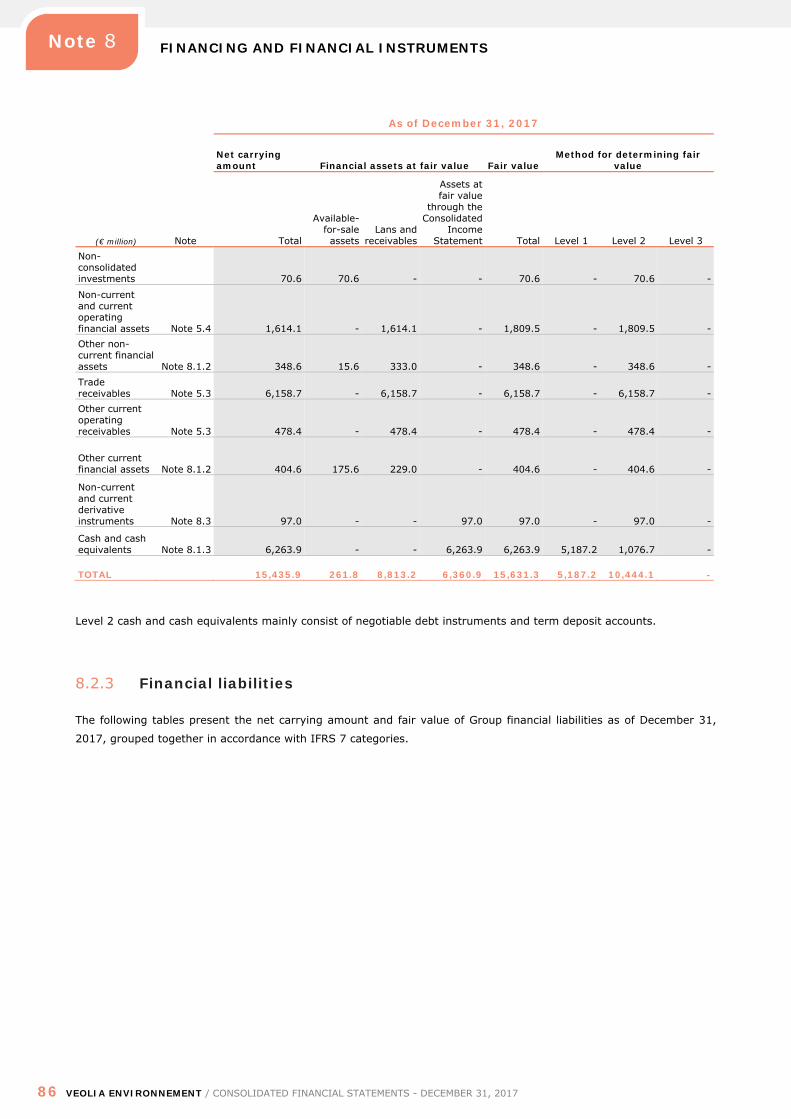
FINANCING AND FINANCIAL INSTRUMENTS
86 VEOLIA ENVIRONNEMENT / CONSOLIDATED FINANCIAL STATEMENTS - DECEMBER 31, 2017
Note 8
(€ million) Note
As of December 31, 2017
Net carrying amount Financial assets at fair value Fair value
Method for determining fair value
Total
Available-for-sale assets
Lans and receivables
Assets at fair value
through the Consolidated
Income Statement Total Level 1 Level 2 Level 3
Non-consolidated investments 70.6 70.6 - - 70.6 - 70.6 -
Non-current and current operating financial assets Note 5.4 1,614.1 - 1,614.1 - 1,809.5 - 1,809.5 - Other non-current financial assets Note 8.1.2 348.6 15.6 333.0 - 348.6 - 348.6 - Trade receivables Note 5.3 6,158.7 - 6,158.7 - 6,158.7 - 6,158.7 - Other current operating receivables Note 5.3 478.4 - 478.4 - 478.4 - 478.4 -
Other current financial assets Note 8.1.2 404.6 175.6 229.0 - 404.6 - 404.6 -
Non-current and current derivative instruments Note 8.3 97.0 - - 97.0 97.0 - 97.0 -
Cash and cash equivalents Note 8.1.3 6,263.9 - - 6,263.9 6,263.9 5,187.2 1,076.7 -
TOTAL 15,435.9 261.8 8,813.2 6,360.9 15,631.3 5,187.2 10,444.1 -
Level 2 cash and cash equivalents mainly consist of negotiable debt instruments and term deposit accounts.
8.2.3 Financial liabilities
The following tables present the net carrying amount and fair value of Group financial liabilities as of December 31,
2017, grouped together in accordance with IFRS 7 categories.
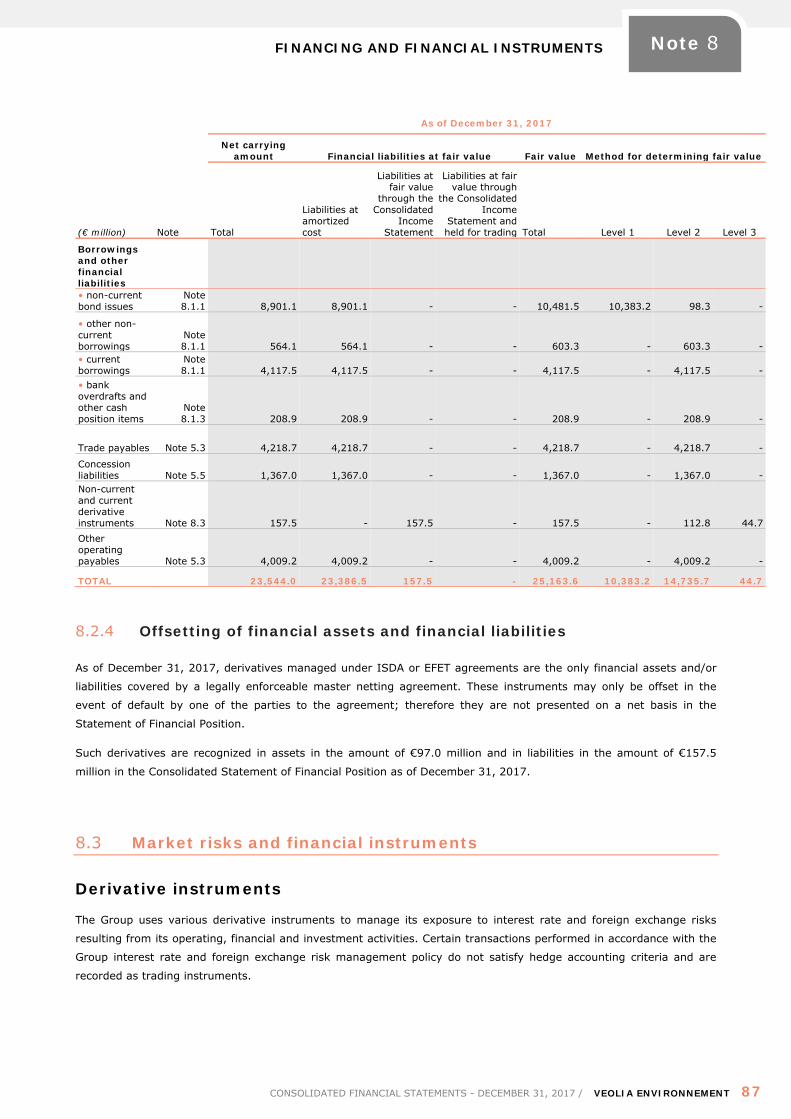
FINANCING AND FINANCIAL INSTRUMENTS
CONSOLIDATED FINANCIAL STATEMENTS - DECEMBER 31, 2017 / VEOLIA ENVIRONNEMENT 87
Note 8
As of December 31, 2017
Net carrying
amount Financial liabilities at fair value Fair value Method for determining fair value
(€ million) Note Total
Liabilities at amortized cost
Liabilities at fair value
through the Consolidated
Income Statement
Liabilities at fair value through
the Consolidated Income
Statement and held for trading Total Level 1 Level 2 Level 3
Borrowings and other financial liabilities • non-current bond issues
Note 8.1.1 8,901.1 8,901.1 - - 10,481.5 10,383.2 98.3 -
• other non-current borrowings
Note 8.1.1 564.1 564.1 - - 603.3 - 603.3 -
• current borrowings
Note 8.1.1 4,117.5 4,117.5 - - 4,117.5 - 4,117.5 -
• bank overdrafts and other cash position items
Note 8.1.3 208.9 208.9 - - 208.9 - 208.9 -
Trade payables Note 5.3 4,218.7 4,218.7 - - 4,218.7 - 4,218.7 -
Concession liabilities Note 5.5 1,367.0 1,367.0 - - 1,367.0 - 1,367.0 - Non-current and current derivative instruments Note 8.3 157.5 - 157.5 - 157.5 - 112.8 44.7 Other operating payables Note 5.3 4,009.2 4,009.2 - - 4,009.2 - 4,009.2 -
TOTAL 23,544.0 23,386.5 157.5 - 25,163.6 10,383.2 14,735.7 44.7
8.2.4 Offsetting of financial assets and financial liabilities
As of December 31, 2017, derivatives managed under ISDA or EFET agreements are the only financial assets and/or
liabilities covered by a legally enforceable master netting agreement. These instruments may only be offset in the
event of default by one of the parties to the agreement; therefore they are not presented on a net basis in the
Statement of Financial Position.
Such derivatives are recognized in assets in the amount of €97.0 million and in liabilities in the amount of €157.5
million in the Consolidated Statement of Financial Position as of December 31, 2017.
8.3 Market risks and financial instruments
Derivative instruments
The Group uses various derivative instruments to manage its exposure to interest rate and foreign exchange risks
resulting from its operating, financial and investment activities. Certain transactions performed in accordance with the
Group interest rate and foreign exchange risk management policy do not satisfy hedge accounting criteria and are
recorded as trading instruments.

FINANCING AND FINANCIAL INSTRUMENTS
88 VEOLIA ENVIRONNEMENT / CONSOLIDATED FINANCIAL STATEMENTS - DECEMBER 31, 2017
Note 8
Derivative instruments are recognized at fair value in the Consolidated Statement of Financial Position. Other than the
exceptions detailed below, changes in the fair value of derivative instruments are recorded through profit or loss. The
fair value of derivatives is estimated using standard valuation models which take into account active market data.
Net gains and losses on instruments at fair value through profit or loss consist of swapped flows and changes in the
value of the instrument.
Derivative instruments may be designated as hedges under one of three types of hedging relationship: fair value
hedge, cash flow hedge or hedge of a net investment in a foreign operation:
a fair value hedge is a hedge of the exposure to changes in fair value of a recognized asset or liability, or an
identified portion of such an asset or liability, that is attributable to a specific risk (primarily interest rate or foreign
exchange risk), and could affect profit or loss for the period;
a cash flow hedge is a hedge of exposure to variability in cash flows that is attributable to a specific risk associated
with a recognized asset or liability or a highly probable forecast transaction (such as a planned purchase or sale)
and could affect profit or loss for the period;
a hedge of a net investment in a foreign operation hedges the exposure to foreign exchange risk of the net assets
of a foreign operation including loans considered part of the investment (IAS 21, The Effects of Changes in Foreign
Exchange Rates).
An asset, liability, firm commitment, future cash-flow or net investment in a foreign operation qualifies for hedge
accounting if:
the hedging relationship is precisely defined and documented at the inception date;
the effectiveness of the hedge is demonstrated at inception and by regular verification of the offsetting nature of
movements in the market value of the hedging instrument and the hedged item. The ineffective portion of the
hedge is systematically recognized in the Consolidated Income Statement.
The use of hedge accounting has the following consequences, in the case of:
fair value hedges of existing assets and liabilities, the hedged portion of these items is measured at fair value in
the Consolidated Statement of Financial Position. The gain or loss on remeasurement is recognized in the
Consolidated Income Statement, where it is offset against matching gains or losses arising on the fair value
remeasurement of the hedging financial instrument, to the extent it is effective;
cash flow hedges, the portion of the gain or loss on the fair value remeasurement of the hedging instrument that
is determined to be an effective hedge is recognized directly in other comprehensive income, while the gain or loss
on the fair value remeasurement of the underlying item is not recognized in the Consolidated Statement of
Financial Position. The ineffective portion of the gain or loss on the hedging instrument is recognized in profit or
loss. Gains or losses recognized in other comprehensive income are reclassified to profit or loss in the same period
or periods in which the asset acquired or liability issued affects profit or loss;
net investment hedges, the effective portion of the gain or loss on the hedging instrument is recognized in
translation reserves in other comprehensive income, while the ineffective portion is recognized in the Consolidated
Income Statement. Gains and losses recognized in foreign exchange translation reserves are reclassified to profit
or loss when the foreign investment is sold.
FINANCING AND FINANCIAL INSTRUMENTS
CONSOLIDATED FINANCIAL STATEMENTS - DECEMBER 31, 2017 / VEOLIA ENVIRONNEMENT 89
Note 8
Embedded derivatives
An embedded derivative is a component of a host contract that satisfies the definition of a derivative instrument and
whose economic characteristics are not closely related to that of the host contract. An embedded derivative must be
separated from its host contract and accounted for as a derivative if, and only if, the following three conditions are
satisfied:
the economic characteristics and risks of the embedded derivative are not closely related to the economic
characteristics and risks of the host contract;
the embedded derivative satisfies the definition of a derivative laid down in IAS 39; and
the hybrid instrument is not measured at fair value with changes in fair value recognized in the Consolidated
Income Statement.
Commodity purchases/sales
These purchase / sales contracts are generally recognized outside the scope of IAS 39 (“own use” exemption), except
for certain specific transactions in coal and electricity. For these specific transactions, cash flow hedge accounting is
systematically preferred.
Options and forward purchase and sale contracts with physical delivery are excluded from the application scope of
IAS 39 if entered into for own use (“exception for own-use”).
This exception is applicable when the following conditions are satisfied:
the volumes purchased or sold under the contracts reflect the operating requirements of the subsidiary;
the contracts are not subject to net settlement as defined by IAS 39 and, in particular, physical delivery is
systematic;
the contracts are not equivalent to sales of options, as defined by IAS 39.
Certain subsidiaries enter into electricity transactions (forward contracts, options) which are recognized as derivative
instruments in accordance with IAS 39.
Instruments falling within the application scope of IAS 39 are derivative instruments and are measured at fair value,
calculated using models mostly based on data. Fair value movements are recorded in operating income. The net
impact of the unwinding of these transactions is recorded in revenue.
The Group is exposed to the following financial risks in the course of its operating and financial activities:
Market risks presented:
o interest-rate risk (interest-rate fair value hedges, cash flow hedges and derivatives not qualifying for
hedge accounting);
o foreign exchange risk (hedges of a net investment in a foreign operation, hedges of balance sheet
foreign exchange exposure by derivatives not qualifying for hedge accounting, embedded
derivatives, overall foreign exchange risk exposure);
o commodity risk (fuel and electricity risks, greenhouse gas emission rights);
Liquidity risk;
Credit risk.
Equity risk is presented in Notes 8.1.3.2. and 9.2.2.2.
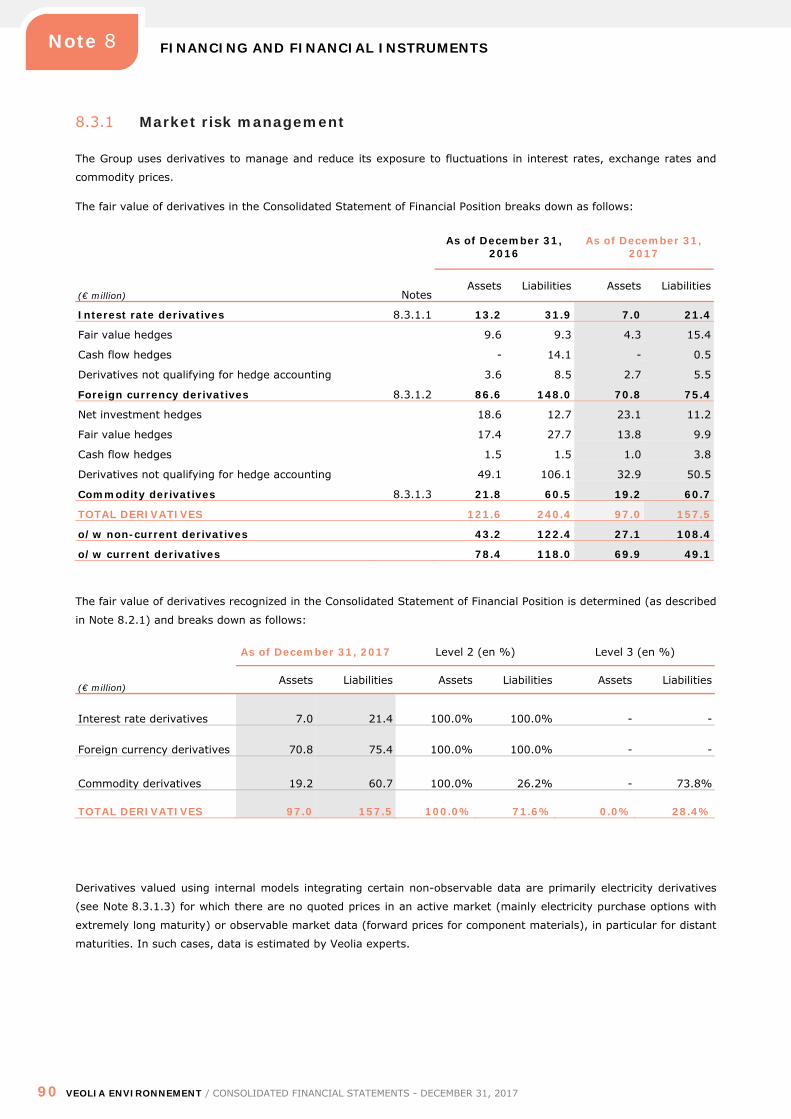
FINANCING AND FINANCIAL INSTRUMENTS
90 VEOLIA ENVIRONNEMENT / CONSOLIDATED FINANCIAL STATEMENTS - DECEMBER 31, 2017
Note 8
8.3.1 Market risk management
The Group uses derivatives to manage and reduce its exposure to fluctuations in interest rates, exchange rates and
commodity prices.
The fair value of derivatives in the Consolidated Statement of Financial Position breaks down as follows:
(€ million) Notes
As of December 31, 2016
As of December 31, 2017
Assets Liabilities Assets Liabilities
Interest rate derivatives 8.3.1.1 13.2 31.9 7.0 21.4
Fair value hedges 9.6 9.3 4.3 15.4
Cash flow hedges - 14.1 - 0.5
Derivatives not qualifying for hedge accounting 3.6 8.5 2.7 5.5
Foreign currency derivatives 8.3.1.2 86.6 148.0 70.8 75.4
Net investment hedges 18.6 12.7 23.1 11.2
Fair value hedges 17.4 27.7 13.8 9.9
Cash flow hedges 1.5 1.5 1.0 3.8
Derivatives not qualifying for hedge accounting 49.1 106.1 32.9 50.5
Commodity derivatives 8.3.1.3 21.8 60.5 19.2 60.7
TOTAL DERIVATIVES 121.6 240.4 97.0 157.5
o/w non-current derivatives 43.2 122.4 27.1 108.4
o/w current derivatives 78.4 118.0 69.9 49.1
The fair value of derivatives recognized in the Consolidated Statement of Financial Position is determined (as described
in Note 8.2.1) and breaks down as follows:
(€ million)
As of December 31, 2017 Level 2 (en %) Level 3 (en %)
Assets Liabilities Assets Liabilities Assets Liabilities
Interest rate derivatives 7.0 21.4 100.0% 100.0% - -
Foreign currency derivatives 70.8 75.4 100.0% 100.0% - -
Commodity derivatives 19.2 60.7 100.0% 26.2% - 73.8%
TOTAL DERIVATIVES 97.0 157.5 100.0% 71.6% 0.0% 28.4%
Derivatives valued using internal models integrating certain non-observable data are primarily electricity derivatives
(see Note 8.3.1.3) for which there are no quoted prices in an active market (mainly electricity purchase options with
extremely long maturity) or observable market data (forward prices for component materials), in particular for distant
maturities. In such cases, data is estimated by Veolia experts.
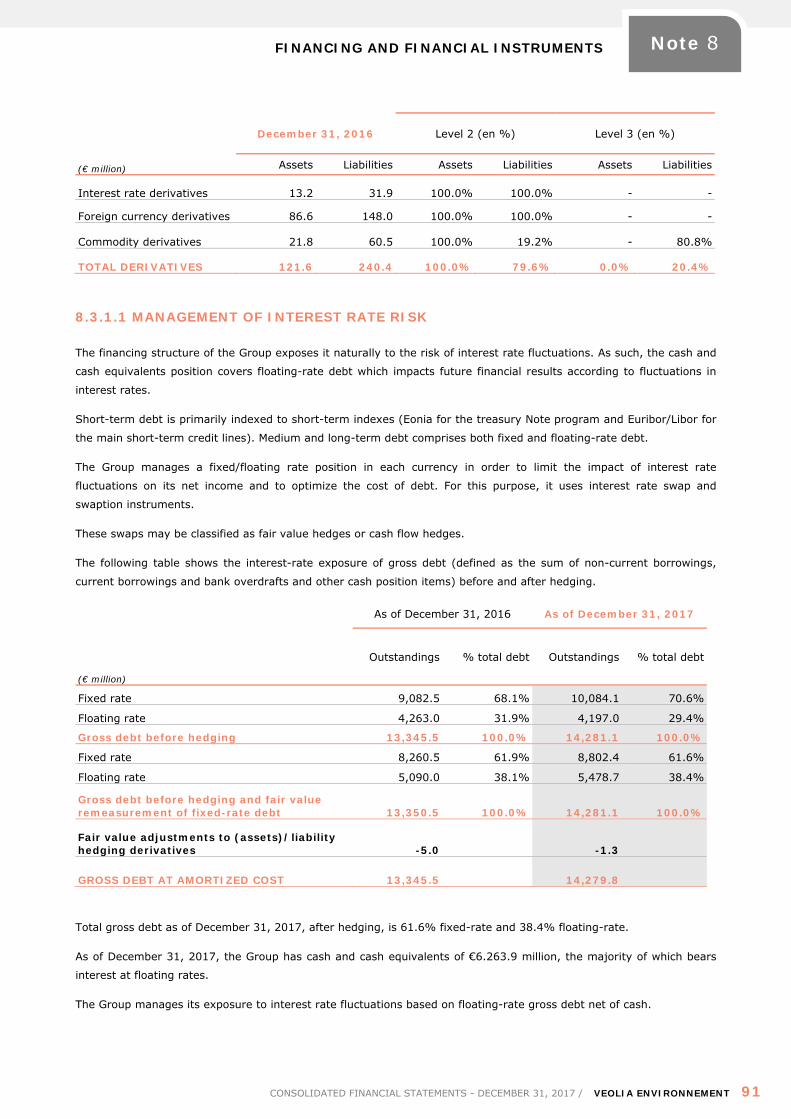
FINANCING AND FINANCIAL INSTRUMENTS
CONSOLIDATED FINANCIAL STATEMENTS - DECEMBER 31, 2017 / VEOLIA ENVIRONNEMENT 91
Note 8
(€ million)
December 31, 2016 Level 2 (en %) Level 3 (en %)
Assets Liabilities Assets Liabilities Assets Liabilities
Interest rate derivatives 13.2 31.9 100.0% 100.0% - -
Foreign currency derivatives 86.6 148.0 100.0% 100.0% - -
Commodity derivatives 21.8 60.5 100.0% 19.2% - 80.8%
TOTAL DERIVATIVES 121.6 240.4 100.0% 79.6% 0.0% 20.4%
8.3.1.1 MANAGEMENT OF INTEREST RATE RISK
The financing structure of the Group exposes it naturally to the risk of interest rate fluctuations. As such, the cash and
cash equivalents position covers floating-rate debt which impacts future financial results according to fluctuations in
interest rates.
Short-term debt is primarily indexed to short-term indexes (Eonia for the treasury Note program and Euribor/Libor for
the main short-term credit lines). Medium and long-term debt comprises both fixed and floating-rate debt.
The Group manages a fixed/floating rate position in each currency in order to limit the impact of interest rate
fluctuations on its net income and to optimize the cost of debt. For this purpose, it uses interest rate swap and
swaption instruments.
These swaps may be classified as fair value hedges or cash flow hedges.
The following table shows the interest-rate exposure of gross debt (defined as the sum of non-current borrowings,
current borrowings and bank overdrafts and other cash position items) before and after hedging.
(€ million)
As of December 31, 2016 As of December 31, 2017
Outstandings % total debt Outstandings % total debt
Fixed rate 9,082.5 68.1% 10,084.1 70.6%
Floating rate 4,263.0 31.9% 4,197.0 29.4%
Gross debt before hedging 13,345.5 100.0% 14,281.1 100.0%
Fixed rate 8,260.5 61.9% 8,802.4 61.6%
Floating rate 5,090.0 38.1% 5,478.7 38.4%
Gross debt before hedging and fair value remeasurement of fixed-rate debt 13,350.5 100.0% 14,281.1 100.0%
Fair value adjustments to (assets)/liability hedging derivatives -5.0 -1.3
GROSS DEBT AT AMORTIZED COST 13,345.5 14,279.8
Total gross debt as of December 31, 2017, after hedging, is 61.6% fixed-rate and 38.4% floating-rate.
As of December 31, 2017, the Group has cash and cash equivalents of €6.263.9 million, the majority of which bears
interest at floating rates.
The Group manages its exposure to interest rate fluctuations based on floating-rate gross debt net of cash.
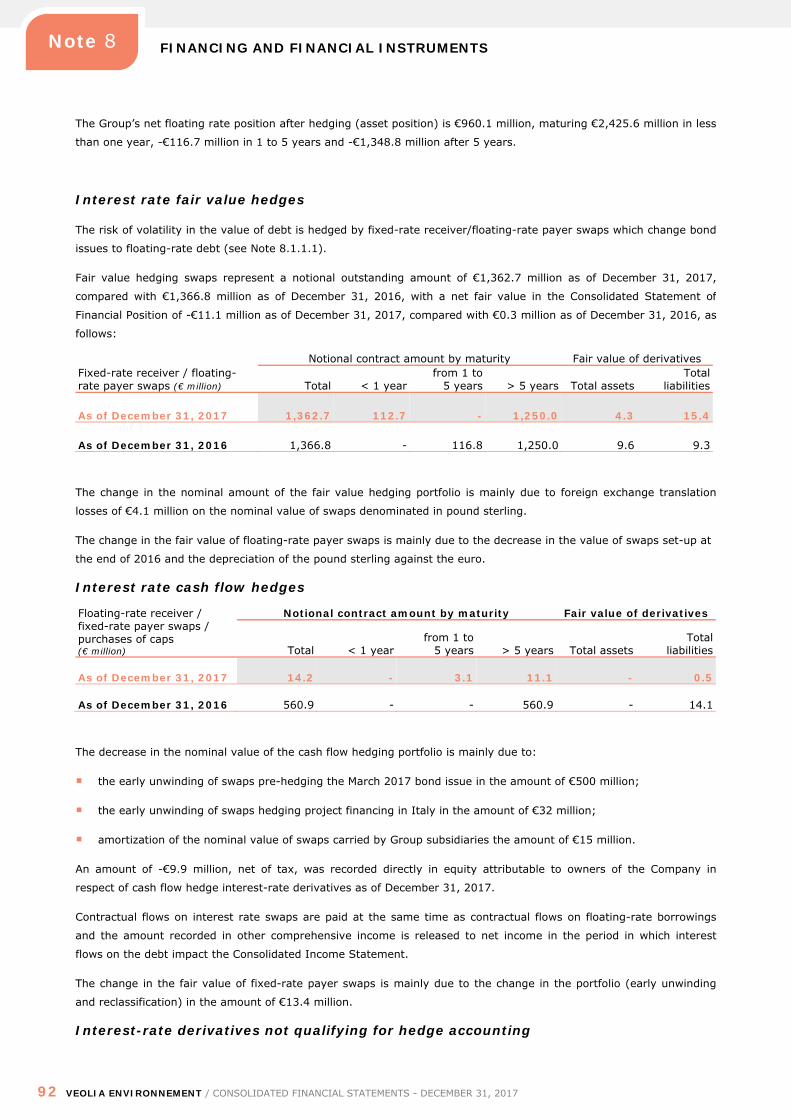
FINANCING AND FINANCIAL INSTRUMENTS
92 VEOLIA ENVIRONNEMENT / CONSOLIDATED FINANCIAL STATEMENTS - DECEMBER 31, 2017
Note 8
The Group’s net floating rate position after hedging (asset position) is €960.1 million, maturing €2,425.6 million in less
than one year, -€116.7 million in 1 to 5 years and -€1,348.8 million after 5 years.
Interest rate fair value hedges
The risk of volatility in the value of debt is hedged by fixed-rate receiver/floating-rate payer swaps which change bond
issues to floating-rate debt (see Note 8.1.1.1).
Fair value hedging swaps represent a notional outstanding amount of €1,362.7 million as of December 31, 2017,
compared with €1,366.8 million as of December 31, 2016, with a net fair value in the Consolidated Statement of
Financial Position of -€11.1 million as of December 31, 2017, compared with €0.3 million as of December 31, 2016, as
follows:
Fixed-rate receiver / floating-rate payer swaps (€ million)
Notional contract amount by maturity Fair value of derivatives
Total < 1 year from 1 to
5 years > 5 years Total assets Total
liabilities
As of December 31, 2017 1,362.7 112.7 - 1,250.0 4.3 15.4
As of December 31, 2016 1,366.8 - 116.8 1,250.0 9.6 9.3
The change in the nominal amount of the fair value hedging portfolio is mainly due to foreign exchange translation
losses of €4.1 million on the nominal value of swaps denominated in pound sterling.
The change in the fair value of floating-rate payer swaps is mainly due to the decrease in the value of swaps set-up at
the end of 2016 and the depreciation of the pound sterling against the euro.
Interest rate cash flow hedges
Floating-rate receiver / fixed-rate payer swaps / purchases of caps (€ million)
Notional contract amount by maturity Fair value of derivatives
Total < 1 year from 1 to
5 years > 5 years Total assets Total
liabilities
As of December 31, 2017 14.2 - 3.1 11.1 - 0.5
As of December 31, 2016 560.9 - - 560.9 - 14.1
The decrease in the nominal value of the cash flow hedging portfolio is mainly due to:
the early unwinding of swaps pre-hedging the March 2017 bond issue in the amount of €500 million;
the early unwinding of swaps hedging project financing in Italy in the amount of €32 million;
amortization of the nominal value of swaps carried by Group subsidiaries the amount of €15 million.
An amount of -€9.9 million, net of tax, was recorded directly in equity attributable to owners of the Company in
respect of cash flow hedge interest-rate derivatives as of December 31, 2017.
Contractual flows on interest rate swaps are paid at the same time as contractual flows on floating-rate borrowings
and the amount recorded in other comprehensive income is released to net income in the period in which interest
flows on the debt impact the Consolidated Income Statement.
The change in the fair value of fixed-rate payer swaps is mainly due to the change in the portfolio (early unwinding
and reclassification) in the amount of €13.4 million.
Interest-rate derivatives not qualifying for hedge accounting
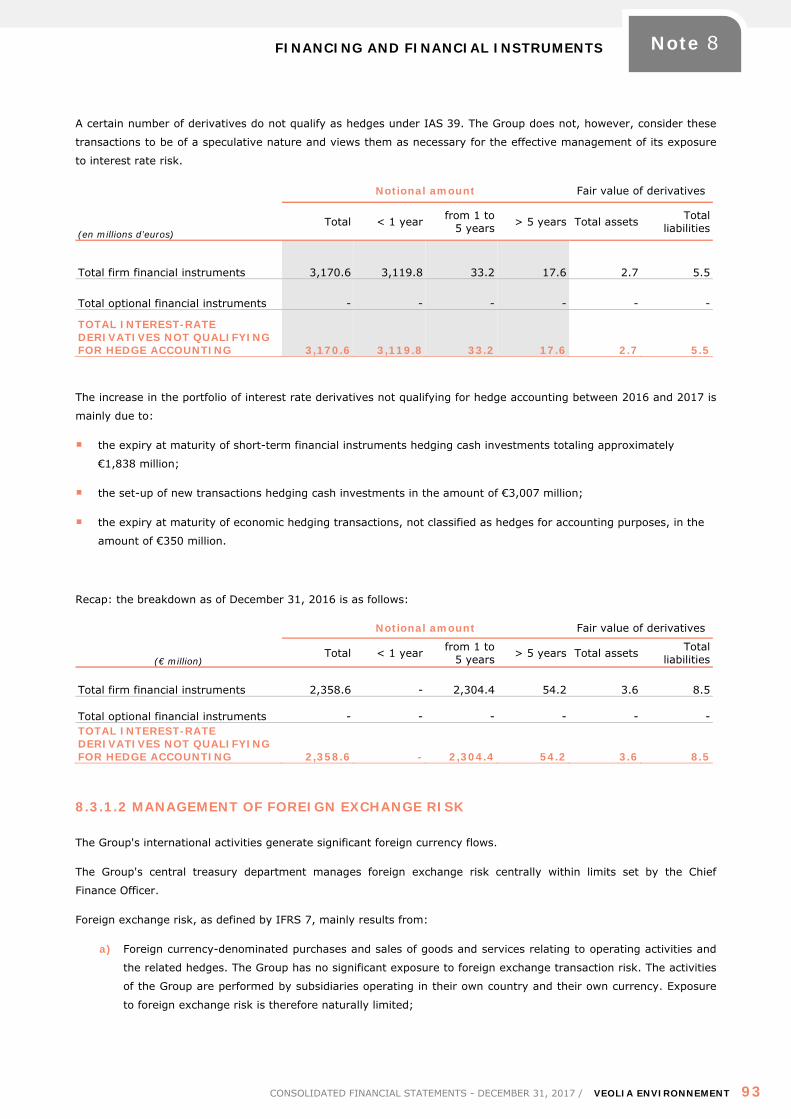
FINANCING AND FINANCIAL INSTRUMENTS
CONSOLIDATED FINANCIAL STATEMENTS - DECEMBER 31, 2017 / VEOLIA ENVIRONNEMENT 93
Note 8
A certain number of derivatives do not qualify as hedges under IAS 39. The Group does not, however, consider these
transactions to be of a speculative nature and views them as necessary for the effective management of its exposure
to interest rate risk.
Notional amount Fair value of derivatives
(en millions d’euros) Total < 1 year from 1 to
5 years > 5 years Total assets Total liabilities
Total firm financial instruments 3,170.6 3,119.8 33.2 17.6 2.7 5.5
Total optional financial instruments - - - - - -
TOTAL INTEREST-RATE DERIVATIVES NOT QUALIFYING FOR HEDGE ACCOUNTING 3,170.6 3,119.8 33.2 17.6 2.7 5.5
The increase in the portfolio of interest rate derivatives not qualifying for hedge accounting between 2016 and 2017 is
mainly due to:
the expiry at maturity of short-term financial instruments hedging cash investments totaling approximately
€1,838 million;
the set-up of new transactions hedging cash investments in the amount of €3,007 million;
the expiry at maturity of economic hedging transactions, not classified as hedges for accounting purposes, in the
amount of €350 million.
Recap: the breakdown as of December 31, 2016 is as follows:
(€ million)
Notional amount Fair value of derivatives
Total < 1 year from 1 to 5 years > 5 years Total assets Total
liabilities
Total firm financial instruments 2,358.6 - 2,304.4 54.2 3.6 8.5
Total optional financial instruments - - - - - - TOTAL INTEREST-RATE DERIVATIVES NOT QUALIFYING FOR HEDGE ACCOUNTING 2,358.6 - 2,304.4 54.2 3.6 8.5
8.3.1.2 MANAGEMENT OF FOREIGN EXCHANGE RISK
The Group's international activities generate significant foreign currency flows.
The Group's central treasury department manages foreign exchange risk centrally within limits set by the Chief
Finance Officer.
Foreign exchange risk, as defined by IFRS 7, mainly results from:
a) Foreign currency-denominated purchases and sales of goods and services relating to operating activities and
the related hedges. The Group has no significant exposure to foreign exchange transaction risk. The activities
of the Group are performed by subsidiaries operating in their own country and their own currency. Exposure
to foreign exchange risk is therefore naturally limited;
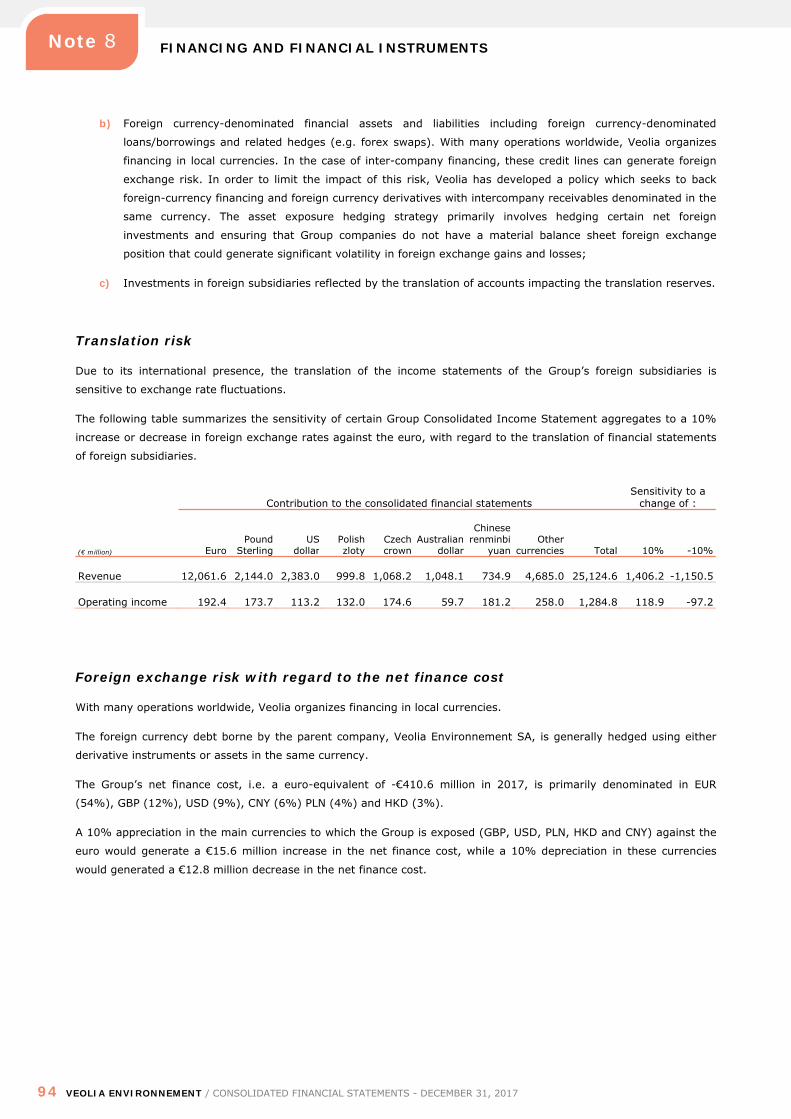
FINANCING AND FINANCIAL INSTRUMENTS
94 VEOLIA ENVIRONNEMENT / CONSOLIDATED FINANCIAL STATEMENTS - DECEMBER 31, 2017
Note 8
b) Foreign currency-denominated financial assets and liabilities including foreign currency-denominated
loans/borrowings and related hedges (e.g. forex swaps). With many operations worldwide, Veolia organizes
financing in local currencies. In the case of inter-company financing, these credit lines can generate foreign
exchange risk. In order to limit the impact of this risk, Veolia has developed a policy which seeks to back
foreign-currency financing and foreign currency derivatives with intercompany receivables denominated in the
same currency. The asset exposure hedging strategy primarily involves hedging certain net foreign
investments and ensuring that Group companies do not have a material balance sheet foreign exchange
position that could generate significant volatility in foreign exchange gains and losses;
c) Investments in foreign subsidiaries reflected by the translation of accounts impacting the translation reserves.
Translation risk
Due to its international presence, the translation of the income statements of the Group’s foreign subsidiaries is
sensitive to exchange rate fluctuations.
The following table summarizes the sensitivity of certain Group Consolidated Income Statement aggregates to a 10%
increase or decrease in foreign exchange rates against the euro, with regard to the translation of financial statements
of foreign subsidiaries.
Contribution to the consolidated financial statements Sensitivity to a
change of :
(€ million) Euro Pound
Sterling US
dollar Polish zloty
Czech crown
Australian dollar
Chinese renminbi
yuan Other
currencies Total 10% -10%
Revenue 12,061.6 2,144.0 2,383.0 999.8 1,068.2 1,048.1 734.9 4,685.0 25,124.6 1,406.2 -1,150.5
Operating income 192.4 173.7 113.2 132.0 174.6 59.7 181.2 258.0 1,284.8 118.9 -97.2
Foreign exchange risk with regard to the net finance cost
With many operations worldwide, Veolia organizes financing in local currencies.
The foreign currency debt borne by the parent company, Veolia Environnement SA, is generally hedged using either
derivative instruments or assets in the same currency.
The Group’s net finance cost, i.e. a euro-equivalent of -€410.6 million in 2017, is primarily denominated in EUR
(54%), GBP (12%), USD (9%), CNY (6%) PLN (4%) and HKD (3%).
A 10% appreciation in the main currencies to which the Group is exposed (GBP, USD, PLN, HKD and CNY) against the
euro would generate a €15.6 million increase in the net finance cost, while a 10% depreciation in these currencies
would generated a €12.8 million decrease in the net finance cost.
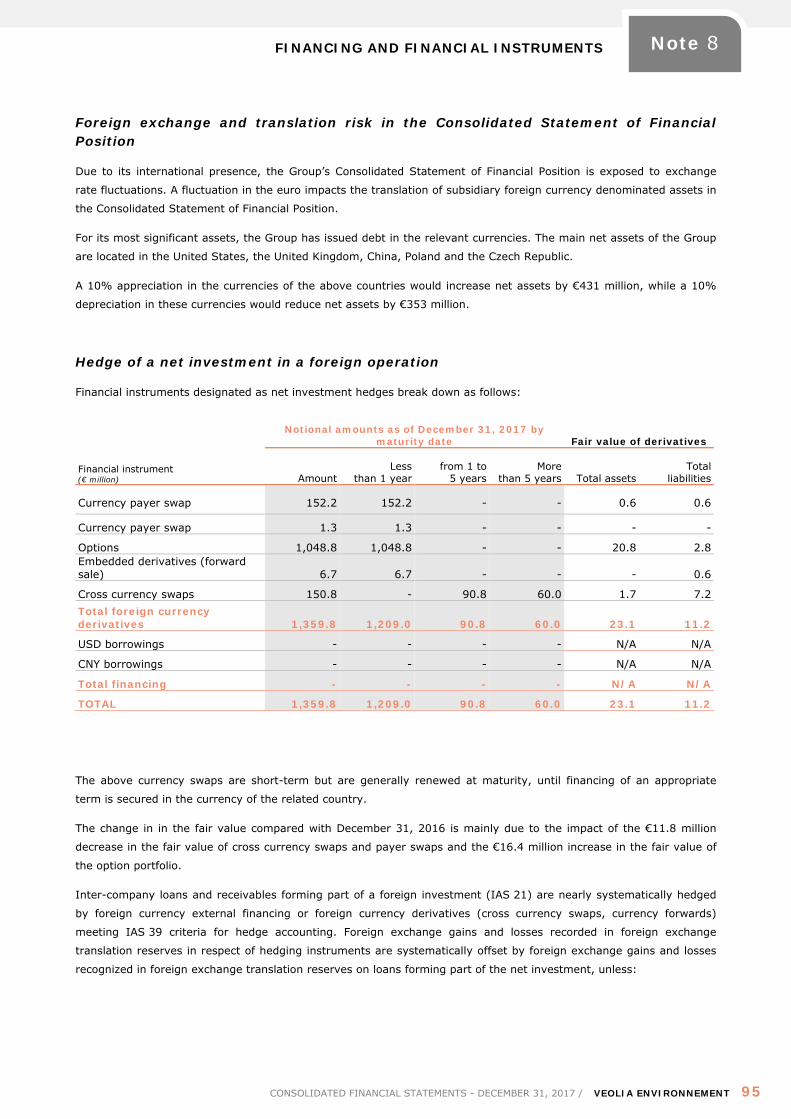
FINANCING AND FINANCIAL INSTRUMENTS
CONSOLIDATED FINANCIAL STATEMENTS - DECEMBER 31, 2017 / VEOLIA ENVIRONNEMENT 95
Note 8
Foreign exchange and translation risk in the Consolidated Statement of Financial Position
Due to its international presence, the Group’s Consolidated Statement of Financial Position is exposed to exchange
rate fluctuations. A fluctuation in the euro impacts the translation of subsidiary foreign currency denominated assets in
the Consolidated Statement of Financial Position.
For its most significant assets, the Group has issued debt in the relevant currencies. The main net assets of the Group
are located in the United States, the United Kingdom, China, Poland and the Czech Republic.
A 10% appreciation in the currencies of the above countries would increase net assets by €431 million, while a 10%
depreciation in these currencies would reduce net assets by €353 million.
Hedge of a net investment in a foreign operation
Financial instruments designated as net investment hedges break down as follows:
Financial instrument (€ million)
Notional amounts as of December 31, 2017 by maturity date Fair value of derivatives
Amount Less
than 1 year from 1 to
5 years More
than 5 years Total assets Total
liabilities
Currency payer swap 152.2 152.2 - - 0.6 0.6
Currency payer swap 1.3 1.3 - - - -
Options 1,048.8 1,048.8 - - 20.8 2.8 Embedded derivatives (forward sale) 6.7 6.7 - - - 0.6
Cross currency swaps 150.8 - 90.8 60.0 1.7 7.2 Total foreign currency derivatives 1,359.8 1,209.0 90.8 60.0 23.1 11.2
USD borrowings - - - - N/A N/A
CNY borrowings - - - - N/A N/A
Total financing - - - - N/A N/A
TOTAL 1,359.8 1,209.0 90.8 60.0 23.1 11.2
The above currency swaps are short-term but are generally renewed at maturity, until financing of an appropriate
term is secured in the currency of the related country.
The change in in the fair value compared with December 31, 2016 is mainly due to the impact of the €11.8 million
decrease in the fair value of cross currency swaps and payer swaps and the €16.4 million increase in the fair value of
the option portfolio.
Inter-company loans and receivables forming part of a foreign investment (IAS 21) are nearly systematically hedged
by foreign currency external financing or foreign currency derivatives (cross currency swaps, currency forwards)
meeting IAS 39 criteria for hedge accounting. Foreign exchange gains and losses recorded in foreign exchange
translation reserves in respect of hedging instruments are systematically offset by foreign exchange gains and losses
recognized in foreign exchange translation reserves on loans forming part of the net investment, unless:
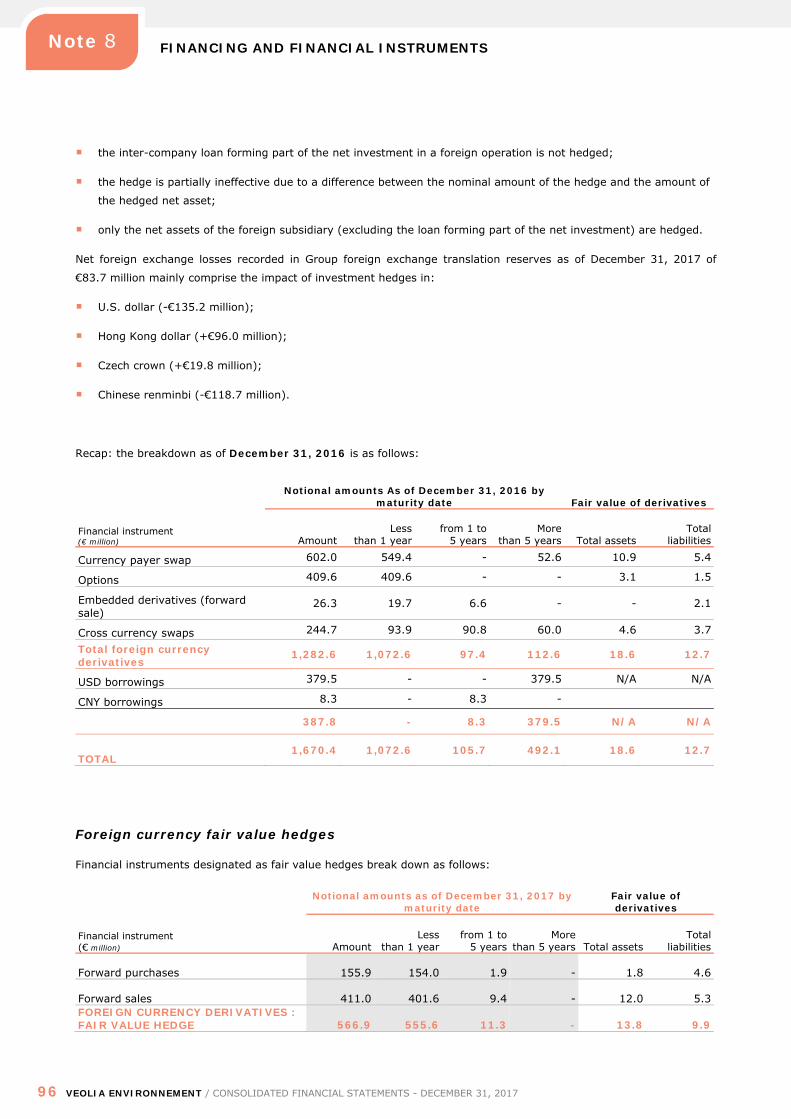
FINANCING AND FINANCIAL INSTRUMENTS
96 VEOLIA ENVIRONNEMENT / CONSOLIDATED FINANCIAL STATEMENTS - DECEMBER 31, 2017
Note 8
the inter-company loan forming part of the net investment in a foreign operation is not hedged;
the hedge is partially ineffective due to a difference between the nominal amount of the hedge and the amount of
the hedged net asset;
only the net assets of the foreign subsidiary (excluding the loan forming part of the net investment) are hedged.
Net foreign exchange losses recorded in Group foreign exchange translation reserves as of December 31, 2017 of
€83.7 million mainly comprise the impact of investment hedges in:
U.S. dollar (-€135.2 million);
Hong Kong dollar (+€96.0 million);
Czech crown (+€19.8 million);
Chinese renminbi (-€118.7 million).
Recap: the breakdown as of December 31, 2016 is as follows:
Financial instrument (€ million)
Notional amounts As of December 31, 2016 by maturity date Fair value of derivatives
Amount Less
than 1 year from 1 to
5 years More
than 5 years Total assets Total
liabilities
Currency payer swap 602.0 549.4 - 52.6 10.9 5.4
Options 409.6 409.6 - - 3.1 1.5
Embedded derivatives (forward sale)
26.3 19.7 6.6 - - 2.1
Cross currency swaps 244.7 93.9 90.8 60.0 4.6 3.7
Total foreign currency derivatives
1,282.6 1,072.6 97.4 112.6 18.6 12.7
USD borrowings 379.5 - - 379.5 N/A N/A
CNY borrowings 8.3 - 8.3 -
387.8 - 8.3 379.5 N/A N/A
TOTAL 1,670.4 1,072.6 105.7 492.1 18.6 12.7
Foreign currency fair value hedges
Financial instruments designated as fair value hedges break down as follows:
Notional amounts as of December 31, 2017 by
maturity date Fair value of derivatives
Financial instrument (€ million) Amount
Less than 1 year
from 1 to 5 years
More than 5 years Total assets
Total liabilities
Forward purchases 155.9 154.0 1.9 - 1.8 4.6
Forward sales 411.0 401.6 9.4 - 12.0 5.3 FOREIGN CURRENCY DERIVATIVES : FAIR VALUE HEDGE 566.9 555.6 11.3 - 13.8 9.9
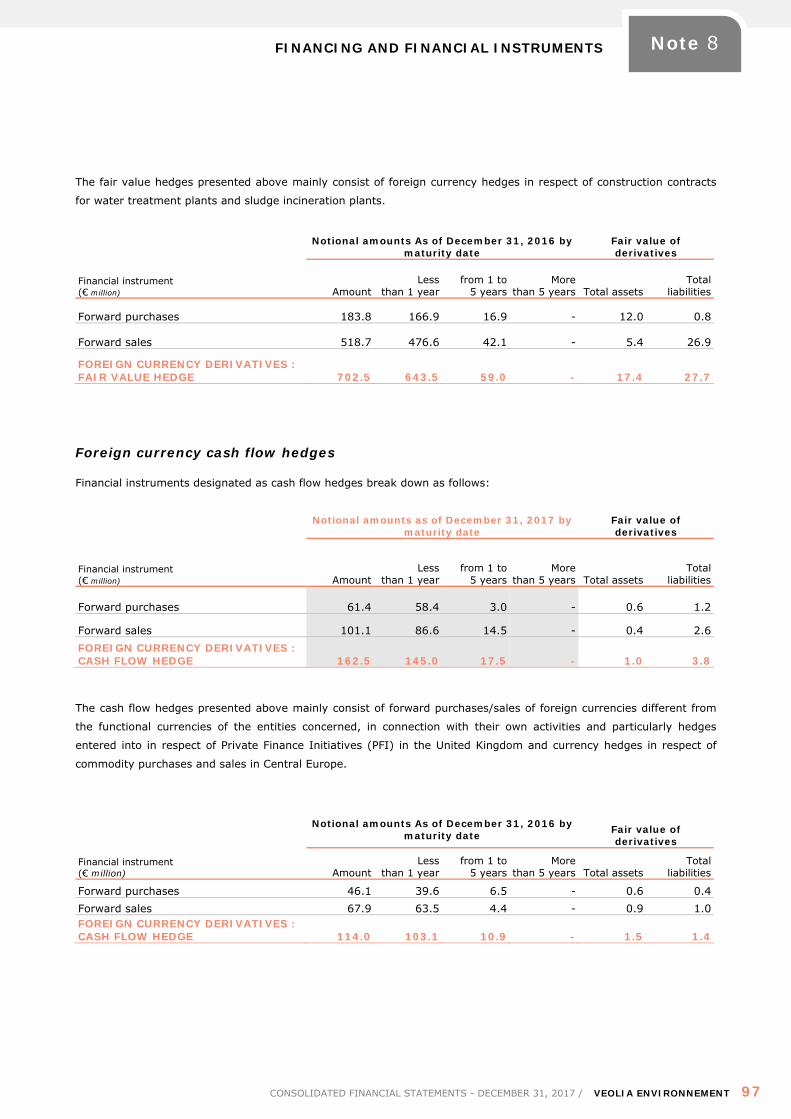
FINANCING AND FINANCIAL INSTRUMENTS
CONSOLIDATED FINANCIAL STATEMENTS - DECEMBER 31, 2017 / VEOLIA ENVIRONNEMENT 97
Note 8
The fair value hedges presented above mainly consist of foreign currency hedges in respect of construction contracts
for water treatment plants and sludge incineration plants.
Notional amounts As of December 31, 2016 by
maturity date Fair value of derivatives
Financial instrument (€ million) Amount
Less than 1 year
from 1 to 5 years
More than 5 years Total assets
Total liabilities
Forward purchases 183.8 166.9 16.9 - 12.0 0.8
Forward sales 518.7 476.6 42.1 - 5.4 26.9
FOREIGN CURRENCY DERIVATIVES : FAIR VALUE HEDGE 702.5 643.5 59.0 - 17.4 27.7
Foreign currency cash flow hedges
Financial instruments designated as cash flow hedges break down as follows:
Notional amounts as of December 31, 2017 by maturity date
Fair value of derivatives
Financial instrument (€ million) Amount
Less than 1 year
from 1 to 5 years
More than 5 years Total assets
Total liabilities
Forward purchases 61.4 58.4 3.0 - 0.6 1.2
Forward sales 101.1 86.6 14.5 - 0.4 2.6 FOREIGN CURRENCY DERIVATIVES : CASH FLOW HEDGE 162.5 145.0 17.5 - 1.0 3.8
The cash flow hedges presented above mainly consist of forward purchases/sales of foreign currencies different from
the functional currencies of the entities concerned, in connection with their own activities and particularly hedges
entered into in respect of Private Finance Initiatives (PFI) in the United Kingdom and currency hedges in respect of
commodity purchases and sales in Central Europe.
Notional amounts As of December 31, 2016 by maturity date Fair value of
derivatives
Financial instrument (€ million) Amount
Less than 1 year
from 1 to 5 years
More than 5 years Total assets
Total liabilities
Forward purchases 46.1 39.6 6.5 - 0.6 0.4 Forward sales 67.9 63.5 4.4 - 0.9 1.0 FOREIGN CURRENCY DERIVATIVES : CASH FLOW HEDGE 114.0 103.1 10.9 - 1.5 1.4
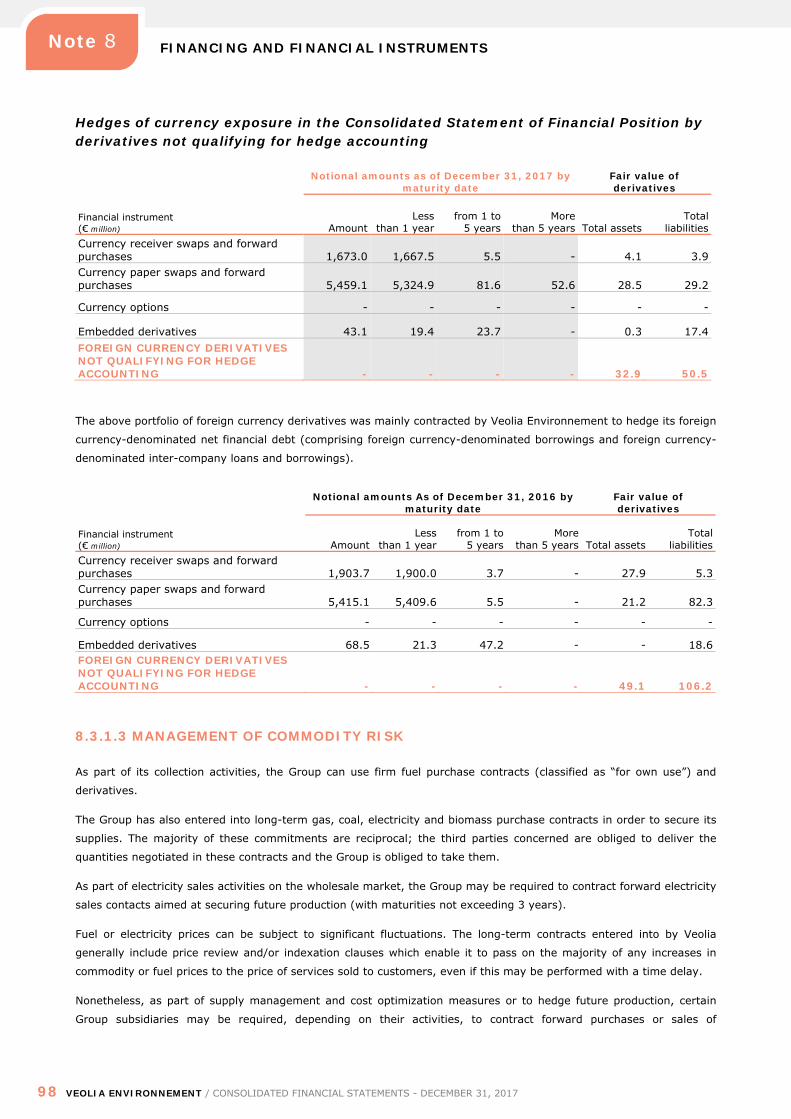
FINANCING AND FINANCIAL INSTRUMENTS
98 VEOLIA ENVIRONNEMENT / CONSOLIDATED FINANCIAL STATEMENTS - DECEMBER 31, 2017
Note 8
Hedges of currency exposure in the Consolidated Statement of Financial Position by derivatives not qualifying for hedge accounting
Notional amounts as of December 31, 2017 by
maturity date Fair value of derivatives
Financial instrument (€ million) Amount
Less than 1 year
from 1 to 5 years
More than 5 years Total assets
Total liabilities
Currency receiver swaps and forward purchases 1,673.0 1,667.5 5.5 - 4.1 3.9 Currency paper swaps and forward purchases 5,459.1 5,324.9 81.6 52.6 28.5 29.2
Currency options - - - - - -
Embedded derivatives 43.1 19.4 23.7 - 0.3 17.4 FOREIGN CURRENCY DERIVATIVES NOT QUALIFYING FOR HEDGE ACCOUNTING - - - - 32.9 50.5
The above portfolio of foreign currency derivatives was mainly contracted by Veolia Environnement to hedge its foreign
currency-denominated net financial debt (comprising foreign currency-denominated borrowings and foreign currency-
denominated inter-company loans and borrowings).
Notional amounts As of December 31, 2016 by
maturity date Fair value of derivatives
Financial instrument (€ million) Amount
Less than 1 year
from 1 to 5 years
More than 5 years Total assets
Total liabilities
Currency receiver swaps and forward purchases 1,903.7 1,900.0 3.7 - 27.9 5.3 Currency paper swaps and forward purchases 5,415.1 5,409.6 5.5 - 21.2 82.3
Currency options - - - - - -
Embedded derivatives 68.5 21.3 47.2 - - 18.6 FOREIGN CURRENCY DERIVATIVES NOT QUALIFYING FOR HEDGE ACCOUNTING - - - - 49.1 106.2
8.3.1.3 MANAGEMENT OF COMMODITY RISK
As part of its collection activities, the Group can use firm fuel purchase contracts (classified as “for own use”) and
derivatives.
The Group has also entered into long-term gas, coal, electricity and biomass purchase contracts in order to secure its
supplies. The majority of these commitments are reciprocal; the third parties concerned are obliged to deliver the
quantities negotiated in these contracts and the Group is obliged to take them.
As part of electricity sales activities on the wholesale market, the Group may be required to contract forward electricity
sales contacts aimed at securing future production (with maturities not exceeding 3 years).
Fuel or electricity prices can be subject to significant fluctuations. The long-term contracts entered into by Veolia
generally include price review and/or indexation clauses which enable it to pass on the majority of any increases in
commodity or fuel prices to the price of services sold to customers, even if this may be performed with a time delay.
Nonetheless, as part of supply management and cost optimization measures or to hedge future production, certain
Group subsidiaries may be required, depending on their activities, to contract forward purchases or sales of
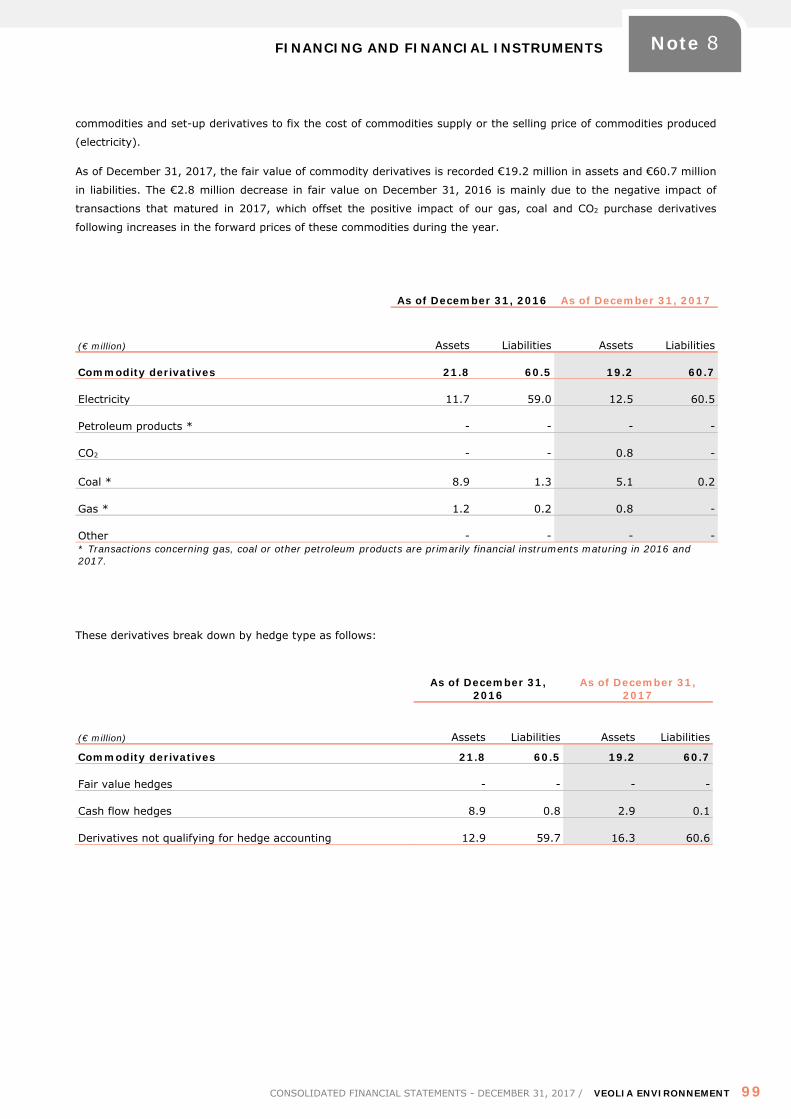
FINANCING AND FINANCIAL INSTRUMENTS
CONSOLIDATED FINANCIAL STATEMENTS - DECEMBER 31, 2017 / VEOLIA ENVIRONNEMENT 99
Note 8
commodities and set-up derivatives to fix the cost of commodities supply or the selling price of commodities produced
(electricity).
As of December 31, 2017, the fair value of commodity derivatives is recorded €19.2 million in assets and €60.7 million
in liabilities. The €2.8 million decrease in fair value on December 31, 2016 is mainly due to the negative impact of
transactions that matured in 2017, which offset the positive impact of our gas, coal and CO2 purchase derivatives
following increases in the forward prices of these commodities during the year.
(€ million)
As of December 31, 2016 As of December 31, 2017
Assets Liabilities Assets Liabilities
Commodity derivatives 21.8 60.5 19.2 60.7
Electricity 11.7 59.0 12.5 60.5
Petroleum products * - - - -
CO2 - - 0.8 -
Coal * 8.9 1.3 5.1 0.2
Gas * 1.2 0.2 0.8 -
Other - - - - * Transactions concerning gas, coal or other petroleum products are primarily financial instruments maturing in 2016 and 2017.
These derivatives break down by hedge type as follows:
(€ million)
As of December 31, 2016
As of December 31, 2017
Assets Liabilities Assets Liabilities
Commodity derivatives 21.8 60.5 19.2 60.7
Fair value hedges - - - -
Cash flow hedges 8.9 0.8 2.9 0.1
Derivatives not qualifying for hedge accounting 12.9 59.7 16.3 60.6
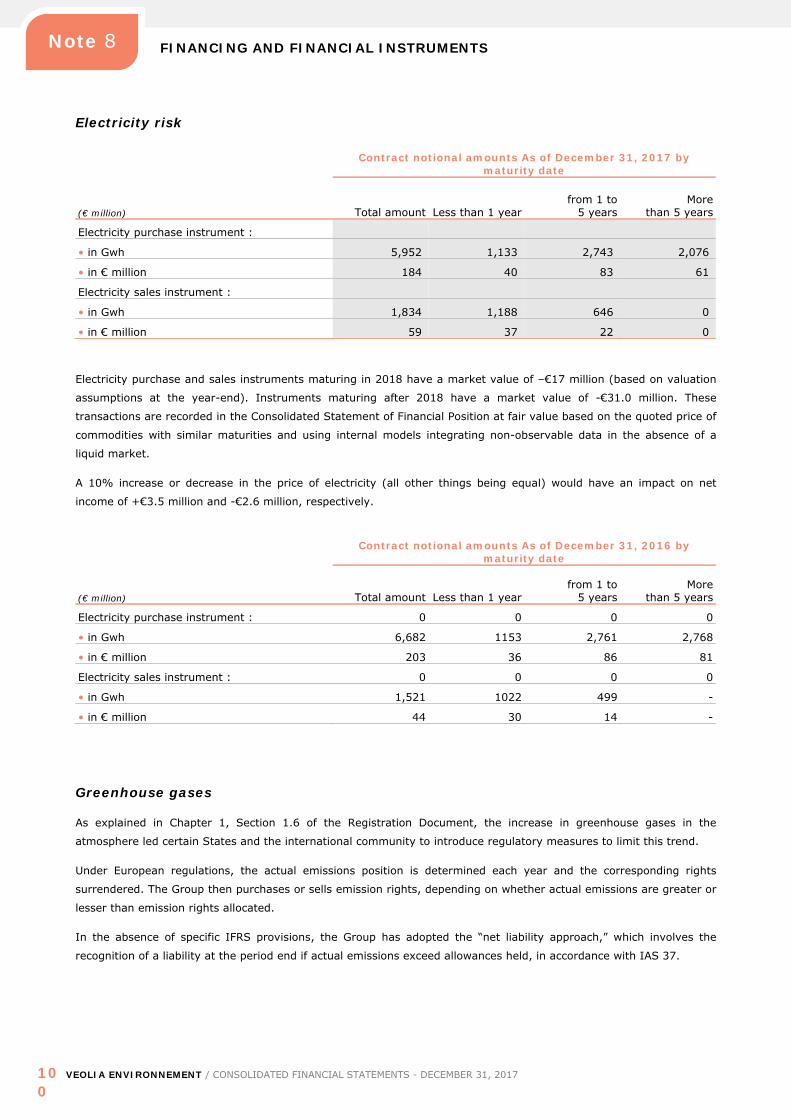
FINANCING AND FINANCIAL INSTRUMENTS
100
VEOLIA ENVIRONNEMENT / CONSOLIDATED FINANCIAL STATEMENTS - DECEMBER 31, 2017
Note 8
Electricity risk
(€ million)
Contract notional amounts As of December 31, 2017 by maturity date
Total amount Less than 1 year from 1 to
5 years More
than 5 years
Electricity purchase instrument :
• in Gwh 5,952 1,133 2,743 2,076
• in € million 184 40 83 61
Electricity sales instrument :
• in Gwh 1,834 1,188 646 0
• in € million 59 37 22 0
Electricity purchase and sales instruments maturing in 2018 have a market value of –€17 million (based on valuation
assumptions at the year-end). Instruments maturing after 2018 have a market value of -€31.0 million. These
transactions are recorded in the Consolidated Statement of Financial Position at fair value based on the quoted price of
commodities with similar maturities and using internal models integrating non-observable data in the absence of a
liquid market.
A 10% increase or decrease in the price of electricity (all other things being equal) would have an impact on net
income of +€3.5 million and -€2.6 million, respectively.
(€ million)
Contract notional amounts As of December 31, 2016 by maturity date
Total amount Less than 1 year from 1 to
5 years More
than 5 years
Electricity purchase instrument : 0 0 0 0
• in Gwh 6,682 1153 2,761 2,768
• in € million 203 36 86 81
Electricity sales instrument : 0 0 0 0
• in Gwh 1,521 1022 499 -
• in € million 44 30 14 -
Greenhouse gases
As explained in Chapter 1, Section 1.6 of the Registration Document, the increase in greenhouse gases in the
atmosphere led certain States and the international community to introduce regulatory measures to limit this trend.
Under European regulations, the actual emissions position is determined each year and the corresponding rights
surrendered. The Group then purchases or sells emission rights, depending on whether actual emissions are greater or
lesser than emission rights allocated.
In the absence of specific IFRS provisions, the Group has adopted the “net liability approach,” which involves the
recognition of a liability at the period end if actual emissions exceed allowances held, in accordance with IAS 37.
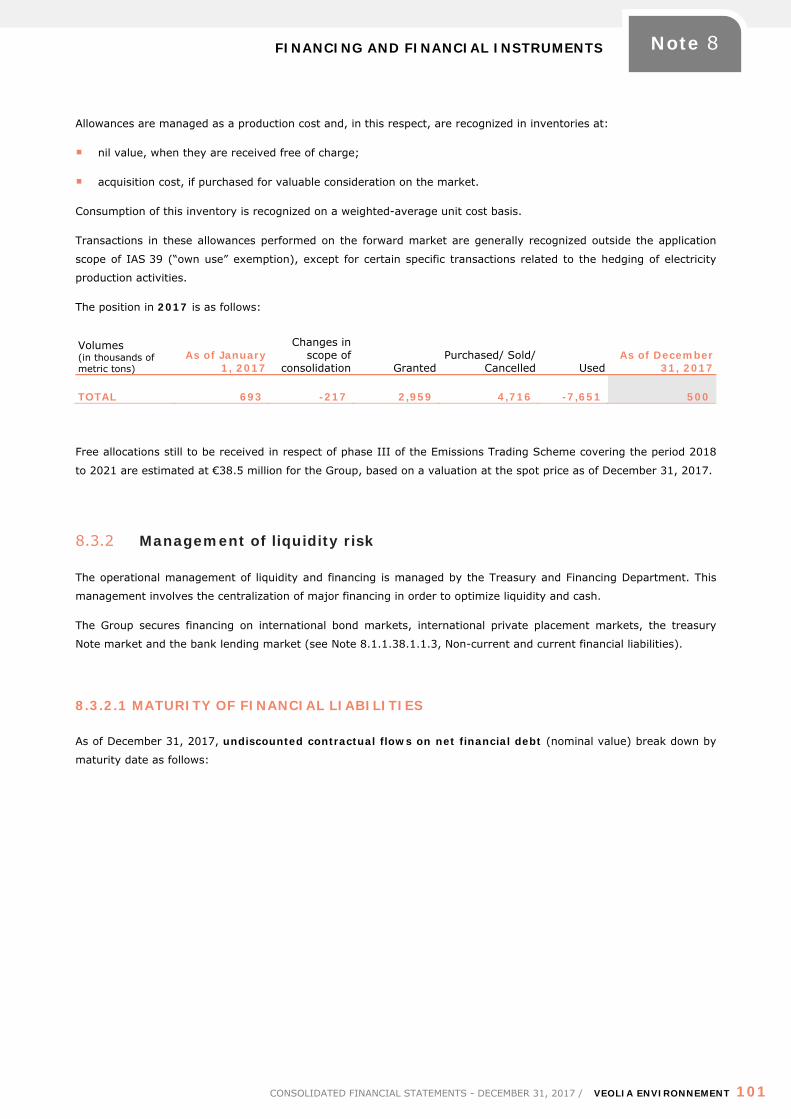
FINANCING AND FINANCIAL INSTRUMENTS
CONSOLIDATED FINANCIAL STATEMENTS - DECEMBER 31, 2017 / VEOLIA ENVIRONNEMENT 101
Note 8
Allowances are managed as a production cost and, in this respect, are recognized in inventories at:
nil value, when they are received free of charge;
acquisition cost, if purchased for valuable consideration on the market.
Consumption of this inventory is recognized on a weighted-average unit cost basis.
Transactions in these allowances performed on the forward market are generally recognized outside the application
scope of IAS 39 (“own use” exemption), except for certain specific transactions related to the hedging of electricity
production activities.
The position in 2017 is as follows:
Volumes (in thousands of metric tons)
As of January 1, 2017
Changes in scope of
consolidation Granted Purchased/ Sold/
Cancelled Used As of December
31, 2017
TOTAL 693 -217 2,959 4,716 -7,651 500
Free allocations still to be received in respect of phase III of the Emissions Trading Scheme covering the period 2018
to 2021 are estimated at €38.5 million for the Group, based on a valuation at the spot price as of December 31, 2017.
8.3.2 Management of liquidity risk
The operational management of liquidity and financing is managed by the Treasury and Financing Department. This
management involves the centralization of major financing in order to optimize liquidity and cash.
The Group secures financing on international bond markets, international private placement markets, the treasury
Note market and the bank lending market (see Note 8.1.1.38.1.1.3, Non-current and current financial liabilities).
8.3.2.1 MATURITY OF FINANCIAL LIABILITIES
As of December 31, 2017, undiscounted contractual flows on net financial debt (nominal value) break down by
maturity date as follows:
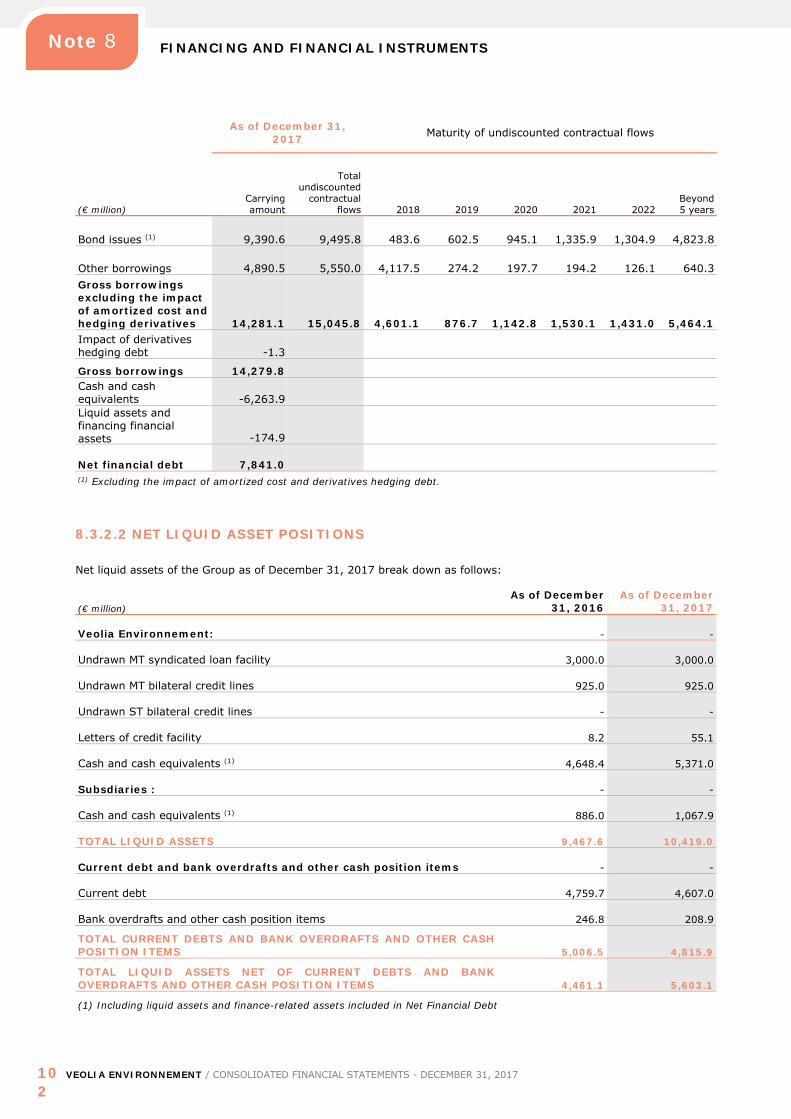
FINANCING AND FINANCIAL INSTRUMENTS
102
VEOLIA ENVIRONNEMENT / CONSOLIDATED FINANCIAL STATEMENTS - DECEMBER 31, 2017
Note 8
(€ million)
As of December 31, 2017 Maturity of undiscounted contractual flows
Carrying amount
Total undiscounted
contractual flows 2018 2019 2020 2021 2022
Beyond 5 years
Bond issues (1) 9,390.6 9,495.8 483.6 602.5 945.1 1,335.9 1,304.9 4,823.8
Other borrowings 4,890.5 5,550.0 4,117.5 274.2 197.7 194.2 126.1 640.3 Gross borrowings excluding the impact of amortized cost and hedging derivatives 14,281.1 15,045.8 4,601.1 876.7 1,142.8 1,530.1 1,431.0 5,464.1 Impact of derivatives hedging debt -1.3
Gross borrowings 14,279.8 Cash and cash equivalents -6,263.9 Liquid assets and financing financial assets -174.9
Net financial debt 7,841.0 (1) Excluding the impact of amortized cost and derivatives hedging debt.
8.3.2.2 NET LIQUID ASSET POSITIONS
Net liquid assets of the Group as of December 31, 2017 break down as follows:
(€ million) As of December
31, 2016 As of December
31, 2017
Veolia Environnement: - -
Undrawn MT syndicated loan facility 3,000.0 3,000.0
Undrawn MT bilateral credit lines 925.0 925.0
Undrawn ST bilateral credit lines - -
Letters of credit facility 8.2 55.1
Cash and cash equivalents (1) 4,648.4 5,371.0
Subsdiaries : - -
Cash and cash equivalents (1) 886.0 1,067.9
TOTAL LIQUID ASSETS 9,467.6 10,419.0
Current debt and bank overdrafts and other cash position items - -
Current debt 4,759.7 4,607.0
Bank overdrafts and other cash position items 246.8 208.9
TOTAL CURRENT DEBTS AND BANK OVERDRAFTS AND OTHER CASH POSITION ITEMS 5,006.5 4,815.9
TOTAL LIQUID ASSETS NET OF CURRENT DEBTS AND BANK OVERDRAFTS AND OTHER CASH POSITION ITEMS 4,461.1 5,603.1
(1) Including liquid assets and finance-related assets included in Net Financial Debt
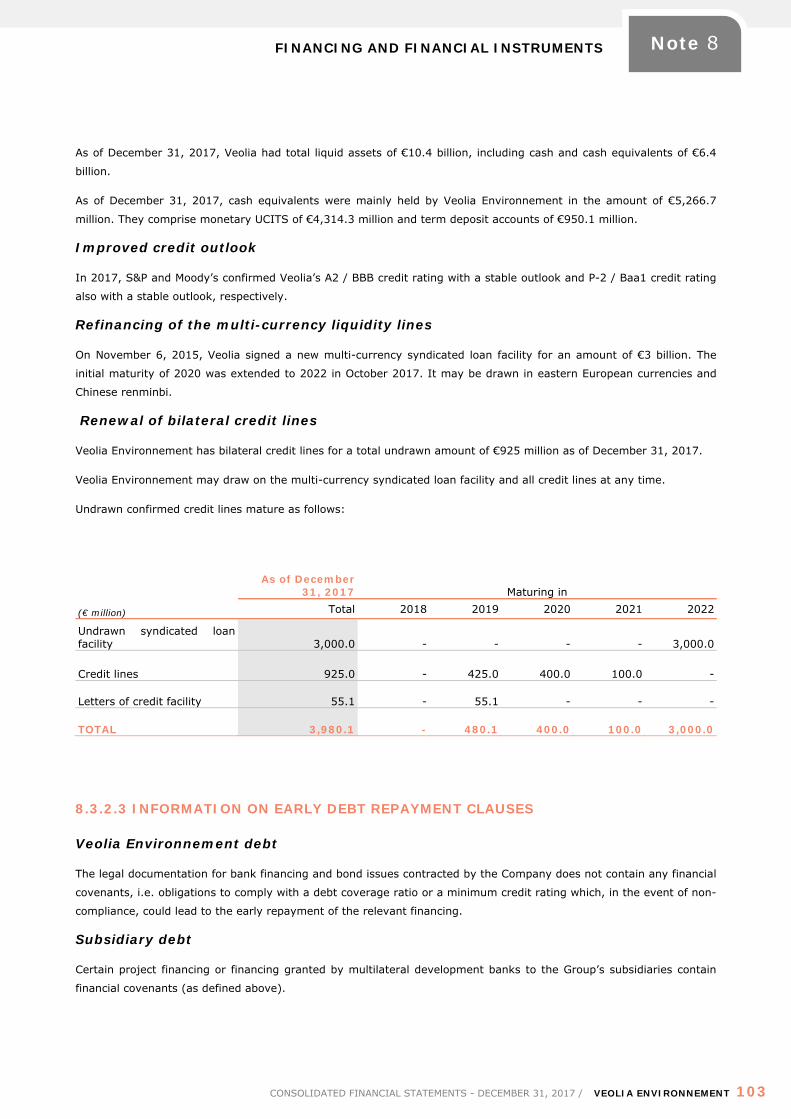
FINANCING AND FINANCIAL INSTRUMENTS
CONSOLIDATED FINANCIAL STATEMENTS - DECEMBER 31, 2017 / VEOLIA ENVIRONNEMENT 103
Note 8
As of December 31, 2017, Veolia had total liquid assets of €10.4 billion, including cash and cash equivalents of €6.4
billion.
As of December 31, 2017, cash equivalents were mainly held by Veolia Environnement in the amount of €5,266.7
million. They comprise monetary UCITS of €4,314.3 million and term deposit accounts of €950.1 million.
Improved credit outlook
In 2017, S&P and Moody’s confirmed Veolia’s A2 / BBB credit rating with a stable outlook and P-2 / Baa1 credit rating
also with a stable outlook, respectively.
Refinancing of the multi-currency liquidity lines
On November 6, 2015, Veolia signed a new multi-currency syndicated loan facility for an amount of €3 billion. The
initial maturity of 2020 was extended to 2022 in October 2017. It may be drawn in eastern European currencies and
Chinese renminbi.
Renewal of bilateral credit lines
Veolia Environnement has bilateral credit lines for a total undrawn amount of €925 million as of December 31, 2017.
Veolia Environnement may draw on the multi-currency syndicated loan facility and all credit lines at any time.
Undrawn confirmed credit lines mature as follows:
(€ million)
As of December 31, 2017 Maturing in
Total 2018 2019 2020 2021 2022
Undrawn syndicated loan facility 3,000.0 - - - - 3,000.0
Credit lines 925.0 - 425.0 400.0 100.0 -
Letters of credit facility 55.1 - 55.1 - - -
TOTAL 3,980.1 - 480.1 400.0 100.0 3,000.0
8.3.2.3 INFORMATION ON EARLY DEBT REPAYMENT CLAUSES
Veolia Environnement debt
The legal documentation for bank financing and bond issues contracted by the Company does not contain any financial
covenants, i.e. obligations to comply with a debt coverage ratio or a minimum credit rating which, in the event of non-
compliance, could lead to the early repayment of the relevant financing.
Subsidiary debt
Certain project financing or financing granted by multilateral development banks to the Group’s subsidiaries contain
financial covenants (as defined above).
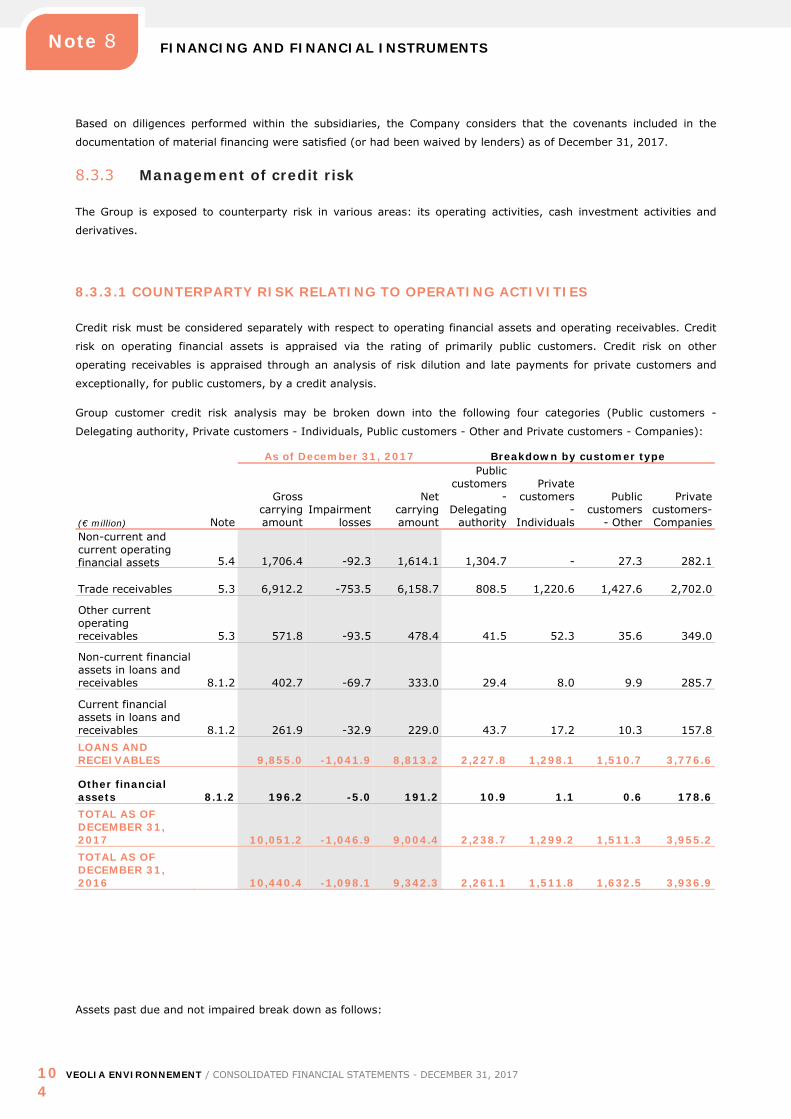
FINANCING AND FINANCIAL INSTRUMENTS
104
VEOLIA ENVIRONNEMENT / CONSOLIDATED FINANCIAL STATEMENTS - DECEMBER 31, 2017
Note 8
Based on diligences performed within the subsidiaries, the Company considers that the covenants included in the
documentation of material financing were satisfied (or had been waived by lenders) as of December 31, 2017.
8.3.3 Management of credit risk
The Group is exposed to counterparty risk in various areas: its operating activities, cash investment activities and
derivatives.
8.3.3.1 COUNTERPARTY RISK RELATING TO OPERATING ACTIVITIES
Credit risk must be considered separately with respect to operating financial assets and operating receivables. Credit
risk on operating financial assets is appraised via the rating of primarily public customers. Credit risk on other
operating receivables is appraised through an analysis of risk dilution and late payments for private customers and
exceptionally, for public customers, by a credit analysis.
Group customer credit risk analysis may be broken down into the following four categories (Public customers -
Delegating authority, Private customers - Individuals, Public customers - Other and Private customers - Companies):
(€ million) Note
As of December 31, 2017 Breakdown by customer type
Gross carrying amount
Impairment losses
Net carrying amount
Public customers
- Delegating
authority
Private customers
- Individuals
Public customers
- Other
Private customers- Companies
Non-current and current operating financial assets 5.4 1,706.4 -92.3 1,614.1 1,304.7 - 27.3 282.1
Trade receivables 5.3 6,912.2 -753.5 6,158.7 808.5 1,220.6 1,427.6 2,702.0
Other current operating receivables 5.3 571.8 -93.5 478.4 41.5 52.3 35.6 349.0
Non-current financial assets in loans and receivables 8.1.2 402.7 -69.7 333.0 29.4 8.0 9.9 285.7
Current financial assets in loans and receivables 8.1.2 261.9 -32.9 229.0 43.7 17.2 10.3 157.8 LOANS AND RECEIVABLES 9,855.0 -1,041.9 8,813.2 2,227.8 1,298.1 1,510.7 3,776.6
Other financial assets 8.1.2 196.2 -5.0 191.2 10.9 1.1 0.6 178.6 TOTAL AS OF DECEMBER 31, 2017 10,051.2 -1,046.9 9,004.4 2,238.7 1,299.2 1,511.3 3,955.2 TOTAL AS OF DECEMBER 31, 2016 10,440.4 -1,098.1 9,342.3 2,261.1 1,511.8 1,632.5 3,936.9
Assets past due and not impaired break down as follows:
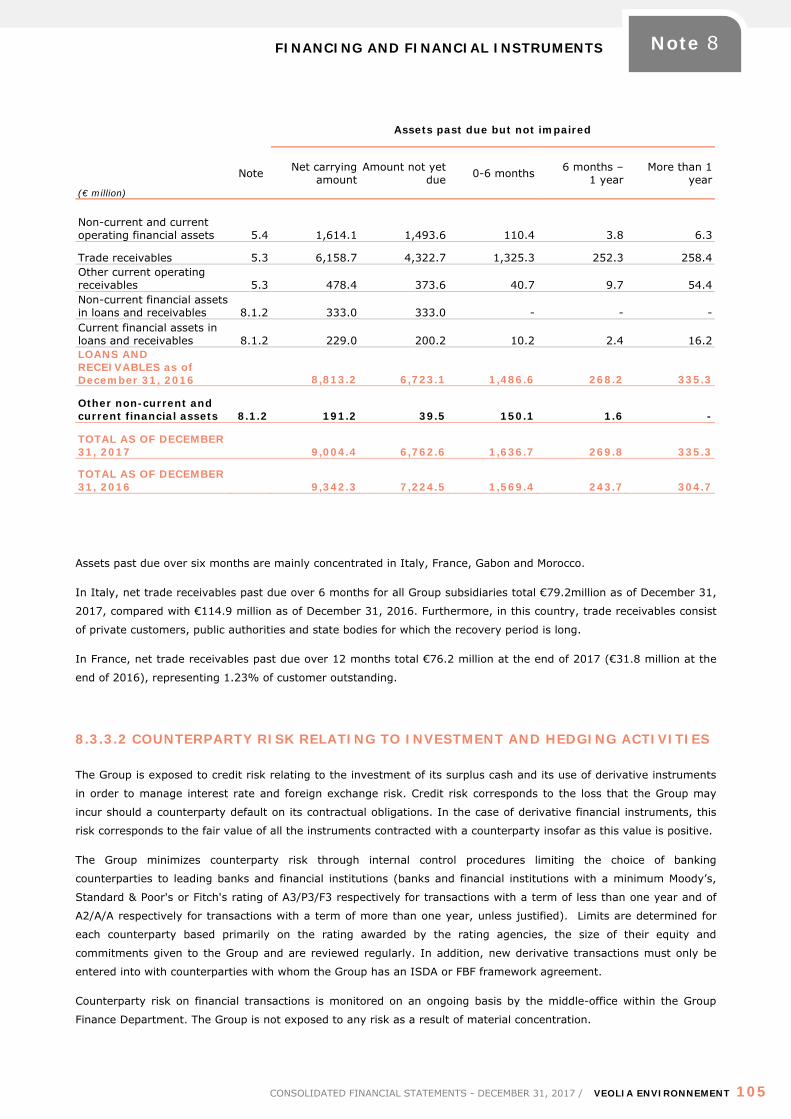
FINANCING AND FINANCIAL INSTRUMENTS
CONSOLIDATED FINANCIAL STATEMENTS - DECEMBER 31, 2017 / VEOLIA ENVIRONNEMENT 105
Note 8
(€ million)
Assets past due but not impaired
Note Net carrying amount
Amount not yet due 0-6 months 6 months –
1 year More than 1
year
Non-current and current operating financial assets 5.4 1,614.1 1,493.6 110.4 3.8 6.3
Trade receivables 5.3 6,158.7 4,322.7 1,325.3 252.3 258.4 Other current operating receivables 5.3 478.4 373.6 40.7 9.7 54.4 Non-current financial assets in loans and receivables 8.1.2 333.0 333.0 - - - Current financial assets in loans and receivables 8.1.2 229.0 200.2 10.2 2.4 16.2 LOANS AND RECEIVABLES as of December 31, 2016 8,813.2 6,723.1 1,486.6 268.2 335.3
Other non-current and current financial assets 8.1.2 191.2 39.5 150.1 1.6 -
TOTAL AS OF DECEMBER 31, 2017 9,004.4 6,762.6 1,636.7 269.8 335.3
TOTAL AS OF DECEMBER 31, 2016 9,342.3 7,224.5 1,569.4 243.7 304.7
Assets past due over six months are mainly concentrated in Italy, France, Gabon and Morocco.
In Italy, net trade receivables past due over 6 months for all Group subsidiaries total €79.2million as of December 31,
2017, compared with €114.9 million as of December 31, 2016. Furthermore, in this country, trade receivables consist
of private customers, public authorities and state bodies for which the recovery period is long.
In France, net trade receivables past due over 12 months total €76.2 million at the end of 2017 (€31.8 million at the
end of 2016), representing 1.23% of customer outstanding.
8.3.3.2 COUNTERPARTY RISK RELATING TO INVESTMENT AND HEDGING ACTIVITIES
The Group is exposed to credit risk relating to the investment of its surplus cash and its use of derivative instruments
in order to manage interest rate and foreign exchange risk. Credit risk corresponds to the loss that the Group may
incur should a counterparty default on its contractual obligations. In the case of derivative financial instruments, this
risk corresponds to the fair value of all the instruments contracted with a counterparty insofar as this value is positive.
The Group minimizes counterparty risk through internal control procedures limiting the choice of banking
counterparties to leading banks and financial institutions (banks and financial institutions with a minimum Moody’s,
Standard & Poor's or Fitch's rating of A3/P3/F3 respectively for transactions with a term of less than one year and of
A2/A/A respectively for transactions with a term of more than one year, unless justified). Limits are determined for
each counterparty based primarily on the rating awarded by the rating agencies, the size of their equity and
commitments given to the Group and are reviewed regularly. In addition, new derivative transactions must only be
entered into with counterparties with whom the Group has an ISDA or FBF framework agreement.
Counterparty risk on financial transactions is monitored on an ongoing basis by the middle-office within the Group
Finance Department. The Group is not exposed to any risk as a result of material concentration.
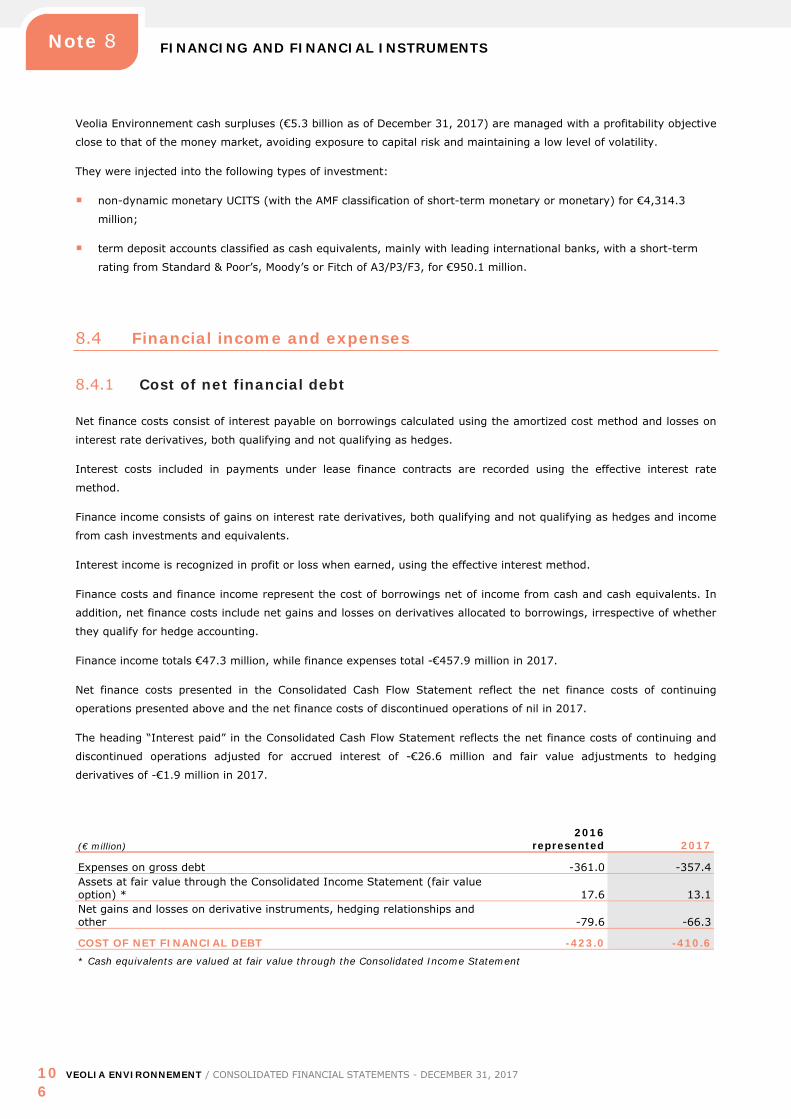
FINANCING AND FINANCIAL INSTRUMENTS
106
VEOLIA ENVIRONNEMENT / CONSOLIDATED FINANCIAL STATEMENTS - DECEMBER 31, 2017
Note 8
Veolia Environnement cash surpluses (€5.3 billion as of December 31, 2017) are managed with a profitability objective
close to that of the money market, avoiding exposure to capital risk and maintaining a low level of volatility.
They were injected into the following types of investment:
non-dynamic monetary UCITS (with the AMF classification of short-term monetary or monetary) for €4,314.3
million;
term deposit accounts classified as cash equivalents, mainly with leading international banks, with a short-term
rating from Standard & Poor’s, Moody’s or Fitch of A3/P3/F3, for €950.1 million.
8.4 Financial income and expenses
8.4.1 Cost of net financial debt
Net finance costs consist of interest payable on borrowings calculated using the amortized cost method and losses on
interest rate derivatives, both qualifying and not qualifying as hedges.
Interest costs included in payments under lease finance contracts are recorded using the effective interest rate
method.
Finance income consists of gains on interest rate derivatives, both qualifying and not qualifying as hedges and income
from cash investments and equivalents.
Interest income is recognized in profit or loss when earned, using the effective interest method.
Finance costs and finance income represent the cost of borrowings net of income from cash and cash equivalents. In
addition, net finance costs include net gains and losses on derivatives allocated to borrowings, irrespective of whether
they qualify for hedge accounting.
Finance income totals €47.3 million, while finance expenses total -€457.9 million in 2017.
Net finance costs presented in the Consolidated Cash Flow Statement reflect the net finance costs of continuing
operations presented above and the net finance costs of discontinued operations of nil in 2017.
The heading “Interest paid” in the Consolidated Cash Flow Statement reflects the net finance costs of continuing and
discontinued operations adjusted for accrued interest of -€26.6 million and fair value adjustments to hedging
derivatives of -€1.9 million in 2017.
(€ million) 2016
represented 2017
Expenses on gross debt -361.0 -357.4 Assets at fair value through the Consolidated Income Statement (fair value option) * 17.6 13.1 Net gains and losses on derivative instruments, hedging relationships and other -79.6 -66.3
COST OF NET FINANCIAL DEBT -423.0 -410.6 * Cash equivalents are valued at fair value through the Consolidated Income Statement
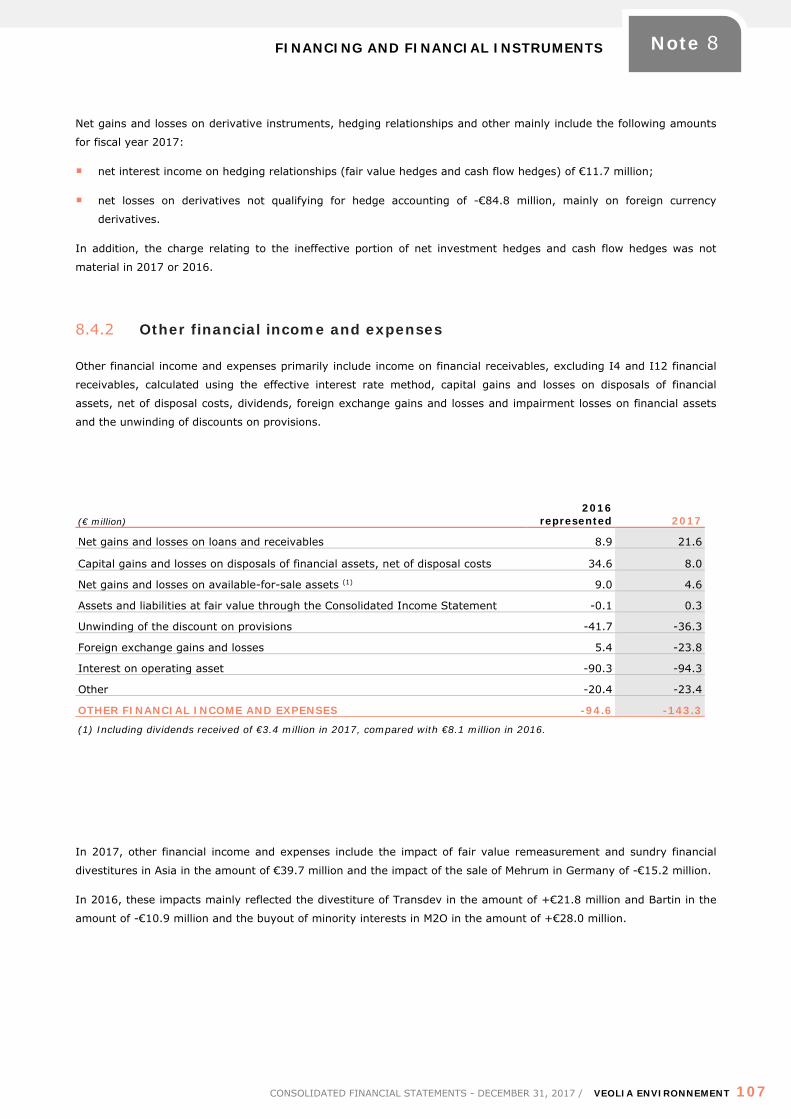
FINANCING AND FINANCIAL INSTRUMENTS
CONSOLIDATED FINANCIAL STATEMENTS - DECEMBER 31, 2017 / VEOLIA ENVIRONNEMENT 107
Note 8
Net gains and losses on derivative instruments, hedging relationships and other mainly include the following amounts
for fiscal year 2017:
net interest income on hedging relationships (fair value hedges and cash flow hedges) of €11.7 million;
net losses on derivatives not qualifying for hedge accounting of -€84.8 million, mainly on foreign currency
derivatives.
In addition, the charge relating to the ineffective portion of net investment hedges and cash flow hedges was not
material in 2017 or 2016.
8.4.2 Other financial income and expenses
Other financial income and expenses primarily include income on financial receivables, excluding I4 and I12 financial
receivables, calculated using the effective interest rate method, capital gains and losses on disposals of financial
assets, net of disposal costs, dividends, foreign exchange gains and losses and impairment losses on financial assets
and the unwinding of discounts on provisions.
(€ million) 2016
represented 2017
Net gains and losses on loans and receivables 8.9 21.6
Capital gains and losses on disposals of financial assets, net of disposal costs 34.6 8.0
Net gains and losses on available-for-sale assets (1) 9.0 4.6
Assets and liabilities at fair value through the Consolidated Income Statement -0.1 0.3
Unwinding of the discount on provisions -41.7 -36.3
Foreign exchange gains and losses 5.4 -23.8
Interest on operating asset -90.3 -94.3
Other -20.4 -23.4
OTHER FINANCIAL INCOME AND EXPENSES -94.6 -143.3
(1) Including dividends received of €3.4 million in 2017, compared with €8.1 million in 2016.
In 2017, other financial income and expenses include the impact of fair value remeasurement and sundry financial
divestitures in Asia in the amount of €39.7 million and the impact of the sale of Mehrum in Germany of -€15.2 million.
In 2016, these impacts mainly reflected the divestiture of Transdev in the amount of +€21.8 million and Bartin in the
amount of -€10.9 million and the buyout of minority interests in M2O in the amount of +€28.0 million.
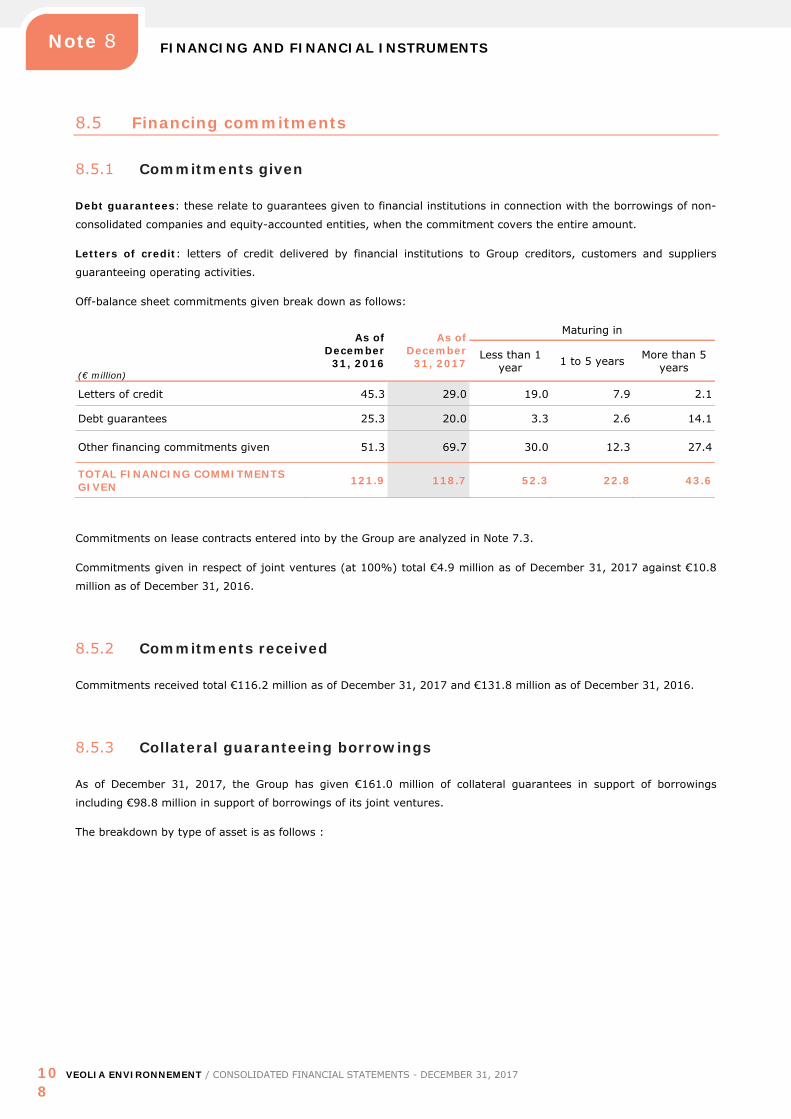
FINANCING AND FINANCIAL INSTRUMENTS
108
VEOLIA ENVIRONNEMENT / CONSOLIDATED FINANCIAL STATEMENTS - DECEMBER 31, 2017
Note 8
8.5 Financing commitments
8.5.1 Commitments given
Debt guarantees: these relate to guarantees given to financial institutions in connection with the borrowings of non-
consolidated companies and equity-accounted entities, when the commitment covers the entire amount.
Letters of credit: letters of credit delivered by financial institutions to Group creditors, customers and suppliers
guaranteeing operating activities.
Off-balance sheet commitments given break down as follows:
(€ million)
As of December
31, 2016
As of December
31, 2017
Maturing in
Less than 1 year 1 to 5 years More than 5
years
Letters of credit 45.3 29.0 19.0 7.9 2.1
Debt guarantees 25.3 20.0 3.3 2.6 14.1
Other financing commitments given 51.3 69.7 30.0 12.3 27.4
TOTAL FINANCING COMMITMENTS GIVEN 121.9 118.7 52.3 22.8 43.6
Commitments on lease contracts entered into by the Group are analyzed in Note 7.3.
Commitments given in respect of joint ventures (at 100%) total €4.9 million as of December 31, 2017 against €10.8
million as of December 31, 2016.
8.5.2 Commitments received
Commitments received total €116.2 million as of December 31, 2017 and €131.8 million as of December 31, 2016.
8.5.3 Collateral guaranteeing borrowings
As of December 31, 2017, the Group has given €161.0 million of collateral guarantees in support of borrowings
including €98.8 million in support of borrowings of its joint ventures.
The breakdown by type of asset is as follows :
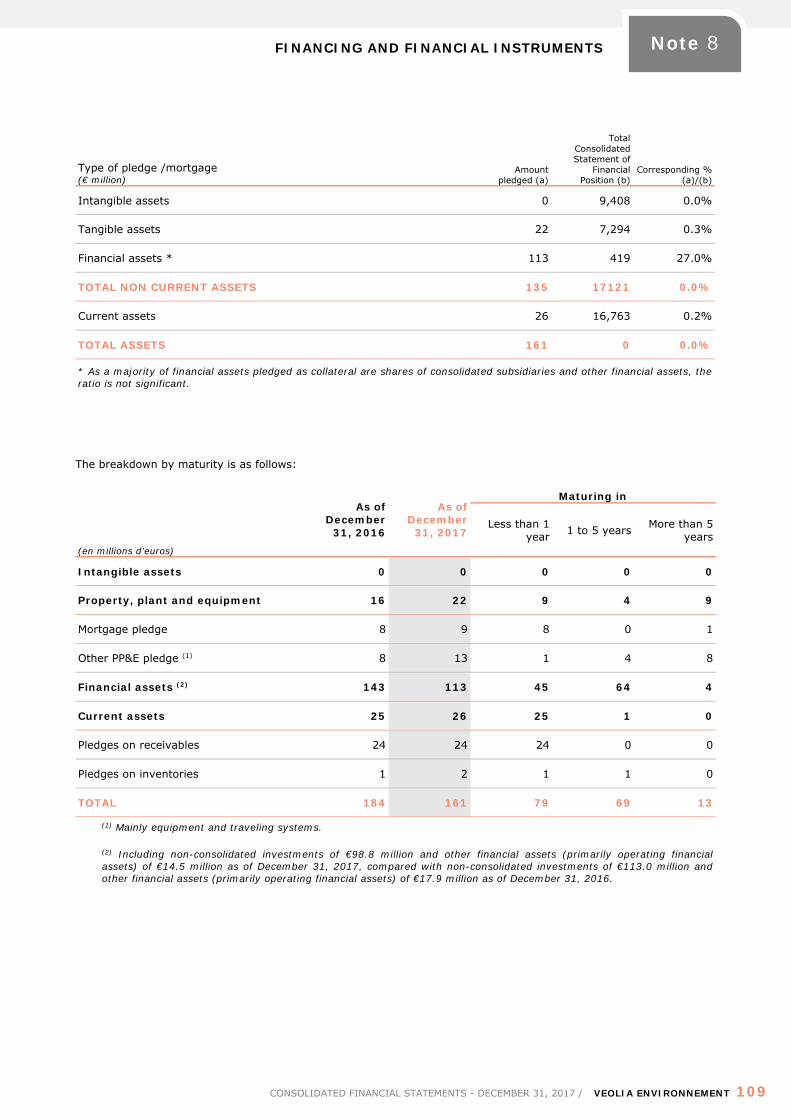
FINANCING AND FINANCIAL INSTRUMENTS
CONSOLIDATED FINANCIAL STATEMENTS - DECEMBER 31, 2017 / VEOLIA ENVIRONNEMENT 109
Note 8
Type of pledge /mortgage (€ million)
Amount pledged (a)
Total Consolidated Statement of
Financial Position (b)
Corresponding % (a)/(b)
Intangible assets 0 9,408 0.0%
Tangible assets 22 7,294 0.3%
Financial assets * 113 419 27.0%
TOTAL NON CURRENT ASSETS 135 17121 0.0%
Current assets 26 16,763 0.2%
TOTAL ASSETS 161 0 0.0%
* As a majority of financial assets pledged as collateral are shares of consolidated subsidiaries and other financial assets, the ratio is not significant.
The breakdown by maturity is as follows:
(en millions d’euros)
As of December
31, 2016
As of December
31, 2017
Maturing in
Less than 1 year 1 to 5 years More than 5
years
Intangible assets 0 0 0 0 0
Property, plant and equipment 16 22 9 4 9
Mortgage pledge 8 9 8 0 1
Other PP&E pledge (1) 8 13 1 4 8
Financial assets (2) 143 113 45 64 4
Current assets 25 26 25 1 0
Pledges on receivables 24 24 24 0 0
Pledges on inventories 1 2 1 1 0
TOTAL 184 161 79 69 13
(1) Mainly equipment and traveling systems.
(2) Including non-consolidated investments of €98.8 million and other financial assets (primarily operating financial assets) of €14.5 million as of December 31, 2017, compared with non-consolidated investments of €113.0 million and other financial assets (primarily operating financial assets) of €17.9 million as of December 31, 2016.
EQUITY AND EARNINGS PER SHARE
110
VEOLIA ENVIRONNEMENT / CONSOLIDATED FINANCIAL STATEMENTS - DECEMBER 31, 2017
Note 9
NOTE 9 EQUITY AND EARNINGS PER SHARE
9.1 Share capital management procedures
Veolia Environnement manages its share capital within the framework of a prudent and rigorous financial policy that
seeks to ensure easy access to French and international capital markets, to enable investments in projects that create
value and provide shareholders with a satisfactory remuneration, while maintaining an “Investment Grade” credit
rating.
With effect from September 30, 2014 and for a period of 12 months renewable by tacit agreement, Veolia
Environnement entrusted ROTHSCHILD & Cie BANQUE with the implementation of a liquidity contract. To this end, an
amount of thirty million euros (€30,000,000) was allocated to the operation of this liquidity account.
This liquidity contract forms part of the share buyback program authorized by the Veolia Environnement General
Shareholders’ Meeting of April 20, 2017, which has renewed its approval authorizing the Board of Directors to proceed
to repurchase of company’s shares for a new period of 18 months.
9.2 Equity attributable to owners of the Company
9.2.1 Share capital
The share capital is fully paid-up.
9.2.1.1 SHARE CAPITAL INCREASES
There were no capital increase in 2017.
9.2.1.2 SHARE CAPITAL INCREASE RESERVED FOR GROUP EMPLOYEES
There were no capital increase reserved for group employees in 2016 and 2017.
9.2.1.3 NUMBER OF SHARES OUTSTANDING AND PAR VALUE
The number of shares outstanding was 563,364,823 as of December 31, 2016 and 2017. The par value of each share
is €5.
9.2.1.4 AUTHORIZED BUT UNISSUED SHARES
The Veolia Environnement Combined General Meeting generally grants two types of share issuance authorizations to
the Board of Directors: (i) authorizations for the issuance of new shares, which are collectively limited to 70% of the
number of shares outstanding on the date of the General Shareholders’ Meeting; and (ii) authorizations for the
preferential issuance of warrants, which is limited to 25% of the number of shares outstanding on the date of the issue
decision and which may only be used in the context of an outstanding tender offer on the Company’s shares. The first
category of authorizations yields an exact number of authorized but unissued shares, whereas the number of shares
authorized but unissued under the second category of authorizations will depend on the number of shares already
outstanding on the date of the decision. Both types of authorizations, with the same limitations on issuance, i.e. 70%
and 25%, were approved at the Combined General Meetings in 2009 and 2010.
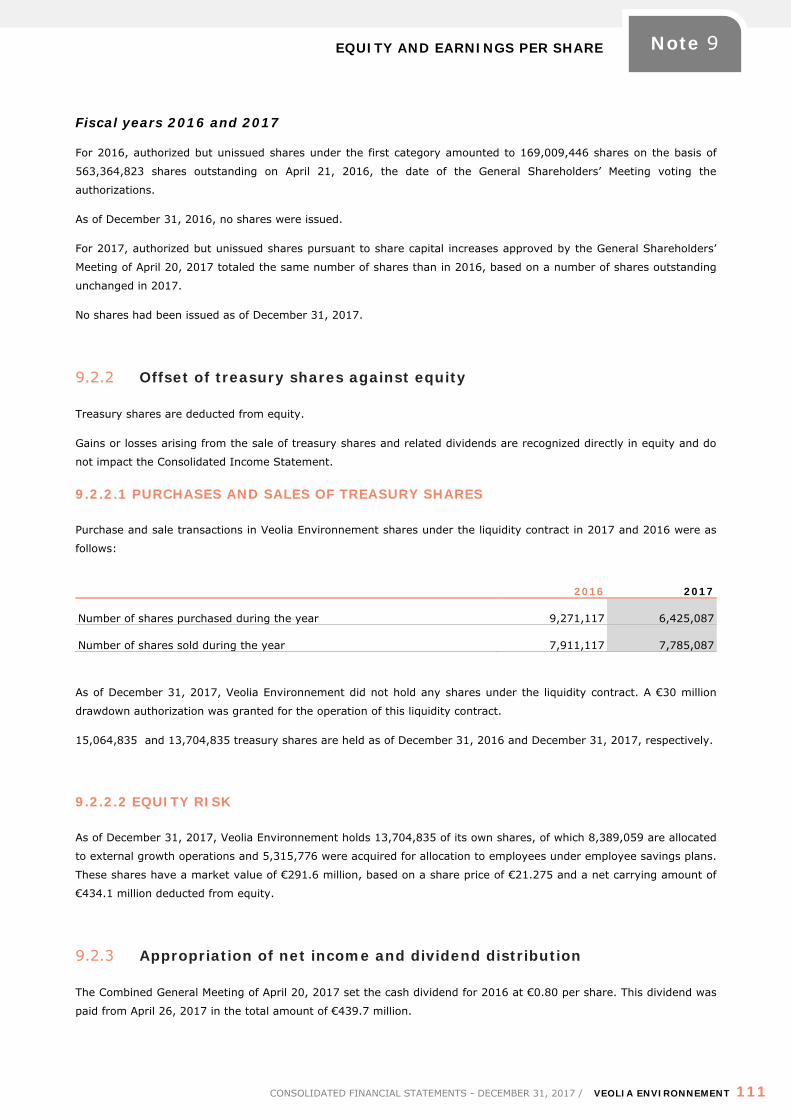
EQUITY AND EARNINGS PER SHARE
CONSOLIDATED FINANCIAL STATEMENTS - DECEMBER 31, 2017 / VEOLIA ENVIRONNEMENT 111
Note 9
Fiscal years 2016 and 2017
For 2016, authorized but unissued shares under the first category amounted to 169,009,446 shares on the basis of
563,364,823 shares outstanding on April 21, 2016, the date of the General Shareholders’ Meeting voting the
authorizations.
As of December 31, 2016, no shares were issued.
For 2017, authorized but unissued shares pursuant to share capital increases approved by the General Shareholders’
Meeting of April 20, 2017 totaled the same number of shares than in 2016, based on a number of shares outstanding
unchanged in 2017.
No shares had been issued as of December 31, 2017.
9.2.2 Offset of treasury shares against equity
Treasury shares are deducted from equity.
Gains or losses arising from the sale of treasury shares and related dividends are recognized directly in equity and do
not impact the Consolidated Income Statement.
9.2.2.1 PURCHASES AND SALES OF TREASURY SHARES
Purchase and sale transactions in Veolia Environnement shares under the liquidity contract in 2017 and 2016 were as
follows:
2016 2017
Number of shares purchased during the year 9,271,117 6,425,087
Number of shares sold during the year 7,911,117 7,785,087
As of December 31, 2017, Veolia Environnement did not hold any shares under the liquidity contract. A €30 million
drawdown authorization was granted for the operation of this liquidity contract.
15,064,835 and 13,704,835 treasury shares are held as of December 31, 2016 and December 31, 2017, respectively.
9.2.2.2 EQUITY RISK
As of December 31, 2017, Veolia Environnement holds 13,704,835 of its own shares, of which 8,389,059 are allocated
to external growth operations and 5,315,776 were acquired for allocation to employees under employee savings plans.
These shares have a market value of €291.6 million, based on a share price of €21.275 and a net carrying amount of
€434.1 million deducted from equity.
9.2.3 Appropriation of net income and dividend distribution
The Combined General Meeting of April 20, 2017 set the cash dividend for 2016 at €0.80 per share. This dividend was
paid from April 26, 2017 in the total amount of €439.7 million.
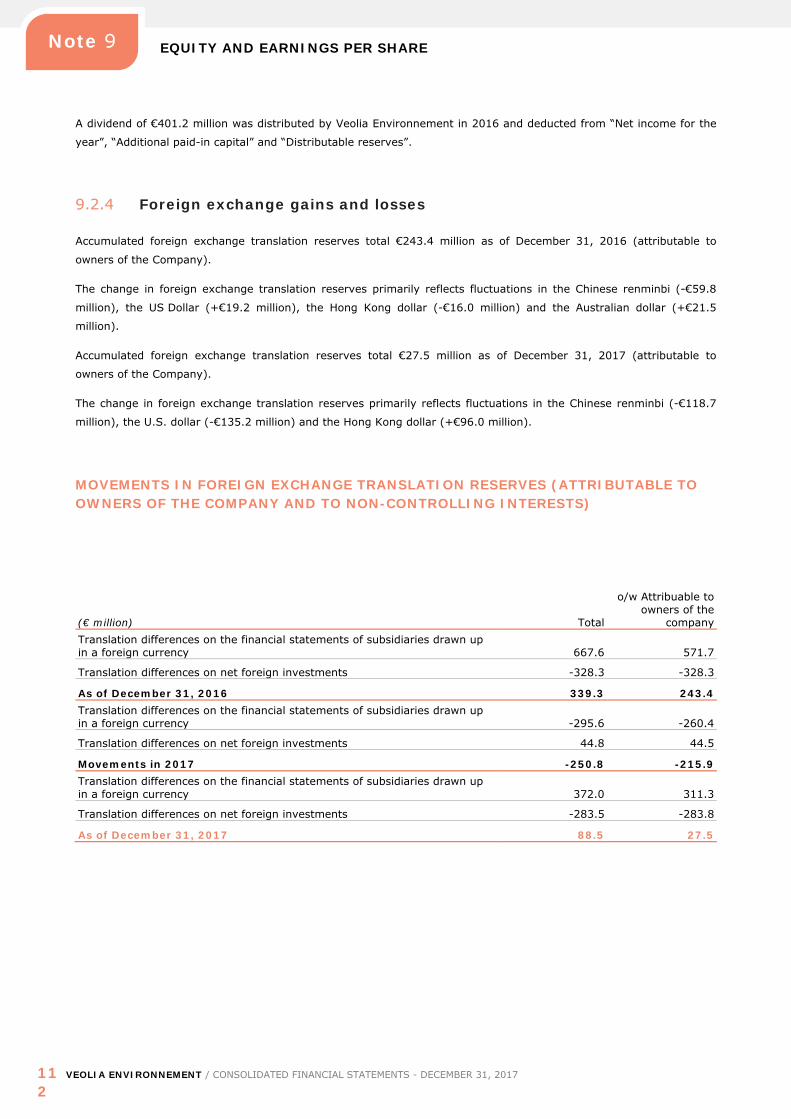
EQUITY AND EARNINGS PER SHARE
112
VEOLIA ENVIRONNEMENT / CONSOLIDATED FINANCIAL STATEMENTS - DECEMBER 31, 2017
Note 9
A dividend of €401.2 million was distributed by Veolia Environnement in 2016 and deducted from “Net income for the
year”, “Additional paid-in capital” and “Distributable reserves”.
9.2.4 Foreign exchange gains and losses
Accumulated foreign exchange translation reserves total €243.4 million as of December 31, 2016 (attributable to
owners of the Company).
The change in foreign exchange translation reserves primarily reflects fluctuations in the Chinese renminbi (-€59.8
million), the US Dollar (+€19.2 million), the Hong Kong dollar (-€16.0 million) and the Australian dollar (+€21.5
million).
Accumulated foreign exchange translation reserves total €27.5 million as of December 31, 2017 (attributable to
owners of the Company).
The change in foreign exchange translation reserves primarily reflects fluctuations in the Chinese renminbi (-€118.7
million), the U.S. dollar (-€135.2 million) and the Hong Kong dollar (+€96.0 million).
MOVEMENTS IN FOREIGN EXCHANGE TRANSLATION RESERVES (ATTRIBUTABLE TO OWNERS OF THE COMPANY AND TO NON-CONTROLLING INTERESTS)
(€ million) Total
o/w Attribuable to owners of the
company Translation differences on the financial statements of subsidiaries drawn up in a foreign currency 667.6 571.7
Translation differences on net foreign investments -328.3 -328.3
As of December 31, 2016 339.3 243.4 Translation differences on the financial statements of subsidiaries drawn up in a foreign currency -295.6 -260.4
Translation differences on net foreign investments 44.8 44.5
Movements in 2017 -250.8 -215.9 Translation differences on the financial statements of subsidiaries drawn up in a foreign currency 372.0 311.3
Translation differences on net foreign investments -283.5 -283.8
As of December 31, 2017 88.5 27.5
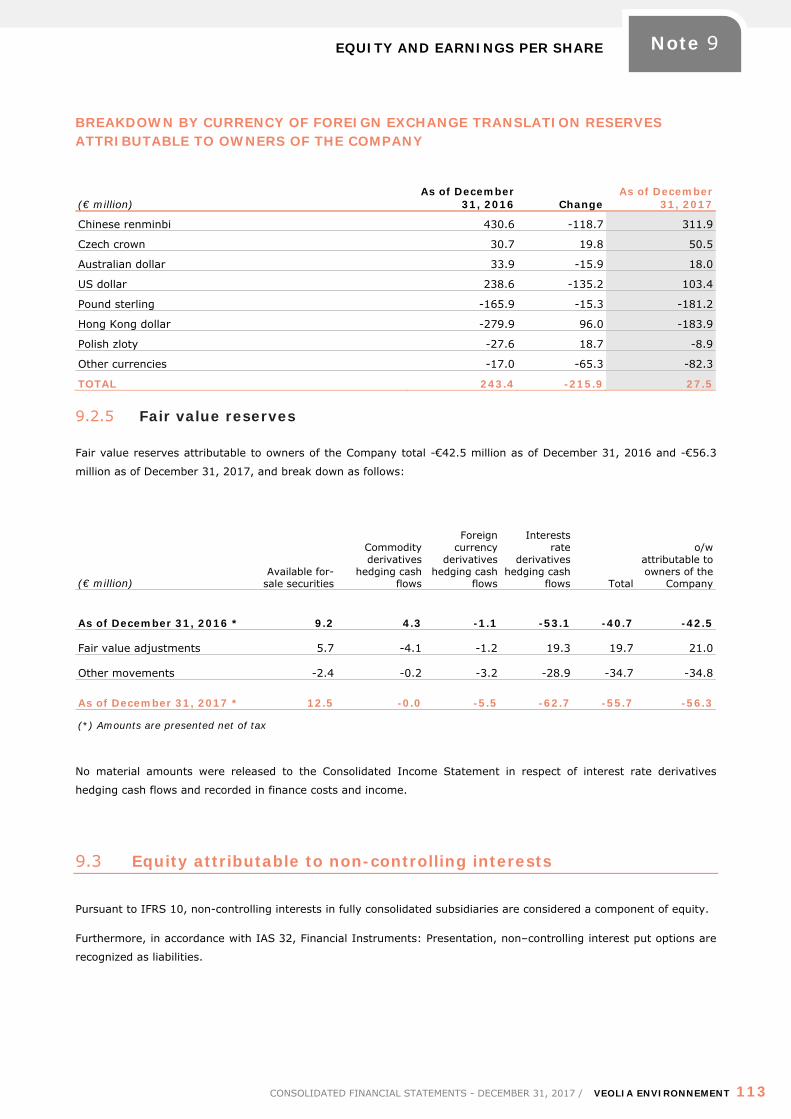
EQUITY AND EARNINGS PER SHARE
CONSOLIDATED FINANCIAL STATEMENTS - DECEMBER 31, 2017 / VEOLIA ENVIRONNEMENT 113
Note 9
BREAKDOWN BY CURRENCY OF FOREIGN EXCHANGE TRANSLATION RESERVES ATTRIBUTABLE TO OWNERS OF THE COMPANY
(€ million) As of December
31, 2016 Change As of December
31, 2017
Chinese renminbi 430.6 -118.7 311.9
Czech crown 30.7 19.8 50.5
Australian dollar 33.9 -15.9 18.0
US dollar 238.6 -135.2 103.4
Pound sterling -165.9 -15.3 -181.2
Hong Kong dollar -279.9 96.0 -183.9
Polish zloty -27.6 18.7 -8.9
Other currencies -17.0 -65.3 -82.3
TOTAL 243.4 -215.9 27.5
9.2.5 Fair value reserves
Fair value reserves attributable to owners of the Company total -€42.5 million as of December 31, 2016 and -€56.3
million as of December 31, 2017, and break down as follows:
(€ million) Available for-
sale securities
Commodity derivatives
hedging cash flows
Foreign currency
derivatives hedging cash
flows
Interests rate
derivatives hedging cash
flows Total
o/w attributable to owners of the
Company
As of December 31, 2016 * 9.2 4.3 -1.1 -53.1 -40.7 -42.5
Fair value adjustments 5.7 -4.1 -1.2 19.3 19.7 21.0
Other movements -2.4 -0.2 -3.2 -28.9 -34.7 -34.8
As of December 31, 2017 * 12.5 -0.0 -5.5 -62.7 -55.7 -56.3
(*) Amounts are presented net of tax
No material amounts were released to the Consolidated Income Statement in respect of interest rate derivatives
hedging cash flows and recorded in finance costs and income.
9.3 Equity attributable to non-controlling interests
Pursuant to IFRS 10, non-controlling interests in fully consolidated subsidiaries are considered a component of equity.
Furthermore, in accordance with IAS 32, Financial Instruments: Presentation, non–controlling interest put options are
recognized as liabilities.
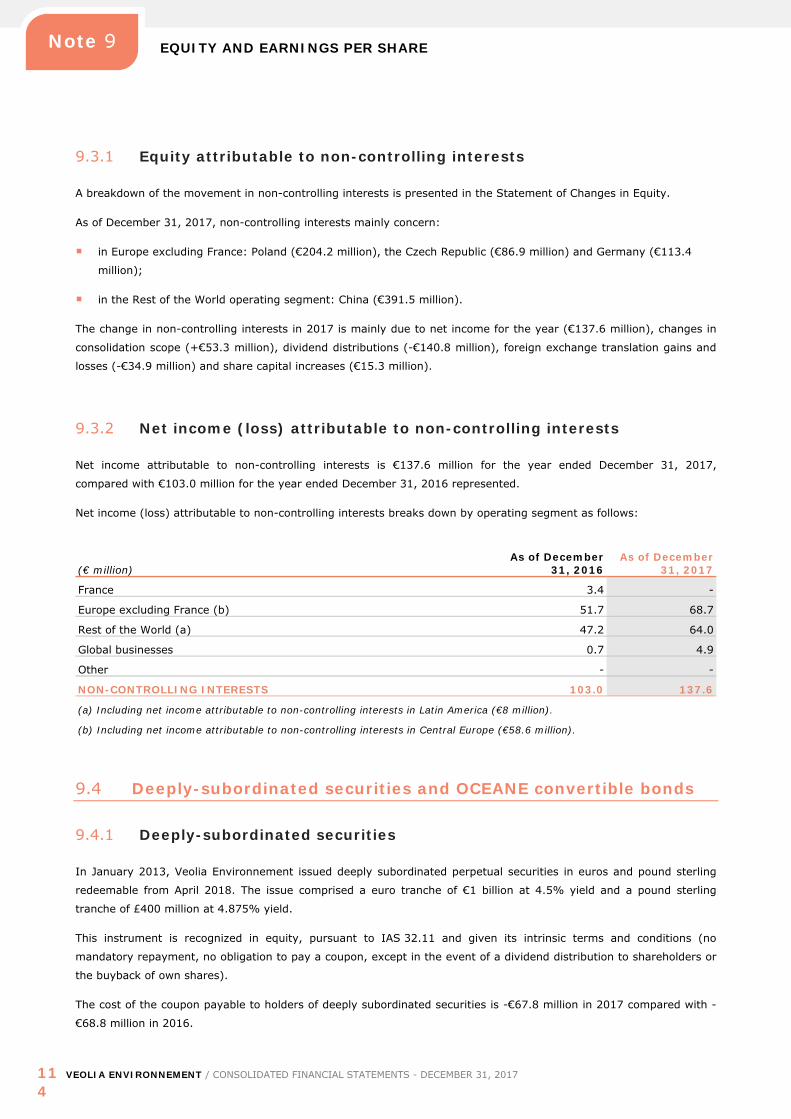
EQUITY AND EARNINGS PER SHARE
114
VEOLIA ENVIRONNEMENT / CONSOLIDATED FINANCIAL STATEMENTS - DECEMBER 31, 2017
Note 9
9.3.1 Equity attributable to non-controlling interests
A breakdown of the movement in non-controlling interests is presented in the Statement of Changes in Equity.
As of December 31, 2017, non-controlling interests mainly concern:
in Europe excluding France: Poland (€204.2 million), the Czech Republic (€86.9 million) and Germany (€113.4
million);
in the Rest of the World operating segment: China (€391.5 million).
The change in non-controlling interests in 2017 is mainly due to net income for the year (€137.6 million), changes in
consolidation scope (+€53.3 million), dividend distributions (-€140.8 million), foreign exchange translation gains and
losses (-€34.9 million) and share capital increases (€15.3 million).
9.3.2 Net income (loss) attributable to non-controlling interests
Net income attributable to non-controlling interests is €137.6 million for the year ended December 31, 2017,
compared with €103.0 million for the year ended December 31, 2016 represented.
Net income (loss) attributable to non-controlling interests breaks down by operating segment as follows:
(€ million) As of December
31, 2016 As of December
31, 2017
France 3.4 -
Europe excluding France (b) 51.7 68.7
Rest of the World (a) 47.2 64.0
Global businesses 0.7 4.9
Other - -
NON-CONTROLLING INTERESTS 103.0 137.6
(a) Including net income attributable to non-controlling interests in Latin America (€8 million).
(b) Including net income attributable to non-controlling interests in Central Europe (€58.6 million).
9.4 Deeply-subordinated securities and OCEANE convertible bonds
9.4.1 Deeply-subordinated securities
In January 2013, Veolia Environnement issued deeply subordinated perpetual securities in euros and pound sterling
redeemable from April 2018. The issue comprised a euro tranche of €1 billion at 4.5% yield and a pound sterling
tranche of £400 million at 4.875% yield.
This instrument is recognized in equity, pursuant to IAS 32.11 and given its intrinsic terms and conditions (no
mandatory repayment, no obligation to pay a coupon, except in the event of a dividend distribution to shareholders or
the buyback of own shares).
The cost of the coupon payable to holders of deeply subordinated securities is -€67.8 million in 2017 compared with -
€68.8 million in 2016.
EQUITY AND EARNINGS PER SHARE
CONSOLIDATED FINANCIAL STATEMENTS - DECEMBER 31, 2017 / VEOLIA ENVIRONNEMENT 115
Note 9
9.4.2 OCEANE convertible bonds
On March 8, 2016, Veolia Environnement issued convertible “OCEANE” bonds.
The conversion option of this transaction, described in Note 8.1.1.1., may be settled solely in shares and is recognized
in equity in the amount of €17.6 million as of December 31, 2017.
9.5 Earnings per share
Basic earnings per share is calculated by dividing adjusted net income attributable to owners of the Company by the
weighted average number of ordinary shares outstanding during the fiscal year.
Pursuant to IAS 33, the weighted average number of shares outstanding taken into account for the calculation of net
income per share is adjusted for the distribution of scrip dividends during the year. Pursuant to IAS 33.9 and 12, net
income attributable to owners of the Company has been adjusted to take into account the cost of the coupon payable
to holders of deeply subordinated securities issued by Veolia Environnement.
Diluted earnings per share is calculated by dividing adjusted net income attributable to owners of the Company by the
weighted average number of ordinary shares outstanding during the fiscal year plus the weighted average number of
ordinary shares that would be issued following the conversion into ordinary shares of all potentially dilutive ordinary
shares.
Net income and the number of shares used to calculate basic and diluted earnings per share are presented below for
all activities.
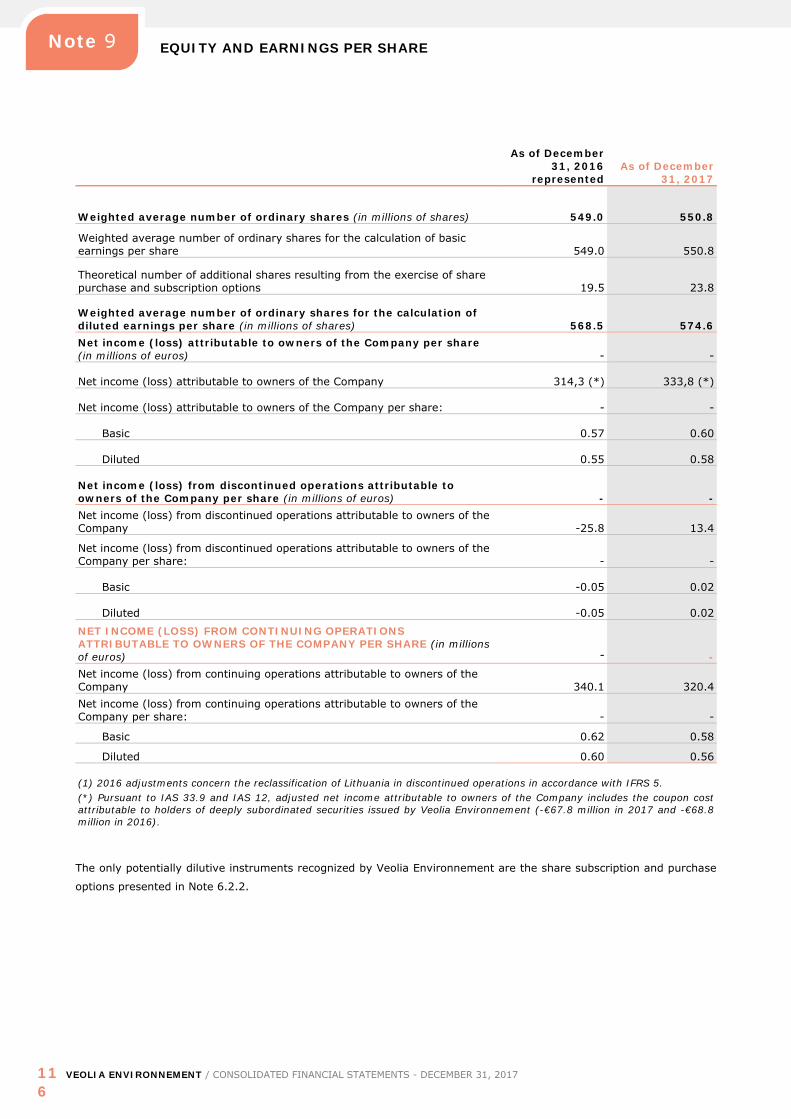
EQUITY AND EARNINGS PER SHARE
116
VEOLIA ENVIRONNEMENT / CONSOLIDATED FINANCIAL STATEMENTS - DECEMBER 31, 2017
Note 9
As of December 31, 2016
represented As of December
31, 2017
Weighted average number of ordinary shares (in millions of shares) 549.0 550.8
Weighted average number of ordinary shares for the calculation of basic earnings per share 549.0 550.8
Theoretical number of additional shares resulting from the exercise of share purchase and subscription options 19.5 23.8
Weighted average number of ordinary shares for the calculation of diluted earnings per share (in millions of shares) 568.5 574.6 Net income (loss) attributable to owners of the Company per share (in millions of euros) - -
Net income (loss) attributable to owners of the Company 314,3 (*) 333,8 (*)
Net income (loss) attributable to owners of the Company per share: - -
Basic 0.57 0.60
Diluted 0.55 0.58
Net income (loss) from discontinued operations attributable to owners of the Company per share (in millions of euros) - - Net income (loss) from discontinued operations attributable to owners of the Company -25.8 13.4
Net income (loss) from discontinued operations attributable to owners of the Company per share: - -
Basic -0.05 0.02
Diluted -0.05 0.02
NET INCOME (LOSS) FROM CONTINUING OPERATIONS ATTRIBUTABLE TO OWNERS OF THE COMPANY PER SHARE (in millions of euros) ‐ - Net income (loss) from continuing operations attributable to owners of the Company 340.1 320.4 Net income (loss) from continuing operations attributable to owners of the Company per share: - -
Basic 0.62 0.58
Diluted 0.60 0.56
(1) 2016 adjustments concern the reclassification of Lithuania in discontinued operations in accordance with IFRS 5. (*) Pursuant to IAS 33.9 and IAS 12, adjusted net income attributable to owners of the Company includes the coupon cost attributable to holders of deeply subordinated securities issued by Veolia Environnement (-€67.8 million in 2017 and -€68.8 million in 2016).
The only potentially dilutive instruments recognized by Veolia Environnement are the share subscription and purchase
options presented in Note 6.2.2.
PROVISIONS
CONSOLIDATED FINANCIAL STATEMENTS - DECEMBER 31, 2017 / VEOLIA ENVIRONNEMENT 117
Note 10
NOTE 10 PROVISIONS
Pursuant to IAS 37, Provisions, Contingent Liabilities and Contingent Assets, a provision is recorded when, at the year
end, the Group has a current legal or implicit obligation to a third party as a result of a past event, it is probable that
an outflow of resources embodying economic benefits will be required to settle the obligation and the amount of the
obligation can be reliably estimated.
Provisions cover all losses that are considered probable, and that relate to litigation (taxation, employee or other)
arising in the normal course of Veolia’s business operations.
As part of its obligations under public services contracts, Veolia generally has contractual obligations for the
maintenance and repair of the installations it manages. The resulting maintenance and repair costs are analyzed in
accordance with IAS 37 on provisions and, where necessary, a provision for contractual commitments is recorded
where there are delays in work to be performed.
In the event of a restructuring, an obligation exists if, prior to the period end, the restructuring has been announced
and a detailed plan produced or implementation has commenced. Future operating costs are not provided.
In the case of provisions for rehabilitation of landfill facilities, Veolia accounts for the obligation to restore a site as
waste is deposited, recording a non-current asset component and taking into account inflation and the date on which
expenses will be incurred (discounting). The asset is amortized based on its depletion.
Provisions for closure and post-closure costs encompass the legal and contractual obligations of the Group on the
completion of operating activities at a site (primarily site rehabilitation provisions) and, more generally, expenditure
associated with environmental protection as defined in the ethics charter of each entity (provision for environmental
risks).
Provisions giving rise to an outflow after more than one year are discounted if the impact is material. Discount rates
reflect current assessments of the time value of money and the risks specific to the liability. The unwinding of the
discount is recorded in the Consolidated Income Statement in "Other financial income and expenses".
Movements in non-current and current provisions during 2017 are as follows:
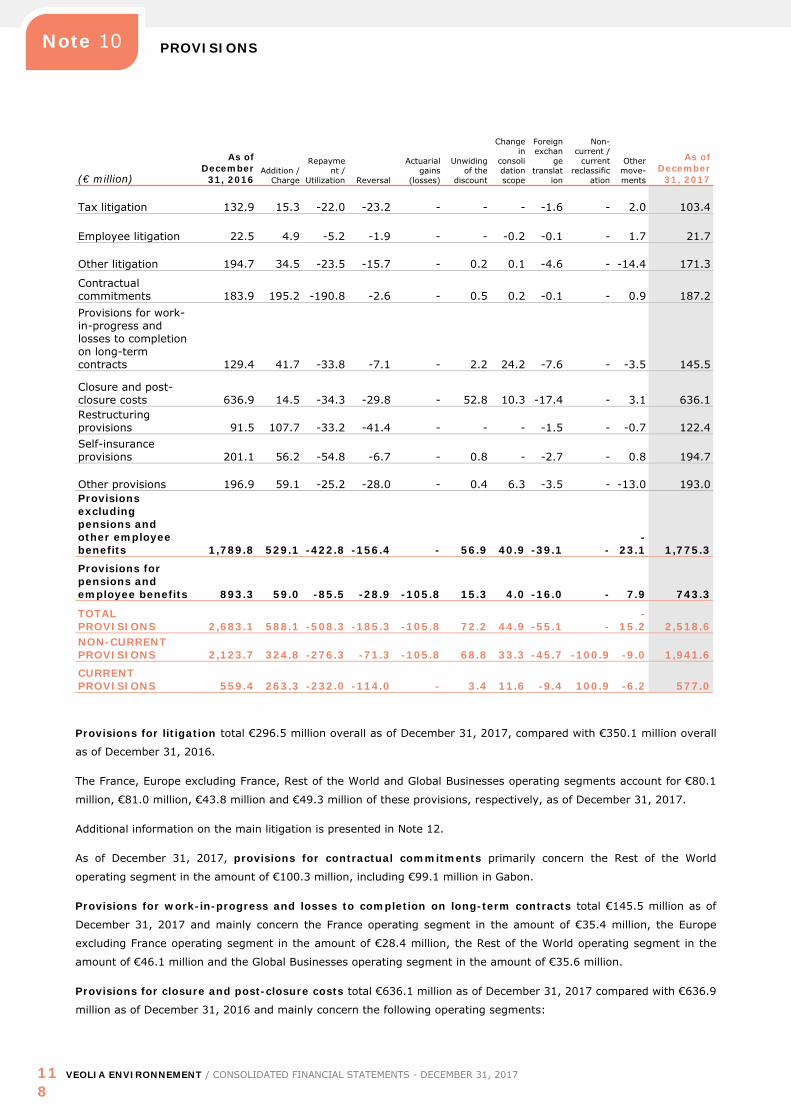
PROVISIONS
118
VEOLIA ENVIRONNEMENT / CONSOLIDATED FINANCIAL STATEMENTS - DECEMBER 31, 2017
Note 10
(€ million)
As of December
31, 2016 Addition /
Charge
Repayment /
Utilization Reversal
Actuarial gains
(losses)
Unwiding of the
discount
Change in
consolidation scope
Foreign exchan
ge translat
ion
Non-current /
current reclassific
ation
Other move-ments
As of December
31, 2017
Tax litigation 132.9 15.3 -22.0 -23.2 - - - -1.6 - 2.0 103.4
Employee litigation 22.5 4.9 -5.2 -1.9 - - -0.2 -0.1 - 1.7 21.7
Other litigation 194.7 34.5 -23.5 -15.7 - 0.2 0.1 -4.6 - -14.4 171.3
Contractual commitments 183.9 195.2 -190.8 -2.6 - 0.5 0.2 -0.1 - 0.9 187.2 Provisions for work-in-progress and losses to completion on long-term contracts 129.4 41.7 -33.8 -7.1 - 2.2 24.2 -7.6 - -3.5 145.5
Closure and post-closure costs 636.9 14.5 -34.3 -29.8 - 52.8 10.3 -17.4 - 3.1 636.1 Restructuring provisions 91.5 107.7 -33.2 -41.4 - - - -1.5 - -0.7 122.4 Self-insurance provisions 201.1 56.2 -54.8 -6.7 - 0.8 - -2.7 - 0.8 194.7
Other provisions 196.9 59.1 -25.2 -28.0 - 0.4 6.3 -3.5 - -13.0 193.0 Provisions excluding pensions and other employee benefits 1,789.8 529.1 -422.8 -156.4 - 56.9 40.9 -39.1 -
-23.1 1,775.3
Provisions for pensions and employee benefits 893.3 59.0 -85.5 -28.9 -105.8 15.3 4.0 -16.0 - 7.9 743.3
TOTAL PROVISIONS 2,683.1 588.1 -508.3 -185.3 -105.8 72.2 44.9 -55.1 -
-15.2 2,518.6
NON-CURRENT PROVISIONS 2,123.7 324.8 -276.3 -71.3 -105.8 68.8 33.3 -45.7 -100.9 -9.0 1,941.6 CURRENT PROVISIONS 559.4 263.3 -232.0 -114.0 - 3.4 11.6 -9.4 100.9 -6.2 577.0
Provisions for litigation total €296.5 million overall as of December 31, 2017, compared with €350.1 million overall
as of December 31, 2016.
The France, Europe excluding France, Rest of the World and Global Businesses operating segments account for €80.1
million, €81.0 million, €43.8 million and €49.3 million of these provisions, respectively, as of December 31, 2017.
Additional information on the main litigation is presented in Note 12.
As of December 31, 2017, provisions for contractual commitments primarily concern the Rest of the World
operating segment in the amount of €100.3 million, including €99.1 million in Gabon.
Provisions for work-in-progress and losses to completion on long-term contracts total €145.5 million as of
December 31, 2017 and mainly concern the France operating segment in the amount of €35.4 million, the Europe
excluding France operating segment in the amount of €28.4 million, the Rest of the World operating segment in the
amount of €46.1 million and the Global Businesses operating segment in the amount of €35.6 million.
Provisions for closure and post-closure costs total €636.1 million as of December 31, 2017 compared with €636.9
million as of December 31, 2016 and mainly concern the following operating segments:
INCOME TAX EXPENSE
CONSOLIDATED FINANCIAL STATEMENTS - DECEMBER 31, 2017 / VEOLIA ENVIRONNEMENT 119
Note 11
France in the amount of €230.7 million in 2017, compared with €227.3 million in 2016;
Europe excluding France, in the amount of €202.1 million in 2017, compared with €208.7 million in 2016.
The change in these provisions in 2017 is mainly due to the unwinding of the discount in the amount of €52.8 million,
net reversals of provisions in the amount of -€49.6 million and foreign exchange translation gains and losses in the
amount of -€17.4 million.
By nature of obligation, these provisions concern:
provisions for site rehabilitation in the amount of €571.1 million at the end of 2017 compared with €552.7 million
at the end of 2016;
provisions for environmental risks in the amount of €50.2 million at the end of 2017 compared with €58.5 million
at the end of 2016;
provisions for plant dismantling in the amount of €14.7 million at the end of 2017, compared with €25.7 million at
the end of 2016.
Self-insurance provisions were mainly recorded by Group insurance and reinsurance subsidiaries.
Other provisions include various obligations recorded as part of the normal operation of the Group's subsidiaries and
which are of immaterial individual amount. They primarily concern the following operating segments:
France in the amount of €31.1 million as of December 31, 2017, compared with €33.4 million as of December 31,
2016;
Europe excluding France, in the amount of €60.3 million as of December 31, 2017, compared with €62.4 million as
of December 31, 2016;
the Rest of the World in the amount of €39.0 million as of December 31, 2017, compared with €39.3 million as of
December 31, 2016.
Provisions for pensions and other employee benefits as of December 31, 2017 total €743.2 million, and include
provisions for pensions and other post-employment benefits of €655.8 million (governed by IAS 19 and detailed in
note 6) and provisions for other long-term benefits of €87.4 million.
NOTE 11 INCOME TAX EXPENSE
11.1 Income taxes
The income tax expense (income) includes the current tax expense (income) and the deferred tax expense (income).
11.1.1 Analysis of the income tax expense
The income tax expense breaks down as follows:
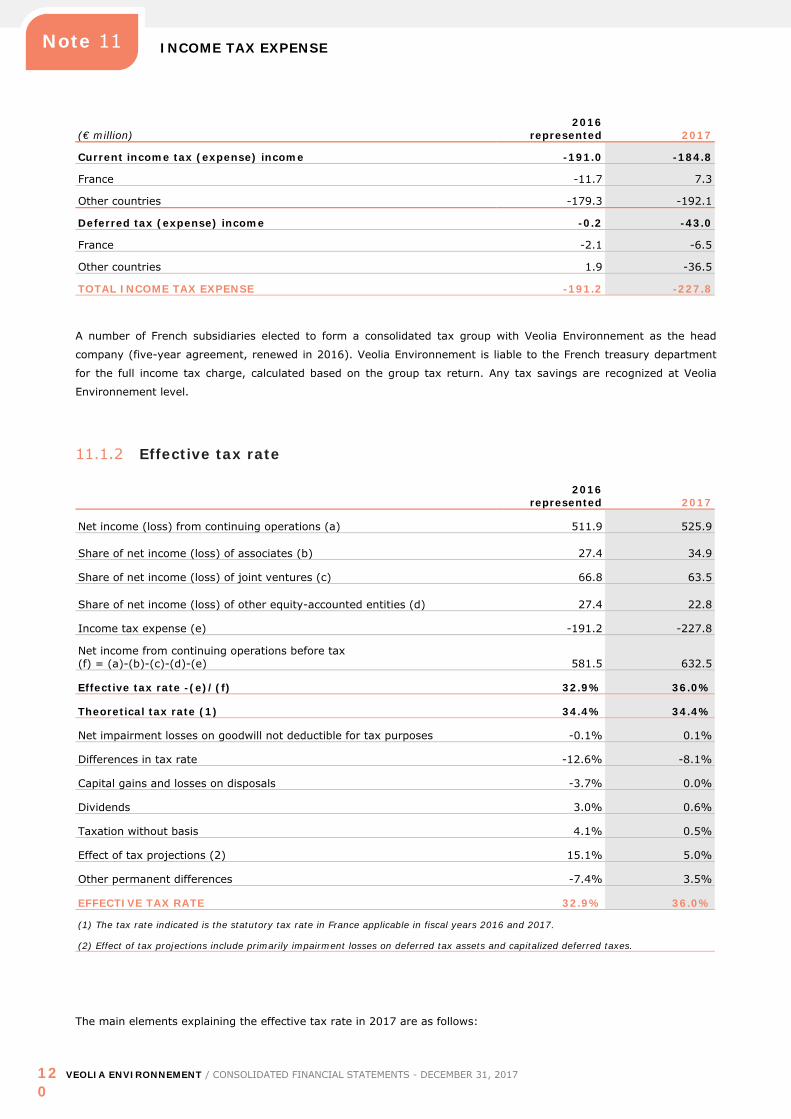
INCOME TAX EXPENSE
120
VEOLIA ENVIRONNEMENT / CONSOLIDATED FINANCIAL STATEMENTS - DECEMBER 31, 2017
Note 11
(€ million) 2016
represented 2017
Current income tax (expense) income -191.0 -184.8
France -11.7 7.3
Other countries -179.3 -192.1
Deferred tax (expense) income -0.2 -43.0
France -2.1 -6.5
Other countries 1.9 -36.5
TOTAL INCOME TAX EXPENSE -191.2 -227.8
A number of French subsidiaries elected to form a consolidated tax group with Veolia Environnement as the head
company (five-year agreement, renewed in 2016). Veolia Environnement is liable to the French treasury department
for the full income tax charge, calculated based on the group tax return. Any tax savings are recognized at Veolia
Environnement level.
11.1.2 Effective tax rate
2016
represented 2017
Net income (loss) from continuing operations (a) 511.9 525.9
Share of net income (loss) of associates (b) 27.4 34.9
Share of net income (loss) of joint ventures (c) 66.8 63.5
Share of net income (loss) of other equity-accounted entities (d) 27.4 22.8
Income tax expense (e) -191.2 -227.8
Net income from continuing operations before tax (f) = (a)-(b)-(c)-(d)-(e) 581.5 632.5
Effective tax rate -(e)/(f) 32.9% 36.0%
Theoretical tax rate (1) 34.4% 34.4%
Net impairment losses on goodwill not deductible for tax purposes -0.1% 0.1%
Differences in tax rate -12.6% -8.1%
Capital gains and losses on disposals -3.7% 0.0%
Dividends 3.0% 0.6%
Taxation without basis 4.1% 0.5%
Effect of tax projections (2) 15.1% 5.0%
Other permanent differences -7.4% 3.5%
EFFECTIVE TAX RATE 32.9% 36.0%
(1) The tax rate indicated is the statutory tax rate in France applicable in fiscal years 2016 and 2017.
(2) Effect of tax projections include primarily impairment losses on deferred tax assets and capitalized deferred taxes.
The main elements explaining the effective tax rate in 2017 are as follows:

INCOME TAX EXPENSE
CONSOLIDATED FINANCIAL STATEMENTS - DECEMBER 31, 2017 / VEOLIA ENVIRONNEMENT 121
Note 11
recognition of an impairment loss of €37 million on deferred tax assets on U.S. tax group losses, following the tax
rate reduction introduced by U.S. tax reforms and applicable from January 1, 2018;
the non-capitalization of French tax group losses.
transactions in countries with a lower tax rate than the French standard rate;
tax income of €25 million in respect of the dispute concerning the 3% contribution on dividends in France.
It is recalled that the main elements explaining the effective tax rate in 2016 were as follows:
the non-capitalization of Veolia tax group losses;
the impact of the tax rate decrease in some countries.
11.2 Deferred tax assets and liabilities
Deferred tax assets and liabilities are generally recognized on timing differences and/or tax loss carry forwards.
Deferred tax assets arising from timing differences are only recognized when it is probable that:
there are sufficient taxable timing differences within the same tax group or tax entity that are expected to reverse
in the same periods as the expected reversal of such deductible timing differences or in the periods when the
deferred tax assets arising from tax losses can be carried back or forward;
or the Group is likely to generate sufficient future taxable profits against which the asset can be offset.
At each period end, the Group reviews the recoverable amount of deferred tax assets arising from material tax losses
carried-forward.
Deferred tax assets arising from these tax losses are no longer recognized or are reduced when required by the
specific facts and circumstances of each company or tax group concerned, and particularly when:
the forecast period and uncertainties regarding the economic environment no longer enable the probability of
utilization to be assessed;
the companies have not started utilizing the losses;
the forecast utilization period exceeds the carry forward period authorized by tax legislation;
offset against future taxable profits is uncertain due to the risk of different interpretations of the application of tax
legislation.
Deferred tax assets and liabilities are adjusted for the effects of changes in prevailing tax laws and rates at the year
end. Deferred tax balances are not discounted.
Movements in deferred tax assets and liabilities during 2017 are as follows:
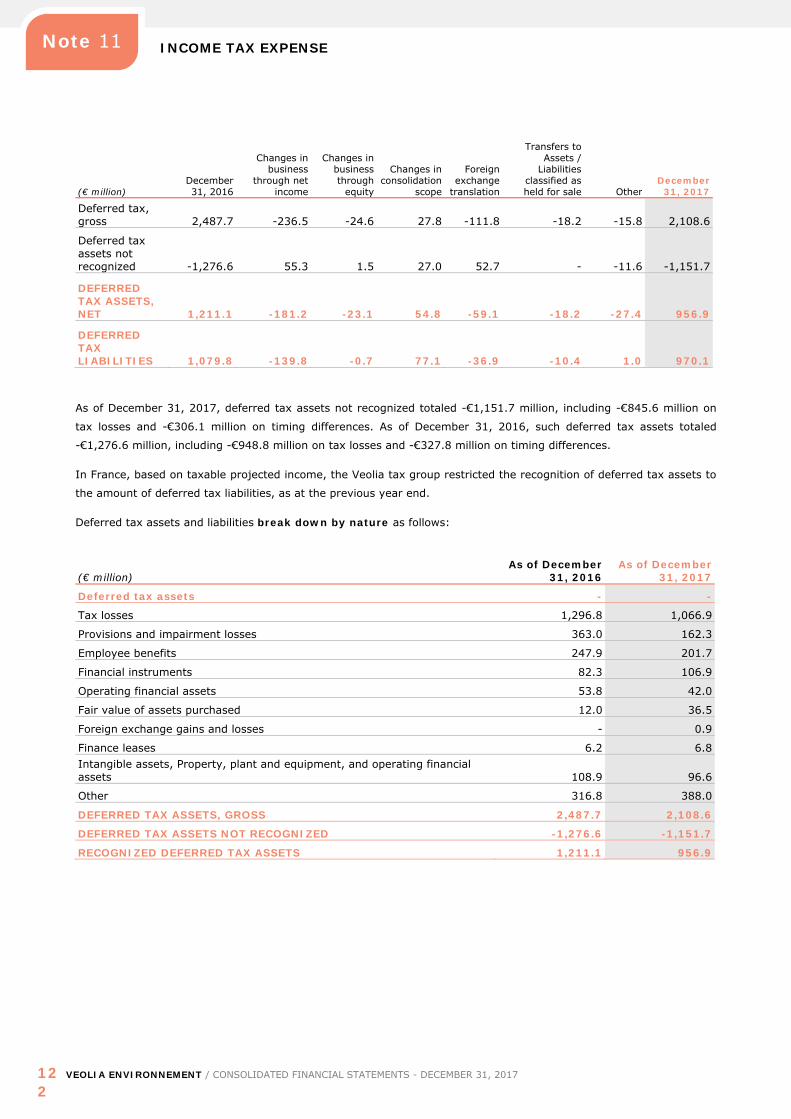
INCOME TAX EXPENSE
122
VEOLIA ENVIRONNEMENT / CONSOLIDATED FINANCIAL STATEMENTS - DECEMBER 31, 2017
Note 11
(€ million) December 31, 2016
Changes in business
through net income
Changes in business through
equity
Changes in consolidation
scope
Foreign exchange
translation
Transfers to Assets /
Liabilities classified as held for sale Other
December 31, 2017
Deferred tax, gross 2,487.7 -236.5 -24.6 27.8 -111.8 -18.2 -15.8 2,108.6
Deferred tax assets not recognized -1,276.6 55.3 1.5 27.0 52.7 - -11.6 -1,151.7
DEFERRED TAX ASSETS, NET 1,211.1 -181.2 -23.1 54.8 -59.1 -18.2 -27.4 956.9
DEFERRED TAX LIABILITIES 1,079.8 -139.8 -0.7 77.1 -36.9 -10.4 1.0 970.1
As of December 31, 2017, deferred tax assets not recognized totaled -€1,151.7 million, including -€845.6 million on
tax losses and -€306.1 million on timing differences. As of December 31, 2016, such deferred tax assets totaled
-€1,276.6 million, including -€948.8 million on tax losses and -€327.8 million on timing differences.
In France, based on taxable projected income, the Veolia tax group restricted the recognition of deferred tax assets to
the amount of deferred tax liabilities, as at the previous year end.
Deferred tax assets and liabilities break down by nature as follows:
(€ million) As of December
31, 2016 As of December
31, 2017
Deferred tax assets - -
Tax losses 1,296.8 1,066.9
Provisions and impairment losses 363.0 162.3
Employee benefits 247.9 201.7
Financial instruments 82.3 106.9
Operating financial assets 53.8 42.0
Fair value of assets purchased 12.0 36.5
Foreign exchange gains and losses - 0.9
Finance leases 6.2 6.8 Intangible assets, Property, plant and equipment, and operating financial assets 108.9 96.6
Other 316.8 388.0
DEFERRED TAX ASSETS, GROSS 2,487.7 2,108.6
DEFERRED TAX ASSETS NOT RECOGNIZED -1,276.6 -1,151.7
RECOGNIZED DEFERRED TAX ASSETS 1,211.1 956.9
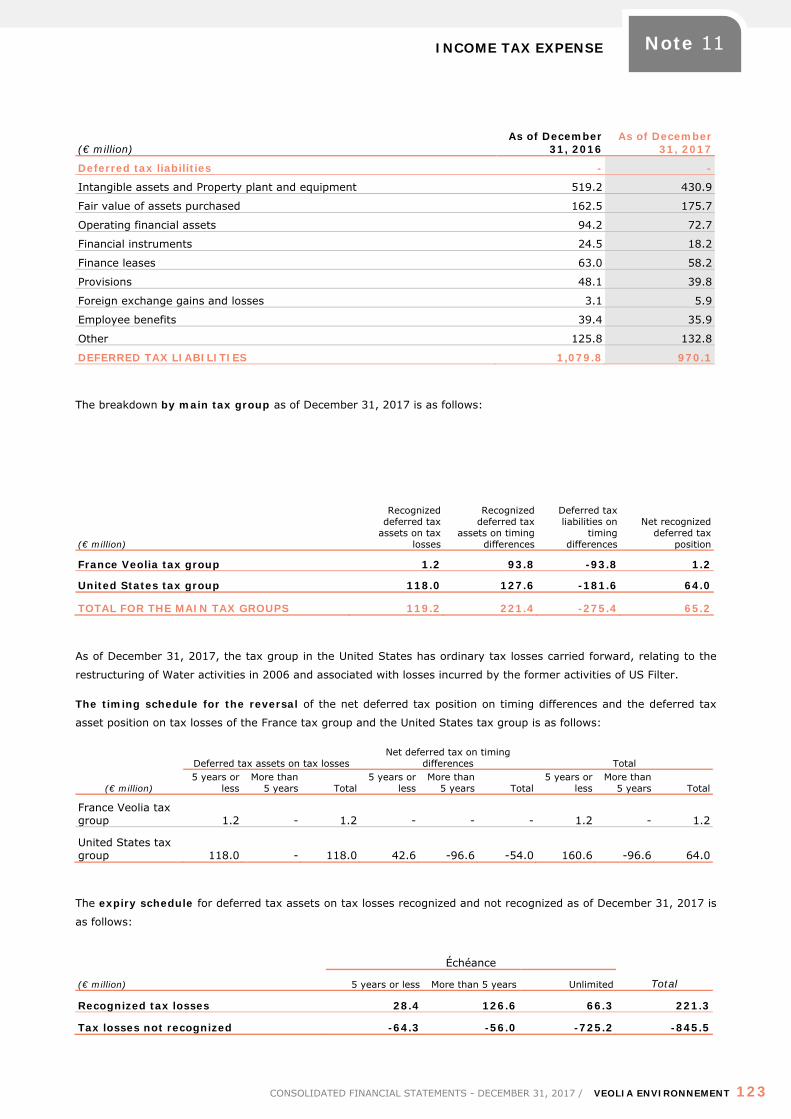
INCOME TAX EXPENSE
CONSOLIDATED FINANCIAL STATEMENTS - DECEMBER 31, 2017 / VEOLIA ENVIRONNEMENT 123
Note 11
(€ million) As of December
31, 2016 As of December
31, 2017
Deferred tax liabilities - -
Intangible assets and Property plant and equipment 519.2 430.9
Fair value of assets purchased 162.5 175.7
Operating financial assets 94.2 72.7
Financial instruments 24.5 18.2
Finance leases 63.0 58.2
Provisions 48.1 39.8
Foreign exchange gains and losses 3.1 5.9
Employee benefits 39.4 35.9
Other 125.8 132.8
DEFERRED TAX LIABILITIES 1,079.8 970.1
The breakdown by main tax group as of December 31, 2017 is as follows:
(€ million)
Recognized deferred tax
assets on tax losses
Recognized deferred tax
assets on timing differences
Deferred tax liabilities on
timing differences
Net recognized deferred tax
position
France Veolia tax group 1.2 93.8 -93.8 1.2
United States tax group 118.0 127.6 -181.6 64.0
TOTAL FOR THE MAIN TAX GROUPS 119.2 221.4 -275.4 65.2
As of December 31, 2017, the tax group in the United States has ordinary tax losses carried forward, relating to the
restructuring of Water activities in 2006 and associated with losses incurred by the former activities of US Filter.
The timing schedule for the reversal of the net deferred tax position on timing differences and the deferred tax
asset position on tax losses of the France tax group and the United States tax group is as follows:
(€ million)
Deferred tax assets on tax losses Net deferred tax on timing
differences Total 5 years or
less More than
5 years Total 5 years or
less More than
5 years Total 5 years or
less More than
5 years Total
France Veolia tax group 1.2 - 1.2 - - - 1.2 - 1.2
United States tax group 118.0 - 118.0 42.6 -96.6 -54.0 160.6 -96.6 64.0
The expiry schedule for deferred tax assets on tax losses recognized and not recognized as of December 31, 2017 is
as follows:
(€ million)
Échéance
Total 5 years or less More than 5 years Unlimited
Recognized tax losses 28.4 126.6 66.3 221.3
Tax losses not recognized -64.3 -56.0 -725.2 -845.5
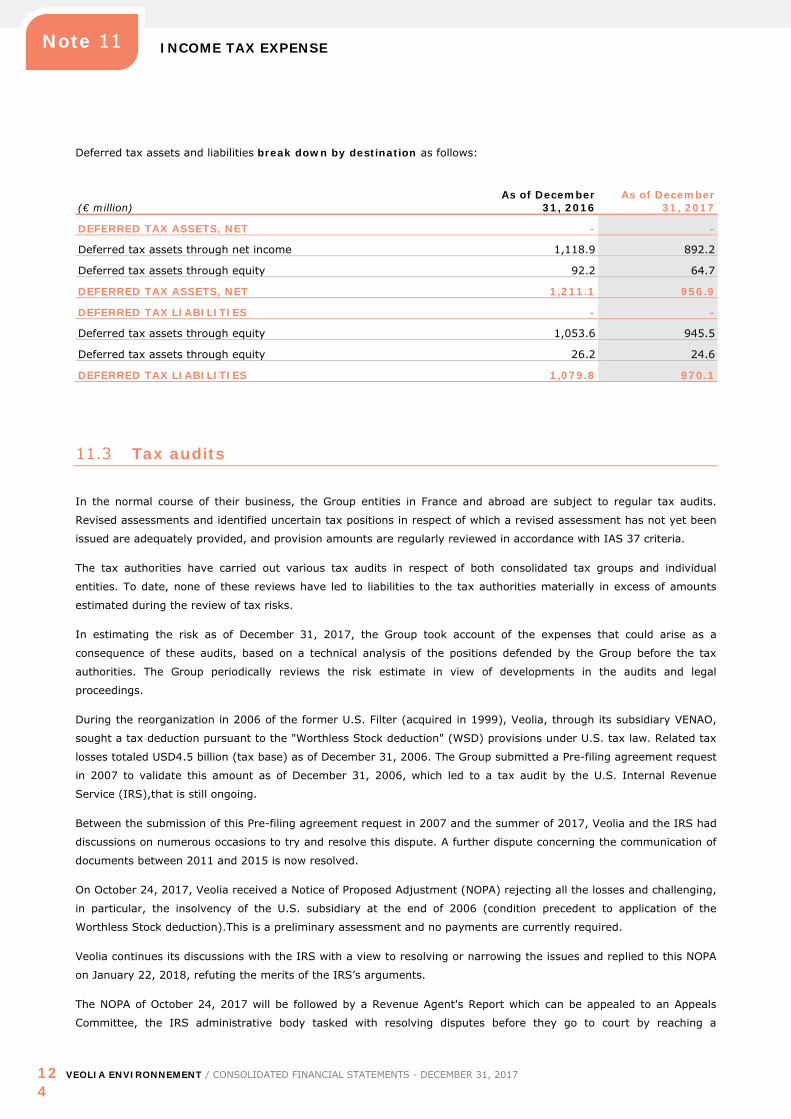
INCOME TAX EXPENSE
124
VEOLIA ENVIRONNEMENT / CONSOLIDATED FINANCIAL STATEMENTS - DECEMBER 31, 2017
Note 11
Deferred tax assets and liabilities break down by destination as follows:
(€ million) As of December
31, 2016 As of December
31, 2017
DEFERRED TAX ASSETS, NET - -
Deferred tax assets through net income 1,118.9 892.2
Deferred tax assets through equity 92.2 64.7
DEFERRED TAX ASSETS, NET 1,211.1 956.9
DEFERRED TAX LIABILITIES - -
Deferred tax assets through equity 1,053.6 945.5
Deferred tax assets through equity 26.2 24.6
DEFERRED TAX LIABILITIES 1,079.8 970.1
11.3 Tax audits
In the normal course of their business, the Group entities in France and abroad are subject to regular tax audits.
Revised assessments and identified uncertain tax positions in respect of which a revised assessment has not yet been
issued are adequately provided, and provision amounts are regularly reviewed in accordance with IAS 37 criteria.
The tax authorities have carried out various tax audits in respect of both consolidated tax groups and individual
entities. To date, none of these reviews have led to liabilities to the tax authorities materially in excess of amounts
estimated during the review of tax risks.
In estimating the risk as of December 31, 2017, the Group took account of the expenses that could arise as a
consequence of these audits, based on a technical analysis of the positions defended by the Group before the tax
authorities. The Group periodically reviews the risk estimate in view of developments in the audits and legal
proceedings.
During the reorganization in 2006 of the former U.S. Filter (acquired in 1999), Veolia, through its subsidiary VENAO,
sought a tax deduction pursuant to the "Worthless Stock deduction" (WSD) provisions under U.S. tax law. Related tax
losses totaled USD4.5 billion (tax base) as of December 31, 2006. The Group submitted a Pre-filing agreement request
in 2007 to validate this amount as of December 31, 2006, which led to a tax audit by the U.S. Internal Revenue
Service (IRS),that is still ongoing.
Between the submission of this Pre-filing agreement request in 2007 and the summer of 2017, Veolia and the IRS had
discussions on numerous occasions to try and resolve this dispute. A further dispute concerning the communication of
documents between 2011 and 2015 is now resolved.
On October 24, 2017, Veolia received a Notice of Proposed Adjustment (NOPA) rejecting all the losses and challenging,
in particular, the insolvency of the U.S. subsidiary at the end of 2006 (condition precedent to application of the
Worthless Stock deduction).This is a preliminary assessment and no payments are currently required.
Veolia continues its discussions with the IRS with a view to resolving or narrowing the issues and replied to this NOPA
on January 22, 2018, refuting the merits of the IRS’s arguments.
The NOPA of October 24, 2017 will be followed by a Revenue Agent's Report which can be appealed to an Appeals
Committee, the IRS administrative body tasked with resolving disputes before they go to court by reaching a
CONTINGENT ASSETS AND LIABILITIES
CONSOLIDATED FINANCIAL STATEMENTS - DECEMBER 31, 2017 / VEOLIA ENVIRONNEMENT 125
Note 12
settlement agreement. In most cases, this procedure reaches a compromise between the IRS’s and the company’s
positions. Where disagreement remains, an appeal can be filed with the courts.
The Group, in agreement with its legal advisors, continues to view the tax positions adopted as robust. Accordingly,
the Group has recognized USD 2.3 billion of the USD 4.5 billion disputed tax losses. The Group’s total exposure in the
event the revised assessment is confirmed at the end of the procedure, taking account of losses utilized since 2006
and the recognition of deferred tax assets, would be USD795 million (excluding interest and penalties). Conversely, a
favorable outcome would allow the progressive recognition of additional deferred tax assets, based on the Group’s
ability to utilize these losses before they expire in 2026.
NOTE 12 CONTINGENT ASSETS AND LIABILITIES
In accordance with IAS 37 criteria, management does not consider it appropriate to record a provision or, as the case
may be, an additional provision, or to recognize deferred income with respect to the following legal, administrative or
arbitration proceedings as of December 31st, 2017, due to the uncertain nature of their outcome.
The main contingent assets and liabilities relating to legal, administrative or arbitration proceedings are presented
below:
North America
United States – Water – Flint
In April 2014, in an attempt to save money, the emergency manager (“Emergency Manager”) in charge of the City of
Flint, Michigan (“Flint”), ordered that it switch its water supply source (previously provided from Detroit) and begin
treating Flint River water for distribution to its residents.
Soon after, Flint residents began to complain about its odor, taste and appearance. Between August 2014 and
December 2014, Flint experienced a number of water quality issues resulting in violations of National Primary Drinking
Water Regulations including Total Trihalomethanes (TTHM, which are disinfection byproducts) maximum contaminant
level violations.
In February 2015, Flint hired a US subsidiary of the Company, Veolia Water North America Operating Services, LLC
(“VWNAOS”) for an analysis related to residual effects of chlorine process (TTHM), discoloration and taste and odor
issues. The scope of work of this one-time (invoiced $40.000), approximately four-week analysis did not include lead
and copper tests.
On February 18, 2015, VWNAOS issued an interim report, which included a statement that the drinking water was
“safe” in that it complied “with state and federal standards and required testing”. During the public meeting, which
was organized by the Flint City Council Public Works Committee in relation to VWNAOS’s interim report, VWNAOS
employees communicated to the public the results of said report. The City had previously informed VWNAOS that the
City, and not VWNAOS, would be conducting lead testing.
On March 12, 2015, VWNAOS delivered its final report to Flint, then made available to the public. In its report,
VWNAOS issued a broad set of recommendations to address TTHM compliance and improve water quality related to
odor and discoloration. It would appear that many of these recommendations were ignored by the local authorities
CONTINGENT ASSETS AND LIABILITIES
126 VEOLIA
ENVIRONNEMENT
/ CONSOLIDATED FINANCIAL STATEMENTS - DECEMBER 31, 2017
Note 12
On June 24, 2015, the US Environmental Protection Agency issued a memorandum summarizing the available
information regarding activities conducted by the City of Flint and several governmental agencies in response to high
lead levels in City drinking water reported by a Flint resident.
On October 21, 2015, the office of the Governor of the State of Michigan commissioned the Flint Water Advisory Task
Force, a consulting group made up of experts in a variety of disciplines, to conduct an independent review of the Flint
water crisis, including lead contamination of residents.
On March 21, 2016, Flint Water Advisory Task Force issued its final report, drafted after interviewing numerous
individuals and reviewing many documents. The Task force report came to the conclusion that the responsibility for the
Flint water crisis rested largely with several governmental agencies and the City of Flint. Notably, the report
highlighted that the Michigan Department of Environmental Quality and the City of Flint did not require and implement
corrosion control at the time of change of water supply source, contrary to what is required under the federal Lead &
Copper Rule to avoid contamination of drinking water. A total of fifteen current or former state and local employees
have been charged with criminal conduct in their mishandling of the lead issues.
Individual and class actions
Since February 2016, numerous individual complaints and class actions have been filed before Michigan and Federal
courts by Flint residents against a number of defendants, including the State of Michigan, the Michigan Department of
Environmental Quality and the US subsidiaries of the Company, Veolia North America (“VNA”) and VWNAOS. Flint
residents allege injury and damages by exposure to toxins, including lead, contained within Flint River water and have
levied accusations of professional negligence and fraud.
The Company has been named in a dozen class actions and hundreds of individual actions. In five of the class actions,
the Company has entered into tolling agreements with the defendants aiming to dismiss the Company without
prejudice to them, thus suspending the statute of limitations. In all the remaining class actions, time for serving the
Company has expired.
In January 2018 a mediation process started by order of the court presiding over the lawsuits in Federal court. The
mediators required the attendance of all parties to the Federal litigation, which includes the US subsidiaries of the
Company but not the Company itself.
Civil action of the State of Michigan’s Attorney General
On June 22, 2016, the State of Michigan’s Attorney General filed a civil action against several corporations, including
VWNAOS and the Company itself, for their alleged role in the Flint water crisis. The Attorney General subsequently
dismissed that initial action, and filed a new civil action on August 16, 2016. Among other allegations, the Attorney
General refers to the interim report delivered by VWNAOS. The Attorney General alleges that the acts and omissions of
these companies constitute professional negligence and fraud.
Subsequent to filing the new action, the Attorney General agreed to dismiss the Company without prejudice. On
September 12, 2016, stipulations of dismissal were filed with the court to that effect. Thus, the Company is no longer
a party to either of the Attorney General actions; however, the Attorney General action against the Company’s
subsidiaries is ongoing.
The Group strongly contests the merits of all these legal proceedings.
These lawsuits have been reported to the insurers, who have reserved their rights with respect to the guarantee from
which the Company and its US subsidiaries benefit.
CONTINGENT ASSETS AND LIABILITIES
CONSOLIDATED FINANCIAL STATEMENTS - DECEMBER 31, 2017 / VEOLIA ENVIRONNEMENT 127
Note 12
Central and Eastern Europe
Romania
In 2000, Apa Nova Bucuresti (“ANB”), Veolia Eau’s Romanian subsidiary in which it holds a 74% stake, signed a 25-
year concession agreement for water distribution and wastewater services with the city of Bucharest.
At the end of July 2015, the National Anticorruption Division of Ploiesti (“NAD”) opened an investigation on influence
peddling involving several persons and entities, including several Romanian subsidiaries of the Company.
ANB and certain of its former managers are suspected of having purchased, between 2008 and 2015, the influence of
three natural persons in order to obtain favorable decisions from Bucharest’s public authorities, resulting in significant
increases in water prices. In exchange for their influence, ANB allegedly made significant payments to companies
controlled by these three persons or related persons, without these payments being proportionate to the services
rendered, and without these services necessarily being real.
Since August 2015, ANB, as well as other subsidiaries of the Company with water and energy activities in Romania,
have provided the NAD, at its request, with numerous documents.
Throughout October 2015, three former managers of ANB were questioned by the NAD, and then placed under the
status of “inculpat” and under judicial supervision.
On October 30, 2015, ANB was placed under this same status, for bribery, buying influence, invasion of privacy, tax
evasion and money laundering.
The investigation continues and to date, the file has not been sent to Court.
ANB is cooperating with the NAD. So far, it only has partial access to the criminal case file.
The Securities and Exchange Commission (SEC) and the Department of Justice (DOJ) are currently conducting
investigations concerning possible violations of US federal laws, relating to the facts which are the subject of NAD’s
investigation. As part of its investigation, the SEC has asked the Company to voluntarily provide documents and
information regarding these facts. At the SEC’s behest, as part of international cooperation, the Autorité des marchés
financiers (AMF) has made requests of the Company as well, which are also related to the facts which are the subject
of NAD’s investigation, in connection with its own investigation on the matter.
The Company is fully cooperating with the investigating authorities and, in particular, providing all requested
information, in accordance with applicable laws.
In 2017, the Parquet National Financier confirmed that a preliminary investigation has been launched.
In January 2018, a search took place in the Company’s premises in Aubervilliers and some hearing of witnesses were
conducted.
Lithuania - Energy
Between 2000 and 2003, the Lithuanian subsidiaries of the Group, UAB Vilniaus Energija (“UVE”) and UAB Litesko
(“Litesko”), signed a number of contracts with Lithuanian cities, of which the most significant was with the city of
Vilnius (“Vilnius”) in 2002 to rent, operate and modernize the heating and electricity production and distribution
infrastructure. The Group made significant investments over the years for which it is awaiting a cost evaluation and a
return on its investment.
The government publicly, and on numerous occasions, accused the Group of being responsible for high heating prices
by waging a sustained campaign against it.
CONTINGENT ASSETS AND LIABILITIES
128 VEOLIA
ENVIRONNEMENT
/ CONSOLIDATED FINANCIAL STATEMENTS - DECEMBER 31, 2017
Note 12
Several steps were thus taken by the authorities and public entities against the Lithuanian subsidiaries of the Group.
Actions to pass on consumer heating costs to UVE:
With Vilnius’s approval, UVE installed individual heat exchange sub-stations. In September 2011, the law
governing the heating sector was amended to transfer the ownership of these sub-stations to apartment
owners, without compensating the investors. Although the courts and the national commission for energy and
price control (the “National Commission”) recognized UVE’s right to compensation, they nevertheless ruled that
they lacked jurisdiction to enforce the exercise of such right. On September 20, 2017, UVE lodged an appeal
before the supreme administrative court. The hearing has not been scheduled yet. To date, UVE has still not
received any compensation.
In 2008 and 2009, UVE respectively proposed to Vilnius and the National Commission to invest in a smoke
condenser. Both entities refused to approve this investment. Pursuant to the applicable regulations, UVE
therefore invested on a private basis. However, in October 2014, the National Commission unilaterally reduced
UVE’s heating prices to capture the savings realized with the help of this condenser despite no legal basis. On
October 13, 2015, the administrative court rejected UVE’s complaint against this decision. On October 27,
2015, UVE lodged an appeal before the supreme administrative court, which dismissed it on November 2, 2016.
In March 2016, the National Commission approved a reduction in UVE’s heating prices, established by Vilnius in
September 2015, following a new calculation of the economic effects of smoke condensers. On October 23,
2015, UVE lodged an appeal before the administrative court against Vilnius’ decision. On April 11, 2016, UVE
also lodged an appeal before such court against the National Commission’s decision. The court combined the
two appeals and then dismissed them on October 17, 2016. UVE has lodged an appeal before the supreme
administrative court. A date for the hearing has yet to be scheduled.
On December 11, 2015, the regional administrative court of Vilnius cancelled the heating prices that the
National Commission had established for UVE for a period of five years (2011-2015), by calling on the National
Commission to retroactively reduce prices. UVE appealed on December 28, 2015 before the supreme
administrative court; a hearing was scheduled for August 17, 2016. The appeal has suspensive effect. On
January 24, 2017, the supreme administrative court upheld the regional administrative court’s decision, which
went into effect on the same day. UVE submitted a request for renewal of the proceedings which was dismissed
by the supreme administrative court on June 16, 2017.
Actions to render the Group’s combined heat power plants economically non-viable
Vilnius’ contract requires UVE to operate combined heat power plants, producing both heat and electricity, and
to produce electricity for sale. The government established an annual electricity purchasing quota for the
national public electricity company (Lesto) at a specific price, ensuring sufficient demand for electricity
generated by the combined heat power plants.
The government decided to terminate the electricity purchasing quota system as of January 1, 2016. Without
these quotas, the most important of the combined heat power plants operated by UVE, VE-3, is no longer
economically viable. As a result, UVE notified the municipal heating network company, controlled by Vilnius,
Vilniaus Silumos Tinklai (“VST”), that VE-3 would cease operating on January 1, 2016 and would be returned.
VST declared its refusal to take back VE-3, requiring UVE to bear the socio-economic costs resulting from the
terminated quotas until the end of the agreement, i.e on March 29, 2017.
CONTINGENT ASSETS AND LIABILITIES
CONSOLIDATED FINANCIAL STATEMENTS - DECEMBER 31, 2017 / VEOLIA ENVIRONNEMENT 129
Note 12
Actions to sanction the Group due to heat price increases
Competition Council
(i) UVE
On January 18, 2011, UVE signed a five-year biofuel supply agreement (the “Agreement”) with a company
named Bionovus in order to provide heat to Vilnius, for which it manages the network. On February 25, 2013,
the competition council of the Republic of Lithuania (the “Competition Council”) decided to open an
investigation regarding compliance of operators in biofuel production and distribution with Lithuanian
competition law.
On December 2, 2015, the Competition Council imposed a €19 million fine on UVE for restricting competition
under the Agreement. UVE challenges that decision since (i) the supplies involved were open to competition via
a call for tenders and in accordance with applicable laws, (ii) the relevant biofuel market used by the
Competition Council for its investigation is not justified and (iii) this fine is disproportionate as it is established
on all of UVE’s heating sales whereas only 15% of these sales are generated from biofuels.
On December 22, 2015, UVE initiated an appeal against this decision before the administrative court of Vilnius,
which suspended the payment for the duration of the proceeding. On October 18, 2016, the administrative
court reduced the fine to €17.1 million but did not modify the rest of the Competition Council’s decision. On
November 17, 2016, UVE lodged an appeal before the supreme administrative court. A date for the hearing has
yet to be scheduled.
(ii) Litesko
On August 2, 2001, a 15-year agreement was concluded between Litesko, the city of Alytus (“Alytus”) and its
municipal utility, Alytus Silumos Tinklai (“AST”) to operate and modernize the heat infrastructure of Alytus. In
June 2005, a ten-year extension was agreed upon (until 2026) in return for a commitment on Litesko’s part to
invest. In December 2007, Alytus requested an additional investment: a new biofuel plant. In exchange, Alytus
agreed to allow Litesko to remain the owner of the plant after the agreement’s expiration in 2026.
On September 9, 2015, the Competition Council concluded that Alytus had violated competition law by
extending the agreement and by accepting that Litesko would remain the owner of the biofuel plant. It called
upon Alytus to reconsider the commitments made in 2005 and 2007. Alytus did not file any appeal against this
decision. On September 29, 2015, Litesko lodged an appeal against the Competition Council’s decision before
the administrative court of Vilnius, which rejected such appeal on February 29, 2016. Litesko filed an appeal on
March 14, 2016 before the supreme administrative court, with suspensive effect. On July 14, 2017, the
supreme administrative court dismissed Litesko’s appeal.
On January 15, 2016, Alytus informed Litesko that the commitments granted in 2005 and 2007 were null and
void and that, consequently, the biofuel plant was to be transferred to AST on June 1, 2016.
On August 17, 2016, Alytus filed a claim before the civil court of Kaunas in order to request the transfer of
AST’s heating facilities.Alytus also requested €8.3 million in indemnities (later increased to €11,7 million), with
respect to calculated heating prices, and €5.9 million for allegedly abandoned investments in Alytus’ heating
system.
On August 29, 2017, Litesko filed a counterclaim for an amount of €8.4 million, including circa €7 million for the
additional investments. The hearings for the pleadings have been set for mid February – early March 2018.
CONTINGENT ASSETS AND LIABILITIES
130 VEOLIA
ENVIRONNEMENT
/ CONSOLIDATED FINANCIAL STATEMENTS - DECEMBER 31, 2017
Note 12
National Commission
(i) UVE
Following an inspection begun in August 2015 by the National Commission in order to assess the validity of the
costs and revenues related to UVE’s regulated activities for the 2012-2014 period, the National Commission, on
August 18, 2016, provided UVE with a draft report in which it concluded that UVE had received unjustified
revenues of approximately €24.8 million over this period. UVE contested the National Commission’s conclusion
and, on September 7, 2016, presented its arguments against the draft report. On September 22, 2016, the
National Commission stated, in its final report, that UVE had received unjustified revenues in the amount of
€24.3 million. On October 26, 2016, UVE sought relief before the administrative court. After the hearing for the
pleadings which took place on January 31, 2018, the court indicated that it would render its decision on
February 21, 2018.
On October 30 2015, the National Commission found that UVE did not comply with its requests to submit
documents and information during the inspection period. Accordingly the National Commission fined UVE for an
amount of €600.000 on December 22, 2015. On January 20, 2016, UVE challenged this decision before the
administrative court which decided to stay the proceedings until the issuance of a decision with respect to the
final report case based on UVE’s abovementioned complaint of October 26, 2016.
In addition, on October 14, 2016, on the basis of the results of the final report, the National Commission
decided to reduce the new base heating prices for UVE by 23%. On November 14, 2016, UVE lodged an appeal
before the administrative court. On June 26, 2017 the administrative court suspended the proceedings until the
issuance of a decision with respect to final report case, based on UVE’s abovementioned complaint of October
26, 2016.
On February 6, 2017, still on the basis of the final report findings, the National Commission drafted a
memorandum concerning alleged breaches relating to regulated activities, in which it accused UVE of violating
the principles and objectives of laws on energy and heating. UVE responded to these accusations in writing. On
March 24, 2017, the National Commission imposed to UVE a fine of €1,3 million. On April 24, 2017, UVE
initiated an appeal against this decision before the administrative court of Vilnius. On October 11, 2017, the
court suspended the proceedings until the issuance of the decision with respect to the final report case, based
on UVE’s abovementioned complaint of October 26, 2016.
(ii) Litesko
On March 29 the National Commission approved the new heat base price for the next regulatory period in
Alytus. Litesko contested the National Commission’s decision regarding the new heat base price and appealed
the National Commission’s decisions to the administrative court of Vilnius on May 2, 2017. On October 24,
2017, the administrative court dismissed Litesko’s appeal. Litesko then filed an appeal before the supreme
administrative court. The hearing has not been scheduled yet.
It should also be noted that on October 12, 2017, the National Commission approved the new heat price in
Birzai. On November 13, 2017, Litesko challenged the National Commission’s decision before the Vilnius
administrative court. At the hearing which took place on February 7, 2018, the case was postponed to a next
hearing on February28, 2018.
Potential criminal liability of the managers of UVE and Litesko
CONTINGENT ASSETS AND LIABILITIES
CONSOLIDATED FINANCIAL STATEMENTS - DECEMBER 31, 2017 / VEOLIA ENVIRONNEMENT 131
Note 12
In February 2012, an investigation was launched by the public prosecutor of Vilnius against the managers of
UVE, Litesko and Dalkia Lietuva in connection with a natural gas purchase by UVE and Litesko, between 2003
and 2005, through a gas trading subsidiary, Dalkia Lietuva (liquidated in March 2014).
Although this gas purchase complied with the law, the public prosecutor brought charges of fraud and misuse of
corporate assets before the criminal court of Vilnius. In October 2014, the defendants were referred to the
court which started reviewing the case. It began with a hearing of the witnesses for the prosecution. During this
stage, the prosecutor was recused by the court in January 2016 after having pursued legal action against a
witness for the prosecution who had provided testimony favorable to the defense. On December 28, 2017, the
court terminated the case because of the statute of limitations. The time limit to lodge an appeal has expired.
Proceedings initiated before the International Center for the Settlement of Investment Disputes (“ICSID”) and the
Stockholm Chamber of Commerce (“SCC”)
Given the numerous legal actions and decisions described above, which are both inequitable and discriminatory, on
January 26, 2016, the Company, Veolia Baltics and Eastern Europe, UVE and Litesko (collectively “the Companies”)
filed a request for arbitration against Lithuania before the International Center for the Settlement of Investment
Disputes (“ICSID”).
In addition, on December 12, 2016, the Companies filed a request with the arbitral tribunal for interim measures
relating to Competition Council proceedings against UVE before Lithuanian courts, in the context of an order for the
precautionary seizure of UVE’s bank accounts; the request was withdrawn after the supreme administrative court
reversed the seizure order.
On December 22, 2016, the Companies submitted their statement of claim, in which they are requesting an indemnity
of circa €120 million. On September 17, 2017, Lithuania submitted its counter-memorial in which it presented a
counterclaim of circa €150 million.
On November 30, 2016, in the context of the Vilnius agreement, the Company and UVE also filed a request for
arbitration before the Stockholm Chamber of Commerce (“SCC”) to secure the appointment of an independent expert
to evaluate the condition of the assets before the agreement came to an end (March 29, 2017). That SCC arbitration
has since expanded in scope to address claims by UVE against Vilnius and VST in connection with the March 2017
conclusion of the Vilnius lease, as well as possible counterclaims by the respondents. On May 26, 2017, the Company
and UVE filed their revised request for arbitration, to which Vilnius and VST responded on July 3, 2017.
On October 16, 2017, the Company and UVE filed their statement of claim in which they are requesting an amount of
circa €22 million. Vilnius and VST’s statement of defense shall be submitted on February 19, 2018.
Other segments
Other segments –Regional aid to passenger road transportation
Transdev Group was informed by a letter from the President of the Ile-de-France Regional Council dated March 3,
2014, that on June 4, 2013, the Paris Administrative Court had instructed the Ile-de-France Region to proceed with the
recovery of subsidies granted to operators under the plan for the improvement of public transportation services. These
subsidies were deemed to be illegal State aids by a decision of the Paris Administrative Court of Appeals of July 12,
2010, on the grounds that no notification was made to the European Commission. According to the terms of the letter,
CONTINGENT ASSETS AND LIABILITIES
132 VEOLIA
ENVIRONNEMENT
/ CONSOLIDATED FINANCIAL STATEMENTS - DECEMBER 31, 2017
Note 12
this restitution obligation could affect certain of Transdev Group’s subsidiaries that may have benefited from these
subsidies, because the Paris Administrative Court of Appeals rejected on December 31, 2013 the Ile-de-France region’s
request for a stay of implementation on the restitution injunction.
This first notification was also sent to other regular line operators in the outer Paris suburbs. This letter is part of a
legal dispute between the Ile-de-France Region and an occasional transportation company, and no subsidiary of the
Transdev Group is a party to it. Although the Region mentions in its letter an estimated regional subsidized amount of
approximately €98.7 million (not including interest) attributed to Transdev Group’s subsidiaries, this estimate remains
uncertain due to the complexity of the assessment resulting from, (i) the length of time the plan has existed, (ii) the
number of operators that received the subsidies, a large number of which have since restructured/consolidated their
activities, and (iii) the plan’s operating rules, which involve local authorities which are either intermediaries (the sums
paid by the Region passing through them) or economic beneficiaries under the plan. In addition, certain subsidies
granted by the Ile-de-France Region should not be considered State aid, as the criteria relating to economic
advantages and effects on trade have not been met.
If the Ile-de-France Region were to issue a recovery order, the Transdev Group or its concerned subsidiaries would
lodge an appeal with suspensive effect before the administrative court.
Transdev Group, together with OPTILE (Organisation Professionnelle des Transports d'Ile-de-France, an association of
all the private companies that operate regular lines in the Ile-de-France Transportation Plan), intends to contest any
potential claims for repayment and intends to take legal action necessary to defend its interests.
In addition, by a decision on February 2, 2017, the European Commission concluded that the State aids granted by the
Ile-de-France Region to operators of public transportation services by bus in the region from 1994 to 2008 were
compatible with the internal market.
In light of this decision, the nominal amount of the State aids cannot be recovered. Only the interest accrued over the
period of illegality (from the date on which the aid was granted and February 2, 2017) could be recovered.
A number of transportation companies, including subsidiaries of Transdev Group, lodged a partial annulment appeal
against the Commission’s decision before the General Court of the European Union. On a primary basis, the appellants
claim that the subsidies granted by the region constitute existing aids and must not be taken into account in
calculating interest. In the alternative, the appellants’ claim that only the subsidies granted after November 25, 1998
should be taken into account in calculating the interest to be recovered and that any aid granted before this date
would be time-barred.
In parallel, on February 27, 2015, Transdev Ile-de-France (as well as other interested members of OPTILE) filed before
the Paris Administrative Court of Appeals:
- an application as a third party against the decision rendered by the same Court on July 12, 2010 that had stated
that the subsidies in question were illegal, in which proceedings it was not a party;
- voluntary intervention, before the same Court, in the context of the appeal filed by the Ile-de-France Region
against the decision of the Paris Administrative Court on June 4, 2013, asking that the Ile-de-France Region issue,
as a consequence of the proceeding cited above, the enforcement orders allowing the recovery of the disputed aid.
By two decisions of November 27, 2015, the Paris Administrative Court of Appeals:
‐ rejected the third-party proceeding of Transdev Ile-de-France;
‐ required the Ile-de-France region to determine, within nine months, the amounts that should be returned by
each beneficiary company of the aid plan, taking into account the nature of the subsidized investments and
the type of transportation activity that was conducted, and issue recovery orders.
RELATED-PARTY TRANSACTIONS
CONSOLIDATED FINANCIAL STATEMENTS - DECEMBER 31, 2017 / VEOLIA ENVIRONNEMENT 133
Note 13
On January 27, 2016, Transdev Ile-de-France lodged an appeal against the decision to reject their third-party
proceeding, which the French Supreme Administrative Court (Conseil d’état) admitted on July 12, 2016.
The Ile-de-France region lodged an appeal before the French Supreme Administrative Court against the decision
requiring it to issue recovery orders. This appeal does not have suspensive effect.
NOTE 13 RELATED-PARTY TRANSACTIONS
The Group identifies related parties in accordance with the provisions of paragraph 9 of IAS 24 revised, Related Party
Disclosures.
A breakdown of compensation and related benefits of key management (related parties) is presented in Note 6.4.
A breakdown of relations with joint ventures is presented in Note 5.2.4.1.
Relations with other related parties break down as follows:
Caisse des dépôts et consignations (4.62% shareholding as of December 31, 2017)
The Caisse des dépôts et consignations is considered a related party, as a legal entity director sitting on the Board of
Directors of Veolia Environnement.
On December 21, 2016, Veolia Environnement and Caisse des dépôts et consignations finalized an agreement entered
into on July 29, 2016 concerning Veolia Environnement’s withdrawal from the transportation business and the share
capital of Transdev Group. The agreements entered into pursuant to this agreement and which continued in 2017 are
set out in Note 3.3 to the 2016 Consolidated financial statements.
Relations with Raise Investissement
In July 2016, Veolia Environnement subscribed to a share capital increase for cash by Raise Investissement SAS in the
amount of €5 million (subscription for 5 million newly issued shares with a par value of one euro each). The
subscription amount was paid up 50% in July 2016 and 25% in October 2017. The residual balance will be settled
when called by the Chairman of this company within a maximum of 5 years.
The duties of chairman of Raise Investissement SAS are performed by Raise Conseil SAS.
Mrs. Clara Gaymard, a director of Veolia Environnement, is considered a related party due to her position as Chief
Executive Officer of Raise Conseil SAS.
SUBSEQUENT EVENTS
134 VEOLIA
ENVIRONNEMENT
/ CONSOLIDATED FINANCIAL STATEMENTS - DECEMBER 31, 2017
Note 14
Relations with SM Conseil
On March 20, 2017, Veolia Environnement entered into a three-year service agreement with SM Conseil SAS,
commencing immediately. Under the terms of the agreement, Veolia Environnement retained this company to assist it
(1) promote Veolia to other stakeholders and potential partners with the aim of developing its business and (2)
identify potential decision-makers and managers likely to contribute to the implementation of its strategy.
This agreement provides for payment to SM Conseil of fixed remuneration of €400,000 per annum, adjusted in line
with the SYNTEC index. It does not provide for the payment of “success fees”.
SM Conseil is chaired by Mr. Serge Michel, a non-voting director (censeur) on the Veolia Environnement Board of
Directors.
NOTE 14 SUBSEQUENT EVENTS
Gabon
By letter dated February 16, 2018, the Gabonese Republic unilaterally terminated the concession agreement signed
with the Group's subsidiary, SEEG – Société d’énergie et d’eau du Gabon, (Gabon’s Energy and Water Company),
alleging reasons of general interest. The same day, through Ministerial order, all material and human resources
were seized by the Gabonese government. A new Ministerial order has also designated a new management in charge
of implementing termination and seizure measures.
The Group has immediately strongly protested against this brutal and manifestly unlawful action and has done
everything it could to support its employees in Gabon. Furthermore, Veolia is examining the legal consequences as
well as legal actions that could result from this situation, and expects Gabon to comply with the rule of law and with its
obligations.
Veolia, through its 51% subsidiary, SEEG, has managed the production, transport, and distribution of drinking water
and electricity throughout all Gabon since 1997, under the terms of a 20-year contract with the Gabonese Republic,
extended for five years last March.
SEEG contribution to main 2017 aggregate can be summarized as follows:
(€ million)
Revenue 306.2
EBITDA 63.6
Operating income 18.7
Net income attributable to owners of the Company 2.6
The SEEG value, in 2017 Group’s consolidated financial statements, amounts to € 40 million.
MAIN COMPANIES INCLUDED IN THE CONSOLIDATED FINANCIAL STATEMENTS
CONSOLIDATED FINANCIAL STATEMENTS - DECEMBER 31, 2017 / VEOLIA ENVIRONNEMENT 135
Note 15
Disposal U.S. Industrial Cleaning Services Division of Veolia North America
On January 23,2018, Veolia Environmental Services North America, LLC, a subsidiary of Veolia North America, Inc and
Clean Harbors, Inc. announced the signing of a definitive agreement whereby Clean Harbors will acquire Veolia North
America’s U.S. Industrial Cleaning Services Division for $120 million in an all-cash transaction. The acquisition is
expected to close in the first quarter of 2018, subject to approval by U.S. regulators and other customary closing
conditions.
NOTE 15 MAIN COMPANIES INCLUDED IN THE CONSOLIDATED FINANCIAL STATEMENTS
In 2017, Veolia Group consolidated or accounted for a total of 1,611 companies and 2,243 companies including
Transdev Group, of which the main companies are:
Company and address French company registration number (Siret)
Consolidation method
% control % interest
Veolia Environnement SA 21 rue La Boétie 75008 Paris
403 210 032 00104 FC 100.00 100.00
FRANCE Water Veolia Eau – Compagnie Générale des Eaux 21 rue La Boétie 75008 PARIS
572 025 526 10945 FC 100.00 100.00
Veolia Water 21 rue La Boétie 75008 PARIS
421 345 042 00053 FC 100.00 100.00
Compagnie des Eaux et de l’Ozone 21 rue La Boétie 75008 PARIS
775 667 363 02470 FC 100.00 100.00
Société Française de Distribution d’Eau 28 boulevard de Pesaro 92000 Nanterre
542 054 945 00416 FC 99.60 99.60
Compagnie Fermière de Services Publics ZAC de la Pointe 9, rue des Frênes 72190 SARGE LES LE MANS
575 750 161 00904 FC 99.87 99.87
Compagnie Méditerranéenne d’Exploitation des Services d’Eau – CMESE 1 rue Albert Cohen Immeuble Plein Ouest A 13016 MARSEILLE
780 153 292 00187 FC 99.72 99.72
Société des Eaux de Melun Zone Industrielle – 198/398, rue Foch 77000 Vaux Le Pénil
785 751 058 00047 FC 99.32 99.32
Société des Eaux de Marseille 25, rue Edouard-Delanglade 13006 Marseille
057 806 150 00017 FC 98.02 98.02
Waste Veolia Propreté 21 rue La Boétie 75008 PARIS
572 221 034 01230 FC 100.00 100.00
Routière de l’Est Parisien 28 boulevard de Pesaro 92000 Nanterre
612 006 965 00182 FC 100.00 100.00
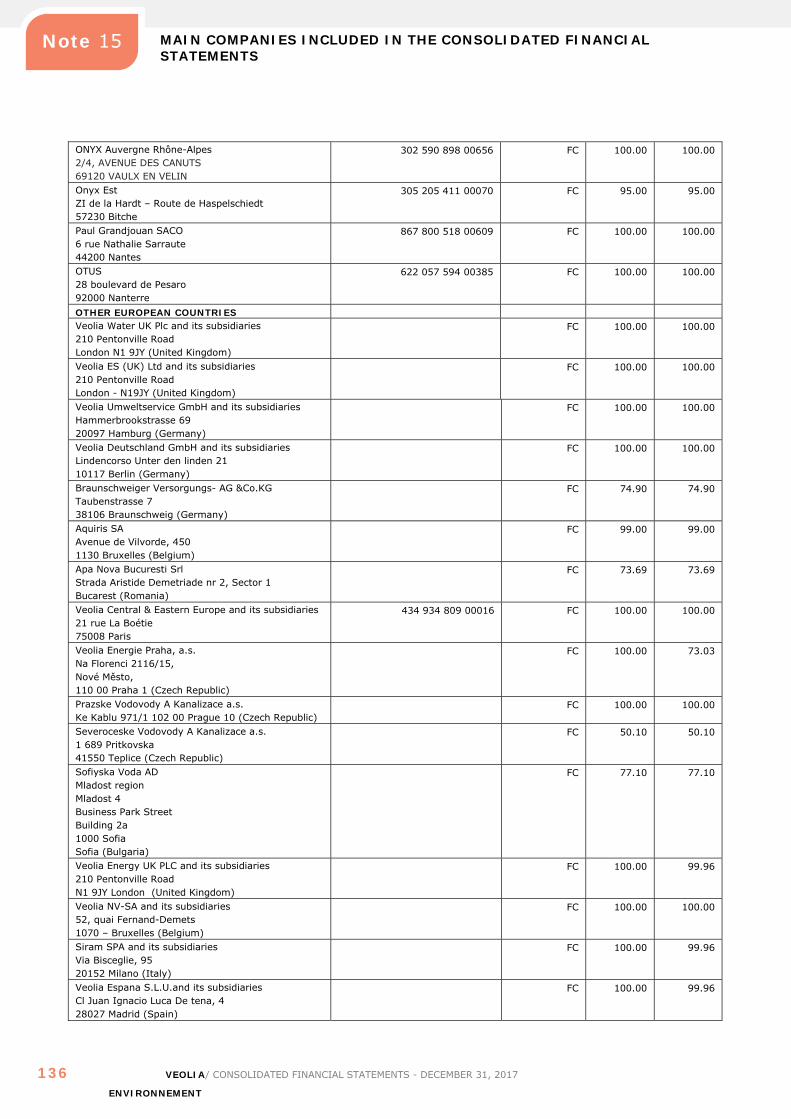
MAIN COMPANIES INCLUDED IN THE CONSOLIDATED FINANCIAL STATEMENTS
136 VEOLIA
ENVIRONNEMENT
/ CONSOLIDATED FINANCIAL STATEMENTS - DECEMBER 31, 2017
Note 15
ONYX Auvergne Rhône-Alpes 2/4, AVENUE DES CANUTS 69120 VAULX EN VELIN
302 590 898 00656 FC 100.00 100.00
Onyx Est ZI de la Hardt – Route de Haspelschiedt 57230 Bitche
305 205 411 00070 FC 95.00 95.00
Paul Grandjouan SACO 6 rue Nathalie Sarraute 44200 Nantes
867 800 518 00609 FC 100.00 100.00
OTUS 28 boulevard de Pesaro 92000 Nanterre
622 057 594 00385 FC 100.00 100.00
OTHER EUROPEAN COUNTRIES Veolia Water UK Plc and its subsidiaries 210 Pentonville Road London N1 9JY (United Kingdom)
FC 100.00 100.00
Veolia ES (UK) Ltd and its subsidiaries 210 Pentonville Road London - N19JY (United Kingdom)
FC 100.00 100.00
Veolia Umweltservice GmbH and its subsidiaries Hammerbrookstrasse 69 20097 Hamburg (Germany)
FC 100.00 100.00
Veolia Deutschland GmbH and its subsidiaries Lindencorso Unter den linden 21 10117 Berlin (Germany)
FC 100.00 100.00
Braunschweiger Versorgungs- AG &Co.KG Taubenstrasse 7 38106 Braunschweig (Germany)
FC 74.90 74.90
Aquiris SA Avenue de Vilvorde, 450 1130 Bruxelles (Belgium)
FC 99.00 99.00
Apa Nova Bucuresti Srl Strada Aristide Demetriade nr 2, Sector 1 Bucarest (Romania)
FC 73.69 73.69
Veolia Central & Eastern Europe and its subsidiaries 21 rue La Boétie 75008 Paris
434 934 809 00016 FC 100.00 100.00
Veolia Energie Praha, a.s. Na Florenci 2116/15, Nové Město, 110 00 Praha 1 (Czech Republic)
FC 100.00 73.03
Prazske Vodovody A Kanalizace a.s. Ke Kablu 971/1 102 00 Prague 10 (Czech Republic)
FC 100.00 100.00
Severoceske Vodovody A Kanalizace a.s. 1 689 Pritkovska 41550 Teplice (Czech Republic)
FC 50.10 50.10
Sofiyska Voda AD Mladost region Mladost 4 Business Park Street Building 2a 1000 Sofia Sofia (Bulgaria)
FC 77.10 77.10
Veolia Energy UK PLC and its subsidiaries 210 Pentonville Road N1 9JY London (United Kingdom)
FC
100.00 99.96
Veolia NV-SA and its subsidiaries 52, quai Fernand-Demets 1070 – Bruxelles (Belgium)
FC
100.00 100.00
Siram SPA and its subsidiaries Via Bisceglie, 95 20152 Milano (Italy)
FC
100.00 99.96
Veolia Espana S.L.U.and its subsidiaries Cl Juan Ignacio Luca De tena, 4 28027 Madrid (Spain)
FC
100.00 99.96
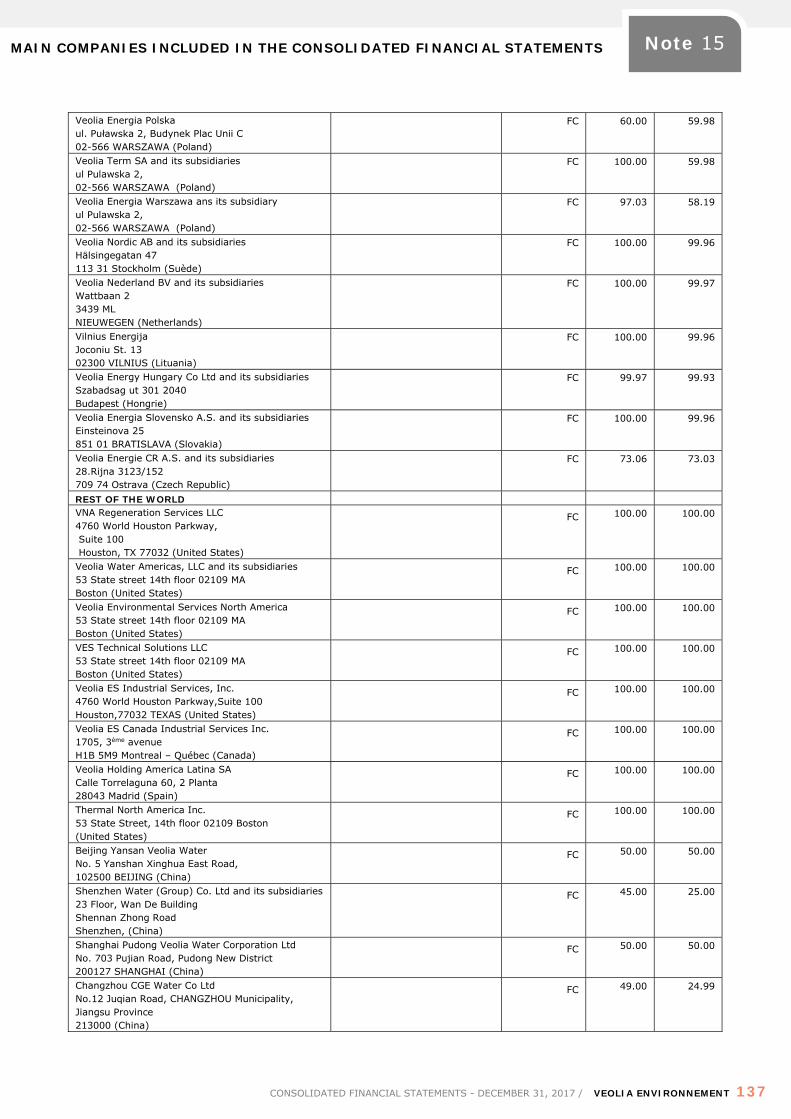
MAIN COMPANIES INCLUDED IN THE CONSOLIDATED FINANCIAL STATEMENTS
CONSOLIDATED FINANCIAL STATEMENTS - DECEMBER 31, 2017 / VEOLIA ENVIRONNEMENT 137
Note 15
Veolia Energia Polska ul. Puławska 2, Budynek Plac Unii C 02-566 WARSZAWA (Poland)
FC
60.00 59.98
Veolia Term SA and its subsidiaries ul Pulawska 2, 02-566 WARSZAWA (Poland)
FC
100.00 59.98
Veolia Energia Warszawa ans its subsidiary ul Pulawska 2, 02-566 WARSZAWA (Poland)
FC
97.03 58.19
Veolia Nordic AB and its subsidiaries Hälsingegatan 47 113 31 Stockholm (Suède)
FC
100.00 99.96
Veolia Nederland BV and its subsidiaries Wattbaan 2 3439 ML NIEUWEGEN (Netherlands)
FC
100.00 99.97
Vilnius Energija Joconiu St. 13 02300 VILNIUS (Lituania)
FC
100.00 99.96
Veolia Energy Hungary Co Ltd and its subsidiaries Szabadsag ut 301 2040 Budapest (Hongrie)
FC
99.97 99.93
Veolia Energia Slovensko A.S. and its subsidiaries Einsteinova 25 851 01 BRATISLAVA (Slovakia)
FC
100.00 99.96
Veolia Energie CR A.S. and its subsidiaries 28.Rijna 3123/152 709 74 Ostrava (Czech Republic)
FC
73.06 73.03
REST OF THE WORLD VNA Regeneration Services LLC 4760 World Houston Parkway, Suite 100 Houston, TX 77032 (United States)
FC 100.00 100.00
Veolia Water Americas, LLC and its subsidiaries 53 State street 14th floor 02109 MA Boston (United States)
FC 100.00 100.00
Veolia Environmental Services North America 53 State street 14th floor 02109 MA Boston (United States)
FC 100.00 100.00
VES Technical Solutions LLC 53 State street 14th floor 02109 MA Boston (United States)
FC 100.00 100.00
Veolia ES Industrial Services, Inc. 4760 World Houston Parkway,Suite 100 Houston,77032 TEXAS (United States)
FC 100.00 100.00
Veolia ES Canada Industrial Services Inc. 1705, 3ème avenue H1B 5M9 Montreal – Québec (Canada)
FC 100.00 100.00
Veolia Holding America Latina SA Calle Torrelaguna 60, 2 Planta 28043 Madrid (Spain)
FC 100.00 100.00
Thermal North America Inc. 53 State Street, 14th floor 02109 Boston (United States)
FC 100.00 100.00
Beijing Yansan Veolia Water No. 5 Yanshan Xinghua East Road, 102500 BEIJING (China)
FC 50.00 50.00
Shenzhen Water (Group) Co. Ltd and its subsidiaries 23 Floor, Wan De Building Shennan Zhong Road Shenzhen, (China)
FC 45.00 25.00
Shanghai Pudong Veolia Water Corporation Ltd No. 703 Pujian Road, Pudong New District 200127 SHANGHAI (China)
FC 50.00 50.00
Changzhou CGE Water Co Ltd No.12 Juqian Road, CHANGZHOU Municipality, Jiangsu Province 213000 (China)
FC 49.00 24.99
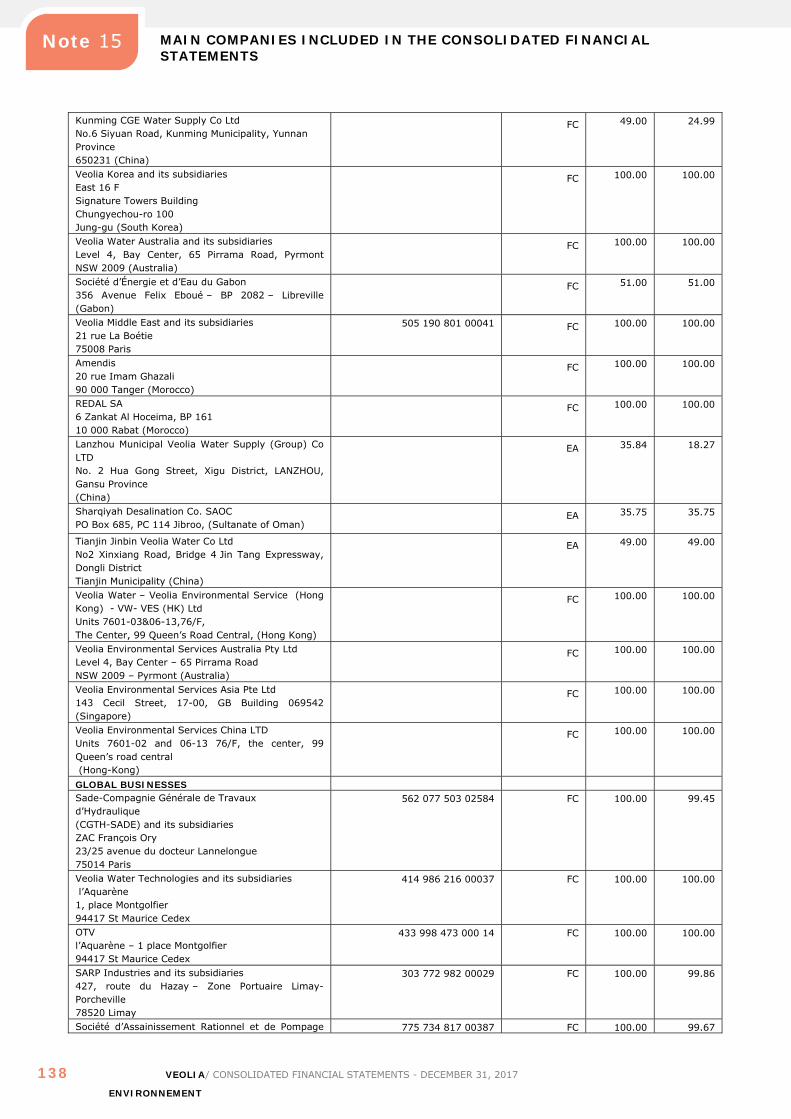
MAIN COMPANIES INCLUDED IN THE CONSOLIDATED FINANCIAL STATEMENTS
138 VEOLIA
ENVIRONNEMENT
/ CONSOLIDATED FINANCIAL STATEMENTS - DECEMBER 31, 2017
Note 15
Kunming CGE Water Supply Co Ltd No.6 Siyuan Road, Kunming Municipality, Yunnan Province 650231 (China)
FC 49.00 24.99
Veolia Korea and its subsidiaries East 16 F Signature Towers Building Chungyechou-ro 100 Jung-gu (South Korea)
FC 100.00 100.00
Veolia Water Australia and its subsidiaries Level 4, Bay Center, 65 Pirrama Road, Pyrmont NSW 2009 (Australia)
FC 100.00 100.00
Société d’Énergie et d’Eau du Gabon 356 Avenue Felix Eboué – BP 2082 – Libreville (Gabon)
FC 51.00 51.00
Veolia Middle East and its subsidiaries 21 rue La Boétie 75008 Paris
505 190 801 00041 FC 100.00 100.00
Amendis 20 rue Imam Ghazali 90 000 Tanger (Morocco)
FC 100.00 100.00
REDAL SA 6 Zankat Al Hoceima, BP 161 10 000 Rabat (Morocco)
FC 100.00 100.00
Lanzhou Municipal Veolia Water Supply (Group) Co LTD No. 2 Hua Gong Street, Xigu District, LANZHOU, Gansu Province (China)
EA 35.84 18.27
Sharqiyah Desalination Co. SAOC PO Box 685, PC 114 Jibroo, (Sultanate of Oman)
EA 35.75 35.75
Tianjin Jinbin Veolia Water Co Ltd No2 Xinxiang Road, Bridge 4 Jin Tang Expressway, Dongli District Tianjin Municipality (China)
EA 49.00 49.00
Veolia Water – Veolia Environmental Service (Hong Kong) - VW- VES (HK) Ltd Units 7601-03&06-13,76/F, The Center, 99 Queen’s Road Central, (Hong Kong)
FC 100.00 100.00
Veolia Environmental Services Australia Pty Ltd Level 4, Bay Center – 65 Pirrama Road NSW 2009 – Pyrmont (Australia)
FC 100.00 100.00
Veolia Environmental Services Asia Pte Ltd 143 Cecil Street, 17-00, GB Building 069542 (Singapore)
FC 100.00 100.00
Veolia Environmental Services China LTD Units 7601-02 and 06-13 76/F, the center, 99 Queen’s road central (Hong-Kong)
FC 100.00 100.00
GLOBAL BUSINESSES Sade-Compagnie Générale de Travaux d’Hydraulique (CGTH-SADE) and its subsidiaries ZAC François Ory 23/25 avenue du docteur Lannelongue 75014 Paris
562 077 503 02584 FC 100.00 99.45
Veolia Water Technologies and its subsidiaries l’Aquarène 1, place Montgolfier 94417 St Maurice Cedex
414 986 216 00037 FC 100.00 100.00
OTV l’Aquarène – 1 place Montgolfier 94417 St Maurice Cedex
433 998 473 000 14 FC 100.00 100.00
SARP Industries and its subsidiaries 427, route du Hazay – Zone Portuaire Limay-Porcheville 78520 Limay
303 772 982 00029 FC 100.00 99.86
Société d’Assainissement Rationnel et de Pompage 775 734 817 00387 FC 100.00 99.67
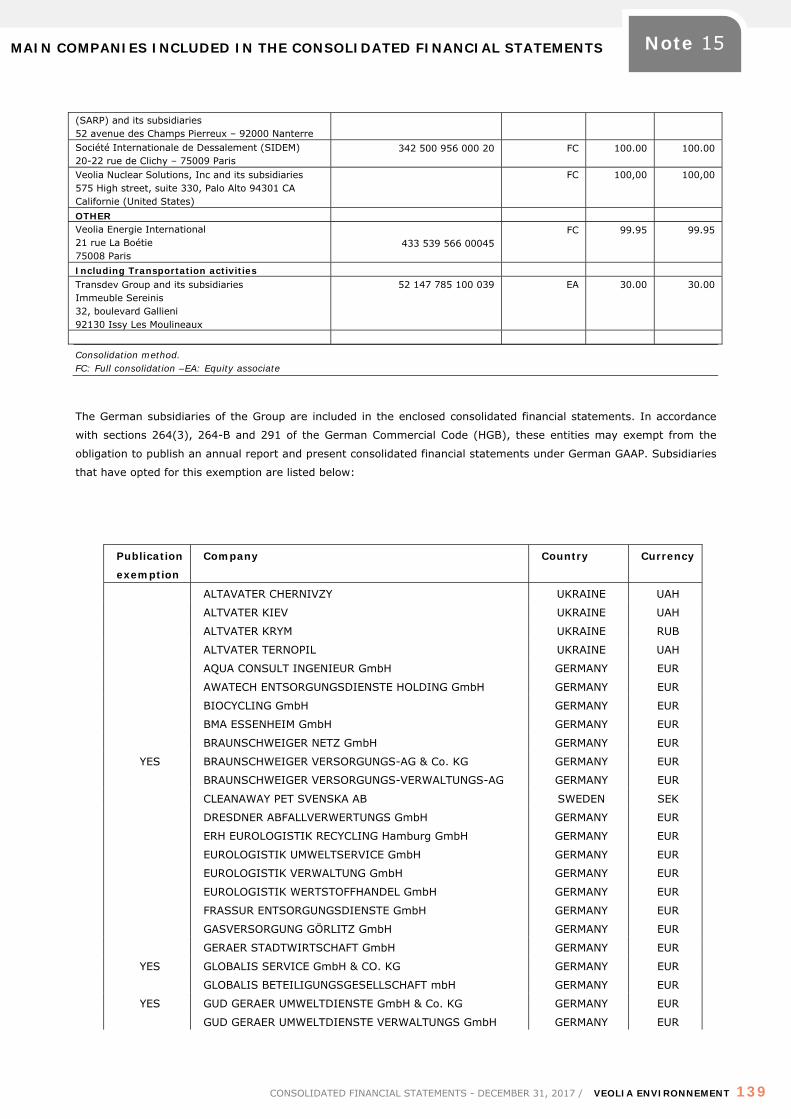
MAIN COMPANIES INCLUDED IN THE CONSOLIDATED FINANCIAL STATEMENTS
CONSOLIDATED FINANCIAL STATEMENTS - DECEMBER 31, 2017 / VEOLIA ENVIRONNEMENT 139
Note 15
(SARP) and its subsidiaries 52 avenue des Champs Pierreux – 92000 Nanterre Société Internationale de Dessalement (SIDEM) 20-22 rue de Clichy – 75009 Paris
342 500 956 000 20 FC 100.00 100.00
Veolia Nuclear Solutions, Inc and its subsidiaries 575 High street, suite 330, Palo Alto 94301 CA Californie (United States)
FC 100,00 100,00
OTHER Veolia Energie International 21 rue La Boétie 75008 Paris
433 539 566 00045
FC
99.95 99.95
Including Transportation activities Transdev Group and its subsidiaries Immeuble Sereinis 32, boulevard Gallieni 92130 Issy Les Moulineaux
52 147 785 100 039 EA
30.00 30.00
Consolidation method. FC: Full consolidation –EA: Equity associate
The German subsidiaries of the Group are included in the enclosed consolidated financial statements. In accordance
with sections 264(3), 264-B and 291 of the German Commercial Code (HGB), these entities may exempt from the
obligation to publish an annual report and present consolidated financial statements under German GAAP. Subsidiaries
that have opted for this exemption are listed below:
Publication
exemption
Company Country Currency
ALTAVATER CHERNIVZY UKRAINE UAH
ALTVATER KIEV UKRAINE UAH
ALTVATER KRYM UKRAINE RUB
ALTVATER TERNOPIL UKRAINE UAH
AQUA CONSULT INGENIEUR GmbH GERMANY EUR
AWATECH ENTSORGUNGSDIENSTE HOLDING GmbH GERMANY EUR
BIOCYCLING GmbH GERMANY EUR
BMA ESSENHEIM GmbH GERMANY EUR
BRAUNSCHWEIGER NETZ GmbH GERMANY EUR
YES BRAUNSCHWEIGER VERSORGUNGS-AG & Co. KG GERMANY EUR
BRAUNSCHWEIGER VERSORGUNGS-VERWALTUNGS-AG GERMANY EUR
CLEANAWAY PET SVENSKA AB SWEDEN SEK
DRESDNER ABFALLVERWERTUNGS GmbH
ERH EUROLOGISTIK RECYCLING Hamburg GmbH
EUROLOGISTIK UMWELTSERVICE GmbH
EUROLOGISTIK VERWALTUNG GmbH
EUROLOGISTIK WERTSTOFFHANDEL GmbH
FRASSUR ENTSORGUNGSDIENSTE GmbH
GERMANY
GERMANY
GERMANY
GERMANY
GERMANY
GERMANY
EUR
EUR
EUR
EUR
EUR
EUR
GASVERSORGUNG GÖRLITZ GmbH GERMANY EUR
GERAER STADTWIRTSCHAFT GmbH GERMANY EUR
YES GLOBALIS SERVICE GmbH & CO. KG GERMANY EUR
GLOBALIS BETEILIGUNGSGESELLSCHAFT mbH GERMANY EUR
YES GUD GERAER UMWELTDIENSTE GmbH & Co. KG GERMANY EUR
GUD GERAER UMWELTDIENSTE VERWALTUNGS GmbH GERMANY EUR
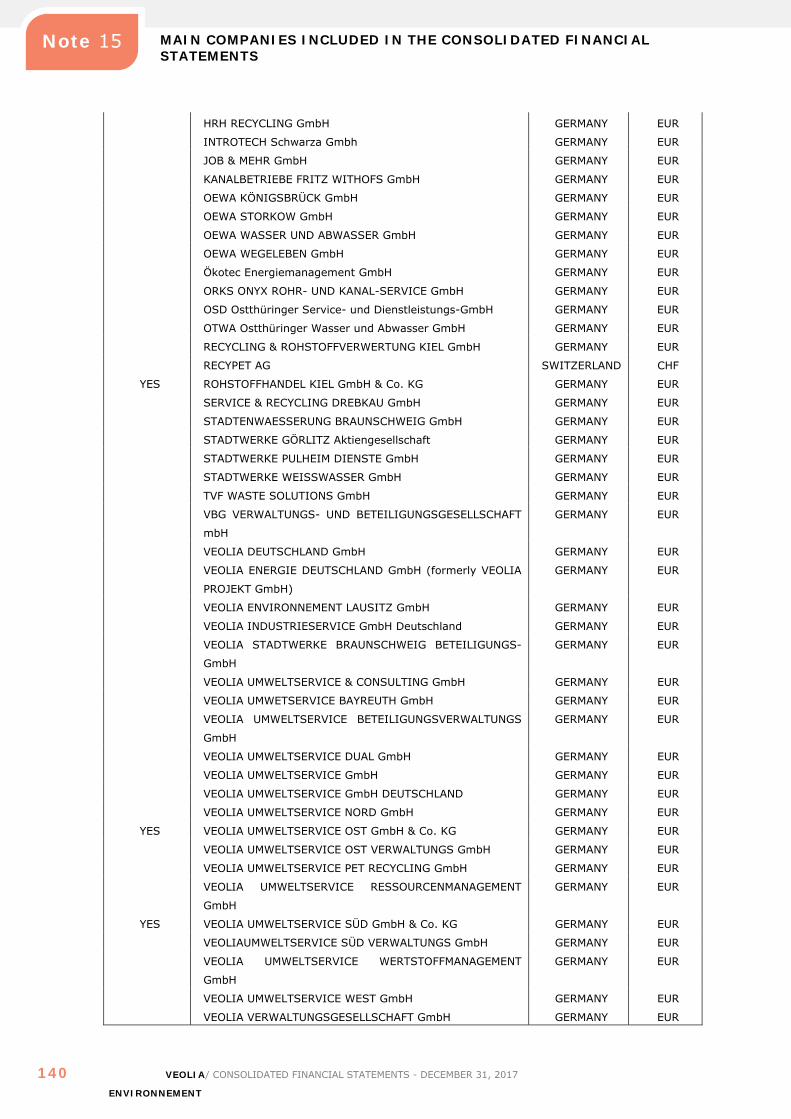
MAIN COMPANIES INCLUDED IN THE CONSOLIDATED FINANCIAL STATEMENTS
140 VEOLIA
ENVIRONNEMENT
/ CONSOLIDATED FINANCIAL STATEMENTS - DECEMBER 31, 2017
Note 15
HRH RECYCLING GmbH
INTROTECH Schwarza Gmbh
GERMANY
GERMANY
EUR
EUR
JOB & MEHR GmbH GERMANY EUR
KANALBETRIEBE FRITZ WITHOFS GmbH GERMANY EUR
OEWA KÖNIGSBRÜCK GmbH GERMANY EUR
OEWA STORKOW GmbH GERMANY EUR
OEWA WASSER UND ABWASSER GmbH GERMANY EUR
OEWA WEGELEBEN GmbH
Ökotec Energiemanagement GmbH
GERMANY
GERMANY
EUR
EUR
ORKS ONYX ROHR- UND KANAL-SERVICE GmbH
OSD Ostthüringer Service- und Dienstleistungs-GmbH
OTWA Ostthüringer Wasser und Abwasser GmbH
GERMANY
GERMANY
GERMANY
EUR
EUR
EUR
RECYCLING & ROHSTOFFVERWERTUNG KIEL GmbH GERMANY EUR
RECYPET AG SWITZERLAND CHF
YES ROHSTOFFHANDEL KIEL GmbH & Co. KG
SERVICE & RECYCLING DREBKAU GmbH
GERMANY
GERMANY
EUR
EUR
STADTENWAESSERUNG BRAUNSCHWEIG GmbH GERMANY EUR
STADTWERKE GÖRLITZ Aktiengesellschaft GERMANY EUR
STADTWERKE PULHEIM DIENSTE GmbH GERMANY EUR
STADTWERKE WEISSWASSER GmbH GERMANY EUR
TVF WASTE SOLUTIONS GmbH GERMANY EUR
VBG VERWALTUNGS- UND BETEILIGUNGSGESELLSCHAFT
mbH
GERMANY EUR
VEOLIA DEUTSCHLAND GmbH GERMANY EUR
VEOLIA ENERGIE DEUTSCHLAND GmbH (formerly VEOLIA
PROJEKT GmbH)
GERMANY EUR
VEOLIA ENVIRONNEMENT LAUSITZ GmbH GERMANY EUR
VEOLIA INDUSTRIESERVICE GmbH Deutschland GERMANY EUR
VEOLIA STADTWERKE BRAUNSCHWEIG BETEILIGUNGS-
GmbH
GERMANY EUR
VEOLIA UMWELTSERVICE & CONSULTING GmbH GERMANY EUR
VEOLIA UMWETSERVICE BAYREUTH GmbH GERMANY EUR
VEOLIA UMWELTSERVICE BETEILIGUNGSVERWALTUNGS
GmbH
GERMANY EUR
VEOLIA UMWELTSERVICE DUAL GmbH GERMANY EUR
VEOLIA UMWELTSERVICE GmbH GERMANY EUR
VEOLIA UMWELTSERVICE GmbH DEUTSCHLAND GERMANY EUR
VEOLIA UMWELTSERVICE NORD GmbH GERMANY EUR
YES VEOLIA UMWELTSERVICE OST GmbH & Co. KG GERMANY EUR
VEOLIA UMWELTSERVICE OST VERWALTUNGS GmbH GERMANY EUR
VEOLIA UMWELTSERVICE PET RECYCLING GmbH GERMANY EUR
VEOLIA UMWELTSERVICE RESSOURCENMANAGEMENT
GmbH
GERMANY EUR
YES VEOLIA UMWELTSERVICE SÜD GmbH & Co. KG GERMANY EUR
VEOLIAUMWELTSERVICE SÜD VERWALTUNGS GmbH GERMANY EUR
VEOLIA UMWELTSERVICE WERTSTOFFMANAGEMENT
GmbH
GERMANY EUR
VEOLIA UMWELTSERVICE WEST GmbH GERMANY EUR
VEOLIA VERWALTUNGSGESELLSCHAFT GmbH GERMANY EUR
AUDIT FEES
CONSOLIDATED FINANCIAL STATEMENTS - DECEMBER 31, 2017 / VEOLIA ENVIRONNEMENT 141
Note 16
NOTE 16 AUDIT FEES
Audit fees incurred by the Group, including fees related to equity associates, during fiscal years 2017 and 2016 total
€xxx million and €28.7 million, respectively, including:
€xxx million in 2017 and €24.5 million in 2016 in respect of the statutory audit of the accounts; and
€xxx million in 2017 and €4.2 million in 2016 in respect of services falling within the scope of diligences directly
related to the audit engagement.