Consolidated Financial Resultsfor1Q FY2019 · Regarding NTT DOCOMO’s (“Docomo”) mobile...
20
© Internet Initiative Japan Inc. Internet Initiative Japan Inc. TSE1 (3774) August 7, 2019 Consolidated Financial Results for 1Q FY2019 We changed our accounting principles from the Generally Accepted Accounting Principles in the U.S. (“U.S. GAAP”) to the International Financial Reporting Standards (IFRS) from the filing of FY2018 annual report “Yuka- shoken-houkokusho” which was filed on June 28, 2019. Because reporting period of foreign consolidated subsidiaries under IFRS is different from that of under U.S. GAAP, some figures disclosed in the past are different.
Transcript of Consolidated Financial Resultsfor1Q FY2019 · Regarding NTT DOCOMO’s (“Docomo”) mobile...

© Internet Initiative Japan Inc.
Internet Initiative Japan Inc.TSE1 (3774)August 7, 2019
Consolidated Financial Results for 1Q FY2019
We changed our accounting principles from the Generally Accepted Accounting Principles in the U.S. (“U.S. GAAP”) to the International Financial Reporting Standards (IFRS) from the filing of FY2018 annual report “Yuka-shoken-houkokusho” which was filed on June 28, 2019.
Because reporting period of foreign consolidated subsidiaries under IFRS is different from that of under U.S. GAAP, some figures disclosed in the past are different.

© Internet Initiative Japan Inc.
Agenda
1
Ⅰ. Summary of 1Q19 Financial ResultsⅡ. Consolidated Financial Results for 1Q19Ⅲ. Other Information

© Internet Initiative Japan Inc. 2
Ⅰ. Summary of 1Q19 Financial Results % =Year over Year (YoY) comparison
Solid business developments & strong earnings along with favorable demandSolid business developments & strong earnings along with favorable demandTotal Revenues JPY49.8 billion +11.1%Operating Profit JPY1.4 billion +58.8%
Enhancement of enterprise NW service developmentEnterprise recurring revenue* continued to grow: +8.9% Expansion of Full-MVNO & IoT service lineups
• First in Japan to launch eSIM services (July), Developing and preparing to launch eSIM services for enterprises• SoftSIM (May), Services to visualize and monitor IoT data (July) etc.
Execution of Multi cloud strategy: Cloud revenue +10.7%• Adding connecting points for multi cloud: AWS, MS, Google• IIJ Omnibus Service’s function expansion: optimizing route control when accessing SaaS such as MS Office365
Strong demands continue for Security: Revenue +20.0% Each service grew such as SOC, DDoS Protection CDN: Providing Internet live platform for “Virtual High School Baseball Championship” 5 years in a row JOCDN: Data migration of a large contents holder is approximately 80% completed
Gross profit for both NW & SI started with improving trend NW gross profit +14.0%, +JPY0.6 billion YoY(*) with recurring revenue accumulation & rebound effect of Full-
MVNO profitability improvement by increasing its revenue against its fixed cost SI gross profit +23.3%, +JPY0.4 billion YoY with continuing effect of FY18 profitability improvement strategies
DeCurret, new company for digital currency trading and settlement business, raised capital by private placement Expect even stronger synergy with enterprise shareholders 11 new shareholders: KDDI, Konami, Sumitomo Life, Daido Life, Meiji Yasuda Life, Chubu Electric Power,
Hankyu Hanshin Holdings, Matsui Securities, Energia Communications, ALSOK, Toppan Printing IIJ ownership 30%, Total enterprise shareholders 30 , Capital raised to JPY8.63 billion
(*) The growth rate shows the comparison for the normalized 1Q18 operating profit which is calculated by allocating JPY2.05 billion of additional NW service cost recorded in 4Q18 as a result of NTT Docomo’s mobile interconnectivity unit charge revision to attributable each quarter of FY2018
(*)
(including capital reserve)
*Enterprise recurring revenue is calculated by subtracting revenues of WAN, MVNE
and consumers from recurring revenue
(excluding WAN)
(including IIJ)

© Internet Initiative Japan Inc.
% of Revenues % of Adjusted Revenues [% of Revenues] % of Revenues % of Revenues
[Compared to 1Q18 Results]Apr. 2019 - Jun. 2019 Apr. 2019 - Sep. 2019 Apr. 2019 - Mar. 2020
Revenues 49.8 +11.1% 97.7 204.0
85.2% 85.8% [84.8%] 85.5% 84.6%
42.4 +10.3%[+11.7%]
14.8% 14.2% [15.2%] 14.5% 15.4%
7.4 +16.3%[+8.1%]
12.0% 12.2% 12.3% 12.0%
6.0 +9.5% 12.0 24.42.8% 1.9% [3.0%] 2.3% 3.4%
1.4 +58.8%[+2.2%]
2.7% 2.1% [3.2%] 1.5% 3.1%
1.4 +45.2%[-3.9%]
1.6% 1.2% [1.9%] 0.6% 1.7%
0.8 +42.9%[-11.1%]
Compared to 1Q18Adjusted Results 1H19 Targets FY19 Targets
Net Profit 0.5 0.6 3.5[0.9]
2.2 7.0[1.4]
Profit before tax 0.9 1.5 6.3[1.4]
SG&A etc. 5.5
Operating Profit 0.9
Gross Profit 6.3 14.2 31.4[6.8]
Cost of Sales 38.5 83.5 172.6[38.0]
1Q19 Results
44.8
1Q18 Adjusted Results[1Q18 Results]Apr. 2018 - Jun. 2018
3
Unit: JPY billionⅡ- 1. Consolidated Financial Results for 1Q19
(*1) Adjusted results is calculated by allocating JPY2.05 billion of additional NW service cost recorded in 4Q18 as a result of NTT Docomo’s mobile interconnectivity unit charge revision (March 2019) to attributable each quarter of 1Q19. For details, please refer to page 5 of this presentation material.
(*2) SG&A etc. shows the sum of SG&A, which includes R&D expenses, and other income/expenses.(*3) Net profit is “Profit for the period/year attributable to owners of the parent”
(*1)
(*3)
(*2)

© Internet Initiative Japan Inc.
Ⅱ- 2. Revenues Unit: JPY million[ ] , YoY = Year over year comparison
NW Services
ATM Operation Business
Systems Integration (SI)
Outsourcing Service
Internet Connectivity Services (Enterprise)
WAN Service
Internet Connectivity Services (Consumer) Systems Operation and MaintenanceSystems Construction (including equipment sales)
* One-time revenue, systems construction revenues which includes equipment sales, is mainly recognized when systems or equipment are delivered and accepted by customers
* Recurring revenue represent the following monthly recurring revenues: Internet Connectivity Services for Enterprise, Internet Connectivity Services for Consumer, Outsourcing Services, WAN Services, and Systems Operation and Maintenance
Recurring Revenue*1Q19: JPY41,540 million, +6.8% YoY(83.4% of 1Q19 revenues)
One-time Revenue*1Q19: JPY7,249 million, +46.2% YoY(14.5% of 1Q19 revenues)
FY18: 192,430 [+9.2%]
4

© Internet Initiative Japan Inc.
NW ServicesGross profit ratio: SI Total
FY18: 163,455 [+10.5%]
Ⅱ- 3. Cost of Sales & Gross Profit RatioNW Services ATM Operation BusinessSICost of Sales:
Unit: JPY million
[ ] , YoY = Year over year comparison
Total 1Q19: JPY7,382 million
+16.3% YoY from 1Q18 adjusted results NW Services 1Q19: JPY5,019 million
+14.0% YoY from 1Q18 adjusted results• Allocation of JPY2.05 billion, additional
NW service cost recorded in 4Q18 as a result of NTT Docomo’s mobile interconnectivity unit charge revision, to attributable each quarter of FY2018 is described below:
(unit: JPY billion)
• Full-MVNO related fixed cost increased by over JPY0.3 billion per quarter (from Mar. 2018)
SI 1Q19: JPY1,890 million, +23.3% YoY
Gross profit
5
4Q18
2.05
0.48 0.50 0.52 0.55
1Q18 2Q18 3Q18 4Q18
Adjusted results
• Adjusted results are calculated by allocating JPY2.05 billion of additional NW service cost recorded in 4Q18 as a result of NTT Docomo’s mobile interconnectivity unit charge revision to attributable each quarter of FY2018. FY2018 figures disclosed in this presentation material from this page reflect such adjustment
• SI includes equipment sales
Adjusted results Adjusted results Adjusted results

© Internet Initiative Japan Inc.
Ⅱ- 4. Network Services (1) RevenuesUnit: JPY million
[ ] , YoY =Year over year comparisonQoQ = 1Q19 compared to 4Q18
9,931 10,447
FY18: 118,626 [+9.8%]
10,613 10,967
• Total contracted bandwidth is calculated by multiplying number of contracts by contracted bandwidths respectively for IP service (including data center connectivity service) and IIJ FiberAccess/F and IIJ DSL/F of Internet connectivity services (Enterprise).
Outsourcing ServicesInternet Connectivity Services (consumer)
WAN Services
Total Contracted Bandwidth (Gbps)
Internet Connectivity Services (enterprise)Internet Connectivity (Enterprise) 1Q19: +14.0% YoY, +2.1% QoQ
• Mobile revenue continued to increase 1Q19-end total subscriptions: 2,786 thousand
(up 342 thousand YoY) 1Q19-end MVNE clients: 152 (+9 clients YoY) IP services and others achieved YoY growth
with no significant pricing pressure from clients: IP services +2.2% YoY
Internet Connectivity (Consumer) 1Q19: +5.7% YoY, +2.7% QoQ
Outsourcing Services 1Q19: +11.8% YoY, +2.1% QoQ
• Strong demands for Security and Omnibus 1Q19 Security revenue: +20.0% YoY 1Q19 Omnibus revenue: +51.4% YoY
WAN Services 1Q19: -3.9% YoY, -4.2% QoQ
• FY19 revenue is expected to decrease by approx. JPY4.0 billion YoY, due to existing large clients migrating to mobile.
NW Services RevenuesTotal Mobile Revenue
11,339
6
© Internet Initiative Japan Inc.
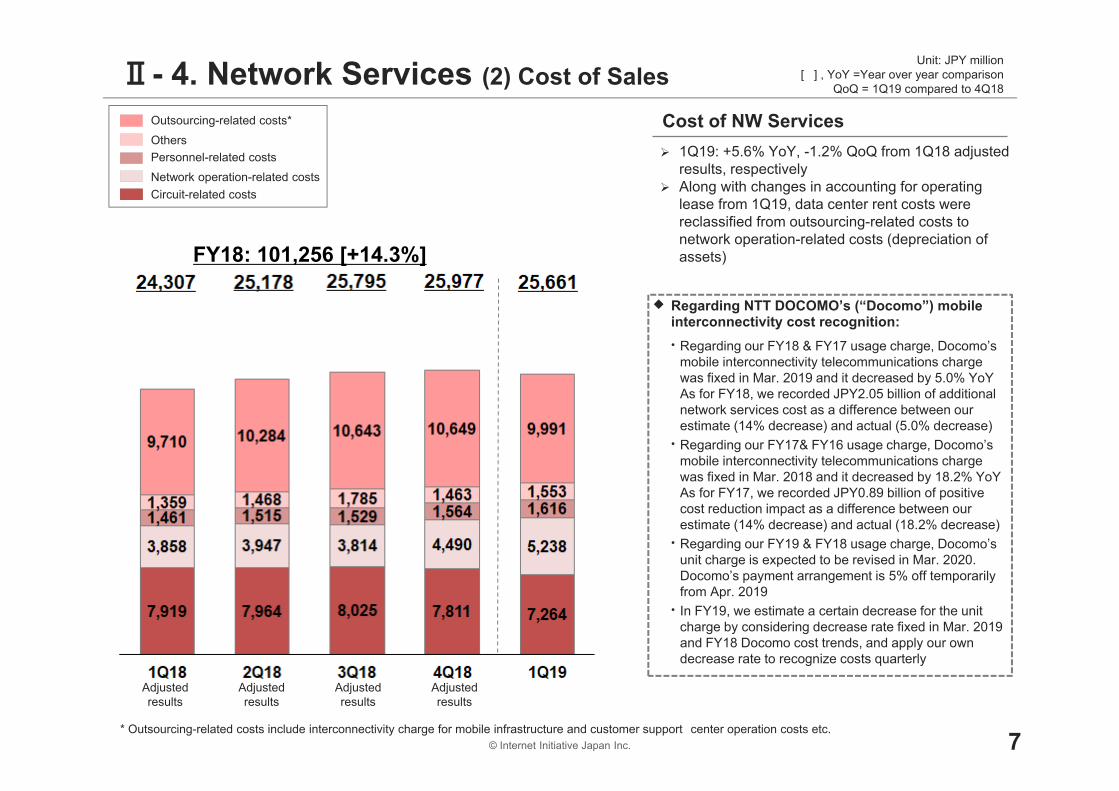
Ⅱ- 4. Network Services (2) Cost of SalesUnit: JPY million
[ ] , YoY =Year over year comparisonQoQ = 1Q19 compared to 4Q18
FY18: 101,256 [+14.3%]
OthersOutsourcing-related costs*
Personnel-related costsNetwork operation-related costsCircuit-related costs
Cost of NW Services 1Q19: +5.6% YoY, -1.2% QoQ from 1Q18 adjusted
results, respectively Along with changes in accounting for operating
lease from 1Q19, data center rent costs were reclassified from outsourcing-related costs to network operation-related costs (depreciation of assets)
Regarding NTT DOCOMO’s (“Docomo”) mobile interconnectivity cost recognition:• Regarding our FY18 & FY17 usage charge, Docomo’s
mobile interconnectivity telecommunications charge was fixed in Mar. 2019 and it decreased by 5.0% YoYAs for FY18, we recorded JPY2.05 billion of additional network services cost as a difference between our estimate (14% decrease) and actual (5.0% decrease)
• Regarding our FY17& FY16 usage charge, Docomo’s mobile interconnectivity telecommunications charge was fixed in Mar. 2018 and it decreased by 18.2% YoYAs for FY17, we recorded JPY0.89 billion of positive cost reduction impact as a difference between our estimate (14% decrease) and actual (18.2% decrease)
• Regarding our FY19 & FY18 usage charge, Docomo’s unit charge is expected to be revised in Mar. 2020. Docomo’s payment arrangement is 5% off temporarilyfrom Apr. 2019
• In FY19, we estimate a certain decrease for the unit charge by considering decrease rate fixed in Mar. 2019 and FY18 Docomo cost trends, and apply our own decrease rate to recognize costs quarterly
* Outsourcing-related costs include interconnectivity charge for mobile infrastructure and customer support center operation costs etc. 7
Adjustedresults
Adjustedresults
Adjustedresults
Adjustedresults
© Internet Initiative Japan Inc.
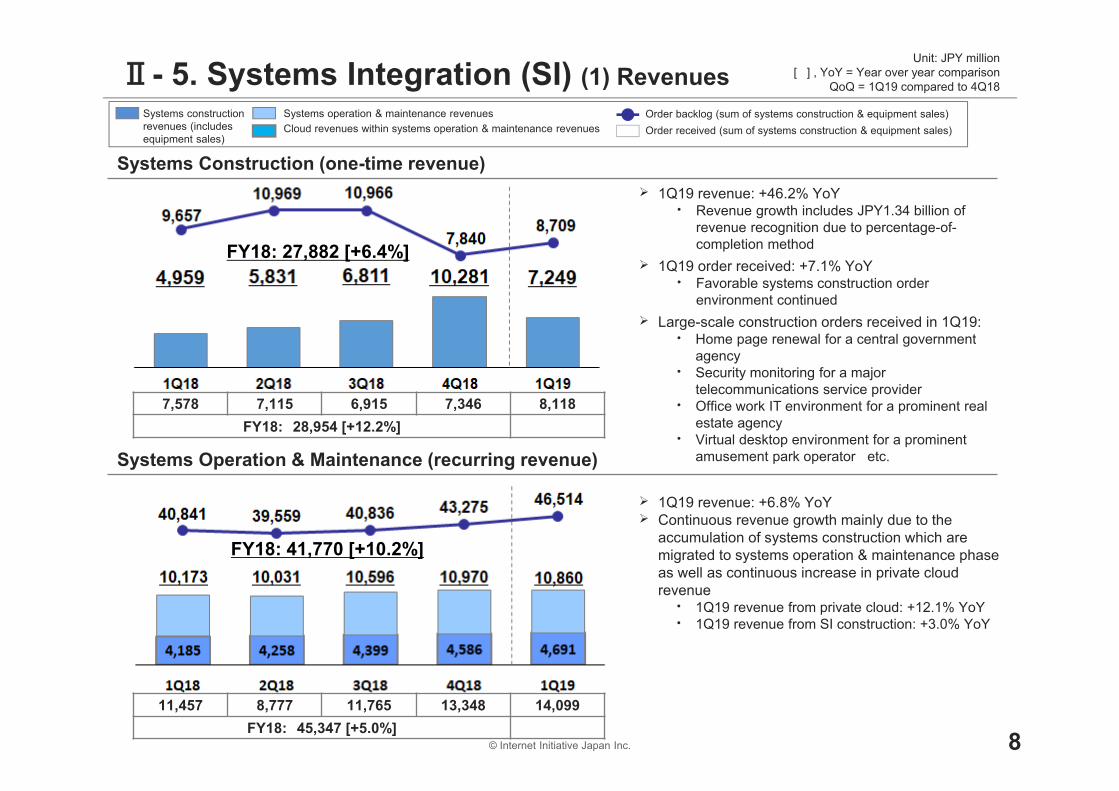
Ⅱ- 5. Systems Integration (SI) (1) RevenuesUnit: JPY million
[ ] , YoY = Year over year comparisonQoQ = 1Q19 compared to 4Q18
Systems constructionrevenues (includes equipment sales)
Order backlog (sum of systems construction & equipment sales)Order received (sum of systems construction & equipment sales)
Systems operation & maintenance revenuesCloud revenues within systems operation & maintenance revenues
Systems Operation & Maintenance (recurring revenue)
Systems Construction (one-time revenue) 1Q19 revenue: +46.2% YoY
• Revenue growth includes JPY1.34 billion ofrevenue recognition due to percentage-of-completion method
1Q19 order received: +7.1% YoY• Favorable systems construction order
environment continued Large-scale construction orders received in 1Q19:
• Home page renewal for a central government agency
• Security monitoring for a major telecommunications service provider
• Office work IT environment for a prominent real estate agency
• Virtual desktop environment for a prominent amusement park operator etc.
1Q19 revenue: +6.8% YoY Continuous revenue growth mainly due to the
accumulation of systems construction which are migrated to systems operation & maintenance phase as well as continuous increase in private cloud revenue
• 1Q19 revenue from private cloud: +12.1% YoY• 1Q19 revenue from SI construction: +3.0% YoY
8
7,578 7,115 6,915 7,346 8,118FY18: 28,954 [+12.2%]
FY18: 27,882 [+6.4%]
11,457 8,777 11,765 13,348 14,099FY18: 45,347 [+5.0%]
FY18: 41,770 [+10.2%]

© Internet Initiative Japan Inc.
Ⅱ- 5. Systems Integration (SI) (2) Cost of Sales Unit: JPY million
Others
Purchasing costs
Outsourcing-related costs*
Personnel-related costs
Network operation-related costs
[ ] , YoY = Year over year comparisonQoQ = 1Q19 compared to 4Q18
*Outsourcing-related costs include SI project-related outsourcing personnel costs
1Q19: +19.3% YoY• 1Q19-end number of SI-related
outsourcing personnel: 1,075 personnel(increased by 36 personnel YoY, decreased by 27 personnel QoQ)
• SI-related outsourcing personnel and costs decreased QoQ. Outsourcing-related and personnel-related costs tend to increase along with increase in projects
System engineers productivity rate continue to be stable, following the trend of gross profit improvement in FY18
Along with changes in accounting for operating lease from 1Q19, a portion of systems operation and maintenance costs such as outsourcing were reclassified from outsourcing-related costs to network operation-related costs (depreciation of assets)
Cost of SI
9
FY18: 59,872 [+5.1%]
© Internet Initiative Japan Inc.
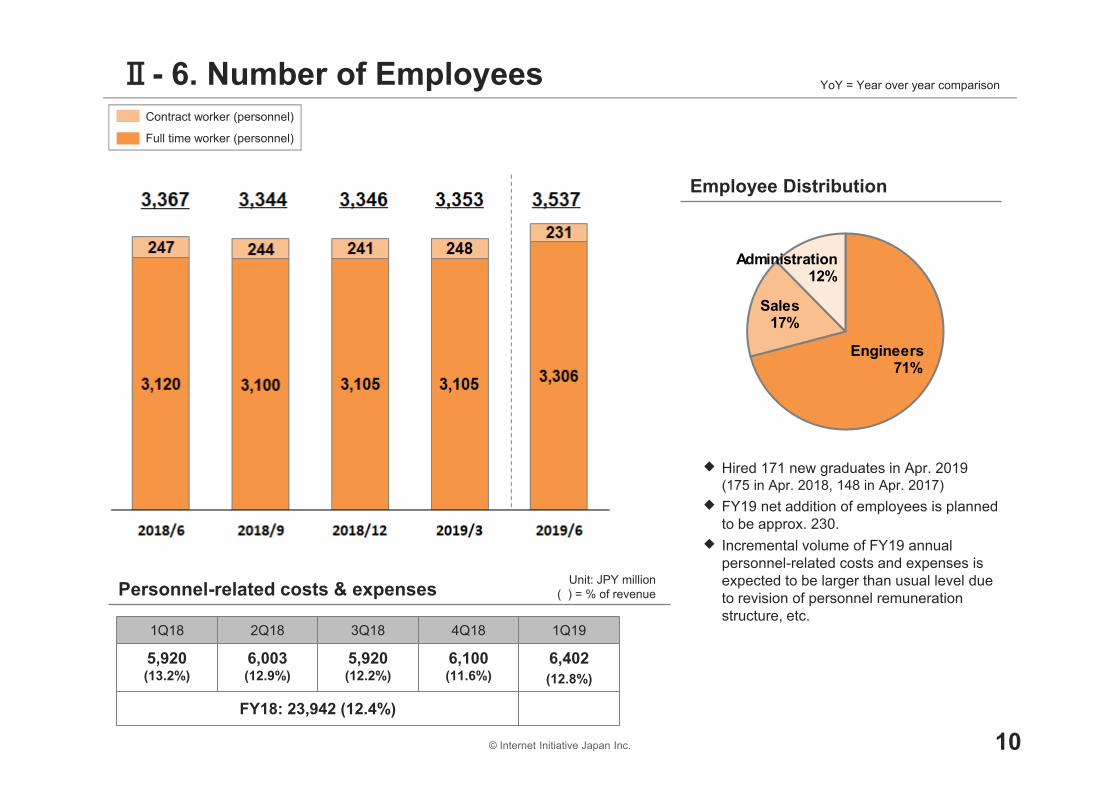
Personnel-related costs & expenses
Ⅱ- 6. Number of Employees YoY = Year over year comparison
Contract worker (personnel)
Full time worker (personnel)
Employee Distribution
Unit: JPY million( ) = % of revenue
Hired 171 new graduates in Apr. 2019(175 in Apr. 2018, 148 in Apr. 2017)
FY19 net addition of employees is planned to be approx. 230.
Incremental volume of FY19 annual personnel-related costs and expenses is expected to be larger than usual level due to revision of personnel remuneration structure, etc.
10
1Q18 2Q18 3Q18 4Q18 1Q19
5,920(13.2%)
6,003(12.9%)
5,920(12.2%)
6,100(11.6%)
6,402(12.8%)
FY18: 23,942 (12.4%)
Engineers71%
Sales17%
Administration12%

© Internet Initiative Japan Inc.
Ⅱ- 7. SG&A etc. Unit: JPY million[ ] , YoY = Year over year comparison
Commission expenses
Research & development expenses
% of total revenues 1Q19 commission expenses
+JPY172 million YoY Commission expenses such as for
mobile services increased 1Q19 others +JPY222 million YoY Advertising expenses increased +72
million YoY 1Q19 personnel expenses +JPY142
million YoY
SG&A etc.
11
FY18: 22,652 [+5.5%]
( )
Others
Personnel expenses
(12.3%) (11.8%) (11.6%) (11.5%) (12.1%)

© Internet Initiative Japan Inc.
Profit before tax 1Q19: JPY1,369 million
(+45.2% from 1Q18 adjusted results)• Dividend income: JPY61 million• Interest expense: JPY126 million• Share of loss of investments on DeCurret
accounted for using equity method: JPY337 million DeCurret’s plan: FY19: loss of JPY0.7
billion, FY20: equity in net gain will be expected
• Gains on changes in equity of JPY374 million arisen from the issuance of common stock of DeCurret
Profit for the period attributable to owners of the parent 1Q19: +42.9% from 1Q18 adjusted results
• Profit for the period attributable to non-controlling interests: JPY49 million
Ⅱ- 8. ProfitOperating profit Operating profit ratio
Profit
103 65 (46) 16 (124) Finance income (expense), net
(30) 6 (43) (252) 112 Share of profit (loss) of investments accounted for using equity method
(511) (738) (716) (179) (543) Income tax expense
(40) (45) (45) (47) (49) Less: Profit for the period attributable to non-controlling interests
FY18 Operating profit: 6,023 FY18 Profit for the year attributable to owners of the parent: 3,521
Profit for the period attributable to owners of the parent
Unit: JPY million
12
Adjusted results Adjusted results Adjusted results Adjusted results

© Internet Initiative Japan Inc.
Mar. 31, 2019 June 30, 2019 ChangesCash and cash equivalents 31,958 32,893 +935Trade receivables 33,376 31,264 (2,112)Inventories 3,403 1,836 (1,568)Prepaid expenses (current and non-current) 16,560 20,230 +3,670Tangible assets 33,136 18,855 (14,281)Right-of-use assets - 51,880 +51,880Goodwill and intangible assets 24,901 24,027 (875)Investments accounted for using the equity method 4,838 5,331 +494Other investments 11,402 9,691 (1,711)Others 7,715 8,384 +669
Total assets: 167,289 204,390 +37,101Trade and other payables 21,962 17,531 (4,431)Borrowings (current and non-current) 26,750 29,000 +2,250Deferred income (current and non-current) 10,980 11,716 +735Income taxes payable 1,139 1,130 (10)Retirement benefit liabilities 3,489 3,532 +44Other financial liabilities (current and non-current) 19,183 57,332 +38,149Others 6,666 6,327 (339)
Total liabilities: 90,170 126,567 +36,398Share capital 25,519 25,519 -Share premium 36,226 36,240 +14Retained earnings 12,335 14,075 +1,740Other components of equity 4,089 3,043 (1,046)Treasury shares (1,897) (1,897) -
Total equity attributable to owners of the parent: 76,271 76,979 +708
Ⅱ- 9. Consolidated Statements of Financial Position (Summary)Unit: JPY million
13
Note 1
Note 2
Note 3
Note1: Breakdown of right-of-use assets as of June 30, 2019: JPY36,589 million for operating leases (office rent contracts etc.), JPY15,291 million for finance lease (transferred from tangible and intangible assets)
Note 2: Details of other financial liabilities as of June 30, 2019: JPY36,623 million for operating lease (office rent contracts etc.)Note 3: Ratio of total equity attributable to owners of the parent: 45.6% as of March 31, 2019 37.7% as of June 30, 2019* Along with the adoption of IFRS 16, certain operating lease related assets and liabilities are recognized on Statements of Financial Position

© Internet Initiative Japan Inc.
Ⅱ- 10. Consolidated Cash Flows Unit: JPY millionYoY = Year over year comparison
Operating Activities
Investing Activities
Financing Activities
MajorBreakdown
YoY Change
Profit before tax 1,369 -56
Depreciation and amortization 7,164 +3,555
(related to right-of use assets under operating lease contracts 3,127 +3,127)
Changes in operating assets and liabilities -2,057 -5,646
MajorBreakdown
YoY Change
Purchase of tangible assets -2,947 -1,376
Purchase of intangible assets such as software -1,650 -87
Proceeds from sales of equity securities 2,650 +2,650
MajorBreakdown
YoY Change
Payments of other financial liabilities -5,158 -3,461
(related to operating lease -3,142 -3,142)
(related to finance lease -1,766 -246)
Proceeds from short-term borrowings 3,000 +3,000
FY18: 25,152
14
FY18: (8,688)
FY18: (5,890)

© Internet Initiative Japan Inc.
Ⅱ- 11. Other Financial Data Unit: JPY million
Finance leaseCash CAPEX
CAPEX CAPEX-related depreciation and amortization*
Adjusted EBITDA*
15
FY18: 15,083 FY18: 13,867
FY18: 19,890
*Adjusted EBITDA is calculated by adding adjusted operating profit and CAPEX-related depreciation and amortization.
* CAPEX-related depreciation and amortization is calculated by excluding depreciation and amortization of assets that do not have the nature of capital investment, such as right-of-use assets related to operating leases, small-amount equipment and customer relationship.

© Internet Initiative Japan Inc.
Mobile revenue & subscription
Ⅲ - 1. KPIs of Services
Cloud-related revenue & Customer Base
Revenue unit: JPY billion% = Year over year comparison
1,690360
1,7601,600330
As of Jun. 2019As of Jun. 2018As of Jun. 2017
380
210 240230
MRR over JPY0.5 millionMRR over JPY1.0 million
Total number of customer
MRR=Monthly Recurring Revenue
IIJmio Mobile
IIJ Mobile
Subscriptions(unit: thousand):
MVNE
Revenue (unit: JPY billion) :
IIJmio Mobile
IIJ Mobile
< >
FY18: 20.13(+12.2%)
Security-related revenue
FY18: 14.11(+16.9%)
MVNE< >
1Q19-end total subscriptions: 2,786 thousand (+14.0%) 1Q19 total revenue: JPY11.34 billion (+14.2%) Full-MVNO: JPY0.34 billion (+49.9% from 4Q18)
1Q19 IIJ Raptor revenue:IIJ Raptor JPY0.78 billion (+JPY0.12 billion from 4Q18)
1Q19 revenue recognition: 87.6% SI operation &
maintenance, 12.4% outsourcing
FY2019 revenue target: JPY22.5 billion
Each services such as SOC, DDoS Protection, Cloud-based Web security, and Cloud-based ID management grew
Security services revenues are recognized in outsourcing services revenue
IIJ Mobile: enterpriseIIJmio Mobile: consumer
16

© Internet Initiative Japan Inc.
Ⅲ - 2. Recent Business Developments
Raised Capital: Enterprise Shareholders Increased to 30
First in Japan to launch eSIM services
Full-MVNO Services adopted by Motorola Solutions
Apr.
“IIJ Flex Mobility Service” adopted by Dai Nippon Printing
Completed the construction of Shiroi Data Center Campus
Jul.
WOWOW became a shareholder
Added Google Cloud PlatformTM as a new multi cloud connecting point
Launched SoftSIM, adopted by WABCO Japan
DeCurret
Full-MVNO/IoT
Cloud
JOCDN
Data Center
NW Services
Full-MVNO/IoT
Full-MVNO/IoT
Started PoC of Public LTE & Private LTE integrated Full-MVNO/IoT
(Largest shareholder IIJ with 30% ownership)
May
Jun.
(Largest shareholder IIJ: ownership 19%)
17

© Internet Initiative Japan Inc.
% of Revenues % of Revenues % of Revenues
1Q19 Results 1H19 Targets Compared to 1H18Adjusted Results FY19 Targets YoY
Apr. 2019 - Jun. 2019 Apr. 2019 - Sep. 2019 [Compared to 1H18 Results] Apr. 2019 - Mar. 2020
85.2% 85.5% 84.6%
42.4 83.5 +7.1% 172.6 +5.6%[+8.5%]
14.8% 14.5% 15.4%
7.4 14.2 +7.1% 31.4 +8.4%[-0.3%]
12.0% 12.3% 12.0%
6.0 12.0 +9.5% 24.4 +6.3%2.8% 2.3% 3.4%
1.4 2.2 -4.3% 7.0 +16.2%[-33.0%]
0.1 (0.7) - (0.6) -2.7% 1.5% 3.1%
1.4 1.5 -38.6% 6.3 +7.8%[-56.3%]
1.6% 0.6% 1.7%
0.8 0.6 -57.8% 3.5 -0.6%[-71.4%]
Net Profit
Cost of Sales
Gross Profit
SG&A etc.
Operating Profit
Shares of profit (loss) ofinvestments accounted for
using equity method
Profit before tax
Total Revenues 49.8 97.7 +7.1% 204.0 +6.0%
Ⅲ - 3. Financial Targets (remain unchanged) Unit: JPY billionYoY = Year over year comparison
(*1) SG&A etc. shows the sum of SG&A, which includes R&D expenses, and other income/expenses.(*2) Net Profit is “Profit for the year (period) attributable to owners of the parent.”
18
(*1)
(*2)

DisclaimerStatements made in this presentation regarding IIJ’s or managements’ intentions, beliefs, expectations, or predictions for the future are forward-looking statements that are based on IIJ’s and managements’ current expectations, assumptions, estimates and projections about its business and the industry. These forward-looking statements, such as statements regarding revenues, operating and net profitability are subject to various risks, uncertainties and other factors that could cause IIJ’s actual results to differ materially from those contained in any forward-looking statement.