Consolidated Financial Results income rose 35.6 billion yen, or 38% year-on-year, to 129.5 billion...
36
- 1 - Translation April 24, 2014 Consolidated Financial Results for FY 2013 Full Year (April 1, 2013 through March 31, 2014) [Japan GAAP] Company name: Mitsubishi Motors Corporation Listing: First Section, the Tokyo Stock Exchange Stock code: 7211 URL: http://www.mitsubishi-motors.co.jp/ Representative: Osamu Masuko, President Contact: Yoshihiro Kuroi, Senior Executive Officer, Corporate General Manager of Corporate Planning Office TEL: +81-3-6852-4206 (from overseas) Scheduled date for ordinary general shareholders’ meeting: June 25, 2014 Scheduled date to file Securities Report: June 25, 2014 Scheduled date to deliver cash dividends: June 26, 2014 1. Consolidated performance for the Full Year 2013 (April 1, 2013 to March 31, 2014) (Figures less than one million yen are rounded, unless otherwise noted) (1) Consolidated operating results (Percentages indicate year-on-year changes.) Net sales Operating income Ordinary income Net income Millions of yen % Millions of yen % Millions of yen % Millions of yen % FY 2013 2,093,409 15.3 123,434 83.2 129,472 37.9 104,664 175.6 FY 2012 1,815,113 0.4 67,382 5.8 93,903 54.2 37,978 58.7 Reference: Comprehensive income FY 2013: ¥ 121,808 million (37.7%) FY2012: ¥ 88,459 million (330.3%) Net income per share-basic Net income per share-diluted Return on equity Ratio of ordinary income to total assets Ratio of operating income to sales Yen Yen % % % FY 2013 156.60 104.29 23.8 8.6 5.9 FY 2012 66.05 37.09 12.7 6.8 3.7 Note: Equity income from affiliates: FY 2013 FY 2012 ¥7,373 million ¥4,853 million Note: Ten shares of common stock were consolidated into one share on August 1, 2013. Net income per share were calculated as if the consolidation of shares had been carried out on the beginning of the year ended March 31, 2013. (2) Consolidated financial position Total assets Net assets Equity ratio Net assets per share As of Millions of yen Millions of yen % Yen March 31, 2014 1,543,890 550,009 35.0 549.63 March 31, 2013 1,452,809 351,227 23.4 (92.12) Reference: Shareholders’ Equity As of March 31, 2014: ¥ 540,532 million As of March 31, 2013: ¥ 340,197 million Note: Ten shares of common stock were consolidated into one share on August 1, 2013. Net assets per share were calculated as if the consolidation of shares had been carried out on the beginning of the year ended March 31, 2013.
Transcript of Consolidated Financial Results income rose 35.6 billion yen, or 38% year-on-year, to 129.5 billion...

- 1 -
Translation
April 24, 2014
Consolidated Financial Results for FY 2013 Full Year (April 1, 2013 through March 31, 2014) [Japan GAAP]
Company name: Mitsubishi Motors Corporation Listing: First Section, the Tokyo Stock Exchange Stock code: 7211 URL: http://www.mitsubishi-motors.co.jp/ Representative: Osamu Masuko, President Contact: Yoshihiro Kuroi, Senior Executive Officer, Corporate General Manager of Corporate Planning Office TEL: +81-3-6852-4206 (from overseas) Scheduled date for ordinary general shareholders’ meeting: June 25, 2014 Scheduled date to file Securities Report: June 25, 2014 Scheduled date to deliver cash dividends: June 26, 2014 1. Consolidated performance for the Full Year 2013 (April 1, 2013 to March 31, 2014)
(Figures less than one million yen are rounded, unless otherwise noted)
(1) Consolidated operating results (Percentages indicate year-on-year changes.)
Net sales Operating income Ordinary income Net income
Millions of yen % Millions of yen % Millions of yen % Millions of yen %
FY 2013 2,093,409 15.3 123,434 83.2 129,472 37.9 104,664 175.6
FY 2012 1,815,113 0.4 67,382 5.8 93,903 54.2 37,978 58.7
Reference: Comprehensive income FY 2013: ¥ 121,808 million (37.7%) FY2012: ¥ 88,459 million (330.3%)
Net income
per share-basic
Net income
per share-diluted Return on equity
Ratio of ordinary income to total assets
Ratio of operating income to sales
Yen Yen % % %
FY 2013 156.60 104.29 23.8 8.6 5.9
FY 2012 66.05 37.09 12.7 6.8 3.7
Note: Equity income from affiliates: FY 2013 FY 2012
¥7,373 million ¥4,853 million Note: Ten shares of common stock were consolidated into one share on August 1, 2013. Net income per share were calculated as if the consolidation of shares had been carried out on the beginning of the year ended March 31, 2013. (2) Consolidated financial position
Total assets Net assets Equity ratio Net assets per share
As of Millions of yen Millions of yen % Yen
March 31, 2014 1,543,890 550,009 35.0 549.63
March 31, 2013 1,452,809 351,227 23.4 (92.12)
Reference: Shareholders’ Equity As of March 31, 2014: ¥ 540,532 million As of March 31, 2013: ¥ 340,197 million
Note: Ten shares of common stock were consolidated into one share on August 1, 2013. Net assets per share were calculated as if the consolidation of shares had been carried out on the beginning of the year ended March 31, 2013.

- 2 -
(3) Consolidated cash flows
Cash flows from operating activities
Cash flows from Investing activities
Cash flows from financing activities
Cash & cash equivalents at end of period
Millions of Yen Millions of Yen Millions of Yen Millions of Yen
FY2013 210,443 (81,352) (82,083) 411,695
FY2012 172,227 (114,327) (8,310) 361,167
2. Cash dividends
Cash dividend per share Total annual
cash dividends
Dividend payout ratio
(Consolidated)
Ratio of dividends to net assets
(Consolidated)
Record Date
First quarter
Second quarter
Third quarter
Fiscal year end
Annual
Yen Yen Yen Yen Yen Millions of Yen % %
FY2012 — 0.00 — 0.00 0.00 0 0.0 —
FY2013 — 0.00 — 25.00 25.00 24,586 16.0 10.9
FY2014 (Forecast) — 7.50 — 7.50 15.00 13.4
Note: The amount of the year-end dividend for FY2013 (ended March 31, 2014) includes an extraordinary dividend of 10 yen.
3. Consolidated earnings forecasts for fiscal year 2014 (from April 1, 2014 to March 31, 2015) (Percentages indicate changes over the same period in the previous fiscal year.)
Net sales Operating income Ordinary income Net income Net income per share
Millions of yen % Millions of yen % Millions of yen % Millions of yen % Yen
FY2014 2nd quarter 1,090,000 17.3 55,000 8.2 56,000 (8.2) 43,000 (8.0) 43.72
Full year 2,300,000 9.9 135,000 9.4 138,000 6.6 110,000 5.1 111.85
Note (1) Changes in significant subsidiaries during the period (changes in specified subsidiaries resulting in the change in
scope of consolidation): No (2) Changes in accounting policies, changes in accounting estimates, and restatement
(i) Changes in accounting policies due to revisions to accounting standards: Yes (ii) Changes in accounting policies due to other reasons: No (iii) Changes in accounting estimates: No (iv) Restatement: No
(3) Number of shares issued and outstanding (common stocks)
(i) Total number of shares issued and outstanding at the end of the fiscal year (including treasury stock) As of March 31, 2014: 983,661,919 shares As of March 31, 2013: 608,090,053 shares
(ii) Number of shares of treasury stock at the end of the period As of March 31, 2014: 221,383 shares As of March 31, 2013: 219,595 shares
(iii) Average number of shares during the period (cumulative from the beginning of the fiscal year) As of March 31, 2014: 668,367,915 shares As of March 31, 2013: 574,989,838 shares
Note: Ten shares of common stock were consolidated into one share on August 1, 2013. The total number of issued shares and outstanding (including treasury stock), the number of shares of treasury stock and the average number of shares of the previous period were calculated as if the consolidation of shares had been carried out on the beginning of the year ended March 31, 2013.

- 3 -
Reference: Summary of Non-consolidated Results
Financial highlights (April 1, 2013 through March 31, 2014) (1) Non-consolidated operating results (Percentages indicate changes over same period in the previous fiscal year.)
Net sales Operating income Ordinary income Net income
Millions of Yen % Millions of Yen % Millions of Yen % Millions of Yen %
FY2013 1,671,622 20.8 56,705 283.9 102,831 36.6 93,641 142.0 FY2012 1,383,389 (3.1) 14,771 (2.4) 75,290 283.3 38,696 84.9
Net income
per share-basic
Net income
per share-diluted
Yen Yen
FY2013 140.11 93.31
FY2012 67.30 37.80
(2) Non-consolidated financial position
Total assets Net assets Equity ratio Net assets
per share– basic As of Millions of Yen Millions of Yen % Yen
March 31, 2014 1,035,396 349,699 33.8 355.59
March 31, 2013 982,418 170,789 17.4 (370.81)
Note: Shareholders’ equity: FY2013 FY2012
¥ 349,699 million ¥ 170,789 million * Annual audit procedures: As of when this summary of financial results have been released as flash report, we have not completed the audit for Securities Report required in accordance with the Financial Instruments and Exchange Act. * Proper use of earnings forecasts, and other special matters: (Note for the description about financial forecast)
Figures for financial forecasts are based on judgments and estimates that have been made on the basis of currently available information, and are subject to a number of risks, uncertainties and assumptions. Changes in the MMC group's business environment, market trends or exchange rates may cause actual results to differ materially from these forecasts for FY2014.
(How to obtain Additional Information Material / Details of the Financial Results Briefing) Additional Information Material is disclosed on the official MMC web site on the same day as publication of the results. In addition, an audio recording of the Financial Results Briefing held on the same day will, together with the material used for the briefing, be posted on the official MMC website immediately quickly following the briefing.

- 4 -
1. Operating and Financial Results
1.1 Analysis of operating results
Overview of consolidated results for the term
The operating environment for the automobile industry during fiscal 2013 continued to be marked by destabilizing factors. There were some indications that the recovery in the global economy was gaining strength, these including the economic recovery in the United States, the bottoming out of economic troubles in the Eurozone and the correction in the high value of the yen as a result of the Bank of Japan's fiscal easing policy. But the operating environment was negatively impacted by upheavals in emerging market economies due to the scale-back in the United States’ qualitative easing policy, by a slowing down in the growth of the Chinese economy, by political and economic confusion in some emerging nations and by geopolitical risks which now include the tensions in the Ukraine.
Fiscal 2013 marked the final year of the company’s JUMP 2013 mid-term business plan and during the year Mitsubishi Motors focused its efforts on emerging markets, environmental initiatives and raising profit levels in order to achieve the plan’s fundamental goal of “growth and a leap forward.”
Operating within this environment, the Mitsubishi Motors Group posted cumulative consolidated results for the full 2013 fiscal year which set record profits in all profit indicators, as follows: Net sales increased 278.3 billion yen, or 15% year-on-year, to 2,093.4 billion yen. Operating income rose 56.0 billion yen, or 83% year-on-year, to 123.4 billion yen, as a result of favorable foreign exchange rates as well as solid progress made in continuing reduction of material and other costs, despite increases in sales and R&D costs. Ordinary income rose 35.6 billion yen, or 38% year-on-year, to 129.5 billion yen. Net income increased 66.7 billion yen, or 176% year-on-year, to 104.7 billion yen.
Global retail sales volume for the full 2013 fiscal year totaled 1,047,000 units, an increase of 6% or 60,000 units over the same period in FY2012. Sales volumes by region were as follows.
In Japan, MMC posted a sales volume of 143,000 units, a year-on-year increase of 7% or 9,000 units. A fall in registered car sales over the same period last year was more than countered by firm sales of the eK Wagon and eK Custom minicar models launched in June 2013 and of the eK Space minicar model launched in February 2014. In North America, MMC posted a sales volume of 97,000 units, an increase of 14% or 12,000 units over the same period last year. The increase was driven by the launch of new Outlander SUV and new Mirage models. In Europe, MMC posted a sales volume of 202,000 units, an increase of 11% or 21,000 units over the same period last year. The increase was driven by the launch of the Outlander PHEV and other new models. In Asia, MMC posted a sales volume across the region of 344,000 units, a decrease of 4% or 13,000 units over the same period last year. Sales volume decreased in Thailand as a result of sluggish demand stemming from the ending of the Thai government's First Buyer Program in December 2012 and confusion in the political situation. This drop was partly countered by a major growth in sales in China, and especially at GAC Mitsubishi Motors, as well as by record-setting sales volume in Indonesia and the Philippines. In Other regions, MMC posted a sales volume of 261,000 units, an increase of 14% or 31,000 units. The increase was due to sales volume in Australia, New Zealand, Latin America and the Middle East & Africa all exceeding the figures for fiscal 2012.
Notes:
(1) The sales figures above are reported by geographical segment, which is based on an administrative classification
created by MMC.
(2) The unit sales, net sales and operating income reported below are supplemental information for the “Consolidated
Financial Tables: Segment information”. Specifically, results for MMC and affiliated companies in Japan, as well as
- 5 -
results for MMC Group-affiliated companies outside of Japan will be outlined.
Results by business sector were as follows: (1) Automobile business
In the automotive business sector, for the year ended March 31, 2014 net sales totaled 2,081.2 billion yen, up 276.1 billion yen or 15% over the previous fiscal year. Operating profit of 121.9 billion yen was up 56.9 billion yen over fiscal 2012.
(2) Automobile financing business
In the automobile financing business sector, for the year ended March 31, 2014 net sales totaled 12.2 billion yen, up 2.1 billion yen or 21% over the previous fiscal year. Operating profit of 1.5 billion yen was down 0.9 billion yen over fiscal 2012.
Results by region were as follows: (1) Japan
Net sales totaled 1,744.4 billion yen, an increase of 299.8 billion yen or 21% over fiscal 2012 due to higher unit sales. Operating income came in at 68.4 billion yen, an increase of 59.1 billion yen or 639% over fiscal 2012 due to the correction in the high value of the Japanese yen and to the positive results of cost reductions. (Higher revenue and profit)
(2) North America
Net sales totaled 267.3 billion yen, an increase of 92.2 billion yen or 53% over fiscal 2012 driven mainly by higher unit sales and the correction in the high value of the Japanese yen. Operating income came in at 2.7 billion yen (higher revenue and a positive turnaround in operating profit).
(3) Europe
Net sales came in at 128.7 billion yen, an increase of 7.9 billion yen or 7%, over fiscal 2012 mainly due to the correction in the high value of the Japanese yen and to increased unit sales of higher-priced models. Operating income, however, came in at 8.2 billion yen, down 3.1 billion yen or 27% on fiscal 2012 due to an increase in costs and other factors (higher revenue, lower profit).
(4) Asia & Other
Net sales came in at 856.2 billion yen, an increase of 5.5 billion yen or 1% over fiscal 2012 driven mainly by higher unit sales in the ASEAN region. Operating income, however, came in at 48.0 billion yen, down 7.7 billion yen or 14% on fiscal 2012 due to higher sales costs and a drop in unit sales of high-margin models (higher revenue, lower profit).
FY2014 forecast summary
The consolidated earnings forecast for fiscal 2014 (ending March 31, 2015) at the current time is as follows:
FY2014 2Q Consolidated FY 2014 Full-year Net Sales 1,090.0 billion yen 2,300.0 billion yen Operating income 55.0 billion yen 135.0 billion yen Ordinary income 56.0 billion yen 138.0 billion yen Net income 43.0 billion yen 110. billion yen
* Assumed currency exchange rates: 100 yen / 1 USD; 138 yen / 1 EUR; 90 yen / 1 AUD; 3.28 yen/1THB Forecasts for consolidated retail sales volume are as follows: (1,000 units; reference only) Region FY 2014 Forecast FY 2013 Results
Japan 147 143 North America 109 97

- 6 -
Europe 225 202 Asia 431 344 Others 270 261
Total 1,182 1,047 *These forecasts are based on judgments and estimates that have been made on the basis of currently available information, and are subject to a number of risks, uncertainties and assumptions. Changes in MMC's business environment, market trends or exchange rates may cause actual results to differ materially from these forecasts for FY2014 Progress of mid-term business plan
On November 6, 2013 the company announced a new mid-term business plan titled "New Stage 2016" covering the three years from fiscal 2014 through fiscal 2016. New Stage 2016 lays out the following five policies for making the company more competitive so that it can put the MMC Group on a solid path to growth (for details see Section 3. Management Policies (4) Issues facing the Company):
Growing revenues by launching strategic models
Enhancing the MMC brand and identity
Reinforcing MMC’s production base in ASEAN countries,
Establishing an SUV brand with a strong foothold in emerging markets
Making effective use of resources through business partnerships

- 7 -
1.2 Financial standing Analysis of assets, debt, net assets and cash flows
Assets at the end of the period totaled 1,543.9 billion yen, an increase of 91.1 billion yen over the end of fiscal 2012. Liabilities totaled 993.9 billion yen, a reduction of 107.7 billion yen compared to the end of fiscal 2012. Net assets totaled 550.0 billion yen, an increase of 198.8 billion yen over the figure for the end of fiscal 2012.
Cash flows from operating activities came to a net inflow of 210.4 billion yen. This compared to a net inflow of 172.2 billion yen in fiscal 2012.
Cash flows from investing activities came to a net outflow of 81.4 billion yen, due to disbursements related to the acquisition of tangible fixed assets. This compared to a net outflow of 114.3 billion yen in fiscal 2012. Cash flows from financing activities came to a net outflow of 82.1 billion yen due to disbursements related to repayments of long-term borrowings. This compared to a net outflow of 8.3 billion yen in fiscal 2012. As a result, the balance of cash and cash equivalents at the end of fiscal 2013 stood at 411.7 billion yen. This compared to a balance of 361.2 billion yen at the end of fiscal 2012. Trends in key cash flow ratios
Definitions:
Ratio of shareholders’ equity: Shareholders’ equity / total assets (excluding minority interest) Ratio of market value to assets: Total market value of shares / total assets (excluding minority interest) Debt repayment coverage: Interest bearing liabilities / cash flow from operating activities Interest coverage ratio: Cash flows from operating activities / interest payments
- All figures are calculated based on consolidated financial data.
- Total market value of shares is the closing market share price at the end of the period multiplied by the number of outstanding shares (excluding treasury shares) at the end of the period.
- Operating cash flows used.
- Interest bearing liabilities indicate all liabilities listed on the consolidated balance sheet for which interest is paid.
FY2008
Full-year
FY2009
Full-year
FY2010
Full-year
FY2011
Full-year
FY2012
Full-year
FY2013
Full-year
Ratio of shareholders’ equity (%) 18.8 17.8 18.2 19.5 23.4 35.0
Ratio of market value to assets (%) 60.8 55.9 43.0 39.4 41.0 68.8
Debt repayment coverage (years) - 3.9 3.8 2.9 2.1 1.1
Interest coverage ratio - 7.4 7.9 8.5 15.9 22.3

- 8 -
1.3 Dividend policy and dividends for the term ended March 31, 2014
MMC considers the return of profits to shareholders to be one of the most important goals of management. The increasing intensity of competition in the global auto industry and the need to develop more advanced environmental technologies today mean that demand on corporate funds is high. It is a basic company policy to regularly divide the fruits of its operations among its shareholders after taking the state of earnings and cash flows into account.
MMC forecast that the amount of the year-end dividend is to be 25 yen, which is the total of an
ordinary dividend of 15 yen per share and an extraordinary dividend of 10 yen per share in light of factors such the
cleanup of shares of preferred stock and the state of full-year operating results.
The payment of the year-end dividend is to be confirmed through a resolution at the General Shareholders’ Meeting.
For the term ending March 2015, the company plans to pay an ordinary dividend of 15 Yen, the same as this term, split
into an interim dividend of 7.5 Yen and a year-end dividend of 7.5 Yen. 1.4 Business-related risks Risks that may seriously impact the operating results and/or financial standing of the MMC Group are outlined below. Country risk
Overseas sales accounted for around 80 percent of the MMC Group’s consolidated net sales for the period. Changes in the economic, political or social situation in Japan or in the regions and countries MMC trades with, and in particular the countries of ASEAN and other emerging nations which will be central to the company’s regional strategy, may seriously impact the MMC Group’s operating results and/or financial standing.
In addition, conducting business operations in overseas markets exposes the company to latent risks including, but not limited to, changes in laws and taxes, changes in the political and economic situation, deficiencies in infrastructure, difficulties in acquiring skilled personnel, acts of terrorism and other emergencies and the outbreak of epidemics. In the event risks such as these start to manifest themselves, they may seriously impact the operating results and/or financial standing of the MMC Group. Intensifying competition
Overcapacity in the auto industry and other factors are seeing an intensification of competition on a global basis. Increasing price competition makes sales incentives and effective publicity campaigns indispensable in promoting sales and retaining market share. Such increases in price competition and marketing incentives may seriously impact the operating results and/or financial standing of the MMC Group.
In addition, as competition in the auto industry intensifies, the development cycle for new products becomes shorter. In such circumstances, unless the company is able to offer new products which satisfy price, quality, safety and other customer requirements, or if the company’s strategic products are unable to gain suitable market acceptance, the operating results and/or financial standing of the MMC Group may be seriously impacted. Further, unless the MMC Group is able to formulate effective measures and strategies aimed at maintaining and increasing its competitiveness, the operating results and/or financial standing of the MMC Group may be seriously impacted through a drop in demand for its products. Natural and other disasters
The MMC Group maintains production and other facilities in Japan and many parts of the world. The occurrence of a major natural or other disaster, including earthquakes, typhoons, fires and epidemics, in these areas may result in the suspension or other serious interruption in the operations of the MMC Group or of its suppliers. MMC has prepared and maintains plans and measures to keep operations going in areas and under situations where such risks are high and where they would have a serious impact on MMC Group operations. A disaster occurring on a scale larger than anticipated, however, may seriously impact the operating results and/or financial standing of the MMC Group.
Changes in laws and regulations
- 9 -
The MMC Group is subject to laws and regulations governing protection of the environment, product safety and other matters in the countries where it operates. In the event that the MMC Group fails to conform to or is unable to comply with such laws and regulations, or should such failure lead to sanctions against it, then large costs may be incurred for the purpose of conforming to or of complying with any revision, strengthening of or additions to, these laws and regulations and this may seriously impact the operating results and/or financial standing of the MMC Group.
Manufacturing cost
The MMC Group sources parts and raw materials from a large number of suppliers to manufacture its products. Any rise in the manufacturing cost of MMC’s products due to changes in demand and other market conditions may seriously impact the operating results and/or financial standing of the MMC Group.
Foreign exchange rate fluctuations
Overseas sales accounted for around 80 percent of the MMC Group’s consolidated net sales for the term under consideration. MMC endeavors to hedge risks involved in foreign currency receivables and payables through the prudent use of derivative contracts and other instruments but fluctuations in foreign exchange rates may still seriously impact the operating results and/or financial standing of the MMC Group.
Funding interest rates As at the end of March 2014, the balance of MMC’s consolidated interest-bearing debt(short-term borrowings and long-term borrowings) was 222.4 billion yen. At that time, the balance of the company’s consolidated savings was 450.1 billion yen and so any impact due to the interest-bearing debt may be partially mitigated but changes in interest rates on borrowings resulting from changes in financial market conditions may seriously impact the operating results and/or financial standing of the MMC Group.
Failure to achieve mid-term business plan targets
The MMC Group has drawn up a mid-term business plan setting out operational strategy for the mid-term. However, in the event that differences arise between the premises on which the plan was drawn up and real-world conditions, or should risks other than those described in this section become prominent, the operating results and/or financial standing of the MMC Group may be seriously impacted.
MMC endeavors to improve the quality and assure the safety of MMC Group products. However, in the event that MMC has to issue a recall or implement countermeasures on a large scale due to product defects or failures, or in the event that MMC is pursued in a large-scale product liability action, the large costs incurred and the damage to the company’s reputation and consequent drop in demand for its products may seriously impact the operating results and/or financial standing of the MMC Group.
Lawsuits
Any lawsuit brought against MMC by customers, trading partners or other third parties in the course of the MMC Group conducting its business operations may seriously impact the operating results and/or financial standing of the MMC Group.
In addition, in the event that a decision in a legal action currently under dispute goes against the MMC Group’s claims or predictions, this may seriously impact the operating results and/or financial standing of the MMC Group.
In February 20, 2010, MASRIA CO., Ltd. (hereafter “Plaintiff”), a former MMC distributor in Egypt, filed a lawsuit against MMC for dissolution of a distributor agreement between MMC and the Plaintiff including a 900 million USD claim for damages. The judgments in both the courts of first and second instance found in favor of MMC on October 26, 2010 and July 3, 2012 respectively. The case is now before the final appellate court after the Plaintiff appealed on July 21, 2012 against the judgment of the court of second instance. MMC’s notice to terminate the distributor agreement with the Plaintiff followed due legal process and the terms of the agreement, thus making the Plaintiff’s claim irrational. For this reason, at present MMC does not consider this legal case will result in any serious impact on the operating results and/or financial standing of the MMC Group. Tie-ups and alliances

- 10 -
The MMC Group engages in a variety of activities through operational tie-ups and alliances with auto manufacturers and other companies both in Japan and overseas for the purpose of conducting and expanding its operations. In the event of a particular situation arising at, or of any breakdown in discussions with, a tie-up or alliance company which is beyond the control of MMC, the operating results and/or financial standing of the MMC Group may be seriously impacted.
Dependence on particular suppliers
MMC sources raw materials and parts from a large number of suppliers. The necessity to procure materials and parts characterized by higher quality or more advanced technologies at more competitive prices may bring about a situation in which orders are concentrated upon a specific supplier. There may also be only a limited number of suppliers able to supply parts for which a specific technology is required. Consequently, the operating results and/or financial standing of the MMC Group may be seriously impacted in the event that some unforeseen situation arises and interrupts deliveries from such suppliers.
Customer, trading partner credit
The MMC Group is exposed to credit risks in its dealings with customers and with dealers and other trading partners and in its automobile financing business. In the event that losses stemming from such credit risks exceed the company’s estimates, the operating results and/or financial standing of the MMC Group may be seriously impacted.
Infringement of intellectual property rights
In order to distinguish its products from those of other auto manufacturers MMC endeavors to protect its own technologies, know-how and other intellectual property as well as to prevent the infringement of third party intellectual property rights. However, in the event that a third party unlawfully uses MMC Group intellectual property to manufacture and sell imitations of its products, or in the event that limitations in the legal system in certain countries in relation to the protection of intellectual property rights result in a fall in sales or in legal costs, or in the event that an unforeseen third party intellectual property right requires a halt in manufacturing or sales or in the payment of compensation, the operating results and/or financial standing of the MMC Group may be seriously impacted.
IT and information security
The information technology and the networks and systems that the MMC Group uses in its management and its products are exposed to the possibility of attacks by hackers or computer viruses, to illegal or inappropriate use and to infrastructure breakdowns. In such an event, the operating results and/or financial standing of the MMC Group may be seriously impacted.
The MMC Group possesses confidential information relating to matters both within and without the Group and including personal data. In the event such information is improperly leaked to the outside, the operating results and/or financial standing of the MMC Group may be seriously impacted.

- 11 -
2. The Mitsubishi Motors Corporation Group of Companies
The MMC Group of companies comprises Mitsubishi Motors Corporation, 43 consolidated subsidiaries and 22 equity method affiliates (as at March 31, 2014). The MMC Group is engaged in the development, production and sales of passenger vehicles and their parts and components, as well as in auto financing operations. MMC conducts most of the development work.
In Japan, MMC produces standard and small passenger cars and minicars, while Pajero Manufacturing Co., Ltd. produces some Mitsubishi-brand sport utility vehicles (including the Pajero). Mitsubishi-brand vehicles are sold in Japan by Kanto Mitsubishi Motors Sales Co., Ltd. and other Mitsubishi Motors sales companies. Mitsubishi Automotive Engineering Co., Ltd. undertakes some of the development of MMC products. Mitsubishi Automotive Logistics Technology Co., Ltd. is responsible for the transport of Mitsubishi-brand cars throughout Japan and also for some pre-delivery inspection and maintenance work.
Outside Japan, Mitsubishi-brand cars are produced and sold in North America by Mitsubishi Motors North America, Inc. and in Thailand by Mitsubishi Motors (Thailand) Co., Ltd.
Auto lease and financing services are provided by MMC Diamond Finance Corporation, and by Mitsubishi Motors Credit of America, Inc. in the United States.
The MMC Group structure and constituent company products and services outlined above are shown in the diagram below.
Kanto Mitsubishi Motors Sales Co., Ltd. † and others
MMC Diamond Finance Corporation (Japan) # Mitsubishi Motors Credit of America, Inc. (USA) †
Customers
Finished & semi-finished vehicles, parts Services, etc.
Mitsubishi Automotive Logistics Technology Co., Ltd. †
and others
Mitsubishi Motors North America, Inc. † Mitsubishi Motors (Thailand) Co., Ltd. †
and others
Mitsubishi Motors Corporation
Pajero Manufacturing Co., Ltd. †
Assembly (Japan)
Mitsubishi Automotive Engineering Co., Ltd. †
Engineering
Transportation / other services Overseas production & sales
Sales (Japan)
Auto finance
† Consolidated subsidiary
# Equity-method affiliate
Other related companies
Mitsubishi Heavy Industries, Ltd.
- 12 -
3. Management Policies 3.1 Basic management policy
“We are committed to providing the utmost driving pleasure and safety for our valued customers and our community. On these commitments we will never compromise. This is the Mitsubishi Motors way.”
This corporate philosophy is the cornerstone to all of MMC’s corporate activities in its quest to remain and grow as a company that enjoys the trust of its shareholders, customers, business associates, employees and all other stakeholders.
The phrase “For our valued customers and our community” refers to MMC’s determination to place the utmost importance on its customers and the local communities it operates in. All corporate activities are conducted with customer satisfaction as the foremost consideration. To this end, MMC devotes its energies and resources to developing environmental technologies and to the pursuit of vehicle safety. By earning customer satisfaction in this way MMC aims to remain a company in which society places its trust.
The phrase “The utmost driving pleasure and safety” refers to MMC’s determination to make clear the direction engineering and car building MMC is taking. The vehicles that MMC offers customers reflect the ideals of “Driving Pleasure” and “Reassuring Safety.” MMC builds cars that balance on and off-road performance – the fundamental appeal of a car – with the safety and reliability that encourage customers to drive Mitsubishi cars with confidence and reassurance for many years.
The phrase “On these commitments we will never compromise” refers to the uncompromising attention to detail that MMC gives to its car design and building activities and that distinguishes MMC from others. In its approach to designing and building cars MMC leaves no stone unturned in its commitment to discovering new values that earn customer satisfaction and enrich the car ownership experience.
The phrase “Committed to providing” refers to the importance that MMC attaches to continuity. MMC passionately believes that by constantly challenging new frontiers and pushing the envelope in its design and building activities it can continue to offer customers cars that reflect and embody the next evolutionary stage in traditional MMC values. 3.2 Management indices
MMC does not currently employ ROE, ROA or other such management performance indices. MMC is, however, working toward sustainable growth by devoting its energies and resources to tackling the tasks set out in the New Stage 2016 midterm business plan.
3.3 Medium- and long-term management strategy
All MMC Group directors and employees will work together in devoting their energies to executing the New Stage 2016 mid-term business plan that covers the period from fiscal 2014 through fiscal 2016 (end of March 2017).
3.4 Issues facing the Company
In a journey that started with the Revitalization Plan initiated in FY2005, went on through STEP UP 2010 and ended with JUMP 2013, the MMC Group has succeeded in creating the climate to allow resumption of dividend payments on common stock, a long-standing issue, after completing the cleanup of shares of preferred stock.
Gazing into the future, while a rebound fall in demand in Japan after the last-minute surge before the recent increase in consumption tax is unavoidable in the short term, a certain degree of improvement in the operating environment for automakers is expected as business recovers overseas. However, the industry is still exposed to such risks as political and economic uncertainty in emerging nations which are looked to as growth markets, mid- to long-term stagnation in established markets, foreign exchange fluctuations and intensifying competition between automakers.
In these circumstances, the MMC Group has positioned the New Stage 2016 mid-term business plan as a “new stage for growth” in its management plans. This “new stage for growth” adopts five basic policies: Revenue growth by launching strategic models; Enhancing the MMC brand and identity; Reinforcing MMC’s production base in ASEAN countries; Establishing an SUV brand with a strong foothold in emerging markets; and, making effective use of resources through business partnerships. In turn, these policies provide the foundation for the following strategies which the company will adopt as it aims to achieve the new mid-term business plan.
1. Revenue growth by launching strategic models

- 13 -
2. Development of next-generation technology
3. Strengthening of regional strategies
4. Restructuring of operating structure
5. Establishment of stable business foundation
6. Actions for quality improvement
MMC identifies the following as keys to achieving the New Stage 2016 mid-term business plan: Ensuring the profitability of the measures taken under JUMP 2013 to strengthen MMC operations such as the start-up of a new factory in Thailand, as well as the start of production at joint-venture operations China and Russia; utilizing its strong-selling pickup trucks, SUVs and crossover models as strategic products while steadily meeting the growing global need for eco-car technologies and safety technologies; harvesting higher sales volume on the back of mid- to long-term growth in Asian markets; strengthening its operations organization in emerging markets as well as conducting advance research and cutting-edge technology development to prepare for the future after New Stage 2016 has been completed.
In FY2014, the initial year of the new mid-term business plan, MMC will introduce a new pickup truck as the first of its strategic products. And with a firm eye on future growth in the Philippine automobile market, the company will bolster its operational base in the country by restructuring its production capability by relocating Mitsubishi Motors Philippines Corporation’s (MMPC) headquarters and factory to another factory site where MMPC acquired in March this year.
In addition, MMC will continue implementation of its “Customer First Program” initiative to promote company-wide quality reforms.
Placing the highest priority on compliance in its implementation and execution of the initiatives described above, MMC will give even greater consideration to its relationship with the environment and with society to ensure that it continues to faithfully earn the trust it enjoys from its customers and society at large.
Through a process of resolute examination of its internal control systems, MMC will further bolster its corporate governance and redouble its efforts to ensure corporate compliance and the appropriateness and efficiency of its operations management.
Guided by New Stage 2016, MMC is aiming to enter a new stage of growth in which it will achieve a solid increase in net sales and in earnings and will build an organization that returns growth-driven profits to its shareholders on a consistent basis. MMC wishes to thank its stockholders and all stakeholders for their support and guidance to date and humbly asks for their continued support and guidance in the years ahead.

- 14 -
4. Consolidated financial statements (1) Consolidated balance sheets
(Millions of yen)
FY 2012 As of March 31, 2013
FY 2013 As of March 31, 2014
Assets
Current assets
Cash and deposits 409,509 450,063
Notes and accounts receivable-trade 149,555 173,535
Finance receivables 26,856 28,927
Merchandise and finished goods 143,046 156,080
Work in process 33,979 24,876
Raw materials and supplies 25,295 26,593
Short-term loans receivable 90 3,261
Deferred tax assets 3,543 15,445
Other 93,416 61,803
Less: Allowance for doubtful accounts (6,312) (4,025)
Total current assets 878,980 936,561
Noncurrent assets
Property, plant and equipment
Buildings and structures, net 82,541 79,678
Machinery, equipment and vehicles, net 139,756 148,565
Tools, furniture and fixtures, net 51,977 55,033
Land 99,432 101,022
Construction in progress 13,196 16,501
Total property, plant and equipment 386,903 400,801
Intangible assets 12,894 12,937
Investments and other assets
Long-term finance receivables 48,228 40,652
Investment securities 67,251 71,759
Long-term loans receivable 4,562 7,775
Deferred tax assets 4,349 9,898
Other 59,873 70,415
Less: Allowance for doubtful accounts (10,234) (6,911)
Total investments and other assets 174,031 193,590
Total noncurrent assets 573,829 607,329
Total assets 1,452,809 1,543,890

- 15 -
(Millions of yen)
FY 2012
As of March 31, 2013 FY 2013
As of March 31, 2014
Liabilities
Current liabilities
Notes and accounts payable-trade 313,810 355,724
Short-term loans payable 113,984 121,074
Current portion of long-term loans payable 143,271 32,611
Lease obligations 4,703 3,818
Accounts payable-other and accrued expenses 106,168 113,893
Income taxes payable 8,360 9,522
Deferred tax liabilities 346 15
Provision for product warranties 28,273 31,993
Other 68,328 52,291
Total current liabilities 787,248 720,946
Noncurrent liabilities
Long-term loans payable 107,125 68,672
Lease obligations 6,793 4,933
Deferred tax liabilities 30,103 28,053
Provision for retirement benefits 111,660 -
Net defined benefit liability - 113,747
Provision for directors’ retirement benefits 912 912
Other 57,738 56,614
Total noncurrent liabilities 314,333 272,934
Total liabilities 1,101,581 993,880
Net assets
Shareholders’ equity
Capital stock 657,355 165,701
Capital surplus 432,666 85,257
Retained earnings (688,049) 340,714
Treasury stock (217) (219)
Total shareholders’ equity 401,754 591,453
Accumulated comprehensive income
Valuation difference on available-for-sale securities 5,222 5,786
Deferred gains or losses on hedges 2,980 (1,641)
Foreign currency translation adjustment (69,759) (51,323)
Remeasurements of defined benefit plans - (3,742)
Total accumulated comprehensive income (61,556) (50,921)
Minority interests 11,030 9,477
Total net assets 351,227 550,009
Total liabilities and net assets 1,452,809 1,543,890

- 16 -
(2) Consolidated statement s of income and Consolidated statements of comprehensive income
Consolidated statements of income (Millions of yen)
For the fiscal year ended
March 31, 2013 For the fiscal year ended
March 31, 2014
Net sales 1,815,113 2,093,409
Cost of sales 1,475,141 1,643,176
Gross profit 339,971 450,232
Selling, general and administrative expenses
Advertising and promotion expenses 75,225 106,143
Freightage expenses 43,252 56,595
Provision of allowance for doubtful accounts 232 (1,144)
Directors' compensations, salaries and allowances 60,761 64,515
Provision for retirement benefits 5,080 5,155
Depreciation 8,795 9,129
Research and development expenses 34,817 36,714
Other 44,422 49,687
Total selling, general and administrative expenses 272,589 326,797
Operating income (loss) 67,382 123,434
Non-operating income
Interest income 3,746 5,325
Dividends income 1,144 1,031
Foreign exchange gains 30,395 16,674
Equity in earnings of affiliates 4,853 7,373
Other 2,012 929
Total non-operating income 42,152 31,333
Non-operating expenses
Interest expenses 10,624 9,345
Share issuance cost - 12,639
Litigation expenses 1,538 1,031
Other 3,469 2,279
Total non-operating expenses 15,631 25,295
Ordinary income (loss) 93,903 129,472
Extraordinary income
Gain on sales of noncurrent assets 332 1,198
Gain on sales of subsidiaries and affiliates’ stocks - 802
Gain on sales of investment securities 11,533 205
Other 155 85
Total extraordinary income 12,022 2,291

- 17 -
(Millions of yen)
For the fiscal year ended
March 31, 2013
For the fiscal year ended
March 31, 2014
Extraordinary loss
Loss on retirement of noncurrent assets 5,328 4,572
Loss on sales of noncurrent assets 36 664
Impairment loss 793 6,902
Loss on sales of stocks of subsidiaries and affiliates 30,188 185
Other 182 2,243
Total extraordinary losses 36,529 14,568
Income (loss) before income taxes and minority interests
69,396 117,194
Income taxes-current 17,383 24,693
Income taxes-deferred 10,385 (14,629)
Total income taxes 27,769 10,063
Income (loss) before minority interests 41,627 107,130
Minority interests in income 3,648 2,465
Net income (loss) 37,978 104,664
Consolidated statements of comprehensive income (Millions of yen)
For the fiscal year ended
March 31, 2013
For the fiscal year ended
March 31, 2014
Income (loss) before income taxes and minority interests
41,627 107,130
Other comprehensive income
Valuation difference on available-for-sale securities (6,087) 558
Deferred gains or losses on hedges 747 (3,438)
Foreign currency translation adjustment 42,817 7,621
Share of other comprehensive income of associates accounted for using equity method
9,354 9,936
Total other comprehensive income 46,832 14,677
Comprehensive income 88,459 121,808
Comprehensive income attributable to:
Owners of the parent 83,177 119,028
Minority interests 5,281 2,780

- 18 -
(3) Consolidated statements of changes in net assets (Millions of yen)
For the fiscal year ended March 31,2013
Shareholders’ equity
Capital stock Capital surplusRetained earnings Treasury stock
Total shareholders’
equityBalance at the end of previous period 657,355 432,666 726,028) 15) 363,976Changes of items during the period
Net income (loss) - - 37,978 - 37,978 Issuance of new shares - - - - -Deficit disposition - - - - -Transfer to other capital surplus from capital stock - - - - -
Purchase of treasury stock - - - 201) 201)Disposal of treasury shares - - - - -Retirement of treasury shares - - - - -Change of scope of equity method - - - - -Net changes of items other than shareholders’ equity - - - - -
Total changes of items during the period ‐ ‐ 37,978 201) 37,777Balance at the end of current period 657,355 432,666 688,049) 217) 401,754
(Millions of yen)
For the fiscal year ended March 31,2013
Other comprehensive income
Minority interests
Owners of the parent
Valuation difference on available-for-
sale securities
Deferred gains or
losses on hedges
Foreign currency
translation adjustment
Remeasurements of defined
benefit plans
Total other comprehensi
ve income
Balance at the end of previous period 11,327 2,232 120,542) - 106,982) 8,626 265,620
Changes of items during the period
Net income (loss) - - - - - - 37,978 Issuance of new shares - - - - - - -Deficit disposition - - - - - - -Transfer to other capital surplus from capital stock - - - - - - -
Purchase of treasury stock - - - - - - 201)Disposal of treasury shares - - - - - - -Retirement of treasury shares - - - - - - -Change of scope of equity method - - - - - - -
Net changes of items other than shareholders’ equity 6,104) 747 50,782 - 45,426 2,404 47,830
Total changes of items during the period 6,104) 747 50,782 - 45,426 2,404 85,607
Balance at the end of current period 5,222 2,980 69,759) - 61,556) 11,030 351,227

- 19 -
(Millions of yen)
For the fiscal year ended
March 31,2014
Shareholders’ equity
Capital stock Capital surplusRetained earnings Treasury stock
Total shareholders’
equityBalance at the end of previous period 657,355 432,666 688,049) 217) 401,754Changes of items during the period
Net income (loss) - - 104,664 - 104,664 Issuance of new shares 133,375 133,375 - - 266,750Deficit disposition - 924,102) 924,102 - -Transfer to other capital surplus from capital stock 625,028) 625,028 - - -
Purchase of treasury stock - - - 181,711) 181,711)Disposal of treasury shares - 0 - 0 0Retirement of treasury shares - 181,709) - 181,709 -Change of scope of equity method - - 3) - 3)Net changes of items other than shareholders’ equity - - - - -
Total changes of items during the period 491,653) 347,408) 1,028,764 2) 189,699Balance at the end of current period 165,701 85,257 340,714 219) 591,453
(Millions of yen)
For the fiscal year ended March 31,2014
Other comprehensive income
Minority interests
Owners of the parent
Valuation difference on available-for-
sale securities
Deferred gains or
losses on hedges
Foreign currency
translation adjustment
Remeasurements of defined
benefit plans
Total other comprehensi
ve income
Balance at the end of previous period 5,222 2,980 69,759) - 61,556) 11,030 351,227
Changes of items during the period
Net income (loss) - - - - - - 104,664 Issuance of new shares - - - - - - 266,750Deficit disposition - - - - - - -Transfer to other capital surplus from capital stock - - - - - - -
Purchase of treasury stock - - - - - - 181,711) Disposal of treasury shares - - - - - - 0Retirement of treasury shares - - - - - - -Change of scope of equity method - - - - - - 3)
Net changes of items other than shareholders’ equity 563 4,621) 18,435 3,742) 10,635 1,553) 9,082
Total changes of items during the period 563 4,621) 18,435 3,742) 10,635 1,553) 198,781
Balance at the end of current period 5,786 1,641) 51,323) 3,742) 50,921) 9,477 550,009

- 20 -
(4) Consolidated statements of cash flows
(Millions of yen)
For the fiscal year ended
March 31, 2013 For the fiscal year ended
March 31, 2014
Net cash provided by (used in) operating activities
Income (loss) before income taxes and minority interests 69,396 117,194
Depreciation and amortization 54,324 59,211
Impairment loss 793 6,902
Amortization of goodwill 1 1
Increase (decrease) in allowance for doubtful accounts (1,596) (2,445)
Increase (decrease) in provision for retirement benefits 2,676 -
Increase (decrease) in net defined benefit liability - (3,372)
Interest and dividends income (4,890) (6,356)
Interest expenses 10,624 9,345
Foreign exchange losses (gains) 10,467 (7,507)
Equity in (earnings) losses of affiliates (4,853) (7,373)
Loss (gain) on sales and retirement of noncurrent assets 5,032 4,038
Loss (gain) on sales of investment securities (11,533) (205)
Loss (gain) on sales of stocks of subsidiaries and affiliates 30,188 (616)
Share issuance cost - 12,639
Decrease (increase) in notes and accounts receivable-trade 14,919 (23,910)
Decrease (increase) in inventories 5,976 (1,187)
Change in finance receivables 15,153 12,249
Increase (decrease) in notes and accounts payable-trade (22,208) 42,135
Other, net 19,972 23,163
Subtotal 194,443 233,906
Interest and dividends income received 7,218 9,396
Interest expenses paid (10,826) (9,453)
Income taxes paid (18,608) (23,404)
Net cash provided by (used in) operating activities 172,227 210,443
Net cash provided by (used in) investment activities
Decrease (increase) in time deposits (40,203) 9,583
Purchase of property, plant and equipment (61,573) (90,695)
Proceeds from sales of property, plant and equipment 8,528 14,715
Purchase of investment securities (944) (0)
Proceeds from sales of investment securities 12,563 221
Payments for investments in capital of subsidiaries and affiliates (11,381) -
Decrease (increase) in short-term loans receivable 8,651 (1,625)
Payments of long-term loans receivable (0) (6,294)
Collection of long-term loans receivable 302 705
Payments for sales of investments in subsidiaries resulting in change in scope of consolidation
(21,587) (2,265)
Other, net (8,681) (5,697)
Net cash provided by (used in) investment activities (114,327) (81,352)

- 21 -
(Millions of yen)
For the fiscal year ended
March 31, 2013 For the fiscal year ended
March 31, 2014
Net cash provided by (used in) financing activities
Net increase (decrease) in short-term loans payable 21,552 (5,790)
Proceeds from long-term loans payable 85,169 2,925
Repayment of long-term loans payable (106,473) (142,824)
Proceeds from issuance of common shares - 254,111
Purchase of treasury shares (201) (181,711)
Cash dividends paid to minority shareholders (3,562) (4,313)
Other, net (4,793) (4,480)
Net cash provided by (used in) financing activities (8,310) (82,083)
Effect of exchange rate change on cash and cash equivalents 546 3,520
Net increase (decrease) in cash and cash equivalents 50,136 50,527
Cash and cash equivalents at beginning of period 310,993 361,167
Increase in cash and cash equivalents resulting from merger with unconsolidated subsidiaries
37 -
Cash and cash equivalents at end of period 361,167 411,695

- 22 -
(5) Notes to consolidated financial statements
Notes on premise of going concern
There is no item to be reported.
Significant Matters Serving as a Basis for the Preparation of Consolidated Financial Statements
Disclosure is omitted as there were no significant changes to the items described in the latest Annual Securities Report (filed on June 25, 2013) except for the following. Application of Accounting Standard for Retirement Benefits Notes on Changes in Accounting Policies Accounting Standard for Retirement Benefits “Accounting Standard for Retirement Benefits” (ASBJ Statement No. 26, issued on May 17, 2012, hereinafter referred to as the “Retirement Benefits Accounting Standard”) and the “Guidance on Accounting Standard for Retirement Benefits” (ASBJ Guidance No. 25, issued on May 17, 2012, hereafter referred as the Guidance on Retirement Benefits) have been applied from this fiscal year except for the amendments relating to determination of retirement benefit obligations and current service cost, which stipulated in section 35 of the Retirement Benefits Accounting Standard and section 67 of the Guidance on Retirement benefits. Accordingly, net defined benefit liability is recorded by deducting pension assets from defined benefit obligations and unrecognized actuarial gains and losses and unrecognized prior service costs are recorded in net defined benefit liability. When the amount of pension assets exceeds defined benefit obligations, the net amount is recorded in other in investments and other assets. With regard to application of Accounting Standard for Retirement Benefits, the effect of changes are adjusted to measurements of defined benefit plans in accumulated other comprehensive income at the end of this fiscal year in accordance with transitional measures stipulated in section 37 of the Retirement Benefits Accounting Standard. The effect of application of changes is immaterial. Consolidated balance sheet: (Millions of yen)
As of March 31, 2014
Contingent liabilities
Contingent liabilities 14,065
Consolidated statement of income: (Millions of yen)
For the fiscal year from April 1, 2013 to March 31, 2014
Total R&D expenditure included in selling,
general and administrative expenses 36,714

- 23 -
Consolidated statement of changes in net assets: (from April 1, 2013 to March 31, 2014)
Shares issued and outstanding and treasury shares (Thousands of shares)
Number of shares
As of 3/31/2013 Increase Decrease
Number of shares
As of 3/31/2014
Shares issued and outstanding:
Common shares Note 1,2 6,080,900 508,807 5,606,045 983,661
Class A # 1 preferred shares Note 3 57 - 57 -
Class G # 1 preferred shares Note 4 130 - 130 -
Class G # 2 preferred shares Note 5 168 - 168 -
Class G # 3 preferred shares Note 6 10 - 10 -
Class G # 4 preferred shares Note 7 30 - 30 -
Total 6,081,296 508,807 5,606,441 983,661
Treasury shares
Common shares Note 8,9 2,195 2 1,976 221
Class A # 1 preferred shares Note 10 - 57 57 -
Class G # 1 preferred shares Note 11,12 - 130 130 -
Class G # 2 preferred shares Note 13,14 - 168 168 -
Class G # 3 preferred shares Note 15 - 10 10 -
Class G # 4 preferred shares Note 16 - 30 30 -
Total 2,195 398 2,372 221
Note: 1. Increase of 508,807 thousand common shares consists of 187,113 thousand shares increased from conversion of Class A # 1 preferred shares, 31,142 thousand shares increased from conversion of Class G # 1 preferred shares, 26,674 thousand shares increased from conversion of Class G # 2 preferred shares, 25,706 thousand shares increased from conversion of Class G # 4 preferred shares, 217,750 thousand shares increased from public offering and 20,419 thousand shares increased from third-party allocation.
2. Decrease of 5,606,045 thousand common shares is due to stock merger.
3. Decrease of 57 thousand Class A #1 preferred shares is due to retirement of treasury shares.
4. Decrease of 130 thousand Class G # 1 preferred shares is due to retirement of treasury shares.
5. Decrease of 168 thousand Class G #2 preferred shares is due to retirement of treasury shares.
6. Decrease of 10 thousand Class G #3 preferred shares is due to retirement of treasury shares.
7. Decrease of 30 thousand Class G #4 preferred shares is due to retirement of treasury shares.
8. Increase of 2 thousand treasury common shares is due to increase of 2 thousand shares from the purchases of stock lots not meeting the minimum trading lot.
9. Decrease of 1,976 thousand treasury common shares is due to stock merger.
10. Increase and decrease of 57 thousand treasury Class A # 1 preferred shares are due to purchases and retirements associated with the conversion of preferred shares.
11. Increase of 130 thousand treasury Class G # 1 preferred shares is due to purchases of 32 thousand treasury preferred shares associated with conversion of preferred shares and purchases of 97 thousand treasury preferred shares associated with resolution of the board of directors meeting.
12. Decrease of 130 thousand G #1 preferred treasury shares is due to retirement.

- 24 -

- 25 -
13. Increase of 168 thousand treasury Class G # 2 preferred shares is due to purchases of 31 thousand treasury preferred shares associated with conversion of preferred shares and purchases of 137 thousand treasury preferred shares in associated with resolution of the board of directors meeting.
14. Decrease of 168 thousand G #2 preferred treasury shares is due to retirement.
15. Increase and decrease of 10 thousand treasury Class G # 3 preferred shares are due to purchases and retirements associated with resolution of the board of directors meeting.
16. Increase and decrease of 30 thousand treasury Class G # 4 preferred shares are due to purchases and retirements associated with the conversion of preferred shares.
Consolidated statement of cash flows: (Millions of yen)
For the fiscal year ended March 31, 2014
Reconciliation between cash and cash equivalents and the amounts
reported in the consolidated balance sheet is as follows:
Cash and deposits 450,063
Time deposits with maturities greater than three months (38,368)
Cash and cash equivalents 411,695
- 26 -
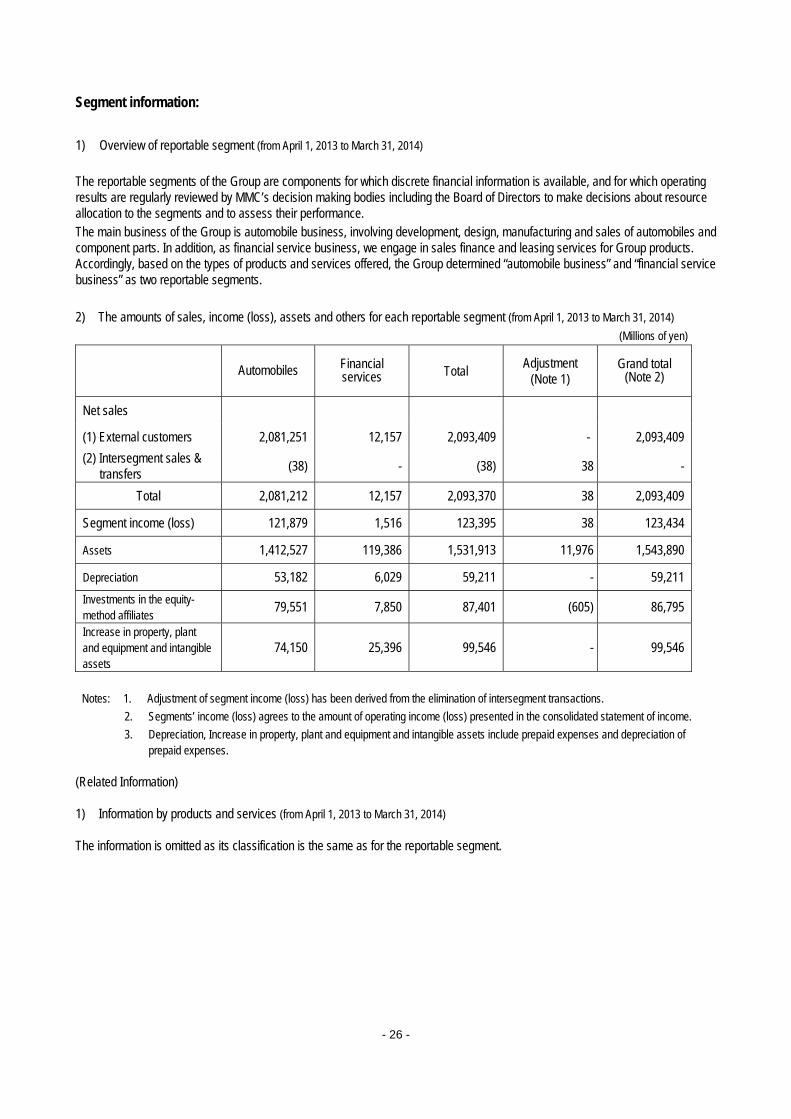
Segment information:
1) Overview of reportable segment (from April 1, 2013 to March 31, 2014) The reportable segments of the Group are components for which discrete financial information is available, and for which operating results are regularly reviewed by MMC’s decision making bodies including the Board of Directors to make decisions about resource allocation to the segments and to assess their performance. The main business of the Group is automobile business, involving development, design, manufacturing and sales of automobiles and component parts. In addition, as financial service business, we engage in sales finance and leasing services for Group products. Accordingly, based on the types of products and services offered, the Group determined “automobile business” and “financial service business” as two reportable segments. 2) The amounts of sales, income (loss), assets and others for each reportable segment (from April 1, 2013 to March 31, 2014)
(Millions of yen)
Automobiles Financial services Total
Adjustment (Note 1)
Grand total (Note 2)
Net sales
(1) External customers 2,081,251 12,157 2,093,409 - 2,093,409
(2) Intersegment sales & transfers
(38) - (38) 38 -
Total 2,081,212 12,157 2,093,370 38 2,093,409
Segment income (loss) 121,879 1,516 123,395 38 123,434
Assets 1,412,527 119,386 1,531,913 11,976 1,543,890
Depreciation 53,182 6,029 59,211 - 59,211
Investments in the equity-method affiliates
79,551 7,850 87,401 (605) 86,795
Increase in property, plant and equipment and intangible assets
74,150 25,396 99,546 - 99,546
Notes: 1. Adjustment of segment income (loss) has been derived from the elimination of intersegment transactions.
2. Segments’ income (loss) agrees to the amount of operating income (loss) presented in the consolidated statement of income.
3. Depreciation, Increase in property, plant and equipment and intangible assets include prepaid expenses and depreciation of prepaid expenses.
(Related Information) 1) Information by products and services (from April 1, 2013 to March 31, 2014) The information is omitted as its classification is the same as for the reportable segment.
- 27 -
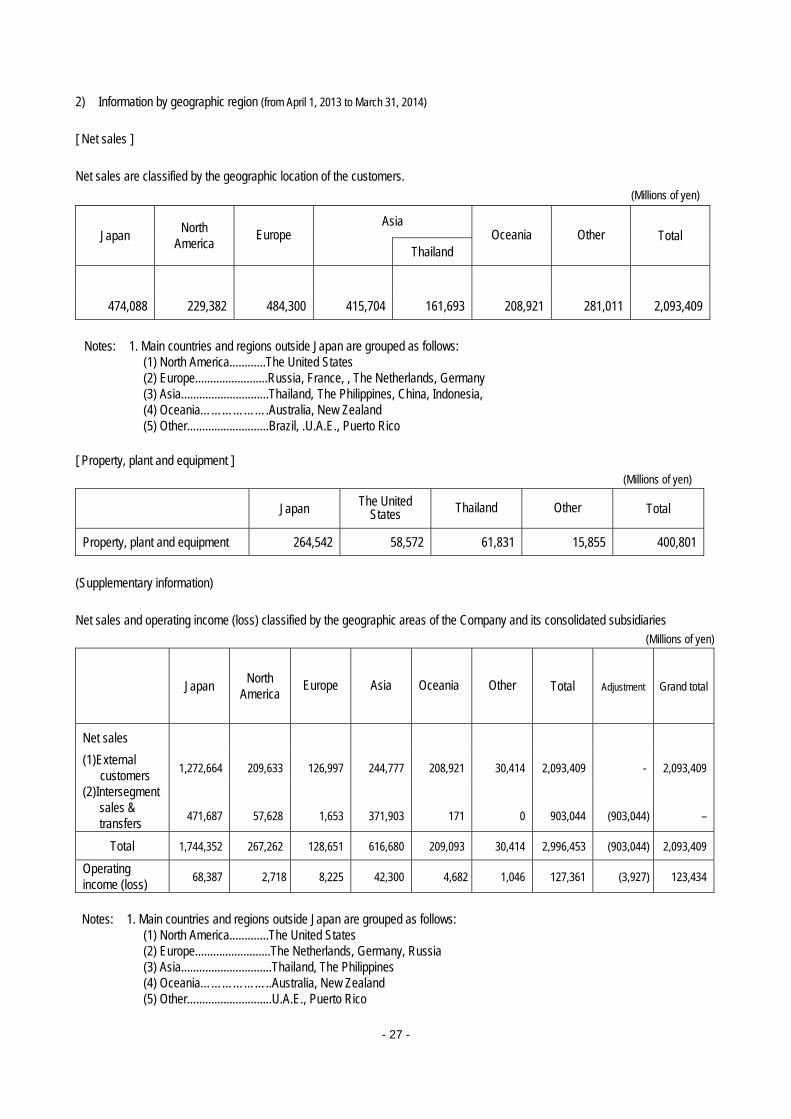
2) Information by geographic region (from April 1, 2013 to March 31, 2014) [ Net sales ] Net sales are classified by the geographic location of the customers.
(Millions of yen)
Japan North
America Europe
Asia Oceania Other Total
Thailand
474,088 229,382 484,300 415,704 161,693 208,921 281,011 2,093,409
Notes: 1. Main countries and regions outside Japan are grouped as follows:
(1) North America............The United States (2) Europe........................Russia, France, , The Netherlands, Germany (3) Asia.............................Thailand, The Philippines, China, Indonesia, (4) Oceania……………….Australia, New Zealand (5) Other...........................Brazil, .U.A.E., Puerto Rico
[ Property, plant and equipment ]
(Millions of yen)
Japan The United States Thailand Other Total
Property, plant and equipment 264,542 58,572 61,831 15,855 400,801
(Supplementary information) Net sales and operating income (loss) classified by the geographic areas of the Company and its consolidated subsidiaries
(Millions of yen)
Japan North
America Europe Asia Oceania Other Total Adjustment Grand total
Net sales
(1)External customers
1,272,664 209,633 126,997 244,777 208,921 30,414 2,093,409 - 2,093,409
(2)Intersegment sales & transfers
471,687
57,628
1,653
371,903
171
0
903,044
(903,044)
–
Total 1,744,352 267,262 128,651 616,680 209,093 30,414 2,996,453 (903,044) 2,093,409
Operating income (loss)
68,387 2,718 8,225 42,300 4,682 1,046 127,361 (3,927) 123,434
Notes: 1. Main countries and regions outside Japan are grouped as follows:
(1) North America.............The United States (2) Europe.........................The Netherlands, Germany, Russia (3) Asia..............................Thailand, The Philippines (4) Oceania………………..Australia, New Zealand (5) Other............................U.A.E., Puerto Rico

- 28 -
Information on major customers
(Millions of yen)
Customer Net sales Relevant segment
Mitsubishi Corporation 272,020 Automobiles
Impairment loss (from April 1, 2013 to March 31, 2014)
(Millions of yen)
Automobiles Financial services Total Adjustment Grand total
Impairment loss 6,902 - 6,902 - 6,902
Goodwill (from April 1, 2013 to March 31, 2014)
No significant items to be reported. Negative goodwill (from April 1, 2013 to March 31, 2014)
There is no item to be reported.

- 29 -
Per share information (Yen)
For the fiscal year ended March 31, 2014 (from April 1, 2013 to March 31, 2014)
Net assets per share 549.63
Net income per share - basic 156.60
Net income per share - diluted 104.29
Note: Basis for calculating net income per share - basic and net income per share - diluted is shown below. (Millions of yen) For the fiscal year ended
March 31, 2014 (from April 1, 2013 to March 31,
2014) Net income per share - basic
Net income as shown on the statement of income 104,664 Gain not attributable to ordinary shareholders - Net income related to common stock 104,664 Average number of shares of common stock outstanding during the period (Unit: Thousands of shares)
668,367
Net income per share – diluted Adjustment to Net income - Increase in number of shares of common stock (Unit: Thousands of shares)
335,179
(Preferred shares) (335,179) (Subscription rights to shares) -
Note: Ten shares of common stock were consolidated into one share on August 1, 2013. Net income per share were calculated as if the consolidation of shares had been carried out on the beginning of the year ended March 31, 2014.
Significant subsequent events:
There is no item to be reported. Other notes:
Notes to the following items are omitted from this report to enable accelerated disclosure of our financial reporting.
Lease transactions
Related-party transactions
Deferred tax
Financial instruments
Marketable securities
Derivative transactions
Retirement benefits
Business combinations etc.
Asset retirement obligations
Investment and rental properties etc.

- 30 -
5. Non-consolidated financial statements
(1) Non-consolidated balance sheet (Millions of yen)
FY 2012 As of March 31, 2013
FY 2013 As of March 31, 2014
Assets Current assets Cash and cash deposits 239,393 238,499 Notes receivable – trade 1 - Accounts receivable – trade 162,478 179,352 Finished goods 29,763 27,842 Work in process 28,545 17,278 Raw materials and supplies 9,580 12,020 Advance payments - trade 6,388 645 Prepaid expenses 747 1,062 Deferred tax assets - 10,534 Short-term loans receivable to affiliated companies 50,169 78,507 Accounts receivable–other 35,311 41,491 Other 2,697 7,188 Less: Allowance for doubtful accounts (19,303) (17,002)
Total current assets 545,774 597,422 Non-current assets Property, plant and equipment
Buildings 143,368 141,135 Less: Accumulated depreciation (105,367) (105,192) 38,000 35,942 Structures 36,997 36,899 Less: Accumulated depreciation (30,174) (30,173) 6,823 6,725 Machinery and equipment 445,162 433,035 Less: Accumulated depreciation (385,516) (381,072) 59,646 51,963 Transportation equipment 4,407 4,367 Less: Accumulated depreciation (3,684) (3,512) 723 855 Tools, furniture and fixtures 218,584 218,402 Less: Accumulated depreciation (175,265) (172,604) 43,318 45,797 Land 49,668 50,524 Construction in progress 6,779 5,667
Total property, plant and equipment 204,960 197,477 Intangible assets
Patent right 32 19 Leasehold right 885 885 Right of Trademark 27 24 Software 7,512 6,986 Others 861 1,537
Total intangible assets 9,320 9,454

- 31 -
(Millions of yen)
FY 2012 As of March 31, 2013
FY 2013 As of March 31, 2014
Investments and other assets Investment securities 23,747 23,550 Investments in subsidiaries and affiliates 158,663 164,157 Investments in capital 20 20 Investments in capital of subsidiaries and affiliates 21,311 21,311 Long-term loans receivable 0 0 Long-term loans receivable from subsidiaries and affiliates
- 3,620
Claims provable in bankruptcy, claims provable in rehabilitation and other
5,426 2,376
Long-term prepaid expenses 7,688 8,590 Lease and guarantee deposits 10,999 9,575 Other - 28 Less: Allowance for doubtful accounts (5,496) (2,189)
Total investments and other assets 222,362 231,042 Total non-current assets 436,643 437,974
Total assets 982,418 1,035,396 Liabilities
Current liabilities Notes payable- trade 8,734 3,388 Electronically recorded obligations - operating - 9,145 Accounts payable- trade 294,888 320,304 Short-term loans payable 68,150 30,100 Current portion of long-term loans payable 110,716 16,851 Lease obligations 4,402 3,505 Accounts payable – other 50,373 63,437 Accrued expenses 3,108 3,290 Income taxes payable 374 2,607 Deferred tax liabilities 343 - Advances received 31,849 17,207 Deposits received 40,770 41,660 Unearned revenue 33 35 Provision for product warranties 9,434 10,669 Asset retirement obligations 922 141 Other 7,187 10,354
Total current liabilities 631,288 532,700 Non-current liabilities
Long-term loans payable 22,487 5,631 Long-term loans payable to subsidiaries and affiliates 22,500 17,500 Lease obligations 5,974 4,292 Long-term accounts payable-other 12,461 10,611 Deferred tax liabilities 9,646 7,621 Provision for retirement benefits 92,117 93,590 Provision for directors’ retirement benefits 696 696 Asset retirement obligations 4,863 3,443 Other 9,593 9,608
Total non-current liabilities 180,340 152,996 Total liabilities 811,629 685,696
- 32 -
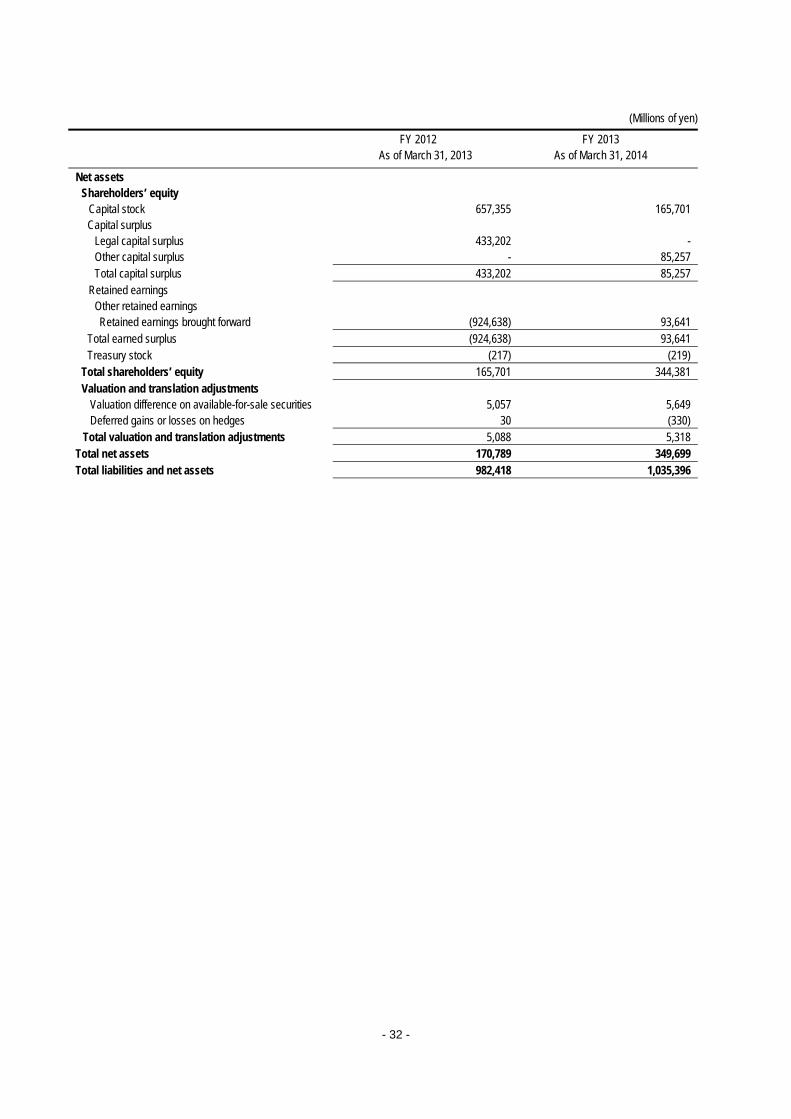
(Millions of yen)
FY 2012 As of March 31, 2013
FY 2013 As of March 31, 2014
Net assets Shareholders’ equity
Capital stock 657,355 165,701 Capital surplus
Legal capital surplus 433,202 - Other capital surplus - 85,257 Total capital surplus 433,202 85,257
Retained earnings Other retained earnings Retained earnings brought forward (924,638) 93,641
Total earned surplus (924,638) 93,641 Treasury stock (217) (219)
Total shareholders’ equity 165,701 344,381 Valuation and translation adjustments
Valuation difference on available-for-sale securities 5,057 5,649 Deferred gains or losses on hedges 30 (330)
Total valuation and translation adjustments 5,088 5,318 Total net assets 170,789 349,699 Total liabilities and net assets 982,418 1,035,396

- 33 -
(2) Non-consolidated statement of income (Millions of yen)
For the fiscal year Ended as of March 31, 2013
For the fiscal year Ended as of March 31, 2014
Net sales 1,383,389 1,671,622 Cost of sales 1,223,517 1,445,346 Gross profit 159,872 226,276 Selling, general and administrative expenses Advertising and promotion expenses 30,224 34,885 Haulage expenses 40,148 51,866 Provision of allowance for doubtful accounts 204 (1,108) Directors’ compensations, salaries and allowances 20,325 21,191 Provision for retirement benefits 2,308 1,694 Depreciation 4,890 4,581 Research and development expenses 33,238 41,013 Fees 4,798 7,044 Rent expenses 8,213 7,267 Other 748 1,135
Total selling, general and administrative expenses 145,100 169,751 Operating income (loss) 14,771 56,705
Non-operating income Interest income 1,963 2,286 Dividends income 57,268 54,064 Foreign exchange gains 12,376 8,227 Other 1,505 2,304
Total non-operating income 73,113 66,883 Non-operating expenses
Interest expenses 9,301 6,476 Share issuance cost - 12,639 Foreign withholding tax 1,418 - Other 1,875 1,641
Total non-operating expenses 12,594 20,757 Ordinary income (loss) 75,290 102,831 Extraordinary income
Gain on sales of investment securities 11,531 199 Gain on sales of non-current assets 198 23 Gain on sales of subsidiaries and affiliates' stocks 1,321 - Other gains 138 10
Total extraordinary income 13,189 234 Extraordinary losses Impairment loss 508 6,073 Loss on disposal of fixed assets 5,036 3,974 Loss on sales of stocks of subsidiaries and affiliates 31,623 - Loss on valuation of stocks of subsidiaries and affiliates
7,988 900
Other losses 2,526 1,823 Total extraordinary losses 47,684 12,771 Net income(loss) before income taxes 40,795 90,293 Income tax, current 2,067 9,632 Income tax, deferred (- indicates reduction) 31 (12,980) Total income taxes 2,099 (3,347) Net income(loss) 38,696 93,641
- 34 -
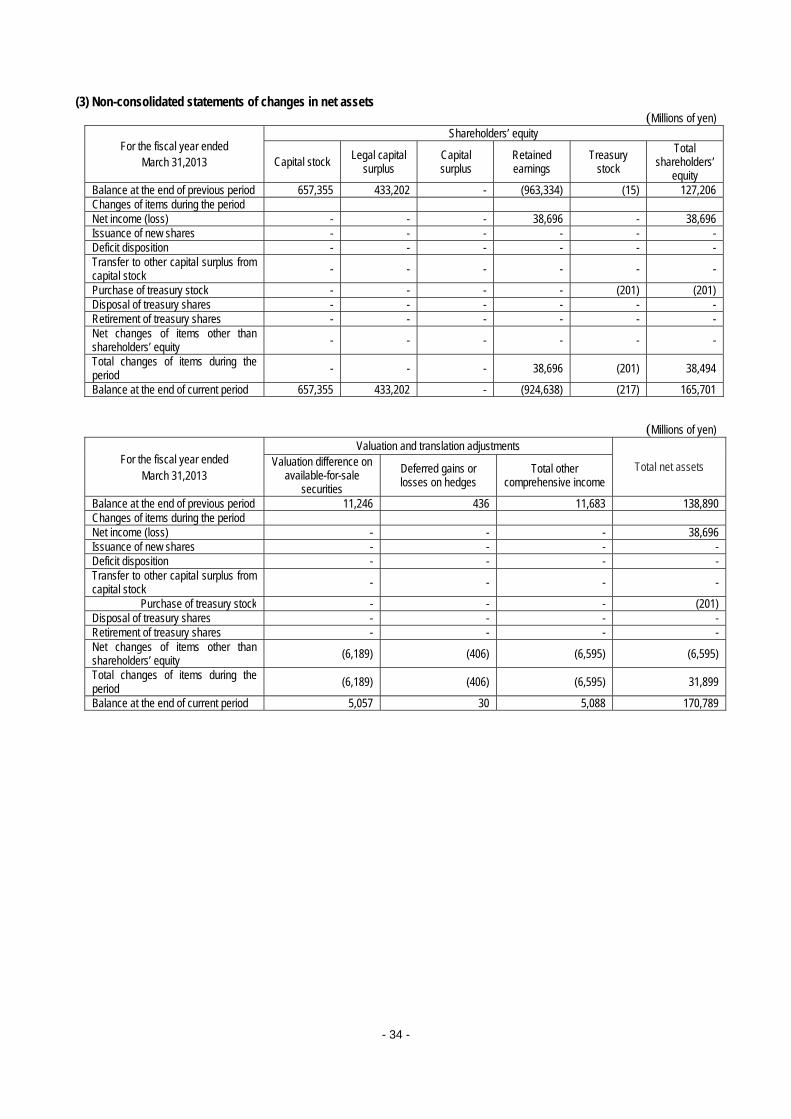
(3) Non-consolidated statements of changes in net assets (Millions of yen)
For the fiscal year ended March 31,2013
Shareholders’ equity
Capital stock Legal capital
surplus Capital surplus
Retained earnings
Treasury stock
Total shareholders’
equity Balance at the end of previous period 657,355 433,202 - (963,334) (15) 127,206 Changes of items during the period Net income (loss) - - - 38,696 - 38,696 Issuance of new shares - - - - - - Deficit disposition - - - - - - Transfer to other capital surplus from capital stock - - - - - -
Purchase of treasury stock - - - - (201) (201) Disposal of treasury shares - - - - - - Retirement of treasury shares - - - - - - Net changes of items other than shareholders’ equity - - - - - -
Total changes of items during the period - - - 38,696 (201) 38,494
Balance at the end of current period 657,355 433,202 - (924,638) (217) 165,701
(Millions of yen)
For the fiscal year ended March 31,2013
Valuation and translation adjustments
Total net assets Valuation difference on available-for-sale
securities
Deferred gains or losses on hedges
Total other comprehensive income
Balance at the end of previous period 11,246 436 11,683 138,890 Changes of items during the period Net income (loss) - - - 38,696 Issuance of new shares - - - - Deficit disposition - - - - Transfer to other capital surplus from capital stock - - - -
Purchase of treasury stock - - - (201) Disposal of treasury shares - - - - Retirement of treasury shares - - - - Net changes of items other than shareholders’ equity (6,189) (406) (6,595) (6,595)
Total changes of items during the period (6,189) (406) (6,595) 31,899
Balance at the end of current period 5,057 30 5,088 170,789
- 35 -
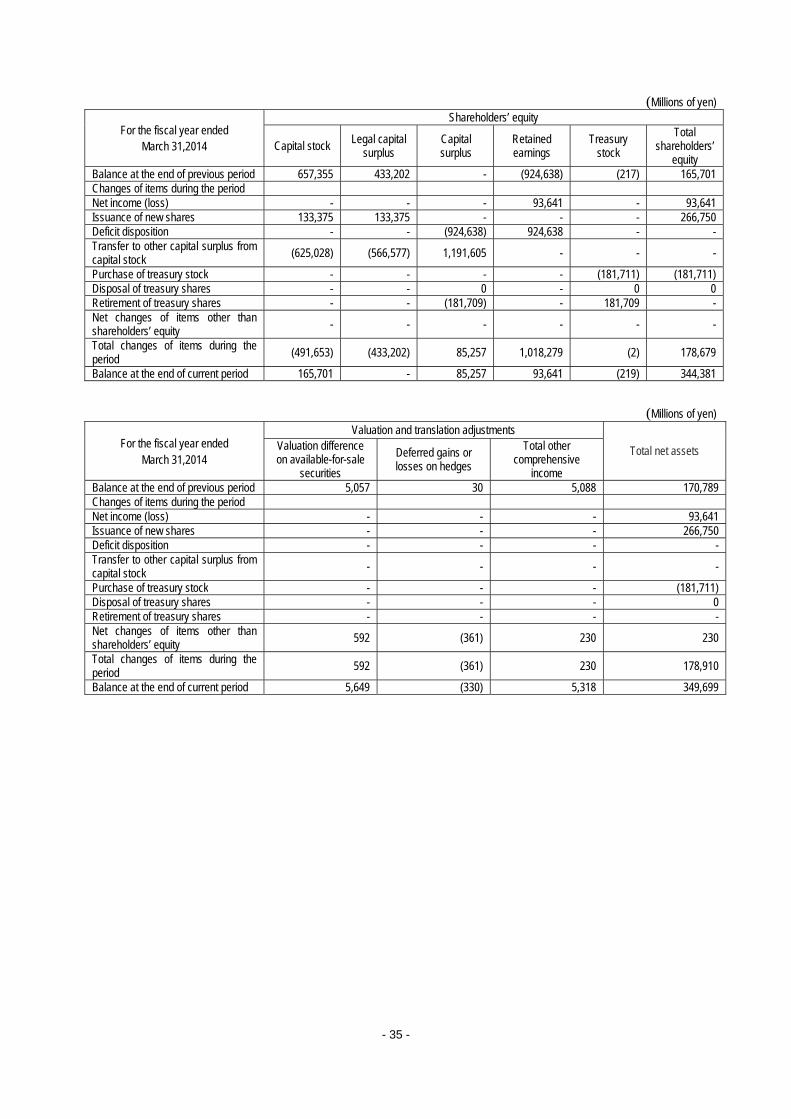
(Millions of yen)
For the fiscal year ended March 31,2014
Shareholders’ equity
Capital stock Legal capital
surplus Capital surplus
Retained earnings
Treasury stock
Total shareholders’
equity Balance at the end of previous period 657,355 433,202 - (924,638) (217) 165,701 Changes of items during the period Net income (loss) - - - 93,641 - 93,641 Issuance of new shares 133,375 133,375 - - - 266,750Deficit disposition - - (924,638) 924,638 - - Transfer to other capital surplus from capital stock (625,028) (566,577) 1,191,605 - - -
Purchase of treasury stock - - - - (181,711) (181,711) Disposal of treasury shares - - 0 - 0 0Retirement of treasury shares - - (181,709) - 181,709 -Net changes of items other than shareholders’ equity - - - - - -
Total changes of items during the period (491,653) (433,202) 85,257 1,018,279 (2) 178,679
Balance at the end of current period 165,701 - 85,257 93,641 (219) 344,381
(Millions of yen)
For the fiscal year ended March 31,2014
Valuation and translation adjustments
Total net assets Valuation difference on available-for-sale
securities
Deferred gains or losses on hedges
Total other comprehensive
income Balance at the end of previous period 5,057 30 5,088 170,789 Changes of items during the period Net income (loss) - - - 93,641 Issuance of new shares - - - 266,750Deficit disposition - - - - Transfer to other capital surplus from capital stock - - - -
Purchase of treasury stock - - - (181,711) Disposal of treasury shares - - - 0Retirement of treasury shares - - - - Net changes of items other than shareholders’ equity 592 (361) 230 230
Total changes of items during the period 592 (361) 230 178,910
Balance at the end of current period 5,649 (330) 5,318 349,699

- 36 -
Notes on premise of going concern: There is no item to be reported.