FY2008 Consolidated Financial Results For the Year Ended ...
Mitsui & Co., Ltd. and subsidiaries
(Web Site : http://www.mitsui.com/jp/en/)
President and Chief Executive Officer : Tatsuo Yasunaga
Investor Relations Contacts : Yuji Mano, General Manager, Investor Relations Division TEL 81-3-3285-7533
1. Consolidated financial results
(1) Consolidated operating results information for the year ended March 31, 2018
(from April 1, 2017 to March 31, 2018)
Note:
(2) Consolidated financial position information
(3) Consolidated cash flow information
△ 8.3
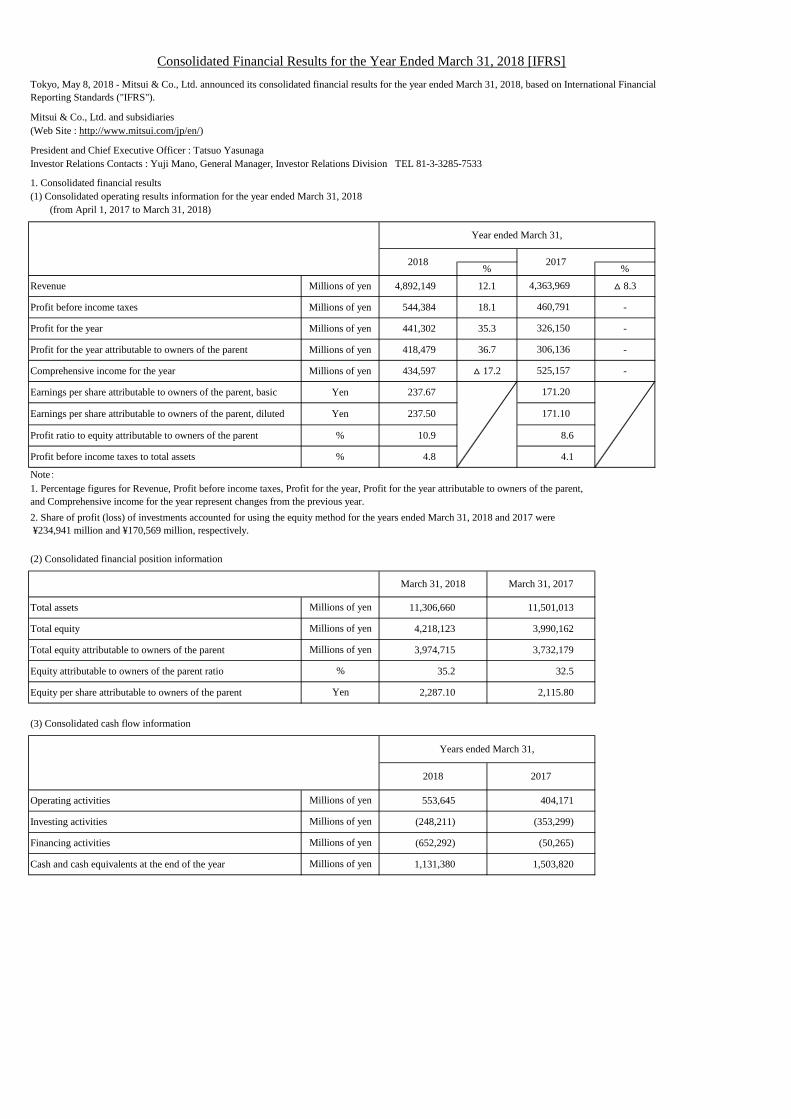
Consolidated Financial Results for the Year Ended March 31, 2018 [IFRS]
Tokyo, May 8, 2018 - Mitsui & Co., Ltd. announced its consolidated financial results for the year ended March 31, 2018, based on International Financial
Reporting Standards ("IFRS").
Year ended March 31,
2018 2017% %
Revenue Millions of yen 4,892,149 12.1 4,363,969
-
Profit before income taxes Millions of yen 544,384 18.1 460,791 -
Profit for the year Millions of yen 441,302 35.3 326,150
-
Profit for the year attributable to owners of the parent Millions of yen 418,479 36.7 306,136 -
Comprehensive income for the year Millions of yen 434,597 △ 17.2 525,157
Profit ratio to equity attributable to owners of the parent % 10.9 8.6
Profit before income taxes to total assets % 4.8 4.1
Earnings per share attributable to owners of the parent, diluted Yen
Total equity attributable to owners of the parent Millions of yen 3,974,715 3,732,179
1. Percentage figures for Revenue, Profit before income taxes, Profit for the year, Profit for the year attributable to owners of the parent,
and Comprehensive income for the year represent changes from the previous year.
March 31, 2018 March 31, 2017
Total assets Millions of yen 11,306,660 11,501,013
2. Share of profit (loss) of investments accounted for using the equity method for the years ended March 31, 2018 and 2017 were
¥234,941 million and ¥170,569 million, respectively.
2018 2017
(652,292)Financing activities Millions of yen (50,265)
Investing activities Millions of yen (353,299)
Years ended March 31,
Operating activities Millions of yen 404,171
237.50 171.10
Earnings per share attributable to owners of the parent, basic Yen 237.67 171.20
Cash and cash equivalents at the end of the year Millions of yen 1,131,380 1,503,820
Equity per share attributable to owners of the parent Yen 2,287.10 2,115.80
(248,211)
553,645
Equity attributable to owners of the parent ratio % 35.2 32.5
Total equity Millions of yen 4,218,123 3,990,162

2. Dividend information
4. Others
(1) Increase/decrease of important subsidiaries during the period : Yes
Excluded: 1 company (MBK Healthcare Partners Limited)
(2) Changes in accounting policies and accounting estimate :
(i) Changes in accounting policies required by IFRS None
(ii) Other changes None
(iii) Changes in accounting estimates Yes
Note :
For further details please refer to page 23 "5. Consolidated Financial Statements (7) Changes in Accounting Estimates".
(3) Number of shares :
This earnings report is not subject to audit.
3. Forecast of consolidated operating results for the year ending March 31, 2019 (from April 1, 2018 to March 31, 2019)
Year ending
March 31, 2019
Profit attributable to owners of the parent Millions of yen 420,000
Earnings per share attributable to owners of the parent, basic Yen 241.67
March 31, 2018 March 31, 2017
Number of shares of common stock issued, including treasury stock 1,796,514,127 1,796,514,127
Number of shares of treasury stock 58,632,655 32,558,297
Year ended
March 31, 2018
Year ended
March 31, 2017
Average number of shares of common stock outstanding 1,760,728,440 1,788,165,778
Supplementary materials and IR meetings on financial results:
Supplementary materials on financial results can be found on our web site.
We will hold an IR meeting on financial results for analysts and institutional investors on May 9, 2018.
Contents of the meeting (English and Japanese) will be posted on our web site immediately after the meeting.
A Cautionary Note on Forward-Looking Statements:
This report contains forward-looking statements including those concerning future performance of Mitsui & Co., Ltd. ("Mitsui"), and those
statements are based on Mitsui's current assumptions, expectations and beliefs in light of the information currently possessed by it. Various factors
may cause Mitsui's actual results to be materially different from any future performance expressed or implied by these forward-looking statements.
Therefore, these statements do not constitute a guarantee by Mitsui that such future performance will be realized.
For key assumptions on which the statements concerning future performance are based, please refer to (2) "Forecasts for the Year Ending March 31,
2019" on p.13. For cautionary notes with respect to forward-looking statements, please refer to the "Notice" section on p.16.
Years ended March 31, Year ending
March 31,
2019 (Forecast)2018 2017
Interim dividend per share Yen 30 25 35
Year-end dividend per share Yen 40 30 35
Annual dividend per share Yen 70 55 70
Annual dividend (total) Millions of yen 122,439 97,741
Consolidated dividend payout ratio % 29.5 32.1 29.0
Consolidated dividend on equity attributable to owners of the parent % 3.2 2.7

Table of Contents
1. Qualitative Information
(1) Operating Environment……………………………………………………………………...………….….2
(2) Results of Operations………………………………………………………………………………………2
(3) Financial Condition and Cash Flows……………………………………………………………………..8
2. Management Policies
(1) Progress with the Medium-term Management Plan..………………………………………...…………..13
(2) Forecasts for the Year Ending March 31, 2019………..……………………………………...………….13
(3) Profit Distribution Policy………………………………………………………………………………..15
3. Basic Approach on Adoption of Accounting Standards……………………………………………….....15
4. Other Information………………………………………………………………………………………….16
5. Consolidated Financial Statements
(1) Consolidated Statements of Financial Position.........................................................................................17
(2) Consolidated Statements of Income and Comprehensive Income............................................................19
(3) Consolidated Statements of Changes in Equity.........................................................................................20
(4) Consolidated Statements of Cash Flows....................................................................................................21
(5) Assumption for Going Concern.................................................................................................................21
(6) Basis of Consolidated Financial Statements.............................................................................................22
(7) Changes in Accounting Estimates..............................................................................................................23
(8) Notes to Consolidated Financial Statements............................................................................................24
1

1. Qualitative Information
As of the date of disclosure of this earnings report, the audit procedures for consolidated financial statements
have not been completed.
(1) Operating Environment
In the year ended March 31, 2018, the global economy saw ongoing gradual growth in both developed
countries and emerging countries supported by firm spending and investment.
In the U.S., consumer spending continues to be resilient supported by a favorable environment for
employment and employee income. At the same time, tax reform is expected to drive capital investment. As
such, economic recovery is expected to continue for the time being. In Europe, though the economy has been
resilient following growth in spending and investment, this growth is expected to weaken going forward as
corporate business confidence plateaus. In Japan, gradual economic recovery is expected to continue as a
result of consumer spending continuing to be resilient following improvement in the employment
environment, and because of increases in both investment related to the Olympic and Paralympic Games,
and in capital investment focused on labor-saving initiatives. In emerging countries, while stable growth
continues in China, this growth is expected to weaken following an environment of excess capacity and
adjustments of debts. At the same time, future growth is expected in India due to the progress of economic
reform such as the introduction of the Goods and Services Tax. Also, the trend of gradual recovery is
expected to continue in Brazil with consumption and investment picking up. However, limited growth is
expected to continue in Russia due in part to ongoing sanctions from the U.S. and other nations.
The global economy is expected to follow a trend of gentle recovery going forward. However, careful watch
continues to be needed on the escalation of geopolitical risk surrounding the Middle East, the future
prospects for the European and U.S. economies, which have shown signs of maturity in some parts, the
impact of the Federal Reserve Board’s monetary tightening on the economies of emerging countries, and
trends in U.S. trade policy.
(2) Results of Operations
1) Analysis of Consolidated Income Statements
(Billions of Yen) Current Year Previous Year Change
Revenue 4,892.1 4,364.0 +528.1
Gross profit 790.7 719.3 +71.4
Selling, general and administrative expenses (571.7) (539.0) (32.7)
Other Income
(Expenses)
Gain (Loss) on Securities and Other
Investments—Net 55.1 65.0 (9.9)
Impairment Reversal (Loss) of
Fixed Assets—Net (25.5) (5.7) (19.8)
Gain (Loss) on Disposal or Sales of
Fixed Assets—Net 15.1 11.0 +4.1
Other Income (Expense)—Net 15.8 9.9 +5.9
Provision Related to Multigrain Business (25.0) - (25.0)
Finance Income
(Costs)
Interest Income 36.5 34.9 +1.6
Dividend Income 84.8 51.9 +32.9
Interest Expense (66.5) (57.0) (9.5)
Share of Profit (Loss) of Investments Accounted for
Using the Equity Method 234.9 170.6 +64.3
Income Taxes (103.1) (134.6) + 31.5
Profit for the Year 441.3 326.2 +115.1
Profit for the Year Attributable to Owners of the Parent 418.5 306.1 +112.4
* May not match with the total of items due to rounding off. The same shall apply hereafter.
2

Revenue
Revenue from sales of products for the year ended March 31, 2018 (“current year”) was ¥4,330.8 billion, an
increase of ¥497.2 billion from the year ended March 31, 2017 (“previous year”), and revenue from
rendering of services for the current year was ¥436.6 billion, an increase of ¥30.7 billion from the previous
year. Furthermore, other revenue for the current year was ¥124.7 billion, an increase of ¥0.2 billion from the
previous year.
Gross Profit
Mainly the Energy Segment and the Mineral & Metal Resources Segment reported an increase in gross
profit, while the Chemicals Segment recorded a decline.
Other Income (Expenses)
Gain (Loss) on Securities and Other Investments—Net
For the current year, a gain on securities was recorded in the Mineral & Metal Resources Segment, while a
gain and a loss on securities were recorded in the Machinery & Infrastructure Segment. Furthermore, losses
on securities were recorded in the Lifestyle Segment and the Innovation & Corporate Development Segment.
For the previous year, gains on securities were recorded in the Mineral & Metal Resources Segment, the
Lifestyle Segment, the Machinery & Infrastructure Segment and the Innovation & Corporate Development
Segment.
Impairment Reversal (Loss) of Fixed Assets—Net
For the current year, an impairment loss on fixed assets was recorded in the Lifestyle Segment and the
Machinery & Infrastructure Segment.
Gain (Loss) on Disposal or Sales of Fixed Assets—Net
For the current year, a gain on disposal of fixed assets was recorded in the Lifestyle Segment and the
Innovation & Corporate Development Segment. For the previous year, a gain on disposal of fixed assets was
recorded in the Lifestyle Segment.
Other Income (Expense)—Net
The Iron & Steel Products Segment recorded a valuation profit on the derivative in relation to a price
adjustment clause for an investment in an equity accounted investee and exploration expenses declined
mainly in the Energy Segment.
Provision Related to Multigrain Business
The Lifestyle Segment recorded a provision related to Multigrain business due to the deterioration of the
business environment.
Finance Income (Costs)
Dividend Income
Mainly the Energy Segment and the Mineral & Metal Resources Segment reported an increase.
Share of Profit (Loss) of Investments Accounted for Using the Equity Method
Mainly the Machinery & Infrastructure Segment, the Mineral & Metal Resources Segment and the Energy
Segment recorded an increase.
3

Income Taxes
For the current year, deferred tax liabilities on the investment into Valepar S.A. were reversed.
Furthermore, deferred tax liabilities on equity accounted investments were reversed upon receiving
dividends from those investees, and deferred tax liabilities were reversed due to the U.S. tax reform. On the
other hand, income taxes for the current year increased as profit before income taxes for the current year
increased by ¥83.6 billion, and deferred tax assets on equity accounted investments as well as Multigrain
Trading AG were reversed.
The effective tax rate for the current year was 18.9%, a decline of 10.3% from 29.2% for the previous year.
The aforementioned reversal of deferred tax liabilities resulted in the decline, while the reversal of deferred
tax assets caused an increase.
Profit for the Year Attributable to Owners of the Parent
Profit for the year attributable to owners of the parent was ¥418.5 billion, an increase of ¥112.4 billion from
the previous year.
2) Operating Results by Operating Segment
Effective April 1, 2017, the region-focused reporting segments were aggregated into product-focused
reporting segments, and the allocation of overhead costs and income taxes to reporting segments was
changed. In accordance with the aforementioned changes, the operating segment information for the
previous year has been restated to conform to the operating segments as of April 2017.
Iron & Steel Products Segment
(Billions of Yen) Current Year Previous Year Change
Profit for the year attributable to owners of the parent 24.7 10.9 +13.8
Gross profit 41.9 36.7 +5.2
Profit (loss) of equity method investments 13.3 11.1 +2.2
Dividend income 2.5 2.8 (0.3)
Selling, general and administrative expenses (32.1) (35.0) +2.9
Others (0.9) (4.7) +3.8
The following factors mainly affected results:
For the current year, a valuation profit on the derivative of ¥4.8 billion was recorded in relation to a
price adjustment clause for the investment in Gestamp Automoción S.A.
For the current year, Game Changer Holdings reported a gain of ¥3.5 billion due to a reversal of
deferred tax liability upon the U.S. tax reform.
Mineral & Metal Resources Segment
(Billions of Yen) Current Year Previous Year Change
Profit for the year attributable to owners of the parent 257.6 144.3 +113.3
Gross profit 206.8 176.8 +30.0
Profit (loss) of equity method investments 61.8 48.5 +13.3
Dividend income 16.4 2.0 +14.4
Selling, general and administrative expenses (44.4) (31.8) (12.6)
Others 17.0 (51.2) +68.2
Gross profit increased mainly due to the following factors:
Iron ore mining operations in Australia reported an increase of ¥13.6 billion due to higher iron ore
prices.
4

Coal mining operations in Australia reported an increase of ¥12.3 billion due to higher coal prices.
Profit (loss) of equity method investments increased mainly due to the following factors:
Inversiones Mineras Acrux SpA, a copper mining company in Chile, reported an increase of ¥11.7
billion mainly due to a reversal effect of impairment loss for the previous year, its reversal for the
current year and higher copper prices.
Compañía Minera Doña Inés de Collahuasi, a copper mining company in Chile, reported an increase
of ¥5.1 billion mainly due to higher copper prices.
Valepar S.A. declined by ¥9.6 billion mainly due to the incorporation by Vale S.A. in the three
month period ended September 30, 2017.
For the current year, a dividend from Vale S.A. of ¥8.7 billion was recorded.
In addition to the above, the following factors also affected results:
Following the incorporation of Valepar S.A. by Vale S.A., the Mineral & Metal Resources Business
Unit reported a gain on securities of ¥56.3 billion and the reversal of deferred tax liability of ¥35.2
billion for the taxable temporary differences on the investment in Valepar S.A.
For the current year, following the dividend received from Inner Mongolia Erdos Electric Power &
Metallurgical Ltd, the reversal of deferred tax liability for the taxable temporary differences on the
equity accounted investment was reported.
For the previous year, as a result of the deconsolidation of Sims Metal Management from an equity
accounted investee, a profit of ¥26.9 billion on securities was recorded.
For the current year, a provision of ¥14.7 billion for doubtful debt and an impairment loss on an
equity accounted investment of ¥3.9 billion were posted, reflecting the revisions to our various
assumptions regarding SCM Minera Lumina Copper Chile, the project company for the Caserones
Copper Mine.
Machinery & Infrastructure Segment
(Billions of Yen) Current Year Previous Year Change
Profit for the year attributable to owners of the parent 89.6 66.8 +22.8
Gross profit 121.9 114.5 +7.4
Profit (loss) of equity method investments 96.5 64.3 +32.2
Dividend income 3.4 3.0 +0.4
Selling, general and administrative expenses (121.5) (115.9) (5.6)
Others (10.7) 0.9 (11.6)
Gross profit increased mainly due to the following factor:
Mitsui & Co. Plant Systems, Ltd. reported an increase of ¥3.4 billion reflecting a higher volume of
sales in the electricity business.
Profit (loss) of equity method investments increased mainly due to the following factors:
IPP businesses recorded an increase of ¥37.8 billion.
- For the current year, ¥20.3 billion in gains on the sales of interests in the UK IPP business were
recorded.
- For the previous year, impairment loss on the intangible asset has been recorded in relation to
previously purchased IPP business.
- For the previous year, a loss in relation to closure of a power plant in Australia was recorded.
- Mark-to-market valuation losses, such as those on long-term derivative contracts, were
improved by ¥2.6 billion to ¥0.6 billion from a ¥2.0 billion loss for the previous year.
- The IPP business in Indonesia recorded a decline of tax burden due to the Indonesian tax reform
for the previous year, while it recorded a ¥3.9 billion gain due to its refinance for the current
year.
Penske Automotive Group, Inc. recorded an increase of ¥4.8 billion mainly due to the U.S. tax
reform.
5

For the current year, a loss was recorded at an equity accounted investee due to an anticipated
deterioration of an overseas project.
For the current year, reserves of ¥5.1 billion for financing projects in Latin America were recorded.
For the current year, a loss was recorded due to an impairment loss incurred for the overseas rail
business.
In addition to the above, the following factors also affected results:
For the previous year, a gain of ¥5.8 billion due to sale of the wind power generation business in
Australia was recorded.
For the previous year, other income was recorded due to receipt of adjustment fees in relation to the
purchase price of an IPP business.
For the current year, an impairment loss of ¥5.4 billion on fixed assets was recorded in relation to
container terminal development and operation.
For the previous year, a gain on sale of a stake in relation to the aviation business of ¥4.1 billion was
reported.
For the current year, a financing subsidiary of the IPP business in Indonesia recorded a loss of ¥4.1
billion due to the refinance.
For the current year, a holding company for UK IPP business recorded a valuation loss of ¥3.5
billion on securities, following the sale of interests.
For the current year, following the dividend received from the IPP project, the reversal of deferred
tax liability for the taxable temporary differences on the equity accounted investment was reported.
For the current year, a gain on a partial sale of an equity accounted investment was recorded.
Chemicals Segment
(Billions of Yen) Current Year Previous Year Change
Profit for the year attributable to owners of the parent 34.2 32.7 + 1.5
Gross profit 136.6 145.6 (9.0)
Profit (loss) of equity method investments 11.3 3.9 +7.4
Dividend income 2.3 1.9 +0.4
Selling, general and administrative expenses (96.6) (93.5) (3.1)
Others (19.4) (25.2) +5.8
Gross profit declined mainly due to the following factor:
Novus International, Inc. reported a decline of ¥16.9 billion mainly due to lower methionine
prices.
In addition to the above, the following factor also affected results:
For the current year, Intercontinental Terminals Company LLC reported a gain of ¥8.4 billion due
to a reversal of deferred tax liabilities upon the U.S. tax reform.
Energy Segment
(Billions of Yen) Current Year Previous Year Change
Profit for the year attributable to owners of the parent 48.6 31.7 +16.9
Gross profit 96.8 63.9 +32.9
Profit (loss) of equity method investments 24.5 17.1 +7.4
Dividend income 51.9 32.6 +19.3
Selling, general and administrative expenses (42.1) (43.1) +1.0
Others (82.5) (38.8) (43.7)
Gross profit increased mainly due to the following factors:
Mitsui Oil Exploration Co., Ltd. recorded an increase of ¥17.1 billion mainly due to a decrease in
costs and the effect of foreign currency fluctuation.
6

Mitsui E&P USA LLC reported an increase of ¥9.7 billion mainly due to higher gas prices and an
increase in production.
MEP Texas Holdings LLC reported an increase of ¥4.9 billion mainly due to higher crude oil
prices.
Mitsui E&P Middle East B.V. reported an increase of ¥4.5 billion mainly due to higher crude oil
prices and an increase in production.
Mitsui E&P Australia Pty Ltd reported an increase of ¥4.4 billion mainly due to higher crude oil
prices.
Westport Petroleum Inc. reported a decrease of ¥3.7 billion from its trading operations.
Profit of equity method investment increased mainly due to the following factor:
Japan Australia LNG (MIMI) Pty. Ltd. reported an increase due to higher crude oil prices.
Dividends from six LNG projects (Sakhalin II, Qatargas 1, Abu Dhabi, Oman, Qatargas 3 and
Equatorial Guinea) were ¥50.1 billion in total, an increase of ¥19.7 billion from the previous year.
In addition to the above, the following factors also affected results:
For the current year, MEPUS Holdings LLC, a holding company of U.S. shale gas and oil
production business, reported a loss of ¥14.9 billion due to a reversal of deferred tax assets
following the U.S. tax reform.
For the current year, exploration expenses of ¥7.0 billion in total were recorded, including those
recorded by Mitsui Oil Exploration Co., Ltd. For the previous year, exploration expenses of ¥7.5
billion in total were recorded, including those recorded by Mitsui Oil Exploration Co., Ltd.
Lifestyle Segment
(Billions of Yen) Current Year Previous Year Change
Profit (Loss) for the year attributable to owners of the parent (26.3) 25.4 (51.7)
Gross profit 139.5 136.2 +3.3
Profit (loss) of equity method investments 22.8 24.1 (1.3)
Dividend income 4.3 4.3 0.0
Selling, general and administrative expenses (153.0) (139.5) (13.5)
Others (39.9) 0.3 (40.2)
Gross profit increased mainly due to the following factors:
XINGU AGRI AG reported an increase of ¥4.0 billion mainly due to the reversal effect of the
drought in the previous year.
Multigrain Trading AG reported a decline of ¥4.2 billion mainly due to the poor performance of the
origination and merchandising business.
Profit (loss) of equity method investments declined mainly due to the following factors:
Ventura Foods LLC reported a decline of ¥3.9 billion mainly due to the poor performance of the
edible oil products business.
Panasonic Healthcare Holdings Co., Ltd. (now called PHC Holdings Corporation) reported an
increase as a new contributor.
In addition to the above, the following factors also affected results:
For the current year, Multigrain Trading AG recorded a provision of ¥25.5 billion due to the
deterioration of the business environment, tax expenses of ¥8.6 billion mainly resulting from the
reversal of deferred tax assets and losses of ¥4.1billion mainly related to asset impairments.
For the previous year, a ¥14.6 billion gain on sale of shares was recorded due to the partial sale of
shares in IHH Healthcare Berhad.
For the current year, XINGU AGRI AG recorded an impairment loss on fixed assets of ¥11.3
billion due to a decline in the value of land.
7

For the current year, MBK Healthcare Network Ltd. recorded an impairment loss on securities of
¥5.9 billion due to the revision of the future business plan for DaVita Care Pte. Ltd., in which MBK
Healthcare Network Ltd. invested.
For the current year, the Lifestyle Segment recorded a gain on the reversal of deferred tax liability
of ¥8.3 billion due to the liquidation of MBK Healthcare Partners Limited, which held IHH
Healthcare Berhad.
For the current year, Mitsui & Co. Real Estate Ltd. recorded a gain on the sales of buildings in
Japan.
Innovation & Corporate Development Segment
(Billions of Yen) Current Year Previous Year Change
Profit (Loss) for the year attributable to owners of the parent (4.6) 11.0 (15.6)
Gross profit 45.1 45.0 +0.1
Profit (loss) of equity method investments 5.0 2.1 +2.9
Dividend income 2.7 4.1 (1.4)
Selling, general and administrative expenses (50.8) (50.2) (0.6)
Others (6.6) 10.0 (16.6)
Gross profit increased mainly due to the following factors:
A ¥4.5 billion gain was recorded due to the valuation gains of fair value on shares for the current
year in Hutchison China MediTech Ltd.
For the current year, a gain was recorded due to the valuation gains of fair value on shares in a
Japanese company.
For the current year, a ¥6.0 billion loss was recorded due to the valuation losses of fair value on
shares of a high speed mobile data network operator in developing countries.
In addition to the above, the following factors also affected results:
For the previous year, a profit of ¥4.8 billion on securities of Hutchison China MediTech Ltd was
recorded.
A decline of ¥3.8 billion was recorded at an equity accounted investee due to an anticipated
deterioration in relation to an investment.
For the current year, a loss of ¥3.1 billion on securities of Naaptol Online Shopping Pvt. Ltd. was
recorded.
For the current year, a gain on the sales of warehouses in Japan was recorded.
(3) Financial Condition and Cash Flows
1) Financial Condition
(Billions of yen) March 31, 2018 March 31, 2017 Change
Total Assets 11,306.7 11,501.0 (194.3)
Current Assets 4,226.2 4,474.7 (248.5)
Non-current Assets 7,080.5 7,026.3 +54.2
Current Liabilities 2,698.8 2,524.0 +174.8
Non-current Liabilities 4,389.8 4,986.9 (597.1)
Net Interest-bearing Debt 3,089.2 3,282.1 (192.9)
Total Equity Attributable to Owners of the Parent 3,974.7 3,732.2 +242.5
Net Debt-to-Equity Ratio (times) 0.78 0.88 (0.10)
8

Assets
Current Assets:
Cash and cash equivalents declined by ¥372.4 billion, mainly due to repayment of debt.
Trade and other receivables increased by ¥26.6 billion, mainly because trading volume increased in the
Energy Segment, prices and trading volume increased and March 31, 2018 fell under the financial
institutions’ holiday in the Chemical Segment, despite the decrease due to the transfer to Assets held for
sale.
Advance payments to suppliers increased by ¥81.9 billion, mainly due to an increase in trading volume
in the Machinery & Infrastructure Segment.
Assets held for sale increased by ¥108.9 billion, because assets expected to be transferred from Mitsui
and Mitsui & Co. Steel Ltd. to NIPPON STEEL & SUMIKIN BUSSAN CORPORATION are
presented as a single line item as of March 31, 2018.
Non-current Assets:
Investments accounted for using the equity method declined by ¥238.7 billion, mainly due to the
following factors:
A decline of ¥250.8 billion corresponding to the incorporation of Valepar S.A. by Vale S.A.;
A decline of ¥73.6 billion resulting from foreign currency exchange fluctuations;
An increase of ¥234.9 billion corresponding to the profit of equity method investments for the
current year, despite a decline of ¥285.9 billion due to dividends received from equity accounted
investees;
An increase of ¥48.3 billion due to an additional acquisition of a stake in Penske Truck Leasing
Co., L.P., which is engaged in truck leasing and rental business in North America;
An increase of ¥16.9 billion due to an investment in Cameron LNG Holdings, LLC, which is
engaged in the natural gas liquefaction business in the U.S.; and
An increase of ¥15.1 billion due to an additional acquisition of a stake in International Columbia
U.S. LLC, the holding company for Asia’s largest hospital group for middle-income patients.
Other investments increased by ¥487.8 billion, mainly due to the following factors:
An increase of ¥307.1 billion corresponding to the incorporation of Valepar S.A. by Vale S.A.;
Fair value on financial assets measured at FVTOCI increased by ¥159.5 billion mainly due to
higher share prices;
An increase of ¥14.2 billion due to an investment in the Russian pharmaceutical company JSC R-
Pharm; and
An increase of ¥10.2 billion due to an additional acquisition of shares in NIPPON STEEL &
SUMIKIN BUSSAN CORPORATION.
Trade and other receivables (Non-Current) declined by ¥77.0 billion, mainly due to the following
factors:
A decline of ¥28.0 billion due to collection of loan to the IPP business in Indonesia;
A decline of ¥19.4 billion due to collection of loan to SUMIC Nickel Netherlands, an investment
company for overseas Nickel businesses;
A decline of ¥16.9 billion mainly due to reclassification of partial subsidiaries under Mitsui Rail
Capital Participações Ltda., the holding company for freightcar leasing and management business
in Brazil, to equity accounted investees;
A decline of ¥13.6 billion due to recording allowance for doubtful receivables against the loan to
SCM Minera Lumina Copper Chile, the project company for the Caserones Copper Mine;
An increase of ¥19.3 billion due to execution of loan to Gestamp Automoción S.A’s North
American operations; and
An increase of ¥13.4 billion due to execution of loan to the offshore energy business.
Property, plant and equipment declined by ¥93.6 billion, mainly due to the following factors:
A decline of ¥34.0 billion at U.S. shale gas and oil producing operations mainly due to partial sale
9

of interest in the Marcellus Shale Gas Project (including a foreign exchange translation loss of ¥8.1
billion);
A decline of ¥30.5 billion (including a foreign exchange translation loss of ¥16.3 billion) at iron ore
mining operations in Australia;
A decline of ¥30.1 billion (including a foreign exchange translation loss of ¥15.3 billion) at oil and
gas operations other than U.S. shale gas and oil producing operations; and
An increase of ¥10.5 billion for the integrated development project in the 2, Ohtemachi 1-Chome
District.
Investment property increased by ¥9.2 billion, mainly due to an increase of ¥13.8 billion for the
integrated development project in the 2, Ohtemachi 1-Chome District.
Deferred tax assets declined by ¥43.1 billion, mainly due to a reduction in the corporate tax rate
following the U.S. tax reform.
Liabilities
Current Liabilities:
Short-term debt declined by ¥103.0 billion, mainly due to repayment of debt. Meanwhile, the current
portion of long-term debt increased by ¥94.3 billion, mainly due to reclassification to current maturities,
despite repayment of debt.
Trade and other payables increased by ¥60.6 billion, corresponding to the increase in trade and other
receivables. Furthermore, advances from customers increased by ¥75.7 billion, corresponding to the
increase in advance payments to suppliers.
Liabilities directly associated with assets held for sale increased by ¥40.3 billion, because liabilities
expected to be transferred from Mitsui and Mitsui & Co. Steel Ltd. to NIPPON STEEL & SUMIKIN
BUSSAN CORPORATION are presented as a single line item as of March 31, 2018.
Non-current Liabilities:
Long-term debt, less the current portion, declined by ¥565.9 billion, mainly due to reclassification to
current maturities, repayment of debt and reclassification of partial subsidiaries under Mitsui Rail
Capital Participações Ltda., the holding company for freightcar leasing and management in Brazil, to
equity accounted investees.
Provisions increased by ¥3.9 billion, mainly due to recording of a provision related to Multigrain
business, despite the decrease of the asset retirement obligation by ¥19.0 billion at oil and gas
operations other than U.S. shale gas and oil producing operations.
Deferred tax liabilities declined by ¥14.4 billion, mainly due to the reversal of deferred tax liability for
the retained earnings of Valepar S.A. corresponding to the incorporation of Valepar S.A. by Vale S.A.,
the reversal of deferred tax liability on undistributed profits corresponding to receipt of dividends from
the equity accounted investees which are engaged in the IPP business, and a reduction in the corporate
tax rate following the U.S. tax reform, despite the increase in financial assets measured at FVTOCI
corresponding to higher share prices.
Total Equity Attributable to Owners of the Parent
Capital surplus declined by ¥23.3 billion mainly due to the decrease corresponding to an additional
acquisition of a stake in Japan Collahuasi Resources, the holding company for Compañía Minera Doña
Inés de Collahuasi, which is a copper mining company in Chile.
Retained earnings increased by ¥353.3 billion.
Other components of equity declined by ¥37.4 billion, mainly due to the following factors:
Financial assets measured at FVTOCI increased by ¥102.8 billion, mainly due to higher share
prices.
Foreign currency translation adjustments declined by ¥146.6 billion, mainly reflecting the
appreciation of the Japanese yen against the U.S. dollar, the Australian dollar, and the Brazilian
10

real.
Treasury stock which is a subtraction item in shareholders’ equity increased by ¥50.0 billion, due to
share buy-back.
Non-controlling interests declined by ¥14.6 billion, mainly due to an additional acquisition of a stake in
Japan Collahuasi Resources, the holding company for Compañía Minera Doña Inés de Collahuasi
which is a copper mining company in Chile.
2) Cash Flows
(Billions of yen) Current Year Previous Year Change
Cash flows from operating activities 553.6 404.2 +149.4
Cash flows from investing activities (248.2) (353.3) +105.1
Free cash flow 305.4 50.9 +254.5
Cash flows from financing activities (652.3) (50.3) (602.0)
Effect of exchange rate changes on cash and cash
equivalents etc. (25.5) 12.4 (37.9)
Change in cash and cash equivalents (372.4) 13.0 (385.4)
Cash Flows from Operating Activities
(Billions of Yen) Current Year Previous Year Change
Cash flows from operating activities a 553.6 404.2 +149.4
Cash flows from change in working capital b (112.9) (90.6) (22.3)
Core operating cash flow a-b 666.5 494.8 +171.7
Net cash from an increase or a decrease in working capital, or changes in operating assets and liabilities
for the current year was ¥112.9 billion of net cash outflow mainly due to the effects of Other - net. Core
operating cash flow, cash flows from operating activities without the net cash flow from an increase or
a decrease in working capital, for the current year amounted to ¥666.5 billion.
Net cash inflow from dividend income, including dividends received from equity accounted
investees, for the current year totaled ¥376.4 billion, an increase of ¥181.7 billion from ¥194.7
billion for the previous year.
Depreciation and amortization for the current year was ¥192.6 billion, a decline of ¥0.7 billion
from ¥193.3 billion for the previous year.
The following table shows core operating cash flow by operating segment.
(Billions of Yen) Current Year Previous Year Change
Iron & Steel Products 14.2 8.6 +5.6
Mineral & Metal Resources 240.8 202.1 +38.7
Machinery & Infrastructure 158.8 74.4 +84.4
Chemicals 50.2 53.8 (3.6)
Energy 175.3 134.1 +41.2
Lifestyle 7.1 8.4 (1.3)
Innovation & Corporate Development 3.1 6.1 (3.0)
All Other and Adjustments and Eliminations 17.0 7.3 +9.7
Consolidated Total 666.5 494.8 +171.7
Cash Flows from Investing Activities
Net cash outflows that corresponded to investments in equity accounted investees (net of sales of
investments in equity accounted investees) were ¥115.0 billion, mainly due to the following factors:
11

An additional acquisition of a stake in Penske Truck Leasing Co., L.P., which is engaged in the
truck leasing and rental business in North America, for ¥48.3 billion;
An investment in Cameron LNG Holdings, LLC, which is engaged in the natural gas liquefaction
business in the U.S., for ¥16.9 billion;
An investment in CIM Group, LLC for ¥10.1 billion;
A sale of a stake in relation to the water concession business in Czech Republic; and
A partial sale of an equity accounted investment for ¥10.9 billion.
Net cash outflows that corresponded to other investments (net of sales and maturities of other
investments) were ¥23.5 billion, mainly due to the following factors:
An investment in the Russian pharmaceutical company JSC R-Pharm for ¥22.0 billion;
An acquisition of a healthcare staffing project in the U.S. for ¥13.3 billion;
An additional acquisition of shares in NIPPON STEEL & SUMIKIN BUSSAN CORPORATION
for ¥10.2 billion; and
A sale of a stake in Champions Cinco Pipe & Supply LLC, oil and gas well tubular business.
Net cash inflows that corresponded to collections of loan receivables (net of increases in loan
receivables) were ¥25.7 billion, mainly due to the following factors:
Collection of loan to the IPP business in Indonesia for ¥28.0 billion;
Collection of loan to SUMIC Nickel Netherlands, an investment company for overseas Nickel
businesses for ¥19.4 billion;
Collection of loan corresponding to the sales of the interest in UK First Hydro power assets for
¥18.4 billion;
Execution of loan to Gestamp Automoción S.A’s North American operations for ¥19.3 billion;
and
Execution of loan to the offshore energy business for ¥13.4 billion.
Net cash outflows that corresponded to purchases of property, plant, and equipment (net of sales of
those assets) were ¥135.7 billion, mainly due to the following factors:
An expenditure for the oil and gas projects other than the U.S. shale gas and oil projects for a total
of ¥64.1 billion;
An expenditure for iron ore mining operations in Australia for ¥15.0 billion;
An expenditure for coal mining operations in Australia for ¥13.9 billion;
An expenditure for the U.S. shale gas and oil projects for ¥11.5 billion;
An expenditure for the integrated development project in the 2, Ohtemachi 1-Chome District for
¥10.5 billion; and
A partial sale of interest in the Marcellus Shale Gas Project for ¥15.8 billion.
Net cash outflows that corresponded to sales of investment property (net of purchases of investment
property) were ¥8.1 billion, mainly due to the following factors:
An expenditure for the integrated development project in the 2, Ohtemachi 1-Chome District for
¥13.8 billion; and
A sale of buildings in Japan by Mitsui & Co. Real Estate Ltd. for ¥10.5 billion.
Cash Flows from Financing Activities
Net cash outflows from net change in short-term debt and long-term debt were ¥99.0 billion and ¥351.2
billion, respectively, mainly due to the repayment of debt.
The cash outflow from the purchases of treasury stock was ¥50.0 billion.
The cash outflow from payments of cash dividends was ¥105.8 billion.
The cash outflow from transactions with non-controlling interest shareholders was ¥46.2 billion, mainly
due to an additional acquisition of a stake in Japan Collahuasi Resources, the holding company for
Compañía Minera Doña Inés de Collahuasi, which is a copper mining company in Chile.
12

2. Management Policies
(1) Progress with the Medium-term Management Plan
Reference is made to our Presentation Material of Financial Results for the year ended March 31, 2018
“Driving Value Creation Progress on Medium-term Management Plan and FY Mar/2019 Business Plan” on
our web site. Reference is also made to “Driving Value Creation” released on May 9, 2017.
(2) Forecasts for the Year Ending March 31, 2019
1) Forecasts for the year ending March 31, 2019
We assume foreign exchange rates for the year ending March 31, 2019 will be ¥110/US$, ¥85/AU$ and
¥33/BRL, while average foreign exchange rates for the year ended March 31, 2018 were ¥110.70/US$,
¥85.77/AU$ and ¥34.25/BRL. Also, we assume the annual average crude oil price applicable to our financial
results for the year ending March 31, 2019 will be US$61/barrel, up US$7 from the previous year, based on
the assumption that the crude oil price (JCC) will average US$59/barrel throughout the year ending March
31, 2019.
<Assumption>
Exchange rate (JPY/USD)
Crude oil (JCC)
Consolidated oil price
(Billions of yen)
Gross profit 830.0 790.7 39.3
Selling, general and
administrative expenses(560.0) (571.7) 11.7
Gain on investments, fixed assets
and other0.0 35.7 (35.7)
Interest expenses (40.0) (30.0) (10.0)
Dividend income 100.0 84.8 15.2
Profit (loss) of equity method
investments260.0 234.9 25.1
Profit before income taxes 590.0 544.4 45.6
Income taxes (150.0) (103.1) (46.9)
Non-controlling Interests (20.0) (22.8) 2.8
Profit for the year attributable to
owners of the parent420.0 418.5 1.5
Depreciation and amortization 200.0 192.6 7.4
Core operating cash flow 570.0 666.5 (96.5)
Reversal effects of Valepar
reorganization and provision for
Multigrain
Increase in dividend at the Mineral &
Metal Resources Segment
Reversal effects of loss making
businesses
Reversal effects of Valepar
reorganization
Reversal effect of provision for
Caserones
$59/bbl $57/bbl $/bbl $/bbl
$61/bbl $54/bbl $/bbl $/bbl
March 31, 2019
Forecast
March 31, 2018
ResultChange Description
Higher crude oil price
110.00 110.70 0.00 0.00
13
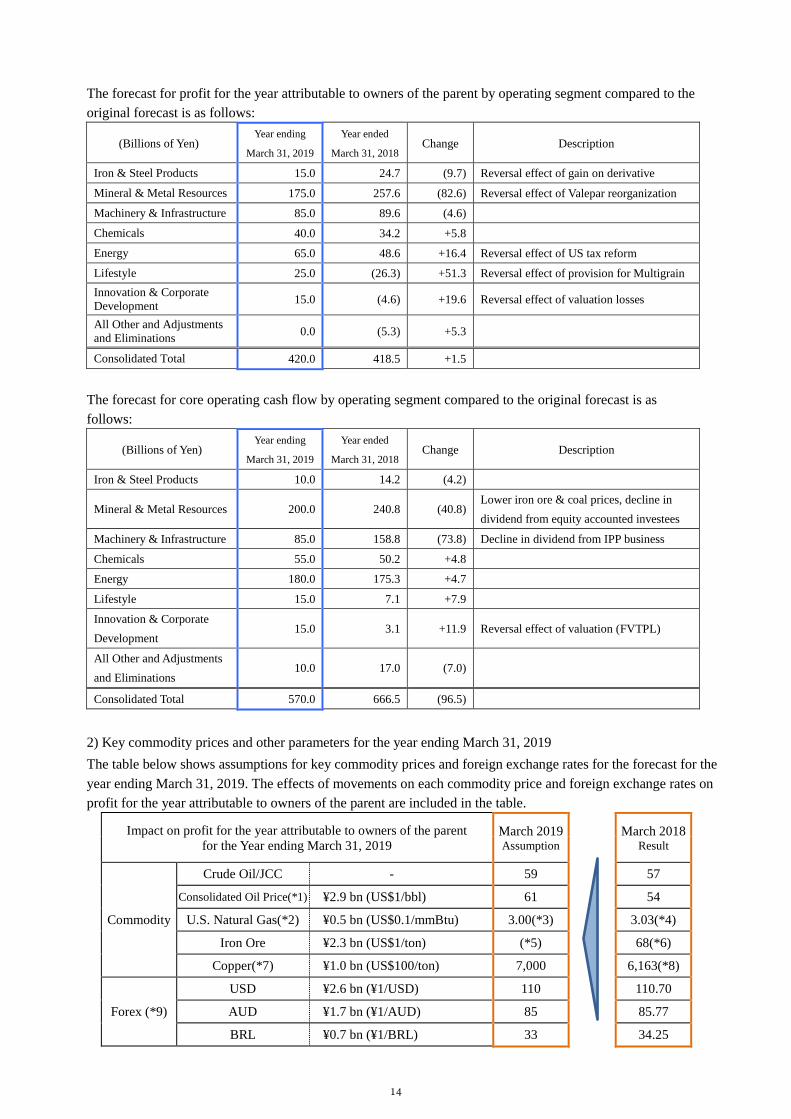
The forecast for profit for the year attributable to owners of the parent by operating segment compared to the
original forecast is as follows:
(Billions of Yen) Year ending
March 31, 2019
Year ended
March 31, 2018 Change Description
Iron & Steel Products 15.0 24.7 (9.7) Reversal effect of gain on derivative
Mineral & Metal Resources 175.0 257.6 (82.6) Reversal effect of Valepar reorganization
Machinery & Infrastructure 85.0 89.6 (4.6)
Chemicals 40.0 34.2 +5.8
Energy 65.0 48.6 +16.4 Reversal effect of US tax reform
Lifestyle 25.0 (26.3) +51.3 Reversal effect of provision for Multigrain
Innovation & Corporate
Development 15.0 (4.6) +19.6 Reversal effect of valuation losses
All Other and Adjustments
and Eliminations 0.0 (5.3) +5.3
Consolidated Total 420.0 418.5 +1.5
The forecast for core operating cash flow by operating segment compared to the original forecast is as
follows:
(Billions of Yen) Year ending
March 31, 2019
Year ended
March 31, 2018 Change Description
Iron & Steel Products 10.0 14.2 (4.2)
Mineral & Metal Resources 200.0 240.8 (40.8) Lower iron ore & coal prices, decline in
dividend from equity accounted investees
Machinery & Infrastructure 85.0 158.8 (73.8) Decline in dividend from IPP business
Chemicals 55.0 50.2 +4.8
Energy 180.0 175.3 +4.7
Lifestyle 15.0 7.1 +7.9
Innovation & Corporate
Development 15.0 3.1 +11.9 Reversal effect of valuation (FVTPL)
All Other and Adjustments
and Eliminations 10.0 17.0 (7.0)
Consolidated Total 570.0 666.5 (96.5)
2) Key commodity prices and other parameters for the year ending March 31, 2019
The table below shows assumptions for key commodity prices and foreign exchange rates for the forecast for the
year ending March 31, 2019. The effects of movements on each commodity price and foreign exchange rates on
profit for the year attributable to owners of the parent are included in the table.
Impact on profit for the year attributable to owners of the parent
for the Year ending March 31, 2019 March 2019 Assumption
March 2018
Result
Commodity
Crude Oil/JCC - 59 57
Consolidated Oil Price(*1) ¥2.9 bn (US$1/bbl) 61 54
U.S. Natural Gas(*2) ¥0.5 bn (US$0.1/mmBtu) 3.00(*3) 3.03(*4)
Iron Ore ¥2.3 bn (US$1/ton) (*5) 68(*6)
Copper(*7) ¥1.0 bn (US$100/ton) 7,000 6,163(*8)
Forex (*9)
USD ¥2.6 bn (¥1/USD) 110 110.70
AUD ¥1.7 bn (¥1/AUD) 85 85.77
BRL ¥0.7 bn (¥1/BRL) 33 34.25
14

(*1) The oil price trend is reflected in profit (loss) for the year attributable to owners of the parent with a 0-6
month time lag. For the year ending March 31, 2018, we assume the annual average price applicable to
our financial results as the Consolidated Oil Price based on the estimation: 4-6 month time lag, 51%; 1-
3 month time lag, 40%; no time lag, 9%. The above sensitivities show impact on annual figures
resulting from changes in consolidated oil price.
(*2) As Mitsui has very limited exposure to U.S. natural gas sold at Henry Hub (HH), the above sensitivities
show impact of changes in the weighted average sale price.
(*3) For natural gas sold in the US on HH linked prices, the assumed price used is US$3.00/mmBtu. (*4) Daily average of settlement price for prompt month Henry Hub Natural Gas Futures contracts reported by
NYMEX during January 2017 to December 2017.
(*5) We refrain from disclosing the iron ore price assumptions. (*6) Daily average of representative reference prices (Fine, Fe 62% CFR North China) during April 2017 to
March 2018.
(*7) As the copper price affects our consolidated results with a 3 month time lag, the above sensitivities
show the impact of US$100/ton change in averages of the LME monthly average cash settlement prices
for the period March to December 2018.
(*8) The LME monthly average cash settlement price during January 2017 to December 2017. (*9) Impact of currency fluctuation on profit (loss) for the year attributable to owners of the parent of overseas
subsidiaries and equity accounted investees (denomination in functional currency) against the Japanese yen.
Impact of currency fluctuation between their functional currencies against revenue currencies and exchange
rate hedging are not included.
(3) Profit Distribution Policy
Our profit distribution policy has been resolved as follows at the board of directors through discussion in which
external directors were also involved:
In order to increase corporate value and maximize shareholder value, we seek to maintain an optimal
balance between (a) meeting investment demand in our core and growth areas through re-investments of
our retained earnings, and (b) directly providing returns to shareholders by paying out cash dividends.
In addition to the above, in relation to share buyback toward improving capital efficiency, we judge that
the decision by the board of directors in a prompt and flexible manner as needed concerning its timing
and amount by taking into consideration of the business environment such as, future investment activity
trends, free cash flow and interest-bearing debt levels, and return on equity, continues to contribute to
enhancement of corporate value.
For the period of the Medium-term Management Plan, we have established a target minimum annual dividend
amount of ¥100 billion, based on our assessment of achievable stable core operating cash flow, with the aim
of ensuring a certain level of return to shareholders regardless of changes in the external environment. While
our principal intention is to steadily increase dividends through improvements in corporate performance, we
will also consider flexible ways to address shareholder compensation, provided that sufficient retained
earnings is secured for future business development.
In accordance with above policy, for the year ended March 31, 2018, we conducted ¥50.0 billion repurchase
of its own shares.
For the year ended March 31, 2018, we plan to pay an annual dividend of ¥70 per share (a ¥15 increase from
the year ended March 31, 2017, and including the interim dividend of ¥30 per share) taking into consideration
of core operating cash flow and profit for the year attributable to owners of the parent as well as stability and
continuity of the amount of dividend.
For the year ending March 31, 2019, we currently envisage an annual dividend of ¥70 per share, the same
amount as the year ended March 31, 2018, taking into consideration of core operating cash flow and profit for
the year attributable to owners of the parent as well as stability and continuity of the amount of dividend.
3. Basic Approach on Adoption of Accounting Standards
International Financial Reporting Standards was adopted on our annual securities report under the Financial
Instruments and Exchange Act for the year ended March 31, 2014 for the purpose of improving international
comparability of financial information as well as enhancement and efficiency of our financial reporting.
15

4. Other Information
Notice:
This flash report contains forward-looking statements about Mitsui and its consolidated subsidiaries. These
forward-looking statements are based on Mitsui’s current assumptions, expectations and beliefs in light of
the information currently possessed by it and involve known and unknown risks, uncertainties and other
factors. Such risks, uncertainties and other factors may cause Mitsui’s actual consolidated financial position,
consolidated operating results or consolidated cash flows to be materially different from any future
consolidated financial position, consolidated operating results or consolidated cash flows expressed or
implied by these forward-looking statements.
These risks, uncertainties and other factors include, among others, (1) economic downturns worldwide or at
specific regions, (2) fluctuations in commodity prices, (3) fluctuations in exchange rates, (4) credit risks
from clients with which Mitsui and its consolidated subsidiaries have business transactions or financial
dealings and/or from various projects, (5) declines in the values of non-current assets, (6) changes in the
financing environment, (7) declines in market value of equity and/or debt securities, (8) changes in the
assessment for recoverability of deferred tax assets, (9) inability to successfully restructure or eliminate
subsidiaries or associated companies as planned, (10) unsuccessful joint ventures and strategic investments,
(11) risks of resource related businesses not developing in line with assumed costs and schedules and
uncertainty in reserves and performance of third party operators, (12) loss of opportunities to enter new
business areas due to limitations on business resources, (13) environmental laws and regulations, (14)
changes in laws and regulations or unilateral changes in contractual terms by governmental entities, (15)
employee misconduct, (16) failure to maintain adequate internal control over financial reporting, and (17)
climate change and natural disaster. For further information on the above, please refer to Mitsui’s Annual
Securities Report.
Forward-looking statements may be included in Mitsui’s Annual Securities Report and Quarterly Securities
Reports or in its other disclosure documents, press releases or website disclosures. Mitsui undertakes no
obligation to publicly update or revise any forward-looking statements.
16

5. Consolidated Financial Statements
(1) Consolidated Statements of Financial Position
(Millions of Yen)
Current Assets:
1,131,380¥ 1,503,820¥
1,766,017 1,739,402
243,915 267,680
550,699 589,539
307,339 225,442
108,920 -
117,886 148,865
4,226,156 4,474,748
Non-current Assets:
2,502,994 2,741,741
1,825,026 1,337,164
400,079 477,103
153,149 145,319
1,729,897 1,823,492
188,953 179,789
173,207 168,677
49,474 92,593
57,725 60,387
7,080,504 7,026,265
Total 11,306,660¥ 11,501,013¥
Deferred tax assets
Other non-current assets
Total non-current assets
Other investments
Trade and other receivables
Other financial assets
Property, plant and equipment
Investment property
Intangible assets
Other current assets
Total current assets
Investments accounted for using the equity method
Assets
March 31,
2018
March 31,
2017
Cash and cash equivalents
Trade and other receivables
Other financial assets
Inventories
Advance payments to suppliers
Assets held for sale
17

(Millions of Yen)
Current Liabilities:
201,556¥ 304,563¥
482,550 388,347
1,264,285 1,203,707
300,284 315,986
62,546 52,177
287,779 212,142
28,036 13,873
Liabilities directly associated with assets held for sale 40,344 -
31,392 33,172
2,698,772 2,523,967
Non-current Liabilities:
3,542,829 4,108,674
103,162 111,289
50,872 60,358
200,649 196,718
467,003 481,358
25,250 28,487
4,389,765 4,986,884
7,088,537 7,510,851
Equity:
341,482 341,482
386,165 409,528
2,903,432 2,550,124
448,035 485,447
(104,399) (54,402)
3,974,715 3,732,179
243,408 257,983
4,218,123 3,990,162
Total 11,306,660¥ 11,501,013¥
Capital surplus
Other current liabilities
Total current liabilities
Long-term debt, less current portion
Other financial liabilities
Retirement benefit liabilities
Retained earnings
Other components of equity
Treasury stock
Total equity attributable to owners of the parent
Non-controlling interests
Total equity
Provisions
Deferred tax liabilities
Other non-current liabilities
Total non-current liabilities
Common stock
Total liabilities
Provisions
Liabilities and Equity
March 31,
2018
March 31,
2017
Short-term debt
Current portion of long-term debt
Trade and other payables
Other financial liabilities
Income tax payables
Advances from customers
18

Consolidated Statements of Income
(Millions of Yen)
4,330,823¥ 3,833,564¥
436,606 405,893
124,720 124,512
Total revenue 4,892,149 4,363,969
Cost of products sold (3,856,008) (3,418,437)
Cost of services rendered (186,093) (171,741)
Cost of other revenue (59,343) (54,496)
Total cost (4,101,444) (3,644,674)
790,705 719,295
(571,703) (538,975)
55,146 64,962
Impairment reversal (loss) of fixed assets—net (25,454) (5,732)
15,108 11,013
(25,006) -
15,826 9,877
Total other income (expenses) (536,083) (458,855)
Interest income 36,516 34,905
Dividend income 84,793 51,874
(66,488) (56,997)
Total finance income (costs) 54,821 29,782
234,941 170,569
544,384 460,791
(103,082) (134,641)
441,302¥ 326,150¥
418,479¥ 306,136¥
22,823 20,014
Consolidated Statements of Comprehensive Income
(Millions of Yen)
441,302¥ 326,150¥
Items that will not be reclassified to profit or loss:
174,983 198,971
14,242 16,379
4,372 (3,132)
(48,857) (54,549)
Items that may be reclassified subsequently to profit or loss:
(82,590) 25,787
6,184 14,985
(42,390) (6,528)
(32,649) 7,094
Total other comprehensive income (6,705) 199,007
Comprehensive Income for the Year 434,597¥ 525,157¥
Comprehensive Income for the Year Attributable to:
416,113¥ 503,025¥
18,484 22,132
Year ended
March 31,
2017
Gross Profit
(2) Consolidated Statements of Income and Comprehensive Income
Year ended
March 31,
2018
Revenue:
Sale of products
Rendering of services
Other revenue
Cost:
Other Income (Expenses):
Selling, general and administrative expenses
Gain (loss) on securities and other investments—net
Gain (loss) on disposal or sales of fixed assets—net
Other income (expense)—net
Finance Income (Costs):
Interest expense
Share of Profit (Loss) of Investments Accounted for Using the Equity Method
Profit before Income Taxes
Income Taxes
Profit for the Year
Provision related to Multigrain business
Profit for the Year Attributable to:
Owners of the parent
Non-controlling interests
Non-controlling interests
Cash flow hedges
Year ended
March 31,
2018
Year ended
March 31,
2017
Profit for the Year
Other Comprehensive Income:
Financial assets measured at FVTOCI
Remeasurements of defined benefit pension plans
Share of other comprehensive income of investments accounted for using the equity method
Income tax relating to items not reclassified
Foreign currency translation adjustments
Share of other comprehensive income of investments accounted for using the equity method
Income tax relating to items that may be reclassified
Owners of the parent
Unrealized holding losses on available-for-saleSummary of Changes in Equity from Nonowner Sources (Comprehensive Income (Loss)):Other comprehensive income (loss) (after income tax effect):Foreign currency translation and other adjustments Unrealized holding losses on available-for-saleSummary of Changes in Equity from Nonowner Sources (Comprehensive Income (Loss)):Other comprehensive income (loss) (after income tax effect):
Unrealized holding losses on available-for-saleSummary of Changes in Equity from Nonowner Sources (Comprehensive Income (Loss)):Other comprehensive income (loss) (after income tax effect):Foreign currency translation and other adjustmentsUnrealized holding losses on available-for-saleSummary of Changes in Equity from Nonowner Sources (Comprehensive Income (Loss)):Other comprehensive income (loss) (after income tax effect):Foreign currency translation and other adjustmentsUnrealized holding losses on available-for-saleSummary of Changes in Equity from Nonowner Sources (Comprehensive Income (Loss)):Other comprehensive income (loss) (after income tax effect):Foreign currency translation and other adjustmentsUnrealized holding losses on available-for-saleSummary of Changes in Equity from Nonowner Sources (Comprehensive Income (Loss)):Other comprehensive income (loss) (after income tax effect):Foreign currency translation and other adjustments
19

(3) Consolidated Statements of Changes in Equity
(Millions of Yen)
Common
Stock
Capital
Surplus
Retained
Earnings
Other
Components of
Equity
Treasury
StockTotal
¥ 341,482 ¥ 412,064 ¥ 2,314,185 ¥ 317,955 ¥ (5,961) ¥ 3,379,725 ¥ 286,811 ¥ 3,666,536
Profit for the year 306,136 306,136 20,014 326,150
Other comprehensive income for the year 196,889 196,889 2,118 199,007
503,025 22,132 525,157
Dividends paid to the owners of the parent
(per share: \57) (102,187) (102,187) (102,187)
Dividends paid to non-controlling interest
shareholders(52,706) (52,706)
Acquisition of treasury stock (48,648) (48,648) (48,648)
Sales of treasury stock (0) 207 207 207
Compensation costs related to stock options 164 164 164
Equity transactions with non-controlling
interest shareholders (2,700) 2,593 (107) 1,746 1,639
31,990 (31,990) - -
¥ 341,482 ¥ 409,528 ¥ 2,550,124 ¥ 485,447 ¥ (54,402) ¥ 3,732,179 ¥ 257,983 ¥ 3,990,162
Profit for the year 418,479 418,479 22,823 441,302
Other comprehensive income for the year (2,366) (2,366) (4,339) (6,705)
416,113 18,484 434,597
Dividends paid to the owners of the parent
(per share: \60) (105,844) (105,844) (105,844)
Dividends paid to non-controlling interest
shareholders(24,098) (24,098)
Acquisition of treasury stock (50,057) (50,057) (50,057)
Sales of treasury stock (29) (30) 60 1 1
Compensation costs related to stock options 247 247 247
Equity transactions with non-controlling
interest shareholders (23,581) 5,657 (17,924) (8,961) (26,885)
40,703 (40,703) - -
¥ 341,482 ¥ 386,165 ¥ 2,903,432 ¥ 448,035 ¥ (104,399) ¥ 3,974,715 ¥ 243,408 ¥ 4,218,123
Transfer to retained earnings
Balance as at March 31, 2018
Comprehensive income for the year
Transaction with owners:
Balance as at March 31, 2017
Attributable to owners of the parent
Non-
controlling
Interests
Total
Equity
Transaction with owners:
Transfer to retained earnings
Balance as at April 1, 2016
Comprehensive income for the year
20
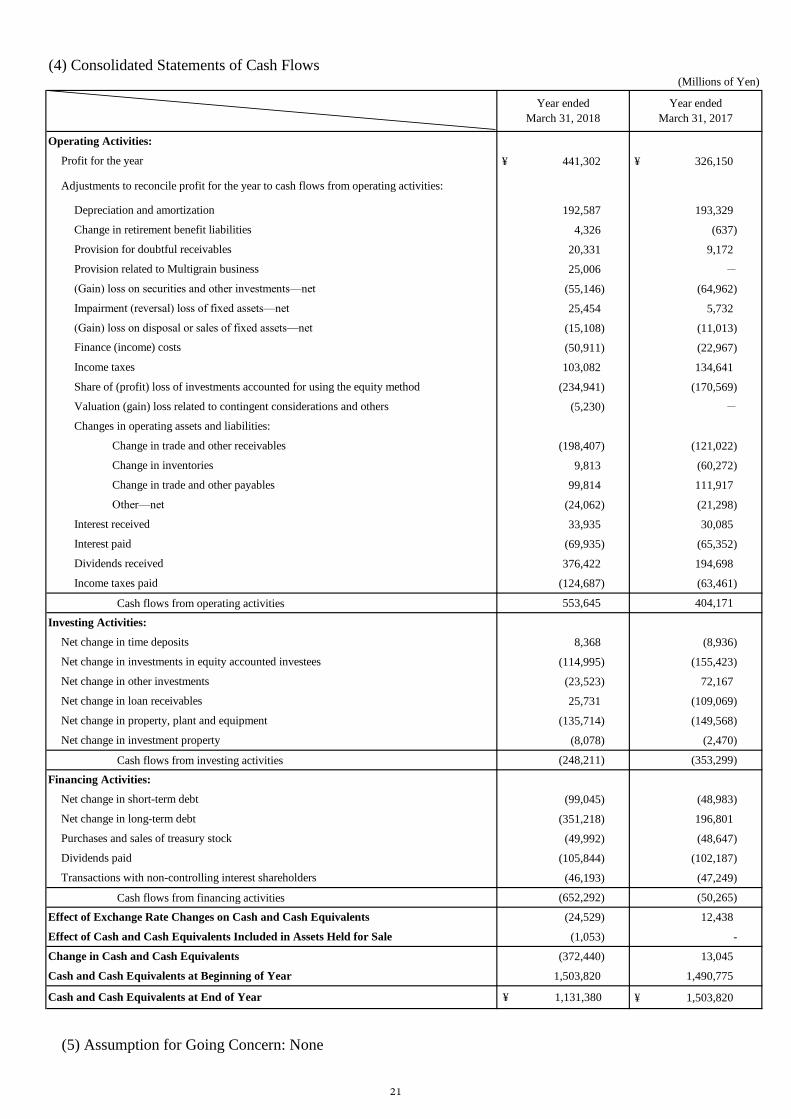
¥ 441,302 ¥ 326,150
Adjustments to reconcile profit for the year to cash flows from operating activities:
192,587 193,329
4,326 (637)
20,331 9,172
25,006 -
(55,146) (64,962)
25,454 5,732
(15,108) (11,013)
(50,911) (22,967)
103,082 134,641
(234,941) (170,569)
(5,230) -
(198,407) (121,022)
9,813 (60,272)
99,814 111,917
(24,062) (21,298)
33,935 30,085
(69,935) (65,352)
376,422 194,698
(124,687) (63,461)
Cash flows from operating activities 553,645 404,171
8,368 (8,936)
(114,995) (155,423)
(23,523) 72,167
25,731 (109,069)
(135,714) (149,568)
(8,078) (2,470)
Cash flows from investing activities (248,211) (353,299)
(99,045) (48,983)
(351,218) 196,801
(49,992) (48,647)
(105,844) (102,187)
(46,193) (47,249)
Cash flows from financing activities (652,292) (50,265)
(24,529) 12,438
(1,053) -
(372,440) 13,045
1,503,820 1,490,775
1,131,380¥ ¥ 1,503,820
Valuation (gain) loss related to contingent considerations and others
Provision related to Multigrain business
(4) Consolidated Statements of Cash Flows(Millions of Yen)
Income taxes
Year ended
March 31, 2017
Operating Activities:
Profit for the year
Depreciation and amortization
(Gain) loss on securities and other investments—net
Impairment (reversal) loss of fixed assets—net
(Gain) loss on disposal or sales of fixed assets—net
Finance (income) costs
Change in retirement benefit liabilities
Year ended
March 31, 2018
Provision for doubtful receivables
Effect of Exchange Rate Changes on Cash and Cash Equivalents
Effect of Cash and Cash Equivalents Included in Assets Held for Sale
Net change in time deposits
Share of (profit) loss of investments accounted for using the equity method
Changes in operating assets and liabilities:
Change in trade and other receivables
Change in inventories
Change in trade and other payables
Other—net
Interest received
Interest paid
Dividends received
Income taxes paid
Investing Activities:
Net change in short-term debt
Net change in long-term debt
Cash and Cash Equivalents at Beginning of Year
Cash and Cash Equivalents at End of Year
(5) Assumption for Going Concern: None
Change in Cash and Cash Equivalents
Purchases and sales of treasury stock
Dividends paid
Transactions with non-controlling interest shareholders
Net change in investments in equity accounted investees
Net change in other investments
Net change in loan receivables
Net change in property, plant and equipment
Financing Activities:
Net change in investment property
21

(6) Basis of Consolidated Financial Statements
Scope of subsidiaries and equity accounted investees
① Subsidiaries1) Overseas 201
2) Japan 64
② Equity accounted investees (associated companies and joint ventures)1) Overseas 165
2) Japan 42
A total of 382 subsidiaries and equity accounted investees are excluded from the above. These include companies which are sub-consolidated or accounted for under the equity method by subsidiaries other than trading subsidiaries.
22
(7) Changes in Accounting Estimates
Significant changes in accounting estimates in the consolidated financial statements for the year ended
March 31, 2018 are as follows.
(Impairment)
Mitsui Bussan Copper Investment & Co., Ltd., a subsidiary in the Mineral & Metal Resources Segment,
recognized an impairment loss of ¥18,590 million related to SCM Minera Lumina Copper Chile, an
equity-method affiliate, which Mitsui Bussan Copper Investment & Co., Ltd. and MLCC Finance
Netherlands B.V., an equity-method affiliate, have investment and loan for. The impairment loss was
driven by update in the revision of the long-term copper production program and operational situation.
Out of ¥ 18,590 million, ¥ 14,722 million loss is included in Provision for doubtful receivables under
“Selling, General and Administrative Expenses” and ¥ 3,868 million loss is included in “Share of
Profit (Loss) of Investments Accounted for Using the Equity Method” respectively.
XINGU AGRI AG, a subsidiary in the Lifestyle Segment, recognized an impairment loss of ¥11,288
million in “impairment loss of fixed assets” by reducing the carrying amount of assets such as the
goodwill and the farmland to the recoverable amount of ¥70,470 million. The impairment loss mainly
related to a decline in the soybean price and decreased demand for the farmland in the area where the
assets are located. The recoverable amount above represents the fair value less costs of disposal, which
is based on a valuation conducted by independent valuation appraisers who have recent experience in
the locations and categories of the asset being valued, and the fair value is classified as level 3.
(Provision)
Due to the recent deterioration of the business environment, provisions totaled ¥25,006 million have
been recognized in relation to the export business of our consolidated subsidiary, Multigrain Trading
AG which is engaged in origination and merchandising of agricultural products in Brazil.
23

①Segment InformationYear ended March 31, 2018 (from April 1, 2017 to March 31, 2018)
(Millions of Yen)
Iron & Steel
Products
Mineral & Metal
Resources
Machinery &
InfrastructureChemicals Energy Lifestyle
Innovation &
Corporate
Development
Total All Other
Adjustments
and
Eliminations
Consolidated
Total
Revenue 238,240 946,369 447,088 1,186,673 534,293 1,409,378 127,326 4,889,367 1,937 845 4,892,149
Gross Profit 41,874 206,767 121,943 136,573 96,808 139,533 45,084 788,582 1,278 845 790,705
Share of Profit (Loss) of Investments Accounted for Using the Equity Method 13,349 61,806 96,525 11,318 24,544 22,842 5,040 235,424 (116) (367) 234,941
Profit (Loss) for the Year Attributable to Owners of the parent 24,728 257,617 89,617 34,235 48,601 (26,340) (4,637) 423,821 2,469 (7,811) 418,479
Core Operating Cash Flow 14,179 240,829 158,846 50,174 175,282 7,118 3,061 649,489 8,558 8,440 666,487
Total Assets at March 31, 2018 654,725 2,092,908 2,255,650 1,186,254 1,917,687 1,901,822 622,709 10,631,755 6,239,888 (5,564,983) 11,306,660
Year ended March 31, 2017 (from April 1, 2016 to March 31, 2017) (As restated)(Millions of Yen)
Iron & Steel
Products
Mineral & Metal
Resources
Machinery &
InfrastructureChemicals Energy Lifestyle
Innovation &
Corporate
Development
Total All Other
Adjustments
and
Eliminations
Consolidated
Total
Revenue 202,406 746,406 408,504 1,037,284 463,601 1,378,263 125,226 4,361,690 1,908 371 4,363,969
Gross Profit 36,724 176,786 114,452 145,611 63,885 136,179 44,988 718,625 299 371 719,295
Share of Profit (Loss) of Investments Accounted for Using the Equity Method 11,129 48,468 64,341 3,880 17,090 24,085 2,077 171,070 (106) (395) 170,569
Profit (Loss) for the Year Attributable to Owners of the parent 10,853 144,314 66,806 32,653 31,679 25,382 10,975 322,662 (2,888) (13,638) 306,136
Core Operating Cash Flow 8,617 202,136 74,432 53,771 134,109 8,378 6,109 487,552 16,394 (9,100) 494,846
Total Assets at March 31, 2017 612,632 1,962,236 2,238,142 1,175,205 1,905,252 1,723,399 611,395 10,228,261 5,798,648 (4,525,896) 11,501,013
(8) Notes to Consolidated Financial Statements
Notes:1. “All Other” principally consisted of the Corporate Staff Unit which provides financing services and operations ser vices to external customers and/or to the companies and affiliated companies.
Total assets of “All Other” at March 31, 2017 and March 31, 2018 consisted primarily of cash and cash equivalents and time deposits related to financing activities,
and assets of the Corporate Staff Unit and certain subsidiaries related to the above services.
2. Transfers between reportable segments are made at cost plus a markup.
3. Profit (Loss) for the Year Attributable to Owners of the parent of “Adjustments and Eliminations” includes income and expense items that are not allocated to specific reportable segments,
and eliminations of intersegment transactions.
4. Since the three-month period ended June 30, 2017, Core Operating Cash Flow has been identified as the performance indicator that is more important than EBITDA, therefore,
Core Operating Cash Flow has been disclosed by reportable segments instead of EBITDA. Core Operating Cash Flow is calculated by eliminating the sum of the
“Changes in Operating Assets and Liabilities” from “Cash Flows from Operating Activities” as presented in the Condensed Consolidated Statements of Cash Flows.
5. Previously, there was a difference between the Company's actual income taxes and the reportable segments' income taxes that were calculated using the internal tax rate and the difference was included in
the “Adjustments and Eliminations”. Since the three-month period ended June 30, 2017, the internal tax rate has been made the same as the external tax rate.
In addition, since the three-month period ended June 30, 2017, the scope of allocation of expenses incurred at Corporate Staff Unit to reportable segments was reviewed,
and part of the expenses which were previously allocated to the reportable segments have been excluded from the scope of allocation.
6. The components of deciding resources to be allocated to the segments and assessing their performance by the Company's chief operating decision-maker have been changed to the components
where the regional operating segments were consolidated by the product operating segments. Since the three-month period ended June 30, 2017, the previous 10 reportable segments that include 7 product segments of
“Iron & Steel Products”, “Mineral & Metal Resources”, “Machinery & Infrastructure”, “Chemicals”, “Energy”, “Lifestyle” and “Innovation & Corporate Development” along with 3 regional segments of
“Americas”, “Europe, the Middle East and Africa” and “Asia Pacific”, have been changed to 7 reportable segments of “Iron & Steel Products”, “Mineral & Metal Resources”,
“Machinery & Infrastructure”, “Chemicals”, “Energy”, “Lifestyle” and “Innovation & Corporate Development”, where the regional segments were consolidated by the product segments.
In addition, part of each of the regional segments have been consolidated to “All Other”.
7. Previously, the profit and loss of consolidated subsidiaries that are jointly held by numerous operating segments were al located from the supervising to non-supervising operating segments based on the profit share of
each of the segments using the Share of Profit (Loss) of Investments Accounted for Using the Equity Method and Income for the Period Attributable to Non-controlling Interests.
Since the three-month period ended June 30, 2017, these allocations are made based on the profit share of each of the segments in each of the accounts disclosed in the segment information
to reflect the performance of the operating segments more properly.
8. In accordance with the changes in 4-7 above, the segment information for the Year ended March 31, 2017 has been restated to conform to the current period presentation.
24

Basic Earnings per Share Attributable to
Owners of the Parent:
Profit for the Year Attributable to Owners of the Parent 418,479 1,760,728 237.67
Effect of Dilutive Securities:
Adjustments of effect of:
Dilutive securities of associated companies (52) -
Stock options - 1,038
Diluted Earnings per Share Attributable to
Owners of the Parent:Profit for the Year Attributable to Owners of the Parent
after effect of dilutive securities418,427 1,761,766 237.50
Basic Earnings per Share Attributable to
Owners of the Parent:
Profit for the Year Attributable to Owners of the Parent 306,136 1,788,166 171.20
Effect of Dilutive Securities:
Adjustments of effect of:
Dilutive securities of associated companies (43) -
Stock options - 759
Diluted Earnings per Share Attributable to
Owners of the Parent:Profit for the Year Attributable to Owners of the Parent
after effect of dilutive securities306,093 1,788,925 171.10
③Subsequent Events
There are no material subsequent events to be disclosed.
②Earnings per share
Shares
(denominator)Per share amount
Profit
(numerator)
Millions of Yen
Shares
(denominator)
In Thousands Yen
The following is a reconciliation of basic earnings per share attributable to owners of the parent to diluted earnings per share attributable to
owners of the parent for the years ended March 31, 2018 and 2017:
Year ended March 31, 2017(from April 1, 2016 to March 31, 2017)
Profit
(numerator)
Per share amount
Yen
Year ended March 31, 2018(from April 1, 2017 to March 31, 2018)
Millions of Yen In Thousands
25