Consolidated Financial Highlights 21F
25
Consolidated Financial Highlights 21F First Quarter TSE Code:6737 July 30th, 2021
Transcript of Consolidated Financial Highlights 21F

Consolidated Financial Highlights
21FFirst Quarter
TSE Code:6737
July 30th, 2021

© 2021 EIZO Corporation. All Rights Reserved.
21F, First Quarter1
Any statements in this document, other than those of historical fact, are forward-looking statements about the future performance of
EIZO and its group companies, which are based on management’s assumptions and beliefs in light of information currently available,
and involve apparent or potential risks and uncertainties including forex impact, and risks related to supply and demand. Actual results
may differ materially from these forecasts.
Note: “21Q1” appearing in this presentation means “First Quarter Fiscal year 2021”.
“21F” appearing in this presentation means “Fiscal year 2021”, that is Fiscal year ended March 31, 2022.
Disclaimer Regarding Forward-looking Statements
Details of the Market Group
Market Group Market / Use
Business & Plus (B&P)Financial institutions , Public authorities , Educational facilities , CAD , Commercial facilities , Business and
home use
Healthcare (HC) Diagnosis / Medical examination , Medical treatment / Operation , Healthcare-IT
Creative Work (CW) Media & Entertainment , 3D computer graphics , Photo editing , Illustration , Design , Publication / Printing
Vertical & Specific (V&S)For various mission critical environments, infrastructure and industrial equipment
Air traffic control (ATC) , Maritime , Security & Surveillance (S&S) , MIL-STD compliance & Other industrial
fields (including touch panel applications)
Amusement (AMU) LCD-mounted pachinko and slot machines
Other (OTH) Maintenance services and commissioned development of software

© 2021 EIZO Corporation. All Rights Reserved.
21F, First Quarter
1. 21Q1 Consolidated Financial Results
2. 21F Plan / Topics
3. Reference Materials
2
Contents

© 2021 EIZO Corporation. All Rights Reserved.
21F, First Quarter
21Q1 Consolidated Financial Highlights
Under severe supply conditions caused by the shortage of semiconductors, our inventory
strategy ensured we could continue stable supply contributing to strong sales.
◼ B&P: Overseas sales were steady mainly in Europe due to high investment in IT equipment.
Sales in Japan increased because of capital investment previously postponed.
◼ HC: Overseas sales were steady due to a healthy demand for diagnostic and endoscopy
applications. Sales in Japan recovered slightly as hospitals eased entry restrictions.
◼ AMU: In a slow market, sales increased due to new compliance regulations and previously postponed
sales due to the temporary closure of pachinko parlors nationwide in 20Q1.
Operating Income increased significantly. Gross profit ratio increased by 5.7pt compared to
20Q1. SG&A increased as expenses in 20Q1 for sales & marketing were controlled strictly.
Sales & Operating Income IncreasedSteady Sales in B&P, HC & CW. Increasing Sales in AMU.
3

© 2021 EIZO Corporation. All Rights Reserved.
21F, First Quarter
20Q1 21Q1 QoQ
Net Sales 14,098 23,151 164.2%
Gross Profit 4,613 8,890 192.7%
Gross Profit / Net Sales 32.7% 38.4% 5.7pt
Selling, General and
Administrative Expenses4,441 4,850 109.2%
Operating Income 171 4,039 2,355.3%
Operating Income / Net Sales 1.2% 17.4% 16.2pt
Ordinary Income 585 4,579 781.9%
Net Income Attributable to
EIZO Corporation’s Stockholders390 3,166 811.1%
Exchange Rate(Quarterly Ave.):USD JPY107.63 JPY109.52 JPY1.89
Exchange Rate(Quarterly Ave.):EUR JPY118.58 JPY131.94 JPY13.36
4
(JPY Million) Consolidated Income Statement

© 2021 EIZO Corporation. All Rights Reserved.
21F, First Quarter
14,098 400 1,177 522 (424)
7,392 (15)
23,151
10,000
15,000
20,000
25,000
20Q1 21Q1
5
Main Factors for Changes in Net Sales(JPY Million)
B&P: Sales increased both in Japan and overseas supported by high investment in IT equipment.
HC: Overseas sales were steady in diagnostics and endoscopy applications. Sales in Japan recovered
gradually as hospitals eased entry restrictions.
CW: Sales increased in Europe and Media & Entertainment sales recovered gradually in North America
due to the resumption of market activity.
V&S: Sales decreased due to completion of some programs of advanced product customization in Japan.
AMU: Sales increased due to new compliance regulations and previously postponed sales due to the
temporary closure of pachinko parlors nationwide in 20Q1.
OTH: Sales of commissioned development of software decreased.
Total 1,675
B&P HCCW V&S
AMU OTH

© 2021 EIZO Corporation. All Rights Reserved.
21F, First Quarter
171 530
2,960
786 (408) 4,039
0
2,000
4,000
20Q1 21Q1
6
The FOREX impact was caused by a strong EUR against the JPY.
Net Sales increased as a result of steady sales in B&P, HC and CW and increasing sales in AMU.
Gross Profit Ratio, excluding the FOREX impact, increased due to sales of highly profitable products.
SG&A increased as expenses in 20Q1 for sales & marketing were controlled strictly.
Main Factors for Changes in Operating Income
Raising gross
profit ratio
Increase in
SG&A
(JPY Million)
FOREX
Impact
Increase in
net sales

© 2021 EIZO Corporation. All Rights Reserved.
21F, First Quarter
3.4 3.9 4.5 4.5 3.5 3.6 4.4 5.1 3.9
6.57.7 7.1 7.9
5.2 5.87.0
8.8
6.4
1.21.2 1.5
1.3
0.91.3
1.6
1.5
1.51.9
2.6 3.1 2.6
2.42.3
1.8
2.0
1.91.3
2.62.5 3.0
0.8
3.2
6.0
4.3
8.2
0.5
1.22.2 1.3
1.0
1.2
0.71.1 1.0
14.9
19.421.1 20.9
14.0
17.6
21.723.0 23.1
0
10
20
30
19Q1 19Q2 19Q3 19Q4 20Q1 20Q2 20Q3 20Q4 21Q1
B&P HC CW V&S AMU OTH
7
(JPY Billion)
Net Sales: OverallB&P/HC/CW/V&S
Total
QoQ 113.8%
© 2021 EIZO Corporation. All Rights Reserved.
21F, First Quarter
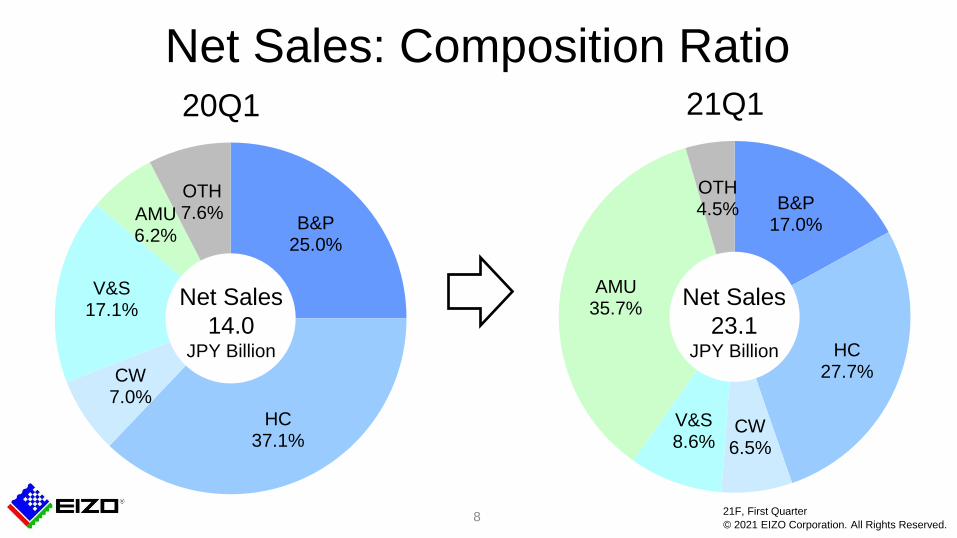
B&P17.0%
HC27.7%
CW6.5%
V&S8.6%
AMU35.7%
OTH4.5%
21Q1
B&P25.0%
HC37.1%
CW7.0%
V&S17.1%
AMU6.2%
OTH7.6%
20Q1
Net Sales
23.1JPY Billion
8
Net Sales: Composition Ratio
Net Sales
14.0JPY Billion

© 2021 EIZO Corporation. All Rights Reserved.
21F, First Quarter
1.2 1.2
2.3 2.6
3.53.9
0
1
2
3
4
5
20Q1 21Q1
Japan Overseas
Net Sales: B&P (Business & Plus)
9
(JPY Billion)
QoQ
111.3%
Overseas
Sales were steady supported by high investment in IT
equipment in Europe.
Sales of ultrawide, curved monitors contributed strongly.
Japan
Decreasing sales for home and satellite offices were compensated by increasing salesbecause of capital investment previously postponed.

© 2021 EIZO Corporation. All Rights Reserved.
21F, First Quarter
1.5 2.1
3.64.2
5.2
6.4
0
1
2
3
4
5
6
7
8
9
10
20Q1 21Q1
Japan Overseas
Net Sales: Healthcare
10
(JPY Billion)
QoQ
122.5%
OR Integration Sales both in Japan and overseas
recovered slightly.
Endoscopy Sales in China and North America
increased steadily.
Diagnostics Sales increased both in Japan and overseas despite tough
market conditions impacted by COVID-19. Sales in Europe were steady supported by a healthy
demand for run-rate business. Sales in North America recovered slightly with the economic recovery.
Sales in Japan recovered gradually as hospitals eased entry restrictions.

© 2021 EIZO Corporation. All Rights Reserved.
21F, First Quarter
0.2 0.2
0.6
1.20.9
1.5
0
1
2
20Q1 21Q1
Japan Overseas
Net Sales: Creative Work
11
(JPY Billion)
QoQ
153.2%
Overseas
Media & Entertainment sales mainly in North America, which were low in 20F because of COVID-19, recovered gradually.
The positive sales momentum driven by new models released in 20F has continued.
Japan
Sales decreased. The demand for gaming content creators, which was high in 20Q1, returnedto normal.

© 2021 EIZO Corporation. All Rights Reserved.
21F, First Quarter
1.40.9
0.9
1.0
2.4
1.9
0
1
2
3
20Q1 21Q1
Japan Overseas
Net Sales: V&S (Vertical & Specific)
12
(JPY Billion)
QoQ
82.4%
ATC (Air Traffic Control)
Sales were steady mainly in
China and Middle-East.
Maritime Sales in Japan decreased.
S&S (Security & Surveillance) Overseas sales recovered slightly.
Others
Sales in Japan decreased due to completion of some
programs requiring advanced product customization.
Sales overseas were affected by COVID-19, in particular
the automotive and other industrial markets.

© 2021 EIZO Corporation. All Rights Reserved.
21F, First Quarter
0.8
8.2
0
2
4
6
8
10
20Q1 21Q1
Net Sales: Amusement
13
(JPY Billion)
©SANYO BUSSAN CO.,LTD.
QoQ
951.9%
The market size continues to decrease.
The demand for replacement with new models will continue until the compliance deadline in January2022.
Sales increased due to new compliance regulations and previously postponed sales due to the temporary closure of pachinko parlors nationwide in 20Q1.

© 2021 EIZO Corporation. All Rights Reserved.
21F, First Quarter
20F 21Q1 Growth
Current Assets 71,506 76,646 5,139
Cash & Equivalents 18,882 21,815 2,932
Accounts Receivable
etc.*19,412 23,735 4,322
Inventories 31,247 29,025 (2,221)
Tangible Assets 18,858 18,550 (307)
Intangible Assets 2,430 2,346 (84)
Investments and Other
Assets57,266 55,828 (1,437)
Total 150,061 153,371 3,309
Current Liabilities 17,929 20,556 2,626
Long term Liabilities 17,679 17,251 (428)
Shareholders’ Equity 114,453 115,563 1,110
Total 150,061 153,371 3,309
Consolidated Balance Sheets
14
(JPY Million)
Current Liabilities
Accounts Payable increased in line with the purchase of materials in response to increasing AMU demand.
Apply “Accounting Standard for Revenue
Recognition (ASBJ Statement No.29)” from 21F.
Costs of commissioned development of AMU
software before inspection, which were included in
Inventories in 20F, were included in Contract
Assets (Accounts Receivable in the table) from the
beginning of 21F.
(The amount in 20F : 3,291 Million Yen)
* Notes and accounts receivable, contract assets and trade notes receivable transferred by endorsement

© 2021 EIZO Corporation. All Rights Reserved.
21F, First Quarter
1. 21Q1 Consolidated Financial Result
2. 21F Plan / Topics
3. Reference Materials
15
Contents

© 2021 EIZO Corporation. All Rights Reserved.
21F, First Quarter
20F 21F Plan 20F vs.21F Plan
Net Sales 76,565 82,200 107.4%
Gross Profit 26,551 28,900 108.8%
Gross Profit / Net Sales 34.7% 35.2% 0.5pt
Selling, General and
Administrative Expenses18,616 19,800 106.4%
Operating Income 7,935 9,100 114.7%
Operating Income / Net Sales 10.4% 11.1% 0.7pt
Ordinary Income 8,814 9,800 111.2%
Net Income Attributable to
EIZO Corporation’s Stockholders6,155 6,900 112.1%
Exchange Rate (Yearly Ave.) :USD JPY106.10 JPY110.00 JPY3.90
Exchange Rate (Yearly Ave.) :EUR JPY123.76 JPY128.00 JPY4.24
ROA 6.4% -
ROE 5.9% -
16
21F Plan(JPY Million)
The basis for the forecast has not changed.
(*) No revision of 21F projected
results announced on May 11th,
2021.

© 2021 EIZO Corporation. All Rights Reserved.
21F, First Quarter17
Topic 1EIZO Endorses the Recommendations of
the Task Force on Climate-related Financial Disclosures (TCFD)
EIZO decided to endorse the TCFD* in May 2021 in order to further promote our
efforts and information disclosure on climate change from an international perspective.* In response to a request from the G20, the Financial Stability Board (FSB) established the TCFD to examine climate-related
disclosure and responses by financial institutions. TCFD encourages companies and other organizations to disclose their
governance, strategy, risk management, indicators and targets with respect to climate change-related risks and opportunities.
EIZO established a new structure to promote sustainability in June 2021.
◼ Sustainability Committee (Chairman: President, Members: Operating Officers and President of Subsidiaries)
plans and progresses management of policies, goals and measures.
◼ Management Committee confirms and delivers policies, goals and measures.
EIZO will continue to make further contributions to the realization of a
sustainable society

© 2021 EIZO Corporation. All Rights Reserved.
21F, First Quarter18
Topic 2Case Study:ATC Market
Qingdao Air Traffic Management Station (CAAC)
The requirement for air traffic management, including monitors is increasing
significantly as traffic numbers in China reach new levels.
Over 400 EIZO monitors are deployed
◼ Primary control monitors (2K x 2K)
After two years of testing and evaluation, hundreds of monitors
chosen by high performance and streamlined maintenance.
◼ Tower monitors (24”)
Provide high readability in even under changing ambient lighting
conditions, enabled by wide brightness range.
◼ Auxiliary monitors (FlexScan) Over 300 monitors were installed.
EIZO will maintain our position as the leader in the ATC market
with an extensive range of imaging solutions offering high performance.

© 2021 EIZO Corporation. All Rights Reserved.
21F, First Quarter
1. 21Q1 Consolidated Financial Result
2. 21F Plan / Topics
3. Reference Materials
19
Contents

© 2021 EIZO Corporation. All Rights Reserved.
21F, First Quarter
Net Sales: B&P / HealthcareB&P
Healthcare
20
(JPY Billion)
18Q1 18Q2 18Q3 18Q4 19Q1 19Q2 19Q3 19Q4 20Q1 20Q2 20Q3 20Q4 21Q1
Total 3.8 4.2 4.6 5.0 3.4 3.9 4.5 4.5 3.5 3.6 4.4 5.1 3.9
Overseas 3.0 3.1 3.3 3.0 2.4 2.6 3.0 2.9 2.3 2.6 3.2 2.9 2.6
Japan 0.8 1.1 1.2 1.9 0.9 1.2 1.4 1.6 1.2 1.0 1.2 2.2 1.2
0.8 1.1 1.2 1.9 0.9 1.2 1.4 1.6 1.2 1.0 1.2 2.2 1.2
3.0 3.1 3.3 3.02.4 2.6 3.0 2.9
2.3 2.6 3.22.9
2.6
3.8 4.2 4.6 5.0
3.4 3.94.5 4.5
3.5 3.64.4
5.13.9
0
2
4
6
Japan Overseas
18Q1 18Q2 18Q3 18Q4 19Q1 19Q2 19Q3 19Q4 20Q1 20Q2 20Q3 20Q4 21Q1
Total 6.8 7.4 7.4 8.6 6.5 7.7 7.1 7.9 5.2 5.8 7.0 8.8 6.4
Overseas 3.9 4.6 4.5 4.6 3.8 3.9 4.8 4.7 3.6 3.8 4.4 4.6 4.2
Japan 2.8 2.7 2.8 4.0 2.7 3.8 2.3 3.2 1.5 1.9 2.6 4.1 2.1
2.8 2.7 2.8 4.0 2.7 3.8 2.3 3.2 1.5 1.9 2.6 4.1 2.1
3.9 4.6 4.54.6
3.83.9
4.8 4.73.6 3.8 4.4
4.64.2
6.8 7.4 7.48.6
6.57.7 7.1 7.9
5.2 5.87.0
8.86.4
02468
10
Japan Overseas

© 2021 EIZO Corporation. All Rights Reserved.
21F, First Quarter
Net Sales: Creative Work / V&SCreative Work
V&S
21
(JPY Billion)
18Q1 18Q2 18Q3 18Q4 19Q1 19Q2 19Q3 19Q4 20Q1 20Q2 20Q3 20Q4 21Q1
Total 1.3 1.3 1.6 1.5 1.2 1.2 1.5 1.3 0.9 1.3 1.6 1.5 1.5
Overseas 1.1 1.1 1.4 1.2 0.9 0.9 1.2 1.0 0.6 1.0 1.3 1.1 1.2
Japan 0.2 0.2 0.2 0.3 0.2 0.2 0.3 0.3 0.2 0.2 0.2 0.3 0.2
0.2 0.2 0.2 0.3 0.2 0.2 0.3 0.3 0.2 0.2 0.2 0.3 0.2
1.1 1.1 1.4 1.20.9 0.9
1.2 1.00.6
1.0 1.3 1.1 1.2
1.3 1.31.6 1.5
1.2 1.21.5
1.3
0.91.3
1.6 1.5 1.5
0
1
2
Japan Overseas
18Q1 18Q2 18Q3 18Q4 19Q1 19Q2 19Q3 19Q4 20Q1 20Q2 20Q3 20Q4 21Q1
Total 1.5 1.7 2.2 1.8 1.9 2.6 3.1 2.6 2.4 2.3 1.8 2.0 1.9
Overseas 0.9 1.0 1.1 1.0 1.2 1.6 1.9 1.3 0.9 1.1 1.0 1.2 1.0
Japan 0.6 0.6 1.0 0.8 0.6 1.0 1.1 1.3 1.4 1.1 0.7 0.8 0.9
0.6 0.6 1.0 0.8 0.6 1.0 1.1 1.3 1.4 1.1 0.7 0.8 0.90.9 1.0
1.1 1.0 1.21.6 1.9 1.3 0.9 1.1
1.0 1.2 1.01.5 1.7
2.2 1.8 1.92.6
3.12.6 2.4 2.3
1.8 2.0 1.9
0
1
2
3
4
Japan Overseas

© 2021 EIZO Corporation. All Rights Reserved.
21F, First Quarter
Net Sales: Amusement / Other Amusement
Other
22
(JPY Billion)
18Q1 18Q2 18Q3 18Q4 19Q1 19Q2 19Q3 19Q4 20Q1 20Q2 20Q3 20Q4 21Q1
AMU 2.3 2.2 2.6 1.3 1.3 2.6 2.5 3.0 0.8 3.2 6.0 4.3 8.2
2.3 2.2 2.61.3 1.3
2.6 2.5 3.00.8
3.26.0
4.3
8.2
0
2
4
6
8
10
18Q1 18Q2 18Q3 18Q4 19Q1 19Q2 19Q3 19Q4 20Q1 20Q2 20Q3 20Q4 21Q1
OTH 0.4 1.0 0.6 0.5 0.5 1.2 2.2 1.3 1.0 1.2 0.7 1.1 1.0
0.41.0
0.6 0.5 0.51.2
2.2
1.3 1.0 1.20.7
1.1 1.0
0
1
2
3

© 2021 EIZO Corporation. All Rights Reserved.
21F, First Quarter
18Q1 18Q2 18Q3 18Q4 19Q1 19Q2 19Q3 19Q4 20Q1 20Q2 20Q3 20Q4 21Q1
TOTAL 4.4 4.2 4.4 4.4 4.7 4.6 4.8 4.9 4.4 4.6 4.6 4.8 4.8
Other 1.4 1.3 1.4 1.3 1.6 1.4 1.6 1.5 1.3 1.6 1.5 1.5 1.6
Amortization of goodwill 0.08 0.08 0.05 0.03 0.12 0.10 0.09 0.09 0.09 0.09 0.09 0.09 0.09
R&D 1.4 1.2 1.3 1.3 1.2 1.4 1.4 1.5 1.3 1.2 1.3 1.3 1.3
Personnel 1.4 1.5 1.5 1.5 1.6 1.5 1.6 1.7 1.6 1.6 1.7 1.8 1.7
SG&A / Net Sales 22.7% 22.3% 19.4% 19.5% 31.4% 23.7% 22.9% 23.5% 31.5% 26.5% 21.4% 21.0% 21.0%
1.4 1.5 1.5 1.5 1.6 1.5 1.6 1.7 1.6 1.6 1.7 1.8 1.7
1.4 1.2 1.3 1.3 1.2 1.4 1.4 1.51.3 1.2 1.3 1.3 1.3
0.08 0.08 0.05 0.03 0.12 0.10 0.09 0.09
0.09 0.09 0.09 0.09 0.09
1.41.3
1.4 1.3 1.61.4
1.6 1.5
1.31.6
1.5 1.5 1.64.4
4.24.4 4.4
4.74.6
4.8 4.9 4.44.6 4.6 4.8 4.8
22.7%22.3%
19.4% 19.5% 31.4%23.7% 22.9%
23.5%
31.5%
26.5%
21.4%21.0% 21.0%
0%
10%
20%
30%
40%
0
2
4
6Personnel R&D Amortization of goodwill Other SG&A / Net Sales
Selling, General and Administrative Expenses
23
(JPY Billion)

Visit us online
www.eizoglobal.com