Consolidated annual fi nancial statements annual fi nancial statements - 31 March 2016 04...
57
Consolidated annual financial statements For the year ended 31 March 2016
-
Upload
truongliem -
Category
Documents
-
view
214 -
download
1
Transcript of Consolidated annual fi nancial statements annual fi nancial statements - 31 March 2016 04...

1
Consolidated
annual fi nancial statementsFor the year ended 31 March
2016

2 3
Contents
01
The information contained in this document is also available on Telkom ’s investor relations website www.telkom.co.za/ir
Telkom SA SOC Ltd(Registration number 1991/005476/30)JSE share code: TKG ISIN: ZAE000044897
Group secretaryEphenia Motlhamme
Transfer secretariesComputershare Investor Services (Pty) LtdPO Box 61051 Marshalltown, 2107
SponsorThe Standard Bank of South Africa LtdStandard Bank Centre30 Baker Street, Rosebank, 2196
DirectorsJA Mabuza (Chairman) SN Maseko (Group chief executive offi cer) DJ Fredericks (Chief fi nancial offi cer) S Botha, G Dempster, T Dingaan, N Kapila, I Kgaboesele, K Kweyama, K Mzondeki, N Ntshingila, F Petersen-Lurie, R Tomlinson, LL von Zeuner
Consolidated annual fi nancial statements - 31 March 2016 04Directors’ responsibility statement 05Certifi cate from group company secretary 06Directors' report 07Audit committee report 09Independent auditor's report 11Statements of profi t or loss and other comprehensive income 12Statements of fi nancial position 13Consolidated statement of changes in equity 14Statement of changes in equity 15Statements of cash fl ows 16 Notes to the consolidated annual fi nancial statements 17
1. Corporate information2. Signifi cant accounting policies3. Segment information4. Operating revenue5. Other income6. Expenses7. Investment income8. Finance charges and fair value movements9. Taxation (income)/expense10. Earnings per share11. Reclassifi cation of discontinued operation12. Acquisition of subsidiaries13. Property, plant and equipment14. Intangible assets15. Financial instruments and risk management16. Investments17. Finance lease receivables18. Deferred taxation19. Inventories
20. Trade and other receivables21. Other fi nancial assets and liabilities22. Net cash and cash equivalents23. Share capital24. Share-based compensation reserve25. Non-distributable reserves26. Non-controlling interest27. Interest-bearing debt28. Provisions29. Deferred revenue30. Employee benefi ts31. Trade and other payables32. Reconciliation of profi t for the year to cash generated from operations33. Dividend received34. Finance charges paid35. Taxation paid36. Dividend paid37. Commitments
38. Contingencies39. Directors’ interest and Prescribed Offi cers40. Related parties41. Group interest in subsidiaries and associates42. Signifi cant events43. Subsequent events44. Shareholder analysis
Seamlessly connecting South Africans to a better life

4 5
Consolidated annual fi nancial statements
01
Consolidated annual fi nancial statements
Directors’ responsibility statement
The directors are responsible for the preparation of the annual fi nancial statements of the company and the group. The directors are also responsible for maintaining a sound system of internal control to safeguard shareholders’ investments and the group’s assets.
In presenting the accompanying fi nancial statements, International Financial Reporting Standards have been followed and applicable accounting policies have been used incorporating prudent judgements and estimates.
The external auditors are responsible for independently auditing and reporting on the annual fi nancial statements.
In order for the directors to discharge their responsibilities, management continues to develop and maintain a system of internal control aimed at reducing the risk of error or loss in a cost-effective manner. The internal controls include a risk-based system of internal auditing and administrative controls designed to provide reasonable but not absolute assurance that assets are safeguarded and that transactions are executed and recorded in accordance with generally accepted business practices and the group’s policies and procedures.
The directors, primarily through the audit committee, which consists of independent non-executive directors, meet periodically with the external and internal auditors, as well as executive management to evaluate matters concerning accounting policies, internal controls, auditing and fi nancial reporting.
The directors are of the opinion, based on the information and explanations given by management and internal audit, that the internal accounting controls are adequate, so that the fi nancial records may be relied on for preparing the fi nancial statements and maintaining accountability for assets and liabilities.
The directors are satisfi ed that the company and the group have adequate resources to continue in operational existence for the foreseeable future. Accordingly, Telkom SA SOC Limited continues to adopt the going concern basis in preparing the annual fi nancial statements.
Against this background, the directors of the group accept responsibility for the consolidated annual fi nancial statements, which were approved by the board of directors on 11 July 2016 and are signed on their behalf by:
Jabu MabuzaChairman of the Telkom board
Sipho MasekoGroup chief executive offi cer
Pretoria11 July 2016

7
Certificate from group company secretary
I hereby certify in accordance with section 88(2)(e) of the Companies Act, 71 0f 2008 as amended, the group has lodged with the Commissioner of Companies all such returns as are required of a public company in terms of this Act and that all such returns are, to the best of my knowledge and belief, true, correct and up to date.
I further certify that Telkom and its directors have, during the 12 months ended 31 March 2016, complied with all JSE Listings Requirements and every disclosure requirement for continued listing on the JSE imposed by the JSE Limited during that period.
Ephy MotlhammeGroup company secretary11 July 2016
Directors'reportTo the members of Telkom SA SOC LimitedThe directors have pleasure in submitting the annual financial statements of the company and the group for the year ended 31 March 2016.
Nature of businessTelkom is a full service communications provider for South Africa.
Financial resultsProfit from continuing operations for the year ended 31 March 2016 was R2 376 million (2015: R3 184 million) representing basic earnings per share from continuing operations of 439.4 cents per share (2015: 603.0 cents per share) and headline earnings per share from continuing operations of 330.0 cents per share (2015: 593.2 cents per share). Full details of the financial position and results of the group are set out in the accompanying companyand group annual financial statements.
DividendsOrdinary dividend number 18 of 270 cents per share (2015: 215 cents ordinary dividend and 30 cents special dividend per share), in respect of the year ended 31 March 2016, was declared payable on Monday, 4 July 2016 to shareholders recorded in the register of the company at close of business on Friday, 1 July 2016.
Subsidiaries, associates and other investmentsParticulars of the material subsidiaries of the group are set out in note 41 of the accompanying group annual financial statements.
The attributable interest of the group in the after tax earnings from continuing operations of its subsidiaries for the year ended 31 March 2016 were:
Share capitalDetails of the authorised, issued and unissued share capital of the company as at 31 March 2016 are contained in note 23, of the accompanying group annual financial statements.
Share repurchaseThe company did not repurchase any shares during the year under review.
Subsequent to March 2016, Telkom purchased 3 710 126 shares from the market through Rossal No 65 (Pty) Ltd for the purpose of the employee share plan.
Borrowing powersIn terms of the group’s memorandum of incorporation, Telkom has unlimited borrowing powers subject to the restrictive financial covenants of the TL20 bond, syndicated and term loans.
Capital expenditure and commitmentsDetails of the company and group’s capital commitments on property, plant and equipment as well as intangible assets are set out in note 37 of the accompanying group annual financial statements.
97
2016 Restated 2015 R million R million
Aggregate amount of profit after taxation 470 332
6 Consolidated annual financial statements

8 98 9Consolidated annual financial statements
Details of the company and group’s capital expenditure on property, plant and equipment as well as intangibles are set out in notes 13 and 14 of the accompanying group annual financial statements.
Events subsequent to reporting dateEvents subsequent to the reporting date are set out in note 43 of the accompanying group annual financial statements.
DirectorateThere were no changes in the composition of the board of directors from 1 April 2015 to the date of this report.
The board of directors at the date of this report is as follows:JA Mabuza (chairman)SN Maseko (chief executive officer)DJ Fredericks (chief financial officer)S BothaG DempsterT DingaanN KapilaI KgaboeseleK KweyamaK Mzondeki N NtshingilaF Petersen-LurieR TomlinsonLL von Zeuner
Details of each director may be found in our integrated report.
Directors’ interestsAt 31 March 2016, the following directors held a beneficial interest in the shares of Telkom:
ExecutiveSN Maseko 52 520DJ Fredericks 9 874
Non-executiveJA Mabuza 26 000F Petersen-Lurie 400I Kgaboesele 12 000K Mzondeki 267
Refer to note 43 for changes in the directors’ beneficial interest in theshares of Telkom.
Details of the company secretary’s business address and the company’s registered office are set out on the inside back cover.
110
51 54
Audit committee report
IntroductionThe audit committee presents its report for the financial year ended 31 March 2016. The report is presented in accordance with the company’s memorandum of incorporation, the requirements of the Companies Act, 71 of 2008 (the Act), as well as the recommendations contained in the third King Report on Governance for South Africa (King III). Among others, the audit committee’s operations are also guided by a formal charter that is in line with the JSE Listings Requirements.
MembershipThe membership of the committee comprised the following independent non-executive directors:
I Kgaboesele (chairman)K MzondekiLL von ZeunerR TomlinsonT Dingaan
In addition, the chief executive officer; the chief financial officer, head of internal audit, head of risk management and the external auditors are also permanent invitees to meetings.
Qualification details of the current members of the audit committee are available in our integrated report as is their meeting attendance.
Duties performedDuring the financial year ended 31 March 2016, the committee convened six times to discharge both its statutory and board responsibilities. As an overview only, and not to be regarded as an exhaustive list, the committee carried out the following duties:• In conjunction with the risk committee reviewed the appropriateness of the
identified significant risks and the management and control thereof• Reviewed the group’s statement on internal control systems prior to
endorsement by the board• Satisfied itself that the internal audit coverage plans made provision for
effectively addressing the risk areas of the business• Considered the results of work performed by, and the conclusions of, the internal audit function in relation to: – corporate governance – risk management – financial systems, internal control and reporting – internal financial controls• Assessed and evaluated the independence and effectiveness of the internal
auditor functions, in accordance with its mandate• Assessed the effectiveness of the combined assurance forum• Reviewed the performance and expertise of the chief financial officer• Took responsibility for the appointment of independent external auditors,
retention, compensation, resignation or dismissal of the external auditors, as well as their terms of engagement and oversight of the work of the external auditors who report directly to the committee
• Considered any material problems, reservations and observations, or any potentially contentious accounting treatments or judgements, or significant unusual transactions, or going concern issues arising from the external audit
• Reviewed and recommended for adoption by the board the interim and annual financial information that is publicly disclosed, including the integrated reporting
• Reviewed the adequacy of management’s corrective action taken in response to significant internal and external audit findings
• Obtained regular updates from management regarding compliance matters• Obtained regular updates on the status of material open litigation and other
proceedings and the related reserves• Reviewed the adequacy and effectiveness of the control framework and
governance structures implemented within the IT environment.
The committee is satisfied that it has fulfilled its obligations in respect of the audit committee charter.
151
Directors' report(continued)

10 1110
Going concernBased on the results and the committee’s assessment that the going concern basis of accounting was appropriately applied, the committee is comfortable in recommending to the board that no material uncertainties existed to negatively impact the going concern status of the group and all the entities in the group.
ConclusionBased on the results of the formal documented review of the group’s system of internal controls and risk management, including the design, implementation and effectiveness of the internal fi nancial controls conducted by Telkom audit services during the 2016 fi nancial year and considering information and explanations given by management and discussions with the external auditor on the results of the audit, the audit committee has considered all signifi cant control matters and associated action plans. Having regard to the aforementioned, nothing has come to the attention of the audit committee that leads it to conclude that the group’s system of internal controls and risk management are not effective and that the internal fi nancial controls do not form a sound basis for the preparation of reliable fi nancial statements.
The audit committee is satisfi ed that Ernst & Young Inc is independent and was appointed in terms of the requirements of section 90(2) of the Companies Act, 71 of 2008 and nominated the reappointment of Ernst & Young Inc. and the appointment of Nkonki Inc. as registered auditors for the 2016 fi nancial year.
In terms of the authority delegated to the audit committee by the board on 3 June 2016, the audit committee has fi nalised and approved the integrated report including the consolidated annual fi nancial statements for the year ended 31 March 2016 on 11 July 2016.
I Kgaboesele Chairman of the audit committee11 July 2016
Consolidated annual fi nancial statements
A member firm of Ernst & Young Global Limited. A full list of Directors is available on the website. Chief Executive: Ajen Sita
EY 102 Rivonia Road Sandton Private Bag X14 Sandton 2146
Ernst & Young Incorporated Co. Reg. No. 2005/002308/21 Tel: +27 (0) 11 772 3000 Fax: +27 (0) 11 772 4000 Docex 123 Randburg ey.com
INDEPENDENT AUDITOR’S REPORT TO THE BOARD OF DIRECTORS AND SHAREHOLDERS OF TELKOM SA SOC LIMITED Report on the Financial Statements WehaveauditedtheaccompanyingGroupandCompanyfinancialstatementsofTelkomSASOCLimitedsetoutonpages12to110,whichcomprisethe Group and Company statements of financial position as at 31March2016, the Group and Company statements of comprehensive income, theGroupandCompanystatementsofchangesinequityandtheGroupandCompanystatementsofcashflowsfortheyearthenended,andthenotes,comprisingasummaryofsignificantaccountingpoliciesandotherexplanatoryinformation. Directors’ Responsibility for the Financial Statements TheCompany’sdirectorsareresponsible for thepreparationand fairpresentationof theseGroupandCompany financial statements inaccordancewith International Financial Reporting Standards and the requirements of the Companies Act of South Africa, and for such internal control as thedirectorsdetermineisnecessarytoenablethepreparationoffinancialstatementsthatarefreefrommaterialmisstatement,whetherduetofraudorerror. Auditor’s Responsibility Our responsibility is to express an opinion on these Group and Company financial statements based on our audit. We conducted our audit inaccordancewith InternationalStandardsonAuditing. Thosestandardsrequirethatwecomplywithethical requirementsandplanandperformtheaudittoobtainreasonableassuranceaboutwhethertheGroupandCompanyfinancialstatementsarefreefrommaterialmisstatement.An audit involves performing procedures to obtain audit evidence about the amounts and disclosures in the financial statements. The proceduresselecteddependontheauditor’sjudgement,includingtheassessmentoftherisksofmaterialmisstatementofthefinancialstatements,whetherduetofraudorerror.Inmakingthoseriskassessments,theauditorconsidersinternalcontrolrelevanttotheentity’spreparationandfairpresentationoftheGroupandCompanyfinancialstatementsinordertodesignauditproceduresthatareappropriateinthecircumstances,butnotforthepurposeofexpressinganopinionontheeffectivenessoftheentity’sinternalcontrol.Anauditalsoincludesevaluatingtheappropriatenessofaccountingpoliciesusedandthereasonablenessofaccountingestimatesmadebymanagement,aswellasevaluatingtheoverallpresentationofthefinancialstatements.Webelievethattheauditevidencewehaveobtainedissufficientandappropriatetoprovideabasisforourauditopinion.Opinion In our opinion, the Group and Company financial statements present fairly, in all material respects, the Group and Company financial position ofTelkomSASOCLimitedasat31March2016,andoftheGroupandCompanyfinancialperformanceandtheGroupandCompanycashflowsfortheyearthenendedinaccordancewithInternationalFinancialReportingStandardsandtherequirementsoftheCompaniesActofSouthAfrica.Other reports required by the Companies Act AspartofourauditoftheGroupandCompanyfinancialstatementsfortheyearended31March2016,wehavereadtheDirectors’Report,theAuditCommittee’sReportandtheCompanySecretary’sCertificateforthepurposeofidentifyingwhethertherearematerialinconsistenciesbetweenthesereportsandtheauditedGroupandCompanyfinancialstatements.Thesereportsaretheresponsibilityoftherespectivepreparers.Basedonreadingthese reports we have not identified material inconsistencies between these reports and the audited Group and Company financial statements.However,wehavenotauditedthesereportsandaccordinglydonotexpressanopiniononthesereports.Report on Other Legal and Regulatory Requirements IntermsoftheIRBARulepublishedinGovernmentGazetteNumber39475dated4December2015,wereportthatErnstandYoungInc.hasbeentheauditorofTelkomSASOCLimitedclientfor18years.EYhasbeentheappointedauditorofTelkomsince1998. Ernst&YoungInc.Director–DelanieLamprechtRegisteredAuditorCharteredAccountant(SA)11July2016
Audit committee report (continued)

12 13
Other comprehensive income
Items that may be reclassified subsequently to profit or loss
Exchange losses on translating foreign operations (9) - - -
Items that will not be reclassified to profit or loss
Defined benefit plan actuarial gains/(losses) 191 (1 953) 191 (1 953)
Income tax relating to actuarial gains/(losses) - 282 - 282
Defined benefit plan asset ceiling limitation 86 699 86 699
Income tax relating to asset ceiling limitation - (125) - (125)
Other comprehensive income/(loss) for the year, net of taxation 268 ( 1097) 277 (1 097)
Total comprehensive income for the year 2 644 2 087 2 862 2 034
Profit attributable to:
Owners of Telkom 2 246 3 079 2 585 3 131
Non-controlling interest 130 105 - -
Profit for the year 2 376 3 184 2 585 3 131
Total comprehensive income attributable to:
Owners of Telkom 2 514 1 982 2 862 2 034
Non-controlling interest 130 105 - -
Total comprehensive income for the year 2 644 2 087 2 862 2 034
Total operations
Basic earnings per share (cents) 10 439.4 603.0
Diluted earnings per share (cents) 10 432.8 590.7
Group Company
Notes2016
Rm
Restated2015
Rm2016
Rm
Restated2015
Rm
Operating revenue 4 37 325 32 760 32 106 31 611
Payments to other operators 6.1 2 793 2 930 2 813 2 956
Cost of sales 6.2 6 969 3 249 3 000 2 787
Net operating revenue 27 563 26 581 26 293 25 868
Other income 5 1 281 731 1 308 743
Operating expenses 20 083 18 471 19 577 18 230
Employee expenses 6.3 10 901 9 462 10 105 9 342
Selling, general and administrative expenses 6.4 4 978 4 755 5 600 4 693
Service fees 6.5 3 106 3 219 2 892 3 208
Operating leases 6.6 1 098 1 035 980 987
EBITDA 8 761 8 841 8 024 8 381
Depreciation of property, plant and equipment 6.7 4 370 4 506 4 305 4 480
Amortisation of intangible assets 6.7 902 779 799 757
Write-offs, impairment and losses of property, plant and equipment and intangible assets 6.7 170 220 170 220
Operating profit 3 319 3 336 2 750 2 924
Investment income 7 203 293 812 506
Finance charges and fair value movements 8 622 473 618 471
Finance charges 521 562 489 560
Foreign exchange and fair value movements 101 (89) 129 (89)
Profit before taxation 2 900 3 156 2 944 2 959
Taxation expense/(income) 9 524 (28) 359 (172)
Profit for the year 2 376 3 184 2 585 3 131
Current liabilities 13 076 11 483 11 993 12 197
Trade and other payables 31 7 134 5 635 6 820 6 380
Shareholders for dividend 36 22 19 20 19
Current portion of interest-bearing debt 27 703 1 612 520 1 612
Current portion of employee-related provisions 28 2 231 1 882 2 009 1 855
Current portion of non-employee related provisions 28 142 303 72 302
Current portion of deferred revenue 29 1 708 1 502 1 457 1 499
Income tax payable 35 675 344 653 344
Current portion of other financial liabilities 21 455 185 442 185
Credit facilities utilised 22 6 1 - 1
Total liabilities 20 180 16 755 18 609 17 416
Total equity and liabilities 46 787 41 982 43 976 41 097
Group Company
Notes2016
Rm
Restated2015
Rm2016
Rm
Restated2015
Rm
Assets
Non-current assets 33 875 30 855 34 049 30 688
Property, plant and equipment 13 25 357 24 479 24 459 24 323
Intangible assets 14 4 584 2 982 2 604 2 793
Investments in subsidiaries 16.1 - - 3 274 202
Other investments 16.2 2 318 2 231 2 335 2 227
Employee benefits 30 846 452 846 452
Other financial assets 21 55 28 - 28
Finance lease receivables 17 281 413 281 413
Deferred taxation 18 434 270 250 250
Current assets 12 912 11 127 9 927 10 409
Inventories 19 971 638 506 531
Income tax receivable 35 57 11 - -
Current portion of finance lease receivables 17 207 200 207 200
Trade and other receivables 20 7 375 5 388 5 257 4 887
Current portion of other financial assets 21 1 754 1 247 1 735 1 247
Cash and cash equivalents 22 2 548 3 643 2 222 3 544
Total assets 46 787 41 982 43 976 41 097
Equity and liabilities
Equity attributable to owners of the parent 26 134 24 864 25 367 23 681
Share capital 23 5 208 5 208 5 208 5 208
Share-based compensation reserve 24 241 126 241 126
Non-distributable reserves 25 1 507 1 507 795 786
Retained earnings 19 178 18 023 19 123 17 561
Non-controlling interest 26 473 363 - -
Total equity 26 607 25 227 25 367 23 681
Non-current liabilities 7 104 5 272 6 616 5 219
Interest-bearing debt 27 4 566 3 244 4 306 3 244
Employee-related provisions 28 1 665 1 264 1 645 1 249
Non-employee related provisions 28 66 61 9 39
Deferred revenue 29 656 687 656 687
Deferred taxation 18 151 16 - -
Statements of profit or loss andother comprehensive incomefor the year ended 31 March 2016
* *
Statements of financial positionat 31 March 2016
* *
Refer to note 2.5 and note 11.*
Refer to note 2.6.*
Consolidated annual financial statements

14 15
Group
Attributable to equity holders of Telkom
Share capital
Rm
Treasury shares
Rm
Non-distri-
butable reserves
Rm
Share-based
compen-sation
reserveRm
Retained earnings
Rm
Total
Rm
Non-controlling
interest
Rm
Total equity
Rm
Balance at 1 April 2014 5 208 (771) 2 580 11 15 743 22 771 377 23 148
Total comprehensive income – – 1 982 1 982 105 2 087
Profit for the year 3 079 3 079 105 3 184
Other comprehensive loss – – (1 097) (1 097) – (1 097)
Net defined benefit plan remeasurements (1 097) (1 097) (1 097)
Transactions with owners recorded directly in equityRevaluation of the cell captive transferred to non-distributable reserves (refer to note 25) 221 (221) – –
Realised gain of the cell captive (refer to note 25) (519) 519 – –
Adjustments to shares held in escrow (refer to note 25) (4) (4) (4)Transfer of treasury shares to non-distributable reserves(refer to note 25) 775 (775) – –Increase in share-based compensation reserve (refer to note 24) 115 115 115Contributions by and distributions to non-controlling interestDividends declared (refer tonote 26) – (119) (119)
Balance at 31 March 2015 * 5 208 – 1 507 126 18 023 24 864 363 25 227
Balance at 1 April 2015 5 208 – 1 507 126 18 023 24 864 363 25 227
Total comprehensive income (9) – 2 523 2 514 130 2 644
Profit for the year 2 246 2 246 130 2 376
Other comprehensive income (9) – 277 268 – 268
Exchange losses on translating foreign operations (9) (9) (9)
Net defined benefit plan remeasurements 277 277 277
Transactions with owners recorded directly in equityRevaluation of the cell captive transferred to non-distributable reserves (refer to note 25) 9 (9) – –Increase in share-basedcompensation reserve (refer to note 24) 115 115 115
Acquisition of non-controlling interest (68) (68) (32) (100)
Dividend declared (1 291) (1 291) (1 291)
Contributions by and distributions to non-controlling interestDividends declared (refer to note 26) (114) (114)
Acquisition of subsidiary with non-controlling interests 126 126
Balance at 31 March 2016 5 208 – 1 507 241 19 178 26 134 473 26 607
Consolidated statement of changes in equityfor the year ended 31 March 2016
Attributable to equity holders of Telkom
Share capital
Rm
Treasury shares
Rm
Non-dis-tributable
reserves
Rm
Share-based
compen-sation
reserveRm
Retained earnings
Rm
Total
Rm
Company
Balance at 1 April 2014 5 208 (775) 1 859 11 15 229 21 532
Total comprehensive income 2 034 2 034
Profit for the year 3 131 3 131
Other comprehensive loss ( 1 097) (1 097)
Net defined benefit plan remeasurements (1 097) (1 097)
Transactions with owners recorded directly in equityRevaluation of the cell captive transferred to non-distributable reserves (refer to note 25) 221 (221) –
Realised gain of the cell captive (refer to note 25) (519) 519 –
Transfer of treasury shares to non-distributable reserves (refer to note 25) 775 (775)
Increase in share-based compensation reserve (refer to note 24) 115 115
Balance at 31 March 2015* 5 208 – 786 126 17 561 23 681
Balance at 1 April 2015 5 208 – 786 126 17 561 23 681
Total comprehensive income 2 862 2 862
Profit for the year 2 585 2 585
Other comprehensive income 277 277
Net defined benefit plan remeasurements 277 277
Transactions with owners recorded directly in equityRevaluation of the cell captive transferred to non-distributable reserves (refer to note 25) 9 (9) –
Increase in share-based compensation reserve(refer to note 24) 115 115
Dividend declared (1 291) (1 291)
Balance at 31 March 2016 5 208 – 795 241 19 123 25 367
Statement of changesin equityfor the year ended 31 March 2016
These balances have been restated. Refer to notes 2.5 and 2.6.*
These balances have been restated. Refer to notes 2.5 and 2.6.*
Consolidated annual financial statements

16 17
Statements of cash flowsfor the year ended 31 March 2016
Group Company
Notes2016
Rm
Restated2015
Rm2016
Rm2015
Rm
Cash flows from operating activities 6 751 6 281 6 549 6 220
Cash receipts from customers 37 690 32 952 32 481 31 249
Cash paid to suppliers and employees (28 946) (26 153) (24 526) (24 978)
Cash generated from operations 32 8 744 6 799 7 955 6 271
Interest received 465 502 419 467
Dividend received 33 – – 195 226
Finance charges paid 34 (768) (493) (678) (491)
Taxation paid 35 (288) (406) (52) (251)
Cash generated from operations before dividend paid 8 153 6 402 7 839 6 222
Dividend paid 36 (1 402) (121) (1 290) (2)
Cash flows from investing activities (8 265) (5 168) (8 462) (5 111)
Proceeds on disposal of property, plant and equipment and intangible assets 567 253 535 253
Proceeds on disposal of investment 16.2 – 750 – 750
Additions to assets for capital expansion* (5 941) (5 070) (5 694) (4 996)
Increase in repurchase agreements (534) (1 101) (534) (1 101)
Loans advanced to subsidiaries – – (15) (17)
Acquisition of subsidiary (BCX) net of cash acquired 12.1 (2 255) – – –
Investments made by FutureMakers 16.2 (13) – – –
Acquisition of non-controlling interest by BCX 12.3 (89) – – –
Acquisition of subsidiary (BCX) 12.1 – – (2 654) –
Investment in FutureMakers – – (100) –
Cash flows from financing activities 412 685 590 685
Loans raised 4 020 1 000 4 015 1 000
Loans repaid (3 746) (310) (3 608) (310)
Finance lease repaid (430) (170) (412) (170)
Proceeds from net derivatives 568 165 595 165
Net (decrease)/increase in cash and cash equivalents (1 102) 1 798 (1 323) 1 794
Net cash and cash equivalents at beginning of year 3 642 1 841 3 543 1 746
Effect of foreign exchange rate gains on cash and cashequivalents 2 3 2 3 Net cash and cash equivalents at end of year 22 2 542 3 642 2 222 3 543
**
Includes R83 million (2015: R137 million) inventory purchases in the current financial year.Refer to note 2.7.
Notes to the consolidated annualfinancial statementsfor the year ended 31 March 2016
1. Corporate information
Telkom SA SOC Limited (Telkom), the ultimate parent of the group, is a company incorporated and domiciled in the Republic of South Africa (South Africa) whose shares are publicly traded. The main objective of Telkom, its subsidiaries and associate (the group) is to supply telecommunication, multimedia, technology, information, mobile communication services and other related information technology services to the group customers,as well as mobile communication services, in Africa. The group’s services and products include:
- fixed-line retail voice services to post-paid, pre-paid and private payphone customers using PSTN (public switched telephone network) lines, including ISDN (integrated services digital network) lines, and the sale of subscription-based value-added voice services and calling plans;
- fixed-line customer premises equipment rental, sales and services both voice and data needs and these include PABX, computers, routers, modems, telephone handsets and other ancillary equipment;
- interconnection services, including terminating and transiting traffic from South African mobile operators, as well as from international operators and transiting traffic from mobile to international destinations;
- fixed-line data services, including domestic and international data transmission services, such as point-to-point leased lines, ADSL (Asymmetrical Digital Subscriber Line) services, packet-based services, managed data networking services and internet access and related information technology services;
- W-CDMA (Wideband Code Division Multiple Access), a 3G next generation network, including fixed voice services, data services and nomadic voice services;
- mobile communication services, including voice services, data services and handset sales through its mobile brand called Telkom Mobile;
- Business Connexion provides business solutions based on information and communication technology and manages ICT systems and products, services and solution throughout Africa; and
- other services including directory services, through Trudon (Pty) Ltd, wireless data services, through Swiftnet (Pty) Ltd and included internet services outside South Africa.
Convergence is one of our key strategic initiatives in building a sustainable future for Telkom. We will lead the provision of converged services in South Africa in support of our mission statement: Seamlessly connecting people to a better life. The strategy is to transform Telkom into an integrated fixed, mobile, IT and content provider, leveraging our unique strengths in the fixed, mobile and IT markets in order to drive sustainable revenue growth, defend our core business and create efficiencies over the longer term.
2. Significant accounting policies
2.1 Basis of preparation The consolidated annual financial statements comply with International Financial Reporting Standards (IFRS) of the International Accounting Standards Board (IASB), the Companies Act of South Africa, 2008, as amended, the JSE Listings Requirements and the SAICA Financial Reporting Guides as issued by the Accounting Practices Committee and Financial Pronouncements as issued by the Financial Reporting Standards Council.
The consolidated annual financial statements are presented in South African rand, which is the group’s presentation currency. All financial information presented in rand has been rounded to the nearest million.
The financial statements are prepared on the historical cost basis, with the exception of certain financial instruments initially (and sometimes subsequently) measured at fair value. Details of the group’s significant accounting policies are set out below and are consistent with those applied in the previous financial year except for the adopted standards as listed on the next page:
***
Consolidated annual financial statements

18 19
Standard(s), Amendment(s) Salient feature of the changes Effective date
IFRS 5 Non-current Assets Held for Sale and Discontinued Operations
Amendment to the accounting treatment of changes to a plan of sale or to a plan of distribution to owners. The amendment clarifies that changing between disposal methods would not be considered a new plan of disposal but rather a continuation of the original plan. This amendment has been adopted and has no impact on the group.
1 January 2016
IFRS 7 Financial Instruments Disclosures
Servicing contracts disclosures: Application guidance to clarify whether a servicing contract gives rise to continuing involvement in a transferred asset for the purposes determining the transfer disclosure requirements. This amendment has been adopted and have no impact on the group.
1 January 2016
IFRS 7 Financial Instruments Disclosures
Offsetting disclosures to the condensed interim financial statements: Amendment clarifying the applicability of previous amendments to IFRS 7 issued in December 2011 with regard to offsetting financial assets and financial liabilities in relation to interim financial statements prepared under IAS 34. As per this amendment the IFRS 7 amendment is only applicable to the condensed interim financial statement to the extent that it is required by IAS 34 andprovides an update to information provided in the most recentannual report.
1 January 2016
IFRS 14 Regulatory Deferral Accounts
This new standard describes the financial reporting requirements for ‘regulatory deferral account balances’ that arise when an entity provides goods or services to customers at a price or rate that is subject to rate regulation. This standard is applicable to first time adopters of IFRS. This amendment is not applicable to Telkom.
1 January 2016
IAS 1 Presentation of Financial Statements
Amendment aiming to ensure that an entity does not reduce the understandability of its financial statements by obscuring material information with immaterial information or by aggregating material items that have different natures or functions. This amendment has been adopted and has no material impact on the group.
1 January 2016
IAS 19 Employee Benefits Discount rate: requirement to use the market yields on government bonds denominated in the currency of high quality corporate bonds in cases where there is no deep market for such bonds for the purpose of discounting post-employment benefit obligations. This amendment has been adopted and has no impact on the group.
1 January 2016
IAS 34 Interim Financial Reporting
Certain disclosures are to be given either in the interim financial statements or incorporated by a cross-reference from the interim financial statements to some other statement. These disclosures must also be available to users on the same terms and at the same time as the interim financial statements for the interim financial report to be complete. This amendment has been adopted and has no impact on the group.
1 January 2016
The following new standards and amendments to standards have been adopted.
Notes to the consolidated annualfinancial statementsfor the year ended 31 March 2016
2. Significant accounting policies (continued)
2.1 Basis of preparation (continued)
2. Significant accounting policies (continued)
2.1 Basis of preparation (continued)
Standard(s), Amendment(s) Salient feature of the changes Effective date
IFRS 10, IFRS 12 and IAS 28, Investment Entities: Applying the Consolidation Exception
Amendment granting exemption from preparation of consolidated financial statements for an intermediate parent entity that is subsidiary of an investment entity even if that parent entity measures all of its subsidiaries at fair value. Consequential amendments have also been made to IAS 28 exemption from applying the equity method for entities that are subsidiaries and hold interest in associate and joint venture. This amendment has been adopted and has no impact on the group.
1 January 2016
Standards and interpretations in issue not yet adopted and not yet effective
The following new standards, amendments to standards and interpretations in issue have not yet been adopted and are not yet effective. All standards are effective for annual periods beginning on or after the effective date. Pronouncement Title Effective date
IFRS 7 Financial Instruments Disclosures
Amendments requiring disclosures about the initial application of IFRS 9.
1 January 2018*
IFRS 7 Financial Instruments Disclosures
Additional hedge accounting disclosures resulting from the introduction of a hedge accounting chapter in IFRS 9.
1 January 2018*
IFRS 9 Financial Instruments IFRS 9 introduced new requirements for classifying and measuring financial assets and financial liabilities and the derecognition of financial instruments. The standard also includes guidance on impairment of assets and hedge accounting. The standard is likely to have an impact on Telkom as its financial instruments classification and measurements will need to change. However the materiality of the impact to Telkom has not been assessed.
1 January 2018*
IFRS 10 Consolidated Financial Statements
Amendment of the accounting for a split of gains or losses on the loss of control between:(i) the recognition of gains or losses in profit or loss of a parent company and(ii) the elimination against the carrying amounts of investments in the existing associate/joint venture and former subsidiary when control over the subsidiary is lost. This amendment will not have an impact on the group.
TBA
IFRS 15 Revenue from Contracts with Customers
IFRS 15 establishes principles for reporting about the nature, amount, timing and uncertainty of revenue and cash flows arising from an entity’s contracts with customers. It states that recognition of revenue should depict the transfer of promised goods or services to customers in an amount that reflects the consideration to which the entity expects to be entitled in exchange for those goods or services. The impact of the standard has not been assessed, however it is expected to have a material impact on Telkom because it will change the way that Telkom is currently measuring its revenue.
1 January 2018
Consolidated annual financial statements

20 21
Pronouncement Title Effective date
IFRS 16 Leases IFRS 16 introduces a single lessee accounting model that requires a lessee to recognise assets and liabilities for all leases with a term of more than 12 months, unless the underlying asset is of low value as defined.The impact of the standard to Telkom has not been assessed, however it is expected to have a material impact as the Telkom group currently has a number of assets that are carried as operating lease and are above the threshold.
1 January 2019
IAS 7 Disclosure Initiative This amendment requires an entity to provide disclosures that enable users of financial statements to evaluate changes in liabilities arising from financing activities, including both changes arising from cash flows and non-cash changes. This amendment will have an impact on the disclosure in relation to the notes to cash flow, however the impact is not expected to be material.
1 January 2017
IAS 12 Recognition of Deferred Tax Assets for Unrealised Losses
The amendment clarifies that an entity needs to consider whether tax law restricts the sources of taxable profits against which it may make deductions on the reversal of that deductible temporary difference. Furthermore, the amendments provide guidance on how an entity should determine future taxable profits and explains in which circumstances taxable profit may include the recovery of some assets for more than their carrying amount. The amendment is likely to have an impact on Telkom group, however the materiality of the impact to Telkom has not been assessed.
1 January 2017
IAS 28 Investment in Associates or Joint Ventures
See IFRS 10 Consolidated Financial Statements: Sale or Contribution of Assets between an Investor and its Associate or Joint Venture (Amendments to IFRS 10 and IAS 28): Narrow scope amendment to address an acknowledged inconsistency between the requirements in IFRS 10 and those in IAS 28 (2011), in dealing with the sale or contribution of assets between an investor and its associate or joint venture. Adoption of this amendment will not have an impact onthe group.
TBA
IAS 39 Financial Instruments: Recognition and Measurement
Amendments to permit an entity to elect to continue to apply the hedge accounting requirements in IAS 39 for a fair value hedge of the interest rate exposure of a portion of a portfolio of financial assets or financial liabilities when IFRS 9 is applied, and to extend the fair value option to certain contracts that meet the ‘own use’ scope exception. The impact of the amendment has not been assessed.
1 January 2018*
The standards apply when IFRS 9 is applied.
Notes to the consolidated annualfinancial statementsfor the year ended 31 March 2016
2. Significant accounting policies (continued) 2. Significant accounting policies (continued)
2.2 Change in accounting policy Reassessment of the Telkom Retirement Fund Defined Benefit (DB) MembersDuring the current reporting period, the group reassessed the accounting treatment of the Telkom Retirement Fund (TRF). The rules of the fund provide employees who were appointed prior to 1 September 2009 retiring from the defined contribution plan with an option to receive a pension from the fund.
Should a retiree elect to receive the pension, the employer is thereafter exposed to longevity and other actuarial risk. Such a pension is based on the plan assets allocated to the employee at the point of retirement based on the defined contribution portion of the plan. Those employees that do not elect to receive a pension from the fund would use their allocated plan assets to invest in annuities with unrelated parties. The classification rules within IAS 19 require that, where the employer is exposed to any actuarial risk, the entire fund be classified as a defined benefit plan (DB). This change in classification impacted on the statement of financial position, the statement of profit and loss and other comprehensive income. At 31 March 2016 the obligation balance is R1.274 billion (2015; R812 million; 2014:Rnil).
It should, however be noted that there is a difference between the IAS 19 project credit unit methodology valuations and the fund actuaries’ valuation, which reflects that the assets of the TRF are sufficient to cover the TRF’s liabilities towards active members and pensioners. The TRF is in a sound financial condition as at the valuation date in terms of section 16 of the Pension Funds Act, as amended. As at the latest statutory valuation date there was a surplus of R536 million in the pensioners account per the statutory valuation (after taking into account the solvency reserve of R2.3 billion).
2.3 Significant accounting judgements, estimates and assumptionsThe preparation of financial statements requires the use of estimates and assumptions that affect the reported amounts of assets and liabilities and disclosure of contingent assets and liabilities at the date of the financial statements and the reported amounts of revenue and expenses during the reporting periods. Although these estimates and assumptions are based on management’s best knowledge of current events and actions that the group may undertake in the future, actual results may ultimately differ from those estimates and assumptions.
The presentation of the results of operations, financial position and cash flows in the financial statements of the group is dependent upon and sensitive to the accounting policies, assumptions and estimates that are used as a basis for the preparation of these financial statements. Management has made certain judgements in the process of applying the group’s accounting policies. These, together with the key estimates and assumptions concerning the future, and other key sources of estimation uncertainty at the reporting date, are as follows:
2.3.1 Property, plant and equipment and intangible assetsThe useful lives of assets are based on management’s estimation. Management considers the impact of changes in technology, customer service requirements, availability of capital funding and required return on assets and equity to determine the optimum useful life expectation for each of the individual categories of property, plant and equipment and intangible assets. Due to the rapid technological advancement in the telecommunications industry as well as Telkom’s plan to migrate to a next generation network over the next few years, the estimation of useful lives could differ significantly on an annual basis due to unexpected changes in the roll-out strategy. The impact of the change in the expected useful life of property, plant and equipment is described more fully in note 13. The estimation of residual values of assets is also based on management’s judgement whether the assets will be sold or used to the end of their economic lives and what their condition will be like at that time. Changes in the useful lives and/or residual values are accounted for as a change in accounting estimate.
For intangible assets that incorporate both a tangible and intangible portion, management uses judgement to assess which element is more significant to determine whether it should be treated as property, plant and equipment or intangible assets.
Standards and interpretations in issue not yet adopted and not yet effective (continued)
2.1 Basis of preparation (continued)
*
Consolidated annual financial statements

22 23
2. Significant accounting policies (continued)
2.3 Significant accounting judgements, estimates and assumptions (continued)2.3.2 Asset retirement obligations Management’s judgement is exercised when determining whether an asset retirement obligation exists, and in determining the expected future cash flows and the discount rate used to determine its present value when the legal or constructive obligation to dismantle or restore the site arises, as well as the estimated useful life of the related asset.
2.3.3 Impairments of property, plant and equipment and intangible assetsManagement is required to make judgements concerning the cause, timing and amount of impairment as indicated in notes 13 and 14. In the identification of impairment indicators, management considers the impact of changes in current competitive conditions, cost of capital, availability of funding, technological obsolescence, discontinuance of services, market changes, legal changes, operating environments and other circumstances that could indicate that an impairment exists. The group applies the impairment assessment to its cash-generating unit. This requires management to make significant judgements concerning the existence of impairment indicators, identification of cash-generating units, remaining useful lives of assets and estimates of projected cash flows and fair value less costs of disposal. Management’s analysis of cash-generating units involves an assessment of a group of assets’ ability to independently generate cash inflows and involves analysing the extent to which different products make use of the same assets. Management’s judgement is also required when assessing whether a previously recognised impairment loss should be reversed.
Where impairment indicators exist, the determination of the recoverable amount of a cash-generating unit requires management to make assumptions to determine the fair value less cost of disposal and value in use. Value in use is calculated using the discounted cash flow valuation method. Key assumptions on which management has based its determination of fair value less costs of disposal include the existence of binding sale agreements, and for the determination of value in use include the weighted average cost of capital, projected revenues, gross margins, average revenue per customer, capital expenditure, expected customer bases and market share. The judgements, assumptions and methodologies used can have a material impact on the recoverable amount and ultimately the amount of any impairment.
In calculating value in use, consideration is given to the completion of a network that is still partially completed at the date of performing the impairment test. Significant judgement is applied in determining if network expansion should be treated as the completion of a partially completed asset or the enhancement of an asset (which cash flows are not allowed to be considered in calculation of value in use).
2.3.4 Impairment of receivablesAn impairment loss is recognised on trade receivables that are assessed to be impaired (refer to notes 15 and 20). The impairment is based on an assessment of the extent to which customers have defaulted on payments already due and an assessment on their ability to make payments based on their credit worthiness and historical write-offs experience. Should the assumptions regarding the financial condition of the customer change, actual write-offs could differ significantly from the impairment loss recognised.
2.3.5 Customer relationship periodsThe average customer relationship periods for Wholesale, Voice and Non-Voice services are utilised to amortise the deferred installation revenue and cost. Management makes judgements about the customer relationship period estimate based on the historical churn information. The churn is determined by considering the service installation and disconnection dates, the weighted customer base ageing and the service connection status of the customers. Changes in average customer relationship periods are accounted for as a change in accounting estimates.
Notes to the consolidated annualfinancial statement for the year ended 31 March 2016
2. Significant accounting policies (continued)
2.3 Significant accounting judgements, estimates and assumptions (continued)2.3.6 Deferred taxation assetManagement’s judgement is exercised when determining the probability of future taxable profits which will determine whether deferred taxation assets should be recognised or derecognised. The realisation of deferred taxation assets will depend on whether it is possible to generate sufficient taxable income, taking into account any legal restrictions on the length and nature of the taxation asset. When deciding whether to recognise unutilised deferred taxation credits as deferred tax assets, management needs to determine the extent that the future obligations are likely to be available for set-off against the deferred taxation asset. In the event that the assessment of the future obligation and future utilisation changes, the change in the recognised deferred taxation asset is recognised in profit or loss. The carrying amount of deferred tax assets is reviewed at each reporting date and adjusted to reflect changes in the probability that sufficient taxable profits will be available to allow all or part of the asset to be recovered.
The period of assessment of probable future taxable income for the purpose of assessing whether a deferred tax asset should be raised has been restricted to three years. The company has included the tax implications in the three-year forecast of taxable income which required the application of significant judgement and estimates.
2.3.7 TaxationManagement determines the income tax charge in accordance with the applicable complex tax laws and rules which are subject to interpretation. The calculation of the group’s total tax charge necessarily involves judgements, including those involving estimations, in respect of certain items whose tax treatment cannot be finalised until resolution has been reached with the tax authority or, as appropriate, through a formal legal process. The resolution of some of these items may give rise to material profits, losses and/or cash flows. Where the effect of these laws and rules is not clear, the taxation liability estimates are made by management on all highly probable tax positions based on the single most likely outcome approach. Tax assets are only recognised when the amounts receivable are virtually certain.
The resolution of taxation issues is not always within the control of the group and is often dependent on the efficiency of the legal processes. Some complex tax issues may take a number of years before they are resolved. Payments in respect of taxation liabilities for an accounting period result from payments on account and on the final resolution of open items. As a result, there can be substantial differences between the taxation charge in the statement of profit or loss and comprehensive income and the current tax payments.
2.3.8 Deferred taxation rateManagement makes judgements on the tax rate applicable based on the group’s expectations at reporting date on how the asset is expected to be recovered or the liability is expected to be settled.
2.3.9 Employee benefitsThe group provides defined benefit plans for certain post-employment benefits. The obligation and assets related to each of the post-retirement benefits are determined through an actuarial valuation. The actuarial valuation relies heavily on assumptions as disclosed in note 30. The assumptions determined by management make use of information obtained from the group’s employment agreements with staff andspensioners, market-related returns on similar investments, market-related discount rates and other available information. The assumptions concerning the interest on assets and expected change in liabilities are determined on a uniform basis, considering long-term historical returns and future estimates of returns and medical inflation expectations. In the event that further changes in assumptions are required, the future amounts of post-employment benefits may be affected materially.
The discount rate reflects the average timing of the estimated defined benefit payments. The discount rate is based on long-term South African Government bonds with the longest maturity period as reported by the Bond Exchange of South Africa. The discount rate is expected to follow the trend of inflation.
Consolidated annual financial statements

24 25
2. Significant accounting policies (continued)
2.3 Significant accounting judgements, estimates and assumptions (continued)2.3.9 Employee benefits (continued)The overall interest on assets is determined based on the market prices prevailing at that date, applicable to the period over which the obligation is to be settled.
The interest cost on the defined benefit obligation and the interest on assets are accounted for through the net interest cost based on the net defined benefit asset or liability and the discount rate, measured at the beginning of the year.
The forfeitable share incentives are allocated to employees based on vesting conditions linked to time and performance measures. The total shareholders’ return, free cash flow and Net Promoter Score are considered in estimating the fair value of the grant at grant date. Telkom allocates the number of shares per employee, based on a formula taking into account the annual guaranteed package, percentage of gross profit and share price at grant date. The shares to be allocated are limited to approximately 5 percent of issued share capital and vest between three and five years. The additional share scheme award provides for the granting of shares to eligible participating employees, equivalent in value to the increase in share price from the grant date (based on the specific grant price) to the vesting date.
2.3.10 LeasesThe group provides customer specific solutions to certain entities using access network equipment and involving leases with the group acting as the lessor. The group has determined, based on an evaluation of the terms and conditions of the arrangements that it retains, all the significant risks and rewards of ownership of the equipment and accounts for the contracts as finance leases. The determination of whether an arrangement is, or contains, a lease is based on the substance of the arrangement at inception date, whether fulfilment of the arrangement is dependent on the use of a specific asset or assets or the arrangement conveys a right to use the asset, even if that right is not explicitly specified in an arrangement. This can be the case for fibre optical cables. Judgement is applied in determining if a fibre arrangement specifies the fibre/spectrum/wavelength or merely capacity. If a portion is not physically distinct, it is not considered to be a specified asset.
Site co-location and tower-sharing agreements are assessed to determine whether they should be classified as a finance lease or operating lease on the basis of transfer of significant risks and rewards. Telkom acts as a lessor and lessee in these agreements.
2.3.11 Provisions For other provisions, estimates are made of legal or constructive obligations resulting in the raising of provisions, and the expected date of probable outflow of economic benefits to assess whether the provision should be discounted. Refer to note 28. Liabilities provided for legal matters require judgements regarding projected outcomes and ranges of losses based on historical experience and recommendations of legal counsel. Litigation is however unpredictable and actual costs incurred could differ materially from those estimated at the reporting date.
2.3.12 Contingent liabilitiesOn an ongoing basis the group is a party to various legal disputes, the outcomes of which cannot be assessed with a high degree of certainty. A liability is recognised where, based on the group’s legal views and advice, it is considered probable that an outflow of resources will be required to settle a present obligation that can be measured reliably. Disclosure of other contingent liabilities is made in note 38 unless the possibility of a loss arising is considered remote.
2.3.13 Contingent assetsContingent assets are not recognised in the financial statements. When there is a probability that there will be an inflow of economic benefits to Telkom relating to a contingent asset, the contingent asset is disclosed in note, 38. The related income and asset are only recognised when it is virtually certain that there will be an inflow of economic benefits.
2.3.14 Segment informationFor judgements, estimates and assumptions relating to operating segments refer to note 3.
Notes to the consolidated annualfinancial statementsfor the year ended 31 March 2016
2. Significant accounting policies (continued)
2.4 Summary of significant accounting policies2.4.1 Basis of consolidationThe consolidated financial statements incorporate the financial statements of Telkom and entities (including special purpose entities) controlled by Telkom, its subsidiaries and associates.
2.4.2 SubsidiariesSubsidiaries are investees controlled by the group. The group controls an investee when it is exposed to, or has rights to, variable returns from its involvement with the investee and has the ability to affect those returns through its power over the investee. The group consolidates the financial statements of subsidiaries from the date the control of the subsidiary commences until the date that control ceases.
2.4.3 Transactions with non-controlling interestsNon-controlling interests in subsidiaries are identified separately from the group’s equity. The interests of non-controlling shareholders are initially measured either at fair value or at the non-controlling interests’ proportionate share of the fair value of the acquiree’s identifiable net assets. The choice of measurement basis is made on an acquisition by acquisition basis. Subsequent to acquisition, the carrying amount of non-controlling interests is the amount of those interests at initial recognition plus the non-controlling interests’ share of subsequent changes in equity. Total comprehensive income is attributed to non-controlling interests even if this results in the non-controlling interests having a deficit balance.
2.4.4 Joint arrangementsA joint arrangement is an arrangement where two or more parties have joint control over another entity. In a joint arrangement parties are bound by a contractual arrangement that gives two or more of the parties joint control of the arrangement. A joint arrangement is classified and accounted for as either a joint operation or joint venture.
In a joint operation parties that have joint control of the arrangement have rights to the assets, and obligations for the liabilities, relating to the arrangement. These parties are the joint operators. The group recognises its own assets, liabilities, revenues and expenses that are incurred or earned separately to other joint operators. Otherwise the group recognises its share of assets, liabilities, revenues and expenses when these items are incurred jointly.
In a joint venture parties that jointly control the joint arrangement have rights to the net assets of the arrangement. These parties are called joint ventures. The group accounts for the joint venture using the equity method. Under the equity accounting method, the investment in the joint venture is carried in the statement of financial position at costplus post-acquisition changes in the group’s share of the net assets of the joint venture. The share of the profit of the joint venture is shown on the face of the statement of profit or loss and other comprehensive income.
Where necessary, adjustments are made to the financial statements of subsidiaries and joint ventures to bring the accounting policies used in line with those used by the group.
2.4.5 AssociatesAn associate is an entity over which the group has significant influence. The group has significant influence over an associate when it has the power to participate in the financial and operating policy decisions of the investee. The group recognises its interests in associates by applying the equity method.
2.4.6 Investments in subsidiaries, associates and joint venturesInvestments in subsidiaries, associates and joint ventures are carried at cost at company level and adjusted for any impairment losses.
Consolidated annual financial statements

26 27
2. Significant accounting policies (continued)
2.4 Summary of significant accounting policies (continued)2.4.7 Business combinationsAcquisitions of subsidiaries and businesses are accounted for using the acquisition method. The consideration for each acquisition is measured at the aggregate of the fair values (at acquisition date) of assets given, liabilities incurred or assumed, and equity instruments issued by the group in exchange for control of the acquiree and non-controlling interest.
If the initial accounting for a business combination is incomplete by the end of the reporting period in which the combination occurs, the group reports provisional amounts for the items for which the accounting is incomplete. Those provisional amounts are adjusted during the measurement period, or additional assets or liabilities are recognised, to reflect new information obtained about facts and circumstances that existed as of the acquisition date that, if known, would have affected the amounts recognised as of that date.
Any transaction costs that the group incurs in connection with the business combination such as legal fees, due diligence fees and other professional and consultation fees are expensed as incurred.
Business combinations in which all of the combining entities or businesses are ultimately controlled by the same party/parties both before and after the business combinations (and where control is not transitory) are referred to as common control business combinations. The carrying amounts of the acquired entity are the consolidated carrying amounts as reflected in the consolidated financial statements of the selling entity. The excess of the cost of the transaction over the acquirer’s proportionate share of the net asset value acquired in common control transactions, is allocated to equity. This is in accordance with the pooling of interest method.
2.4.8 GoodwillGoodwill arising in a business combination is recognised as an asset at the date of acquisition.
Goodwill is measured as the excess of the sum of the consideration transferred, the amount of any non-controlling interests in the acquiree, and the fair value of the acquirer’s previously held equity interest in the acquiree (if any) over the net fair value of the acquiree’s identifiable net assets.
If the group’s interest in the fair value of the acquiree’s identifiable net assets exceeds the sum of the consideration transferred, the amount of any non-controlling interests in the acquiree and the fair value of the acquirer’s previously held equity interest in the acquiree, the excess is recognised immediately in profit or loss as a bargain purchase gain.
On disposal of a subsidiary, the attributable amount of goodwill is included in the determination of profit or loss on disposal.
2.4.9 Revenue recognitionRevenue comprises the fair value of the consideration received or receivable for the sale of goods and services in the ordinary course of the group’s activities. Revenue is shown net of value-added tax, returns and rebates and after eliminating sales within the group.
Telkom assesses whether it is acting as an agent or principal in its revenue arrangement using the specific criteria in IAS 18. According to these criteria; the principal has exposure to the significant risks and rewards associated with the sale of goods or rendering of services. Examples of principalship include assumption of inventory risk, customer credit risk, responsibility to provide products or services and having latitude in setting prices.
Notes to the consolidated annualfinancial statementsfor the year ended 31 March 2016
2. Significant accounting policies (continued)
2.4 Summary of significant accounting policies (continued)2.4.10 Dealer incentivesThe group provides incentives to its dealers by means of trade discounts. Incentives are based on sales volume and value of transactions. Revenue is recognised gross of discounts to the extent that the discounts are not granted to the customer. Revenue is recognised net of discounts when the discounts are granted to the customer.
2.4.11 Retail voicePre-paidPre-paid traffic service and payphone card revenue collected in advance is deferred and recognised based on actual usage or upon expiration of the usage period, whichever comes first. The terms and conditions of certain pre-paid products allow unused minutes to be carried over. Revenue related to the unused minutes carried over is deferred until usage or expiration.
Telkom provides incentives to its retail payphone card distributors as trade discounts. Revenue for retail payphone cards is recorded as traffic revenue, net of these discounts as the cards are used.
Post-paidRevenue related to local, long distance, network-to-network, roaming and international call connection services is recognised when the call is placed or the connection provided.
2.4.12 InterconnectionInterconnection revenue for call termination, call transit, and network usage is recognised as the traffic flow occurs.
2.4.13 Customer premises equipmentRevenue related to the sale of communication equipment, products and value-added services is recognised upon delivery and acceptance of the product or service by the customer.
2.4.14 Data The group provides data communication services under post-paid and pre-paid payment arrangements. Revenue includes fees for installation and activation, which are deferred over the expected average customer relationship period. Costs incurred on first time installations that form an integral part of the network are capitalised and depreciated over the life of the expected average customer relationship period. All other installation and activation costs are expensed as incurred. Post-paid and pre-paid service arrangements include subscription fees, typically monthly fees, which are recognised over the subscription period. Revenue related to the unused data carried over is deferred until usage or expiration.
2.4.15 Rendering of servicesRevenue from a contract to provide a service is recognised by reference to the stage of completion of the contract.
Stage of completion of the contract is determined as follows: - Installation fees are recognised by reference to the stage of completion of the installation, determined as the
proportion of the total time expected to install to the time that has elapsed at the reporting date.
- Servicing fees included in the price of products sold are recognised by reference to the proportion of the cost to the total cost of providing the servicing for the product sold, taking into account historical trends in the number of services actually provided on past goods sold.
- Revenue from time and material contracts is recognised at the contractual rates as labour hours are delivered and direct expenses are incurred.
Consolidated annual financial statements

28 29
2. Significant accounting policies (continued)
2.4 Summary of significant accounting policies (continued)2.4.16 Deferred revenue and expensesActivation revenue and costs are deferred and recognised systematically over the expected duration of the customer relationship because it is considered to be part of the customers’ ongoing rights to telecommunication services and the operator’s continuing involvement. Any excess of the costs over revenues is expensed immediately.
2.4.17 Post-paid contract and pre-paid productContract products are defined as arrangements with multiple deliverables. The arrangement consideration is allocated to each deliverable, based on the fair value of each deliverable on a selling price standalone basis as a percentage of the aggregated fair value of individual deliverables.
- Revenue from the handset is recognised when the handset is delivered. - Monthly service revenue received from the customer is recognised in the period in which the service is delivered. - Airtime revenue is recognised on the usage basis commencing on activation date. Unused airtime is deferred in full
and recognised in the month of usage or on termination of the contract by the subscriber. - Revenue from the sale of pre-paid products is recognised when the product is delivered to the customer. - Revenue from the sale of pre-paid airtime is deferred until such time as the customer uses the airtime, or the credit
expires. - Free minutes, data and SMSs are accounted for as a separate identifiable deliverable and revenue allocated to free
minutes is deferred and recognised when the free minutes are used, or expire.
2.4.18 Customer loyalty programmesThe free minutes and data (award credits) granted to Telkom customers are accounted for as a separately identifiable component of a sales transaction in which they are granted. Award credits are determined by reference to their fair value. The fair value of award credits takes into account the amount of discounts or incentives that would otherwise be offered to customers who have not earned award credits from the initial sale transaction. Revenue from award credits is deferred and recognised as revenue when the customer redeems the award credit.
2.4.19 Connection incentivesIntermediaries and customers are paid cash as a connection incentive. Cash incentives paid to intermediaries are expensed in the period in which they are incurred. Cash incentives paid to customers are recognised as intangible assets and expensed over the contract period.
2.4.20 IncentivesIncentives paid to service providers and dealers for products delivered to the customer are expensed as incurred. Incentives paid to service providers and dealers for services delivered are expensed in the period that the related revenue is recognised.
2.4.21 Roaming agreementsAmounts paid to other mobile operators in terms of roaming agreements are expensed at the earlier of minutes being utilised or expiry thereof. A prepayment to this effect is recognised if it is probable that the group will obtain future economic benefits from such unused minutes.
Notes to the consolidated annualfinancial statementsfor the year ended 31 March 2016
2. Significant accounting policies (continued)
2.4 Summary of significant accounting policies (continued)2.4.22 Cost of salesCost of sales for any period is the amount of the inventory that was recognised as an expense during that period. When inventories are sold, the carrying amount is recognised as part of cost of sales. Any write-down of inventories to net realisable value and any loss of inventory or reversals of previous write-downs or losses are recognised in cost of sales in the period the write-down, loss or reversal occurs. Cost of sales includes all the expenses that can be directly tied to revenue received for services provided and goods sold to customers.
2.4.23 Property, plant and equipmentThe cost of an item of property, plant and equipment is recognised as an asset if it is probable that the future economic benefits associated with the item will flow to the group and the cost of the item can be measured reliably.
Property, plant and equipment is stated at historical cost less accumulated depreciation and any accumulated impairment losses. Each component of an item of property, plant and equipment with a cost that is significant in relation to the total cost of the item is depreciated separately. Depreciation is charged from the date the asset is available for use on a straight-line basis over the estimated useful life and ceases at the earlier of the date that the asset is classified as held for sale and the date the asset is derecognised. Idle assets continue to attract depreciation.
Assets under construction represents freehold buildings, operating software, network and support equipment and includes all direct expenditure as well as related borrowing costs capitalised, but excludes the costs of abnormal amounts of waste material, labour, or other resources incurred in the production of self-constructed assets.
The estimated useful lives applied are provided in note 6.7.
2.4.24 Intangible assetsAt initial recognition acquired intangible assets are recognised at their purchase price, including import duties and non-refundable purchase taxes, after deducting trade discounts and rebates. The recognised cost includes any directly attributable costs for preparing the asset for its intended use. Internally generated intangible assets are recognised at cost comprising all directly attributable costs necessary to create and prepare the asset to be capable of operating in the manner intended by management. Licences, software, trademarks, copyrights and other intangible assets are carried at cost less accumulated amortisation and any accumulated impairment losses. Amortisation commences when the intangible assets are available for their intended use and is recognised on a straight-line basis over the assets’ expected useful lives.
Amortisation ceases at the earlier of the date that the asset is classified as held for sale and the date that the asset is derecognised.
The residual value of intangible assets is the estimated amount that the group would currently obtain from the disposal of the asset, after deducting the estimated cost of disposal, if the asset were already of the age and in the condition expected at the end of its useful life. Due to the nature of the asset the residual value is assumed to be zero unless there is a commitment by a third party to purchase the asset at the end of its useful life or when there is an active market that is likely to exist at the end of the asset’s useful life, which can be used to estimate the residual values. The residual values of intangible assets, the amortisation methods used and their useful lives are reviewed on an annual basis at reporting date and adjusted prospectively as required.
Assets under construction represents application and other non-integral software and includes all direct expenditure as well as related borrowing costs capitalised, but excludes the costs of abnormal amounts of waste material, labour, or other resources incurred in the production of self-constructed assets.
The expected useful lives applied are provided in note 6.7.
Consolidated annual financial statements

30 31
2. Significant accounting policies (continued)
2.4 Summary of significant accounting policies (continued)2.4.25 Asset retirement obligationsAsset retirement obligations related to property, plant and equipment are recognised at the present value of expected future cash flows when the obligation to dismantle or restore the site arises. The increase in the related asset’s carrying value is depreciated over its estimated useful life. The unwinding of the discount is included in finance charges and fair value movements. Changes in the measurement of an existing liability that result from changes in the estimated timing or amount of the outflow of resources required to settle the liability, or a change in the discount rate are accounted for as increases or decreases to the original cost of the recognised assets. If the amount deducted exceeds the carrying amount of the asset, the excess is recognised immediately in profit or loss.
2.4.26 Impairment of property, plant and equipment and intangible assetsThe group regularly reviews its non-financial assets and cash-generating units for any indication of impairment. When indicators, including changes in technology, market, economic, legal and operating environments, availability of funding or discontinuance of services occur and could result in changes of the asset’s or cash-generating unit’s estimated recoverable amount, an impairment test is performed.
Previously recognised impairment losses, other than goodwill, are reviewed annually for any indication that they may no longer exist or may have decreased. If any such indication exists, the recoverable amount of the asset is estimated. Such impairment losses are reversed in profit or loss if the recoverable amount has increased as a result of a change in the estimates used to determine the recoverable amount, but not to an amount higher than the carrying amount that would have been determined (net of depreciation or amortisation) had no impairment loss been recognised in prior years.
2.4.27 InventoriesMerchandise, installation material and maintenance inventories are stated at the lower of cost, determined on a weighted average basis, and estimated net realisable value. Telkom Mobile’s inventory cost is determined according to the first-in-first-out basis.
2.4.28 Financial instruments Recognition and measurementAll regular way transactions are accounted for on settlement date. Regular way purchases or sales are purchases or sales of financial assets that require delivery of assets within the period generally established by regulation or convention in the marketplace. The measurement of financial assets and liabilities is set out below and presented in a table in note 15.
2.4.29 Subsequent measurementSubsequent to initial recognition, the group classifies financial assets as at fair value through profit or loss, held-to-maturity investments or loans and receivables. Financial liabilities are classified as at fair value through profit or loss or other financial liabilities.
The fair value of financial assets and liabilities that are actively traded in financial markets is determined by reference to quoted market prices at the close of business on the reporting date. The group recognises transfers between levels of the fair value hierarchy as of the end of the reporting period during which the event or change in circumstances that caused the transfer has occurred.
Notes to the consolidated annualfinancial statementsfor the year ended 31 March 2016
2. Significant accounting policies (continued)
2.4 Summary of significant accounting policies (continued)2.4.30 Other financial liabilitiesOther financial liabilities, including borrowings and derivative liabilities, are initially measured at fair value net of transaction costs, with gains and losses arising on the change in fair value recognised in net finance charges and fair value movements for the year.
Other financial liabilities are subsequently measured at amortised cost, with interest expense recognised in finance charges and fair value movements, on an effective interest rate basis.
2.4.31 Cash and cash equivalentsCash and cash equivalents comprises cash on hand, deposits held on call and short-term deposits with an initial maturity of less than three months when entered into.
For the purpose of the statement of cash flows, cash and cash equivalents consists of cash and cash equivalents defined above, net of credit facilities utilised.
2.4.32 DerecognitionA financial instrument or a portion of a financial instrument is derecognised and a gain or loss recognised when the group’s contractual rights expire, financial assets are transferred or financial liabilities are extinguished. On derecognition of a financial asset or liability, the difference between the consideration and the carrying amount on the settlement date is included in finance charges and fair value movements for the year.
Bonds and commercial paper bills are derecognised when the obligation specified in the contract is discharged. The difference between the carrying value of the bond and the amount paid to extinguish the obligation is included in finance charges and fair value movements for the year.
2.4.33 Hedge accountingThe group uses derivative financial instruments, such as forward currency contracts, cross-currency swaps and options, to hedge its foreign currency risks and interest rate risks. Derivative financial instruments including forward currency contracts that are designated as hedging instruments in an effective hedge are initially recognised at fair value on the date on which a derivative contract is entered into. Telkom applies fair value hedge accounting for firm commitments.Designated hedging instruments and firm commitments are subsequently remeasured at fair value at each reporting date. The gain or loss relating to both the effective and ineffective portion of hedging instruments is recognisedimmediately in profit or loss on remeasurement. When a firm commitment is designated as a hedged item,the subsequent cumulative change in the fair value of the firm commitment attributable to the hedged risk is recognised as an asset or liability with a corresponding gain or loss recognised in profit and loss.
2.4.34 Treasury sharesWhere the group acquires, or in substance acquires, its own shares, such shares are measured at acquisition cost and disclosed as a reduction of equity. No gain or loss is recognised in profit or loss on the purchase, sale, issue or cancellation of the group’s own equity instruments. Such shares are not remeasured for changes in fair value.
Where the group chooses or is required to buy equity instruments from another party to satisfy its obligations to its employees under the share-based payment arrangement by delivery of its own shares, the transaction is accounted for as equity settled. This applies regardless of whether the employee’s rights to the equity instruments were granted by the group itself or by its shareholders or were settled by the group itself or its shareholders.
Consolidated annual financial statements

32 33
2. Significant accounting policies (continued)
2.4 Summary of significant accounting policies (continued)2.4.35 LeasesA lease is classified as a finance lease if it transfers substantially all the risks and rewards incidental to ownership. All other leases are classified as operating leases.
The land and buildings elements of a lease of land and buildings are considered separately for the purposes of lease classification unless it is impracticable to do so.
2.4.36 Employee benefitsPost-employment benefitsThe group provides defined benefit and defined contribution plans for the benefit of employees. These plans are funded by the employees and the group, taking into account recommendations of the independent actuaries. The post-retirement telephone rebate liability is unfunded.
Defined benefit plansThe group provides defined benefit plans for pension, retirement, post-retirement medical aid benefits and telephone rebates to qualifying employees. The group’s net obligation in respect of defined benefits is calculated separately for each plan by estimating the amount of future benefits earned in return for services rendered.
The amount reported in the statement of financial position represents the present value of the defined benefit obligations, using the projected credit unit method, reduced by the fair value of the related plan assets. To the extent that there is uncertainty as to the entitlement to the surplus, no asset is recognised. The effects of this asset limitation and actuarial gains and losses are recognised in other comprehensive income. Interest, service cost, settlement gains or losses and curtailment gains or losses related to the defined benefit plan are recognised in the statement of profit or loss.
Telkom Retirement Fund reservesIn terms of its rules, Telkom Retirement Fund operates a number of reserve accounts, namely member share account, risk and expense reserve account, processing error account, pension reserves account and solvency reserve account.The risk and expense reserve account comprises the funds required to support fluctuations in the payment of the in-service death and disability benefits, and administration expenses. The processing error reserve account comprises the balance as identified at 31 March 2008 plus all investment return and appreciation earned by the fund less investment-related expenses, taxation and all amounts allocated to members, pensioners and reserve accounts. The member surplus account comprises the actuarial surplus allocated to members and pensioners. The solvency reserve is held within the pensions account to act as a buffer against worse-than-expected experience and equal to an amount set by the actuary of the fund from time to time to ensure a prudent funding level that is subject to affordability. The pensions account comprises the funds required to pay each pension that has been granted in terms of the rules. All these reserves are taken into account by the actuaries determining the net value of the fund (fund assets less the fund obligation).
Notes to the consolidated annualfinancial statementsfor the year ended 31 March 2016
2. Significant accounting policies (continued)
2.4 Summary of significant accounting policies (continued)2.4.37 Share-based paymentsThe group has a share-based payment compensation plan, facilitated through Telkom Share Plan (TSP). The plan is an equity-settled plan, consisting of the Long-term Incentive Plan (LTIP) and the Employee Share Ownership Plan (ESOP).
Grants of equity instruments, are made to employees in terms of the LTIP and the ESOP and are classified as equity-settled share-based payment transactions. The expense relating to the services rendered by the employees,and the corresponding increase in equity, is measured at the fair value of the equity instruments at their date of grant based on the market price at grant date. This compensation cost is recognised over the vesting period, based on the best available estimate at each reporting date of the number of equity instruments that are expected to vest.
During the vesting period; participants have all the shareholders' rights; including the right to vote and share in the dividend distribution. The dividend received by employees is recognised as a reduction in equity. The amount of dividend received by employees who have left service prior to vesting conditions being met is recognised in profit and loss at the end of each reporting date.
Additional share award schemeThe additional share scheme award provides for the granting of shares to eligible participating employees, equivalent in value to the increase in share price from the grant date (based on the specific grant price) to the vesting date.
2.4.38 Cell captiveThe cell captive is accounted for at fair value and all fair value movements are accounted for in the statement of profit or loss.
Consolidated annual financial statements

34 35
2.5 Adjustments to the consolidated statement of profit or loss and other comprehensive income
Group Company
for the year ended 31 March 2015 for the year ended 31 March 2015
As previously
reported
Rm
Reclassifica-tion of Trudon
group as not held for
sale*Rm
Reassess-ment of Telkom
Retirement Fund**
Rm
Restated
Rm
As previously
reported
Rm
Reassess-ment of Telkom
Retirement Fund**
Rm
Restated
Rm
Continuing operations
Operating revenue 31 675 1 085 32 760 31 611 31 611
Payments to other operators 2 930 2 930 2 956 2 956
Cost of sales 2 787 462 3 249 2 787 2 787
Net operating revenue 25 958 623 – 26 581 25 868 – 25 868
Other income 699 32 731 743 743
Operating expenses 18 270 147 54 18 471 18 176 54 18 230
Employee expenses 9 354 54 54 9 462 9 288 54 9 342
Selling, general and administrative expenses 4 712 43 4 755 4 693 4 693
Service fees 3 212 7 3 219 3 208 3 208
Operating leases 992 43 1 035 987 987
EBITDA 8 387 508 (54) 8 841 8 435 (54) 8 381
Depreciation of property, plant and equipment 4 500 6 – 4 506 4 480 4 480
Amortisation of intangible assets 758 21 – 779 757 757
Write-offs, impairment and losses of property, plant and equipment and intangible assets 220 – – 220 220 220
Operating profit 2 909 481 (54) 3 336 2 978 (54) 2 924
Investment income 283 10 293 506 506
Finance charges and fair value movements 471 2 – 473 471 471
Interest 560 2 – 562 560 – 560
Foreign exchange loss and fair value movements (89) – – (89) (89) – (89)
Profit before taxation 2 721 489 (54) 3 156 3 013 (54) 2 959
Taxation expense/(income) (168) 122 18 (28) (190) 18 (172)
Profit from continuing operations 2 889 367 (72) 3 184 3 203 (72) 3 131
Profit from discontinued operations 367 (367) – – – – –
Profit for the year 3 256 – (72) 3 184 3 203 (72) 3 131
Other comprehensive income
Items that will not be reclassified to profit or lossDefined benefit plan actuarial losses (944) – (1 009) (1 953) (944) (1 009) (1 953)
Defined benefit plan asset ceiling limitation 448 – 251 699 448 251 699
Income tax relating to components of other comprehensive income 139 – 18 157 139 18 157
Other comprehensive loss for the period, net of taxation (357) – (740) (1 097) (357) (740) (1 097)
Total comprehensive income for the year 2 899 – (812) 2 087 2 846 (812) 2 034
Total operations***
Basic earnings per share (cents) 617.1 603.0
Diluted earnings per share (cents) 604.5 590.7
Notes to the consolidated annualfinancial statementsfor the year ended 31 March 2016
The restatement is due to the reclassification of the Trudon group as not held for sale. See note 11.Refer to note 2.2.Total continuing operations EPS is the same as the continuing operations EPS.
2.6 Adjustments to the consolidated statement of financial position
Group Company
At 31 March 2015 At 31 March 2015
As previously
reported
Rm
Reclass-ification
of Trudon group as not held for sale*
Rm
Reassess-ment of Telkom Retire-ment
Fund**
Rm
Restated
Rm
As previously
reported
Rm
Reclass-ification
of Trudon investment as not held
for sale*Rm
Reassess-ment of Telkom Retire-ment
Fund**
Rm
Restated
Rm
Assets
Non-current assets 30 554 301 – 30 855 30 521 167 30 688
Property, plant and equipment 24 387 92 – 24 479 24 323 – – 24 323
Intangible assets 2 793 189 – 2 982 2 793 – – 2 793
Investments in subsidiaries – – 35 167 – 202
Other investments 2 231 – – 2 231 2 227 – – 2 227
Employee benefits 452 – – 452 452 – – 452
Other financial assets 28 – – 28 28 – – 28
Finance lease receivables 413 – – 413 413 – – 413
Deferred taxation 250 20 – 270 250 – – 250
Current assets 10 511 616 – 11 127 10 409 – 10 409
Inventories 552 86 – 638 531 – – 531
Income tax receivable 1 10 – 11 – – – –
Current portion of finance lease receivables 200 – – 200 200 – – 200
Trade and other receivables 4 895 493 – 5 388 4 887 – – 4 887
Current portion of other financial assets 1 247 – – 1 247 1 247 – – 1 247
Cash and cash equivalents 3 616 27 – 3 643 3 544 – – 3 544
Assets of disposal group classified as held for sale 917 (917) – – 167 (167) – –
Total assets 41 982 – – 41 982 41 097 – – 41 097
Equity and liabilities
Equity attributable to owners of the parent 25 676 – (812) 24 864 24 493 – (812) 23 681
Share capital 5 208 – - 5 208 5 208 – - 5 208
Share-based compensation reserve 126 – - 126 126 – - 126
Non-distributable reserves 1 507 – - 1 507 786 – - 786
Retained earnings 18 835 – (812) 18 023 18 373 – (812) 17 561
Non-controlling interest 363 363 – – –
Total equity 26 039 – (812) 25 227 24 493 – (812) 23 681
Non-current liabilities 4 421 39 812 5 272 4 407 – 812 5 219
Interest-bearing debt 3 244 – – 3 244 3 244 – – 3 244
Employee-related provisions 437 15 812 1 264 437 – 812 1 249
Non-employeerelated provisions 39 22 – 61 39 – – 39
Deferred revenue 687 – – 687 687 – – 687
Deferred taxation 14 2 – 16 – – – –
***
***
Consolidated annual financial statements

36 37
2.6 Adjustments to the consolidated statement of financial position(continued)
Group Company
At 31 March 2015 At 31 March 2015
As previously
reported
Rm
Reclass-ification
of Trudon group as not held for sale*
Rm
Reassess-ment of Telkom Retire-ment
Fund**
Rm
Restated
Rm
As previously
reported
Rm
Reclass-ification
of Trudon invest-ment
as not held for
sale*Rm
Reassess-ment of Telkom Retire-ment
Fund**
Rm
Restated
Rm
Current liabilities 11 403 80 – 11 483 12 197 – 12 197
Trade and other payables 5 571 64 – 5 635 6 380 – – 6 380
Shareholders for dividend 19 – – 19 19 – – 19
Current portion of interest-bearing debt 1 612 – – 1 612 1 612 – – 1 612
Current portion of employee-related provisions 1 867 15 – 1 882 1 855 – – 1 855
Current portion of non-employee related provisions 302 1 – 303 302 – – 302
Current portion of deferred revenue 1 502 – – 1 502 1 499 – – 1 499
Income tax payable 344 – – 344 344 – – 344
Current portion of other financial liabilities 185 – – 185 185 – – 185
Credit facilities utilised 1 – – 1 1 – – 1
Liabilities of disposal group classified as held for sale 119 (119) – – – – – –
Total liabilities 15 943 – 812 16 755 16 604 – 812 17 416
Total equity and liabilities 41 982 – – 41 982 41 097 – – 41 097
Notes to the consolidated annual financial statementsfor the year ended 31 March 2016
The restatement is due to the reclassification of the Trudon group as not held for sale,See note 11 and note 16.Refer to note 2.2.
2.7 Adjustments to the statement of cash flows GroupAt 31 March 2015
As previously reported
Rm
Reclassification of Trudon group as not held for sale*
Rm
Restated
Rm
Cash flows from operating activities 6 226 55 6 281
Cash receipts from customers 31 852 1 100 32 952
Cash paid to suppliers and employees (25 210) (943) (26 153)
Cash generated from operations 6 642 157 6 799
Interest received 470 32 502
Finance charges paid (491) (2) (493)
Taxation paid (274) (132) (406)
Cash generated from operations before dividend paid 6 347 55 6 402
Dividend paid (121) – (121)
Cash flows from investing activities (5 113) (55) (5 168)
Proceeds on disposal of property, plant and equipment and intangible assets 253 – 253
Proceeds on disposal of investment 750 – 750
Additions for capital expansion (5 015) (55) (5 070)
Increase in repurchase agreements (1 101) – (1 101)
Cash flows from financing activities 685 – 685
Loans raised 1 000 – 1 000
Loans repaid (310) – (310)
Finance lease capital repaid (170) – (170)
Settlement of derivatives 165 – 165
Net increase in cash and cash equivalents 1 798 – 1 798
Net cash and cash equivalents at beginning of period 1 841 – 1 841
Trudon cash and cash equivalents classified as held for sale (27) 27 –
Effect of foreign exchange rate differences on cash and cash equivalents 3 – 3
Net cash and cash equivalents at end of period 3 615 27 3 642
***
Refer to note 11.*
Consolidated annual financial statements

38 39
3. Segment information
The Telkom group is organised into business units based on products and services and has two reportable segments, namely:i) Telkom, which provides fixed-line access, fixed-line usage, data communications services, mobile voice services and
handset salesii) BCX, which provides business solutions based on information and communication technology and runs ICT systems and manages products, services and solutions.
The Other segment represents Trudon, Swiftnet and other non-trading entities.
The group did not report segment information in prior year as the chief operating decision-maker (CODM) managed the group business on a combined basis. During the current year the group acquired BCX and the CODM manages Telkom and BCX as two segments.
The executive committee assesses the performance of the operating segments based on a measure of operating profit.
The group announced its aspiration to implement a more flexible and agile operating model and launched Openserve on 13 October 2015 which will require a reassessment of segment reporting as progress is made in implementing the new operating and reporting model to manage performance.
Notes to the consolidated annual financial statementsfor the year ended 31 March 2016
3. Segment information (continued)
Telkom BCX Other Eliminations Consolidated
Rm Rm Rm Rm Rm
2015
Operating revenue 31 611 – 1 298 (149) 32 760
External customers 31 576 – 1 184 32 760
Inter-segment 35 – 114 (149) –
Reconciliation of operating profit to profit before tax EBITDA for reportable segments excluding voluntary packages 8 972 – 524 (64) 9 432 Voluntary packages (591) – – – (591)
Depreciation, amortisation, impairment, write-offs and losses (5 457) – (59) 11 (5 505) Operating profit 2 924 – 465 (53) 3 336
Investment income 506 – 14 (227) 293
Finance charges and fair value movement (471) – (2) – (473)Profit before taxation 2 959 – 477 (280) 3 156
Other segment information
Capital expenditure for property, plant and equipment 4 018 – 21 – 4 039Capital expenditure for intangible assets 932 – 55 – 987
3. Segment information(continued)
Telkom BCX Other Eliminations Consolidated
Rm Rm Rm Rm Rm
2016
Operating revenue 32 106 4 810 1 255 (846) 37 325
External customers 32 064 4 116 1 145 – 37 325
Inter-segment 42 694 110 (846) –
Reconciliation of operating profit to profit before tax EBITDA for reportable segments excluding voluntary packages 10 217 274 499 (36) 10 954Voluntary packages (2 193) – – – (2 193)
Depreciation, amortisation,impairment, write-offs and losses (5 274) (61) (58) (49) (5 442)Operating profit 2 750 213 441 (85) 3 319
Investment income 812 7 22 (638) 203
Finance charges and fair value movement (618) (18) – 14 (622)Profit before taxation 2 944 202 463 (709) 2 900
Other segment information
Capital expenditure for property, plant and equipment 5 105 125 33 – 5 263Capital expenditure for intangible assets 656 13 57 – 726
4. Operating revenue
Revenue recognitionThe group provides fixed-line, mobile, data communication services and communication-related products to business, residential, wholesale, payphone and mobile customers. Revenue represents the fair value of fixed or determinable consideration that has been received or is receivable.
Group Company
2016Rm
Restated2015
Rm2016
Rm2015
Rm
37 325 32 760 32 106 31 611
Voice 15 299 15 590 15 309 15 594
Interconnection 1 267 1 493 1 270 1 493
Data 11 791 11 473 11 815 11 405
Customer premises equipment 3 175 2 704 3 175 2 704
Sundry revenue 1 677 1 500 537 415
IT services - Business Connexion 4 116 – – –
Operating revenue increased due to higher mobile data revenue, higher fixed-line subscription revenue, higher equipment sales and the consolidation of BCX. This is partially offset by the decline in fixed-line voice revenue and lower connectivity revenue.
Consolidated annual financial statements

40 41
6. Expenses Group Company
2016Rm
Restated2015
Rm2016
Rm2015
Rm
6.1 Payments to other operators 2 793 2 930 2 813 2 956
Payments to other operators decreased mainly due to the lower mobile termination rates.
6.2 Cost of sales 6 969 3 249 3 000 2 787
The increase in cost of sales is largely attributable to the inclusion of BCX, amounting to R3.5 billion, and the increase in the sale of mobile devices.
6.3 Employee expenses 10 901 9 462 10 105 9 342
Salaries and wages 6 678 7 248 6 129 7 166
Medical aid contributions 17 – – –
Subsidiaries' retirement contributions: Defined contribution plan 44 4 – –
Post-retirement pension and retirement fund (refer to notes 28 and 30) 856 694 856 694
Current service cost 112 107 112 107
Employer contribution: Service cost 551 617 551 617
Interest cost 3 113 3 336 3 113 3 336
Interest on plan assets (3 079) (3 366) (3 079) (3 366)
Curtailment loss: Telkom Retirement Fund* 159 – 159 –
Post-retirement medical aid (refer to notes 28 and 30) 26 (174) 23 (177)
Current service cost 6 5 5 4
Interest cost 185 278 183 276
Settlement loss/(gain) 3 (221) 3 (221)
Interest on plan asset (216) (236) (216) (236)
Curtailment loss 48 – 48 –
Post-retirement telephone rebates (refer to notes 28 and 30) 40 36 40 36
Current service cost 4 3 4 3
Interest cost 34 33 34 33
Curtailment loss 2 – 2 –
Share-based compensation expense (refer to note 24) 115 115 115 115
Other benefits** 3 586 2 025 3 403 1 994
Employee expenses capitalised (461) (486) (461) (486)
The increase in employee expenses is mainly due to the voluntary severance packages (VSP) and voluntary early retirement packages (VERP) offered to employees, an average salary increase of 6 percent and the inclusion of BCX. This is offset by lower headcount from the prior year VSP and VERP process.
Impact of the VSP/VERP process related to 31 August 2015 and 31 March 2015.Other benefits include amongst others, skills development, annual leave, performance incentive, service bonuses, voluntary employee severance/voluntary early retirement packages costs and termination benefits.
Notes to the consolidated annual financial statementsfor the year ended 31 March 2016
5. Other income Group Company
2016Rm
Restated2015
Rm2016
Rm2015
Rm
1 281 731 1 308 743
Other income 577 474 586 487
Interest received from trade receivables 261 208 255 187
Sundry income 316 266 331 300
Profit on disposal of property, plant and equipment and intangible assets 704 257 722 256
The increase in other income is mainly driven by the higher profit on the sale of Telkom properties.
6. Expenses (continued) Group Company
2016Rm
Restated2015
Rm2016
Rm2015
Rm
6.4 Selling, general and administrative expenses 4 978 4 755 5 600 4 693
Selling and administrative expenses 793 700 827 765
Maintenance 3 050 2 945 3 689 2 937
Marketing 824 743 765 714
Impairment of receivables 311 367 319 277 The company’s increase in selling, general and administrative expenses is mainly due to an increase in bad debts and outsourcing costs.
6.5 Service fees 3 106 3 219 2 892 3 208
Facilities and property management 1 704 1 934 1 518 1 934
Consultancy, security and other services 1 338 1 222 1 326 1 218
Auditors' remuneration 64 63 48 56
The effective management of property led to the decrease in service fees for the group and company. This was partially offset by the company transformation cost and the inclusion of BCX in the group. 6.6 Operating leases 1 098 1 035 980 987
Land and buildings 605 481 508 455
Transmission and data lines 17 22 – –
Equipment 50 48 47 48
Vehicles 426 484 425 484
The operating leases remained fairly constant.
Operating lease commitments are disclosed in note 37.
6.7 Depreciation, amortisation, impairment, write-offs and losses 5 442 5 505 5 274 5 457
Depreciation of property, plant and equipment 4 370 4 506 4 305 4 480
Amortisation of intangible assets 902 779 799 757
Write-offs, impairments and losses of property, plant and equipment and intangible assets* 170 220 170 220
The decrease is due to lower asset write-offs and lower accelerated depreciation.
An amount of R9 million was reversed in the current financial year for company and group. This amount was attributed to the inventories year end balance.
***
*
Consolidated annual financial statements

42 43
7. Investment income Group Company
2016Rm
Restated2015
Rm2016
Rm2015
Rm
203 293 812 506
Interest income 203 293 180 280
Dividend income from subsidiaries – – 632 226
Investment income decreased as a result of lower cash balances held by the group during the financial year.
Interest income relates to interest earned from financial assets not measured at fair value through profit or loss. Interest is recognised on a time proportionate basis taking into account the principal amount outstanding and the effective interest rate.
Dividends from investments are recognised on the date that the group is entitled to the dividend.
The increase in dividend income is mainly due to the declaration of dividend by Acajou Investments (Pty) Ltd to Telkom Company.
Notes to the consolidated annual financial statementsfor the year ended 31 March 2016
6. Expenses (continued) Group Company
2016Rm
Restated2015
Rm2016
Rm2015
Rm
6.7 Depreciation, amortisation, impairment, write-offs and losses (continued) Years Years
The estimated useful lives assigned to groups of property, plant and equipment are: Freehold buildings 10 to 50 15 to 40 10 to 40 15 to 40
Leasehold buildings - 1 to 5 - 1 to 5
Network equipment
Cables 4 to 30 4 to 30 4 to 30 4 to 30
Switching equipment 5 to 18 5 to 18 5 to 18 5 to 18
Transmission equipment 5 to 18 5 to 18 5 to 18 5 to 18
Other 2 to 20 2 to 20 2 to 18 2 to 20
Support equipment 3 to 13 5 to 13 5 to 13 5 to 13
Furniture and office equipment 1 to 15 1 to 15 11 to 15 11 to 15
Data processing equipment and software 1 to 10 1 to 10 5 to 10 5 to 10
Telkom support services equipment 1 to 20 1 to 20 2 to 20 2 to 20
The expected useful lives assigned to intangible assets are:
Software and licences 2 to 11 2 to 11 5 to 10 5 to 10
Trademarks, copyrights and other 3 to 13 4 to 13 4 to 13 4 to 13
As a result of the transformation programme together with the group policies and procedures, the group reassessed the useful lives on certain technologies to address the challenges within the competitive market and IP-based products and services. The reassessment of useful lives had the effect of increasing the depreciation and amortisation expense for the year ended 31 March 2016 by R192 million (2015: R353 million). Depreciation and amortisation for each year of the remaining useful lives of the individually reassessed equipment will be significantly lower.
8. Finance charges and fair value movements Group Company
2016Rm
Restated2015
Rm2016
Rm2015
Rm
622 473 618 471
Finance charges on interest-bearing debt* 521 562 489 560
Local debt 624 655 592 653
Less: Finance charges capitalised** (103) (93) (103) (93)
Foreign exchange and fair value movements 101 (89) 129 (89)
Foreign exchange losses 428 247 457 247
Fair value adjustments (327) (336) (328) (336)
Capitalisation rate for borrowing costs (%) 11.5 11.7 11.5 11.7
Finance charges relate to interest expense on financial liabilities not measured at fair value through profit or loss.Fair value adjustments are mainly due to the growth in the assets held by the cell captive.
9. Taxation (income)/expense Group Company
2016Rm
Restated2015
Rm2016
Rm2015
Rm
524 (28) 359 (172)
South African normal company taxation 560 73 359 (79)
Current taxation 572 410 371 258
Overprovision for prior year (12) (337) (12) (337)
Deferred taxation (refer to note 18) (15) (101) - (93)
Capital allowances 77 (20) 88 (19)
Provision other allowances (92) (88) (88) (81)
Underprovision prior year - 7 - 7
Withholding tax 1 - - -
Common control transaction (22) - - -
The higher group taxation is mainly due to the prior year being lower as a result of reduced assessments issued to the company and the reversal of provisions. In the prior year the company recognised a deferred tax asset of R250 million and in the current year no further deferred tax assets were recognised. The aquisition of BCX further contributed to the increase in the tax charge.
For interest-bearing debt movement, refer to note 27.Finance charges are capitalised to property, plant and equipment and intangible assets.
***
Consolidated annual financial statements

44 45
Notes to the consolidated annual financial statementsfor the year ended 31 March 2016
9. Taxation (income)/expense (continued) Group Company
2016Rm
Restated2015
Rm2016
Rm2015
Rm
Reconciliation of taxation rate % % % %
Effective rate 18.0 (0.9) 12.2 (5.7)
South African normal rate of taxation 28.0 28.0 28.0 28.0
Adjusted for: (10.0) (28.9) (15.8) (33.7)
Exempt income (4.4) (4.3) (9.9) (6.7)
Disallowable expenditure 5.6 2.0 4.5 1.3
Deferred tax not provided 0.2 - - -
Deferred tax asset limitation (10.3) (16.4) (10.1) (17.2)
CGT on disposal of Acajou shares - 0.3 - -
Common control transaction (0.8) - - -
Over provision for prior year (0.3) (10.5) (0.3) (11.1)
The low effective tax rate at 31 March 2016 is mainly due to an increase in exempt income and the deferred tax asset limitation. The prior year is significantly lower mainly due to the overprovision of company tax following reduced assessments.
Refer to note 18 with regard to the deferred tax asset limitation.
10. Earnings per share Group
2016 Restated
2015
Total operations
Basic earnings per share (cents) 439.4 603.0
The calculation of earnings per share is based on a profit attributable to equity holders of Telkom for the year of R2 246 million (2015: R3 079 million) and 511 157 460 (2015: 510 593 816) weighted average number of ordinary shares in issue.
Diluted earnings per share (cents) 432.8 590.7
The calculation of earnings per share is based on a profit attributable to equity holders of Telkom for the year of R2 246 million (2015: R3 079 million) and 518 965 683 (2015: 521 248 531) diluted weighted average number of ordinary shares in issue. The adjustment in the weighted average number of shares is as a result of the expected future vesting of shares already allocated to employees under the Telkom Share Plan.
Headline earnings per share (cents)* 330.0 593.2
The calculation of headline earnings per share is based on headline earnings of R1 687 million (2015: R3 029 million) and 511 157 460 (2015: 510 593 816) weighted average number of ordinary shares in issue.
Diluted headline earnings per share (cents)* 325.1 581.1
The calculation of headline earnings per share is based on headline earnings of R1 687 million (2015: R3 029 million) and 518 965 683 (2014: 521 248 531) diluted weighted average number of ordinary shares in issue. The adjustment in the weighted average number of shares is as a result of the expected future vesting of shares under the Telkom Share Plan.
10. Earnings per share (continued) Group
2016 Restated
2015
Reconciliation of weighted average number of ordinary shares: Number of shares
Number of shares
Ordinary shares in issue 526 948 700 520 783 900
Weighted average number of treasury shares (15 791 240) (10 190 084)
Weighted average number of shares outstanding 511 157 460 510 593 816
Reconciliation of diluted weighted average number of ordinary shares
Weighted average number of shares outstanding 511 157 460 510 593 816
Expected future vesting of shares 7 808 223 10 654 715
Diluted weighted average number of shares outstanding 518 965 683 521 248 531
The disclosure of headline earnings is a requirement of the JSE Limited and is not a recognised measure under IFRS. It has been calculated in accordance with the South African Institute of Chartered Accountants’ circular 2/2015 issued in this regard.
Total operations Rm Rm
Reconciliation between earnings and headline earnings:
Profit for the year 2 376 3 184
Non-controlling interest (130) (105)
Profit attributable to owners of Telkom 2 246 3 079
Profit on disposal of property, plant and equipment and intangible assets (704) (257)
Write-offs of property, plant and equipment and intangible assets 170 220
Taxation effects (25) (13)
Headline earnings 1 687 3 029
Dividend per share (cents)The calculation of dividend per share is based on dividends of R1 291 million declared on 5 June 2015 and 526 948 700 number of ordinary shares outstanding on the date of dividend declaration. The dividend declared is made up of an ordinary dividend of 215 cents per share and a special dividend of 30 cents per share.
11. Reclassification of discontinued operation
The Trudon groupOn 27 November 2014, the Telkom board approved the disposal of Telkom’s 64.9 percent shareholding in Trudon to Trumancon. This was part of Telkom’s strategic imperative to focus on its fixed-line, mobile and Internet-based business. In September 2015, the material conditions precedent of the proposed sale of Trudon were not met and therefore Trudon is no longer held for sale and will be consolidated into the results as continuing operations.
The consolidated statement of profit or loss and other comprehensive income, the statement of financial position and statement of cash flows for 31 March 2015 have been restated to reintegrate the numbers for the Trudon group. Refer to notes 2.5, 2.6 and 2.7.
*
Consolidated annual financial statements

46 47
Non-controlling interest at proportional share of net assets 126
Goodwill arising at acquisition 1 119
Purchase consideration transferred 2 654
Analysis of cash flows at acquisition:
Net cash acquired with the subsidiary (included in cash flows from investing activities)
Cash paid 2 654
BCX cash at acquisition (399)
Net cash flow on acquisition 2 255
12. Acquisition of subsidiaries Group
2016Rm
12.1 Business Connexion Group Limited (BCX)*
On 25 August 2015, Telkom acquired the entire issued ordinary share capital and the entire issued “A”ordinary shares of Business Connexion Group (BCX).
The total purchase consideration of R2.7 billion was funded through Telkom’s own cash resources.
BCX provides innovative business solutions based on information and communication technology and runs ICT systems and manages products, services and solutions for a wide range of customers.
The merger will enable Telkom to expand its existing offerings while, at the same time, providing scale in IT services, which will help reinforce Telkom’s core connectivity business and enhance Telkom’s convergence strategy.
The acquisition has been accounted for using the acquisition method. The date of acquisition is31 August 2015 and the annual financial statements include the BCX results for the seven months ended 31 March 2016.
The fair value of the identifiable assets and liabilities at acquisition date was determined as follows:
Assets
Property, plant and equipment 462
Intangible assets 651
Investment in joint venture and associates and long-term loan receivable 74
Deferred tax 117
Trade and other receivables 1 822
Inventories 227
Income tax receivable 14
Cash and cash equivalents 399
Total assets 3 766
Liabilities
Long-term debt 300
Non-current finance leases 38
Deferred taxation 129
Non-current provisions 5
Trade and other payables 1 192
Current portion of long-term debt 169
Current portion of finance leases 23
Income tax payable 23
Current portion of provision 158
Contingent liability 68
Total liabilities 2 105
Total identifiable net assets at fair value 1 661
Notes to the consolidated annual financial statementsfor the year ended 31 March 2016
The fair value of the identifiable assets and liabilities at acquisition date was determined as follows:
Assets
Investment in joint venture and associates and long-term loan receivable 2
Deferred tax 2
Trade and other receivables 7
Cash and cash equivalents 3
Total assets 14
Liabilities
Trade and other payables 3
Income tax payable 2
Total liabilities 5
Total identifiable net assets at fair value 9
Goodwill arising at acquisition (provisional) 32
Purchase consideration transferred 41
12. Acquisition of subsidiaries (contined) Group
2016Rm
12.1 Business Connexion Group Limited (BCX)* (continued)
At the date of the acquisition, the fair value of the trade receivables at R1 424 million approximated its carrying value.
From the date of acquisition, BCX has contributed R4 116 million of revenue and R499 million loss to the net profit before tax from the continuing operations of the group.This is after eliminating inter-company revenue of R694 million. If the acquisition had taken place at the beginning of the year, Telkom group revenue from continuing operations would have been R40 768 million and the Telkom group profit from continuing operations for the period would have been R2 524 million.
The goodwill recognised is primarily attributed to the expected synergies and other benefits from combining the assets and activities of BCX with those of the group. The goodwill is not deductible for income tax purposes.
Transaction costs of R103 million, which includes issue costs, have been expensed since the inception of the acquisition. These expenses were recognised in service fees.
A contingent liability of R68 million was recognised at acquisition of BCX. The amount is an estimate in relation to BCX tax matters in Africa. The timing and the actual amount of this obligation are uncertain.
As at 31 March 2016, the BCX and Telkom initial business combination was complete.
12.2 Anco IT (Pty) Ltd (Anco)*
On 1 November 2015 BCX acquired the entire issued ordinary share capital of Anco.
The total purchase consideration of R41 million was in the form of cash, earn-out payments, a loan to BCX and deferred consideration.
Anco provides innovative business solutions based on information and com munication technology and runs ICT systems and manages products, services and solutions for a wide range of customers.
The merger will enable BCX to expand its existing offerings while, at the same time, providing scale in IT services, which will help reinforce Telkom’s core connectivity business and enhance BCX’s strategy.
The acquisition has been accounted for using the acquisition method. The date of acquisition is 1 November 2015 and the financial statements include the Anco results for the five months ended 31 March 2016.
Consolidated annual financial statements

48 49
Notes to the consolidated annual financial statementsfor the year ended 31 March 2016
12. Acquisition of subsidiaries (contined) Group
2016Rm
Analysis of cash flows at acquisition:
Net cash acquired with the subsidiary (included in cash flows from investing activities) 3
Cash paid 9
Net cash flow on acquisition 6
Deferred purchase consideration 33
The earn-out payments are based on the period as defined in the contract. The amount recognised is based on the likelihood of the company reaching the targets and is calculated as the present value of the earn-out payments. The deferred purchase consideration was also calculated in accordance with the purchase agreement.
At the date of the acquisition, the fair value of the trade receivables approximated its carrying value. The gross amount of trade receivablesis R7 million.
From the date of acquisition, Anco has contributed R15 million of revenue and R1 million to the net profit from the continuing operations of the group. If the acquisition had taken place at the beginning of the year, BCX revenue from continuing operations would have been R4.8 billion and the BCX group profit from continuing operations for the period would have been R133 million.
The goodwill recognised is primarily attributed to the expected synergies and other benefits from combining the assets and activities of Anco with those of the group. The goodwill is not deductible for income tax purposes.
Transaction costs of R0.7 million, which includes issue costs, have been expensed since the inception of the acquisition. These expenses were recognised in service fees.
The business combination was provisional and incomplete at the time the financial statements were authorised for issue.
12.3 UCS Solutions (Pty) Ltd (UCS) minority interest On 31 December 2015 the Telkom group, through BCX group, acquired the remaining 15% of UCS (and its holding in Integr8 IT (Pty) Ltd), based on the vested put option agreement with shareholders. UCS and Integr8 are now a wholly owned subsidiary of BCX group. This transaction was accounted for as an equity transaction.
12.4 Common control transactions On 1 November 2015 Cybernest (DCO), previously the IT business division of Telkom, was sold to BCX to realise synergies. The transaction was financed through a loan from Telkom to BCX and accounted for as a common control transaction. BCX recognised the acquired DCO assets at their carrying amount on the date of sale and the difference between the proceeds and the carrying amount of the DCO business was recognised as common control equity reserves. In Telkom company the difference between the carrying amount of the DCO business and proceeds was recognised in profit or loss. Refer to note 16.1.
13. Property, plant and equipment
2016 2015
Cost
Rm
Accumulated depreciation
and write-offsRm
Carrying value
Rm
Cost
Rm
Accumulateddepreciation
and write-offsRm
Carrying value
Rm
Group
Freehold land and buildings 6 318 (3 801) 2 517 6 406 (4 320) 2 086
Leasehold buildings 47 (37) 10 436 (362) 74
Network equipment 68 937 (51 407) 17 530 68 298 (50 205) 18 093
Support equipment 5 001 (3 936) 1 065 4 552 (3 460) 1 092
Furniture and office equipment 838 (559) 279 249 (207) 42
Data processing equipment and software 4 410 (3 355) 1 055 4 734 (3 725) 1 009
Under construction 2 739 – 2 739 1 929 – 1 929
Other 563 (401) 162 537 (383) 154
88 853 (63 496) 25 357 87 141 (62 662) 24 479
Company
Freehold land and buildings 6 006 (3 690) 2 316 6 406 (4 320) 2 086
Leasehold buildings 24 (21) 3 432 (360) 72
Network equipment 68 636 (51 243) 17 393 68 181 (50 148) 18 033
Support equipment 4 540 (3 505) 1 035 4 550 (3 459) 1 091
Furniture and office equipment 216 (123) 93 236 (198) 38
Data processing equipment and software 4 251 (3 481) 770 4 573 (3 653) 920
Under construction 2 716 – 2 716 1 929 – 1 929
Other 497 (364) 133 536 (382) 154
86 886 (62 427) 24 459 86 843 (62 520) 24 323
Fully depreciated assets with a cost of R2 597 million (2015: R989 million) were derecognised in the current financial year. This has reduced both the cost price and accumulated depreciation of property, plant and equipment.
The capital expenditure under property, plant and equipment relates to expansions of R1 669 million for group and R1 604 million for company (2015 expansions: R1 354 million for group and company). Expansion due to maintenance of R3 561 million for group and R3 501 million for company (2015 maintenance: R2 663 million for group and company).
A total of 38 properties (2015: 62 properties) were held for sale as at the end of the current financial year. These assets have a total net book value of R27 million (2015: R4.9 million) with a total market value of R358 million (2015: R159.6 million) as at the end of the current financial year. The accumulated depreciation on these assets is R106 million (2015: R9.8 million). These properties are being sold because they do not form part of the group’s core business.
Property, plant and equipment with a carrying value of R11.4 million for group and Rnil for company (2015: R58 million for group and company) has been pledged as security. Details of the loans are disclosed in note 27.
An amount of R9.5 million (2015: R7.9 million) under property, plant and equipment disposals relates to the sale of customer premises equipment in terms of a finance lease.
Refer to note 14 for the goodwill reconciliation.*
Consolidated annual financial statements

50 51
Notes to the consolidated annual financial statementsfor the year ended 31 March 2016
13. Property, plant and equipment (continued)
Carrying value at
beginning of year
Rm
Additions
Rm
Acquisition business
combin-ation
Rm
Transfers
Rm
Foreign currency
translation
Rm
Disposals
Rm
Deprecia-tion*
Rm
Write-offs
Rm
Carrying value
at end of year
Rm
Group
2016
Freehold land and buildings 2 086 495 151 80 – (121) (174) – 2 517 Leasehold buildings 74 2 4 – – (58) (12) – 10 Network equipment 18 093 2 349 52 736 – (4) (3 660) (36) 17 530 Support equipment 1 092 175 35 32 – (11) (264) 6 1 065 Furniture and office equipment 42 137 176 (5) 1 (21) (54) 3 279 Data processing equipment and software 1 009 180 – 107 – (3) (240) 2 1 055 Under construction 1 929 1 898 17 (976) – (1) – (128) 2 739
Other 154 27 27 5 – (12) (40) 1 162
24 479 5 263 462 (21) 1 (231) (4 444) (152) 25 357
2015
Freehold land and buildings 2 310 138 – (118) – (7) (205) (32) 2 086
Leasehold buildings 91 – – 2 – – (19) – 74
Network equipment 18 073 2 243 – 1 633 – (9) (3 747) (100) 18 093
Support equipment 954 214 – 147 – – (219) (4) 1 092
Furniture and office equipment 58 1 – 7 – – (21) (3) 42 Data processing equipment and software 959 231 – 81 – – (259) (3) 1 009
Under construction 2 530 1 201 – (1 799) – – – (3) 1 929
Other 148 11 – 33 – – (36) (2) 154
25 123 4 039 – (14) – (16) (4 506) (147) 24 479
The carrying amounts of property, plant and equipment can be reconciled as follows:
An amount of R74 million under depreciation is reflected in cost of sales for group.
13. Property, plant and equipment (continued)
Carrying value at
beginning of year
Rm
Additions
Rm
Transfers
Rm
Disposals
Rm
Depre-ciation*
Rm
Write-offs
Rm
Carrying value
at end of year
Rm
Company
2016
Freehold land and buildings 2 086 493 78 (180) (161) – 2 316
Leasehold buildings 72 (1) – (58) (10) – 3
Network equipment 18 033 2 322 736 (42) (3 620) (36) 17 393
Support equipment 1 091 145 28 – (235) 6 1 035
Furniture and office equipment 38 70 1 (4) (12) – 93
Data processing equipment and software 920 169 107 (196) (232) 2 770
Under construction 1 929 1 891 (976) – – (128) 2 716
Other 154 15 8 (10) (35) 1 133
24 323 5 104 (18) (490) (4 305) (155) 24 459
2015
Freehold land and buildings 2 310 138 (118) (7) (205) (32) 2 086
Leasehold buildings 91 – – – (19) – 72
Network equipment 17 888 2 225 1 757 (8) (3 729) (100) 18 033
Support equipment 954 213 146 – (218) (4) 1 091
Furniture and office equipment 51 1 7 – (18) (3) 38 Data processing equipment and software 866 229 83 – (255) (3) 920
Under construction 2 652 1 201 (1 921) – – (3) 1 929
Other 149 11 32 – (36) (2) 154
24 961 4 018 (14) (15) (4 480) (147) 24 323
The carrying amounts of property, plant and equipment can be reconciled as follows:
The group does not have temporarily idle property, plant and equipment. 29 percent of capital expenditure relates to the expansion of existing networks and services. 28 percent of capital expenditure contributed to the new next generation network programme. 15 percent of expansion of the mobile network also contributed to the growth of property, plant and equipment. The balance of 28 percent capital expenditure is mainly attributable to investment in submarine cable systems, network evolution initiatives, sustainment programmes, IT and OSS systems and property upgrade and growth projects. An extensive build programme that provides capacity for growth in services, focusing on next generation network and mobile technologies, is expected to continue over the next few years.
Changes to the estimated useful lives of property, plant and equipment were necessary due to the transformation programme and the group policies and procedures, resulting in an increase in the depreciation by a further R192 million (2015: R257 million).
The group and company have a process of determining whether an asset which incorporates both a tangible and an intangible element should be recognised as tangible or intangible assets, based on management’s judgement and on facts available and the significance of each element to the total value of the asset. Assets with a carrying value to the net amount of R21 million for group and R18 million for company (2015: R14 million for company and group) were reclassified from property, plant and equipment to intangible assets in the current year.
*
Consolidated annual financial statements

52 53
Notes to the consolidated annual financial statementsfor the year ended 31 March 2016
14. Intangible assets 2016 2015
Cost
Rm
Accumulated amortisation
Rm
Carrying value
Rm
Cost
Rm
Accumulated amortisation
Rm
Carrying value
Rm
Group
Goodwill 1 213 – 1 213 63 – 63
Trademarks, copyrights and other 1 302 (689) 613 525 (353) 172
Software 10 776 (8 422) 2 354 9 989 (7 788) 2 201
Under construction 404 – 404 546 – 546
13 695 (9 111) 4 584 11 123 (8 141) 2 982
Company
Trademarks, copyrights and other 253 (217) 36 245 (199) 46
Software 10 235 (8 058) 2 177 9 989 (7 788) 2 201
Under construction 391 – 391 546 - 546
10 879 (8 275) 2 604 10 780 (7 987) 2 793
Carrying value
at be-ginning of year
Rm
Addi-tions
Rm
Business combi-nation
Rm
Transfers
Rm
Foreign currency
trans-lation
Rm
Dis-posals
Rm
Amorti-sation
Rm
Write-offs
Rm
Carrying value
at end of year
Rm
Group
2016
Goodwill 63 – 1 150 – – – – – 1 213
Trademarks, copyrights and other 172 61 486 2 (1) – (107) – 613
Software 2 201 385 149 453 (5) – (806) (23) 2 354
Under construction 546 280 16 (434) – – – (4) 404
2 982 726 1 801 21 (6) – (913) (27) 4 584
2015
Goodwill 63 – – – – – – – 63
Trademarks, copyrights and other
144 64 – 2 – – (38) – 172
Software 2 132 530 – 348 – – (741) (68) 2 201
Under construction 494 393 – (336) – – – (5) 546
2 833 987 – 14 – – (779) (73) 2 982
The carrying amounts of intangible assets can be reconciled as follows:
14. Intangible assets (continued)
Carrying value
at beginning
of yearRm
Additions
Rm
Transfers
Rm
Disposals
Rm
Write-offs
Rm
Amortisa-tion
Rm
Carrying value
at end of year
Rm
Company
2016
Trademarks, copyrights and other 46 6 2 – – (18) 36
Software 2 201 369 450 (39) (23) (781) 2 177
Under construction 546 283 (434) – (4) – 391
2 793 658 18 (39) (27) (799) 2604
2015
Trademarks, copyrights and other 52 10 - - - (16) 46
Software 2 132 529 349 - (68) (741) 2 201
Under construction 493 393 (335) - (5) - 546
2 677 932 14 - (73) (757) 2 793
The carrying amounts of intangible assets can be reconciled as follows:
The goodwill in group relates to Trudon and the BCX group.
Intangible assets that are material to the group consist of software, brands, customer relationships, copyrights and trademarks whose average remaining amortisation period is 3.4 years (2015: 4.1 years).
No intangible asset apart from goodwill has been assessed as having an indefinite useful life.
An amount of R11 million under amortisation is reflected in cost of sales for group.
Approximately R93 million (2015: R245 million) and R80 million (2015: R244 million) of additions relate to externally acquired intangible assets for group and company respectively while R576 million (2015: R688 million) relates to internal developments for group and company.
Changes to the estimated useful lives of intangible assets were necessary due to the transformation programmeand the group policies and procedures, resulting in an increase in the amortisation by a further Rnil (2015: R96 million).
Group
2016Rm
The group’s 2016 goodwill balance is reconciled as follows:
Opening balance (restated) 63
Acquisition of BCX 1 119
Acquisition of Anco (provisional) 32
Impairment –
Closing balance 1 214
Consolidated annual financial statements

54 55
Goodwill impairment reviews are undertaken annually or more frequently if events or changes in circumstances indicate a potential impairment. The carrying value of the CGU containing the goodwill is compared to the recoverable amount, which is the higher of value in use and the fair value less costs of disposal. Any impairment is recognised immediately as an expense and is not subsequently reversed.
BCX CGUThe basis of the valuation that have we have adopted in arriving at the valuation is the value in use, using the discounted cash flow method. Based on this, the Income approach is used as the primary valuation approach, with the market approach as a cross check. The latter involves calculating multiples of comparable listed companies and comparing the results to the implied BCX multiple from the income approach valuation.
Valuation of BCX’s divisions and its subsidiaries where there are non-controlling interests, as well as a valuation of the synergies arising from Telkom’s acquisition in 2015 that will be realised in the BCX CGU, has been performed.
The BCX CGU was then valued using a sum-of-the-parts approach.
The valuation was performed on an Enterprise value basis, and as such, third party interest-bearing liabilities as at the valuation date were not deducted from the Enterprise value. The intercompany is net off according to the BCX consolidation schedule.
Impairment testing of cash-generating units (CGU): group and company The value in use calculation took into consideration the following key assumptions:
Gross marginThe budgeted gross margin is based on past experience and management’s future expectations of business performance.
Growth ratesThe growth rates are determined based on forward-looking growth rates of the entities, and they reflect management’s assessment of the long-term growth prospects of the sector in which the CGU operates.
A growth rate of 5.4 percent was applied in South African entities. A range of 2 percent to14.4 percent growth rate was applied in foreign entities.
Notes to the consolidated annual financial statementsfor the year ended 31 March 2016
Impairment testing of cash-generating units (CGU):In determining the recoverable amount of the Telkom group CGU, the group considered several sources of estimation uncertainty and made certain assumptions/judgements about the future. The group assessed internal and external indicators of impairment of the CGU and concluded that the carrying value approximates the recoverable amount. No impairment losses or reversals were recognised in profit and loss during the year.
Impairment testingFor the purpose of impairment testing, goodwill acquired in a business combination is allocated to each of the CGUs, or groups of CGUs, that is expected to benefit from the synergies of the combination. Each unit or group of units to which the goodwill is allocated represents the lowest level within the entity at which the goodwill is monitored for internal manage-ment purposes. Goodwill acquired through the business combination between BCX and Telkom SA has been allocated to two CGUs for purposes of impairment testing as follows:
14. Intangible assets (continued) Telkom CGU
Rm
BCX CGU
Rm
Total goodwill
recognisedRm
Carrying amount 719 400 1 119
Discount ratesIn the valuation a local South African WACC range of 13.5 to 14.4 percent has been applied as a discount rate. No specific premiums were applied, as potential forecast risks were modelled as scenarios.
A 2.5 percent specific risk premium was applied to the forecast of the less material entities where a degree of risk was identified in the projection.
For the value in use calculation of the synergies and DCO, we applied a higher WACC range of 18.0 and 18.8 percent which includes a 5 percent specific premium to account for the uncertainty of the cashflows.
Based on the value in use calculation, the estimated midpoint value in use of BCX is R4 082 million while its carrying amount is R2 838 million. As the indicated value in use range exceeds the carrying amount of BCX CGU, there appears to be no indication of impairment.
Sensitivity to changes in assumptionsThe only possible change that is viewed as a sensitive assumption is that relating to the synergies and DCO contributions that are expected from the business combination. The value is use calculation takes into consideration the expected synergies from the business combination. A value in use of R808 million has been assigned to the expected synergies and DCO. However, if the synergies do not materialise the carrying value of the BCX CGU will still be lower than the recoverable amount.
Telkom CGUOn the Telkom CGU impairment indicators test in March 2016 has been performed. The test considered the relationship between the CGU’s market capitalisation and book value, gross operating revenue growth and EBITDA. The market capitalisation of the CGU is higher than its book value and both operating revenue and EBITDA showed an average increase of 11 percent and 15 percent respectively in the last six months. This indicates that the Telkom CGU is not impaired.
15. Financial instruments and risk management
Financial risk management objectives and policiesThe group’s principal financial liabilities, other than derivatives, comprise interest-bearing debt and trade and other payables. The main purpose of these financial liabilities is to raise finance for the group’s operations.
The group has finance lease receivables, trade and other receivables, cash and cash equivalents and short-term deposits that arise directly from its operations. The group uses derivatives as hedging instruments.
The group is exposed to market risk, credit risk and liquidity risk. The group’s senior management oversees the management of these risks supported by a financial risk committee that advises on financial risks and the appropriate financial risk governance framework. The financial risk committee provides assurance to the group’s senior management that the group’s financial risk-taking activities are governed by appropriate policies and procedures and that financial risks are identified, measured and managed in accordance with group policies and group risk appetite. All derivative activities for risk management purposes are carried in accordance with the group’s policy. The group does not speculate in derivative instruments.
Risk managementThe group has exposure to the following risks from its use of financial instruments: credit risk, liquidity risk and market risk. Treasury policies, risk limits and control procedures are continuously monitored by the board of directors through its audit committee and risk committee to manage the financial risks.
The group holds or issues financial instruments to finance its operations, for the temporary investment of short-term funds and to manage currency and interest rate risks. In addition, financial instruments, for example trade receivables and payables, arise directly from the group’s operations.
The group finances its operations primarily by a mixture of issued share capital, retained earnings, long-term and short-term loans. The group uses derivative financial instruments to manage its exposure to market risks from changes in interest and foreign exchange rates. The derivatives used for this purpose are principally interest rate swaps, cross-currency swaps and forward exchange contracts. The group applied fair value hedge accounting in the current and prior financial year.
14. Intangible assets (continued) 14. Intangible assets (continued)
Consolidated annual financial statements

56 57
Notes to the consolidated annual financial statementsfor the year ended 31 March 2016
2016
Liabilities (455) (12 431) – – (12 886) (13 186)
Interest-bearing debt 27 – (5 269) – – (5 269) (5 569)
Trade and other payables 31 – (7 134) – – (7 134) (7 134)
Shareholders for dividend 36 – (22) – – (22) (22)
Other financial liabilities 21 (455) – – – (455) (455)
Forward exchange contracts (155) – – – (155) (155)
Interest rate swaps (7) – – – (7) (7)
Firm commitments (293) – – – (293) (293)
Credit facilities utilised 22 – (6) – – (6) (6)
2015
Classes of financial instruments per statement of financial position
Assets 2 401 – 1 101 9 387 12 889 12 889
Other investments* 16.2 2 227 – – – 2 227 2 227
Trade and other receivables** 20 – – – 5 131 5 131 5 131
Other financial assets 21 174 – 1 101 – 1 275 1 275
Forward exchange contracts 70 – – – 70 70
Firm commitments 5 – – – 5 5
Cross-currency swaps 99 – – – 99 99
Repurchase agreements – – 1 101 – 1 101 1 101
Finance lease receivables 17 – – – 613 613 613
Cash and cash equivalents 22 – – – 3 643 3 643 3 643
Liabilities (185) (10 511) – – (10 696) (11 152)
Interest-bearing debt 27 – (4 856) – – (4 856) (5 312)
Trade and other payables 31 – (5 635) – – (5 635) (5 635)
Shareholders for dividend 36 – (19) – – (19) (19)
Other financial liabilities 21 (185) – – – (185) (185)
Forward exchange contracts (14) – – – (14) (14)
Firm commitments (170) (170) (170)
Interest rate swaps (1) – – – (1) (1)
Credit facilities utilised 22 – (1) – – (1) (1)
The table below sets out the group’s classification of financial assets and liabilities.
Notes
At fair value through profit or
loss-held for trading
Rm
Financial liabilities
at amortised cost
Rm
Held-to-maturity
Rm
Loans and receivables
Rm
Total carrying
value
Rm
Fair value
Rm
2016
Classes of financial instruments per statement of financial position
Assets 2 388 – 1 634 10 084 14 106 14 106
Other investments* 16.2 2 248 – – – 2 248 2 248
Trade and other receivables** 20 – – – 7 013 7 013 7 013
Other financial assets 21 140 – 1 634 35 1 809 1 809
Forward exchange contracts 20 – – – 20 20
Firm commitments 43 – – – 43 43
Cross-currency swaps 38 – – – 38 38
Asset finance 39 – – – 39 39
Loans – – – 35 35 35
Repurchase agreements – – 1 634 – 1 634 1 634
Finance lease receivables 17 – – – 488 488 488
Cash and cash equivalents 22 – – – 2 548 2 548 2 548 2016
Classes of financial instruments per statement of financial position
Liabilities (442) (11 666) – – (12 108) (12 408)
Interest-bearing debt 27 – (4 826) – – (4 826) (5 126)
Trade and other payables 31 – (6 820) – – (6 820) (6 820)
Shareholders for dividend 36 – (20) – – (20) (20)
Other financial liabilities 21 (442) – – – (442) (442)
Firm commitments (293) – – – (293) (293)
Interest rate swaps (7) – – – (7) (7)
Forward exchange contracts (142) – – – (142) (142)
Credit facilities utilised 22 – – – – – –
2015
Classes of financial instruments per statement of financial position
Assets 2 401 – 1 101 8 813 12 315 12 315
Other investments 16.2 2 227 – – – 2 227 2 227
Trade and other receivables** 20 – – – 4 656 4 656 4 656
Other financial assets 21 174 – 1 101 – 1 275 1 275
Forward exchange contracts 70 – – – 70 70
Firm commitment 5 – – – 5 5
Cross-currency swaps 99 – – – 99 99
Repurchase agreements – 1 101 1 101 1 101
Finance lease receivables 17 – – – 613 613 613
Cash and cash equivalents 22 – – – 3 544 3 544 3 544
2016
Classes of financial instruments per statement of financial position
Assets 2 336 – 1 634 7 818 11 788 11 788
Other investments 16.2 2 235 – – – 2 235 2 235
Trade and other receivables** 20 – – – 5 108 5 108 5 108
Other financial assets 21 101 – 1 634 – 1 735 1 735
Forward exchange contracts 20 – – – 20 20
Firm commitments 43 – – – 43 43
Cross-currency swaps 38 – – – 38 38
Repurchase agreements – – 1 634 – 1 634 1 634
Finance lease receivables 17 – – – 488 488 488
Cash and cash equivalents 22 – – – 2 222 2 222 2 222
Notes
At fair value through profit or
loss-held for trading
Rm
Financial liabilities
at amortised cost
Rm
Held-to-maturity
Rm
Loans and receivables
Rm
Total carrying
value
Rm
Fair value
Rm
The table below sets out thecompany's classification offinancial assets and liabilities
15. Financial instruments and risk management (continued) 15. Financial instruments and risk management (continued)
Consolidated annual financial statements

58 59
Notes to the consolidated annual financial statementsfor the year ended 31 March 2016
Notes
At fair value through profit or
loss-held for trading
Rm
Financial liabilities
at amortised cost
Rm
Held-to-maturity
Rm
Loans and receivables
Rm
Total carrying value
Rm
Fair value
Rm
2015
Classes of financial instruments per statement of financial position (continued)Liabilities (185) (11 256) – – (11 441) (11 897)
Interest-bearing debt 27 – (4 856) – – (4 856) (5 312)
Trade and other payables 31 – (6 380) – – (6 380) (6 380)
Shareholders for dividend 36 – (19) – – (19) (19)
Other financial liabilities 21 (185) – – – (185) (185)
Firm commitment (170) – – – (170) (170)
Interest rate swaps (1) – – – (1) (1)
Forward exchange contracts (14) (14) (14)
Credit facilities utilised 22 – (1) – – (1) (1)
Other investments are disclosed net of investments accounted for using the equity method R70 million (2015: R4 million).Trade and other receivables are disclosed net of prepayments of R149 million (2015: R231 million) for the company and R362 million (2015: R257 million) for the group.
The fair value of financial instruments is included at the price that would be received to sell an asset or paid to transfer a liability in an orderly transaction between market participants at the measurement date, or in its absence, the most advantageous market to which the group has access at that date. The fair value of a liability reflects its non-performance risk. The fair value of cash and short-term deposits, trade and other receivables, other financial assets, finance leases, trade and other payables, and other liabilities approximate their carrying amounts largely due to the short-term maturities of these instruments. Long-term receivables and borrowings are evaluated by the group based on parameters such as interest rates, specific country factors and the individual creditworthiness of the customer. Based on this evaluation, allowances are taken to account for the expected losses of these receivables. As at the reporting date, the carrying amounts of such receivables, net of allowances, are not materially different from their calculated fair values. Fair values of quoted bonds are based on price quotations at the reporting date.
15. Financial instruments and risk management (continued)
15.1 Fair value of financial instruments Valuation techniques and assumptions applied for the purposes of measuring fair value Fair value of all financial instruments noted in the statement of financial position approximates carrying value except as disclosed below. The carrying amount of financial instruments approximates fair value, with the exception of interest-bearing debt (at amortised cost) which has a fair value of R5 569 million (2015: R5 312 million) and a carrying amount ofR5 269 million (2015: R4 856 million). The fair value of financial assets and financial liabilities that are traded in active markets are based on quoted market prices or dealer price quotations. The fair value of financial instruments that are not traded in an active market is determined by using other valuation techniques. The fair values of interest-bearing debts are based on quoted prices or, where such prices are not available,the expected future payments discounted at market interest rates, as a result they differ from carrying values. The fair values of listed investments and bonds are based on quoted market prices. The values are not necessarily indicative of the amounts that the group could realise in the normal course of business.
Type of financialinstrument - Group
Fair value at 31 March 2016
Rm
Valuation technique
Significant inputs
Receivables, bank balances, repurchase agreements, and other liquid funds, pay-ables and accruals, credit facilities utilised and shareholders for dividends
6 767 Undiscounted future estimated cash flows due to short-term maturities of these instruments
Probability of default
Derivatives (316) Discounted cash flows
Yield curves Market interest rate Market foreign exchange rate
Borrowings (5 569) Discounted cash flows and quoted bond prices
Market interest rateMarket foreign exchange rate
Fair value hierarchyThe following table presents the group’s assets and liabilities that are measured at fair value at reporting date. The different levels have been defined as follows:
Level 1: Quoted prices in active markets.Level 2: All significant inputs required to value an instrument are observable market data.Level 3: Significant inputs required to value an instrument are not based on observable market data.There were no transfers between levels.
15. Financial instruments and risk management (continued)
***
Consolidated annual financial statements

60 61
Notes to the consolidated annual financial statementsfor the year ended 31 March 2016
3. Segment information (continued)
Total Level 1 Level 2 Level 3
Rm Rm Rm Rm
Group
2016
Assets measured at fair value
Cross-currency swaps 38 – 38 –
Forward exchange contracts 20 – 20 –
Asset finance receivable 39 – 39 –
Firm commitments 43 – 43 –
Loans 35 – 35 –
FutureMakers 13 – – 13
Investment in cell captive preference shares 2 235 – 2 235 –
Liabilities measured at fair value
Forward exchange contracts (155) – (155) –
Firm commitments (293) – (293) –
Interest rate swaps (7) – (7) –
Liabilities measured at amortised cost
Interest-bearing debt (5 569) (2 162) (3 407) –
2015
Assets measured at fair value
Cross-currency swaps 99 – 99 –
Forward exchange contracts 70 – 70 –
Firm commitments 5 – 5 –
Investment in cell captive preference shares 2 227 – 2 227 –
Liabilities measured at fair value
Firm commitments (14) – (14) –
Forward exchange contracts (170) – (170) –
Interest rate swaps (1) – (1) –
Liabilities measured at amortised cost
Interest-bearing debt (5 312) (3 355) (1 957) –
Company
2016
Assets measured at fair value
Cross-currency swaps 38 – 38 –
Forward exchange contracts 20 – 20 –
Firm commitments 43 – 43 –
Investment in cell captive preference shares 2 235 – 2 235 –
Liabilities measured at fair value
Forward exchange contracts (142) – (142) –
Firm commitments (293) – (293) –
Interest rate swaps (7) – (7) –
Liabilities measured at amortised cost
Interest-bearing debt (5 126) (2 162) (2 964) –
15. Financial instruments and risk management (continued)15.1 Fair value of financial instruments Fair value hierarchy (continued)
15. Financial instruments and risk management (continued)15.1 Fair value of financial instruments
Total Level 1 Level 2 Level 3
Rm Rm Rm Rm
2015
Assets measured at fair value
Cross-currency swaps 99 – 99 –
Forward exchange contracts 70 – 70 –
Firm commitments 5 – 5 –
Investment in cell captive preference shares 2 227 – 2 227 –
Liabilities measured at fair value
Firm commitments (170) – (170) –
Forward exchange contracts (14) – (14) –
Interest rate swaps (1) – (1) –
Liabilities measured at amortised cost
Interest-bearing debt (5 312) (3 355) (1 957) –
15.2 Credit risk managementCredit risk or the risk of financial loss is the risk that a counterparty will not meet its contractual obligations as they fall due. The group is exposed to credit risk from its operating activities and from financing activities, including deposits with banks and financial institutions. The group is not exposed to significant concentrations of credit risk as credit limits are set on an individual basis and reviewed regularly. The group's maximum exposure to credit risk is represented by the carrying amount of the financial assets that are exposed to credit risk. The maximum exposure to the group from counterparties in respect of derivative contracts is a net favourable position of R58 million (2015: R174 million). No collateral is required when entering into derivative contracts. The group limits the exposure to any counterparty and exposures are monitored daily. The group expects that all counterparties will meet their obligations. With respect to credit risk arising from other financial assets of the group, which comprises held-to-maturity investments, financial assets held at fair value through profit or loss, loans and receivables and available-for-sale assets (other than equity investments) and preference shares, the group's exposure to credit risk arises from a potential default by counterparties, with a maximum exposure equal to the carrying amount of these instruments. The group's exposure to credit risk is influenced mainly by the individual characteristics of each type of customer. Management reduces the risk of irrecoverable debt by improving credit management through credit checks and limits. To reduce the risk of counterparty failure, limits are set based on the individual ratings of counterparties by well-known ratings agencies. Trade receivables comprise a large widespread customer base, covering residential, business, government, wholesale, global and corporate customer profiles. Credit checks are performed on all customers, other than pre-paid customers, on application for new services on an ongoing basis where appropriate. The group establishes an allowance for impairment that represents its estimate of incurred losses in respect of trade and other receivables. The collective loss allowance is determined based on historical data of payment statistics for similar financial assets as well as expected future cash flows, refer to note 21. Credit risk from balances with banks and financial institutions is managed by the group's treasury department in accordance with the group's policy. Investments of surplus funds are made only with approved counterparties and within credit limits assigned to each counterparty. Counterparty credit limits are reviewed annually or when the need arises. The limits are set to minimise the concentration of risks and therefore mitigate financial loss through potential counterparty failure.
Consolidated annual financial statements

62 63
Notes to the consolidated annual financial statementsfor the year ended 31 March 2016
Group - Carrying amount
Company - Carrying amount
2016Rm
2015Rm
2016Rm
2015Rm
Trade receivables (refer to note 20)
Telkom SA 5 588 4 272 4 678 4 272
Business and residential 1 601 1 309 1 355 1 309
Global, corporate and wholesale 1 751 1 860 1 751 1 860
Government 1 324 440 660 440
Other customers 912 663 912 663
South African subsidiaries 811 567 – –
Impairment of trade receivables ( refer to note 20) (664) (501) (518) (414)
Subtotal for trade receivables 5 735 4 338 4 160 3 858
Other receivables* 1 279 794 949 798
Derivatives 101 174 101 174
Asset finance 39 – – –
Loans 35 – – –
Repurchase agreements 1 634 1 101 1 634 1 101
Investments** 2 248 2 227 2 235 2 227
Finance lease receivables 488 613 488 613
Net cash and cash equivalents 2 548 3 642 2 222 3 543
14 107 12 889 11 789 12 314
15. Financial instruments and risk management (continued)15.2 Credit risk management (continued)
The maximum exposure to credit risk for financial assets at the reporting date by type of instrument and counterparty was:
Other receivables are disclosed net of prepayments of R149 million (2015: R231 million) for the company and R362 million (2015: R257 million) for the group.Other investments are disclosed net of Investments accounted for using the equity method of R70 million (2015: R4 million).
The ageing of trade receivables at the reporting date was:
Not past due/current 4 831 3 628 3 484 3 061
Past due but not impaired
21 to 60 days 553 497 487 497
61 to 90 days 256 108 223 108
91 to 120 days 124 45 76 45
120+ days 635 561 408 561
6 399 4 839 4 678 4 272
The ageing in the allowance for the impairment of trade receivables at reporting date was:Current defaulted trade 47 15 45 14
21 to 60 days 37 32 36 32
61 to 90 days 64 33 62 33
91 to 120 days 38 23 24 23
120+ days 478 398 351 312
664 501 518 414
The movement in the allowance for impairment in respect of trade receivables during the year is disclosed in note 20. Included in the allowance for doubtful debts for Telkom Company are individually impaired receivables with a balance of R319 million (2015: R217 million) which have been identified as being unable to service their debt obligation.
The impairment recognised represents the difference between the carrying amount of these trade receivables and the present value of the future cash flows. The group does not hold any collateral over these balances.
15. Financial instruments and risk management (continued)
15.3 Liquidity risk managementLiquidity risk is the risk that the group will not be able to meet its financial obligations as they fall due. The group is exposed to liquidity risk as a result of uncertain cash flows as well as capital commitments of the group. Liquidity risk is managed by the group's treasury department in accordance with policies and guidelines formulated by the group's executive committees. In terms of its borrowing requirements the group ensures that sufficient facilities exist to meet its immediate obligations. Short-term liquidity gaps may be funded through undrawn facilities and commercial paper bills. There were no material changes in the exposure to liquidity risk and its objectives, policies and processes for managing and measuring the risk during the 2016 financial year.
Notes
Carryingamount
Rm
Contractualcash flows
Rm
0 - 12 months
Rm
1 - 2 years
Rm
2 - 5 years
Rm
> 5 years
Rm
Group
2016
Non-derivative financial liabilities
Interest-bearing debt (excluding finance leases) 27 5 165 5 868 700 1 062 3 970 135
Credit facilities utilised 22 6 6 6 – – –
Trade and other payables 31 7 134 7 134 7 134 – -– –
Finance lease liabilities 27 103 122 43 47 30 2
Shareholders for dividend 36 22 22 – – – –
Derivative financial liabilities
Interest rate swaps 21 7 7 4 3 – –
Firm commitment 21 293 293 293 – – –
Forward exchange contracts 21 155 142 142 – – –
12 885 13 594 8 322 1 112 4 000 137
2015
Non-derivative financial liabilitiesInterest-bearing debt (excluding finance leases) 27 4 205 4 965 1 499 117 3 250 99
Credit facilities utilised 22 1 1 1 – – –
Trade and other payables 31 5 635 5 804 5 804 – – –
Finance lease liabilities 27 651 848 193 213 442 –
Shareholders for dividend 36 19 19 19 – – –
Derivative financial liabilities
Interest rate swaps 1 1 1 – – –
Firm commitment 21 170 170 170 – – –
Forward exchange contracts 21 14 14 14 – – –
10 696 11 822 7 701 330 3 692 99
The table below summarises the maturity profile of the group's financial liabilities based on undiscounted contractual cash flows at the reporting date.
*
**
Consolidated annual financial statements

64 65
Notes to the consolidated annual financial statementsfor the year ended 31 March 2016
Notes
Carryingamount
Rm
Contractualcash flows
Rm
0 - 12 months
Rm
1 - 2 years
Rm
2 - 5 years
Rm
> 5 years
Rm
Company
2016
Non-derivative financial liabilities
Interest-bearing debt (excluding finance leases) 27 4 811 5 448 521 1 000 3 800 127
Trade and other payables 31 6 820 6 820 6 820 – – –
Finance lease liabilities 27 15 18 7 11 – –
Shareholders for dividend 36 20 20 – – – –
Derivative financial liabilities
Interest rate swaps 21 7 7 4 3 – –
Firm commitment 21 293 293 293 – – –
Forward exchange contracts 21 142 142 142 – – –
12 108 12 748 7 787 1 014 3 800 127
2015
Non-derivative financial liabilities
Interest-bearing debt (excluding finance leases) 27 4 205 4 965 1 499 117 3 250 99
Credit facilities utilised 22 1 1 1 – – –
Trade and other payables 31 6 380 6 549 6 549 – – –
Finance lease liabilities 27 651 848 193 213 442 –
Shareholders for dividend 36 19 19 19 – – –
Derivative financial liabilities
Interest rate swaps 21 1 1 1 – – –
Firm commitment 21 170 170 170 – – –
Forward exchange contracts 21 14 14 14 – – –
11 441 12 567 8 446 330 3 692 99
15. Financial instruments and risk management (continued)15.3 Liquidity risk management (continued)
15. Financial instruments and risk management (continued)15.3 Liquidity risk management (continued)
The table below summarises the maturity profile of the company's financial liabilities based on undiscounted contractual cash flow at the reporting date.
Group Company
Averagematurity
Notional amount
Rm
Averagematurity
Notional amount
Rm
2016
Interest rate swaps outstanding
Pay fixed and receive floating 2.73 years 1 070 2.73 years 1 070
2015
Interest rate swaps outstanding
Pay fixed and receive floating 1.5 years 500 1.5 years 500
The table below summarises the interest rate swaps outstanding as at the reporting date:
15.4 Market riskMarket risk is the risk that the fair value of future cash flows of a financial instrument will fluctuate because of changes in market prices. The objective of market risk management is to manage and control market risk exposure. Market risks comprise three types of risk: interest rate risk, currency risk, commodity price risk and other price risk, such as equity risk. Changes in the market prices have an impact on the values of the underlying derivatives and an analysis has been prepared on the basis of changes in one variable and all other variables remaining constant.
Interest rate risk management Interest rate risk is the risk that the fair value or future cash flows of a financial instrument will fluctuate because of changes in market interest rates. Interest rate risk arises from the repricing of the group's forward cover and floating rate debt as well as incremental funding or new borrowings and refinancing of existing borrowings. The group's policy is to manage interest cost through the utilisation of a mix of fixed and floating rate debt. In order to manage this mix in a cost-efficient manner and to hedge specific exposure in the interest rate repricing profile of the existing borrowings, the group makes use of interest rate swaps. Fixed rate debt represents approximately 66 percent (2015: 84 percent) of the total debt. The debt profile of mainly fixed rate debt has been maintained to limit the group's exposure to interest rate increases. The guideline is to target a fixed/floating debt ratio of 65 percent fixed, but adjusted to market conditions. In a scenario of low interest rates, a higher ratio may be established.
Pay fixed and receive floating The floating rate is based on the three-month JIBAR, and is settled in arrears. The interest rate swaps are used to manage interest rate risk on debt instruments. Foreign currency exchange rate risk management Foreign currency risk is the risk that the fair value of future cash flows of a financial instrument will fluctuate because of changes in foreign exchange rates. The group manages its foreign currency exchange rate risk by economically hedging all identifiable exposures via various financial instruments suitable to the group's risk exposure. The group implements fair value hedge accounting.
The group enters into forward exchange contracts and cross-currency swaps to hedge foreign currency exposure on the group's operations and liabilities. These forward exchange contracts are treated as fair value hedges.
Consolidated annual financial statements

66 67
Notes to the consolidated annual financial statementsfor the year ended 31 March 2016
Group Company
Foreign contract value
Rm
Contract value
Rm
Foreign contract value
Rm
Contract value
Rm
Purchased
2016
Currency
USD 179 2 825 162 2 555
Euro 13 224 13 224
Other – 3 – 2
3 052 2 781
Cross-currency swaps
USD 5 34 5 34
2015
Currency
USD 145 1 693 142 1 690
Euro 22 297 22 297
Other – 15 – 15
2 005 2 002
Cross-currency swaps
USD 19 130 19 130
Sell
2016
Currency
USD 10 158 8 127
Other – – – –
158 127
2015
Currency
USD 8 94 8 94
Other – 4 – 4
98 98
The group has various monetary assets and liabilities in currencies other than the group's functional currency. The following table represents the net currency exposure (net carrying amount of foreign denominated monetary assets and liabilities) of the group according to the different foreign currencies.
Group Company
Euro
Rm
United States dollar
Rm
Other
Rm
Euro
Rm
United States dollar
Rm
Other
Rm
2016Net foreign currency monetary assets/(liabilities)Functional currency of company operationSouth African rand (35) (598) 158 (40) (293) (1)2015Net foreign currency monetary assets/(liabilities)Functional currency of company operationSouth African rand (68) (345) (2) (68) (345) (2)
15. Financial instruments and risk management (continued)15.4 Market risk (continued)
15. Financial instruments and risk management (continued)15.4 Market risk (continued)
Sensitivity analysis Interest rate and foreign currency risk An interest rate sensitivity analysis is based on an increase or decrease of 1 percent (100 basis points) in the South African market interest rates and the prevailing information as at the reporting date. The analysis assumes that all other variables remain constant. The analysis and changes in interest rates is performed on the same basis as was used in prior years. If interest rates had been 100 basis points higher/lower and all other variables were held constant, the group’s and company's profit for the year ended 31 March 2016 would decrease/increase by R18 million (2015: decrease/increase by R12 million).
The following table illustrates the sensitivity to a 100 basis points change in the interest rates on profit before taxes, with all other variables held constant:
Group Company
Movement Movement
+ 1%Profit Rm
- 1% Profit Rm
+ 1%Profit
Rm
- 1% Profit
Rm
Classes of financial instruments per statementof financial position
2015
Assets
Other financial assets 6 (6) 6 (6)
Cross-currency swaps 1 (1) 1 (1)
Forward exchange contract 5 (5) 5 (5)
Liabilities
Other financial liabilities 6 (6) 6 (6)
Interest rate swaps 6 (6) 6 (6)
12 (12) 12 (12)
Group Company
Movement Movement
+ 1%Profit
Rm
- 1% Profit
Rm
+ 1%Profit
Rm
- 1% Profit
Rm
Classes of financial instruments per statement of financial position
2016
Assets
Other financial assets 6 (6) 6 (6)
Cross-currency swaps – – – –
Forward exchange contract 6 (6) 6 (6)
Liabilities
Other financial liabilities 12 (12) 12 (12)
Interest rate swaps 12 (12) 12 (12)
18 (18) 18 (18)
Consolidated annual financial statements

68 69
Notes to the consolidated annual financial statementsfor the year ended 31 March 2016
Foreign exchange currency risk The foreign currency sensitivity analysis is based on a 10 percent strengthening or weakening of the rand against all currencies, from the rates applicable and prevailing information as at the reporting date. If foreign exchange rates had been 10 percent higher/lower and all other variables were held constant, the group's and company's profit for the year ended 31 March 2016 would increase/decrease by R42 million for group andR17 million for company (2015: increase/decrease by R38 million).
The following table illustrates the sensitivity to a 10% change in the exchange rates before taxes, with all other variables held constant:
Group Company
+ 10% movement
(depreciation)Rm
- 10% movement
(appreciation)Rm
+ 10% movement
(depreciation)Rm
- 10% movement
(appreciation)Rm
Classes of financial instruments per statement of financial position 2016
Assets
Other financial assets 255 (255) 255 (255)
Forward exchange contract 248 (248) 248 (248)
Cross-currency swaps 7 (7) 7 (7)
Liabilities
Other financial liabilities (282) 282 (257) 257
Firm commitment (257) 257 (257) 257
Forward exchange contract (25) 25 – –
Interest-bearing debt (15) 15 (15) 15
(42) 42 (17) 17
2015
Assets
Other financial assets 216 (216) 216 (216)
Forward exchange contract 193 (193) 193 (193)
Cross-currency swaps 23 (23) 23 (23)
Cash and cash equivalents
Liabilities
Other financial liabilities (142) 142 (142) 142
Firm commitment (142) 142 (142) 142
Interest-bearing debt (36) 36 (36) 36
38 (38) 38 (38)
15. Financial instruments and risk management (continued)15.4 Market risk (continued)
15. Financial instruments and risk management (continued)
15.5 Equity price riskThe group's listed and unlisted investments are susceptible to market price risk arising from uncertainties about future values of the investment securities. Changes in the fair value of equity securities held by the group will fluctuate because of changes in market prices, caused by factors specific to the individual equity issuer, or factors affecting all similar equity securities traded on the market. The group is not exposed to commodity price risk. The group manages the equity price risk through diversification and placing limits on individual and total equity instruments. Reports on the equity portfolio are submitted to the group's senior management on a regular basis. The group's board of directors reviews and approves all equity investment decisions.
At the reporting date, the total amount for local equity investments was R2 711 million (2015: R2 986 million). A 5 percent increase in the local and foreign equity portfolios at the reporting date would have increased profit or loss by R108 million (2015: R80 million) before tax. An equal and opposite change would have decreased profit or loss. A 5 percent fluctuation represents management's assessment of the reasonably possible changes in equity prices. There will be no other impact on equity as the equity securities are classified as at fair value through profit or loss. The analysis assumes that all other variables remain constant and is performed on the same basis as the prior year. 15.6 Capital managementThe group's policy is to manage the capital structure to ensure maximisation of shareholders' return, growth and ability to meet its obligations. Capital comprises equity and net debt which is monitored using, inter alia, a net debt to EBITDA ratio. The group's guidance is to keep the ratio below 1.4 times.
Net debt is defined as interest-bearing debts, credit facilities utilised and other financial liabilities, less cash and cash equivalents and other financial assets. EBITDA is defined as earnings before depreciation, amortisation, impairment and losses, investment income, finance charges and fair value movements and taxation. The group's dividend policy aims to provide shareholders with a competitive return on their investment, while assuring sufficient reinvestment of profits to achieve its strategy. The determination to pay dividends, and the amount of dividends, will be based on a number of factors, including the consideration of the financial results, capital and operating requirements, net debt levels and growth opportunities.
The net debt to EBITDA ratio at reporting date was as follows:
Group Company
2016Rm
2015Rm
2016Rm
2015Rm
Non-current portion of interest-bearing debt 4 566 3 244 4 306 3 244
Current portion of interest-bearing debt 703 1 612 520 1 612
Credit facilities utilised 6 1 – 1
Current portion of other financial liabilities 455 185 442 185
Less: Cash and cash equivalents (2 548) (3 643) (2 222) (3 544)
Less: Other financial assets (1 809) (1 275) (1 735) (1 275)
Net debt 1 373 124 1 311 223
EBITDA 8 761 8 841 8 024 8 435
Net debt to EBITDA ratio 0.16 0.01 0.16 0.03
Consolidated annual financial statements

70 71
Notes to the consolidated annual financial statementsfor the year ended 31 March 2016
16. Investments Company
2016Rm
Restated2015
Rm
16.1 Investments in subsidiaries 3 274 202
Trudon (formerly known as TDS Directory Operations)(Pty) Ltd*
64.90% shareholding at cost 167 167
Swiftnet (Pty) Ltd
100% shareholding at cost 25 25
Rossal No 65 (Pty) Ltd
100% shareholding at cost (R100) – –
Acajou Investments (Pty) Ltd
100% shareholding at cost (R100) – –
Intekom (Pty) Ltd
100% shareholding at cost 10 10
Q-Trunk (Pty) Ltd** – –
100% shareholding at cost – 10
Impairment – (10)
Business Connexion Group Limited (BCX)*** 3 072 –
100% shareholding at cost 2 654 –
Loan 418 –
Refer to note 11.Deregistered.Refer to note 12.
Investments and loans key assumptions Loans and investments are tested for impairment losses whenever there are impairment indicators, by comparing the recoverable amounts of the cash-generating units (CGU) with the carrying amounts of the investments and loans.At 31 March 2016 there were no impairment indicators. For continuing operations the recoverable amount of a CGU is determined based on value in use calculations. Value in use is based on the discounted cash flow method. Loan to BCX This interest-bearing loan was to assist BCX in acquiring the Cybernest business unit. The loan shall accrue interest at a prevailing six-month JIBAR rate plus 200 basis points and shall be payable in cash bi-annually. Loan term is five years, payable in equal bi-annual repayments commencing after first anniversary following the effecive date. Gross margin The budgeted gross margin is based on past experience and management's future expectations of business performance. Growth rates The growth rates are determined based on the forward-looking Consumer Price Index, and reflect management's assessment of the long-term growth prospects of the sector in which the CGU operates. Discount rates The discount rates used are post-tax and reflect specific risks relating to the relevant cash-generating units. Sensitivity to changes in assumptions Management believes that no reasonably possible changes in the assumptions would cause the carrying amount of the cash-generating unit to exceed its recoverable amount in the short term.
Group Company
2016Rm
2015Rm
2016Rm
2015Rm
16.2 Other investments 2 318 2 231 2 335 2 227
At fair value through profit and loss 2 235 2 227 2 235 2 227
Cell captive preference shares 2 235 2 227 2 235 2 227
Unlisted investment
FutureMakers 13 – 100 –
Available-for-sale
Rascom
0.69% interest in Regional African Satellite Communications Organisation, headquartered in Abidjan, Ivory Coast, at cost.
– – – –
Cost – – – 1
Impairment – – – (1)
Investment in associate 4 4 – –
Equity investment in Number Portability Company 4 4 – –
BCX group interests 66 –
Associates 26 – – –
Joint ventures 40 – – –
Cell captive investment in preference shares The fair value through profit or loss investment is used to fund the post-retirement medical aid liability. These investments are made through a cell captive in which Telkom holds 100 percent of the preference shares, and represents the fair value of the underlying investments of the cell captive. These are equity investments.
FutureMakers Fund This fund is an enterprise and supplier development (ESD) programme. In partnership with Identity FutureFund (Pty) Ltd, the fund was created in terms of the Department of Trade and Industry's Code of Good Practice on Black Economic Empowerment 2007, as amended and specifically in terms of the Information and Technology Charter. Investment in associate The Number Portability Company (NPC) was incorporated in response to Regulations of 2005 that required a national centralised database of ported numbers for mobile numbers. The NPC was previously classified as a joint venture jointly controlled by Vodacom, MTN and Cell C. The investment has been classified as an associate in line with the requirements of the revised IAS 28 Investments in Associates and Joint Ventures and IFRS 11 Joint Arrangements. The year end of the associate, 31 December, is different to that of the company and the impact is not material.
16. Investments (continued)
***
***
Consolidated annual financial statements

72 73
Notes to the consolidated annual financial statementsfor the year ended 31 March 2016
Company
2016
Minimum lease payments receivable
Lease payments receivable 571 259 312 –
Unearned finance income (83) (52) (31) –
Present value of minimum lease income 488 207 281 –
Lease receivables 488 207 281 –
2015
Minimum lease payments receivable
Lease payments receivable 660 223 437 –
Unearned finance income (47) (23) (24) –
Present value of minimum lease income 613 200 413 –
Lease receivables 613 200 413 –
Total < 1 year 1 - 5 years > 5 years
Rm Rm Rm Rm
Group
2016
Minimum lease payments receivable
Lease payments receivable 571 259 312 –
Unearned finance income (83) (52) (31) –
Present value of minimum lease income 488 207 281 –
Lease receivables 488 207 281 –
2015
Minimum lease payments receivable
Lease payments receivable 660 223 437 –
Unearned finance income (47) (23) (24) –
Present value of minimum lease income 613 200 413 –
Lease receivables 613 200 413 –
17. Finance lease receivables
The group provides voice and non-voice services through the use of router and PABX equipment that is dedicated to specific customers. The disclosed information relates to those arrangements which were assessed to be finance leases in terms of IAS 17.
18. Deferred taxation Group Company
2016Rm
2015Rm
2016Rm
2015Rm
283 254 250 250
Opening balance 254 (4) 250 –
Profit and loss movements 15 101 – 93
Capital allowances (77) 20 (88) 19
Provisions and other allowances 92 88 88 81
Underprovision prior year – (7) – (7)
Business combination 14 – –
Other comprehensive income tax impact – 157 – 157
The balance comprises: 283 254 250 250
Capital allowances (78) 14 (56) 32
Provisions and other allowances 424 240 306 218
Business combination (102) – – –
Tax losses 39 – – –
Deferred taxation balance is made up as follows: 283 254 250 250
Deferred taxation assets 434 270 250 250
Deferred taxation liabilities (151) (16) – –
A deferred tax asset is recognised for deductible temporary differences to the extent that it is probable that taxable profit will be available against which the deductible temporary difference can be utilised. The group did not recognise deferred tax assets of R1 100 million ( 2015: R1 600 million) in respect of temporary differences amounting to R4 000 million (2015: R5 700 million) that can be carried forward against future taxable income.
19. Inventories Group Company
2016Rm
2015Rm
2016Rm
2015Rm
Inventories 971 638 506 531
Gross inventories 1 062 730 582 623
Write-down of inventories to net realisable value (91) (92) (76) (92)
Inventories consist of the following categories: 971 638 506 531
Installation material, maintenance material and networkequipment 436 291 250 291
Merchandise 535 347 256 240
Write-down of inventories to net realisable value 91 92 76 92
Opening balance 92 111 92 111
Acquistion of BCX 21 – – –
Charged to selling, general and administrative expenses 54 119 56 119
Inventories written off (76) (138) (72) (138)
The increase in inventory is mainly due to an increase in merchandise stock and the consolidation of BCX. An estimated amount of R101 million (2015: R193 million) included in inventories will be used for Telkom's network expansion in the 2017 financial year of which R83 million (2015: R137 million) was purchased in the current financial year. The company's decrease in write-down of inventories is mainly due to lower obsolescence and lower slow moving stock.
Consolidated annual financial statements

74 75
Notes to the consolidated annual financial statementsfor the year ended 31 March 2016
20. Trade and other receivables Group Company
2016Rm
Restated2015
Rm2016
Rm2015
Rm
Trade and other receivables 7 375 5 388 5 257 4 887
Trade receivables 5 735 4 338 4 160 3 858
Gross trade receivables 6 399 4 839 4 678 4 272
Impairment of receivables (664) (501) (518) (414)
Prepayments and other receivables 1 640 1 050 1 097 1 029
Allowance account for credit losses 664 501 518 414
Opening balance 501 412 414 373
Acquisition of BCX 82 – –
Charged to selling, general and administrative expenses 564 490 423 400
Receivables written off (483) (401) (319) (359)
The payment terms of trade receivables vary between 21 days and 30 days from date of invoice. Interest charged varies between prime + 1 percent and 18 percent, depending on the contract terms. Refer to note 15.2 for detailed credit risk analysis.
Fair value hedge The foreign exchange forward contracts designated as fair value hedges are being used to hedge the exposure to changes attributable to movement in the spot exchange rate of its firm commitments.
An increase in fair value of the forward exchange contracts designated as fair value hedges of R288 million (2015: R172 million) has been recognised in finance charges and fair value movement and offset with a similar loss on the hedged items (property, plant and equipment and inventory). The ineffectiveness movement recognised in the current financial year was immaterial.
Repurchase agreements
The group manages a portfolio of repurchase agreements, with a view to generate additional investment income on the favourable interest rates and security provided on these instruments. They are short-term, usually seven days and are held to maturity.
Non-current other financial liabilities consist of: – – – –
At fair value through profit or loss
Total other financial liabilities (455) (185) (442) (185)
Derivative instruments (455) (185) (442) (185)
Forward exchange contracts (155) (14) (142) (14)
Firm commitments (293) (170) (293) (170)
Interest rate swaps (7) (1) (7) (1)
Less: Current portion of other financial liabilities (455) (185) (442) (185)
Derivative instruments (455) (185) (442) (185)
Forward exchange contracts (155) (14) (142) (14)
Firm commitments (293) (170) (293) (170)
Interest rate swaps (7) (1) (7) (1)
21. Other financial assets and liabilities Group Company
2016Rm
2015Rm
2016Rm
2015Rm
Other financial assets and liabilities
Non-current other financial assets consist of: 55 28 – 28
Total other financial assets 1 809 1 275 1 735 1 275
Repurchase agreements 1 634 1 101 1 634 1 101
Derivative instruments 101 174 101 174
Forward exchange contracts 20 70 20 70
Firm commitments 43 5 43 5
Cross-currency swaps 38 99 38 99
Asset finance receivables 39 – – –
Shanike Investments - Nanoteq (Pty) Ltd 3 – – –
NGA loans 32 – – –
Less: Current portion of other financial assets 1 754 1 247 1 735 1 247
Repurchase agreements 1 634 1 101 1 634 1 101
Derivative instruments 101 146 101 146
Forward exchange contracts 20 70 20 70
Firm commitments 43 5 43 5
Cross-currency swaps 38 71 38 71
Asset finance receivables 19 – – –
Derivatives not designated as hedging instruments The group only uses forward exchange contracts to economically hedge its foreign exchange rate transaction exposures. Derivative instruments are measured at fair value through profit or loss.
Consolidated annual financial statements

76 77
Notes to the consolidated annual financial statementsfor the year ended 31 March 2016
22. Net cash and cash equivalents Group Company
2016Rm
2015Rm
2016Rm
2015Rm
Cash disclosed as current assets 2 548 3 643 2 222 3 544
Cash and bank balances 418 162 167 120
Short-term deposits 2 130 3 481 2 055 3 424
Credit facilities utilised (6) (1) – (1)
Net cash and cash equivalents 2 542 3 642 2 222 3 543
Undrawn borrowing facilities 6 450 6 450 5 250 6 450
The undrawn borrowing facilities are unsecured and bear interest at a rate that will be mutually agreed between the borrower and lender at the time of drawdown. These facilities are subject to annual review and are in place to ensure liquidity. At 31 March 2016, R4 billion (2015: R4 billion) of these undrawn facilities was committed. There is no restriction on cash.
Short-term deposits Short-term deposits are made mostly for varying periods of between one day and three months, depending on the immediate cash requirements of the group, and earn interest at the respective short-term deposit rates. Borrowing powers To borrow money, Telkom's directors may mortgage or encumber Telkom's property or any part thereof and issue debentures, whether secured or unsecured, whether outright or as security for debt, liability or obligation of Telkom or any third party. For this purpose the borrowing powers of Telkom are unlimited, but are subject to the restrictive financial covenants as well as specific restrictive clauses in the current funding arrangements.
23. Share capital Group Company
2016Rm
2015Rm
2016Rm
2015Rm
Authorised and issued share capital is made up as follows:
Authorised
1 000 000 000 ordinary shares of R10 each 10 000 10 000 10 000 10 000
Issued
520 783 900 (2015: 520 783 900) ordinary shares of R10 each 5 208 5 208 5 208 5 208
6 164 800 (2015: nil) at no consideration – – – –
The following table illustrates the movement within the number of shares issued:
Number of shares
Number of shares
Shares in issue at beginning of year 520 783 900 520 783 900 520 783 900 520 783 900
Issued on 2 June 2015 at no consideration 2 185 452 – 2 185 452 –
Issued on 30 June 2015 at no consideration 3 979 348 – 3 979 348 –
Shares in issue at end of year 526 948 700 520 783 900 526 948 700 520 783 900
The unissued shares are under the control of the directors until the next annual general meeting. The directors have been given the authority by the shareholders to buy back Telkom's own shares up to a limit of 10 percent of the current issued share capital.
Capital management Refer to note 15.6 for detailed capital management disclosure.
24. Share-based compensation reserve Group Company
2016Rm
2015Rm
2016Rm
2015Rm
Telkom's shareholders approved the Telkom Share Plan at the September 2013 annual general meeting. The scheme covers both operational and management employees and is aimed at giving shares to Telkom employees, at a Rnil exercise price, at the end of the vesting period. Although the number of shares awarded to employees was communicated at the grant date, the ultimate number of shares that vest may differ based on certain performance conditions being met. Refer to note 30.
The fund has been created but the related compensation expense will be recognised over the vesting period of shares granted.
The movement within the share-based compensation reserve is:
Balance at beginning of year 126 11 126 11
Net increase in equity 115 115 115 115
Employee cost 115 115 115 115
Balance at end of year 241 126 241 126
25. Non-distributable reserves Group Company
2016Rm
2015Rm
2016Rm
2015Rm
Non-distributable reserves 1 507 1 507 795 786
Opening balance 1 507 2 580 786 1 859
Movement during the year – (1 073) 9 (1 073)
Foreign currency translation reserve (9) – – –
Transfer of treasury shares – (775) – (775)
Realised gains of the cell captive reserve – (519) – (519)
Revaluation of the cell captive reserve 9 221 9 221
The balance comprises: 1 507 1 507 795 786
Cell captive reserve 2 291 2 282 1 570 1 561
Foreign currency translation reserve (9) – – –
Shares held by subsidiaries and in escrow (775) (775) (775) (775)
The group has a cell captive preference share investment to fund Telkom's post-retirement medical aid liability. The fair value gains from the cell captive are recognised in profit or loss. The fair value gains are transferred to the non-distributable reserves until the date that the investment and the corresponding fair value gains are realised. On this date the fair value gains are transferred back to retained earnings. The reserve also represents amounts paid by Telkom to subsidiaries, Rossal No 65 (Pty) Ltd and Acajou Investments (Pty) Ltd, for the acquisition of Telkom's shares to be utilised in terms of the Telkom Share Plan.
Group Company
2016Number of
shares
2016
Rm
2015Number of
shares
2015
Rm
Escrow 13 464 298 775 6 558 915 519
Rossal No 65 (Pty) Ltd 1 875 239 108 2 046 528 162
Acajou Investments (Pty) Ltd – – 1 584 641 126
Total 15 339 537 883 10 190 084 807
Fair value of ordinary shares in Telkom are held as follows:
All shares will be allocated to employees as part of the share plan.
Consolidated annual financial statements

78 79
Notes to the consolidated annual financial statementsfor the year ended 31 March 2016
26. Non-controlling interest Group
2016Rm
2015Rm
Non-controlling interest 473 363
Balance at beginning of year 363 377
Share of earnings 130 105
Acquisition of non-controlling interest* (32) –
Acquisition of subsidiary with non-controlling interests* 126 –
Dividend declared (114) (119)
The non-controlling interest relates to the minority shareholders of Trudon and Business Connexion.
Refer to note 12.
27. Interest-bearing debt Group Company
2016Rm
2015Rm
2016Rm
2015Rm
Non-current interest-bearing debt 4 566 3 244 4 306 3 244
Total interest-bearing debt 5 269 4 856 4 826 4 856
Gross interest-bearing debt 5 803 4 966 5 448 4 966
Discount on debt instruments issued (637) (761) (637) (761)
Finance leases 103 651 15 651
Less: Current portion of interest-bearing debt (703) (1 612) (520) (1 612)
Local debt (654) (1 260) (500) (1 260)
(154) (1 160) – (1 160)
(500) (100) (500) (100)
Foreign debt (18) (239) (15) (239)
Finance leases (31) (113) (5) (113)
Total interest-bearing debt is made up as follows: 5 269 4 856 4 826 4 856
(a) Local debt 4 994 3 865 4 668 3 865
Telkom debt instruments 4 668 3 865 4 668 3 865
Name, maturity, rate p.a., nominal value
TL15, 2015, 11.9%, Rnil (2015: R1 160 million) – 1 160 – 1 160
TL20, 2020, 15%, R2 500 million(2015: R2 500 million) 1 868 1 755 1 868 1 755
Other loans, 2019 - 2021, 8.45% - 8.742%, R2 800 million (2015: R950 million) 2 800 950 2 800 950
Total group interest-bearing debt is made up of R5 269 million debt at amortised cost (2015: R4 856 million debt at amortised cost). Finance costs accrued on debt are included in trade and other payables (refer to note 31).
The local Telkom bonds are unsecured, but a Side letter to the Subscription Agreement (as amended) of the TL20 bond contains a number of restrictive covenants, which, if not met, could result in the early redemption of the loan at the option of the specific bondholder. The local bonds limit Telkom's ability to create encumbrances on revenue or assets, and secure any indebtedness without securing the outstanding bonds equally and rateably with such indebtedness.
The Side letter's conditions and restrictive covenants fell away subsequently, with effect from 11 April 2014.
Other loans are repayable quarterly and biannually, and have maturities ranging from 2019 to 2021.
27. Interest-bearing debt (continued) Group Company
2016Rm
2015Rm
2016Rm
2015Rm
BCX debt instruments 326 – – –
Rand Merchant Bank 216 – – –
Quarterly instalments over 60 months, variable interest rate JIBAR +1.9%,secured over trade receivables of BCX (Pty) Ltd of R840 million and unlimited guarantee from BCX group.
Cisco Capital 103 – – –
Repayable over 36 months, fixed interest rate of 5.5%, unlimited guarantee from BCX group.
IBM Global Finance 2 – – –
Repayable over 43 months at a fixed interest rate of 10.7%, unsecured.
Astfin Western Cape (Pty) Ltd 5 – – –
The loan is unsecured and bears interest at market-related rates with no fixed terms of repayment.
(b) Foreign debt 172 340 143 340
Telkom
Maturity, rate p.a., nominal value 143 340 143 340
Euro: 2022 - 2025, 0.14% (2015: 0.14%),€7.6 million (2015: €7.6 million) 128 100 128 100
USD: 2011 - 2016, 2.7055% (2015: 2.2031%), USD1.4 million (2015: USD21 million) 15 240 15 240
BCX 29 – – –
Stanbic Tanzania 7 – – –
US dollar denominated loan, repayable over 60 months at interest at a US base rate of 9%, guaranteed by Business Connexion (Pty) Ltd.
Barclays Commercial Mortgage 6 – – –
A pound sterling denominated loan repayable over 20 years at an interest rate of UK prime + 2%, secured by freehold building with a carrying value of R11.4 million.
Stanbic Kenya 16 – – –
A Kenyan shilling denominated loan repayable over 48 months at an interest rate of 15%, guaranteed by Business Connexion (Pty) Ltd.
(c) Finance leases 103 651 15 651
Telkom various leases 15 651 15 651
In September 2015, Telkom settled its lease obligation for the buildings with the Telkom Retirement Fund (TRF). Telkom also purchased a previously leased property from the TRF.BCX various leases 82 – – –
Finance leases are in respect of capitalised leased assets with a carrying value of R63.7 million. BCX has the option to purchase these assets at the end of the lease term.
These amounts are repayable between periods of three and five years.
Interest rates vary between 6.62% and 9.25%. A variable rate based on the base rate of the Bank of England plus 2% applies to a lease denominated in Great British pounds.
Trudon various leases 6 – –
The amounts are repayable between periods of one and five years. Interest rates vary between 5 and 10 percent.
Included in non-current and current debt is:
Debt guaranteed by the South African Government 128 100 128 100
The company may issue or re-issue locally registered debt instruments in terms of the Post Office Amendment Act 85 of 1991. The borrowing powers of the company are set out as per note 22. Repayments/refinancing of current portion of interest-bearing debt The repayment of the current portion of interest-bearing debt of R703 million (2015: R1 612 million)(nominal) for group and R520 million (2015: R1 612 million)(nominal) for company as at 31 March 2016 is expected to be repaid from available cash or operational cash flow. Management believes that sufficient funding facilities will be available at the date of repayment.
*
Consolidated annual financial statements

80 81
Notes to the consolidated annual financial statementsfor the year ended 31 March 2016
28. Provisions Group Company
2016Rm
2015Rm
2016Rm
2015Rm
Non-current employee-related 1 665 1 264 1 645 1 249
Post-retirement medical aid (refer to note 30) 28 22 – –
Balance at beginning of year (402) 1 374 (424) 1 353
Acquisition of BCX 4 – – –
Interest cost 185 278 183 276
Current service cost 6 5 5 4
Interest on plan asset (216) (236) (216) (236)
Actuarial (gain)/loss (271) 423 (271) 423
Settlement loss/(gain) 3 (221) 3 (221)
Curtailment loss 48 – 48 –
Contributions paid* (61) (2 025) (60) (2 023)
Transfer to employee benefit assets (refer to note 30) 732 424 732 424
Telephone rebates (refer to note 30) 410 471 410 471
Balance at beginning of year 471 375 471 375
Interest cost 34 33 34 33
Current service cost 4 3 4 3
Curtailment loss 2 – 2 –
Actuarial (gain)/loss (73) 88 (73) 88
Benefits paid (28) (28) (28) (28)
Telkom Retirement Fund (refer to note 30) 1 274 812 1 274 812
Balance at beginning of year 812 – 812 –
Service cost 660 720 660 720
Interest cost 3 103 3 318 3 103 3 318
Interest on plan asset (3 067) (3 346) (3 067) (3 346)
Actuarial loss 158 1 440 158 1 440
Curtailment loss 159 – 159 –
Change in asset restriction – (706) – (706)
Employer contribution (551) (614) (551) (614)
Annual leave 554 531 435 524
Balance at beginning of year 531 533 524 527
Acquisition of BCX 117 – – –
Charged to employee expenses (60) 29 (73) 28
BCX leave provision recovery (4) – (4) –
Leave paid/utilised (30) (31) (12) (31)
Bonus 964 990 869 977
Balance at beginning of year 990 703 977 692
Acquisition of BCX 67 – – –
Charged to employee expenses 918 970 799 961
Payments made (1 011) (683) (907) (676)
Termination packages and other benefits 666 320 666 320
Less: Current portion of employee-related provisions (2 231) (1 882) (2 009) (1 855)
Annual leave (554) (531) (435) (524)
Post-retirement medical aid (8) (7) – –
Telephone rebates (39) (34) (39) (34)
Bonus (964) (990) (869) (977)
Termination packages and other benefits (666) (320) (666) (320)
28. Provisions (continued) Group Company
2016Rm
2015Rm
2016Rm
2015Rm
Non-current non-employee related 66 61 9 39
Other 208 364 81 341
Less: Current portion of other provisions (142) (303) (72) (302)
Other (142) (303) (72) (302)
includes an amount of R22 million (2015: R1 950 million) paid in terms of the settlement of the post-retirement medical aid.
Annual leave In terms of the group's policy, employees are entitled to accumulate vested leave benefits not taken within a leave cycle, to a cap of 22-25 days (2015: 22 days) which must be taken within a 12-18 month (2015: 18 month) leave cycle. The leave cycle is reviewed annually and is in accordance with legislation. Bonus The bonus scheme consists of performance bonuses which are dependent on the achievement of certain financial and non-financial targets. The bonus is payable annually to all qualifying employees after the company's results have been made public. Non-employee related provisions Other provisions contain provisions for certain legal matters that have been disclosed in the contingencies note (refer to note 38).
29. Deferred revenue Group Company
2016Rm
2015Rm
2016Rm
2015Rm
Deferred revenue 2 364 2 189 2 113 2 186
Non-current deferred revenue 656 687 656 687
Current portion of deferred revenue 1 708 1 502 1 457 1 499
The increase in the group's short-term portion of deferred revenue is due to the inclusion of Business Connexion.
The group provides benefits for all its permanent employees through the Telkom Pension Fund and the Telkom Retirement Fund. Membership of one of the funds is compulsory. In addition, certain retired employees receive medical aid benefits and a telephone rebate. The liabilities for all of the benefits are actuarially determined in accordance with accounting requirements each year. In addition, statutory funding valuations for the retirement and pension funds are performed at intervals not exceeding three years. Actuarial valuations were performed by qualified actuaries to determine the benefit obligation, plan asset and service costs for the pension and retirement funds for each of the financial periods presented.
30. Employee benefits Group Company
2016Rm
2015Rm
2016Rm
2015Rm
Non-current assets 846 452 846 452
Telkom Pension Fund asset 114 28 114 28
Post-retirement medical aid recognition of net plan asset 732 424 732 424
*
Consolidated annual financial statements

82 83
Notes to the consolidated annual financial statementsfor the year ended 31 March 2016
30. Employee benefits (continued)
The Telkom Pension Fund The Telkom Pension Fund is a defined benefit fund that was created in terms of the Post Office Amendment Act 85 of 1991. The Telkom Pension Fund consists only of active members. The latest actuarial valuation performed at 31 March 2016 indicates that the pension fund is in a surplus position of R191 million (2015: R180 million). The recognition of the surplus is limited due to the application of the asset limitation criteria in IAS 19 Employee Benefits. The Telkom Pension Fund is closed to new members. The pension plan exposes the group to actuarial risks, such as longevity risk, currency risk, interest rate risk and market risk.
29. Deferred revenue Group Company
2016Rm
2015Rm
2016Rm
2015Rm
The Telkom Pension Fund
The net periodic pension costs include the following components:
Interest cost on projected benefit obligations 10 18 10 18
Service cost on projected benefit obligations 3 4 3 4
Interest on plan assets after asset restriction (12) (20) (12) (20)
Net periodic pension gain recognised in profit and loss 1 2 1 2
The net periodic other comprehensive income includes the following components:Actuarial gain from financial assumption changes – – – –
Asset ceiling in terms of IAS 19.64 86 (6) 86 (6)
Net periodic pension expense recognised in other comprehensive income 86 (6) 86 (6)
Cumulative actuarial gain (84) (84) (84) (84)
Pension fund contributions (1) (1) (1) (1)
The status of the pension plan obligation is as follows:
At beginning of year 140 194 140 194
Interest cost 10 18 10 18
Current service cost 3 4 3 4
The fund status of the Telkom Pension Fund is dislosed below:
Employee contributions 1 1 1 1
Benefits paid (18) (103) (18) (103)
Actuarial (gain)/loss (6) 26 (6) 26
Benefit obligation at end of year 130 140 130 140
Plan assets at fair value:
At beginning of year 320 374 320 374
Interest on plan assets 23 20 23 20
Benefits paid (18) (103) (18) (103)
Contributions 1 1 1 1
Actuarial (loss)/gain (6) 28 (6) 28
Plan assets at end of year 320 320 320 320
Present value of funded obligation 130 140 130 140
29. Deferred revenue Group Company
2016Rm
2015Rm
2016Rm
2015Rm
Fair value of plan assets (320) (320) (320) (320)
Fund surplus (190) (180) (190) (180)
Asset ceiling in terms of IAS 19.64 76 152 76 152
Recognised net asset (114) (28) (114) (28)
Interest on plan assets after asset restriction 12 20 12 20
Actuarial (loss)/gain on plan assets (6) 28 (6) 28
Actual return on plan assets 6 48 6 48
Plan assets balance comprises:
Cash and cash equivalents 48 26 48 26
Equity securities 125 154 125 154
Property 7 5 7 5
Bonds 51 42 51 42
Commodities 6 – 6 –
Foreign investments 83 93 83 93
Total 320 320 320 320
Sensitivity analysis
Increasing discount rate by 0.5% (4) (5) (4) (5)
Decreasing discount rate by 0.5% 5 5 5 5
Funding arrangements The Telkom Pension Fund investment strategy has been implemented through the appointment of two asset managers with global balanced mandates. Within these mandates the manager is responsible for and has sole discretion of determining the asset allocation, i.e. the mix of the various asset classes used, based on their investment views. In addition a small additional allocation to a specialist manager in the Africa Equity and SA Cash asset classes was added to further diversify the portfolio and to provide return enhancement. The Telkom Pension Fund’s total asset allocation is thus derived by combining the two balanced asset managers’ portfolios with the Africa and additional cash allocation.
30. Employee benefits (continued)The Telkom Pension Fund (continued)
Consolidated annual financial statements

84 85
Notes to the consolidated annual financial statementsfor the year ended 31 March 2016
29. Deferred revenue Group Company
2016Rm
2015Rm
2016Rm
2015Rm
Principal actuarial assumptions were as follows:
Assumptions regarding future mortality are based on mortality tables. The current longevities underlying the values of the liabilities in the defined benefit plan are as follows:Males over 65 16.4 16.3 16.4 16.3
Females over 65 20.5 20.5 20.5 20.5
Discount rate (%) 9.5 7.3 9.5 7.3
Interest on plan assets (%) 9.5 7.3 9.5 7.3
Salary inflation rate (%) 7.9 6.4 7.9 6.4
Pension increase allowance (%) 4.5 4.9 4.5 4.9
The overall long-term expected interest on assets is 9.5 percent. This is based on the new IAS 19R net interest requirement.The assumed rates of mortality are determined by reference to the SA85-90 (Light) ultimate table, as published by the Actuarial Society of South Africa, for pre-retirement purposes and the PA(90) ultimate table, minus one year age rating as published by the Institute and Faculty of Actuaries in London and Scotland, for retirement purposes.Funding level per statutory actuarial valuation (%) 100 100 100 100
The number of employees registered under the Telkom Pension Fund 46 51 46 51
The fund portfolio consists of the following percentages:
Cash (%) 15 8 15 8
Equities (%) 39 48 39 48
Property (%) 2 2 2 2
Bonds (%) 16 13 16 13
Commodities (%) 2 – 2
Foreign investments (%) 26 29 26 29
Total 100 100 100 100
The total estimated contributions to be paid to the pension fund by the employer for the year ending 31 March 2017 is R1.2 million.
30. Employee benefits (continued)The Telkom Pension Fund (continued)
Benefit obligation:
At beginning of year 43 463 37 640 43 463 37 640
Interest cost 3 103 3 318 3 103 3 318
Current service cost 660 720 660 720
Employee contributions 322 360 322 360
Benefits paid (7 305) (2 271) (7 305) (2 271)
Transfers in 4 109 4 109
Curtailment loss 159 – 159 -
Actuarial (gain)/loss (879) 3 587 (879) 3 587
Benefit obligation at end of year for defined benefit plan 39 527 43 463 39 527 43 463
30. Employee benefits (continued)
The Telkom Retirement Fund The Telkom Retirement Fund was established on 1 July 1995 as a hybrid defined benefit and defined contribution plan. Existing employees were given the option to either remain in the Telkom Pension Fund or to be transferred to the Telkom Retirement Fund. All pensioners of the Telkom Pension Fund and employees who retired after 1 July 1995 were transferred to the Telkom Retirement Fund. Upon transfer the Government ceased to guarantee the deficit in the Telkom Retirement Fund. Subsequent to 1 July 1995 further transfers of existing employees occurred. As from 1 September 2009 all new appointments will belong to the Telkom Retirement Fund but will not be able to retire from the Telkom Retirement Fund at retirement age. These members would be required to purchase their pensions from an insurance company. The pensioner pool of the Telkom Retirement Fund only consists of pensioners and is funded through a liability driven investment strategy (LDI). Pensioner increases are subject to affordability targeting between 70 percent and 100 percent of CPI. Telkom guarantees any actuarial shortfall of the pensioner pool in the retirement fund. This liability is initially funded through assets of the retirement fund. The Telkom Retirement Fund is governed by the Pension Funds Act 24 of 1956. In terms of section 37A of this Act, the pension benefits payable to the pensioners cannot be reduced. If therefore the present value of the funded obligation were to exceed the fair value of plan assets, Telkom would be required to fund the statutory deficit.
The funded status of the Telkom Retirement Fund is disclosed below:
Group Company
2016Rm
Restated2015
Rm2016
Rm
Restated 2015
Rm
The Telkom Retirement Fund
The net periodic retirement costs include the following components:
Interest cost on projected benefit obligations 3 103 3 318 3 103 3 318
Interest on plan assets (3 067) (3 406) (3 067) (3 406)
Net periodic pension expense recognised in profit and loss 36 (88) 36 (88)
The net periodic other comprehensive income includes the following components:
Actuarial (loss) due to financial assumptions (339) 370 (339) 370
Acturial (loss)/gain due to demographic assumptions 182 (1 795) 182 (1 795)
Asset ceiling in terms of IAS 19.64 – 706 – 706
Net periodic pension expense recognised in other comprehensive income (157) (719) (157) (719)
Cumulative actuarial loss (1 541) (1 385) (1 541) (1 385)
Retirement fund contributions – – – –
Consolidated annual financial statements

86 87
Notes to the consolidated annual financial statementsfor the year ended 31 March 2016
Included in the fair value of plan assets is:
Office buildings occupied by Telkom – 1 024 – 1 024
Telkom shares 12 17 12 17
The Telkom Retirement Fund invests its funds in South Africa and internationally. Twelve fund managers invest in South Africa and five of these managers specialise in trades with bonds on behalf of the Retirement Fund.
Group Company
2016Rm
Restated2015
Rm2016
Rm
Restated2015
Rm
Plan assets at fair value:
At beginning of year 42 651 38 287 42 651 38 287
Interest on plan assets 3 067 3 346 3 067 3 346
Interest on asset restriction – 60 – 60
Employer contributions 551 614 551 614
Employee contributions 322 360 322 360
Benefits paid (7 305) (2 271) (7 305) (2 271)
Transfers in 4 109 4 109
Actuarial (loss)/gain (1 037) 2 146 (1 037) 2 146
Plan assets at end of year 38 253 42 651 38 253 42 651
Present value of funded obligation 39 527 43 463 39 527 43 463
Asset ceiling in terms of IAS 19.64 – – – –
Fair value of plan assets 38 253 42 651 38 253 42 651
Net liability (1 274) (812) (1 274) (812)
Interest on plan assets 3 067 3 406 3 067 3 406
Actuarial (loss)/gain on plan assets (1 037) 2 146 (1 037) 2 146
Actual return on plan assets 2 030 5 552 2 030 5 552
Plan asset balance comprises:
Equities 12 624 9 810 12 624 9 810
Property 1 530 3 412 1 530 3 412
Bonds 11 094 17 060 11 094 17 060
Africa 3 060 2 559 3 060 2 559
Cash 1 530 853 1 530 853
Foreign investments 8 416 8 957 8 416 8 957
Total 38 254 42 651 38 254 42 651
Funding arrangements The Telkom Retirement Fund pensioner portfolio’s strategic asset allocation (SAA) is determined by an asset liability model (ALM) based on the Fund’s unique liabilities, as determined by its member data and Fund rules. The SAA is a reflection of the Fund's targeted post-retirement interest rate (PRI), and the investment strategy is built around the target of providing consistent annual pension increases of between 70 percent and 100 percent of CPI.
30. Employee benefits (continued)The Telkom Retirement Fund (continued)
30. Employee benefits (continued)
The Telkom Retirement Fund (continued)
Group Company
2016Rm
2015Rm
2016Rm
2015Rm
Principal actuarial assumptions were as follows:
Assumptions regarding future mortality are based on mortality tables. The current longevities underlying the values of the liabilities in the defined benefit plan are as follows:
Males over 65 16.4 16.3 16.4 16.3
Females over 65 20.5 20.5 20.5 20.5
Discount rate (%) 9.5 7.3 9.5 7.3
Interest on plan assets (%) 9.5 7.3 9.5 7.3
Pension increase allowance (%) 6.9 4.9 6.9 4.9
The assumed rates of mortality are determined by reference to the SA85-90 (Light) ultimate table, as published by the Actuarial Society of South Africa, for pre-retirement purposes and the PA(90) Ultimate table, minus one year age rating as published by the Institute and Faculty of Actuaries in London and Scotland, for retirement purposes.
Funding level per statutory actuarial valuation (%) 100 100 100 100
The number of pensioners registered under the Telkom Retirement Fund 12 053 12 366 12 053 12 366
The number of in-service employees entitled to retire in the Telkom Retirement Fund 12 508 12 648 12 508 12 648
The fund portfolio consists of the following percentages:
Equities (%) 33 23 33 23
Property (%) 4 8 4 8
Bonds (%) 29 40 29 40
Africa (%) 8 6 8 6
Cash (%) 4 2 4 2
Foreign investments (%) 22 21 22 21
Total 100 100 100 100
The total estimated contributions to be paid to the Telkom Retirement Fund by the employer for the year ending 31 March 2017 is R850 million.
Consolidated annual financial statements

88 89
Notes to the consolidated annual financial statementsfor the year ended 31 March 2016
30. Employee benefits (continued)
Medical benefits Telkom makes certain contributions to medical funds in respect of certain current and retired employees. The scheme is a defined benefit plan. The expense in respect of current employees' medical aid is disclosed in note 6.3. The amounts due in respect of post-retirement medical benefits to current and retired employees have been actuarially determined and provided for as set out in note 28. Telkom has terminated future post-retirement medical benefits in respect of employees joining after 1 July 2000.
There are three major categories of members entitled to the post-retirement medical aid: pensioners who retired before 1994 ('Pre-94'); those who retired after 2013; and the in-service members. The pensioners retiring post 2013 and the in-service members' liability are subject to a rand cap, which increases as per board's approval. During the current financial year the group settled their obligation with the post-1994 pensioners. Eligible employees must be employed by Telkom until retirement age to qualify for the post-retirement medical aid benefit. The most recent actuarial valuation of the benefit was performed as at 31 March 2016. Telkom has allocated certain investments to fund this liability as set out in note 16.2. The annuity policy of the cell captive investment is the medical plan asset. The group is entitled to a refund of the full surplus in the annuity policy once all the beneficiaries have been paid. As such the group has recognised the full asset.
Present value of funded obligation 2 298 2 412 2 270 2 391
Fair value of plan assets (3 002) (2 815) (3 002) (2 815)
(704) (403) (732) (424)
Liability as disclosed in the statement of financial position (refer to note 28) 28 21 – –
Asset as disclosed in the statement of financial position (732) (424) (732) (424)
Group Company
2016Rm
Restated2015
Rm2016
Rm2015
Rm
Medical aid
Benefit obligation:
At beginning of year 2 412 4 102 2 391 4 081
Acquisition of BCX 4 – – –
Interest cost 185 276 183 276
Service cost 6 4 5 4
Actuarial (gain)/loss (129) 478 (129) 478
Curtailment loss* 48 – 48 –
Settlement gain* (19) (221) (19) (221)
Benefits paid from plan assets (171) (204) (171) (204)
Contributions paid by Telkom* (38) (2 023) (38) (2 023)
Benefit obligation at end of year 2 298 2 412 2 270 2 391
Plan assets at fair value:
At beginning of year 2 815 2 728 2 815 2 728
Interest on plan assets 216 236 216 236
Benefits paid from plan assets (171) (204) (171) (204)
Actuarial gain 142 55 142 55
Plan assets at end of year 3 002 2 815 3 002 2 815
Refer to note 28.
Cumulative actuarial loss (1 652) (1 923) (1 652) (1 923)
Plan assets at fair value:
Interest on plan assets 216 236 216 236
Actuarial gain on plan assets 142 55 142 55
Actual return on plan assets 358 291 358 291
Plan asset balance comprises:
Cash and cash equivalents 180 310 180 310
Equity securities 1 231 1 154 1 231 1 154
Bonds 540 535 540 535
Foreign investments 1 051 816 1 051 816
Total 3 002 2 815 3 002 2 815
Group Company
2016Rm
Restated2015
Rm2016
Rm2015
Rm
The net periodic other comprehensive income includes the following components:Acturial gain/(loss) due to financial assumptions 128 (259) 128 (259)
Actuarial gain/(loss) due to demographic assumptions 143 (164) 143 (164)
Net periodic pension expense and income recognised in other comprehensive income 271 (423) 271 (423)
All equity securities and government bonds have quoted prices in active markets. Funding arrangements The general funding arrangement from the plan assets is to maximise long-term capital growth and long-term total return on Telkom's portfolio. The portfolios are managed as a segregated portfolio which includes international investments. The investment objective is to provide an absolute return, measured over a 36-month period, in excess of CPI-X plus 5 percent per annum. The funding arrangement of the plan assets is driven by designated asset managers to manage Telkom's portfolios by applying a flexible approach, which includes holding equities, property fixed income or money market assets as part of the investment strategy, in variable weightings, at any point in time.
30. Employee benefits (continued)
Medical benefits (continued)
Group Company
2016 2015 2016 2015
Principal actuarial assumptions were as follows:
Assumptions regarding future mortality are based on mortality tables. The current longevities underlying the values of the liabilities in the defined benefit plan are as follows:
Males over 65 16.4 16.3 16.4 16.3
Females over 65 20.5 20.5 20.5 20.5
Discount rate (%) 9.5 7.3 9.5 7.3
Interest on plan assets (%) 9.5 7.3 9.5 7.3
Salary inflation rate (%) 6.9 4.9 6.9 4.9
Medical inflation rate (%) 8.9 6.9 8.9 6.9
The assumed rates of mortality are determined by reference to the SA85-90 (Light) ultimate table, as published by the Actuarial Society of South Africa, for pre-retirement purposes and the PA(90) ultimate table, minus one year age rating as published by the Institute and Faculty of Actuaries in London and Scotland, for retirement purposes.
Contractual retirement age 65 65 65 65
Average retirement age 60 60 60 60
Number of in-service members 944 1 697 944 1 697
Number of pensioners 4 460 4 281 4 460 4 281
*
Consolidated annual financial statements

90 91
Post-retirement mortality rate PA(90) Ultimate-1
(10%) 10%
Benefit obligation 2 270 (101) 103
Percentage change (4.4%) 4.5%
Service cost and interest cost FY2017 188 (10) 10
Percentage change (5.3%) 5.3%
2015
Medical cost inflation rate 6.9% (1%) 1%
Benefit obligation 2 391 (144) 164
Percentage change 6.0% 6.9%
Service cost and interest cost FY2016 280 (10) 12
Percentage change (3.6%) 4.3%
Discount rate 7.3% – 0.5%
Benefit obligation 2 391 110 (101)
Percentage change 4.6% (4.2%)
Service cost and interest cost FY2016 280 10 (11)
Percentage change 3.6% (3.9%)
Post-retirement mortality rate PA(90) Ultimate-1
(10%) 10%
Benefit obligation 2 391 (106) 109
Percentage change 4.4% 4.6%
Service cost and interest cost FY2016 280 (8) 8
Percentage change (2.9%) 2.9%
Group Company
2016 2015 2016 2015
The fund portfolio consists of the following percentages:
Equities (%) 41 41 41 41
Bonds (%) 18 19 18 19
Cash and money market investments (%) 6 11 6 11
Foreign investments (%) 35 29 35 29
Total 100 100 100 100
Telephone rebates Telkom provides telephone rebates to its pensioners who joined prior to 1 August 2009. The most recent actuarial valuation was performed as at 31 March 2016. Eligible employees must be employed by Telkom until retirement age to qualify for the telephone rebates. The scheme is a defined benefit plan.
The status of the telephone rebate liability is disclosed below:
Group Company
2016Rm
2015Rm
2016Rm
2015Rm
Benefit obligation:
At beginning of year 471 375 471 375
Current service cost 4 3 4 3
Interest cost 34 33 34 33
Actuarial (gain)/loss (74) 88 (74) 88
Curtailment loss 2 – 2 –
Benefits paid (27) (28) (27) (28)
Liability as disclosed in the statement of financial position (refer to note 29) 410 471 410 471
The net periodic other comprehensive income includes the following components:
Acturial gain/(loss) due to demographic assumptions (9) 5 (9) 5
Actuarial (loss)/gain due to financial assumptions 84 (93) 84 (93)
Net periodic pension income recognised in other comprehensive income 75 (88) 75 (88)
Cumulative actuarial gain 118 43 118 43
Sensitivity analysis
Increase in discount rate by 0.5% (17) (24) (17) (24)
Decrease in discount rate by 0.5% 18 26 18 26
Principal actuarial assumptions were as follows:
Assumptions regarding future mortality are based on mortality tables. The current longevities underlying the values of the liabilities in the defined benefit plan are as follows:Males over 65 16.4 16.3 16.4 16.3
Females over 65 20.5 20.5 20.5 20.5
Discount rate (%) 9.5 7.3 9.5 7.3
Contractual retirement age 65 65 65 65
Average retirement age 60 60 60 60
The assumed rates of mortality are determined by reference to the standard published mortality table PA (90) Ultimate standard tables, as published by the Institute and Faculty of Actuaries in London and Scotland, rated down one year to value the pensioners.Number of members 9 902 11 494 9 902 11 494
Number of pensioners 12 605 10 293 12 605 10 293
Notes to the consolidated annual financial statementsfor the year ended 31 March 2016
Group and company The valuation results are sensitive to changes in the underlying assumptions. The following table provides an indication of the impact of changing the significant assumptions above:
Current assumption
Decrease Increase
Rm Rm Rm
2016
Medical cost inflation rate 8.9% (1%) 1%
Benefit obligation 2 270 (133) 151
Percentage change (5.9%) 6.6%
Service cost and interest cost FY2017 188 (13) 14
Percentage change (6.9%) 7.4%
Discount rate 9.5% (0.5%) 0.5%
Benefit obligation 2 270 93 (86)
Percentage change 4.1% 3.8%
Service cost and interest cost FY2017 188 12 (13)
Percentage change 6.4% (6.9%)
30. Employee benefits (continued)
Medical benefits (continued)
30. Employee benefits (continued)
Consolidated annual financial statements
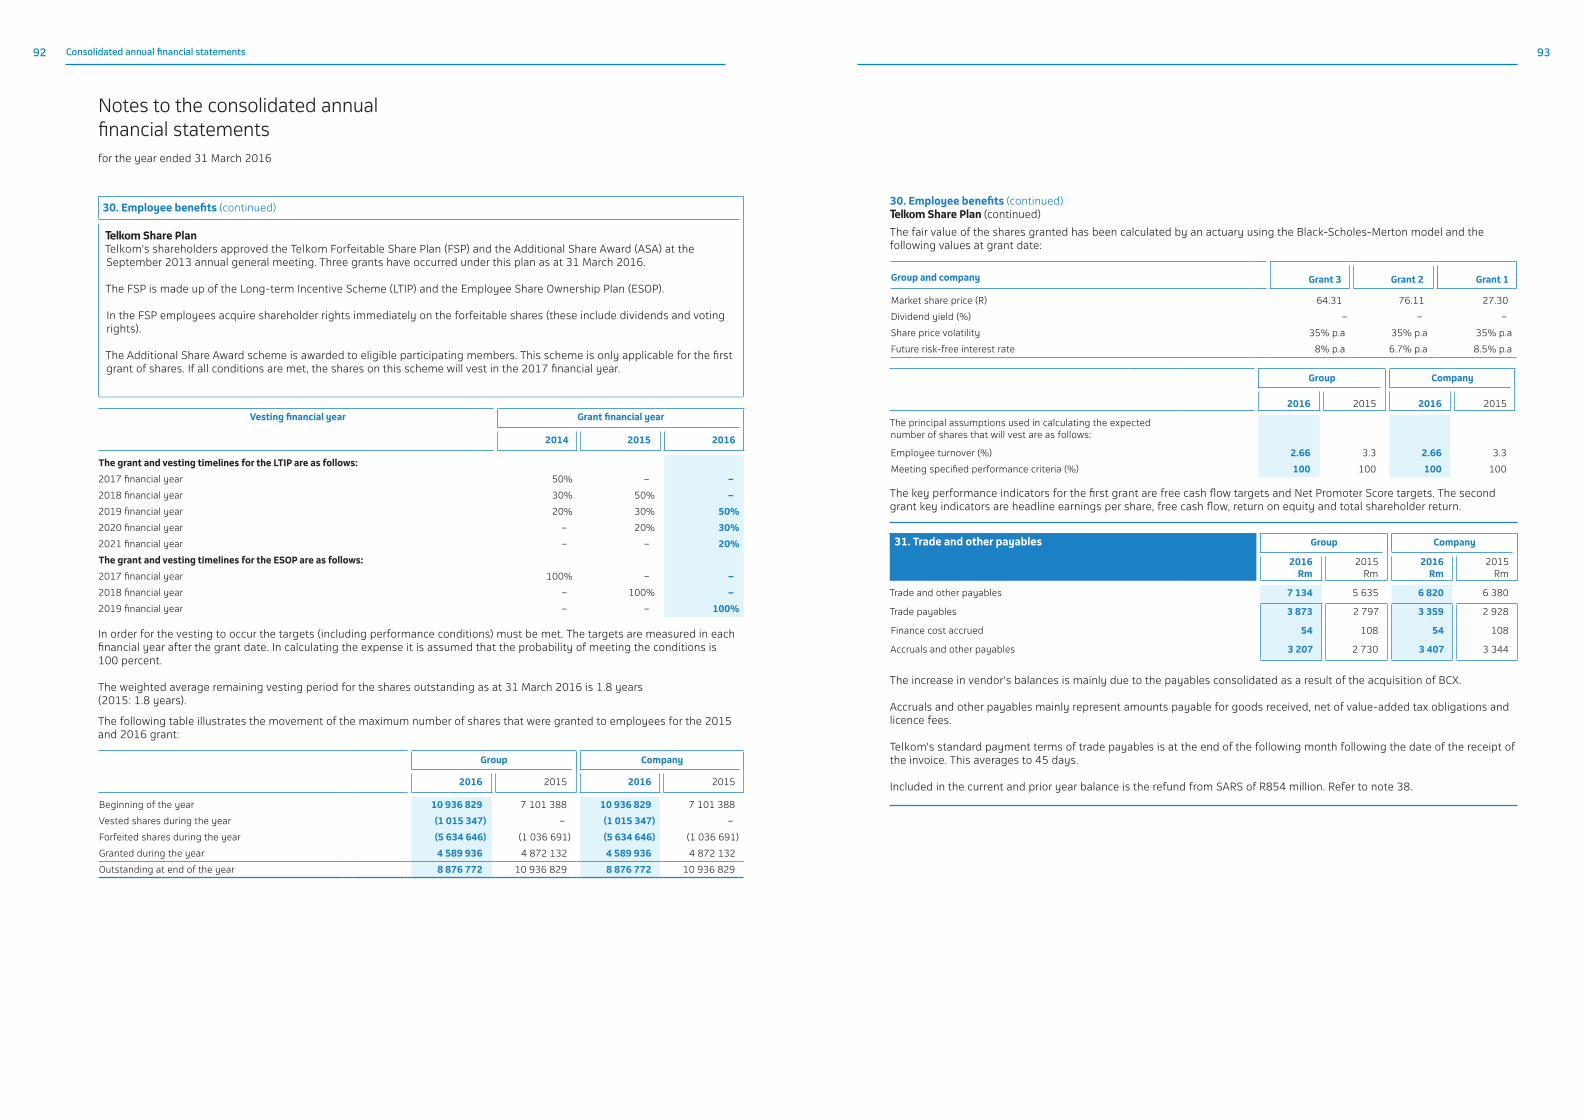
92 93
Notes to the consolidated annual financial statementsfor the year ended 31 March 2016
30. Employee benefits (continued)
Telkom Share PlanTelkom's shareholders approved the Telkom Forfeitable Share Plan (FSP) and the Additional Share Award (ASA) at the September 2013 annual general meeting. Three grants have occurred under this plan as at 31 March 2016. The FSP is made up of the Long-term Incentive Scheme (LTIP) and the Employee Share Ownership Plan (ESOP). In the FSP employees acquire shareholder rights immediately on the forfeitable shares (these include dividends and voting rights).
The Additional Share Award scheme is awarded to eligible participating members. This scheme is only applicable for the first grant of shares. If all conditions are met, the shares on this scheme will vest in the 2017 financial year.
Vesting financial year Grant financial year
2014 2015 2016
The grant and vesting timelines for the LTIP are as follows:
2017 financial year 50% – –
2018 financial year 30% 50% –
2019 financial year 20% 30% 50%
2020 financial year – 20% 30%
2021 financial year – – 20%
The grant and vesting timelines for the ESOP are as follows:
2017 financial year 100% – –
2018 financial year – 100% –
2019 financial year – – 100%
In order for the vesting to occur the targets (including performance conditions) must be met. The targets are measured in each financial year after the grant date. In calculating the expense it is assumed that the probability of meeting the conditions is 100 percent. The weighted average remaining vesting period for the shares outstanding as at 31 March 2016 is 1.8 years(2015: 1.8 years).
The following table illustrates the movement of the maximum number of shares that were granted to employees for the 2015 and 2016 grant:
Group Company
2016 2015 2016 2015
Beginning of the year 10 936 829 7 101 388 10 936 829 7 101 388
Vested shares during the year (1 015 347) – (1 015 347) –
Forfeited shares during the year (5 634 646) (1 036 691) (5 634 646) (1 036 691)
Granted during the year 4 589 936 4 872 132 4 589 936 4 872 132
Outstanding at end of the year 8 876 772 10 936 829 8 876 772 10 936 829
Group and company Grant 3 Grant 2 Grant 1
Market share price (R) 64.31 76.11 27.30
Dividend yield (%) – – –
Share price volatility 35% p.a 35% p.a 35% p.a
Future risk-free interest rate 8% p.a 6.7% p.a 8.5% p.a
The fair value of the shares granted has been calculated by an actuary using the Black-Scholes-Merton model and the following values at grant date:
Group Company
2016 2015 2016 2015
The principal assumptions used in calculating the expected number of shares that will vest are as follows:
Employee turnover (%) 2.66 3.3 2.66 3.3
Meeting specified performance criteria (%) 100 100 100 100
The key performance indicators for the first grant are free cash flow targets and Net Promoter Score targets. The second grant key indicators are headline earnings per share, free cash flow, return on equity and total shareholder return.
The increase in vendor's balances is mainly due to the payables consolidated as a result of the acquisition of BCX. Accruals and other payables mainly represent amounts payable for goods received, net of value-added tax obligations and licence fees. Telkom's standard payment terms of trade payables is at the end of the following month following the date of the receipt of the invoice. This averages to 45 days. Included in the current and prior year balance is the refund from SARS of R854 million. Refer to note 38.
31. Trade and other payables Group Company
2016Rm
2015Rm
2016Rm
2015Rm
Trade and other payables 7 134 5 635 6 820 6 380
Trade payables 3 873 2 797 3 359 2 928
Finance cost accrued 54 108 54 108
Accruals and other payables 3 207 2 730 3 407 3 344
30. Employee benefits (continued)Telkom Share Plan (continued)
Consolidated annual financial statements

94 95
Notes to the consolidated annual financial statementsfor the year ended 31 March 2016
32. Reconciliation of profit for the year to cash generated from operations
Group Company
2016Rm
Restated2015
Rm2016
Rm
Restated2015
Rm
Cash generated from operations 8 744 6 799 7 955 6 271
Profit for the year 2 376 3 184 2 585 3 131
Finance charges and fair value movements 622 473 618 471
Taxation 524 (28) 359 (172)
Investment income (203) (293) (812) (506)
Interest received from trade receivables and subsidiaries (261) (208) (255) (187)
Non-cash items 7 091 4 477 5 616 4 381
Depreciation, amortisation, impairment and write-offs 5 527 5 505 5 274 5 457
Debtors impairment 416 444 424 400
Cost of equipment disposed when recognising finance leases 42 8 42 8
Post-retirement medical aid settlement gain (19) (221) (19) (221)
Increase in provisions 1 424 (902) 399 (906)
Profit on disposal of property, plant and equipment and intangible assets (475) (246) (474) (246)
Deferred revenue 176 (111) (30) (111)
(Decreases/increase in working capital (1 405) (806) (156) (847)
Inventories (23) 146 107 145
Accounts receivable (295) (593) (493) (778)
Accounts payable (1 087) (359) 230 (214)
33. Dividend received Group Company
2016Rm
Restated2015
Rm2016
Rm
Restated2015
Rm
Dividend received – – 195 226
Dividend received from subsidiaries – – 195 226
34. Finance charges paid Group Company
2016Rm
Restated2015
Rm2016
Rm
Restated2015
Rm
Finance charges paid (768) (493) (678) (491)
Finance charges and fair value movements per statement of profit or loss and other comprehensive income (622) (473) (618) (471)
Non-cash items (146) (20) (60) (20)
Movements in interest accruals 107 86 72 86
Net discount amortised 114 98 114 98
Borrowing costs capitalised (refer to note 8) (103) (93) (103) (93)
Capitalised finance leases (136) 86 26 86
Hedging costs (224) 9 (265) 9
Fair value adjustment 12 (261) 12 (261)
Cash effects of foreign exchange rates (2) (3) (2) (3)
Unrealised foreign exchange loss 86 58 86 58
35. Taxation paid Group Company
2016Rm
Restated2015
Rm2016
Rm
Restated2015
Rm
Taxation paid* (288) (406) (52) (251)
Net tax payable at beginning of year (333) (774) (344) (782)
Current taxation (572) (410) (371) (258)
Witholding tax (1) – – –
Acquisition of BCX (10) – – –
Non-cash items 10 445 10 445
Net tax payable at end of year 618 333 653 344
Included in taxation paid is a refund from SARS of R199 million.
36. Dividend paid Group Company
2016Rm
Restated2015
Rm2016
Rm
Restated2015
Rm
Dividend paid (1 402) (121) (1 290) (2)
Dividend payable at beginning of year (19) (21) (19) (21)
Declared during the year - Dividend on ordinary shares: (1 291) – (1 291) –
June 2015 dividend (1 291) – (1 291) –
Dividends declared to non-controlling interests (114) (119) – –
Dividend payable at end of year 22 19 20 19
37. Commitments Group Company
2016Rm
Restated2015
Rm2016
Rm
Restated2015
Rm
Commitments
Capital commitments authorised 6 574 5 556 6 500 5 500
Commitments against authorised capital expenditure 3 388 1 057 3 379 1 057
Authorised capital expenditure not yet contracted 3 186 4 499 3 121 4 443
Capital commitments are largely attributable to purchases of property, plant and equipment and software. Management expects these commitments to be financed from internally generated cash and borrowings. Total < 1 year 1 - 5 years > 5 years
Rm Rm Rm Rm
Group
Operating lease commitments and receivables
2016
Land and buildings 2 629 441 2 119 69
Rental receivable on buildings (1 481) (281) (1 172) (28)
Customer premises equipment receivables (35) (21) (14) –
Vehicles 921 165 756 –
Other 97 78 18 1
Total 2 131 382 1 707 42
*
Consolidated annual financial statements
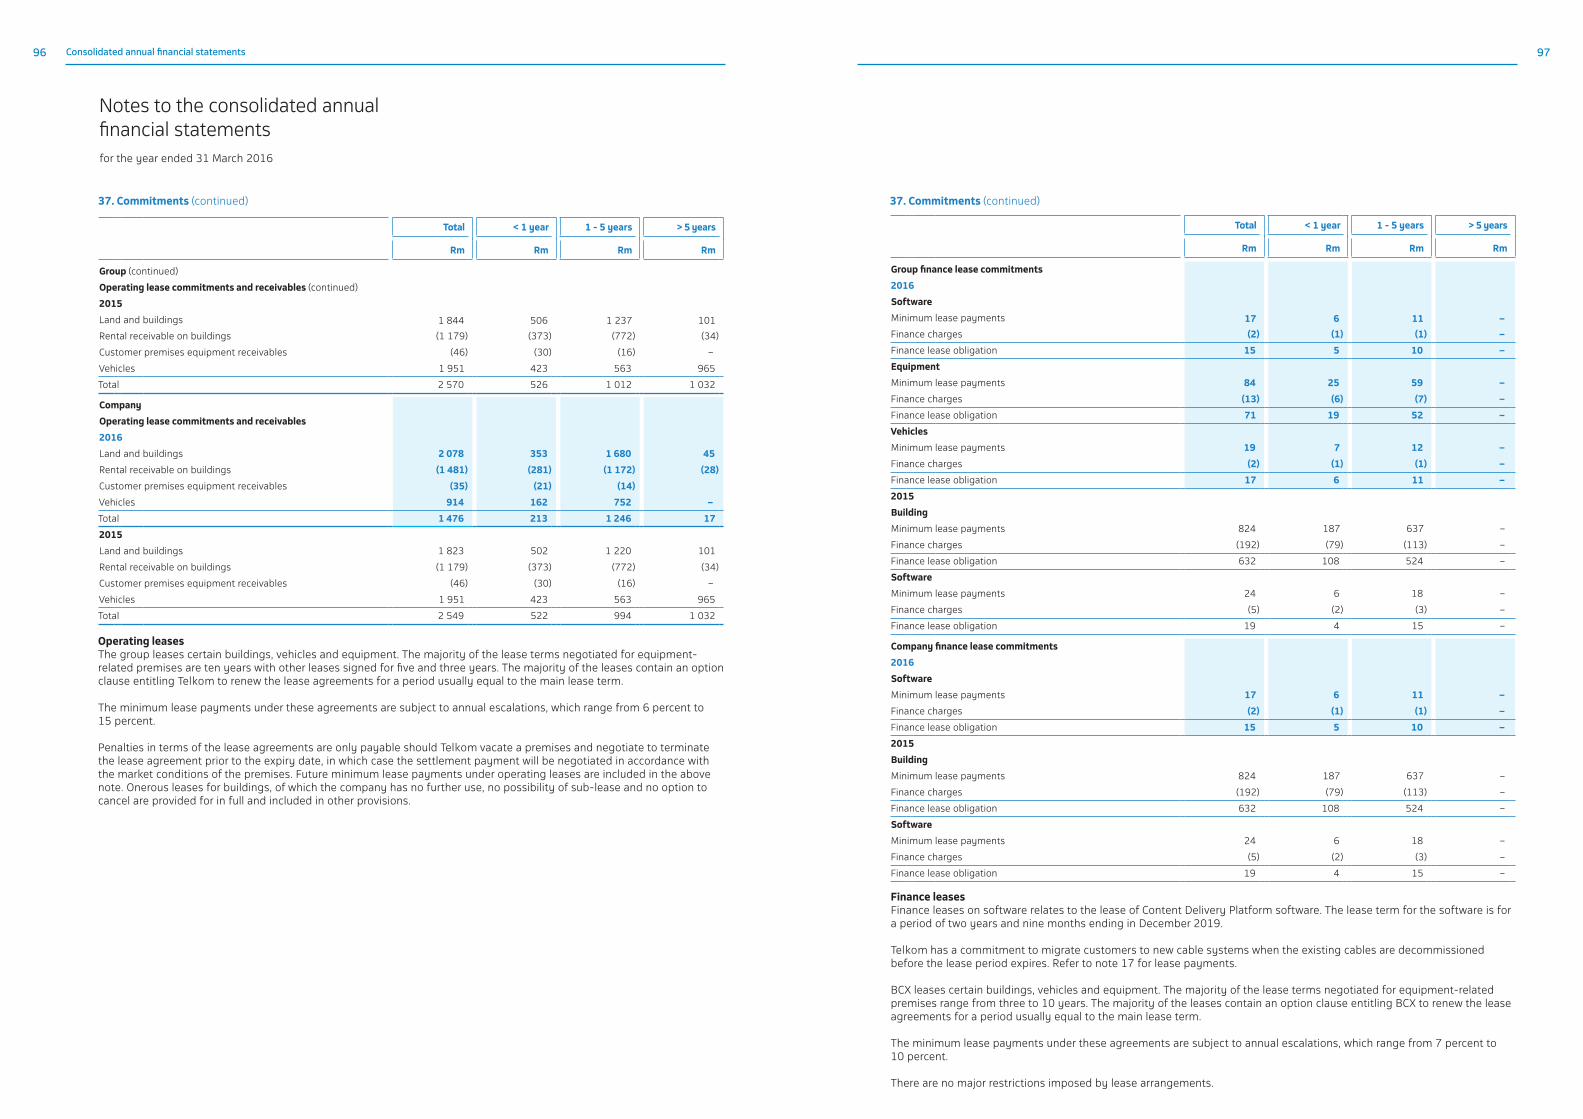
96 97
Notes to the consolidated annual financial statementsfor the year ended 31 March 2016
Total < 1 year 1 - 5 years > 5 years
Rm Rm Rm Rm
Group (continued)
Operating lease commitments and receivables (continued)
2015
Land and buildings 1 844 506 1 237 101
Rental receivable on buildings (1 179) (373) (772) (34)
Customer premises equipment receivables (46) (30) (16) –
Vehicles 1 951 423 563 965
Total 2 570 526 1 012 1 032
Company
Operating lease commitments and receivables
2016
Land and buildings 2 078 353 1 680 45
Rental receivable on buildings (1 481) (281) (1 172) (28)
Customer premises equipment receivables (35) (21) (14)
Vehicles 914 162 752 –
Total 1 476 213 1 246 17
2015
Land and buildings 1 823 502 1 220 101
Rental receivable on buildings (1 179) (373) (772) (34)
Customer premises equipment receivables (46) (30) (16) –
Vehicles 1 951 423 563 965
Total 2 549 522 994 1 032
Operating leases The group leases certain buildings, vehicles and equipment. The majority of the lease terms negotiated for equipment-related premises are ten years with other leases signed for five and three years. The majority of the leases contain an option clause entitling Telkom to renew the lease agreements for a period usually equal to the main lease term. The minimum lease payments under these agreements are subject to annual escalations, which range from 6 percent to 15 percent. Penalties in terms of the lease agreements are only payable should Telkom vacate a premises and negotiate to terminate the lease agreement prior to the expiry date, in which case the settlement payment will be negotiated in accordance with the market conditions of the premises. Future minimum lease payments under operating leases are included in the above note. Onerous leases for buildings, of which the company has no further use, no possibility of sub-lease and no option to cancel are provided for in full and included in other provisions.
37. Commitments (continued)
Total < 1 year 1 - 5 years > 5 years
Rm Rm Rm Rm
Group finance lease commitments
2016
Software
Minimum lease payments 17 6 11 –
Finance charges (2) (1) (1) –
Finance lease obligation 15 5 10 –
Equipment
Minimum lease payments 84 25 59 –
Finance charges (13) (6) (7) –
Finance lease obligation 71 19 52 –
Vehicles
Minimum lease payments 19 7 12 –
Finance charges (2) (1) (1) –
Finance lease obligation 17 6 11 –
2015
Building
Minimum lease payments 824 187 637 –
Finance charges (192) (79) (113) –
Finance lease obligation 632 108 524 –
Software
Minimum lease payments 24 6 18 –
Finance charges (5) (2) (3) –
Finance lease obligation 19 4 15 –
Company finance lease commitments
2016
Software
Minimum lease payments 17 6 11 –
Finance charges (2) (1) (1) –
Finance lease obligation 15 5 10 –
2015
Building
Minimum lease payments 824 187 637 –
Finance charges (192) (79) (113) –
Finance lease obligation 632 108 524 –
Software
Minimum lease payments 24 6 18 –
Finance charges (5) (2) (3) –
Finance lease obligation 19 4 15 –
Finance leases Finance leases on software relates to the lease of Content Delivery Platform software. The lease term for the software is for a period of two years and nine months ending in December 2019. Telkom has a commitment to migrate customers to new cable systems when the existing cables are decommissioned before the lease period expires. Refer to note 17 for lease payments. BCX leases certain buildings, vehicles and equipment. The majority of the lease terms negotiated for equipment-related premises range from three to 10 years. The majority of the leases contain an option clause entitling BCX to renew the lease agreements for a period usually equal to the main lease term. The minimum lease payments under these agreements are subject to annual escalations, which range from 7 percent to 10 percent. There are no major restrictions imposed by lease arrangements.
37. Commitments (continued)
Consolidated annual financial statements

98 99
Beneficial Non-beneficial
Number of shares Notes Direct Indirect Direct Indirect
Directors' shareholding
2016
Executive
SN Maseko 52 520 – – –
DJ Fredericks 9 607 267 – –
62 127 267 – –
Non-executive
JA Mabuza 26 000 – – –
F Petersen-Lurie – – – 400
I Kgaboesele 12 000 – – –
KW Mzondeki 267 – – –
38 267 – – 400
2015
Executive
SN Maseko 52 520 – – –
DJ Fredericks 4 967 267 – –
57 487 267 – –
Non-executive
JA Mabuza 26 000 – – –
F Petersen-Lurie – – – 400
I Kgaboesele 12 000 – – –
KW Mzondeki 267 – – –
38 267 – – 400
Notes to the consolidated annual financial statementsfor the year ended 31 March 2016
38. Contingencies
Contingent liabilities
Matters Before ICASA End-User and Service Charter Regulations In 2011, allegations were made at ICASA's Complaints and Compliance Committee (the CCC) regarding Telkom’s alleged non-compliance with the requirements of the End-User and Service Charter Regulations relating to the clearance of reported faults. The CCC heard the matter and ruled that Telkom is not in breach of the Regulations and recommended that ICASA review the regulations. Telkom has initiated administrative review proceedings seeking to set aside the applicability of the Regulations since the CCC ruling is not binding on ICASA and the risk remains for similar referrals. The review application is in process and no hearing date has been allocated as yet. ICASA promulgated the Amended End-User and Subscriber Charter Regulations 2016 on 1 April 2016 and we are currently assessing the impact that the new regulations will have on the review proceedings and Telkom going forward.
High Court Telkom/ICASA, Neotel and CCC Neotel requested Telkom to provide access to Telkom’s local loop in November 2010. Telkom declined the request and Neotel submitted a formal complaint to the CCC which made an order directing Telkom to provide Neotel access to Telkom’s local loop. Telkom launched an interim relief application in the High Court for an order that the CCC order should not be implemented pending the outcome of a review application in the High Court to review and set aside the CCC order. The parties have since reached an agreement in terms of which Telkom withdrew its application for interim relief and ICASA in turn undertook not to implement the CCC order pending the outcome of Telkom's application for review. No date has been set down as yet for the hearing of the review application.
Radio Surveillance Security Services (Pty) Ltd (RSSS) In December 2011, RSSS served a summons on Telkom for the sum of R216 million.Telkom is defending the matter and has filed a plea and counterclaim for R22 million.No contract was concluded with RSSS, no purchase orders were issued and no quotations were accepted by Telkom. The trial commenced in May 2016 but was postponed for further hearing in April 2017. Phutuma Networks (Pty) Ltd (Phutuma) In August 2009 Phutuma served a summons on Telkom, claiming for damages arising from a tender published by Telkom in November 2007, claiming damages in the amount of R5.5 billion. The High Court granted absolution from the instance, in Telkom's favour. The Supreme Court of Appeal (SCA) had initially dismissed Phutuma's application for leave to appeal in October 2014. On 4 November 2014, the SCA rescinded its order granted in October 2014. In early 2015, the SCA referred the appeal back to the full bench of the North Gauteng High Court. The appeal has been set down for hearing in September 2016.
Other Section 197: Labour Relations Act Telkom invoked a process in terms of section 197 of the Labour Relations Act, to outsource certain service functions, in Telkom, as going concerns. Section 197 (8) states that Telkom and the new employers are jointly and severally liable to any employee who was transferred and becomes entitled to receive a payment as a result of the employee’s dismissal for a reason relating to the new employer’s operational requirements or liquidation. Telkom will be held liable for a period of 12 months after the date of transfer, which may result in an onerous obligation. Contingent Assets Tax matters As noted in the 2014 consolidated annual financial statements, the tax treatment of the loss that arose in 2012 and 2014 financial years on the sale of foreign subsidiaries is based on a specific set of circumstances and a complex legislative environment. A tax refund received during prior periods, relating to the 2012 sale, is contingent and will only be recognised once the matter has been resolved with SARS. Refer to note 31.
39. Directors' interest and prescribed officers
Group and company Notes
Fees
R
Remuneration
R
Performancebonus
R
Fringe andother benefits
R
Total
Rm
2016
Emoluments per director:
Non-executive 3 846 888 5 283 318 – – 9 130 206
N Kapila 295 500 493 486 – – 788 986
I Kgaboesele* 491 970 357 042 – – 849 012
GW Dempster 295 500 357 042 – – 652 542
T Dingaan 315 250 357 042 – – 672 292
RG Tomlinson 290 250 357 042 – – 647 292
RN Ntshingila 106 500 357 042 – – 463 542
JA Mabuza 262 190 1 219 412 – – 1 481 602
KW Mzondeki 363 475 357 042 – – 720 517
SL Botha 298 500 357 042 – – 655 542
KT Kweyama 227 500 357 042 – – 584 542
F Petersen-Lurie 410 278 357 042 – – 767 320
LL von Zeuner 489 975 357 042 – – 847 017 Executive that held office during year ended 31 March 2016 – 12 691 200 9 829 862 1 446 432 23 967 494
SN Maseko (GCEO) – 7 441 200 6 127 846 941 683 14 510 729
Deon Fredericks (CFO) – 5 250 000 3 702 016 504 749 9 456 765
Total emoluments - paid by Telkom 3 846 888 17 974 518 9 829 862 1 446 432 33 097 700
Consolidated annual financial statements

100 101
Group and company Notes Remuneration*
R
Incentivebonus
R
Fringe andother benefits**
R
Total
R
Pension -TRF13%***
Rm
2016Emoluments per prescribed officer:
MA Altman 1 1 197 396 347 857 272 522 1 817 775 124 529
BC Armstrong 5 001 345 3 340 323 481 830 8 823 498 455 122
TE Msubo 1 1 383 071 – 317 475 1 700 546 107 880
GJ Rasethaba 1 1 192 156 692 669 274 338 2 159 163 89 888
AN Samuels 4 291 667 3 489 288 350 649 8 131 604 524 667
V Scarcella 1 1 430 000 1 011 458 329 038 2 770 496 111 540
LM DeVilliers 3 288 448 2 051 514 321 557 5 661 519 447 229
IM Russell 4 153 353 3 000 011 402 977 7 556 341 323 961
IC Coetzee 1 1 039 819 625 000 738 597 2 403 416 78 402
A Vitai 2 2 650 000 1 911 922 11 997 4 573 919 –
J Henning 2 1 295 455 1 091 071 11 997 2 398 523 –
Total emoluments - granted by Telkom 26 922 710 17 561 113 3 512 977 47 996 800 2 263 218
2015Emoluments per prescribed officer:
MA Altman 687 500 413 465 – 1 100 965 71 500
BC Armstrong 4 770 000 2 882 894 11 994 7 664 888 434 070
TE Msubo 3 176 430 1 942 050 11 994 5 130 474 247 762
GJ Rasethaba 2 737 966 1 703 769 11 994 4 453 729 206 443
AN Samuels 3 207 943 2 315 362 11 994 5 535 299 291 923
V Scarcella 3 300 000 1 923 131 6 998 5 230 129 257 400
LM de Villiers 3 146 840 1 917 539 11 994 5 076 373 427 970
IM Russell 3 974 500 2 467 530 11 994 6 454 024 310 011
IC Coetzee 2 343 254 1 068 139 11 994 3 423 387 176 681
Total emoluments - granted by Telkom 27 344 433 16 633 879 90 956 44 069 268 2 423 760
Remuneration has been apportioned based on the period served as prescribed officers. Comparative information has been provided for members identified as prescribed officers. Fringe and other benefits include motor car insurance, retention agreements, sign-on bonuses, flexible allowance, acting allowances, leave gratuity and voluntary severance packages/voluntary early retirement packages benefits. The pension contribution is a company contribution.
1 Ceased 31 August 2015. 2 Appointed to executive committee 16 October 2015.
*
**
***
Notes to the consolidated annual financial statementsfor the year ended 31 March 2016
Group and Company Notes
Fees
R
Remuneration
R
Performancebonus
R
Fringe andother benefits
R
Total
Rm
2015
Emoluments per director:
Non-executive 4 275 150 4 467 646 – – 8 742 796
N Kapila 352 500 465 555 – – 818 055
I Kgaboesele* 680 190 336 375 – – 1 016 565
GW Dempster 16 500 112 331 – – 128 831
T Dingaan 78 300 112 331 – – 190 631
RG Tomlinson 78 300 112 331 – – 190 631
RN Ntshingila 46 500 112 331 – – 158 831
JA Mabuza 365 320 1 148 850 – – 1 514 170
KW Mzondeki 366 900 336 375 – – 703 275
LW Maasdorp 105 000 135 417 – – 240 417
SL Botha 381 500 336 375 – – 717 875
Dr CA Fynn 323 000 250 250 – – 573 250
KT Kweyama 411 500 336 375 – – 747 875
F Petersen-Lurie 502 740 336 375 – – 839 115
LL Von Zeuner 566 900 336 375 – – 903 275
Executive that held office during 31 March 2016 – 11 306 048 8 481 173 1 192 255 20 979 476
SN Maseko (GCEO) – 7 020 000 5 273 213 11 994 12 305 207
DJ Fredericks (CFO) – 4 286 048 3 207 960 1 180 261 8 674 269
Total emoluments – paid by Telkom 4 275 150 15 773 694 8 481 173 1 192 255 29 722 272
39. Directors' interest and prescribed officers (continued) 39. Directors' interest and prescribed officers (continued)
Refer to remuneration report for appointments and resignations. Included in fringe and other benefits is motor car insurance for SN Maseko of R11 997 (2015: R11 994), DJ Fredericks, motor car insurance of R11 997 (2015: R6 497.00). SN Maseko received an allocation of 338 923 shares (2015: nil) amounting to an IFRS 2 expense of R4 392 442 (2015: nil). DJ Fredericks received an allocation of 241 905 shares amounting to an IFRS 2 expense of R3 135 089.
JH Schindehütte earned R6.5 million as remuneration and R12 million as fringe and other benefits.
Paid to Sphere Holdings (Pty) Limited.*
Consolidated annual financial statements

102 103
Notes to the consolidated annual financial statementsfor the year ended 31 March 2016
40. Related parties Group Company
2016Rm
Restated2015
Rm2016
Rm
Restated2015
Rm
Details of material transactions and balances with related parties not disclosed separately in the consolidated annual financial statements were as follows:
With shareholders:
Government of South Africa*
Related party balances
Finance lease receivable 272 366 272 366
Trade receivables 562 464 562 464
Provision for doubtful debt (67) (16) (67) (16)
Related party transactions
Revenue (3 700) (3 770) (3 700) (3 770)
Individually significant revenue** (1 494) (1 771) (1 494) (1 771)
City of Cape Town (41) (41) (41) (41)
Department of Correctional Services (78) (82) (78) (82)
Department of Health: Gauteng (95) (389) (95) (389)
Department of Justice (104) (109) (104) (109)
South African National Defence Force (66) (69) (66) (69)
South African Police Services (577) (628) (577) (628)
South African Revenue Services (28) (34) (28) (34)
S.I.T.A. (Pty) Ltd (201) (205) (201) (205)
South African Post Office (37) (55) (37) (55)
Ekurhuleni Metropolitan Council (57) (52) (57) (52)
KZN Ethekwini Municipality (44) (46) (44) (46)
Department of Internal Affairs (53) (61) (53) (61)
Eastern Cape Department of Health*** (49) – (49) –
Province of KZN Health Service*** (64) – (64) –
Collectively significant revenue** (2 206) (1 999) (2 206) (1 999)
Comparatives are restated.The nature of the individually and collectively significant revenue consists mostly of data revenue.Individually significant from the current year.
At 31 March 2016, the Government of South Africa held 39.3 percent (2015: 39.8 percent) of Telkom's shares, and has the ability to exercise significant influence, and the Public Investment Corporation held 11.4 percent (2015: 12%) of Telkom's shares.
With subsidiaries:
Business Connexion
Related party balances
Trade receivables 219 –
Loan 418
Interest receivable 15
Trade payables (541) –
Related party transactions
Revenue (18) –
Expenses 701 –
Interest received (15) –
2016Share allocation per prescribed officer:
Number of shares
IFRS 2 Expense
MA Altman* 76 735 994 486
BC Armstrong 133 270 1 727 179
TE Msubo* 88 635 1 148 710
GJ Rasethaba* 76 399 990 131
AN Samuels 96 060 1 244 938
V Scarcella* 91 915 1 191 218
LM de Villiers 87 808 1 137 992
IM Russell 110 903 1 437 303
IC Coetzee* 32 323 418 906
A Vitai** 58 929 763 720
J Henning** 13 443 174 221
866 420 11 228 803
2015No forfeitable shares were awarded in the financial year in accordance with the rules of the Telkom Share Plan. This was due to a prolonged close period.
The group has identified exco members as prescribed officers because they exercise general executive control over the business.
39. Directors' interest and prescribed officers (continued)
Prescribed officers at grant date however ceased to be prescribed officers on 31 August 2015.Appointed as to executive committee 16 October 2015.
***
***
***
Consolidated annual financial statements

104 105
Notes to the consolidated annual financial statementsfor the year ended 31 March 2016
40. Related parties (continued) Group Company
2016Rm
Restated2015
Rm2016
Rm
Restated2015
Rm
With subsidiaries:
Trudon (Pty) Ltd
Related party balances
Trade receivables 6 4
Trade payables (311) (319)
Related party transactions
Revenue (68) (70)
Expenses 9 11
Dividend received (188) (221)
Swiftnet (Pty) Ltd
Related party balances
Trade receivables 1 –
Trade payables (3) (3)
Related party transactions
Revenue (4) (4)
Expenses 56 58
Dividend received (7) (6)
Rossal No 65 (Pty) Ltd
Related party balances
Accruals and other payables (2) (285)
Related party transactions
Dividend paid 5 –
Acajou Investments (Pty) Ltd
Related party balances
Accruals and other payables – (154)
Related party transactions
Dividend paid 437 –
Intekom (Pty) Ltd
Related party balances
Accruals and other payables (112) (96)
Related party transactions
Expenses 22 19
Q-Trunk (Pty) Ltd
Related party balances
Loan to subsidiary – 1
Impairment of loan – (1)
The loan is unsecured, interest free and has no fixed repayment terms. The loan has been subordinated in favour of other creditors.
Related party transactions
Expenses – 5
Telkom Foundation
Related party balances
Sundry provision (5) (6)
Assets (5) 4
Related party transactions
Expenses 44 42
40. Related parties (continued) Group Company
2016Rm
Restated2015
Rm2016
Rm
Restated2015
Rm
With subsidiaries (continued):
The sales to and purchases from related parties of telecommunication services are made at normal market prices. Except as indicated above, outstanding balances at year end are unsecured, interest free and settlement occurs in cash. There have been no guarantees provided or received for any related party receivables or payables. Except as indicated above, for the year ended 31 March 2016, the company has not made any impairment of amounts owed by related parties. This assessment is undertaken each financial year through examining the financial position of the related party and the market in which the related party operates.
With entities under common control:
Major public entities
Related party balances
Trade receivables 130 75 45 74
Trade payables (5) (1) (5) (1)
Related party transactions
Revenue (394) (243) (244) (238)
Expenses 226 238 226 238
Individually significant expenses 207 226 207 226
South African Post Office 52 77 52 77
Eskom 155 144 155 144
South African Broadcasting Corporation – 5 – 5
Collectively significant expenses 19 12 19 12
Rent received (28) (53) (28) (53)
Individually significant rent received: South African Post Office (25) (46) (25) (46)
Collectively significant rent received (3) (7) (3) (7)
Rent paid 10 29 10 29
Individually significant rent paid: South African Post Office 5 19 5 19
Collectively significant rent paid 5 10 5 10
Key management personnel compensation:
(Including directors and prescribed officers' emoluments)
Related party transactions
Short-term employee benefits 308 214 213 194
Post-employment benefits 17 12 13 10
Termination benefits 14 5 14 5
Equity compensation benefits 14 4 14 –
Transactions with non-executive directors are disclosed in note 41.
Terms and conditions of transactions with related partiesOutstanding balances at the year end are unsecured, interest free and settlement occurs in cash. There have been no guarantees provided or received for related party receivables or payables.
Consolidated annual financial statements

106 107
Notes to the consolidated annual financial statementsfor the year ended 31 March 2016
41. Group interest in subsidiaries and associates
Set out below is a list of the significant subsidiaries and associate of the group at 31 March 2016. Unless otherwise stated, the entities as listed below have share capital consisting solely of ordinary shares, which are held directly by the group and the proportion of ownership interest held equals to the voting rights held by the group. Country of incorporation: RSA - Republic of South Africa
The total non-controlling interest for the period is R473 million (2015: R363 million), which relates to Trudon and Business Connexion and is not considered material to the group.
The group's interest in the Number Portability Company is not regarded as individually material. The equity method is used to account for the financial information of the associate. The investment is recorded at cost.
Deregistered. **Associate.
Name
Country of incor-poration
Issued share
capital2016
R
Interest in issued
ordinary share capital
2016%
Ownership interest held
by non-controlling
interest2016
%
Issued share capital
2015R
Interest in issued
ordinary share capital
2015%
Ownership interest held
by non-controlling
interest2015
%
Business Connexion RSA 2 280 500 100 – – – –
Trudon (Pty) Ltd RSA 100 000 64.9 35.1 100 000 64.9 35.1
Rossal No 65 (Pty) Ltd RSA 100 100 – 100 100 –
Acajou Investments (Pty) Ltd RSA 100 100 – 100 100 –
Intekom (Pty) Ltd RSA 10 001 000 100 – 10 001 000 100 –
Q-Trunk (Pty) Ltd* RSA – – – 10 001 000 100 –
Swiftnet (Pty) Ltd RSA 5 000 000 100 – 5 000 000 100 –
Number Portability Company** RSA 100 20 – 100 20 –
Revenue EBITDA EBIT Net profit/(loss)
Rm Rm Rm Rm
Interest in operating profits from subsidiaries and associate
2016
Business Connexion 4 810 274 213 132
Trudon (Pty) Ltd 1 048 428 393 294
Swiftnet (Pty) Ltd 158 47 25 20
Rossal No 65 (Pty) Ltd – – – 2
Acajou Investments (Pty) Ltd – – – (2)
Intekom (Pty) Ltd – 22 22 16
Number Portability Company – – – –
Telkom Foundation* – (3) (3) (3)
2015
Trudon (Pty) Ltd 1 096 452 423 300
Rossal No 65 (Pty) Ltd – – – –
Acajou Investments (Pty) Ltd – – – (9)
Intekom (Pty) Ltd – 12 12 14
Q-Trunk (Pty) Ltd – 3 3 3
Swiftnet (Pty) Ltd 89 43 22 18
Number Portability Company – – – –
Telkom Foundation* – 6 6 6
None of the group's equity-accounted investees are publicly listed entities and consequently do not have published price quotations.
There are no significant restrictions on the ability of the associate to transfer funds to the group in the form of cash dividends, or to repay loans or advances made by the group.
Non-proft making trust.
42. Significant events
Issuing of ordinary shares On 30 June 2015, Telkom issued 3 979 348 ordinary shares for no consideration. The shares were allotted and issued in terms of the Telkom Employee Share Plan.
Company secretary Ms Xoliswa Mpongoshe Makasi resigned from her position as company secretary of Telkom with effect from30 June 2015. Ms Ephenia Motlhamme was appointed as company secretary to the group with effect from 1 August 2015.
Results of the Telkom annual general meeting regarding directors' reappointments On 26 August 2015, all board members were re-elected as per the annual general meeting ordinary resolutions. MTN and Telkom Radio Access Network (RAN) assets transaction On 7 March 2014, Telkom signed a heads of agreement in terms of which MTN South Africa would take over the financial and operational responsibility for the roll-out and operation of Telkom’s RAN. The parties wanted reciprocal roaming agreements to enable customers of either party to roam on each other’s network.
On 17 August 2015, Telkom was informed by the Competition Commission that it had recommended to the Competition Tribunal that the transaction be prohibited. The parties have agreed not to proceed with the transaction in its current form.
Acquisition of Business Connexion (BCX) On 22 May 2014, Telkom announced its firm intention to make an offer to acquire the entire issued share capital of BCX in a bid to improve performance and restore profitability.
Shareholders of BCX approved the acquisition by Telkom at an ordinary shareholders meeting held on 11 August 2014. On 4 August 2015, the Competition Tribunal approved the transaction between the companies with conditions. All suspensive conditions were met and the purchase consideration was paid on 25 August 2015. Voluntary severance packages and voluntary early retirement packages Telkom announced on 13 July 2015 the offer of VSP and VERP to non-unionised employees across the company. On 24 July 2015, Telkom announced the decision to extend the invitation to all employees, including union members. The application process was concluded on 17 August 2015.
On 18 March 2016 Telkom announced the offer of VSP and VERP to all employees, including union members across the company. The application process was concluded on 4 April 2016. Approximately 3 878 employee applications were accepted during the financial year.
Dividends The Telkom board declared an ordinary dividend of 215 cents per share and a special dividend of 30 cents per share on 5 June 2016 paid on 20 July 2015 to shareholders registered on 17 July 2015. Pretoria Head Office In September 2015, Telkom settled its lease obligation for the buildings with the Telkom Retirement Fund (TRF). Telkom also purchased a previously leased property from the TRF. FutureMakers Telkom has implemented an Enterprise and Supplier Development (ESD) programme. As part of the programme, Telkom in partnership with Identity FutureFund (Pty) Ltd (IDF), established FutureMakers, in terms of the Department of Trade and Industry’s Codes of Good Practice on Black Economic Empowerment 2007, as amended (the Codes) and specifically, in terms of the Information and Technology Charter (the ICT Charter). The partnership and its initiatives is established in line with Telkom’s sustainable strategy of implementing meaningful black economic empowerment (BEE) initiatives.The inception year of the programme focused on the setup and development of key commercial programmes, namely, Internet cafes,third party dealerships, independent field technicians and a Cisco partnership.
*
*
Consolidated annual financial statements

108 109
Notes to the consolidated annual financial statementsfor the year ended 31 March 2016
42. Significant events (continued)
Launch of redesigned Wholesale division On 13 October 2015 Telkom launched Openserve, the group’s redesigned Wholesale and Networks division. Openserve will be a distinct business unit within the Telkom group, which is formed as part of the group’s ongoing efforts to strengthen customer focus through a more flexible and agile operating model. The separation heralds a new era in the Telkom group as it prepares to welcome a more open access environment and all the opportunities it offers. This move is also in line with Telkom’s turnaround strategy to separate its Wholesale and Retail divisions to facilitate greater focus, accountability and most importantly, customer-centricity. As a key driver of socio-economic development, Openserve will enable more choice, increased innovation and greater service-provider competition. The result will be increased broadband access. Telkom intends to play a substantial role in lowering the barrier to entry for new players and to increase the competitiveness of smaller players.
43. Subsequent events
Dividends The Telkom board declared an ordinary dividend of 270 cents per share on 6 June 2016 payable on 4 July 2016 to shareholders registered on 1 July 2016.
Employee Share Plan During April 2016, Telkom purchased 3 710 126 shares from the market through Rossal for the purposes of the Telkom Employee Share Plan. BCX's acquisition of Relational Database Consulting Effective 1 April 2016 Business Connexion acquired Relational Database Consulting Group (Pty) Ltd (RDC). RDC is a market leader in database and system administration with a strong focus on Oracle, SQL Server, MySQL and PostgreSQL on a variety of operating systems. Their expanded range of services includes Oracle E-Business Suite, Oracle Fusion Middleware, Oracle Solaris Support and Oracle Sales.
The total purchase consideration of R32 million was in the form of cash and earn-out payments. The provisional fair value of the assets and liabilities were R23 million and R17 million respectively. A provisional goodwill of R26 million was recognised. The initial business combination was provisional as the business combination was incomplete at the time the financial statements were authorised for issue.
Telkom Business and Business Connexion (BCX) Integration On 6 June 2016, Telkom announced its intention to integrate Telkom Business into BCX. BCX will operate as the enterprise arm of the larger Telkom group. The group is yet to finalise the integration process.
Allocation of shares in terms of the Telkom Employee Share Plan On 6 June 2016, the board approved the fourth allocation of shares to employees in terms of its Employee Share Plan. The number of shares to vest will depend on the extent to which the performance conditions are met at the end of the applicable performance period.
Vesting and sale of shares In terms of the Telkom Share Plan 161 627 and 64 685 shares vested for Sipho Maseko and Deon Fredericks respectively. On 4 July 2016, Sipho Maseko disposed of 145 907. On 5 July 2016, Sipho Maseko and Deon Fredericks disposed of 15 720 and 25 581 shares respectively. Other matters The directors are not aware of any other matter or circumstance since the financial year ended 31 March 2016 and the date of this report, or otherwise dealt with in the financial statements, which significantly affects the financial position of the group and the results of its operations.
Number of shareholders
Percentage Holdings Percentage
Range of shareholders
1 - 100 shares 53 971 70.04 1 852 279 0.35
101 - 1 000 shares 21 017 27.27 5 436 235 1.03
1 001 - 10 000 shares 1 559 2.02 4 113 927 0.78
10 001 - 50 000 shares 206 0.27 4 631 401 0.88
50 001 - 100 000 shares 91 0.12 6 451 929 1.22
100 001 - 1 000 000 shares 169 0.22 55 993 005 10.63
1 000 001 and more shares 45 0.06 448 469 922 85.11
77 058 100.00 526 948 698 100.00
Type of shareholder
Banks 227 0.30 181 138 629 34.38
Close corporations 34 0.05 37 242 0.01
Endowment funds 127 0.16 233 561 0.04
Individuals 74 518 96.70 11 060 823 2.10
Insurance companies 36 0.05 5 804 756 1.10
Investment companies 6 0.01 2 421 646 0.45
Medical aid schemes 10 0.01 31 150 0.01
Mutual funds 203 0.26 31 899 166 6.05
Nominees and trusts 1 626 2.11 627 131 0.12
Other corporations (including the Government of the Republic of South Africa) 52 0.07 207 079 264 39.30
Own holdings 2 0.00 15 339 537 2.91
Retirement funds 135 0.18 70 850 168 13.45
Private companies 79 0.10 392 277 0.07
Public companies 3 0.00 33 348 0.01
77 058 100.00 526 948 698 100.00
Geographical holdings by owner
South Africa 76 762 99.62 343 744 405 65.23
United States 109 0.14 103 471 722 19.64
United Kingdom 77 0.10 45 844 484 8.70
Europe 57 0.07 26 333 337 5.00
Other 53 0.07 7 554 750 1.43
77 058 100.00 526 948 698 100.00
Beneficial shareholders of more than 2%
The Government of the Republic of South Africa 207 038 058 39.29
Government Employees Pension Fund 60 118 383 11.41
Old Mutual 15 339 537 2.91
282 495 978 53.61
44. Shareholder analysis
Consolidated annual financial statements

110 111
Notes to the consolidated annual financial statementsfor the year ended 31 March 2016
44. Shareholder analysis (continued)
Holdings Percentage
Public and non-public shareholders
Non-public shareholders 222 505 500 42.22
The Government of the Republic of South Africa 207 038 058 39.29
Government buffer account 9 461 0.00
Telkom treasury stock 15 339 537 2.91
Executive and non-executive directors* 101 061 0.02
Subsidiaries' directors* 17 383 0.00
Public shareholders
Institutional and retail investors 304 443 198 57.78
526 948 698 100.00
Director holdings consist of direct and indirect holdings.
The information above is based on registered shareholders, except where only beneficial shareholders' information was available as at 24 March 2016.
*
Consolidated annual financial statements 111
Company registration number1991/005476/30
Head office61 Oak AvenueHighveldCenturion 0157South Africa
Postal addressTelkom SA SOC LimitedPrivate Bag X881Pretoria 0001
Telkom register helpline0861 100 948
Company secretaryEphenia MotlhammeTel: +27 12 311 3911
United States ADR depositoryThe Bank of New York MellonShareholder Relations DepartmentPO Box 11258New YorkNV 10286-1258Tel: +1 888 643 [email protected]
AuditorsErnst & Young Inc102 Rivonia RoadSandton 2146Tel: +27 11 772 3000Fax: +27 11 772 4000
Nkonki IncNkonki House 11 Simba RoadSunninghillJohannesburgTel: +27 11 517 3000
Transfer agentsComputershare Investor Services (Pty) Ltd70 Marshall StreetJohannesburg 2001PO Box 61051Marshalltown 2107
Business call centre10217
Investor relationsNwabisa PikiTel: +27 12 311 [email protected]
Administration
Produced by ahcomm & green grass design

112