CONSERVATION OF THE ENDANGERED HAWAIIAN FERN …...Don Drake, Tim Gallaher, Varsha Graves, Joanna...
101
CONSERVATION OF THE ENDANGERED HAWAIIAN FERN ‘IHI‘IHILAUĀKEA (MARSILEA VILLOSA): A SYNTHESIS OF EXPERIMENTAL RESTORATION, COMMUNITY ECOLOGY, AND POPULATION GENETICS A DISSERTATION SUBMITTED TO THE GRADUATE DIVISION OF THE UNIVERSITY OF HAWAI‘I AT MĀNOA IN PARTIAL FULFILLMENT OF THE REQUIREMENTS FOR THE DEGREE OF DOCTOR OF PHILOSOPHY IN BOTANY AUGUST 2012 By Marian M. Chau Dissertation Committee: Tom A. Ranker, Chairperson Christopher Lepczyk Clifford Morden Tamara Ticktin Lyndon Wester
Transcript of CONSERVATION OF THE ENDANGERED HAWAIIAN FERN …...Don Drake, Tim Gallaher, Varsha Graves, Joanna...
CONSERVATION OF THE ENDANGERED HAWAIIAN FERN ‘IHI‘IHILAUĀKEA
(MARSILEA VILLOSA): A SYNTHESIS OF EXPERIMENTAL RESTORATION,
COMMUNITY ECOLOGY, AND POPULATION GENETICS
A DISSERTATION SUBMITTED TO THE GRADUATE DIVISION OF THE UNIVERSITY OF HAWAI‘I AT MĀNOA IN PARTIAL FULFILLMENT OF THE
REQUIREMENTS FOR THE DEGREE OF
DOCTOR OF PHILOSOPHY
IN
BOTANY
AUGUST 2012
By
Marian M. Chau
Dissertation Committee:
Tom A. Ranker, Chairperson Christopher Lepczyk
Clifford Morden Tamara Ticktin Lyndon Wester

ii
© Copyright 2012 by Marian M. Chau
All rights reserved
iii
For Tom Ranker and Whitney Reyes
without whom this endeavor would not have been possible
And for my family
for their constant love, support, and encouragement

iv
ACKNOWLEDGEMENTS
This research would not have been possible without the generous support of several
organizations. I would like to thank the U.S. Navy Environmental Planning Division for
providing the majority of extramural funding for this project, as well as logistical support for
conducting research at Lualualei Naval Base on O‘ahu. For additional support I also thank
the Research Corporation of the University of Hawai‘i, Botanical Society of America,
American Fern Society, and the following organizations within the University of Hawai‘i at
Mānoa: Graduate Division, Graduate Student Organization, College of Arts and Sciences,
and the Department of Botany (including the Charles H. Lamoureux Fellowship in Plant
Conservation).
Although I owe this work to the support and assistance of many different people,
above all I would like to express my deepest gratitude for the two people who were most
essential to this dissertation. My advisor Tom Ranker has been the best mentor I could have
hoped for. Not only did he support my research, he has guided me throughout my journey in
becoming a career scientist by providing encouragement, timely advice at each stage, ideas
for inspiration, humor, friendship, emotional support, and an excellent role model. I am so
grateful to Tom that I can only thank him enough by aspiring to be a scientist of his caliber,
and a mentor with his kindness, sense of humor, and integrity. I am also incredibly lucky to
have had Whitney Reyes as my undergraduate assistant throughout the entire time that I
conducted these studies. It was invaluable to have someone with her intelligence and
experience assisting me nearly every time I visited my field sites and throughout the entire
experiment I conducted. By the end of our third year in the field at Lualualei, we worked so
efficiently together that it almost felt like we could read each other’s minds. I am also
grateful to Whitney for her friendship and emotional support throughout the past four years,
and I am certain that she has ahead of her a successful career as a scientist. Tom and Whitney
have become my academic family, and I am deeply thankful to have them in my life.
I also wish to thank my Ph.D. committee members: Chris Lepczyk, Cliff Morden,
Tamara Ticktin, and Lyndon Wester. Each of them contributed greatly to this project with
advice and assistance, and since each is an expert in a different field, I was fortunate to have
a variety of perspectives to guide my research. I also appreciated the kind and easygoing

v
personalities of each of my committee members, which together made a group that was a
pleasure to work with. Special thanks go to Cliff, who provided extra assistance with the
population genetic study, including laboratory supplies, protocols, and help with
troubleshooting and analysis.
Not on my committee, but just as essential to my research, was Andy Taylor. I was
fortunate that Andy started a mixed models working group right when I was beginning to
seriously analyze data from my experiment and field ecology projects. Having a group of
people with whom to discuss the challenges of statistical analyses was extremely helpful, and
I am also especially grateful to Andy for his extra time in assisting me with model selection
and interpretation of results.
I also sincerely thank the Ranker Lab (and extended family), also known as the
Hawaiian Fern Mafia, including: Tom Ranker, Whitney Reyes, Shane Shaw, Tiffany Thair,
Amanda Vernon, Autumn Amici, Erin Fujimoto, Maggie Sporck, Seana Walsh, Naomi
Arcand, Kay Lynch, Klaus Mehltreter, and Lars Walker. These folks truly were my family
here in Hawai‘i, were always a great joy to be around, and I truly appreciate their support –
both in my research and in my life. In particular I am grateful for the mentorship of Lars and
Klaus, with whom I collaborated on a project outside of this dissertation. Along with Tom,
they provided wonderful role models, not only teaching me practical skills (like how to write
my first manuscript), but also showing me how to be a career academic scientist while
maintaining a healthy balance in work and life and happiness.
I also want to offer sincere thanks to the many other people who assisted me in
various ways throughout the projects that make up this dissertation. For support at Lualualei
Naval Base I thank Cory Campora, Justin Fujimoto, Aaron Hebshi, Vanessa Pepi, and Laura
Williams. For assistance with background information on conservation of ‘ihi‘ihi, including
endangered species permits, I thank Larry Abbott, Marie Bruegmann, Charmian Dang, Alan
Hong, Martha McDaniels, Dan Palmer, Julia Parish, Tam Wong, and especially Bill Garnett
for his assistance with field collection on Moloka‘i. For assistance with field work on O‘ahu I
thank Molly Cavaleri, Matt Lurie, Lisa Mandle, and Maggie Sporck. For help with species
identification I thank Courtney Angelo, Joanne Birch, Curt Daehler, Alison Sherwood, and
George Wong. For assistance with designing, building, and conducting my restoration
experiment I thank Matt Lurie, Whitney Reyes, Ben Simpson, Dave Spafford, and Halina

vi
Zaleski. For assistance with laboratory work and genetic analyses I thank Stephanie Bradley,
Erin Fujimoto, Stacy Jorgensen, Whitney Reyes, Shane Shaw, and Mitsuko Yorkston. For
sharing in the stress and hilarity of studying for comprehensive exams I thank Jennifer
Bufford, Daniela Dutra, Pei-Luen Lu, Shane Shaw, Maggie Sporck, and Tam Wong. For
additional support and advice I thank Patty Bedoya, Jeff Boutain, Dan Brown, Jason Cantley,
Don Drake, Tim Gallaher, Varsha Graves, Joanna and Nick Griffith, Georgia Hart, David
Hendrix, Aurora Kagawa, Viki Keener and, Lisa Mandle, Kori-Ann Phillips, Alexandre
Sampaio, Isabel Schmidt, Aaron and Laura Shiels, Shimona Quazi, Cheryl Squair, Alexis
von Biedenfeld, Rachael Wade, Mashuri Waite, Keith Weiser and everyone in the
Department of Botany.
Additionally, I would like to thank my inspirational students from the spring and fall
of 2011, who started out as names on my roster but became my good friends, especially
Dylan Davis, Erin Fujimoto, Talaya Rachels, and Meagan Rathjen. I am also grateful to
Sterling Keeley, who I consider my mentor in teaching, and Seana Walsh, who was my
teaching intern and partner in rogue plant collection when I taught the laboratory for
Systematics of Vascular Plants.
I have also had the privilege of serving as the Student Director to the Board of the
Botanical Society of America (BSA) over the last two years. The experience was one of the
best things I could have done for my career – not just in terms of furthering my career but of
truly enriching it. I do not think there is any other scientific society that is more supportive of
its young emerging scientists than the BSA, and its leadership is full of excellent role models.
I feel especially fortunate to have had the opportunity to work with them to promote the
study of botany at the national level. Special thanks also go to my fellow student directors
and good friends, Rachel Meyer and Megan Ward.
My acknowledgements could not be complete without thanking the people who
provided my emotional support network (in addition to many of those above). This includes
Jane Moulin and my Tahitian sisters, with whom I have learned and performed Tahitian
dance for the last five years, and Shelley Choy and my classmates at Iyengar Yoga Honolulu,
where I have been practicing for the last two years. Jane and Shelley have been mentors of a
different kind but have been just as essential to my personal development during my graduate

vii
career. I also thank Annie Rohr, who was always there when I needed emotional support and
whose encouragement got me through many challenging times.
So many friends have provided emotional support over these last several years, far
too many to name, even in addition to those above. However, there are two people who
deserve special recognition. Maggie Sporck was my office mate throughout my graduate
career and became one of my best friends. There were challenges that I could not have
survived without Maggie’s support, but there were even more good times, filled with
laughter and joy. Courtney Angelo was my neighbor and close friend who also saw me
through many ups and downs, and I know I am lucky to have shared the experience of
defending our dissertations on the same day, and to have had each other for support on that
difficult but rewarding journey.
Finally, although they were far away, I am deeply grateful to my friends and family
back on the mainland. I would like to thank Donna Buchanan of Buchanan’s Native Plants in
Houston, Texas, for encouraging my decision to go to graduate school and study botany. I
also am ever thankful for my Houston friends, including my core group of Michelle Feltz,
Ashley Brownlie, Jessica Nixon, and Erik Bogle, for their undying support and for always
believing in me, even when I first came to Hawai‘i, armed only with an undergraduate degree
in creative writing, a few years of experience at a native plant nursery, and a big leap of faith.
Finally, I am especially thankful for my family: my mother and stepfather, Carol and Jon
Benignus; my father and stepmother, Ed and Jaime Chau; my brother and sister-in-law,
Andrew and Nicole Chau; and my stepbrother Emmanuel Ungaro; as well as my wonderful
extended families including my grandparents, Joyce and Jerry Cutchins; and my aunts,
uncles, cousins, and other relatives in the Wiley, Hall, Lam, and Benignus families. My
family has always been extremely supportive of everything I do, and I would not be earning
my Ph.D. without all of their love and encouragement over the past seven years and
throughout my whole life.
viii
ABSTRACT
Conservation of endangered plants is a critical step in maintaining and restoring
global biodiversity. Management efforts such as in situ conservation and restoration through
plant reintroduction are more likely to be successful if decisions are based on carefully
designed scientific research. Marsilea villosa is an endangered, endemic Hawaiian fern with
only seven remaining populations on the islands of O‘ahu and Moloka‘i restricted to
ephemerally flooding dry lowlands. Among its uncommon traits are long-lived sporocarps
(i.e., highly modified leaves with drought resistant walls containing sporangia and spores), a
requirement of flood and drought to complete its sexual life cycle, and extensive vegetative
growth. In this dissertation I conducted three studies to answer the following questions: 1)
Which management techniques best facilitate growth of M. villosa in outplanting for
reintroduction? 2) Which ecological factors affect the growth of M. villosa under field
conditions? 3) How much genetic variation exists within and among M. villosa populations?
4) What are the implications of these studies for how M. villosa is managed? I conducted a
restoration experiment to evaluate the effects of light, flooding, weeding, and their
interactions on the growth of M. villosa outplanted in a common-garden. I found that the
combination of flooding and shade treatments promoted the greatest increase in M. villosa
growth, and that the effects of this interaction grew stronger over time. After drought
occurred, shade also increased M. villosa growth in the absence of weeding. In a three-year
field study, I examined ecological factors that influenced M. villosa growth and confirmed
that shade and flooding have positive synergistic effects, while the negative effects of
associated non-native species differ with functional groups. In a population genetic study, the
majority of genetic variation was found at the subpopulation level, but there was also genetic
structure that showed strong differentiation among some populations and between the two
islands. This research provides several explicit management recommendations that will
increase the chances of success in conservation and restoration of Marsilea villosa, and a
model upon which to base restoration of the more resilient endangered species in Hawai‘i
and worldwide.
ix
TABLE OF CONTENTS
Acknowledgements .................................................................................................................. iv
Abstract .................................................................................................................................. viii
List of Tables ............................................................................................................................ x
List of Figures .......................................................................................................................... xi
Preface ..................................................................................................................................... xii
Chapter 1: Introduction ............................................................................................................. 1
Chapter 2: Effects of light, flooding, and weeding on experimental restoration of an endangered Hawaiian fern ........................................................................................................ 7
Abstract .............................................................................................................................................. 7 Introduction ........................................................................................................................................ 8 Materials and Methods ..................................................................................................................... 11 Results .............................................................................................................................................. 14 Discussion ........................................................................................................................................ 16 Tables ............................................................................................................................................... 20 Figures .............................................................................................................................................. 26
Chapter 3: Ecological factors influencing growth of the endangered Hawaiian fern Marsilea villosa and implications for conservation management .......................................................... 31
Abstract ............................................................................................................................................ 31 Introduction ...................................................................................................................................... 32 Materials and Methods ..................................................................................................................... 34 Results .............................................................................................................................................. 37 Discussion ........................................................................................................................................ 40 Conservation and restoration management implications ................................................................. 43 Tables ............................................................................................................................................... 47 Figures .............................................................................................................................................. 53
Chapter 4: Bottlenecks and founder effects in the endangered Hawaiian fern ‘ihi‘ihi (Marsilea villosa) .................................................................................................................... 60
Abstract ............................................................................................................................................ 60 Introduction ...................................................................................................................................... 61 Materials and Methods ..................................................................................................................... 64 Results .............................................................................................................................................. 65 Discussion ........................................................................................................................................ 67 Tables ............................................................................................................................................... 71 FigureS ............................................................................................................................................. 75
Chapter 5: Conclusions ........................................................................................................... 78 Summary of Findings ....................................................................................................................... 78 Synthesis .......................................................................................................................................... 79
Literature Cited ....................................................................................................................... 82
x
LIST OF TABLES
Table 2.1 Selected models tested and used for ANOVAs in the experiment........................ 21
Table 2.2 Mixed-model ANOVA of the effects of light, weeding, and flooding................. 23
Table 2.3 Relative sporocarp counts three months after the experiment ended.................... 24
Table 2.4 Comparison of associated species present in field and experiment...................... 25
Table 3.1 Hypotheses for single factor effects on M. villosa growth, and interactions........ 48
Table 3.2 Summary of field seasons with monthly and seasonal rainfall............................. 49
Table 3.3 Associated species present within Lualualei survey plots.................................... 50
Table 3.4 Models tested for within-season (2011) repeated measures ANOVA.................. 51
Table 3.5 ANOVA table for fixed effects in the 2011 repeated measures model................. 52
Table 4.1 Summary of populations and subpopulations sampled......................................... 72
Table 4.2 Rare alleles among M. villosa populations........................................................... 73
Table 4.3 Structure results and the true number of genetic clusters present in data............. 73
Table 4.4 Hierarchical analyses of molecular variance (AMOVA)...................................... 74
xi
LIST OF FIGURES
Figure 2.1 Experimental design............................................................................................ 27
Figure 2.2 Single-factor effects on percent cover of M. villosa over time........................... 28
Figure 2.3 Three-way interaction of time×light×flood......................................................... 29
Figure 2.4 Two-way interactions on percent cover of M. villosa and sporocarp counts...... 30
Figure 3.1 Percent cover of M. villosa and associated species over three years................... 54
Figure 3.2 Percent cover of M. villosa and associated species over the 2011 season........... 55
Figure 3.3 Linear regressions of single-factor effects........................................................... 56
Figure 3.4 Interaction effects of time with environmental factors........................................ 57
Figure 3.5 Interaction of maximum flooding depth and canopy cover................................. 58
Figure 3.6 Interaction of percent cover non-native grass species and time since flooding.. 59
Figure 4.1 Estimated genetic structure of M. villosa populations and subpopulations......... 76
Figure 4.2 Principle coordinates analysis of RAPD data for M. villosa............................... 77

xii
PREFACE
The following data chapters (Chapters 2, 3, and 4) were written in the format of scientific
papers for submission to peer-reviewed journals. Chapter 2 (Effects of light, flooding, and
weeding on experimental restoration of an endangered Hawaiian fern) has been submitted to
Restoration Ecology with coauthor Whitney Reyes and is in review. Chapter 3 (Ecological
factors influencing growth of the endangered Hawaiian fern Marsilea villosa and
implications for conservation management) is in preparation for submission to American
Journal of Botany with coauthors Tom Ranker and Whitney Reyes. Chapter 4 (Bottlenecks
and founder effects in the endangered Hawaiian fern ‘ihi‘ihi [Marsilea villosa]) is in
preparation for submission to Biodiversity and Conservation with coauthors Tom Ranker and
Clifford Morden.
1
CHAPTER 1
INTRODUCTION
Conservation of biodiversity is key to the continued existence of life on earth,
including humans. We rely on an abundance of species that provide services such as food,
medicine, pollination, clean water, and many others (Bullock et al., 2011). With the world in
an extinction crisis driven by human activity, we must mitigate our damage to global
biodiversity through conservation and ecological restoration. Conserving endangered plant
species is a complex task, and on-the-ground management is often trial and error, with
managers doing their best to address immediate needs. Ecologists and botanists try to
improve this process by conducting sound science upon which to base management, but there
is often a disconnect between the findings of scientists and their practical application (Hobbs,
2007). My goal with this study was to conduct scientific inquiry on an endangered plant
species that would both contribute to scientific knowledge and have applied results that
would be easily translated into methods for conservation practitioners.
Humans have had a dramatic effect on plant species distributions throughout the
world, but the isolated ecosystems of Hawai‘i have been especially prone to the negative
impacts of development. Human influence in Hawai‘i has led to the increase of non-native
species richness to levels greater than that of native plants (Jakobs et al., 2010), and to a high
percentage of endangered species (~25%) in the Hawaiian flora (Sakai et al., 2002). The
introduction of invasive species such as grasses has also resulted in dramatic reductions of
native species. Most Hawaiian dry forests are now degraded and dominated by non-native
fire-promoting grasses (Cabin et al., 2002). Management of such non-native grasses and
reintroduction of native species that formerly thrived in particular locations can restore native
biodiversity and reverse habitat degradation (Daehler et al., 2005).
The reintroduction of rare and endangered plant species can be an effective strategy
for maintaining biodiversity and helping to restore degraded ecosystems if there are also
management systems in place. However, Godefroid et al. (2011) found that the success rate
of plant reintroductions is moderate, with an average survival rate of 52%, with failures often
due to lack of long-term monitoring. In addition to better monitoring efforts, strategies that
may increase the success of reintroduction are a better understanding of basic species biology
2
and ecological interactions, and better site preparation prior to outplanting. Site quality of
translocations and conditions that maximize population growth are key to long-term
persistence (Rout et al., 2007), and providing suitable habitat is crucial to the reintroduction
of rare and threatened plant species (Hobbs & Cramer, 2008).
Another critical step in the reintroduction of endangered species is gaining an
understanding of the genetic makeup of populations that might serve as sources of
propagules for restoration efforts. It is important to ensure that enough variation is present to
allow for adaptability in new populations through natural selection (Lesica et al., 1999),
particularly with clonally growing plants (Fant et al., 2008), and this often means sampling
from multiple source populations (Godefroid et al., 2011). The capacity for evolutionary
adaptation is critical in light of global climate and environmental changes, and the presence
of genetic variation may facilitate the adaptation of many species to climate change, even
over relatively short timeframes (Weeks et al., 2011). In what would be considered a
genetically successful restoration, an introduced population would maintain levels of genetic
diversity similar to those of wild populations (Menges, 2008; Ramp et al., 2006). In order to
accomplish this, sufficient numbers of individuals must be sampled from one or more source
populations and newly introduced populations must expand sufficiently within a few
generations (Weeks et al., 2011). However, practitioners must find a balance between
maximizing genetic variation in introduced populations and minimizing the risk of
outbreeding depression that leads to decreased local adaptation (Vergeer et al., 2004). The
prevailing attitude among restoration practitioners and ecologists has been a ‘better safe than
sorry’ approach of favoring local populations for source transplant material, but some argue
that these risks are overstated and have unduly restricted the use of translocation as a much
needed restoration strategy (Weeks et al., 2011).
It is also critical that we overcome gaps in knowledge of basic species biology,
especially of environmental factors that limit or facilitate establishment, including ecological
interactions (Drayton & Primack, 2012; Guerrant & Kaye, 2007). More comparisons should
be made with reference populations in the field, and reintroductions should be carefully
designed as experiments based on prior ecological understanding (Kaye, 2008; Menges,
2008). Conducting these types of studies and experiments is especially important when
working with unique ecosystems and understudied taxa.
3
Ephemeral pools are distinctive ecosystems characterized by small spatial scale,
isolation, transience, high dependence on precipitation patterns, and biota that are uniquely
adapted to these often stressful conditions. Although ephemeral pools are fairly abundant
worldwide, many are also threatened by human development and exotic species invasion, and
native species that flourish there are often endemic or endangered (Bauder, 2005; Collinge et
al., 2011; Deil, 2005). However, there have been relatively few studies that have targeted
ephemeral pool ecology and conservation. Small scale ecosystems such as ephemeral pools,
which vary considerably in habitat characteristics and therefore beta diversity, should be
studied not only for their own sake, but also because they make excellent model systems for
hypothesis-testing in ecology, conservation, and evolutionary biology (Blaustein and
Schwartz, 2001; De Meester et al., 2005).
Ferns and lycophytes are ecologically important but have also been understudied with
respect to conservation and restoration. Worldwide, only about 2% of all 11,000 species have
been evaluated for extinction risk, but 89% of those evaluated were found to be at risk.
Furthermore, most risk assessments are based only on abundance and geographic range, and
there is a need to examine intrinsic biology and ecology of ferns to better understand and
evaluate species for conservation purposes (Mehltreter, 2010). Although it is not uncommon
for studies of ecosystem restoration to account for regeneration of native fern species (e.g.,
Burns et al., 2011; Jager & Kowarik, 2010; Weller et al., 2011), very few studies target rare
or endangered ferns for restoration (but see Aguraiuja, 2011; Zenkteler, 2002). There is a
need for ecological studies on which to base conservation and restoration of fern species.
Marsilea villosa (‘ihi‘ihi) is an endangered, endemic Hawaiian fern that is found in
only four surviving populations on the island of O‘ahu and three on the island of Moloka‘i
(Bruegmann 1996; Dan Palmer, Bill Garnett, personal communication). ‘Ihi‘ihi is unusual
among ferns in being heterosporous, producing sporocarps, growing in ephemeral pool
habitats in dry lowland areas, and requiring both flood and drought to complete its sexual life
cycle (Palmer 2002). Marsilea villosa produces regular photosynthetic leaves when rain is
abundant enough to keep soil moist (typically December to March but varying among years
and among populations; Wester et al., 2006; Bruegmann, 1996; Chau, personal observations),
and during the dry summer season, the leaves die and the rhizomes are dormant. The plants
produce sporocarps (i.e., highly modified leaves with thickened, drought-resistant walls
4
containing sporangia and spores) when the soil begins to dry at the end of the rainy season,
but require standing water for sporocarp germination and sexual reproduction. Mature
sporocarps can detach from rhizomes, intact, and potentially form a “sporocarp bank” with a
function similar to a seed bank in angiosperms (though not analogous, as it represents
dispersal of a different life stage). Sporocarps in the soil may be viable for up to a century, as
found in the closely related species M. oligospora (Johnson 1985). The sporocarp is also the
most likely stage for dispersal, which may occur via water or via movement by wetland bird
species (Carlquist, 1976). When soil is moist enough for leaf production but flooding does
not occur to allow for sexual reproduction, which may last several years, ‘ihi‘ihi grows
vegetatively by resprouting leaves and extensive rhizome elongation.
Three studies have been conducted on the ecology of ‘ihi‘ihi at Koko Head, O‘ahu.
The first was a study of ecophysiology, phenology, and taxonomy of the species in the field
and in the greenhouse, which found no significant differences in water potential, leaf
resistance, and osmotic potential at full turgor under varying moisture conditions, suggesting
that M. villosa evolved drought resistance to adapt to specific environments (Bruegmann
1986). A second study mapped the population within ‘Ihi‘ihilauakea Crater at Koko Head
and conducted a weeding experiment within the population (Wester 1994). Wester found that
management through labor-intensive weed removal had no lasting effects and that periodic
flooding was sufficient to exclude most competitors. A study using the same methods as
Wester (1994) surveyed the same population over the following decade and found the
population in severe decline, probably due to lack of flooding for thirteen consecutive years
(Wester et al. 2006). They also found ecological changes, such as a decline in canopy cover
of kiawe (Prosopis pallida) and invasion of alien grasses that may have influenced hydrology
and flooding frequency in ‘Ihi‘ihilauakea Crater.
Restoration through outplanting has been studied experimentally for a few
endangered Hawaiian plants. Cabin et al. (2002b) tested effects of light, weed control
methods, and native (including two endangered) species addition through outplanting and
seeding in a Hawaiian dry forest. They found an increase in native plant cover in all
treatments, with the greatest increase in shade, bulldozed, and outplanted treatments, but
noted that results were highly species-specific. Cabin et al. (2002a) also tested canopy
microsite, watering, and weeding treatments on plots seeded with a similar suite of
5
native/endangered plants. The results of this study indicated that initial clearing of alien grass
provided a sufficient window for native establishment, and that direct seeding is a promising
method for dry forest restoration in Hawai‘i. Efforts to restore the endangered Mauna Kea
silversword (Argyroxiphium sandwicense) have been successful with outplanted seedlings
initially grown under controlled conditions. Walker and Powell (1999) experimentally tested
seeding at different elevations, soil conditions, and microsites. Their results showed that
outplanting, though labor intensive, had higher success rates than seeding, but that seeding
could be more broadly applied and, presumably, allowed for natural selection of the most
favorable genotypes. They suggested combining the two restoration strategies. Several
experimental reintroductions of endangered species outside of Hawai'i have also been
successful in identifying effective planting and management techniques (Alley & Affolter,
2004; Falk et al., 1996; Guerrant & Kaye, 2007; Jusaitis, 2005; Rowland & Maun, 2001),
including two with endangered ferns (Aguraiuja, 2011; Zenkteler, 2002).
Although studies of fern reintroductions are few, there have been three successful
‘ihi‘ihi translocations on O‘ahu. In 2004, a community group outplanted M. villosa from the
center of ‘Ihi‘ihilauakea Crater to an adjacent area under the shade of kiawe cover, and two
patches have survived and grown with supplemental weeding (Larry Abbot, personal
communication). At Hanauma Bay Nature Preserve, an occasionally flooding depression on
the lawn outplanted in 2002 has been successful, and an even larger population grows on
Kamehameha Schools/Bishop Estate land near Makapu‘u, outplanted in the 1960s (Alan
Hong, personal communication). These populations were all started from Koko Head plant
material and are now larger and healthier than their parent population, particularly the
Makapu‘u site (personal observation).
No genetic studies of any kind have focused on M. villosa, however, its phylogenetic
relationships within the cosmopolitan genus Marsilea have been examined, placing it in a
clade with two North American species, M. vestita and M. oligospora (Nagalingum et al.
2007). Population genetics have been studied for Marsilea strigosa, another endangered
species from the Mediterranean basin, and it was found to have high differentiation among
populations, suggesting highly restricted gene flow and reproduction predominantly through
selfing (Vitalis et al. 2001).
6
In the following studies, I aimed to address the following questions regarding the
biology of Marsilea villosa in order to make conservation, restoration, and management
recommendations. 1) Which management techniques best facilitate growth and expansion of
M. villosa in outplanting for reintroduction? 2) Which ecological factors affect the growth of
M. villosa under field conditions? 3) How much genetic variation exists within and among M.
villosa populations? 4) What are the implications of these studies for how M. villosa is
managed, both in situ and for future restoration efforts? To answer these questions, I
conducted three studies. The first was a restoration experiment in which I outplanted M.
villosa in a common-garden, using combinations of different management techniques
(Chapter 2). I tested the effects of light (full sun or 50% shade), flooding (once or none),
weeding (twice monthly or none), and their interactions on the growth of M. villosa over
time. The second was a field study of ecological factors influencing M. villosa growth,
including associated vegetation cover, canopy cover, flooding depth, soil nitrogen, and soil
particle size distribution (Chapter 3). The study took place in three subpopulations at
Lualualei Naval Base, O‘ahu from 2008 to 2011. I collected and analyzed soil samples in
2009, conducted vegetation surveys over three rainy seasons, and measured vegetation cover,
canopy cover, and flooding depth every three weeks over the course of the last season. For
the first two studies, I used mixed models ANOVAs to determine the models that best
explained variation in percent cover of M. villosa in the experiment or in the field. For the
third study, I employed random amplified polymorphic DNA (RAPD) methods to analyze
genetic variation within and among the seven populations of M. villosa (Chapter 4). I used
several statistical methods to determine the structure of genetic variation, analyze
differentiation within and between islands, and make hypotheses about biogeographical
relationships among populations. With each of these studies, I developed several explicit
management recommendations that, taken together, will provide a wide-ranging plan for
informed conservation and restoration of Marsilea villosa, with the ultimate goal of de-listing
this endangered species.
7
CHAPTER 2
EFFECTS OF LIGHT, FLOODING, AND WEEDING ON EXPERIMENTAL
RESTORATION OF AN ENDANGERED HAWAIIAN FERN
Abstract
Conservation of rare plants can be accomplished by the restoration practice of reintroduction,
but subsequent management is often required. In species with narrow habitat requirements, it
is difficult to predict which management methods will be successful at new locations.
Marsilea villosa is an endangered, endemic Hawaiian fern with only seven remaining
populations in ephemerally flooding drylands. Among its uncommon traits are long-lived
sporocarps, a requirement of flood and drought to complete its sexual life cycle, and the
potential for extensive vegetative growth. An experiment was performed to determine which
restoration techniques might best facilitate growth of outplanted M. villosa. The following
effects were tested in a split-plot factorial design: flooding (once/none), light (50% shade/full
sun), weeding (bi-monthly/none), and all interactions. I hypothesized that flooding would
have the largest single-factor effect and that there would be interactions among treatments.
As hypothesized, flooding had the greatest positive effect on percent cover and sporocarp
production. However, shade also increased cover over full sun when the plants began to
experience drought. There was an interaction of light×flooding because M. villosa grew best
in flooded, shaded plots. Weeding had no significant effect except in combination with
flooding. Beyond protected status, current management of M. villosa populations consists
entirely of weed management. This study shows that labor-intensive weeding may be
unnecessary if reintroduced M. villosa is planted under conditions of flooding and moderate
shade and, if planted at the start of a rainy season, will require minimal management to
become a self-sustaining new population.
8
Introduction
The reintroduction of rare and endangered plant species can be an effective strategy
for maintaining biodiversity and helping to restore degraded ecosystems if there are also
ecological management techniques in place to monitor changes and ensure plant
establishment and survival. However, Godefroid et al. (2011) found that the success rate of
plant reintroductions is moderate, with an average survival rate of 52%, and lower rates of
reproduction measures. Among strategies that may increase the success of reintroduction are
a better understanding of species biology, better site preparation prior to outplanting, and
consistent long-term monitoring. Site quality of translocations and conditions that maximize
population growth are key to long-term persistence (Rout et al., 2007), and providing suitable
habitat is crucial to the reintroduction of rare and threatened plant species (Hobbs & Cramer,
2008).
Humans have had a dramatic effect on plant species distributions throughout the
world, but negative effects can be especially challenging in isolated ecosystems such as
Hawai'i. Development and other human activities have led to the increase of non-native
species richness to levels greater than that of native plants (Jakobs et al., 2010). The
introduction of invasive species such as grasses has also resulted in dramatic reductions of
native species. Most Hawaiian dry forests are now degraded and dominated by non-native
fire-promoting grasses (Cabin et al., 2002). Management of such non-native grasses and
reintroduction of native species that formerly thrived in particular locations can restore native
biodiversity and reverse habitat degradation (Daehler et al., 2005). However, restoration
efforts may never return an ecosystem to its original state, because exotic species cannot be
entirely excluded, and management of invasive species will require a long-term commitment
of resources (Norton, 2009).
Reintroduction has been studied experimentally for several endangered Hawaiian
plant species. Often the most important factors in the success of native species are
competition with alien grasses and exploitation of favorable microsites (Cabin et al., 2002).
Efforts to restore the endangered Mauna Kea silversword (Argyroxiphium sandwicense DC.
subsp. sandwicense) have been successful with outplanted seedlings (Walker & Powell,
1999). Several experimental reintroductions of endangered species outside of Hawai'i have
been successful in identifying effective planting and management techniques (Alley &
9
Affolter, 2004; Falk et al., 1996; Guerrant & Kaye, 2007; Jusaitis, 2005; Rowland & Maun,
2001), including two with endangered ferns (Aguraiuja, 2011; Zenkteler, 2002). Though
published studies of fern reintroductions are few, two outplanted Marsilea villosa Kaulf.
(Marsileaceae; ‘ihi‘ihi) populations in Hawai'i have survived for several years (Alan Hong,
Hanauma Bay Nature Preserve, Honolulu, HI, personal communication; Chau, personal
observation).
Marsilea villosa is an endangered, endemic Hawaiian fern with only seven surviving
populations on the islands of O'ahu and Moloka'i (Bruegmann, 1996; W. Garnett, Rare Plant
Species Recovery, Moloka'i, HI, personal communication; Chau & Reyes, personal
observations). Species of Marsilea are unusual among ferns in being heterosporous,
producing sporocarps (i.e., highly modified leaves with thick drought-resistant walls that
contain sporangia and spores), and requiring flood and drought to complete their sexual life
cycle (Palmer, 2003). Marsilea villosa produces photosynthetic leaves when rain is abundant
enough to keep soil moist (typically December to March, but varying among years and
among populations; Chapter 3; Wester et al., 2006; Bruegmann, 1996) and produces
sporocarps when the soil begins to dry, but requires standing water (i.e., during the next
flooding event) for sporocarp germination and sexual reproduction. The extent of M. villosa
cover is positively related to rainfall and fluctuates with supra-annual rainfall variation.
Within populations that have been studied, flooding does not occur every year, but
populations or subpopulations are limited to areas that have had some observed instance of
flooding (Chapter 3; Wester, 1994; Wester et al., 2006; M. Bruegmann 2008, U.S. Fish &
Wildlife Services, Honolulu, HI, personal communication). In the dry season, the leaves die
and the rhizomes are dormant. Sporocarps that matured at the end of the rainy season can
detach from rhizomes, intact, and potentially form a “sporocarp bank” with a function similar
to a seed bank in angiosperms (though not analogous, as it represents dispersal of a different
life stage). Sporocarps may be viable for up to a century, as found in the closely related
species Marsilea oligospora Goodd. (Johnson, 1985). When conditions are wet enough for
plant growth (moist soil) but not for sexual reproduction (standing water), which may last
several years, M. villosa grows vegetatively by resprouting new leaves from old rhizomes
and potentially growing new rhizomes. Production of long-lived sporocarps and abundant
vegetative growth likely contribute to the ability of M. villosa to recover from stressful

10
conditions, such as a drought of a year or more, as long as flooding occurs in subsequent
rainy seasons (Chapter 3). This resilience of M. villosa makes it an excellent candidate for
restoration through reintroduction.
I have conducted the first experiment to evaluate the potential of management
techniques for restoration of this endangered species. The goal of this study was to test the
effects of flooding, light levels, and weed management on growth of outplanted M. villosa.
My first hypothesis was that flooding would be the greatest factor affecting M. villosa growth
and sporocarp production, based on earlier reports (Bruegmann, 1996; Wester, 1994; Wester
et al., 2006) and my firsthand account that M. villosa expands to the boundaries of newly
flooded areas within two weeks of flooding subsidence. Second, I hypothesized an
interaction between flooding and weeding, where M. villosa growth would be higher in
weeded than non-weeded plots in the absence of flooding, but would not differ between weed
treatments within flooded plots. The rationale for this second hypothesis is that seasonal
flooding suppresses weeds, allowing M. villosa to form mats and dominate (personal
observations), while prolonged drought allows weed establishment, leading to M. villosa
decline (Wester et al., 2006). Third, I hypothesized that in non-flooded plots there would be
an interaction between light and weeding, where weeding would increase growth of M.
villosa in sun but not in shade. When flooding is absent for long periods, M. villosa grows
more vigorously in shade, where most invasive species show suboptimal growth, than it does
in sun, where invasive species thrive (L. Abbott 2008, U.S. Army Natural Resources,
Honolulu, HI, personal communication; personal observations). Fourth, I hypothesized that
sporocarp production would increase in non-flooded/sun treatment plots because these
treatments would increase levels of water stress, which stimulates sporocarp production in
the field (Tryon & Tryon, 1982). Finally, I hypothesized that the effects of flooding and the
strength of interactions would increase over the time period of this experiment, given the
fast-growing nature of M. villosa. My aim was to provide baseline resource management
knowledge that will stimulate and inform efforts to restore M. villosa through reintroduction.
11
Materials and Methods
Study Site
The experiment was conducted at the University of Hawai'i at Mānoa on the top floor
balcony of the St. John Plant Sciences Building. The balcony receives full sun and limited
wind - conditions comparable to the natural habitat of M. villosa. Mean annual rainfall at this
location is 999.8 mm, which is higher but similar to M. villosa populations on O'ahu such as
Lualualei (619.1 mm) and Koko Head (724.0; Giambelluca, 2011). I chose to conduct a
common-garden experiment because manipulative experiments are not permitted at the sites
of natural M. villosa populations.
Experimental Design
I tested the following effects: two flooding levels (once or none), two light levels
(50% shade or full sun), two weeding levels (bi-monthly or none), and the interactions of
these factors. Percent cover was measured for M. villosa to determine relative growth in
response to different treatment combinations, and sporocarps were counted after the
experiment ended to quantify sexual reproduction potential. I used a split-plot design with
repeated measures and a factorial arrangement of the three treatments. Light levels were in
the main plots, and a 2×2 factorial combination of flooding and weeding levels were in the
subplots, for an overall 2×2×2 factorial design (Fig. 2.1). Main plots were placed so that
shaded plots would not cast shadows on sun plots. There were six replicates, which were
blocked for variation along the length of the building (Fig. 2.1), due to the physical structure
and space available. Since there was potential variation in conditions along the building-wall-
to-balcony-wall gradient (within each block), I measured the distance from the building wall
to the center of each plot. When wall distance was analyzed as a covariate, it was not found
to be significant. The split-plot design was chosen because using light levels as a main plot
was most logistically feasible, as sun or shade was more easily applied to a larger plot. If a
similar experiment were done in the field, flooding would also have to be in the main plot for
logistical reasons, but in this experiment the plots were constructed allowing flooding in the
subplot, increasing precision for that factor. The factorial arrangement was chosen to
maximize the use of resources and to enable testing for all interactions between factors, since
these were all of interest.
12
Since M. villosa has a shallow root system, plots were constructed using 0.87 cm
sanded pine untreated plywood (Georgia Pacific; Atlanta, GA) as a base and untreated 2 × 4
pine boards (5.08 × 10.16 cm; Home Depot; Atlanta, GA) as rims, and 150 micron Husky
Plastic Sheeting (Poly-America; Grand Prairie, TX) was stapled inside each subplot to
waterproof flooding treatment plots. Holes were drilled through plastic and plywood bases to
provide ample drainage in the subplots receiving the no flooding treatment. Each main plot
(containing four subplots) was placed on cinder blocks to allow full drainage. For shaded
main plots, a frame of 1.27 cm polyvinyl chloride (PVC) pipe was constructed to a height of
70 cm above the plot, and the frame was covered with 50% shade cloth on its top and sides.
This ensured that the plots were fully shaded but did not shade any other plots. Plots were
monitored every 1-2 days. Since 2010 was an exceptionally dry year and rainfall was not
sufficient to keep soil moist enough for plant growth, the plots were watered using the
building’s water source twice a week in March and April 2010. The flooded main plots were
manually flooded on 26 February 2010. Once weed species emerged, weeded subplots were
hand weeded on a bi-monthly basis from 22 February to 19 April 2010. The experiment
ended when subplots began to reach 100% cover of M. villosa. Although the emergent season
of M. villosa in the field tends to fall between December and March (M. Bruegmann 2008,
U.S. Fish & Wildlife Services, Honolulu, HI, personal communication), rainy seasons at
Lualualei can extend into June (Chapter 3), so the timing of the experiment (February
through April) was within the natural range.
Plant Material and Soil
One of the natural subpopulations at Lualualei Valley, O‘ahu, was the source of
dormant M. villosa rhizomes that were grown in 1-liter pots at the experimental site while
plots were being constructed. Soil from the top 10 cm of the ground surface was also
collected from Lualualei Valley, adjacent to the natural population of M. villosa. Soil in 1-
liter pots was watered and observed to confirm that a weed seed bank was present and that
seeds were viable. The soil was sifted for particles larger than 5 cm diameter and thoroughly
mixed to maximize homogeneity, and then soil was placed in each subplot to a depth of 8
cm. Forty-eight clumps of M. villosa with 10 to 15 fully expanded leaves each were chosen
randomly and transplanted into experimental plots in Lualualei soil on 13 February 2010. A
13
threatened and endangered species permit was obtained from the U.S. Fish and Wildlife
Service (Permit No. TE096741-1) prior to all collection activities.
Response Measurement
Plant response measurements were taken bi-monthly, alternating with bi-monthly
weeding treatments. Percent cover of Marsilea villosa and all other vegetation was measured
by image analysis, using a digital camera secured to a 1.4 m high photo-quadrat built from
PVC pipe. Shade cloth was detachable from PVC frames to allow photographs to be taken
with the photo-quadrat, and immediately replaced. Images were analyzed with PhotoGrid 1.0
software (Bird, 2003) using 200 randomly generated points per photograph that were each
scored as M. villosa, grass species, other plant species, or litter/soil. These point counts were
converted into percent cover for each class. This method was used for photographs taken on
the day of planting to confirm no statistical differences between outplantings. Subsequent
measures were taken every two weeks for ten weeks. Three months after the end of the
experiment (allowing time for full drought to occur and for sporocarp development), all
sporocarps were counted in each plot to quantify sexual reproduction potential. Number of
sporocarp-producing nodes on rhizomes and number of sporocarps per node were also
quantified. Aborted sporocarps, which are easily identified by their small size or flattened
appearance, were assumed to be non-viable and were not counted.
Data Analysis
Arcsine square root transformation was used on all percent cover data to normalize
the data. Transformed data for percent cover were analyzed using linear mixed model
ANOVAs with repeated measures. Data for sporocarps per subplot, sporocarps relative to
percent cover, and sporocarps per node were normally distributed without transformation and
were analyzed in the same manner as percent cover but without repeated measures. The
largest models contained all terms in the fully crossed factorial of light (L), flood (F), weed
(W), and time (T) as fixed effects. Block (B) and the interactions of B×L and B×L×F×W
were chosen as random effects because these terms have physical counterparts (block, main
plot, and subplot, respectively; Fig. 2.1), based on an a priori assumption that these would be
the only meaningful random effects. I used a top-down strategy for model selection,
14
beginning with the full model and selecting appropriate estimation methods and covariance
structures (West et al., 2007). Models were systematically reduced by elimination of non-
significant random effects, followed by elimination of non-significant fixed effects, from
highest to lowest order interactions. Best fitting models were selected using the Akaike
Information Criterion corrected for small sample size (AICc), and these models were used to
determine significant differences (P< 0.05). Between the fourth and final repeated measure, a
sudden decrease in rainfall caused an unintentional drought stress event in the experiment,
and the data for the final measure had a higher variance than the first four measures.
Therefore, I treated the final measure as a separate dataset and did not include it in the
repeated measures analysis. The same methods of model selection were used on the data
from this single measure. All ANOVAs were followed by Tukey-adjusted least squares post
hoc tests to determine P values for pairwise significant differences between treatment
combinations. All statistical analyses were run in SAS using the Mixed Procedure (SAS
Institute, 2006).
Results
The model that best explained variation in growth of M. villosa over the first four
measurements (2 - 8 weeks) had no random effects, was reduced in number of fixed effects,
and used unstructured covariance structure and maximum likelihood estimation (Table 2.1).
The effect of time was significant, with mean percent cover more than tripling over eight
weeks (Table 2.2; Fig. 2.2). Over this eight-week period, flooding was the only treatment
with a significant single-factor effect on percent cover of M. villosa. In flooded plots
compared to non-flooded plots, cover was 1.75 times higher at six weeks and was 1.64 times
higher at eight weeks (Table 2.2). There was an interaction of time×flood because the
positive effect of flooding on growth increased over time (Table 2.2; Fig. 2.2b). A significant
interaction of time×light occurred because at four weeks percent cover was higher in sun
plots (P = 0.0067) than in shaded plots, at six weeks there was no difference between light
treatments, and at eight weeks shaded plots had higher cover than sun plots (P = 0.0061; Fig.
2.2a). There was also an interaction of time×light×flood (Table 2.2) because although
flooded plots increased percent cover more than non-flooded plots over time, the difference
between flood treatments in sun plots was only significant at six weeks (P = 0.0106; Fig.
15
2.3a), while the difference between flood treatments in shade plots was only significant at
eight weeks (P = 0.0062; Fig. 2.3b).
A sudden drop in rainfall to levels at which supplementary watering was inadequate
caused an unintentional drought event in the experiment at approximately nine weeks. The
final 10-week measurement was analyzed separately from the repeated measures, and the
model that best explained variation in this final measure included all fixed effects, no random
effects, unstructured covariance structure, and maximum likelihood estimation (Table 2.1).
Flooding again had a significant single-factor effect with percent cover twice as high in
flooded plots than in non-flooded plots (Table 2.2, Fig. 2.2b). Light also had a significant
effect with percent cover 3.4 times higher in shade plots than in sun plots (Table 2.2; Fig.
2.1a). There was an interaction of flood×light because there was no difference between flood
treatments grown in sun, while percent cover was over twice as high in flooded plots than in
non-flooded plots grown in shade (P = 0.0001, Fig. 2.4a). A flood×weed interaction also
occurred because in weeded plots there was no difference between flood treatments, but in
non-weeded plots percent cover was 3.5 times higher in flooded than in non-flooded plots (P
= 0.0006, Fig. 2.4a).
The model that best explained variation in sporocarp counts included all fixed effects,
no random effects, diagonal covariance structure, and restricted maximum likelihood
estimation, and this model was the best fit for all sporocarp response variables (Table 2.1).
Results for number of sporocarps per subplot were parallel to percent cover of M. villosa
after the drought. There was a single-factor effect of flooding with more than double the
number of sporocarps in flooded plots relative to non-flooded plots (Table 2.3). There was
also a flood×light interaction with no difference between flood treatments grown in sun, but
more than four times more sporocarps in flooded plots than non-flooded plots when grown in
shade (P = 0.0002; Fig. 2.4b). The flood×weed interaction was also significant, with no
difference in sporocarp numbers by flood treatment in weeded plots, but without weeding
there were 7.6 times more sporocarps in flooded plots than in non-flooded plots (P = 0.0004;
Fig. 2.4b). When I divided number of sporocarps by percent cover of M. villosa within plots,
there were no significant differences between any treatments or interactions (Table 2.3). The
number of sporocarps per sporocarp-producing node showed significant single-factor effects
of flooding and light, with flooded plots averaging just less than one more sporocarp per
16
node than non-flooded plots, and shaded plots averaging just over one more sporocarp per
node than sun plots (Table 2.3).
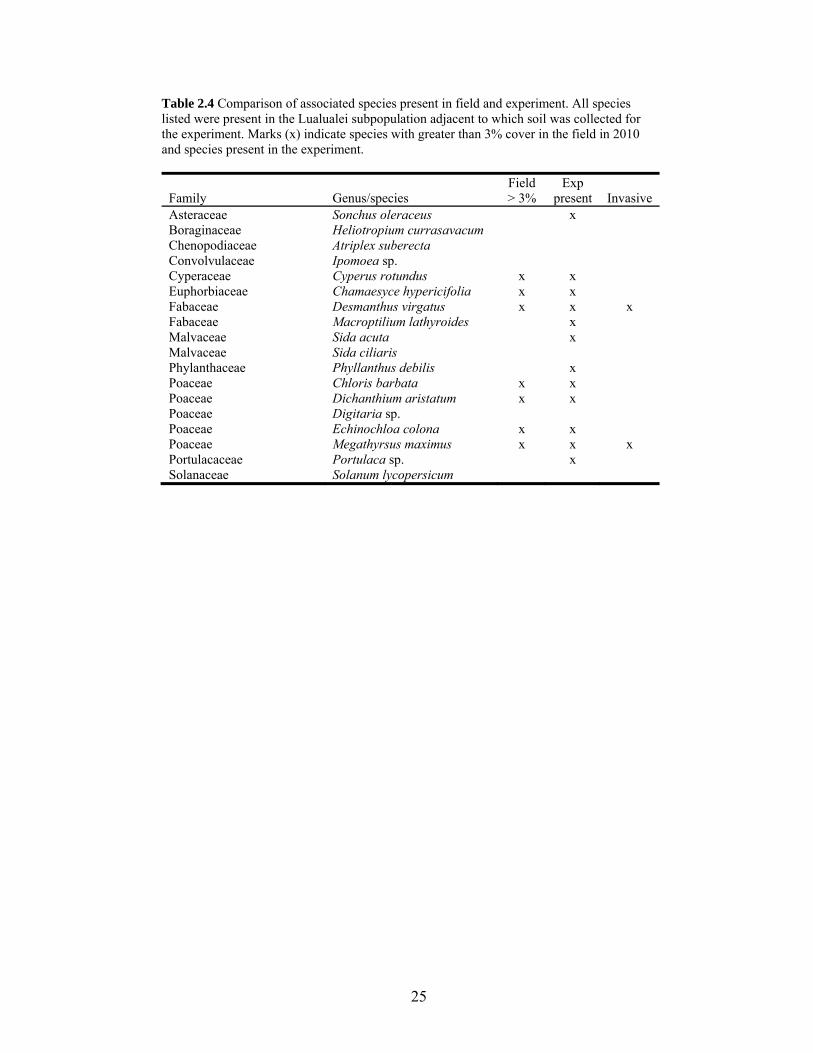
Associated species present in the experiment were all found in the field at Lualualei,
in the subpopulation adjacent to which soil was collected for the experimental plots and weed
seed bank. All species besides M. villosa were non-native species. All species with greater
than 3% cover in the field in 2010 were also present in the experimental plots (Table 2.4). A
3% threshold was chosen because all other associated species had less than 1% cover in the
field, and since 2010 was a drought year, no species had greater than 15% cover in the field,
including M. villosa (Chapter 2). Two species found in the field in 2010 are invasive,
according to either the Hawai'i Department of Agriculture or the Hawai'i-Pacific Weed Risk
Assessment (Table 2.4) and all of these invasive species were also found in the experiment.
Discussion
This experiment strongly supported my hypothesis that flooding is the factor with the
greatest influence on reintroduction success. However, interactions among treatments
showed that light levels and weed management could also affect restoration of M. villosa
over time. The first eight weeks of the experiment showed support for my first and last
hypotheses, with flooding having the greatest single-factor positive effect and having an
increased positive effect over time (Fig. 2.1b). The doubling of M. villosa cover in flooded
vs. non-flooded plots after the unplanned drought event was not predicted, but it is not
surprising given the biology of Marsilea and other plant species that thrive in ephemeral pool
habitats (Deil, 2005).
I did not make hypotheses about the effect of light or interactions of light and flood
over time, but these were some of the strongest effects in the experiment. Although M.
villosa is considered a sun-loving plant (Bruegmann, 1996), I have observed it thriving in
both sun and shade conditions. Since water availability is so critical to the growth and life
cycle of M. villosa, its increased growth in shade might be explained by the decrease in rate
of plant transpiration and soil water loss relative to full-sun conditions (Mejia-Dominguez et
al., 2011). This hypothesis is supported by the interactions of light and flood over time
because in full sun, flooding made less difference over time (Fig. 2.3a), and even after
drought flooding did not make a difference in full sun (Fig. 2.4a). However, in shade
17
conditions flooding did increase percent cover over time (Fig. 2.3b), and these gains were
still present and even stronger after drought (Fig. 2.4a). It appears that the benefits of
flooding are prolonged by the water-conserving properties of shade even after the onset of
drought conditions. My results indicate that the combination of flooding and shade produces
optimal conditions for M. villosa growth, and that reintroductions would greatly benefit from
being planted in areas with seasonal flooding and partial shade, regardless of subsequent
management activities.
Although I did not make predictions about the single-factor effect of weeding, it was
surprising that there were no differences at any time, including after the drought (Fig. 2.2c).
However there were some interactions involving weeding, as I predicted. The percent cover
of M. villosa supported my second hypothesis after the drought event, which was higher in
weeded than non-weeded plots in the absence of flood (Fig. 2.4b). An even greater difference
was found between flooded and non-flooded plots in the absence of weeding; however, this
also lent support to my hypothesis that flooding helped suppress weeds in the absence of
weed control (Wester, 1994; Wester et al., 2006). My third hypothesis that weeding would
increase percent cover of M. villosa in sun and non-flooded plots was not supported. No
three-way effects were detected, and both two-way interactions involved flooding, further
confirming the central role of flooding in the growth of M. villosa.
The results of sporocarp counts following the experiment contradicted my hypothesis
that more sporocarps would be produced in the stressful conditions of sun and absence of
flood. The doubling of sporocarps per plot with flooded compared to non-flooded plots
(Table 2.3) and the similarity of the significance and direction of flood×light and flood×weed
interactions (Fig. 2.4c, d) suggests that production of sporocarps is correlated with growth of
M. villosa, rather than a strategy to increase dispersal and reproduction potential under
stressful conditions. Indeed, the lack of difference in sporocarps produced per percent cover
of M. villosa reinforces this hypothesis (Table 2.3). Thus, it seems important to target
restoration practices that maximize vegetative growth of M. villosa, because losses in growth
are not likely to be compensated by gains in sexual reproduction potential.
An unexpected result of sporocarp counts was the variation in number of sporocarps
per sporocarp-producing node. More sporocarps were produced per node in both flooded and
shaded plots, and although these effects were not strong enough to create an interaction
18
effect, these results suggest that optimal growth conditions tend to produce more sporocarps
per node. During the experiment, I observed that plants that were fully submerged in water
could produce sporocarps, despite the accepted view that sporocarps are produced at the end
of the dry season when plants are water-stressed (Tryon & Tryon, 1982). In the first few
weeks of the experiment, when individual rhizomes could still be distinguished in plots, I
also observed that plants in sun tended to produce longer rhizomes while plants in shade
tended to grow more densely, so that even when percent cover did not differ, distribution of
growth may have. Therefore, I hypothesize that M. villosa grown under stressful conditions
will spread rhizomes farther and faster, producing fewer sporocarps per node, while plants in
optimal conditions will grow more densely and produce more sporocarps per node. Thus, I
hypothesize that in a field situation, M. villosa grown in flooded, shaded conditions may
ultimately produce more sporocarps per area, gaining a potential advantage in sexual
reproduction.
Although I initially had some concerns about variability within the study site, using
the model selection process alleviated these concerns. The elimination of all random
variables in the best fitting models and the lack of any block effects indicated that the
variation detected by the experiment was due to treatment effects. Since this experiment
produced robust results, I expect that these can be applied to reintroductions in a field setting
even with moderate spatial variability. Although the average length of a M. villosa emergent
season is unknown, the length of this experiment did fall within the range observed at
Lualualei Naval Base (Chapter 2). Therefore, my results are relevant to potential
reintroduction locations even if they are flooded only once a season.
This study has important implications for future ecological restoration involving M.
villosa. First, it has expanded the range of potential reintroduction locations. Conventional
wisdom based on simple observation would have reintroduction take place in flooding but
sunny locations. However, based on my results I recommend outplanting new populations of
M. villosa in areas with both flooding and partial shade. Further research may be required to
determine which canopy species would best coexist with M. villosa, as there is considerable
variation in the ways that tree species alter understory microsites (Mejia-Dominguez et al.,
2011). Weed control is the only form of management currently used at natural populations of
M. villosa, either by applying herbicide to surrounding areas and targeted hand weeding (L.
19
Abbott 2008, U.S. Army Natural Resources, Honolulu, HI, personal communication) or by
mowing in the dry season (A. Hebshi 2010, U.S. Navy Environmental Planning Division,
Honolulu, HI, personal communication). If outplanted at the beginning of a rainy season,
reintroduced populations should not require labor-intensive weed management, except
perhaps in years of extreme drought. However, extended lack of flooding (approximately 18
yr) in a natural M. villosa population that used to flood on average every 6.5 yr has led to
severe decline of that population, despite moderate weed control efforts (Wester et al., 2006).
Although ephemeral pools tend to be more resistant than many other ecosystems to exotic
species invasions, extreme climatic events can provide opportunities for invasive species to
establish (Collinge et al., 2011). Thus I add the caveat that potential reintroduction sites
should have a consistent record of flooding, and that occasional weed management, long-
term monitoring, and assessment would be ideal. If reintroductions of M. villosa are
implemented and managed as I recommend, they are likely to establish well, require minimal
management, and become self-sustaining in the long term, reflecting the goals of successful
ecological restoration.

20
TABLES
21
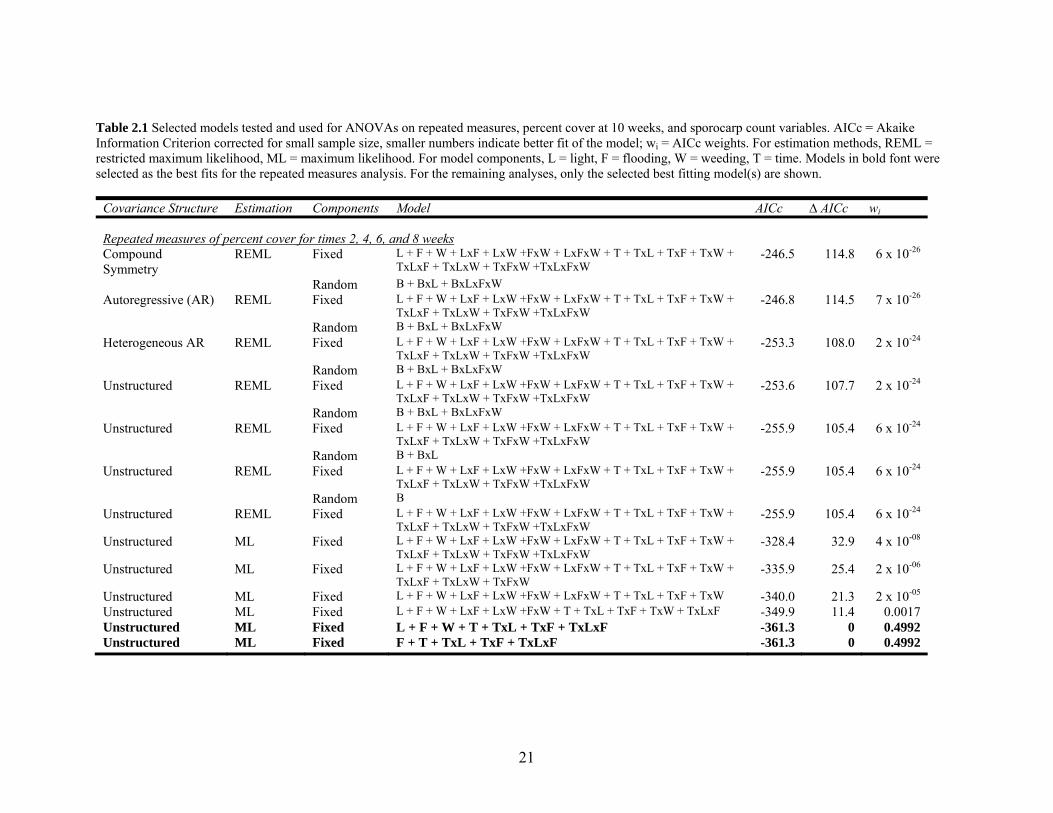
Table 2.1 Selected models tested and used for ANOVAs on repeated measures, percent cover at 10 weeks, and sporocarp count variables. AICc = Akaike Information Criterion corrected for small sample size, smaller numbers indicate better fit of the model; wi = AICc weights. For estimation methods, REML = restricted maximum likelihood, ML = maximum likelihood. For model components, L = light, F = flooding, W = weeding, T = time. Models in bold font were selected as the best fits for the repeated measures analysis. For the remaining analyses, only the selected best fitting model(s) are shown.
Covariance Structure Estimation Components Model AICc ∆ AICc wi
Repeated measures of percent cover for times 2, 4, 6, and 8 weeks Compound Symmetry
REML Fixed L + F + W + LxF + LxW +FxW + LxFxW + T + TxL + TxF + TxW + TxLxF + TxLxW + TxFxW +TxLxFxW
-246.5 114.8 6 x 10-26
Random B + BxL + BxLxFxW Autoregressive (AR) REML Fixed L + F + W + LxF + LxW +FxW + LxFxW + T + TxL + TxF + TxW +
TxLxF + TxLxW + TxFxW +TxLxFxW -246.8 114.5 7 x 10-26
Random B + BxL + BxLxFxW Heterogeneous AR REML Fixed L + F + W + LxF + LxW +FxW + LxFxW + T + TxL + TxF + TxW +
TxLxF + TxLxW + TxFxW +TxLxFxW -253.3 108.0 2 x 10-24
Random B + BxL + BxLxFxW Unstructured REML Fixed L + F + W + LxF + LxW +FxW + LxFxW + T + TxL + TxF + TxW +
TxLxF + TxLxW + TxFxW +TxLxFxW -253.6 107.7 2 x 10-24
Random B + BxL + BxLxFxW Unstructured REML Fixed L + F + W + LxF + LxW +FxW + LxFxW + T + TxL + TxF + TxW +
TxLxF + TxLxW + TxFxW +TxLxFxW -255.9 105.4 6 x 10-24
Random B + BxL Unstructured REML Fixed L + F + W + LxF + LxW +FxW + LxFxW + T + TxL + TxF + TxW +
TxLxF + TxLxW + TxFxW +TxLxFxW -255.9 105.4 6 x 10-24
Random B Unstructured REML Fixed L + F + W + LxF + LxW +FxW + LxFxW + T + TxL + TxF + TxW +
TxLxF + TxLxW + TxFxW +TxLxFxW -255.9 105.4 6 x 10-24
Unstructured ML Fixed L + F + W + LxF + LxW +FxW + LxFxW + T + TxL + TxF + TxW + TxLxF + TxLxW + TxFxW +TxLxFxW
-328.4 32.9 4 x 10-08
Unstructured ML Fixed L + F + W + LxF + LxW +FxW + LxFxW + T + TxL + TxF + TxW + TxLxF + TxLxW + TxFxW
-335.9 25.4 2 x 10-06
Unstructured ML Fixed L + F + W + LxF + LxW +FxW + LxFxW + T + TxL + TxF + TxW -340.0 21.3 2 x 10-05 Unstructured ML Fixed L + F + W + LxF + LxW +FxW + T + TxL + TxF + TxW + TxLxF -349.9 11.4 0.0017 Unstructured ML Fixed L + F + W + T + TxL + TxF + TxLxF -361.3 0 0.4992 Unstructured ML Fixed F + T + TxL + TxF + TxLxF -361.3 0 0.4992
22
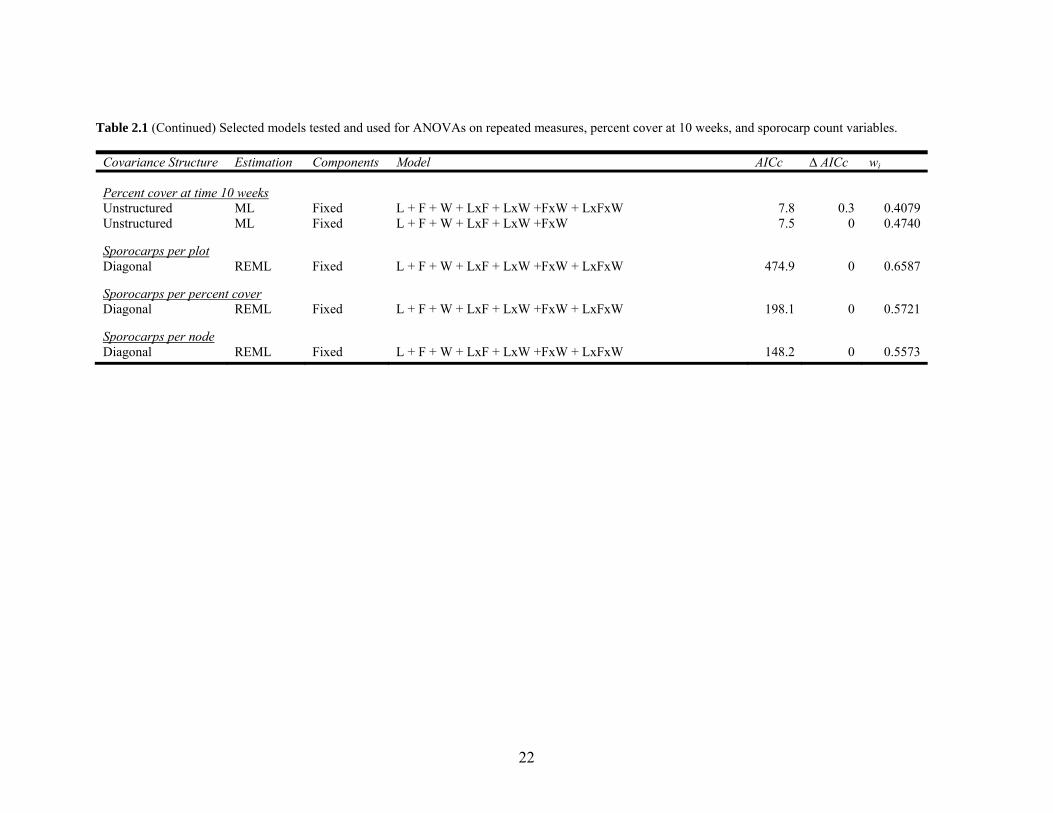
Table 2.1 (Continued) Selected models tested and used for ANOVAs on repeated measures, percent cover at 10 weeks, and sporocarp count variables.
Covariance Structure Estimation Components Model AICc ∆ AICc wi
Percent cover at time 10 weeks Unstructured ML Fixed L + F + W + LxF + LxW +FxW + LxFxW 7.8 0.3 0.4079 Unstructured ML Fixed L + F + W + LxF + LxW +FxW 7.5 0 0.4740
Sporocarps per plot Diagonal REML Fixed L + F + W + LxF + LxW +FxW + LxFxW 474.9 0 0.6587
Sporocarps per percent cover Diagonal REML Fixed L + F + W + LxF + LxW +FxW + LxFxW 198.1 0 0.5721
Sporocarps per node Diagonal REML Fixed L + F + W + LxF + LxW +FxW + LxFxW 148.2 0 0.5573
23
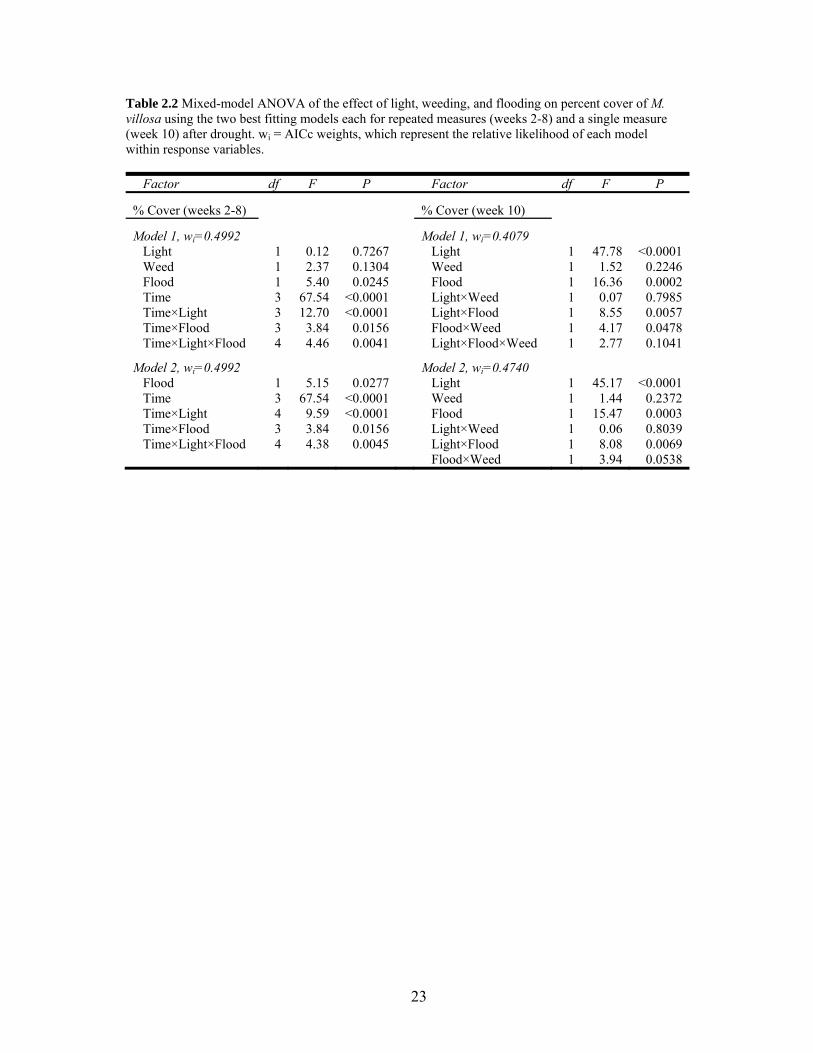
Table 2.2 Mixed-model ANOVA of the effect of light, weeding, and flooding on percent cover of M. villosa using the two best fitting models each for repeated measures (weeks 2-8) and a single measure (week 10) after drought. wi = AICc weights, which represent the relative likelihood of each model within response variables.
Factor df F P Factor df F P
% Cover (weeks 2-8) % Cover (week 10)
Model 1, wi=0.4992 Model 1, wi=0.4079 Light 1 0.12 0.7267 Light 1 47.78 <0.0001 Weed 1 2.37 0.1304 Weed 1 1.52 0.2246 Flood 1 5.40 0.0245 Flood 1 16.36 0.0002 Time 3 67.54 <0.0001 Light×Weed 1 0.07 0.7985 Time×Light 3 12.70 <0.0001 Light×Flood 1 8.55 0.0057 Time×Flood 3 3.84 0.0156 Flood×Weed 1 4.17 0.0478 Time×Light×Flood 4 4.46 0.0041 Light×Flood×Weed 1 2.77 0.1041
Model 2, wi=0.4992 Model 2, wi=0.4740 Flood 1 5.15 0.0277 Light 1 45.17 <0.0001 Time 3 67.54 <0.0001 Weed 1 1.44 0.2372 Time×Light 4 9.59 <0.0001 Flood 1 15.47 0.0003 Time×Flood 3 3.84 0.0156 Light×Weed 1 0.06 0.8039 Time×Light×Flood 4 4.38 0.0045 Light×Flood 1 8.08 0.0069 Flood×Weed 1 3.94 0.0538
24
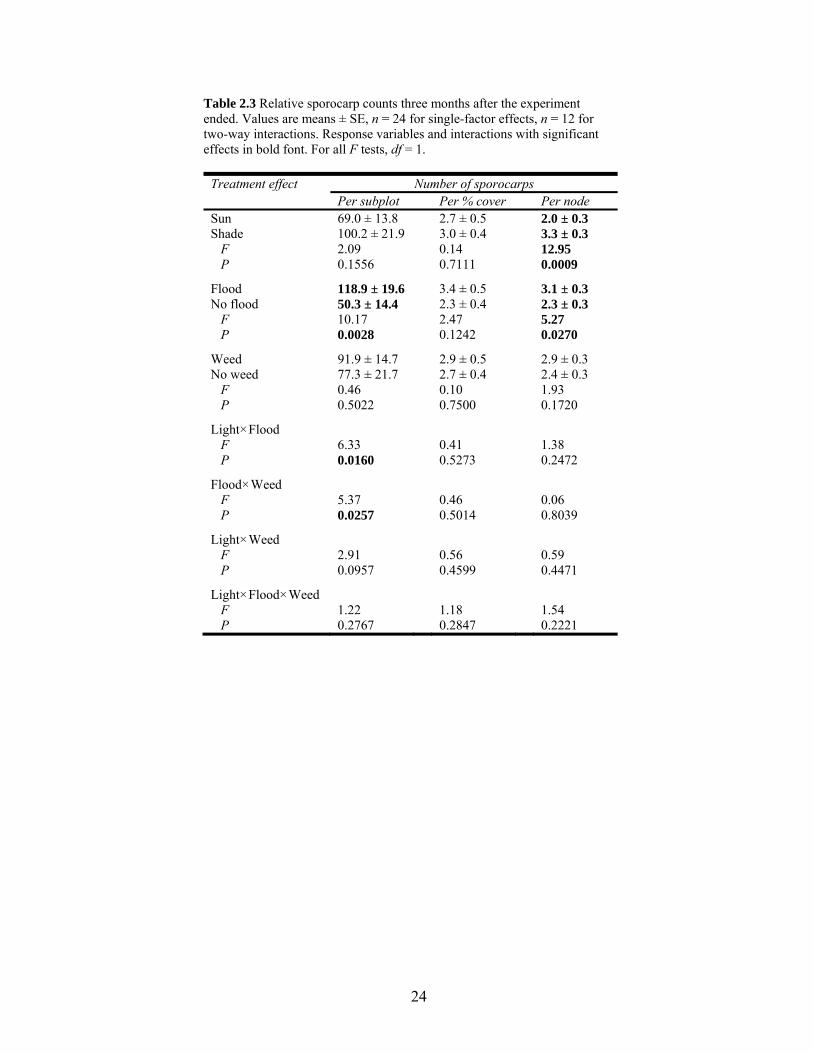
Table 2.3 Relative sporocarp counts three months after the experiment ended. Values are means ± SE, n = 24 for single-factor effects, n = 12 for two-way interactions. Response variables and interactions with significant effects in bold font. For all F tests, df = 1.
Treatment effect Number of sporocarps Per subplot Per % cover Per node Sun 69.0 ± 13.8 2.7 ± 0.5 2.0 ± 0.3 Shade 100.2 ± 21.9 3.0 ± 0.4 3.3 ± 0.3 F 2.09 0.14 12.95 P 0.1556 0.7111 0.0009
Flood 118.9 ± 19.6 3.4 ± 0.5 3.1 ± 0.3 No flood 50.3 ± 14.4 2.3 ± 0.4 2.3 ± 0.3 F 10.17 2.47 5.27 P 0.0028 0.1242 0.0270
Weed 91.9 ± 14.7 2.9 ± 0.5 2.9 ± 0.3 No weed 77.3 ± 21.7 2.7 ± 0.4 2.4 ± 0.3 F 0.46 0.10 1.93 P 0.5022 0.7500 0.1720
Light×Flood
F 6.33 0.41 1.38 P 0.0160 0.5273 0.2472
Flood×Weed F 5.37 0.46 0.06 P 0.0257 0.5014 0.8039
Light×Weed F 2.91 0.56 0.59 P 0.0957 0.4599 0.4471
Light×Flood×Weed F 1.22 1.18 1.54 P 0.2767 0.2847 0.2221
25
Table 2.4 Comparison of associated species present in field and experiment. All species listed were present in the Lualualei subpopulation adjacent to which soil was collected for the experiment. Marks (x) indicate species with greater than 3% cover in the field in 2010 and species present in the experiment.
Family Genus/species Field > 3%
Exp present Invasive
Asteraceae Sonchus oleraceus x Boraginaceae Heliotropium currasavacum Chenopodiaceae Atriplex suberecta Convolvulaceae Ipomoea sp. Cyperaceae Cyperus rotundus x x Euphorbiaceae Chamaesyce hypericifolia x x Fabaceae Desmanthus virgatus x x x Fabaceae Macroptilium lathyroides x Malvaceae Sida acuta x Malvaceae Sida ciliaris Phylanthaceae Phyllanthus debilis x Poaceae Chloris barbata x x Poaceae Dichanthium aristatum x x Poaceae Digitaria sp. Poaceae Echinochloa colona x x Poaceae Megathyrsus maximus x x x Portulacaceae Portulaca sp. x Solanaceae Solanum lycopersicum

26
FIGURES
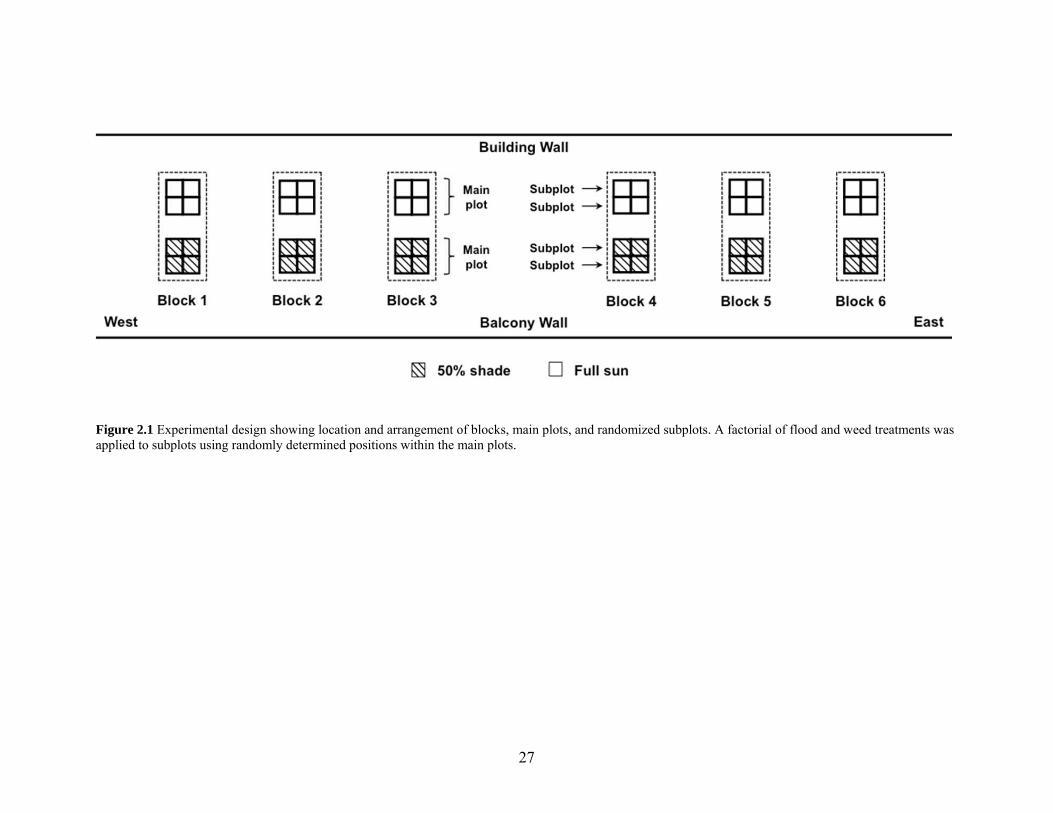
27
Figure 2.1 Experimental design showing location and arrangement of blocks, main plots, and randomized subplots. A factorial of flood and weed treatments was applied to subplots using randomly determined positions within the main plots.
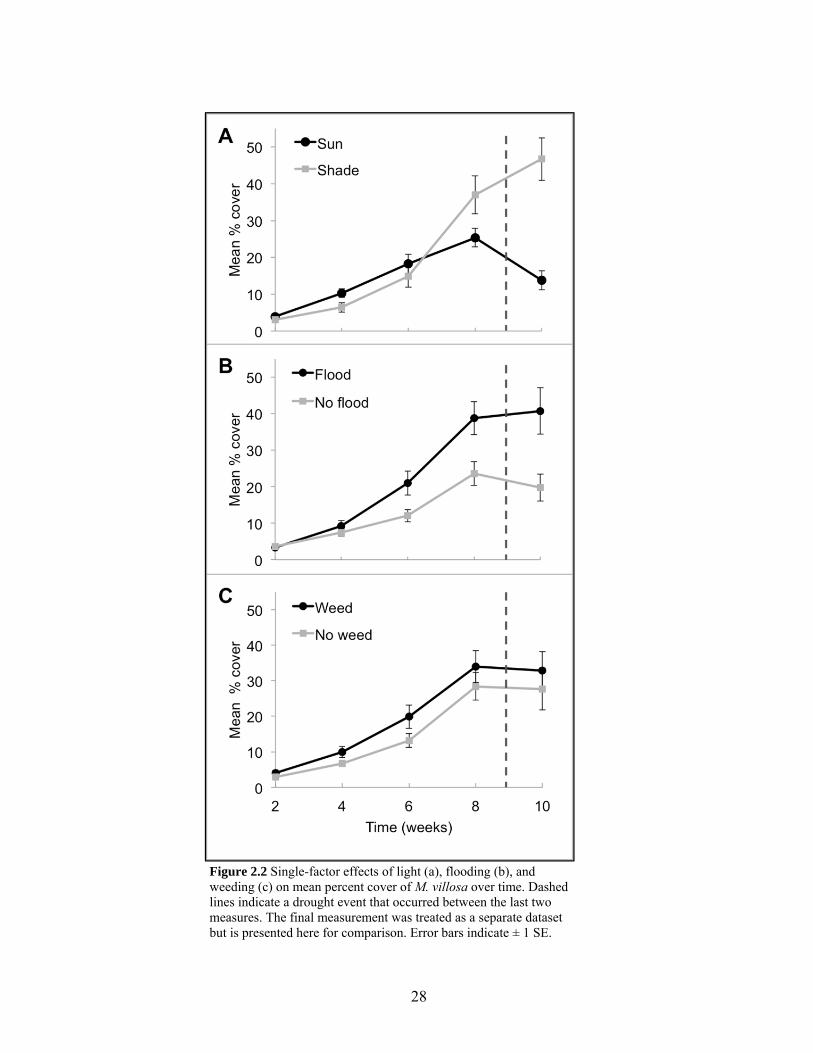
28
Figure 2.2 Single-factor effects of light (a), flooding (b), and weeding (c) on mean percent cover of M. villosa over time. Dashed lines indicate a drought event that occurred between the last two measures. The final measurement was treated as a separate dataset but is presented here for comparison. Error bars indicate ± 1 SE.
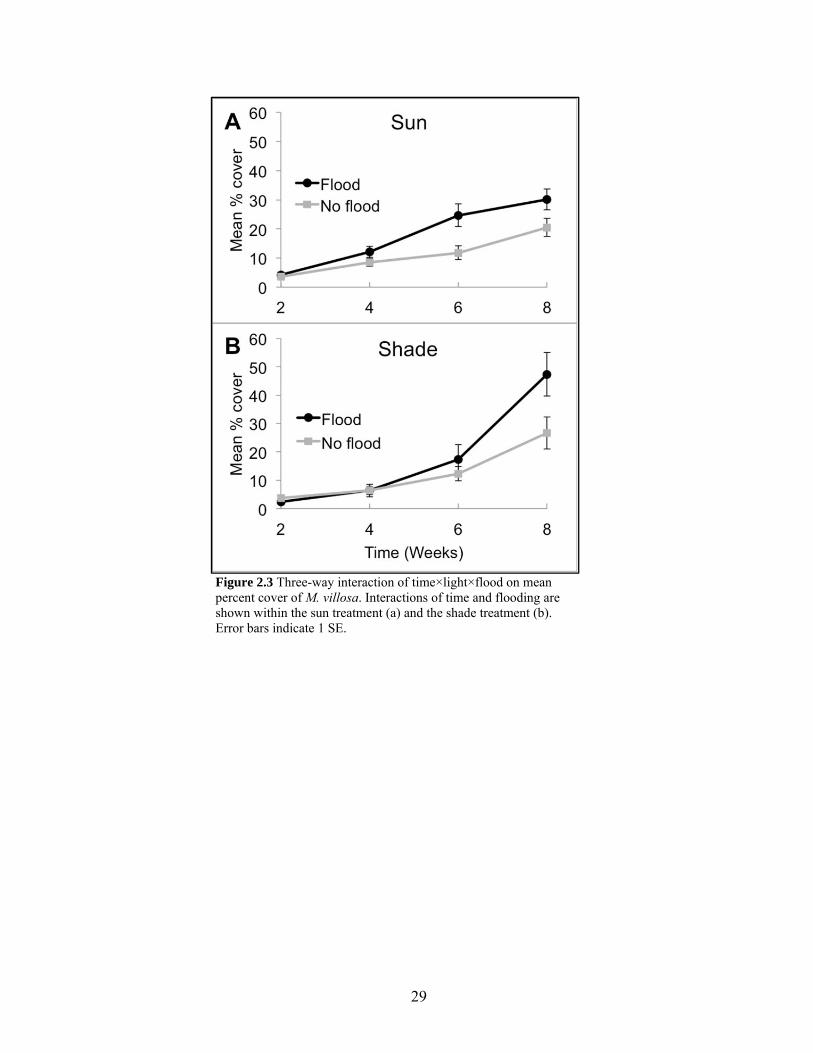
29
Figure 2.3 Three-way interaction of time×light×flood on mean percent cover of M. villosa. Interactions of time and flooding are shown within the sun treatment (a) and the shade treatment (b). Error bars indicate 1 SE.
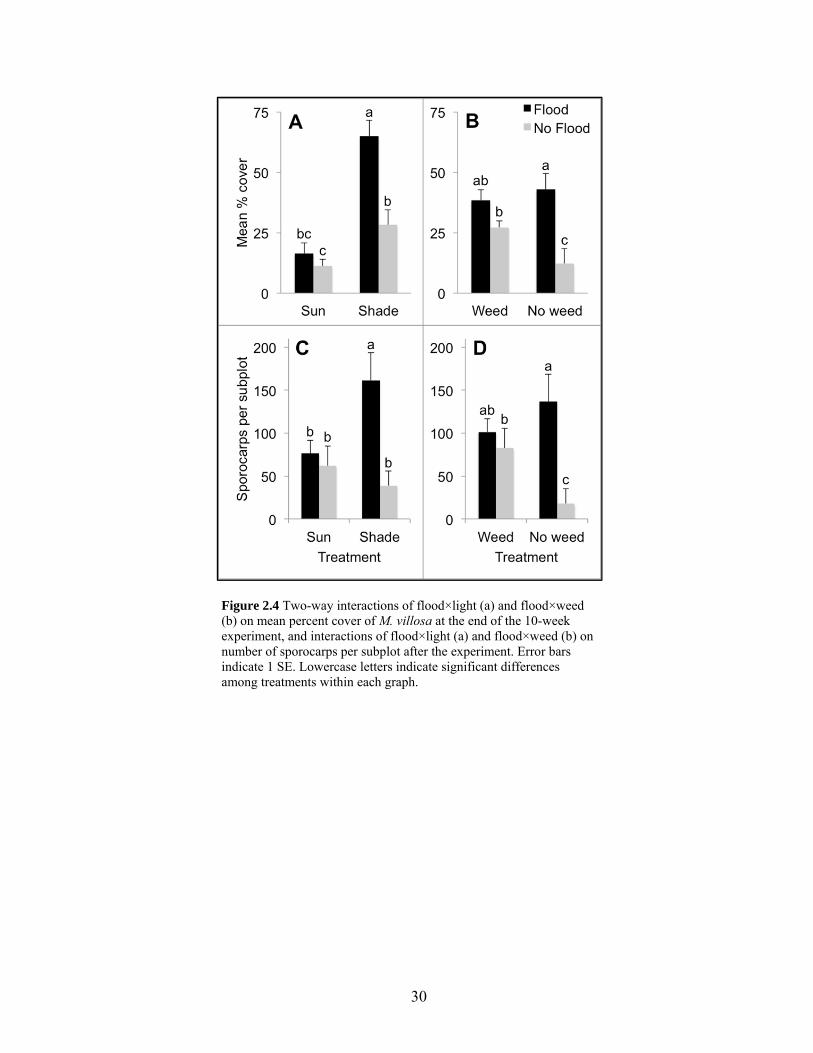
30
Figure 2.4 Two-way interactions of flood×light (a) and flood×weed (b) on mean percent cover of M. villosa at the end of the 10-week experiment, and interactions of flood×light (a) and flood×weed (b) on number of sporocarps per subplot after the experiment. Error bars indicate 1 SE. Lowercase letters indicate significant differences among treatments within each graph.
31
CHAPTER 3
ECOLOGICAL FACTORS INFLUENCING GROWTH OF THE ENDANGERED
HAWAIIAN FERN MARSILEA VILLOSA AND IMPLICATIONS FOR CONSERVATION
MANAGEMENT
Abstract
Conserving endangered plant species is a complex task, and on-the-ground management is
often trial and error, with managers doing their best to address immediate needs. Botanists
can improve this process by conducting sound science upon which to base management
practices. Marsilea villosa is an endangered, endemic Hawaiian fern with seven remaining
populations in ephemerally flooding drylands. Among its uncommon traits are long-lived
sporocarps, a requirement of flood and drought to complete its sexual life cycle, and
extensive vegetative growth. I conducted a three-year field study on the ecology of M. villosa
to identify ecological factors with the greatest impact on its growth. I found that maximum
flooding depth and canopy cover had strong positive relationships with M. villosa growth,
and that all plots with over a 50% threshold of either variable reached 100% cover of M.
villosa by the end of the study. Interaction effects explained the nuances of these
relationships and confirmed some degree of synergy between the two variables. Percent
cover of non-native understory species by functional groups (grass and non-grass species)
each had negative relationships with percent cover of M. villosa, but interactions showed that
percent cover of non-grass species was driven by a particular species over time, and that time
since flooding had a greater influence on M. villosa growth than percent cover of grasses. I
recommend several specific management strategies that will optimize in situ conservation,
guide reintroduction practices to promote self-sustaining new populations, and reduce the
need for labor-intensive management.
32
Introduction
Restoration of endangered plant species is becoming more and more critical as we
face global loss of biodiversity. For many species, both management of existing populations
and reintroduction of the species to new locations may be necessary to protect them from
extinction. Reintroductions are sometimes successful, but often fail to become sustainable in
the long-term (Fahselt, 2007; Godefroid et al., 2011). It is critical that we overcome gaps in
knowledge of basic species biology, especially environmental factors that limit or facilitate
establishment, including ecological interactions (Drayton & Primack, 2012; Guerrant &
Kaye, 2007). More comparisons should be made with reference populations in the field, and
reintroductions should be carefully designed as experiments based on prior ecological
understanding (Kaye, 2008; Menges, 2008).
Ephemeral pools are distinctive ecosystems characterized by their small spatial scale,
isolation, transience, high dependence on precipitation patterns, and biota that are uniquely
adapted to these often stressful conditions. Although ephemeral pools are fairly abundant
worldwide, many are also threatened by human development and exotic species invasion, and
native species that flourish there are often endemic or endangered (Bauder, 2005; Collinge et
al., 2011; Deil, 2005). However, there have been relatively few studies that have targeted
ephemeral pool ecology and conservation. Small scale ecosystems such as ephemeral pools,
which vary considerably in habitat characteristics and therefore beta diversity, should be
studied not only for their own sake, but also because they make excellent model systems for
hypothesis-testing in ecology, conservation, and evolutionary biology (Blaustein and
Schwartz, 2001; De Meester et al., 2005).
Ferns and lycophytes are ecologically important but have also been understudied with
respect to conservation and restoration. Worldwide, only about 2% of all 11,000 species have
been evaluated for extinction risk, but 89% of those evaluated were found to be at risk.
Furthermore, most risk assessments are based only on abundance and geographic range, and
there is a need to examine intrinsic biology and ecology of ferns to better understand and
evaluate species for conservation purposes (Mehltreter, 2010). Although it is not uncommon
for studies of ecosystem restoration to account for regeneration of native fern species (e.g.,
Burns et al., 2011; Jager & Kowarik, 2010; Weller et al., 2011), very few studies target rare
33
or endangered ferns for restoration (but see Aguraiuja, 2011; Zenkteler, 2002). There is a
need for ecological studies on which to base conservation and restoration of fern species.
Marsilea villosa Kaulf. is an endangered, endemic Hawaiian fern with only seven
surviving populations on the islands of O‘ahu and Moloka‘i (Bruegmann, 1996); W. Garnett,
Rare Plant Species Recovery, Moloka‘i, HI, personal communication; Chau & Reyes,
personal observations). Species of Marsilea are unusual among ferns in being heterosporous,
producing sporocarps (i.e., highly modified leaflets with thick drought-resistant walls that
contain sporangia and spores), and requiring flood and drought to complete their sexual life
cycle (Palmer, 2003). Marsilea villosa produces photosynthetic leaves when rain is abundant
(typically November to March) and produces sporocarps when the soil begins to dry out, but
requires standing water for sporocarp maturation and sexual reproduction. In the dry season,
the leaves die and rhizomes are dormant. Sporocarps may be viable for up to a century, as
found in the closely related species Marsilea oligospora Goodd. (Johnson, 1985). When
conditions are wet enough for leaf production but not for sexual reproduction, which may last
several years, M. villosa grows vegetatively. Production of long-lived sporocarps and
vegetative growth likely contribute to the ability of M. villosa to recover from stressful
conditions, such as a drought of a year or more, as long as flooding occurs in subsequent
rainy seasons (personal observations). This combination of characters makes M. villosa a
resilient species and therefore an ideal candidate for restoration efforts.
I performed an ecological field study of the largest population of M. villosa over the
course of three growing seasons. My objectives were to answer the following questions: 1)
How is M. villosa growth affected by biotic factors (e.g., associated vegetation and canopy
cover), abiotic factors (e.g., flooding characteristics and soil properties), and temporal and
spatial variation in these factors? 2) Do the results of this study support those of an
experimental restoration study I conducted during the second year of the field study?
(Chapter 2) and 3) What management recommendations can I make to the U.S. Navy
Environmental Division, the owners of the land on which this population occurs?
I sought to test six hypotheses about single-factor effects on M. villosa growth and
four hypotheses on interactions between ecological factors (Table 3.1). I hypothesized that
increased flooding (1) and shade (2) would have positive relationships with growth of M.
villosa, while variables related to associated non-native species (3) would have negative
34
effects, based on observations of growth in the field. Among associated species, I
hypothesized that functional groups would have different effects (4), with non-native grasses
having a more negative impact on growth of M. villosa than other non-native (mostly forb)
species, due to the fibrous root systems, often perennial habit, and possible clonal growth via
rhizomes of grasses that might compete with M. villosa root and rhizome systems. Among
soil characteristics, I hypothesized that nitrogen (N) content (5) would have a positive
relationship with growth of M. villosa, based on potential facilitation effects of N on plant
growth, and that soils with a greater percentage of clay (6) would increase M. villosa growth
by increasing duration of flooding and retaining more moisture with smaller particle size.
With regard to interactions, I hypothesized that there would be interactions with time (1),
specifically that some effects might only be significant in relation to time. I also made the
following hypotheses about interactions among environmental factors. (2) Marsilea villosa
growth would increase with combined higher levels of flooding and canopy cover, based on
an experiment I conducted in the second year (Chau and Reyes, in review). (3) Non-native
species would have a greater effect under lower canopy cover, since many grasses and other
non-native species in dryland areas thrive under high light conditions. (4) The cover of non-
native species would have a lesser effect on M. villosa growth with increased flooding, since
flooding would kill most non-native species (at least temporarily, via above-ground
biomass), providing a chance for M. villosa to establish.
Materials and Methods
The study population was located on the Lualualei Naval Base on O‘ahu, the entrance
to which is located at 2126’19. 15 N, 15808’39. 29 W. Three subpopulations, distinct but
located within 2 km of each other, were monitored over the course of three winter rainy
seasons from Dec 2008 through June 2011. Since the majority of each rainy season occurred
mostly after December, seasons will hereafter be referred to as 2009, 2010, and 2011. Field
seasons varied considerably in monthly and total precipitation (Table 3.2.) For reference I
named the subpopulations with numbers: LUA1, which covered 2288 m2, LUA2, which was
266 m2, and LUA3, which was 340 m2 (Vanessa Pepi, U.S. Navy Environmental Planning
Division, 2008, personal communication). In January 2009, before the start of this study, I
observed a major flooding event, after which LUA1 expanded by an estimated 200-300 m2.
35
The subpopulations also varied in microsite conditions, with LUA1 partially shaded, LUA2
in full sun, and LUA3 mostly shaded. All shaded areas were under a monotypic canopy of
kiawe (Prosopis pallida [Humb. & Bonpl. ex Willd.] Kunth; Fabaceae).
Prior to any work with M. villosa plants, I obtained a Permit for Threatened and
Endangered Species (P-121) from the State of Hawai‘i Department of Land and Natural
Resources, Division of Forestry and Wildlife, and was added as an authorized individual on
the Pacific Naval Facilities Federal Fish and Wildlife Permit (TE096741). In 2009, I
established permanent plots at each subpopulation. I set up 1 × 1 m grids throughout each
subpopulation and then randomly chose 20 of the plots at each subpopulation to monitor for
three growing seasons. These permanent plots were marked with 12.7 cm galvanized steel
nails (with no more than 5 cm above ground) wrapped in flagging tape, positioned at the
upper left corner of the plot (relative to the road) in each subpopulation. I also used Glo
Orange Flag Stakes (Empire; Mukwonago, WI) to more easily locate plots during the
growing season, but removed these during the dry season so that groundskeepers could mow
over the dormant subpopulations at LUA1 and LUA2 to control weeds. Mowing occurred
monthly throughout the dry season, in several years prior to and during each year throughout
this study (personal communication, Vanessa Pepi, U.S. Navy Environmental Planning
Division, 2008). During each season, I began monitoring from the time the first rain occurred
at the site and continued until the vegetative growth had subsided. The first season lasted
from mid-December to early April, the second from late January to late April, and the third
from mid-December to late May (Table 3.2). In February 2009, I took soil cores from the
west corner (LUA1), south corner (LUA2), or north corner (LUA3) of each of the 60 plots
using a Signature Soil Core Sampler (AMS, Inc.; American Falls, Idaho) with an inner
diameter of 5 cm and a sample volume of ~196 cm3. The 20 soil samples from each of the
subpopulations (60 total) were taken to the Agricultural Diagnostic Service Center at the
College of Tropical Agriculture and Human Resources, University of Hawaii at Manoa for
analysis. Soils were analyzed for total N by dry combustion (Burt, 2004) and for particle size
distribution (% sand, silt, and clay) using a combination of sieving and sedimentation steps
following Kettler et al. (2001).
Vegetation surveys were conducted once in 2009, twice in 2010, and seven times at
three-week intervals over the course of the entire 2011 season (Table 3.2). I used the point-
36
frequency (or ‘pin-drop’) method for determining percent cover of understory plant species
in overlapping tiers (Mueller-Dombois and Ellenberg, 1974). I constructed a 1 m tall frame
of polyvinyl chloride pipe (1.9 cm diameter), and six holes were drilled across the top of the
horizontal piece of the frame at 10 cm intervals. Metal pins (Crown Bolt Round Rods; Aliso
Viejo, California) of 3.2 mm diameter and 91.4 cm length were fitted through the holes in the
frame. The frame was placed over the plot to be surveyed, each pin was raised, and then as it
was lowered each new plant species touched by the pin was recorded. This was repeated six
times at 10 cm intervals, so that each plot had 36 data points in a 50 × 50 cm area
(approximately centered within the 1 × 1 m plot). The pins were lowered slowly and did not
harm the vegetation, and surveying materials were lightweight to minimize disturbance to
plants. From the survey data I calculated the percent cover of M. villosa and all associated
species in each plot.
Canopy cover was also measured during the 2011 season, using a Spherical Crown
Densiometer (Forestry Suppliers, Inc.; Jackson, Mississippi). The densiometer had a grid of
24 squares etched on a convex mirror, with a bubble in the corner for leveling. Each of the
squares etched on the mirror was visually split into four quadrants (total of 96 quadrants) and
given a value of 0 to 4 estimating how much of the quadrant showed canopy openness (a
value of 0 represented 0% canopy openness and value of 4 represented 100% canopy
openness). This was done facing north, east, south, and west at each plot. All values within a
cardinal direction were summed, the average was taken for the four directions and multiplied
by 1.04 (providing percent canopy openness for that plot), and then this value was subtracted
from 100 to obtain the percent canopy cover.
In 2011 I also measured the depth of any standing water present in plots during the
regular surveys. During the largest flooding event, I measured water depth in the permanent
plots twice, at one-week intervals between the second and third surveys (Jan 2011). Using a
plastic ruler, water depth to the nearest 0.1 cm was recorded for the deepest area that fell
within the plot boundary.
I also calculated percent cover of all non-native grass species, percent cover of all
other non-native species (including mostly forbs, but also rare woody plants, vines, algae,
and fungi; Table 3.3), species richness (number of species per plot), change in flooding depth
from the previous repeated measure, maximum flooding depth per plot, flooding duration per
37
plot, and time since flooding. Time since flooding required special consideration, since some
plots did not flood in 2011. From personal observations and rainfall records, I was confident
that no flooding occurred in 2010, when a severe drought year affected the whole state of
Hawai‘i, and I also observed a large flood in the 2009 season that inundated all
subpopulations well beyond their previous boundaries, and thus all of the plots. Although I
did not have plot-specific flooding data for 2009, since that flood subsided in late Jan 2009, I
assigned a value of 100 weeks since flooding at the first repeated measure for all plots that
did not flood in 2011. Data for the 2011 season were analyzed using linear mixed model
ANOVAs with repeated measures (Table 3.4). The starting model included all independent
single factors as fixed effects. All models used site (block) as a random effect, with variance
components covariance structure. Restricted maximum likelihood was used to estimate the
best covariance structure for random effects, followed by maximum likelihood to test fixed
effects. Since all flooding variables were calculated from the same data, they were removed
from the model one at a time by highest P value, unless significant. I then used a top-down
strategy for model selection (West et al., 2007) within two-way interactions of interest. Two-
way interactions with time were introduced then removed from the model one at a time by
highest P value, unless significant, followed by two-way interactions with maximum
flooding depth and two-way interactions with time since flooding, each reduced in the same
manner. The best fitting model was selected using the Akaike Information Criterion
corrected for small sample size (AICc), and these models were used to determine significant
differences (P< 0.05) for fixed effects (Table 3.5). All statistical analyses were run in SAS
using the Mixed Procedure (SAS Institute, 2006).
Results
Associated species at Lualualei (2009-2011)
There were 32 associated species recorded within the Lualualei survey plots over the
three years of this study (Table 3.3). These included 15 flowering plant families, a green alga
(Chlorophyta, Cladophoraceae), and a slime mold (Amoebozoa, Physaridae). Seventeen of
the species (53%) were found within the plots in all three years of the study. All angiosperm
species were non-native, and six (19%) are considered invasive species according to the
Hawai‘i Department of Agriculture or the Hawai‘i-Pacific Weed Risk Assessment (Table
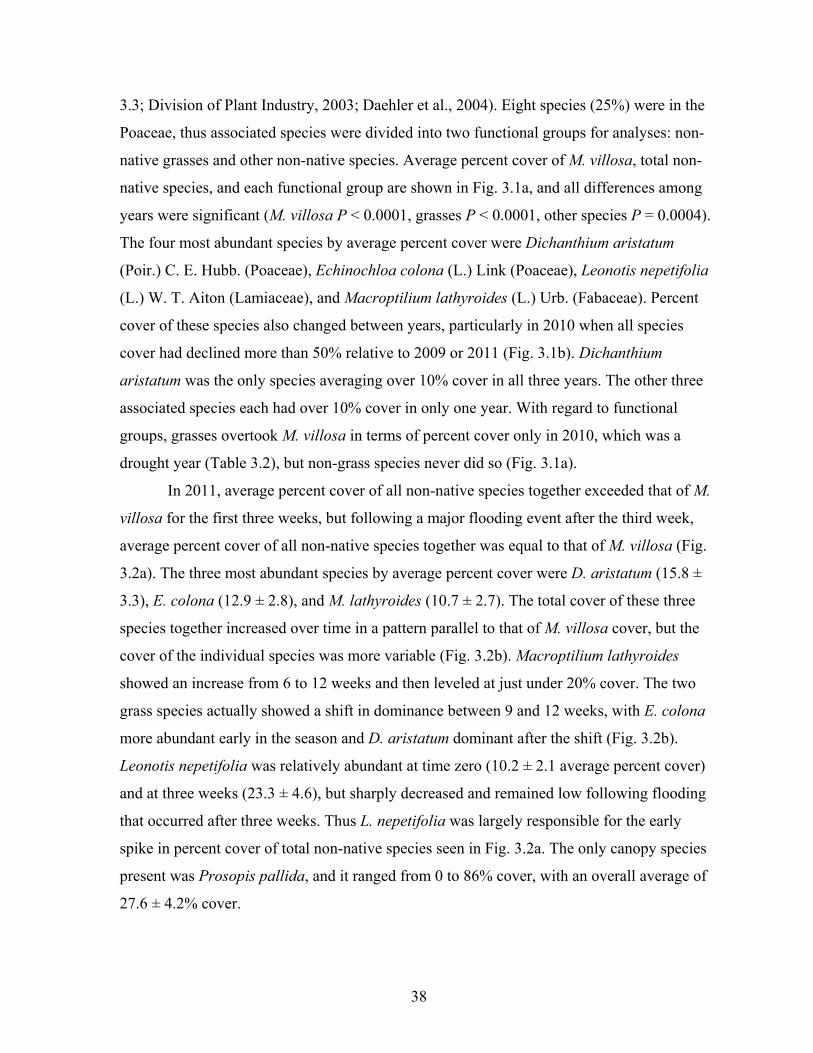
38
3.3; Division of Plant Industry, 2003; Daehler et al., 2004). Eight species (25%) were in the
Poaceae, thus associated species were divided into two functional groups for analyses: non-
native grasses and other non-native species. Average percent cover of M. villosa, total non-
native species, and each functional group are shown in Fig. 3.1a, and all differences among
years were significant (M. villosa P < 0.0001, grasses P < 0.0001, other species P = 0.0004).
The four most abundant species by average percent cover were Dichanthium aristatum
(Poir.) C. E. Hubb. (Poaceae), Echinochloa colona (L.) Link (Poaceae), Leonotis nepetifolia
(L.) W. T. Aiton (Lamiaceae), and Macroptilium lathyroides (L.) Urb. (Fabaceae). Percent
cover of these species also changed between years, particularly in 2010 when all species
cover had declined more than 50% relative to 2009 or 2011 (Fig. 3.1b). Dichanthium
aristatum was the only species averaging over 10% cover in all three years. The other three
associated species each had over 10% cover in only one year. With regard to functional
groups, grasses overtook M. villosa in terms of percent cover only in 2010, which was a
drought year (Table 3.2), but non-grass species never did so (Fig. 3.1a).
In 2011, average percent cover of all non-native species together exceeded that of M.
villosa for the first three weeks, but following a major flooding event after the third week,
average percent cover of all non-native species together was equal to that of M. villosa (Fig.
3.2a). The three most abundant species by average percent cover were D. aristatum (15.8 ±
3.3), E. colona (12.9 ± 2.8), and M. lathyroides (10.7 ± 2.7). The total cover of these three
species together increased over time in a pattern parallel to that of M. villosa cover, but the
cover of the individual species was more variable (Fig. 3.2b). Macroptilium lathyroides
showed an increase from 6 to 12 weeks and then leveled at just under 20% cover. The two
grass species actually showed a shift in dominance between 9 and 12 weeks, with E. colona
more abundant early in the season and D. aristatum dominant after the shift (Fig. 3.2b).
Leonotis nepetifolia was relatively abundant at time zero (10.2 ± 2.1 average percent cover)
and at three weeks (23.3 ± 4.6), but sharply decreased and remained low following flooding
that occurred after three weeks. Thus L. nepetifolia was largely responsible for the early
spike in percent cover of total non-native species seen in Fig. 3.2a. The only canopy species
present was Prosopis pallida, and it ranged from 0 to 86% cover, with an overall average of
27.6 ± 4.2% cover.
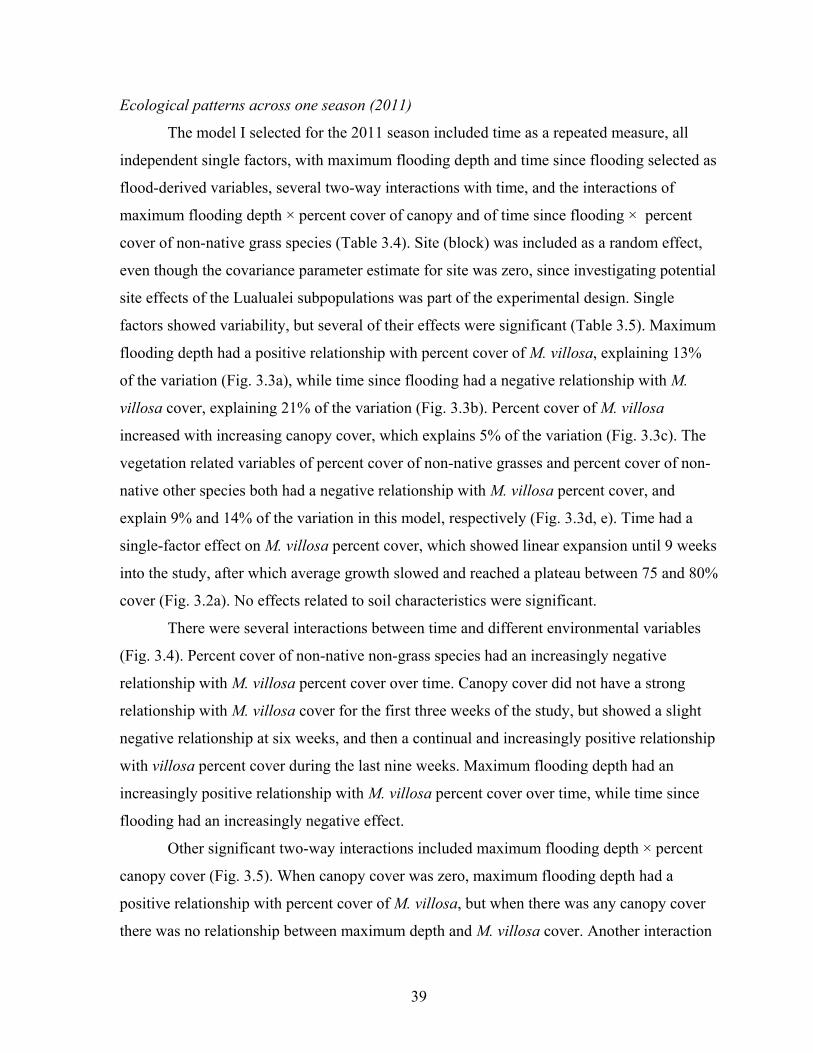
39
Ecological patterns across one season (2011)
The model I selected for the 2011 season included time as a repeated measure, all
independent single factors, with maximum flooding depth and time since flooding selected as
flood-derived variables, several two-way interactions with time, and the interactions of
maximum flooding depth × percent cover of canopy and of time since flooding × percent
cover of non-native grass species (Table 3.4). Site (block) was included as a random effect,
even though the covariance parameter estimate for site was zero, since investigating potential
site effects of the Lualualei subpopulations was part of the experimental design. Single
factors showed variability, but several of their effects were significant (Table 3.5). Maximum
flooding depth had a positive relationship with percent cover of M. villosa, explaining 13%
of the variation (Fig. 3.3a), while time since flooding had a negative relationship with M.
villosa cover, explaining 21% of the variation (Fig. 3.3b). Percent cover of M. villosa
increased with increasing canopy cover, which explains 5% of the variation (Fig. 3.3c). The
vegetation related variables of percent cover of non-native grasses and percent cover of non-
native other species both had a negative relationship with M. villosa percent cover, and
explain 9% and 14% of the variation in this model, respectively (Fig. 3.3d, e). Time had a
single-factor effect on M. villosa percent cover, which showed linear expansion until 9 weeks
into the study, after which average growth slowed and reached a plateau between 75 and 80%
cover (Fig. 3.2a). No effects related to soil characteristics were significant.
There were several interactions between time and different environmental variables
(Fig. 3.4). Percent cover of non-native non-grass species had an increasingly negative
relationship with M. villosa percent cover over time. Canopy cover did not have a strong
relationship with M. villosa cover for the first three weeks of the study, but showed a slight
negative relationship at six weeks, and then a continual and increasingly positive relationship
with villosa percent cover during the last nine weeks. Maximum flooding depth had an
increasingly positive relationship with M. villosa percent cover over time, while time since
flooding had an increasingly negative effect.
Other significant two-way interactions included maximum flooding depth × percent
canopy cover (Fig. 3.5). When canopy cover was zero, maximum flooding depth had a
positive relationship with percent cover of M. villosa, but when there was any canopy cover
there was no relationship between maximum depth and M. villosa cover. Another interaction
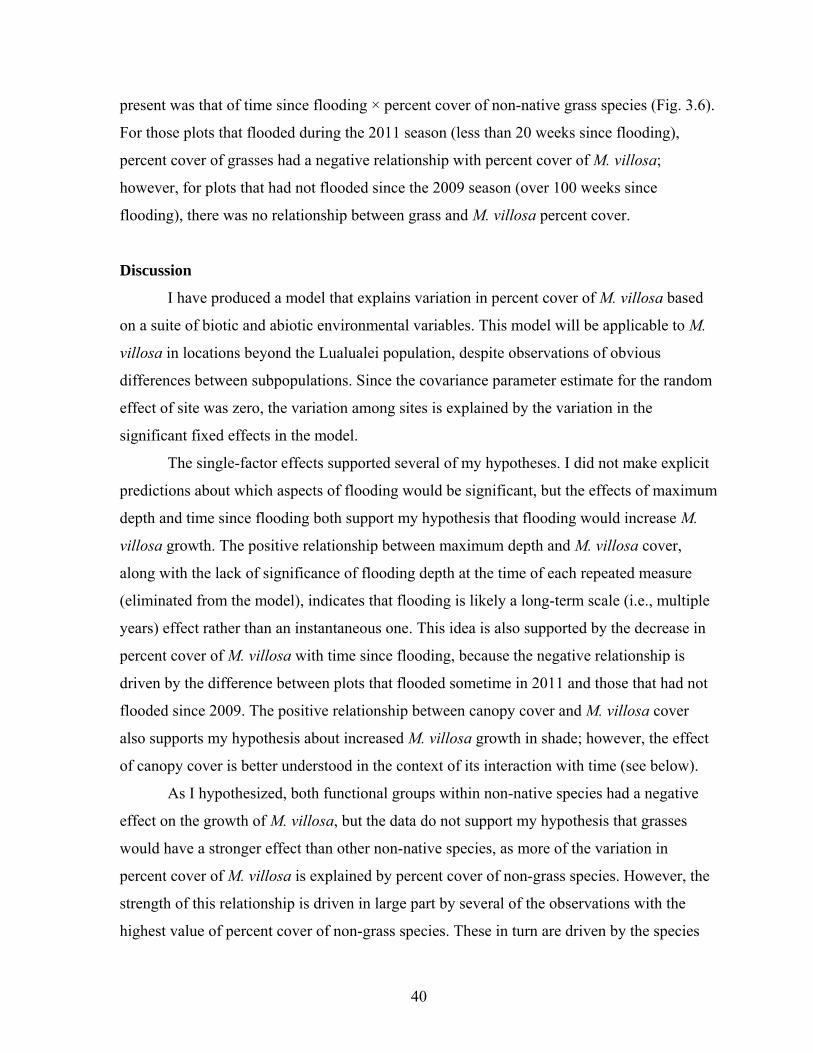
40
present was that of time since flooding × percent cover of non-native grass species (Fig. 3.6).
For those plots that flooded during the 2011 season (less than 20 weeks since flooding),
percent cover of grasses had a negative relationship with percent cover of M. villosa;
however, for plots that had not flooded since the 2009 season (over 100 weeks since
flooding), there was no relationship between grass and M. villosa percent cover.
Discussion
I have produced a model that explains variation in percent cover of M. villosa based
on a suite of biotic and abiotic environmental variables. This model will be applicable to M.
villosa in locations beyond the Lualualei population, despite observations of obvious
differences between subpopulations. Since the covariance parameter estimate for the random
effect of site was zero, the variation among sites is explained by the variation in the
significant fixed effects in the model.
The single-factor effects supported several of my hypotheses. I did not make explicit
predictions about which aspects of flooding would be significant, but the effects of maximum
depth and time since flooding both support my hypothesis that flooding would increase M.
villosa growth. The positive relationship between maximum depth and M. villosa cover,
along with the lack of significance of flooding depth at the time of each repeated measure
(eliminated from the model), indicates that flooding is likely a long-term scale (i.e., multiple
years) effect rather than an instantaneous one. This idea is also supported by the decrease in
percent cover of M. villosa with time since flooding, because the negative relationship is
driven by the difference between plots that flooded sometime in 2011 and those that had not
flooded since 2009. The positive relationship between canopy cover and M. villosa cover
also supports my hypothesis about increased M. villosa growth in shade; however, the effect
of canopy cover is better understood in the context of its interaction with time (see below).
As I hypothesized, both functional groups within non-native species had a negative
effect on the growth of M. villosa, but the data do not support my hypothesis that grasses
would have a stronger effect than other non-native species, as more of the variation in
percent cover of M. villosa is explained by percent cover of non-grass species. However, the
strength of this relationship is driven in large part by several of the observations with the
highest value of percent cover of non-grass species. These in turn are driven by the species
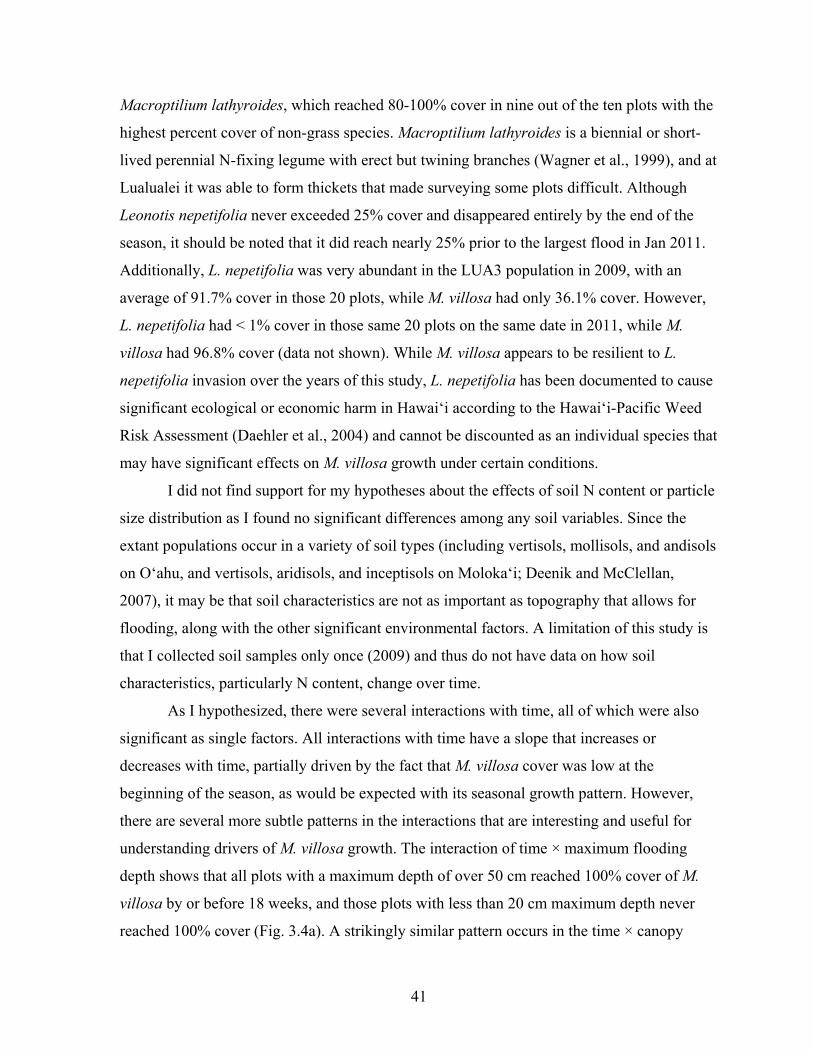
41
Macroptilium lathyroides, which reached 80-100% cover in nine out of the ten plots with the
highest percent cover of non-grass species. Macroptilium lathyroides is a biennial or short-
lived perennial N-fixing legume with erect but twining branches (Wagner et al., 1999), and at
Lualualei it was able to form thickets that made surveying some plots difficult. Although
Leonotis nepetifolia never exceeded 25% cover and disappeared entirely by the end of the
season, it should be noted that it did reach nearly 25% prior to the largest flood in Jan 2011.
Additionally, L. nepetifolia was very abundant in the LUA3 population in 2009, with an
average of 91.7% cover in those 20 plots, while M. villosa had only 36.1% cover. However,
L. nepetifolia had < 1% cover in those same 20 plots on the same date in 2011, while M.
villosa had 96.8% cover (data not shown). While M. villosa appears to be resilient to L.
nepetifolia invasion over the years of this study, L. nepetifolia has been documented to cause
significant ecological or economic harm in Hawai‘i according to the Hawai‘i-Pacific Weed
Risk Assessment (Daehler et al., 2004) and cannot be discounted as an individual species that
may have significant effects on M. villosa growth under certain conditions.
I did not find support for my hypotheses about the effects of soil N content or particle
size distribution as I found no significant differences among any soil variables. Since the
extant populations occur in a variety of soil types (including vertisols, mollisols, and andisols
on O‘ahu, and vertisols, aridisols, and inceptisols on Moloka‘i; Deenik and McClellan,
2007), it may be that soil characteristics are not as important as topography that allows for
flooding, along with the other significant environmental factors. A limitation of this study is
that I collected soil samples only once (2009) and thus do not have data on how soil
characteristics, particularly N content, change over time.
As I hypothesized, there were several interactions with time, all of which were also
significant as single factors. All interactions with time have a slope that increases or
decreases with time, partially driven by the fact that M. villosa cover was low at the
beginning of the season, as would be expected with its seasonal growth pattern. However,
there are several more subtle patterns in the interactions that are interesting and useful for
understanding drivers of M. villosa growth. The interaction of time × maximum flooding
depth shows that all plots with a maximum depth of over 50 cm reached 100% cover of M.
villosa by or before 18 weeks, and those plots with less than 20 cm maximum depth never
reached 100% cover (Fig. 3.4a). A strikingly similar pattern occurs in the time × canopy
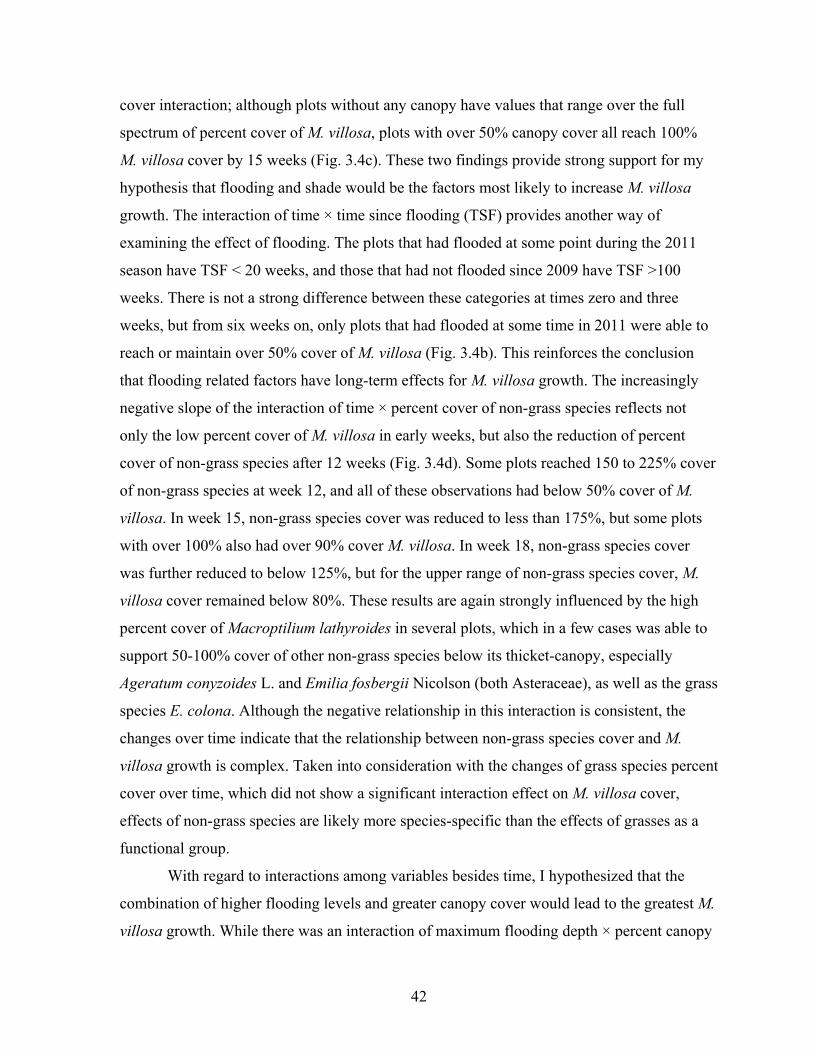
42
cover interaction; although plots without any canopy have values that range over the full
spectrum of percent cover of M. villosa, plots with over 50% canopy cover all reach 100%
M. villosa cover by 15 weeks (Fig. 3.4c). These two findings provide strong support for my
hypothesis that flooding and shade would be the factors most likely to increase M. villosa
growth. The interaction of time × time since flooding (TSF) provides another way of
examining the effect of flooding. The plots that had flooded at some point during the 2011
season have TSF < 20 weeks, and those that had not flooded since 2009 have TSF >100
weeks. There is not a strong difference between these categories at times zero and three
weeks, but from six weeks on, only plots that had flooded at some time in 2011 were able to
reach or maintain over 50% cover of M. villosa (Fig. 3.4b). This reinforces the conclusion
that flooding related factors have long-term effects for M. villosa growth. The increasingly
negative slope of the interaction of time × percent cover of non-grass species reflects not
only the low percent cover of M. villosa in early weeks, but also the reduction of percent
cover of non-grass species after 12 weeks (Fig. 3.4d). Some plots reached 150 to 225% cover
of non-grass species at week 12, and all of these observations had below 50% cover of M.
villosa. In week 15, non-grass species cover was reduced to less than 175%, but some plots
with over 100% also had over 90% cover M. villosa. In week 18, non-grass species cover
was further reduced to below 125%, but for the upper range of non-grass species cover, M.
villosa cover remained below 80%. These results are again strongly influenced by the high
percent cover of Macroptilium lathyroides in several plots, which in a few cases was able to
support 50-100% cover of other non-grass species below its thicket-canopy, especially
Ageratum conyzoides L. and Emilia fosbergii Nicolson (both Asteraceae), as well as the grass
species E. colona. Although the negative relationship in this interaction is consistent, the
changes over time indicate that the relationship between non-grass species cover and M.
villosa growth is complex. Taken into consideration with the changes of grass species percent
cover over time, which did not show a significant interaction effect on M. villosa cover,
effects of non-grass species are likely more species-specific than the effects of grasses as a
functional group.
With regard to interactions among variables besides time, I hypothesized that the
combination of higher flooding levels and greater canopy cover would lead to the greatest M.
villosa growth. While there was an interaction of maximum flooding depth × percent canopy
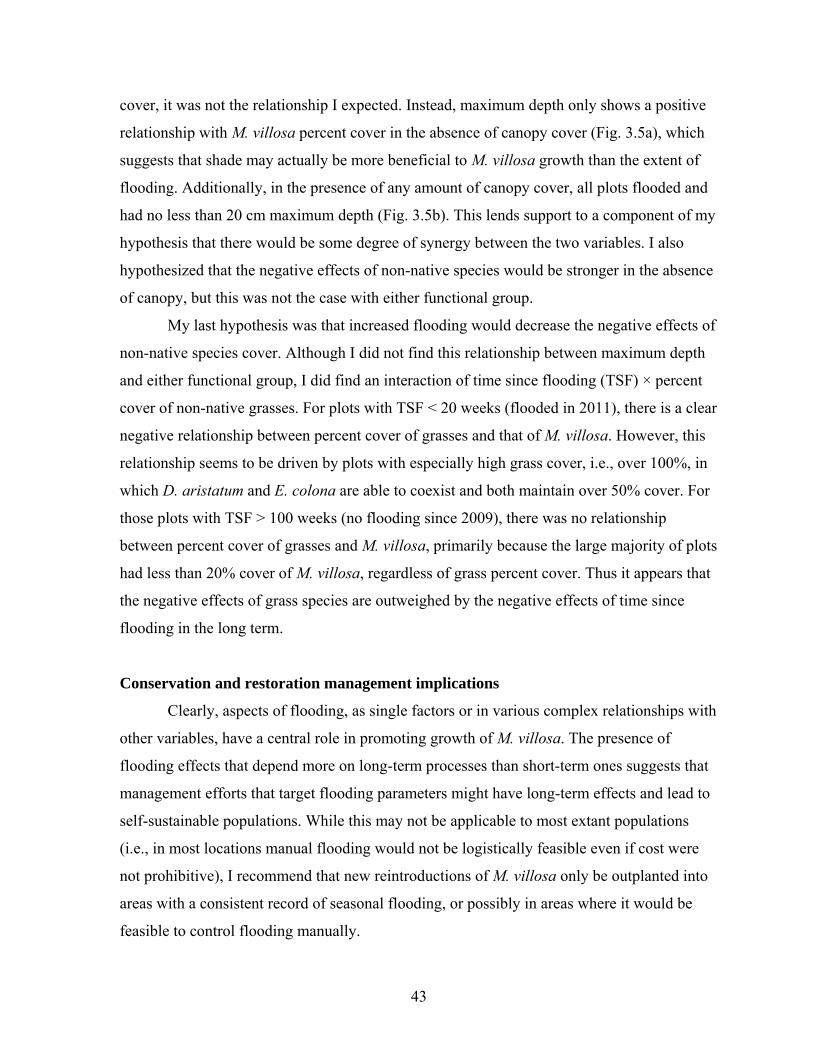
43
cover, it was not the relationship I expected. Instead, maximum depth only shows a positive
relationship with M. villosa percent cover in the absence of canopy cover (Fig. 3.5a), which
suggests that shade may actually be more beneficial to M. villosa growth than the extent of
flooding. Additionally, in the presence of any amount of canopy cover, all plots flooded and
had no less than 20 cm maximum depth (Fig. 3.5b). This lends support to a component of my
hypothesis that there would be some degree of synergy between the two variables. I also
hypothesized that the negative effects of non-native species would be stronger in the absence
of canopy, but this was not the case with either functional group.
My last hypothesis was that increased flooding would decrease the negative effects of
non-native species cover. Although I did not find this relationship between maximum depth
and either functional group, I did find an interaction of time since flooding (TSF) × percent
cover of non-native grasses. For plots with TSF < 20 weeks (flooded in 2011), there is a clear
negative relationship between percent cover of grasses and that of M. villosa. However, this
relationship seems to be driven by plots with especially high grass cover, i.e., over 100%, in
which D. aristatum and E. colona are able to coexist and both maintain over 50% cover. For
those plots with TSF > 100 weeks (no flooding since 2009), there was no relationship
between percent cover of grasses and M. villosa, primarily because the large majority of plots
had less than 20% cover of M. villosa, regardless of grass percent cover. Thus it appears that
the negative effects of grass species are outweighed by the negative effects of time since
flooding in the long term.
Conservation and restoration management implications
Clearly, aspects of flooding, as single factors or in various complex relationships with
other variables, have a central role in promoting growth of M. villosa. The presence of
flooding effects that depend more on long-term processes than short-term ones suggests that
management efforts that target flooding parameters might have long-term effects and lead to
self-sustainable populations. While this may not be applicable to most extant populations
(i.e., in most locations manual flooding would not be logistically feasible even if cost were
not prohibitive), I recommend that new reintroductions of M. villosa only be outplanted into
areas with a consistent record of seasonal flooding, or possibly in areas where it would be
feasible to control flooding manually.
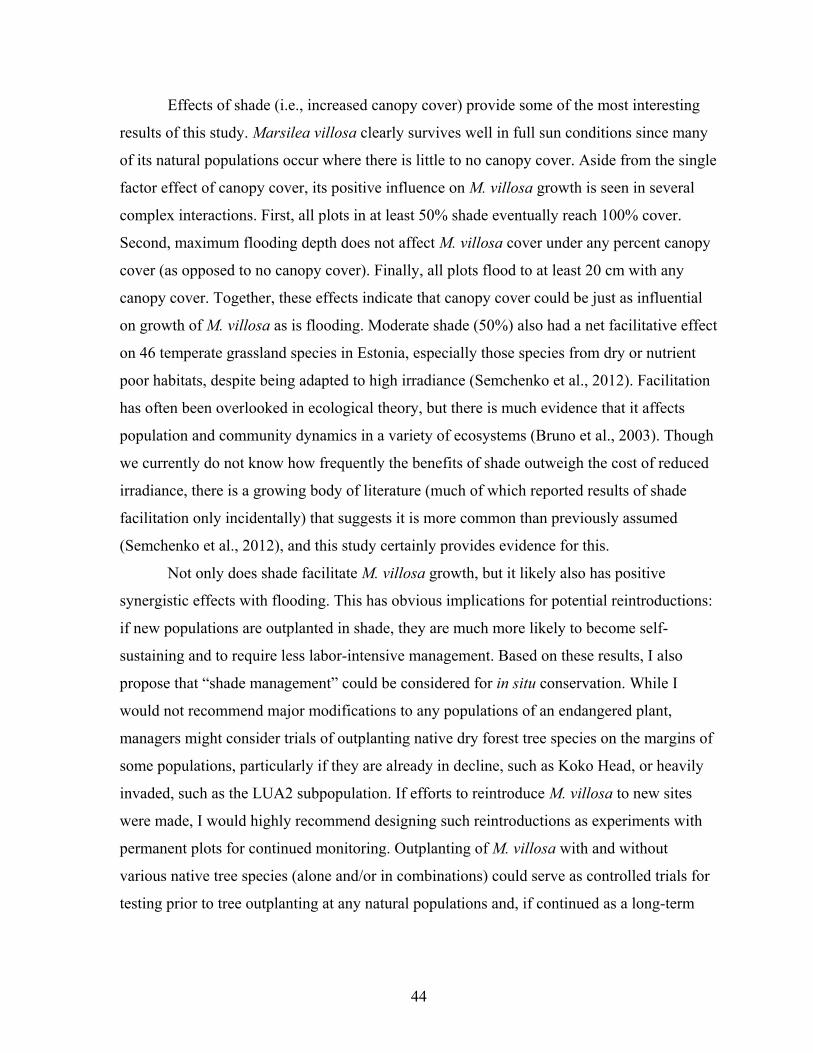
44
Effects of shade (i.e., increased canopy cover) provide some of the most interesting
results of this study. Marsilea villosa clearly survives well in full sun conditions since many
of its natural populations occur where there is little to no canopy cover. Aside from the single
factor effect of canopy cover, its positive influence on M. villosa growth is seen in several
complex interactions. First, all plots in at least 50% shade eventually reach 100% cover.
Second, maximum flooding depth does not affect M. villosa cover under any percent canopy
cover (as opposed to no canopy cover). Finally, all plots flood to at least 20 cm with any
canopy cover. Together, these effects indicate that canopy cover could be just as influential
on growth of M. villosa as is flooding. Moderate shade (50%) also had a net facilitative effect
on 46 temperate grassland species in Estonia, especially those species from dry or nutrient
poor habitats, despite being adapted to high irradiance (Semchenko et al., 2012). Facilitation
has often been overlooked in ecological theory, but there is much evidence that it affects
population and community dynamics in a variety of ecosystems (Bruno et al., 2003). Though
we currently do not know how frequently the benefits of shade outweigh the cost of reduced
irradiance, there is a growing body of literature (much of which reported results of shade
facilitation only incidentally) that suggests it is more common than previously assumed
(Semchenko et al., 2012), and this study certainly provides evidence for this.
Not only does shade facilitate M. villosa growth, but it likely also has positive
synergistic effects with flooding. This has obvious implications for potential reintroductions:
if new populations are outplanted in shade, they are much more likely to become self-
sustaining and to require less labor-intensive management. Based on these results, I also
propose that “shade management” could be considered for in situ conservation. While I
would not recommend major modifications to any populations of an endangered plant,
managers might consider trials of outplanting native dry forest tree species on the margins of
some populations, particularly if they are already in decline, such as Koko Head, or heavily
invaded, such as the LUA2 subpopulation. If efforts to reintroduce M. villosa to new sites
were made, I would highly recommend designing such reintroductions as experiments with
permanent plots for continued monitoring. Outplanting of M. villosa with and without
various native tree species (alone and/or in combinations) could serve as controlled trials for
testing prior to tree outplanting at any natural populations and, if continued as a long-term
45
experiment, would be a valuable contribution to the science and practice of ecological
restoration.
Non-native grass species tended to behave as a true functional group at Lualualei,
with the possible interchange of one dominant species for another over time, which could
simplify weed management efforts. However, as a caveat, practitioners should not discount
the possibility of grass species that are exceptionally problematic. Although Megathyrsus
maximus (Jacq.) B. K. Simon & S. W. L. Jacobs was present at Lualualei in only a few plots
with low percent cover, this species is considered a noxious weed and also occurs at Koko
Head where it is more of a threat to the M. villosa population, perhaps due to the absence of
deep flooding for nearly 20 years (Wester et al. 2006). Another caveat is that grasses at
Lualualei were already under minimal weed management, i.e., the mowing of subpopulations
LUA1 and LUA2 during the M. villosa dormant season. However, although I did not
explicitly compare sites in my model (since I considered site a random effect), it is worth
noting the following: LUA3, which was never mowed but had the highest average canopy
cover, maximum flooding depth, and flooding duration, also had the lowest average percent
cover of non-native grasses and reached 100% cover of M. villosa by the end of this study.
Since effects of non-grass species cover on M. villosa growth were more species-
specific than those of grasses, more attention should be given to the monitoring of non-grass
forbs at the species or genus level rather than as a functional group. The relationship of non-
grass species cover was driven in large part by Macroptilium lathyroides, which had an
increased negative effect toward the end of the season despite decreases in overall non-grass
species cover. Leonotis nepetifolia also showed potential as a species abundant enough to
affect M. villosa growth. However, M. lathyroides has a biennial or perennial habit, whereas
L. nepetifolia is an annual (Gill & Conway, 1979), which may explain why the former has a
greater advantage than the latter in an ephemerally flooding habitat. Therefore, I recommend
M. lathyroides as a target weed species for early control if it should appear within M. villosa
populations, and the same for L. nepetifolia if resources allow; if not, L. nepetifolia should be
carefully monitored. If target species are removed, M. villosa populations should continue to
be monitored for any invasive species that may become more abundant in the absence of
targeted species.
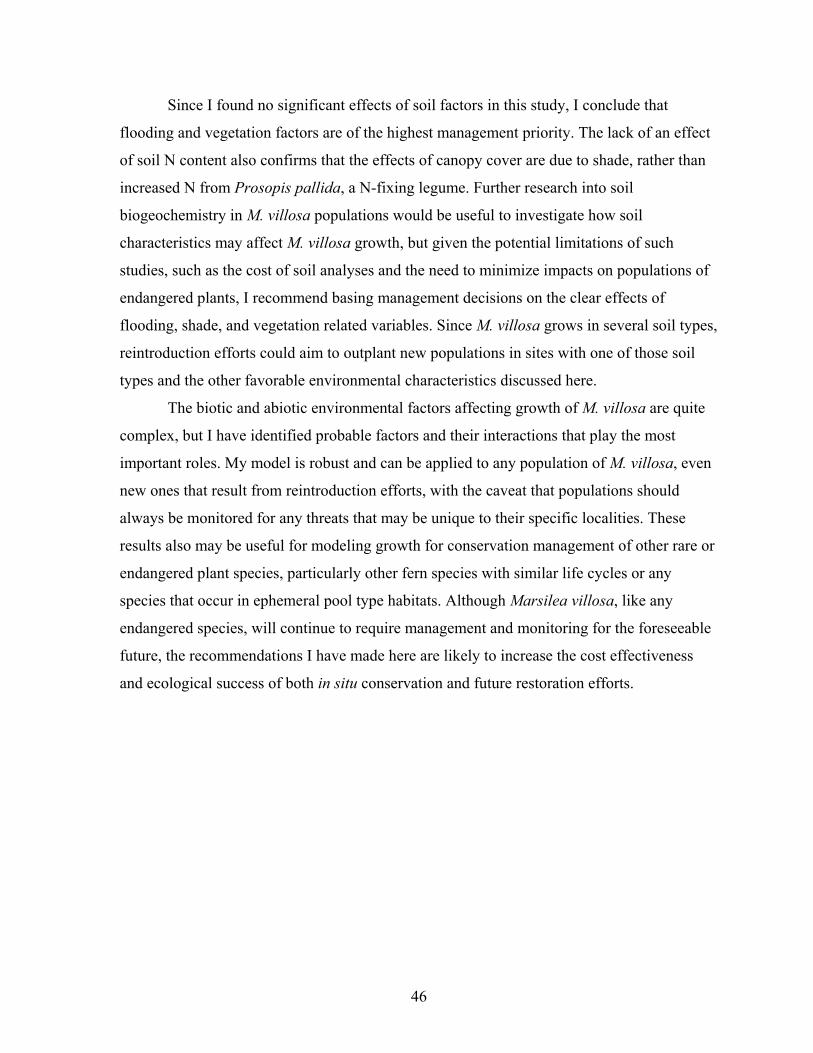
46
Since I found no significant effects of soil factors in this study, I conclude that
flooding and vegetation factors are of the highest management priority. The lack of an effect
of soil N content also confirms that the effects of canopy cover are due to shade, rather than
increased N from Prosopis pallida, a N-fixing legume. Further research into soil
biogeochemistry in M. villosa populations would be useful to investigate how soil
characteristics may affect M. villosa growth, but given the potential limitations of such
studies, such as the cost of soil analyses and the need to minimize impacts on populations of
endangered plants, I recommend basing management decisions on the clear effects of
flooding, shade, and vegetation related variables. Since M. villosa grows in several soil types,
reintroduction efforts could aim to outplant new populations in sites with one of those soil
types and the other favorable environmental characteristics discussed here.
The biotic and abiotic environmental factors affecting growth of M. villosa are quite
complex, but I have identified probable factors and their interactions that play the most
important roles. My model is robust and can be applied to any population of M. villosa, even
new ones that result from reintroduction efforts, with the caveat that populations should
always be monitored for any threats that may be unique to their specific localities. These
results also may be useful for modeling growth for conservation management of other rare or
endangered plant species, particularly other fern species with similar life cycles or any
species that occur in ephemeral pool type habitats. Although Marsilea villosa, like any
endangered species, will continue to require management and monitoring for the foreseeable
future, the recommendations I have made here are likely to increase the cost effectiveness
and ecological success of both in situ conservation and future restoration efforts.

47
TABLES
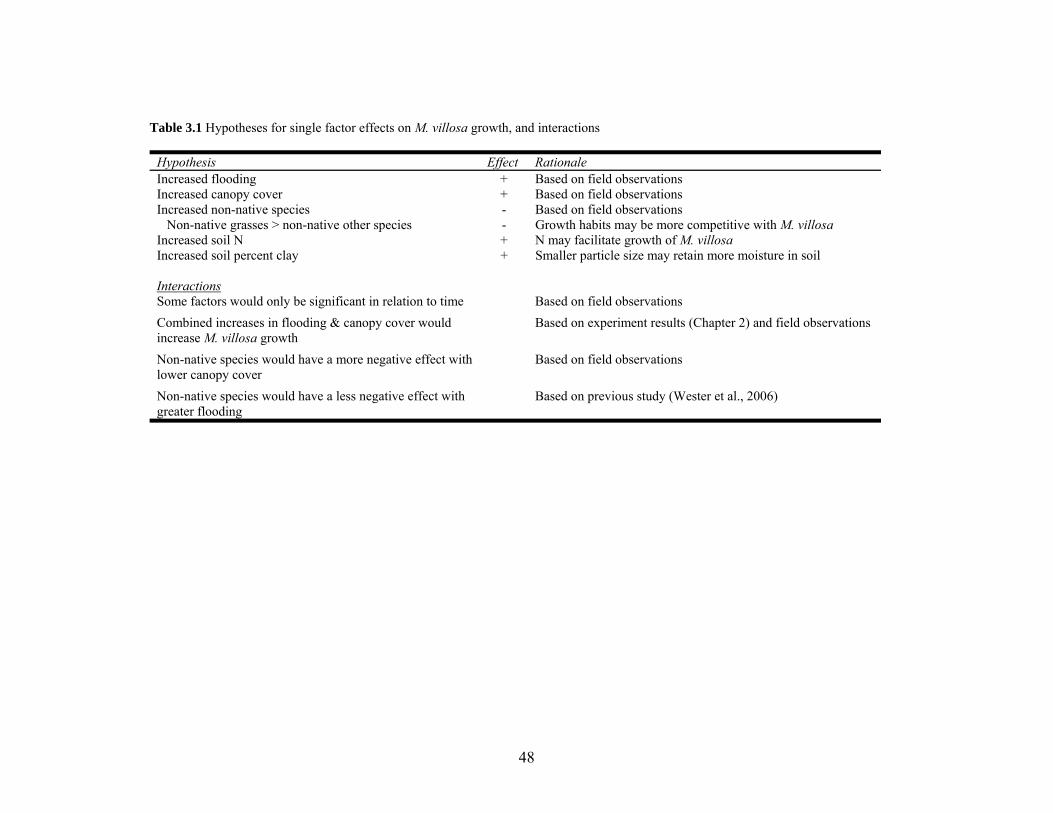
48
Table 3.1 Hypotheses for single factor effects on M. villosa growth, and interactions
Hypothesis Effect Rationale Increased flooding + Based on field observations Increased canopy cover + Based on field observations Increased non-native species - Based on field observations Non-native grasses > non-native other species - Growth habits may be more competitive with M. villosa Increased soil N + N may facilitate growth of M. villosa Increased soil percent clay + Smaller particle size may retain more moisture in soil Interactions Some factors would only be significant in relation to time Based on field observations
Combined increases in flooding & canopy cover would increase M. villosa growth
Based on experiment results (Chapter 2) and field observations
Non-native species would have a more negative effect with lower canopy cover
Based on field observations
Non-native species would have a less negative effect with greater flooding
Based on previous study (Wester et al., 2006)
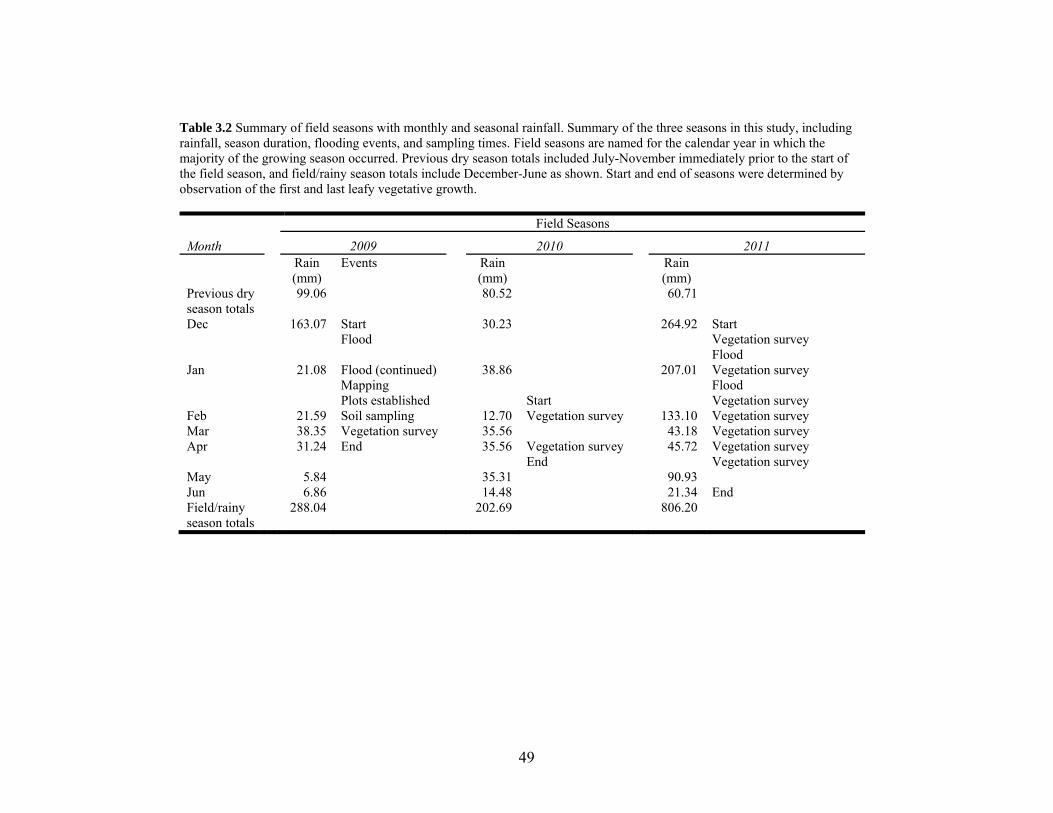
49
Table 3.2 Summary of field seasons with monthly and seasonal rainfall. Summary of the three seasons in this study, including rainfall, season duration, flooding events, and sampling times. Field seasons are named for the calendar year in which the majority of the growing season occurred. Previous dry season totals included July-November immediately prior to the start of the field season, and field/rainy season totals include December-June as shown. Start and end of seasons were determined by observation of the first and last leafy vegetative growth.
Field Seasons
Month 2009 2010 2011 Rain
(mm) Events Rain
(mm) Rain
(mm)
Previous dry season totals
99.06 80.52 60.71
Dec 163.07 Start Flood
30.23 264.92 Start Vegetation survey Flood
Jan 21.08 Flood (continued) Mapping Plots established
38.86 Start
207.01 Vegetation survey Flood Vegetation survey
Feb 21.59 Soil sampling 12.70 Vegetation survey 133.10 Vegetation survey Mar 38.35 Vegetation survey 35.56 43.18 Vegetation survey Apr 31.24 End 35.56 Vegetation survey
End 45.72 Vegetation survey
Vegetation survey May 5.84 35.31 90.93 Jun 6.86 14.48 21.34 End Field/rainy season totals
288.04 202.69 806.20
50
Table 3.3 Associated species present within Lualualei survey plots. No associated species were native to Hawai'i. Invasive species were so designated by either the Hawai'i Department of Agriculture or the Hawai'i-Pacific Weed Risk Assessment.
Family Genus/species 2009 2010 2011 Invasive Asteraceae Ageratina sp. x x Asteraceae Ageratum conyzoides x x Asteraceae Emilia fosbergii x x x Asteraceae Lactuca serriola x x x Asteraceae Sonchus oleraceus x x x Boraginaceae Heliotropium currasavacum x x Chenopdiaceae Atriplex suberecta x x Commelinaceae Tradescantia sp. x x x Convolvulaceae Ipomoea sp. x x Cucurbitaceae Coccinea grandis x x Cyperaceae Cyperus rotundus x x x Euphorbiaceae Chamaesyce hypericifolia x x x Fabaceae Desmanthus virgatus x x x x Fabaceae Macroptilium lathyroides x x x Fabaceae Prosopis pallida x x x Lamiaceae Hyptis suavolens x x Lamiaceae Leonotis nepetifolia x x x x Malvaceae Sida acuta x x Malvaceae Sida ciliaris x Phylanthaceae Phyllanthus debilis x x x Poaceae Cenchrus ciliaris x x x Poaceae Chloris barbata x x x Poaceae Dichanthium aristatum x x x Poaceae Digitaria sp. x x Poaceae Echinochloa colona x x x Poaceae Eragrostis amabilis x Poaceae Megathyrsus maximus x x x Poaceae Setaria verticillata x x x Portulacaceae Portulaca sp. x x Solanaceae Solanum lycopersicum x x x Chlorophyta/Cladophoraceae Pithophora sp. x Amoebozoa/Physaridae Physarum sp. x
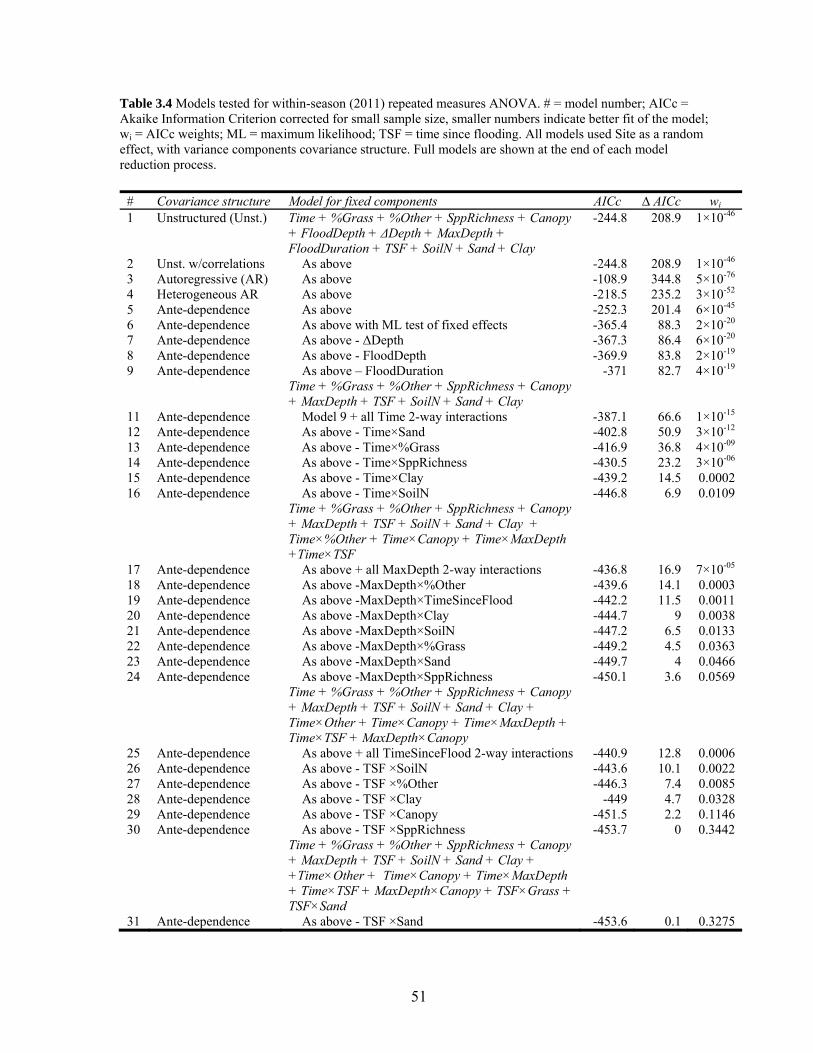
51
Table 3.4 Models tested for within-season (2011) repeated measures ANOVA. # = model number; AICc = Akaike Information Criterion corrected for small sample size, smaller numbers indicate better fit of the model; wi = AICc weights; ML = maximum likelihood; TSF = time since flooding. All models used Site as a random effect, with variance components covariance structure. Full models are shown at the end of each model reduction process.
# Covariance structure Model for fixed components AICc ∆ AICc wi 1 Unstructured (Unst.) Time + %Grass + %Other + SppRichness + Canopy
+ FloodDepth + ΔDepth + MaxDepth + FloodDuration + TSF + SoilN + Sand + Clay
-244.8 208.9 1×10-46
2 Unst. w/correlations As above -244.8 208.9 1×10-46 3 Autoregressive (AR) As above -108.9 344.8 5×10-76 4 Heterogeneous AR As above -218.5 235.2 3×10-52 5 Ante-dependence As above -252.3 201.4 6×10-45 6 Ante-dependence As above with ML test of fixed effects -365.4 88.3 2×10-20 7 Ante-dependence As above - ΔDepth -367.3 86.4 6×10-20 8 Ante-dependence As above - FloodDepth -369.9 83.8 2×10-19 9 Ante-dependence As above – FloodDuration
Time + %Grass + %Other + SppRichness + Canopy + MaxDepth + TSF + SoilN + Sand + Clay
-371 82.7 4×10-19
11 Ante-dependence Model 9 + all Time 2-way interactions -387.1 66.6 1×10-15 12 Ante-dependence As above - Time×Sand -402.8 50.9 3×10-12 13 Ante-dependence As above - Time×%Grass -416.9 36.8 4×10-09 14 Ante-dependence As above - Time×SppRichness -430.5 23.2 3×10-06 15 Ante-dependence As above - Time×Clay -439.2 14.5 0.0002 16 Ante-dependence As above - Time×SoilN
Time + %Grass + %Other + SppRichness + Canopy + MaxDepth + TSF + SoilN + Sand + Clay + Time×%Other + Time×Canopy + Time×MaxDepth +Time×TSF
-446.8 6.9 0.0109
17 Ante-dependence As above + all MaxDepth 2-way interactions -436.8 16.9 7×10-05 18 Ante-dependence As above -MaxDepth×%Other -439.6 14.1 0.0003 19 Ante-dependence As above -MaxDepth×TimeSinceFlood -442.2 11.5 0.0011 20 Ante-dependence As above -MaxDepth×Clay -444.7 9 0.0038 21 Ante-dependence As above -MaxDepth×SoilN -447.2 6.5 0.0133 22 Ante-dependence As above -MaxDepth×%Grass -449.2 4.5 0.0363 23 Ante-dependence As above -MaxDepth×Sand -449.7 4 0.0466 24 Ante-dependence As above -MaxDepth×SppRichness
Time + %Grass + %Other + SppRichness + Canopy + MaxDepth + TSF + SoilN + Sand + Clay + Time×Other + Time×Canopy + Time×MaxDepth + Time×TSF + MaxDepth×Canopy
-450.1 3.6 0.0569
25 Ante-dependence As above + all TimeSinceFlood 2-way interactions -440.9 12.8 0.0006 26 Ante-dependence As above - TSF ×SoilN -443.6 10.1 0.0022 27 Ante-dependence As above - TSF ×%Other -446.3 7.4 0.0085 28 Ante-dependence As above - TSF ×Clay -449 4.7 0.0328 29 Ante-dependence As above - TSF ×Canopy -451.5 2.2 0.1146 30 Ante-dependence As above - TSF ×SppRichness
Time + %Grass + %Other + SppRichness + Canopy + MaxDepth + TSF + SoilN + Sand + Clay + +Time×Other + Time×Canopy + Time×MaxDepth + Time×TSF + MaxDepth×Canopy + TSF×Grass + TSF×Sand
-453.7 0 0.3442
31 Ante-dependence As above - TSF ×Sand -453.6 0.1 0.3275
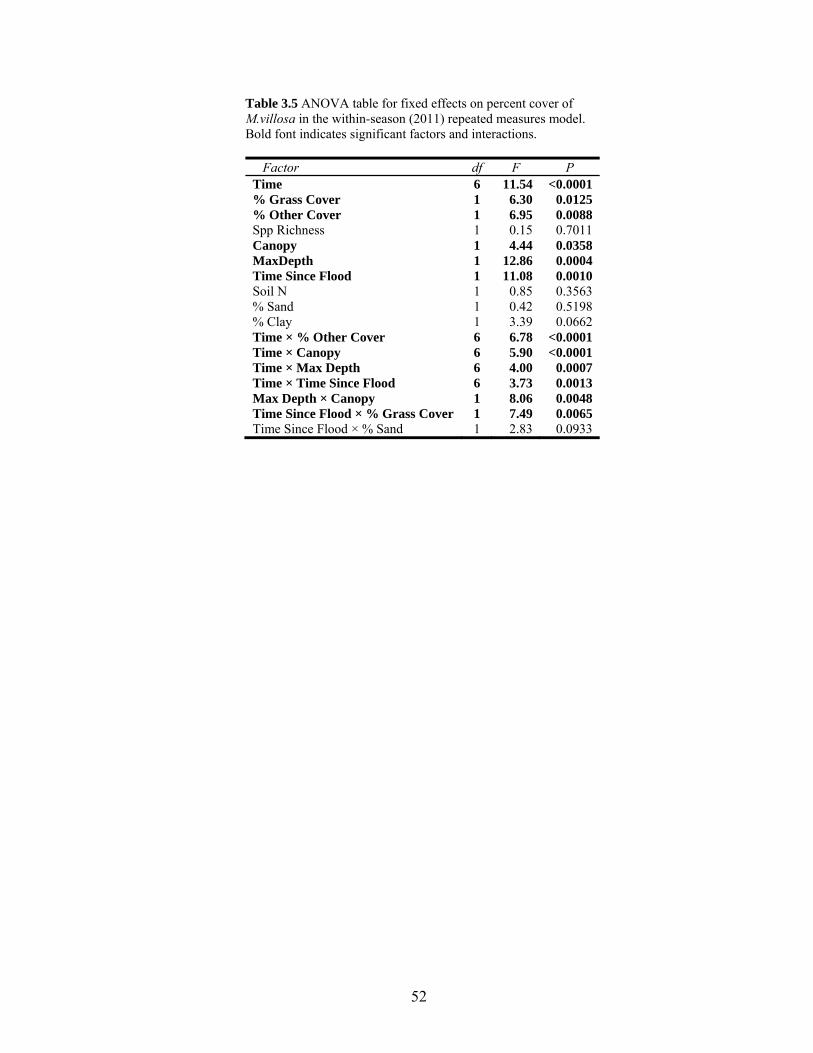
52
Table 3.5 ANOVA table for fixed effects on percent cover of M.villosa in the within-season (2011) repeated measures model. Bold font indicates significant factors and interactions.
Factor df F P Time 6 11.54 <0.0001 % Grass Cover 1 6.30 0.0125 % Other Cover 1 6.95 0.0088 Spp Richness 1 0.15 0.7011 Canopy 1 4.44 0.0358 MaxDepth 1 12.86 0.0004 Time Since Flood 1 11.08 0.0010 Soil N 1 0.85 0.3563 % Sand 1 0.42 0.5198 % Clay 1 3.39 0.0662 Time × % Other Cover 6 6.78 <0.0001 Time × Canopy 6 5.90 <0.0001 Time × Max Depth 6 4.00 0.0007 Time × Time Since Flood 6 3.73 0.0013 Max Depth × Canopy 1 8.06 0.0048 Time Since Flood × % Grass Cover 1 7.49 0.0065 Time Since Flood × % Sand 1 2.83 0.0933

53
FIGURES
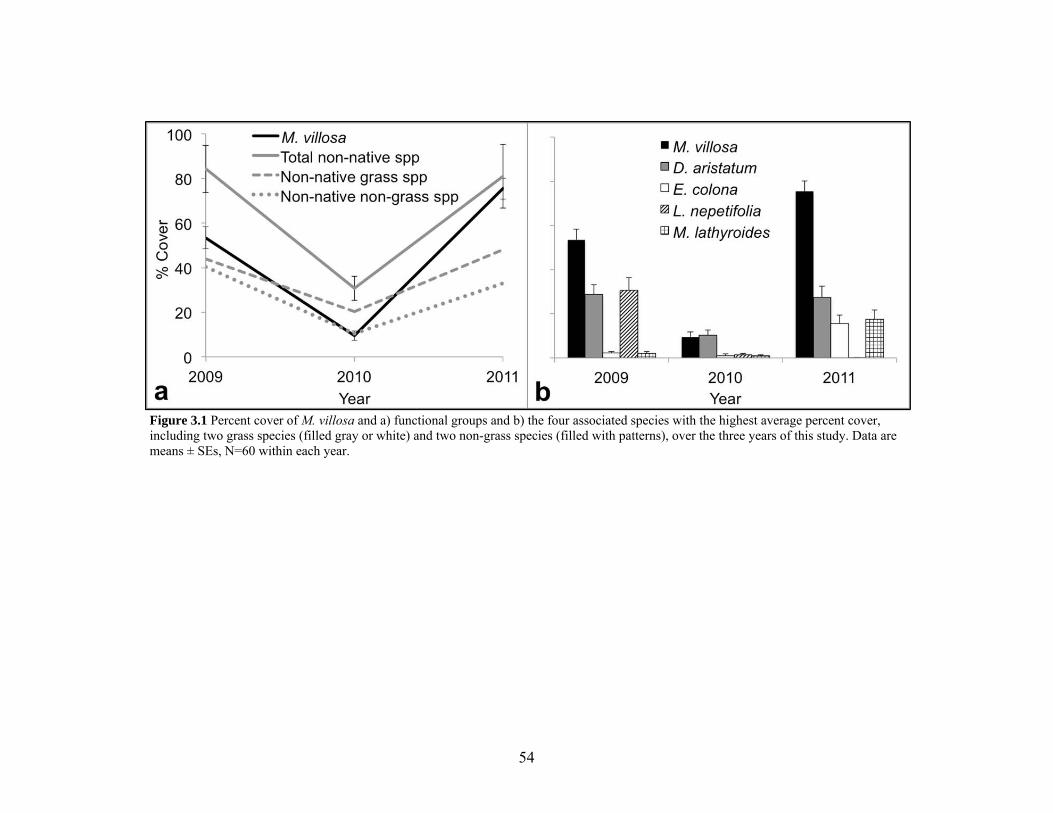
54
Figure 3.1 Percent cover of M. villosa and a) functional groups and b) the four associated species with the highest average percent cover, including two grass species (filled gray or white) and two non-grass species (filled with patterns), over the three years of this study. Data are means ± SEs, N=60 within each year.
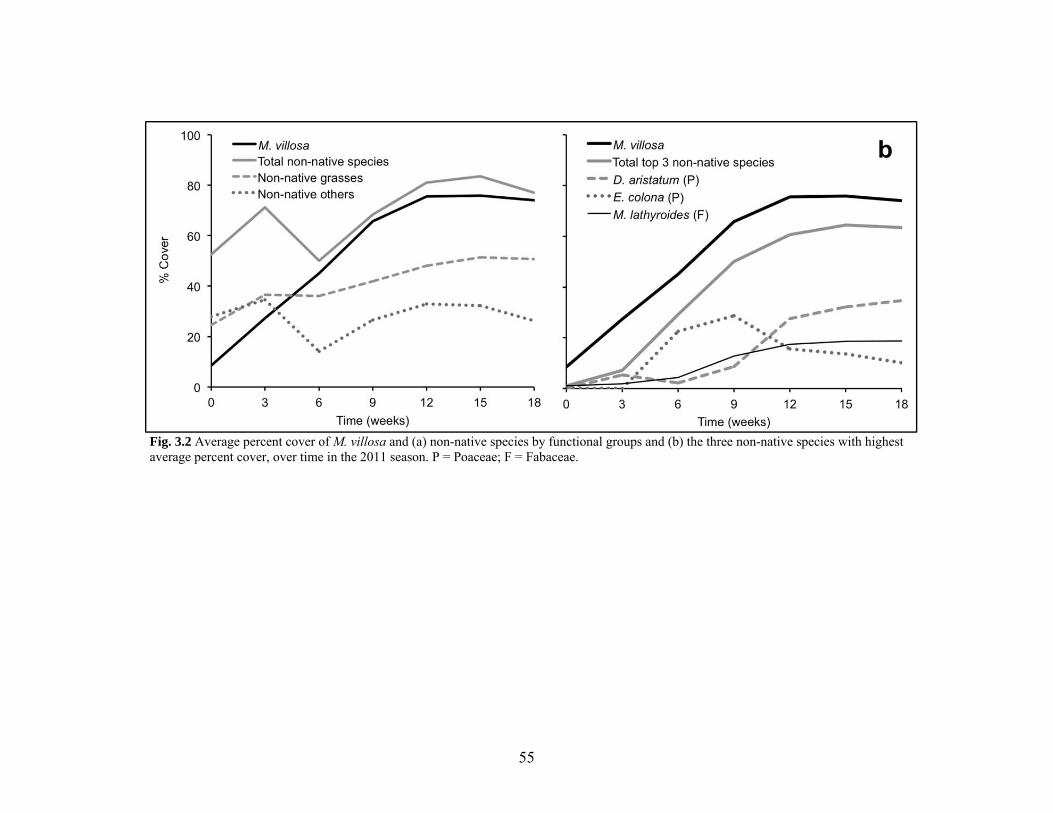
55
Fig. 3.2 Average percent cover of M. villosa and (a) non-native species by functional groups and (b) the three non-native species with highest average percent cover, over time in the 2011 season. P = Poaceae; F = Fabaceae.
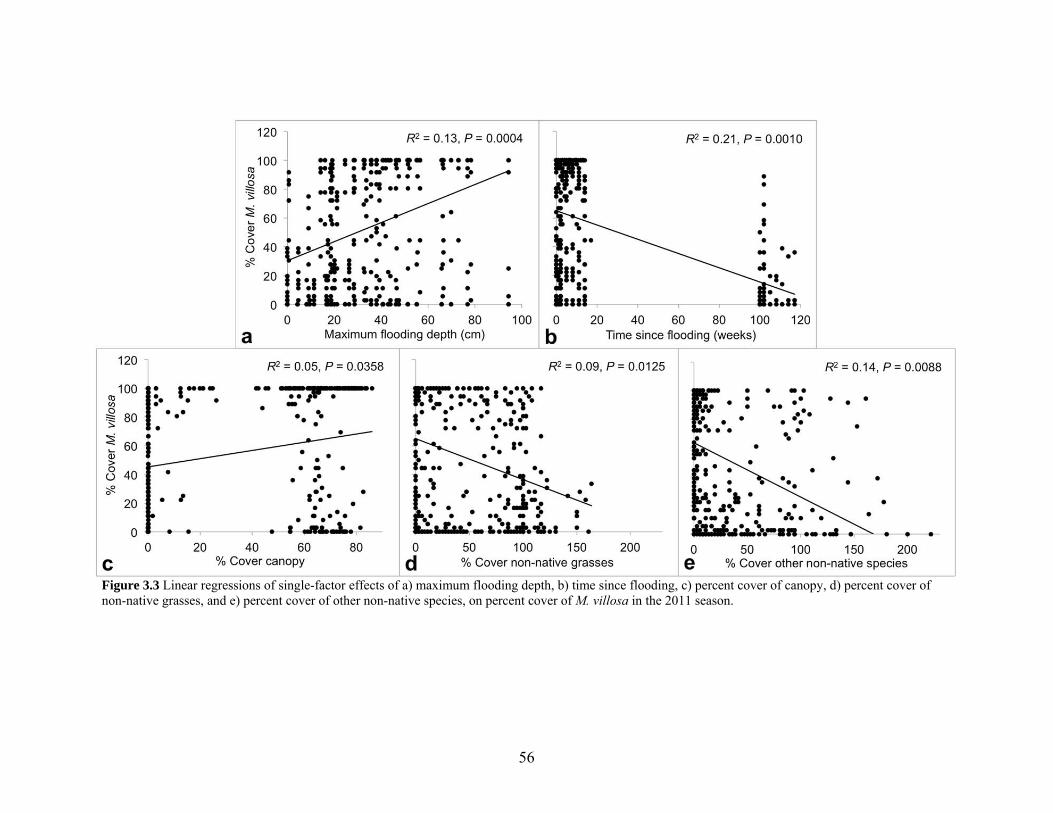
56
Figure 3.3 Linear regressions of single-factor effects of a) maximum flooding depth, b) time since flooding, c) percent cover of canopy, d) percent cover of non-native grasses, and e) percent cover of other non-native species, on percent cover of M. villosa in the 2011 season.
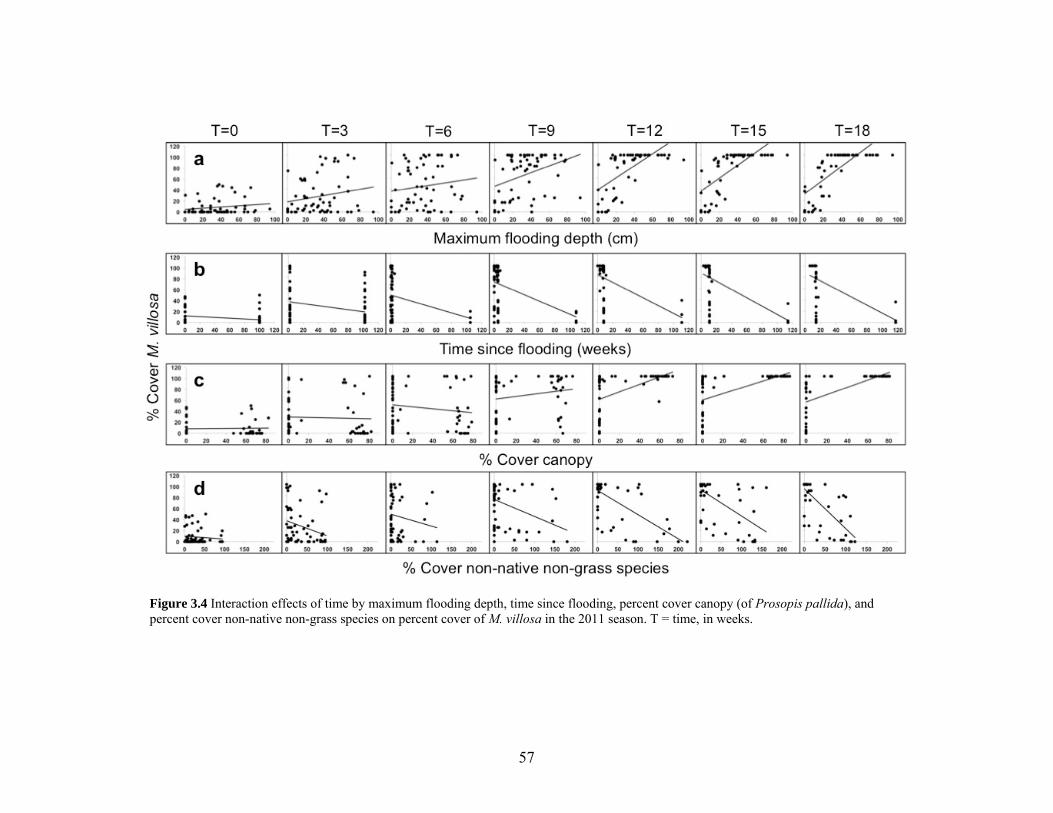
57
Figure 3.4 Interaction effects of time by maximum flooding depth, time since flooding, percent cover canopy (of Prosopis pallida), and percent cover non-native non-grass species on percent cover of M. villosa in the 2011 season. T = time, in weeks.
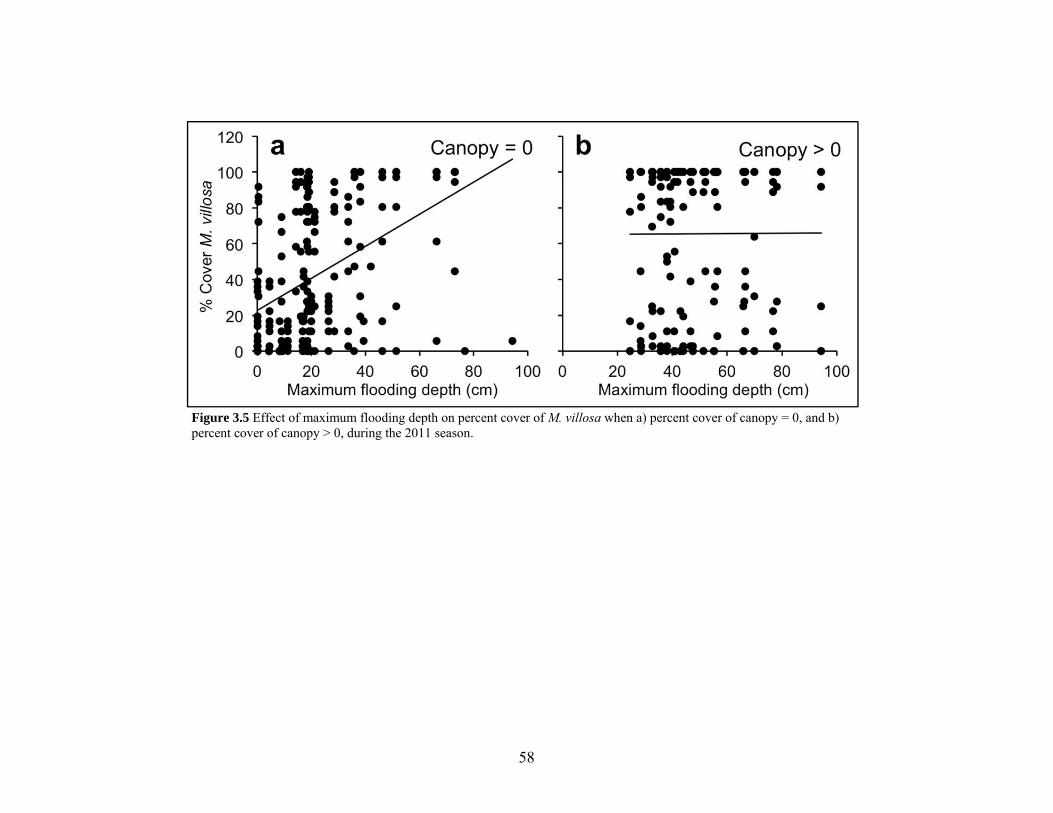
58
Figure 3.5 Effect of maximum flooding depth on percent cover of M. villosa when a) percent cover of canopy = 0, and b) percent cover of canopy > 0, during the 2011 season.
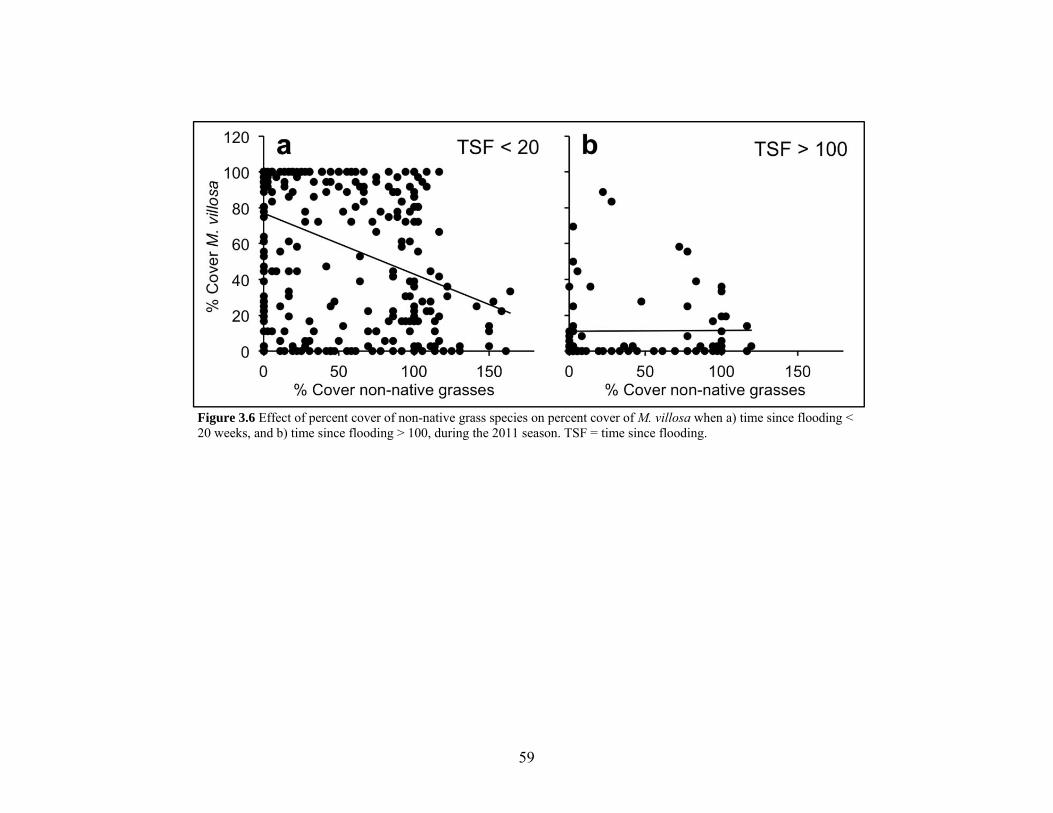
59
Figure 3.6 Effect of percent cover of non-native grass species on percent cover of M. villosa when a) time since flooding < 20 weeks, and b) time since flooding > 100, during the 2011 season. TSF = time since flooding.
60
CHAPTER 4
BOTTLENECKS AND FOUNDER EFFECTS IN THE ENDANGERED HAWAIIAN FERN
‘IHI‘IHI (MARSILEA VILLOSA)
Abstract
Reintroduction of plants or propagules to suitable areas within a natural historical range can be
an effective strategy for endangered species restoration. Understanding the genetic structure of
plant populations is critical to ensure that sampling for reintroduction captures sufficient genetic
diversity to allow for environmental adaptation in new populations. Marsilea villosa (‘ihi‘ihi) is
an endangered, endemic Hawaiian fern with seven remaining populations in ephemerally
flooding drylands on the islands of O‘ahu and Moloka‘i. Among its uncommon traits are long-
lived sporocarps (i.e., highly modified leaves containing sporangia and spores), a requirement of
flood and drought to complete its sexual life cycle, and extensive vegetative growth. I used
RAPD markers to assess population genetic structure across the full range of M. villosa. Using a
Bayesian modeling approach, I inferred three optimal clusters. Cluster assignment was mixed in
most O‘ahu populations, while Moloka‘i populations and one small recently outplanted
population on O‘ahu (Hanauma Bay) fell distinctly within clusters. Within Moloka‘i, populations
from the northwest region were distinct from a population in the southwest region. The Hanauma
Bay population distinction is likely due to a genetic bottleneck since it is known to have been
recently established from few individuals. Strong population structure within Moloka‘i is also
consistent with founder effects. A higher degree of genetic variation on O‘ahu and the distinction
between regions within Moloka‘i suggest two separate colonizations from O‘ahu to Moloka‘i.
Restoration efforts that include M. villosa reintroduction should take into account the results of
this study and consider that best sampling practices for outplanting may differ between islands.
61
Introduction
Translocation of rare or endangered plants is increasingly being used as a management
strategy for species and ecosystem restoration, and these efforts will become increasingly
important as we continue to see increases in human population, development pressures, and
global climate change. Before translocating endangered plants, it is ideal to know the genetic
makeup of source populations to ensure that enough variation is present to allow for adaptability
in new populations through natural selection (Lesica et al., 1999), particularly with clonally
growing plants (Fant et al., 2008), and this often means sampling from multiple source
populations (Godefroid et al., 2011). The capacity for evolutionary adaptation is critical in light
of global climate and environmental changes, and the presence of genetic variation may facilitate
many species’ adaptation to climate change, even over relatively short timeframes (Weeks et al.,
2011). In what would be considered a genetically successful restoration, an introduced
population would maintain levels of genetic diversity similar to that of wild populations
(Menges, 2008; Ramp et al., 2006). In order to accomplish this, sufficient numbers of individuals
must be sampled from one or more source populations and newly introduced populations must
expand sufficiently within a few generations (Weeks et al., 2011). However, practitioners must
find a balance between maximizing genetic variation in introduced populations and minimizing
the risk of outbreeding depression that leads to decreased local adaptation (Vergeer et al., 2004).
The prevailing attitude among restoration practitioners and ecologists has been a ‘better safe than
sorry’ approach of favoring local populations for source transplant material, but some argue that
these risks are overstated and have unduly restricted the use of translocation as a much needed
restoration strategy (Weeks et al., 2011).
Although molecular markers used in population genetic studies represent neutral
variation that does not necessarily correspond to adaptive variation, they can be directly
applicable to restoration in detecting genetic risk factors such as strong founder effects (Hufford
and Mazer, 2003). If translocation source populations are already the result of recent genetic
bottlenecks, introduced populations based on a limited number of transplanted individuals may
exhibit severe founder effects (Menges, 2008).
Here I used random amplified polymorphic DNA (RAPD) markers to assess the genetic
variation within and among populations of the endangered, endemic Hawaiian fern Marsilea
62
villosa Kaulf. with the goal of informing conservation managers on the best practices for
translocation and restoration efforts.
Marsilea villosa has only seven surviving populations on the islands of O‘ahu and
Moloka‘i (Bruegmann, 1996; W. Garnett, Rare Plant Species Recovery, Moloka‘i, HI, personal
communication; personal observations). Species of Marsilea are unusual among ferns in being
heterosporous, producing sporocarps (i.e., highly modified leaves with a thick drought-resistant
walls that contain sporangia and spores), and requiring flood and drought to complete their
sexual life cycle (e.g., Palmer, 2003). Marsilea villosa produces photosynthetic leaves when rain
is abundant enough to keep soil moist and produces sporocarps towards the end of the rainy
season. Standing water (the following year or later) is required for sporocarps to germinate,
initiating sexual reproduction. During the dry season, the leaves die and rhizomes are dormant.
Sporocarps may be viable for up to a century, as found in the closely related species Marsilea
oligospora Goodd. (Johnson, 1985). When conditions are wet enough for leaf production but not
for sexual reproduction, which may last several years, M. villosa grows vegetatively by
spreading rhizomes. Production of long-lived sporocarps and vegetative growth likely contribute
to the ability of M. villosa to recover from stressful conditions, such as a drought of a year or
more, as long as flooding occurs in subsequent rainy seasons (personal observations). This
combination of characters makes M. villosa an ideal candidate for restoration efforts; however,
nothing is known about the population genetics of this species.
Population genetics were studied for Marsilea strigosa Willd., an endangered species
from the Mediterranean basin, and it was found to have high differentiation among populations,
suggesting highly restricted gene flow and reproduction predominantly through selfing (Vitalis et
al., 2002). Similar patterns of differentiation were found in the endangered vernal pool species
Limnanthes floccosa ssp. californica Arroyo (Sloop et al., 2011), suggesting that higher
differentiation among populations may be typical of plant species found in ephemeral pool
habitats. However, Ramp Neale et al. (2008) found that the majority of genetic variation was
distributed within populations of the vernal pool endemic Lasthenia conjugens E. Greene. Thus,
even when habitat specificity may suggest certain genetic patterns, it is important to examine
genetic structure of any species targeted for restoration, particularly endangered species.
The extant populations of M. villosa include locations in a variety of habitats and
represent historical and outplanted populations, providing the potential for variation among
63
populations (Table 4.1). There are four populations on O‘ahu. Lualualei Naval Base is a
historical population on the western side of the island and contains at least five distinct
subpopulations, which range in size and in habitat from open fields to kiawe forest (Prosopis
pallida [Humb. & Bonpl. ex Willd.] Kunth). Koko Head is a natural population on the eastern
side of the island, and it served as the propagule source for two outplanted populations in the
same region. Makapu‘u was outplanted in the 1960’s, and Hanauma Bay was outplanted in 2002
(Alan Hong, personal communication). There are three populations on Moloka‘i, including
Kamaka‘ipo on the southwestern tip of the island, and Ka‘a and Kaeo in the northwestern region.
The latter two each have several subpopulations. Given that water is the primary dispersal agent
for spores (Palmer, 2002), populations and some subpopulations are assumed to be relatively
isolated; however, movement of resistant sporocarps via wetland bird species (internally or
externally) is presumed to be the mode of long-distance dispersal to Hawai‘i for the ancestor of
M. villosa (Carlquist, 1976) and of long-distance dispersal among most Marsilea species in
general (Johnson, 1986). Malone and Proctor (1965) demonstrated that intact sporocarps of
Marsilea vestita Hook. & Grev., the probable sister species to M. villosa (Nagalingum et al.,
2007), could pass through digestive tracts of various wetland bird species including mallard
ducks (Anas platyrhynchos L.). On the naval base at Lualualei, a managed pond serves as a
wildlife refuge for endangered Hawaiian water birds, including Hawaiian moorhen (Gallinula
chloropus sandvicensis Streets), Hawaiian coot (Fulica alai Peale), and Hawaiian stilt
(Himantopus mexicanus knudseni Stejneger), as well as the common mallard-Hawaiian duck
hybrid (A. platyrhynchos x A. wyvilliana P. L. Sclater). Of these, Hawaiian stilts had previously
been observed outside of the managed pond in other flooded areas, but not specifically within the
M. villosa subpopulations (Hawaii Natural Heritage Program, 2004). In Jan and Feb 2011, within
two separate M. villosa subpopulations (Table 4.1), I observed the mallard-Hawaiian duck hybrid
whose range includes all of O‘ahu, but not Moloka‘i (Fowler et al., 2009). Thus, there is at least
the potential for gene flow via bird dispersal, though I speculate that migration may be limited
increasingly with distance. Other studies have found relatively high percentages of genetic
differentiation among islands in endangered plant species, such as Anagyris latifolia Brouss. ex
Willd. (Fabaceae) in the Canary Islands (Gonzalez-Perez et al., 2009), and in clonally growing
species such as Zostera muelleri Irmisch ex Asch. (Zosteraceae) in New Zealand (Jones et al.,
2008). I therefore hypothesized that there would be structure to the genetic variation of M.
64
villosa populations such that the partitioning of genetic variation would be higher among
populations than within populations, and higher between the two islands than within populations.
Here I present the results of the first study of genetic variation within and among populations of
M. villosa and the implications of these results for restoration management.
Materials and Methods
Before any samples were collected, I obtained a Permit for Threatened and Endangered
Species (P-121) from the Department of Land and Natural Resources, Division of Forestry and
Wildlife, and was added as an authorized individual on the Pacific Naval Facilities Federal Fish
and Wildlife Permit (TE096741). Leaf tissue samples were collected from 3-33 individuals at
each of four populations on O‘ahu (including five subpopulations at Lualualei Naval Base) and
three populations on Moloka‘i (Table 4.1). Collected leaves were immediately placed in sealed
plastic bags with silica gel. Total DNA was extracted from 0.01-0.05 g of silica-dried leaves
using the CTAB method of Doyle and Doyle (1987) modified by adding 3% PVP-40 and 5mM
ascorbic acid.
DNA samples of one individual from each of five populations (representing both islands)
were screened with each of 30 primers (kits OPA-OPB; Operon Technologies; Alameda,
California, USA), of which seven were selected for analysis of all individuals. Approximately 50
ng of DNA was amplified in 15 μl polymerase chain reactions (PCR) consisting of 0.2 μM
random 10-mer primer, 0.2 mM dNTP, lx Taq polymerase PCR buffer, 1.5 mM MgCl2, 0.5%
bovine serum albumin, and 1 unit Taq Polymerase (Promega; Madison, Wisconsin, USA).
Amplifications were performed in a Mastercycler Gradient Thermocycler (Eppendorf North
America; New York, New York, USA) under the following conditions: 94 ºC for 2 min,
followed by 45 cycles of 94 ºC for 45 s, 35 ºC for 45 s, 72 ºC for 2 min with 0.5 ºC/s ramp rate,
and a final incubation at 72 ºC for 4 min. Amplification products were electrophoresed on 1.9%
agarose gels in 1x TBE (tris-borate-EDTA) buffer, for 2-4 hours at 85 mA. Gels were stained
with ethidium bromide and photographed under ultraviolet light using a GelDoc-It TS Imaging
System (UVP, LLC; Upland, California, USA). Putative loci were identified based on the size of
bands relative to 100 bp and 1 kb ladders (Promega; Madison, Wisconsin, USA). Only markers
that were well amplified and reproducible in replicate assays were scored. Since my aim was to
65
quantify variation among populations, only variable loci were included in the analysis, scored as
present or absent.
To investigate genetic structure within and among populations, data were analyzed using
the program Structure 2.3.2, which uses a Bayesian model-based clustering method to infer
population structure (Pritchard et al., 2000). Using a Markov Chain Monte Carlo (MCMC)
algorithm, individuals are assigned probabilistically to K populations based on allele frequencies
at each locus. The number of genetic clusters (K) is inferred from the posterior probability
distribution Pr(K|X), calculated from the posterior probability of the data Pr(X|K), with X
representing the genotypes of individuals sampled. Independent models were run for values of K
from 1 to 14. I assumed an ancestry model of no admixture and an allele frequency model of
correlation among populations. An initial burn-in period of 30,000 MCMC iterations was
followed by a run of 106 iterations for data analysis. I ran three replicates for each value of K to
ensure consistency of results. To estimate the true number of clusters present in the data, I
calculated ∆K based on the rate of change in the log probability of the data between successive K
values (Table 4.3; Evanno et al., 2005). I used the sister program Distruct 1.1 to graphically
display the results from Structure (Rosenberg, 2004). I also conducted principle coordinate
analysis (PCoA) using the Gower general similarity coefficient in MVSP 3.1 (Multi-Variate
Statistical Package; Kovach
Computing Services, 1987-2009). These results are presented at the population level, because it
is difficult to interpret a large number of subpopulations visually in PCoA.
I examined hierarchical genetic variation using different geographical groupings as
models with analysis of molecular variance (AMOVA; Excoffier et al., 1992) as implemented in
Arlequin 3.5.1.3 (Excoffier et al., 2005). I tested differentiation using the seven populations as
the highest hierarchical level, with subpopulations nested within some populations, and I tested
island-level partitioning between O‘ahu and Moloka‘i, with populations nested within islands
(Table 4.1, 4.3). Explanatory power of each hierarchical level was tested for significance at P <
0.05.
Results
Seven RAPD primers were examined for all sampled individuals, and from these 106
variable loci were scored. There was a range of 10-28 variable loci per primer with an average of
66
18 loci. Out of 212 possible alleles (i.e., presence or absence at each locus), there were a number
of rare alleles (Table 4.2). Seven of these (3%) were unique to a single individual, while 26
(12%) were present in less than 5% of individuals sampled. There were four populations with
unique alleles, and while three of these had only one unique allele, Lualualei had eight. There
were also 14 alleles unique to two populations, and all except one were shared between Lualualei
and one other population. Of these 13 alleles, six were shared with another O‘ahu population and
seven were shared with a Moloka‘i population. Between islands, there were greater than eight
times as many alleles unique to O'ahu (25 alleles; 12%) than to Moloka'i (3 alleles; 1%).
Replicate models run in Structure for values of K from 1 to 14 produced consistent
results, with the highest log probability of the data estimated with K=4 (Table 4.3). However,
using the method of Evanno et al. (2005), I found that the modal value of ∆K showed a spike
occurring at K=3, which is indicative of the true number of clusters present in the data (Fig. 4.1).
In this model, the five subpopulations within the Ka‘a and Kaeo populations of northwestern
Moloka‘i showed 100% membership in inferred cluster 1, as did the LUA4 subpopulation of
Lualualei (west O'ahu). Kamaka‘ipo (southwest Moloka‘i) and Hanauma Bay (east O‘ahu)
showed 100% membership in inferred cluster 3. Koko Head and Makapu‘u (east O‘ahu), and the
remaining subpopulations of Lualualei had membership in at least two of the inferred clusters,
with not more than 80% membership in any single cluster, but inferred cluster 2 was present only
among O‘ahu populations.
Results from the Principle Coordinates Analysis (PCoA) reinforced these patterns of
genetic structure in M. villosa. The two axes in Fig. 4.2 together accounted for 27.3% of the total
variation. The first PCoA axis separates the southwestern Moloka‘i population (Kamaka‘ipo)
from the northwestern Moloka‘i populations of Ka‘a and Kaeo, which cluster together. The
second PCoA axis separates Hanauma Bay from Koko Head and Makapu‘u, despite Koko Head
being the source population for both Makapu‘u and Hanauma Bay (all in the eastern O‘ahu
region). Kamaka‘ipo and Hanauma Bay also cluster together, while Lualualei (western O‘ahu) is
found along both axes and contains individuals with genetic similarity to each of the other
populations, reflecting the results of the Structure analysis.
I used analysis of molecular variation (AMOVA) to test the significance of two different
hierarchical structures and their power to explain genetic variance in M. villosa. My two models
tested for variation 1) among geographically isolated populations, among subpopulations nested
67
within populations, and within subpopulations and 2) between the two islands, among
populations nested within islands, and within populations (Table 4.4). In both models, all three
levels of variation showed strong statistical support for their explanatory power. Both models
also showed the large majority (75-77%) of genetic variation distributed at the most local level,
and double the amount of diversity at the intermediate level (16-18%) compared to the highest
hierarchical level (7%).
Discussion
I found evidence of genetic structure among populations of M. villosa, supporting my
hypothesis of greater structural differentiation between islands than within islands. The presence
of only two of the three genetic clusters on Moloka‘i indicates that less variation is present there
than on O‘ahu, and suggests that O‘ahu was likely the source for colonization to Moloka‘i.
O‘ahu also shows more mixing of clusters within populations, with the exception of Hanauma
Bay, which is also distinct from other eastern O‘ahu populations in PCoA. Since it is known that
Hanauma Bay was outplanted only ten years ago from a limited number of individuals, it is not
surprising that the population shows membership only in one cluster, indicating a founder effect.
The fact that all subpopulations within northwestern Moloka‘i fall within one cluster,
either by Structure analysis or PCoA, suggests that the region also experienced a genetic
bottleneck, likely due to founder effect. A similar bottleneck apparently occurred with the
southwestern Moloka‘i population. However, since Kamaka‘ipo shows 100% membership in a
different cluster than northwestern Moloka‘i in Structure and is genetically distant from
northwestern Moloka‘i in PCoA, it is likely that the two regions represent two separate
colonization events from O‘ahu to Moloka‘i. Since O‘ahu is the older of the two islands, this
pattern is consistent with the “progression rule,” in which dispersal and colonization often occur
in a west-to-east direction (Wagner & Funk, 1995). This “conveyor belt” effect also increases the
likelihood of divergence between source and colonial populations on different islands (Fleischer
et al., 1998).
Lualualei subpopulation LUA4 also falls within a single genetic cluster, but the
mechanisms behind this distinction are less clear. The subpopulation was only recently
discovered in Jan 2011, and despite its large size and relative proximity to the LUA3
subpopulation and the naval base access road (within 100 m of each), it is unknown whether this
68
subpopulation is actually new or simply had not been observed before. It is deeper into kiawe
forest relative to the access road and surrounded by tall guinea grass (Megathyrsus
maximus [Jacq.] B. K. Simon & S. W. L. Jacobs), and may have been overlooked, particularly
since surveys of the base do not happen on a regular basis and their timing may not always
coincide with optimal years for M. villosa growth. For many species, the sheer size of the
subpopulation would preclude the possibility of it being newly established, but as M. villosa has
a high rate of vegetative growth (Bruegmann, 1986), I cannot rule out that possibility. Given the
variation present among the other O‘ahu populations and subpopulations (excluding Hanauma
Bay), these results provide some support for the hypothesis that LUA4 was established recently,
and if so, its genetic structure is likely another example of founder effect. If I reject that
hypothesis, the proximity of LUA4 to LUA3 suggests at least the possibility of gene flow via
water or bird dispersal, making such a distinctive genetic structure seem unlikely. A final
possibility is that these results may be due to sampling effects, in which case increasing the
sample size may reveal more variation.
I did not find support for my hypotheses of greater variation among than within
populations, or a higher degree of distinction between islands in the AMOVAs; rather the
percentage of variation was increasingly higher with each lower level in the hierarchy. My
results were in contrast to studies that found greater partitioning of variation among populations
in other ephemeral pool plants, such as M. strigosa (Vitalis et al., 2002) and Limnanthes floccosa
ssp. californica Arroyo. (Limnantheaceae; Sloop et al., 2011). However, the vernal pool endemic
Lasthenia conjugens E. Greene (Asteraceae) had 82-84% of variation within populations (Ramp-
Neale et al., 2008), which is similar to the pattern observed in M. villosa. Additionally, ~75% of
variation at the most local level in M. villosa is comparable to average within-population
variation of seed plants that are long-lived perennial (75%), endemic (74%), outcrossing (73%),
water dispersed (75%), or ingestion dispersed (73%), based on 160 studies using RAPD analysis
(Nybom, 2004). This degree of variation within subpopulations is likely explained by relatively
small geographical distances between subpopulations (< 2 km), where dispersal may occur more
often than between populations. The maintenance of moderately high levels of variation within
populations (as well as subpopulations) is likely the result of the interplay between rare to
occasional dispersal, and extensive clonal growth. Although the percentage of variation between
island populations (7.27%) was lower than I hypothesized, it is still relatively high compared to
69
that found in some other island-dwelling species such as Digitalis minor L. (Scrophulariaceae) in
the Balearic Islands (1.57%; Sales et al., 2007), Pinus canariensis C. Sm. (Pinaceae) in the
Canary Islands (0%; Gomez et al., 2003), and Cladophoropsis membranacea (Hofman Bang ex
C. Agardh) Borgesen (Chlorophyta) in the Canary Islands (5.62%; Van der Strate et al., 2003),
and also in species with island-like distributions such as the lakeshore dwelling Ranunculus
reptans L. (Ranunculaceae) in Switzerland (5.89%; Fischer et al., 2000). The relatively high
variation between island populations of M. villosa may reflect the decreased potential for
dispersal between islands, particularly if the mallard-Hawaiian duck hybrid is the dispersal
vector, since Moloka‘i is not within its range (Fowler et al., 2009). The lower level of variance
than I expected between islands is also consistent with my hypotheses of founder effects that I
inferred from the analysis of genetic structure, showing support for the hypothesis that Moloka‘i
populations were colonized by migrants from O‘ahu populations.
Patterns of dispersal and colonization among the Hawaiian islands can also be inferred
from the distribution of rare alleles (Ranker et al., 2000). The difference in frequency of island-
specific alleles (12% on O‘ahu and 1% on Moloka‘i) lends further support of O‘ahu as the source
for colonization and the occurrence of founder effects on Moloka‘i. Eight of the 11 alleles that
were unique to one population were unique to Lualualei, which suggests that it may have been
the ancestral population for all other extant populations. Of the alleles that were unique to just
two populations, 1-3 alleles were shared between Lualualei and each of the other six populations,
lending further support for Lualualei as the source for all subsequent colonizations. This
hypothesis is also strengthened by the PCoA, in which Lualualei samples can be found clustering
with each of the other populations or regional clusters.
Based on previous work on M. villosa conservation and restoration ecology (Chapter 2,
3), I have recommended reintroduction of M. villosa through outplanting and management of
new populations as a restoration technique likely to increase the stability of this endangered
species. Translocations can also serve as common-garden experiments that can be used to
evaluate local adaptation (Menges, 2008), particularly if the genetic composition of source plants
is accounted for. Marsilea villosa would be an excellent candidate for this type of in situ
restoration experiment. I recommend at least two different practices for sampling of M. villosa
plants, rhizomes, or sporocarps for reintroduction efforts. For translocations on O‘ahu,
propagules should be sampled from all populations growing in similar environments in order to
70
capture as much genetic diversity as possible, as well as any rare alleles that may exist in one or
few populations, such as those listed in Table 4.1. Since Lualualei is the largest population and
also shows evidence of being the source for all other populations, Lualualei should be well
sampled for reintroduction efforts on O‘ahu.
For translocations on Moloka‘i, I recommend sampling only from local populations,
since sampling from O‘ahu may introduce genetic variation that is not adaptive to environmental
conditions on Moloka‘i that differ from O‘ahu. For example, all Moloka‘i populations
experience lower mean annual rainfall than those on O‘ahu (Giambelluca et al., 2011). I also
suggest carefully taking into account the habitat characteristics at reintroduction sites on
Moloka‘i. While Ka‘a may be considered a true seasonal wetland, Kamaka‘ipo is even drier than
northwestern Moloka‘i and is most likely a remnant of a larger population that has been
influenced by development, and Kaeo is different from any other M. villosa population in that its
natural drainage topography precludes standing floods in most areas. It would be an interesting
experiment to sample from all Moloka‘i populations to produce a common garden experiment at
a new location on the island. Further, since there is evidence that all Moloka‘i populations may
have origins in Lualualei, it could be worth experimenting with translocations from Lualualei to
Moloka‘i. The benefits of augmenting the genetic variation present on Moloka‘i may outweigh
the risks of genetic mixing, particularly if reintroduction efforts are conscientiously monitored
after outplanting (Weeks et al., 2011). However, if resources are limited to the most critical
management efforts, I would recommend sampling from Moloka‘i populations or subpopulations
that occur in environments most similar to the target area for restoration.
In conclusion, our insight into the genetic diversity of Marsilea villosa will directly
inform conservation and restoration management in Hawai'i. The differences between M. villosa
population genetics and those of M. strigosa (Vitalis et al., 2002) suggest that further study of
any of the other ~60 Marsilea species will be important, especially for those that are rare or
endangered. This study also contributes to a small body of literature on genetics of ephemeral
pool plants, which tend to be endangered, vary considerably, and merit further research.
Additionally, I offer hypotheses on biogeographical patterns for a species previously unstudied
in the Hawaiian Islands.

71
TABLES
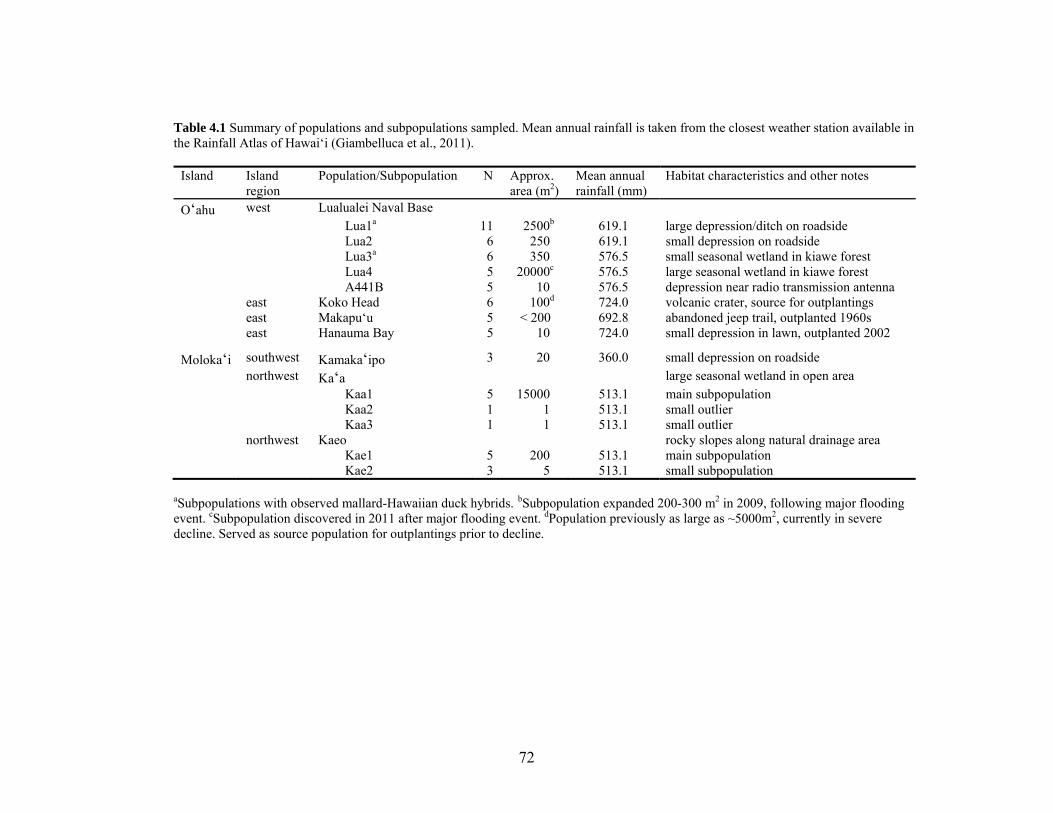
72
Table 4.1 Summary of populations and subpopulations sampled. Mean annual rainfall is taken from the closest weather station available in the Rainfall Atlas of Hawai‘i (Giambelluca et al., 2011).
Island Island
region Population/Subpopulation N Approx.
area (m2) Mean annual rainfall (mm)
Habitat characteristics and other notes
O‘ahu west Lualualei Naval Base Lua1a 11 2500b 619.1 large depression/ditch on roadside Lua2 6 250 619.1 small depression on roadside Lua3a 6 350 576.5 small seasonal wetland in kiawe forest Lua4 5 20000c 576.5 large seasonal wetland in kiawe forest A441B 5 10 576.5 depression near radio transmission antenna east Koko Head 6 100d 724.0 volcanic crater, source for outplantings east Makapu‘u 5 < 200 692.8 abandoned jeep trail, outplanted 1960s east Hanauma Bay 5 10 724.0 small depression in lawn, outplanted 2002
Moloka‘i southwest Kamaka‘ipo 3 20 360.0 small depression on roadside northwest Ka‘a large seasonal wetland in open area Kaa1 5 15000 513.1 main subpopulation Kaa2 1 1 513.1 small outlier Kaa3 1 1 513.1 small outlier northwest Kaeo rocky slopes along natural drainage area Kae1 5 200 513.1 main subpopulation Kae2 3 5 513.1 small subpopulation
aSubpopulations with observed mallard-Hawaiian duck hybrids. bSubpopulation expanded 200-300 m2 in 2009, following major flooding event. cSubpopulation discovered in 2011 after major flooding event. dPopulation previously as large as ~5000m2, currently in severe decline. Served as source population for outplantings prior to decline.
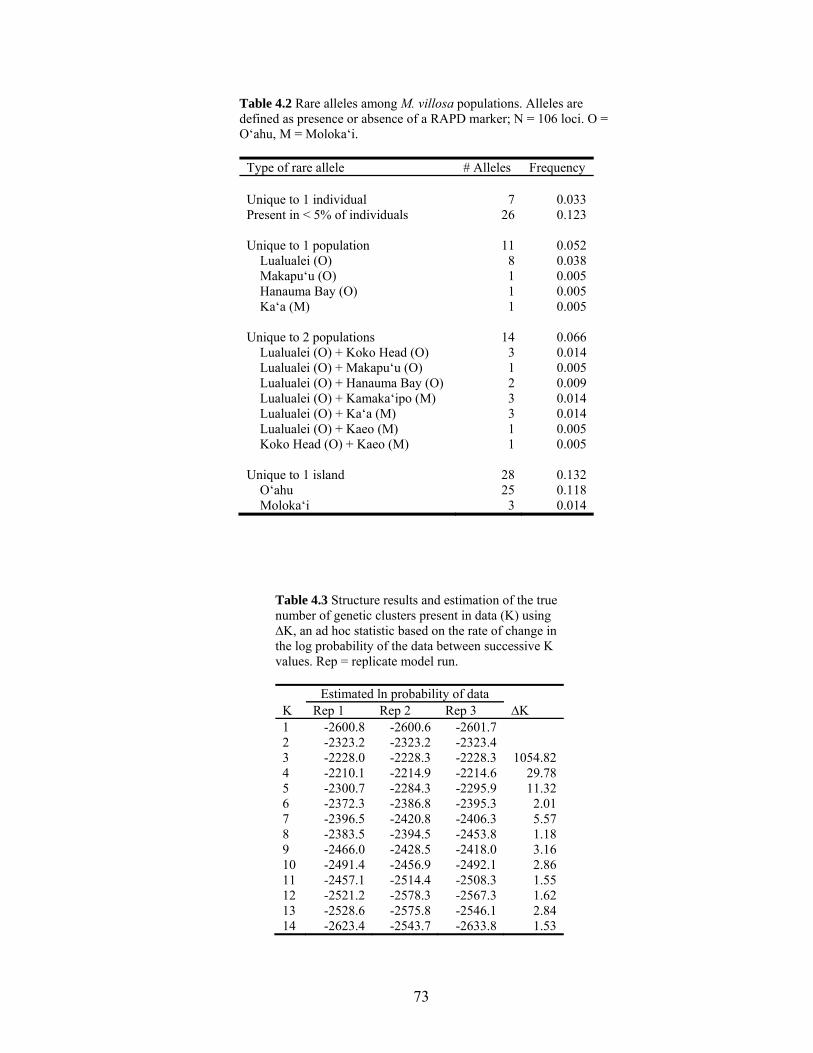
73
Table 4.2 Rare alleles among M. villosa populations. Alleles are defined as presence or absence of a RAPD marker; N = 106 loci. O = O‘ahu, M = Moloka‘i.
Type of rare allele # Alleles Frequency Unique to 1 individual 7 0.033 Present in < 5% of individuals 26 0.123 Unique to 1 population 11 0.052 Lualualei (O) 8 0.038 Makapu‘u (O) 1 0.005 Hanauma Bay (O) 1 0.005 Ka‘a (M) 1 0.005 Unique to 2 populations 14 0.066 Lualualei (O) + Koko Head (O) 3 0.014 Lualualei (O) + Makapu‘u (O) 1 0.005 Lualualei (O) + Hanauma Bay (O) 2 0.009 Lualualei (O) + Kamaka‘ipo (M) 3 0.014 Lualualei (O) + Ka‘a (M) 3 0.014 Lualualei (O) + Kaeo (M) 1 0.005 Koko Head (O) + Kaeo (M) 1 0.005 Unique to 1 island 28 0.132 O‘ahu 25 0.118 Moloka‘i 3 0.014
Table 4.3 Structure results and estimation of the true number of genetic clusters present in data (K) using ∆K, an ad hoc statistic based on the rate of change in the log probability of the data between successive K values. Rep = replicate model run.
Estimated ln probability of data K Rep 1 Rep 2 Rep 3 ∆K 1 -2600.8 -2600.6 -2601.7 2 -2323.2 -2323.2 -2323.4 3 -2228.0 -2228.3 -2228.3 1054.82 4 -2210.1 -2214.9 -2214.6 29.78 5 -2300.7 -2284.3 -2295.9 11.32 6 -2372.3 -2386.8 -2395.3 2.01 7 -2396.5 -2420.8 -2406.3 5.57 8 -2383.5 -2394.5 -2453.8 1.18 9 -2466.0 -2428.5 -2418.0 3.16 10 -2491.4 -2456.9 -2492.1 2.86 11 -2457.1 -2514.4 -2508.3 1.55 12 -2521.2 -2578.3 -2567.3 1.62 13 -2528.6 -2575.8 -2546.1 2.84 14 -2623.4 -2543.7 -2633.8 1.53
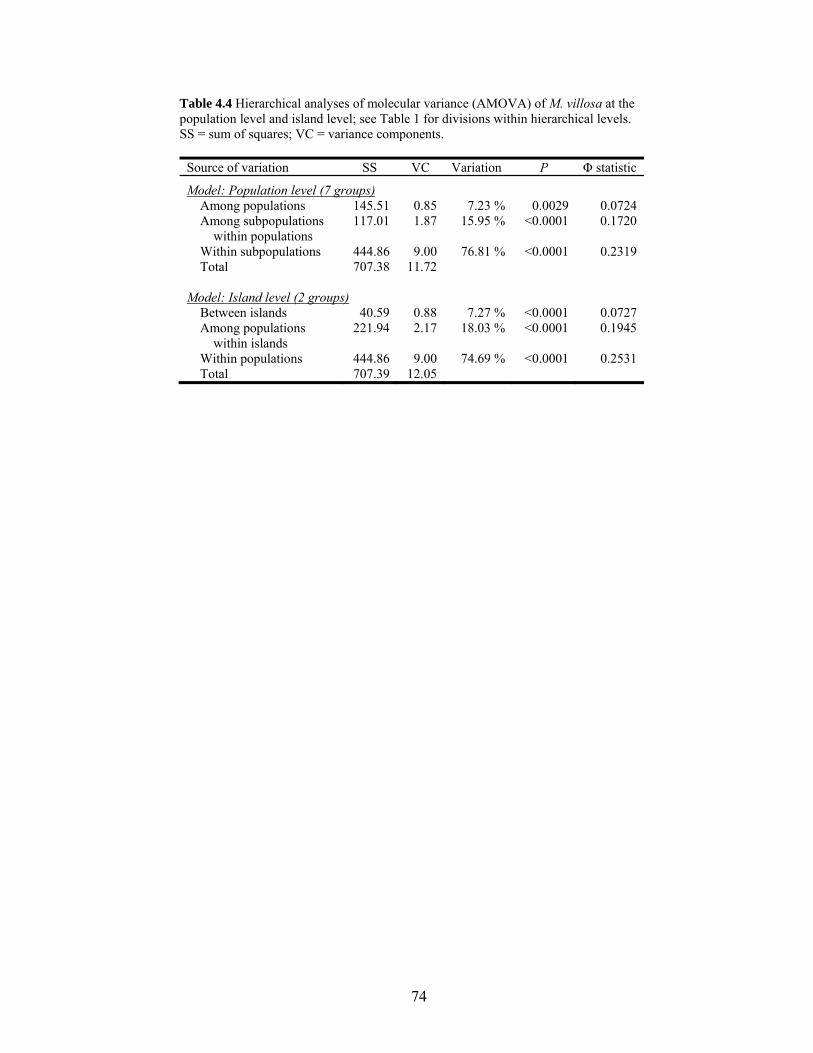
74
Table 4.4 Hierarchical analyses of molecular variance (AMOVA) of M. villosa at the population level and island level; see Table 1 for divisions within hierarchical levels. SS = sum of squares; VC = variance components.
Source of variation SS VC Variation P Φ statistic
Model: Population level (7 groups) Among populations 145.51 0.85 7.23 % 0.0029 0.0724 Among subpopulations within populations
117.01 1.87 15.95 % <0.0001 0.1720
Within subpopulations 444.86 9.00 76.81 % <0.0001 0.2319 Total 707.38 11.72 Model: Island level (2 groups) Between islands 40.59 0.88 7.27 % <0.0001 0.0727 Among populations within islands
221.94 2.17 18.03 % <0.0001 0.1945
Within populations 444.86 9.00 74.69 % <0.0001 0.2531 Total 707.39 12.05

75
FIGURES
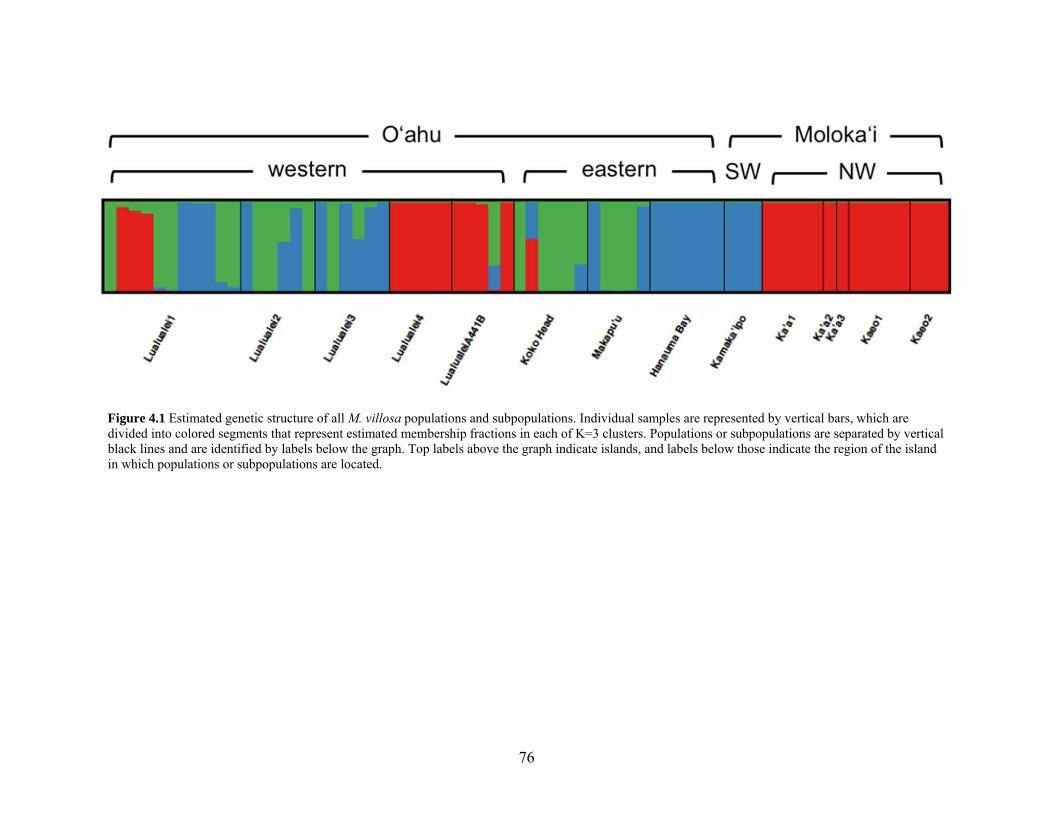
76
Figure 4.1 Estimated genetic structure of all M. villosa populations and subpopulations. Individual samples are represented by vertical bars, which are divided into colored segments that represent estimated membership fractions in each of K=3 clusters. Populations or subpopulations are separated by vertical black lines and are identified by labels below the graph. Top labels above the graph indicate islands, and labels below those indicate the region of the island in which populations or subpopulations are located.
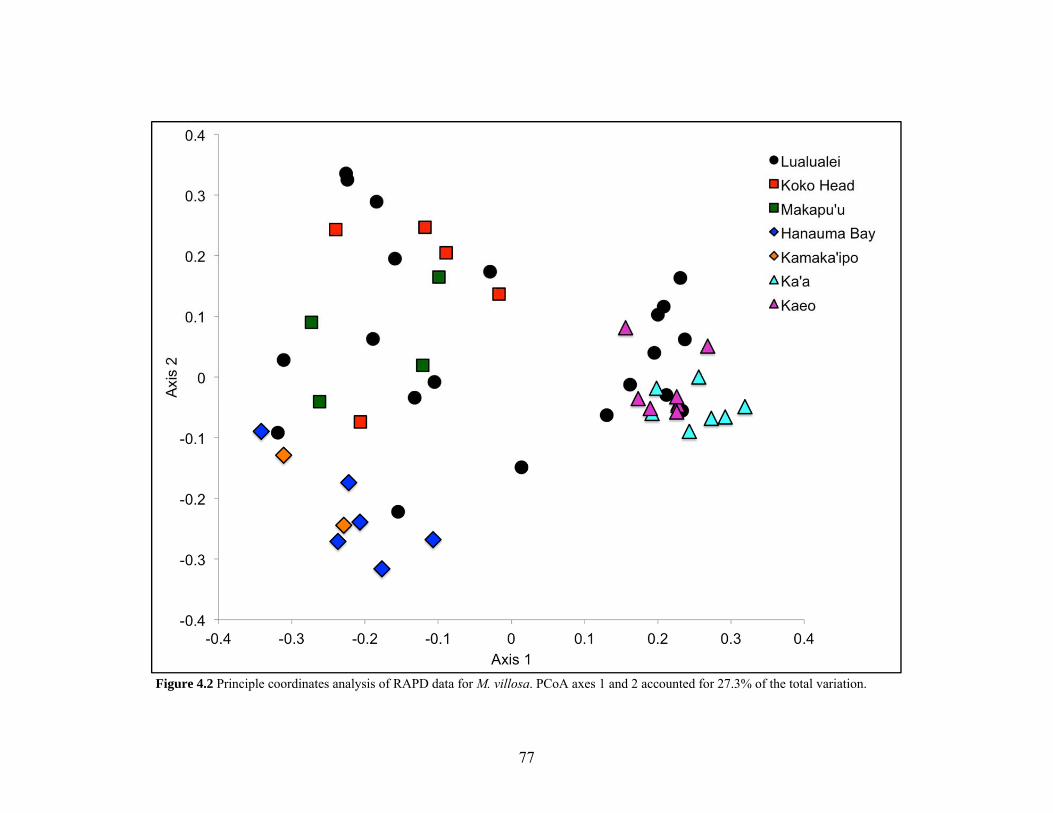
77
Figure 4.2 Principle coordinates analysis of RAPD data for M. villosa. PCoA axes 1 and 2 accounted for 27.3% of the total variation.
78
CHAPTER 5
CONCLUSIONS
The research presented in this dissertation provides explicit management
recommendations that can be directly applied to conservation of Marsilea villosa, and it also
contributes more broadly to our understanding of fern ecology, ephemeral pool systems,
ecological interactions, and restoration of rare and endangered plant species. While some
aspects of these findings confirmed my hypotheses, there were also some surprising results
that will be important to the conservation of this species, which confirms the importance of
conducting scientific research to inform management practices.
Summary of Findings
In the restoration experiment, I found that the combination of flooding and shade
treatments promoted the greatest increase in M. villosa growth, and that the effects of this
interaction grew stronger over time. The effects of shade were unexpected, since M. villosa
grows more often in full sun, so these results expand the range of suitable habitats where M.
villosa might be reintroduced. Although there were no effects of weeding over the majority
of the experiment, after drought occurred, shade increased M. villosa growth in the absence
of weeding. This effect was mirrored in the number of sporocarps produced, indicating that
reproductive potential is tied to vegetative growth, and that management targeting growth of
M. villosa should also maximize sexual reproduction.
The results of the field ecological study confirmed many of the findings of the
experiment, including the importance of shade in increasing growth of M. villosa. This study
also revealed some nuances of the flooding-shade interaction, including 1) that all plots with
more than 40 cm flooding depth or any degree of canopy cover reached 100% cover of M.
villosa by the end of the season, and 2) that in the presence of canopy cover, maximum
flooding depth has no relationship with M. villosa cover, but in the absence of canopy cover,
there is a positive relationship. Additionally, I found that non-native species had negative
relationships with M. villosa cover, but that grass species behaved as a functional group
while non-grass species effects were species-specific. Another interaction occurred where
non-native grass cover had no relationship with M. villosa cover for plots that had flooded
79
within the current season, but had a negative relationship for plots that had not flooded in
over two years. This research suggests that management priorities should lie with flooding
and shade, which have positive synergistic effects, but that weed monitoring and targeted
management may still be important.
In the population genetic study, I found that while the majority of genetic variation
was found within subpopulations, there was also genetic structure that showed strong
differentiation among some populations and between the two islands. Structure indicative of
founder effects and strong differentiation between the two regions of Moloka‘i suggested that
there were two separate colonization events from O‘ahu to Moloka‘i. The presence of rare
alleles and greater genetic variation within the Lualualei population suggested that Lualualei
might have been the source for all other natural populations of M. villosa. Based on these
results, practitioners planning to reintroduce M. villosa should sample widely from as many
populations as possible for outplanting on O‘ahu, but would be advised to sample from
within Moloka‘i for outplanting on that island, especially if resources for controlled
experiments and monitoring are limited.
Synthesis
One of the most exciting results of this research was that the findings of the relatively
long-term field study (three years) corroborated those of the short-term experiment (less than
six months), despite the unexpected result that shade can be just as important as flooding for
promoting Marsilea villosa growth. It is gratifying to be able to recommend, with
confidence, a management strategy previously not considered for this species. This also
highlights the importance of conducting experiments prior to ecological management.
Ideally, these experiments would be controlled, carefully designed, conducted in situ, and
monitored over the long-term, as I recommended in Chapter 2 for potential ecosystem
restoration with M. villosa in conjunction with other native dry forest species. However, this
research shows that if resources are limited, a short-term and relatively low-cost experiment,
also carefully designed, can be very informative to the both the basic biology and the
practical management of an endangered species. This research also highlights the importance
of studying ecological interactions, which are often overlooked, but which can explain much,
if not most, of the variation in biological patterns and processes.
80
Just as we have recognized a need for research that increases understanding of basic
ecology before engaging in ecological restoration (e.g., Drayton & Primack, 2012; Guerrant
& Kaye, 2007; Hobbs & Cramer, 2008; Rout et al., 2007), there have been similar calls for
knowledge of genetic variation to guide restoration through plant reintroduction (e.g., Fant et
al., 2008; Fahselt, 2007; Godefroid et al., 2011; Weeks et al., 2011). This study begins to fill
a gap in our knowledge of M. villosa genetics, and contributes to the literature on population
genetics of ferns, ephemeral pool plants, and endangered species. The combination of
ecological and genetic research in this dissertation provides a strong basis for a more
comprehensive management plan and increases the likelihood of success in restoring M.
villosa. Additionally, the results of the genetic study give evidence for new, testable
hypotheses about the biogeography of this species, and contribute to the literature on
evolution of the endemic Hawaiian flora.
This dissertation is also a contribution to small but growing bodies of literature on
three separate understudied topics: fern ecology, ephemeral pool biology, and facilitation as
an important component of ecological theory. The vast majority of fern species have not been
evaluated for risk of extinction, yet the majority of those that have been evaluated are indeed
at risk (Mehltreter, 2010). The Pteridophyte Specialist Group of the IUCN Species Survival
Commission has recognized that increased study of fern ecology is essential to inform fern
conservation (Jermy and Ranker, 2002). The results of this study would be especially
informative to fern species with a similar biology, of which there are at least 75 worldwide
(Marsileales; Hassler & Swale, 2004). Ephemeral pools are unique ecosystems with island-
like distributions and high beta diversity, in which endemic and endangered species are often
found, and they are useful experimental models for ecological study (De Meester et al, 2005).
While the ecology of M. villosa is likely to be more similar to the endangered M. strigosa
than the vernal pool endemic Lasthenia conjugens, its population genetics were much more
similar to the latter than the former (Ramp et al., 2006; Vitalis et al., 2002). Building the
literature on ephemeral pools will help to resolve these unexpected differences and lead to a
better understanding of the processes at work in these ecosystems. Another ecological topic
gaining recent ground is the role of facilitation in ecological theory, which has been largely
ignored over the past several decades in favor of competition, environmental stress, and other
challenges to survival (Bruno et al., 2003). Yet there are an increasing number of reports of

81
facilitation interactions in ecological studies, including those of shade effects, which have
traditionally been considered for their negative impacts (Semchenko et al., 2012). My
research contributes to the literature on positive interactions of shade and on facilitation as an
important interaction that should be considered in ecological theory.
Finally, this dissertation is, by design, a contribution to the understanding of rare and
endangered species biology, conservation, and restoration ecology. It underscores the need
for basic biological research that informs management by seeking to answer questions that
would best serve conservation practitioners. This research uses a synthetic approach,
combining experimental and field based ecology with population genetics to provide a
broader understanding of the biology of Marsilea villosa and a model upon which to base
restoration of the more resilient endangered species in Hawai‘i and worldwide.
82
LITERATURE CITED
Aguraiuja, R. 2011. Reintroduction of the endangered fern species Woodsia ilvensis to
Estonia: a long-term pilot study. Biodiversity and Conservation 20:391-400.
Alley, H., and J. M. Affolter. 2004. Experimental comparison of reintroduction methods for
the endangered Echinacea laevigata (Boynton and Beadle) Blake. Natural Areas
Journal 24:345-350.
Bauder, E. T. 2005. The effects of an unpredictable precipitation regime on vernal pool
hydrology. Freshwater Biology 50: 2129-2135.
Bird, C. E. 2003. PhotoGrid 1.0b Ecological Analysis of Digital Photographs.
http://www2.hawaii.edu/~cbird/PhotoGrid/frames.htm
Blaustein, L., and S. S. Schwartz. 2001. Why study ecology in temporary pools? Israel
Journal of Zoology 47: 303-312.
Bruegmann, M. M. 1986. The phenology, tissue water relations, and taxonomy of Marsilea
villosa. Master's Thesis, University of Hawai‘i at Mānoa, Honolulu, Hawai‘i.
Bruegmann, M. M. 1996. Recovery plan for Marsilea villosa. U.S. Fish and Wildlife Service.
Portland, Oregon.
Bruno, J. F., J. J. Stachowicz, And M. D. Bertness. 2003. Inclusion of facilitation into
ecological theory. Trends in Ecology & Evolution 18: 119-125.
Bullock, J. M., J. Aronson, A. C. Newton, R. F. Pywell, And J. M. Rey-Benayas. 2011.
Restoration of ecosystem services and biodiversity: conflicts and opportunities.
Trends in Ecology & Evolution 26: 541-549.
Burns, B. R., C. G. Floyd, M. C. Smale, And G. C. Arnold. 2011. Effects of forest fragment
management on vegetation condition and maintenance of canopy composition in a
New Zealand pastoral landscape. Austral Ecology 36: 153-166.
Burt, R. 2004. Dry Combustion, Soil Survey Laboratory Methods Manual. U.S.D.A. Soil
Survey Investigations Report No. 42. Version 4.0, 473-475.
Cabin, R. J., S. G. Weller, D. H. Lorence, S. Cordell, L. J. Hadway, R. Montgomery, D. Goo,
and A. Urakami. 2002. Effects of light, alien grass, and native species additions on
Hawaiian dry forest restoration. Ecological Applications 12:1595-1610.
83
Carlquist, S. 1967. The biota of long-distance dispersal. V. Plant dispersal to Pacific Islands.
Bulletin of the Torrey Botanical Club 94: 129-162.
Collinge, S. K., C. Ray, and F. Gerhardt. 2011. Long-term dynamics of biotic and abiotic
resistance to exotic species invasion in restored vernal pool plant communities.
Ecological Applications 21:2105-2118.
Daehler, C. C., and E. M. Goergen. 2005. Experimental restoration of an indigenous
Hawaiian grassland after invasion by Buffel grass (Cenchrus ciliaris). Restoration
Ecology 13:380-389.
Daehler, C., J. Denslow, S. Ansari, And H. Kuo. 2004. A risk assessment system for
screening out invasive pest plants from Hawai'i and other Pacific islands.
Conservation Biology 18: 360-368.
De Meester, L., S. Declerck, R. Stoks, G. Louette, F. Van De Meutter, T. De Bie, E. Michels,
et al. 2005. Ponds and pools as model systems in conservation biology, ecology and
evolutionary biology. Aquatic Conservation-Marine and Freshwater Ecosystems 15:
715-725.
Deenik, J., And A. Mcclellan. 2007. Soils of Hawai'i. Soil and Crop Management, SCM-20.
College of Tropical Agriculture and Human Resources, University of Hawai'i at
Manoa, Honolulu.
Deil, U. 2005. A review on habitats, plant traits and vegetation of ephemeral wetlands - a
global perspective. Phytocoenologia 35:533-705.
Division Of Plant Industry. 2003. List of plant species designated as noxious weeds (20
October 2003). Hawaii Department of Agriculture.
http://plants.usda.gov/java/noxious?rptType=State&statefips=15.
Doyle, J. J., And J. L. Doyle. 1987. A rapid DNA isolation procedure for small quantities of
fresh leaf tissue. Phytochemical Bulletin 19: 11-15.
Drayton, B., And R. B. Primack. 2012. Success rates for reintroductions of eight perennial
plant species after 15 years. Restoration Ecology 20: 299-303.
Evanno, G., S. Regnaut, And J. Goudet. 2005. Detecting the number of clusters of
individuals using the software STRUCTURE: a simulation study. Molecular Ecology
14: 2611-2620.
84
Excoffier, L., G. Laval, And S. Schneider. 2005. Arlequin (version 3.0): An integrated
software package for population genetics data analysis. Evolutionary Bioinformatics
1: 47-50.
Excoffier, L., P. E. Smouse, And J. M. Quattro. 1992. Analysis of molecular variance
inferred from metric distances among DNA haplotypes - Application to human
mitochondrial-DNA restriction data. Genetics 131: 479-491.
Falk, D. A., M. Olwell, and C. I. Millar. 1996. Restoring diversity: strategies for
reintroduction of endangered plants. Island Press, Washington, DC.
Fahselt, D. 2007. Is transplanting an effective means of preserving vegetation? Canadian
Journal of Botany-Revue Canadienne De Botanique 85: 1007-1017.
Fant, J. B., R. M. Holmstrom, E. Sirkin, J. R. Etterson, And S. Masi. 2008. Genetic structure
of threatened native populations and propagules used for restoration in a clonal
species, American beachgrass (Ammophila breviligulata Fern.). Restoration Ecology
16: 594-603.
Fischer, M., R. Husi, D. Prati, M. Peintinger, M. Van Kleunen, And B. Schmid. 2000. RAPD
variation among and within small and large populations of the rare clonal plant
Ranunculus reptans (Ranunculaceae). American Journal of Botany 87: 1128-1137.
Fleischer, R. C., C. E. Mcintosh, And C. L. Tarr. 1998. Evolution on a volcanic conveyor
belt: using phylogeographic reconstructions and K-Ar-based ages of the Hawaiian
Islands to estimate molecular evolutionary rates. Molecular Ecology 7: 533-545.
Fowler, A. C., J. M. Eadie, And A. Engilis. 2009. Identification of endangered Hawaiian
ducks (Anas wyvilliana), introduced North American mallards (A. platyrhynchos) and
their hybrids using multilocus genotypes. Conservation Genetics 10: 1747-1758.
Giambelluca T. W., Q. Chen, A. G. Frazier, J. P. Price, Y-L. Chen, P-S. Chu, J. Eischeid, and
D. Delparte. 2011. The Rainfall Atlas of Hawai‘i.
http://rainfall.geography.hawaii.edu.
Gill, F. B., And C. A. Conway. 1979. Floral biology of Leonotis nepetifolia (L.) R. Br.
(Labiatae). Proceedings of the Academy of Natural Sciences of Philadelphia: 244-
256.
85
Godefroid, S., C. Piazza, G. Rossi, S. Buord, A. D. Stevens, R. Aguraiuja, C. Cowell, C. W.
Weekley, G. Vogg, J. M. Iriondo, I. Johnson, B. Dixon, D. Gordon, S. Magnanon, B.
Valentin, K. Bjureke, R. Koopman, M. Vicens, M. Virevaire, and T. Vanderborght.
2011. How successful are plant species reintroductions? Biological Conservation
144:672-682.
Gomez, A., S. C. Gonzalez-Martinez, C. Collada, J. Climent, And L. Gil. 2003. Complex
population genetic structure in the endemic Canary Island pine revealed using
chloroplast microsatellite markers. Theoretical and Applied Genetics 107: 1123-1131.
Gonzalez-Perez, M. A., P. A. Sosa, And F. J. Batista. 2009. Genetic variation and
conservation of the endangered endemic Anagyris latifolia Brouss. ex Willd.
(Leguminosae) from the Canary Islands. Plant Systematics and Evolution 279: 59-68.
Guerrant, E. O., and T. N. Kaye. 2007. Reintroduction of rare and endangered plants:
common factors, questions and approaches. Australian Journal of Botany 55:362-370.
Hassler, M., And B. Swale. 2004. Checklist of world ferns. Available online at website:
http://homepages.caverock.net.nz/bj/fern.
Hawaii Natural Heritage Program. 2004. Flora and fauna survey of the Naval Computer and
Telecommunications Area Master Station Pacific, Oahu, Hawaii. Honolulu, HI.
Hobbs, R. J. 2007. Setting effective and realistic restoration goals: Key directions for
research. Restoration Ecology 15: 354-357.
Hobbs, R. J., and V. A. Cramer. 2008. Restoration ecology: Interventionist approaches for
restoring and maintaining ecosystem function in the face of rapid environmental
change. Annual Review of Environment and Resources 33:39-61.
Hufford, K. M., And S. J. Mazer. 2003. Plant ecotypes: genetic differentiation in the age of
ecological restoration. Trends in Ecology & Evolution 18: 147-155.
Jager, H., And I. Kowarik. 2010. Resilience of native plant community following manual
control of invasive Cinchona pubescens in Galapagos. Restoration Ecology 18: 103-
112.
Jakobs, G., C. Kueffer, and C. C. Daehler. 2010. Introduced weed richness across altitudinal
gradients in Hawai‘i: humps, humans and water-energy dynamics. Biological
Invasions 12:4019-4031.
86
Jermy, C. and T. A. Ranker. 2002. Epilogue—The way forward. Proceedings of the
International Symposium: Fern Flora Worldwide: Threats and Responses. The Fern
Gazette 16: 417–424.
Johnson, D. M. 1985. New records for longevity of Marsilea sporocarps. American Fern
Journal 75:30-31.
Jones, T. C., C. E. C. Gemmill, And C. A. Pilditch. 2008. Genetic variability of New Zealand
seagrass (Zostera muelleri) assessed at multiple spatial scales. Aquatic Botany 88: 39-
46.
Jusaitis, M. 2005. Translocation trials confirm specific factors affecting the establishment of
three endangered plant species. Ecological Management & Restoration 6:61-67.
Kaye, T. N. 2008. Vital steps toward success of endangered plant reintroductions. Native
Plants Journal 9: 313-322.
Kettler, T. A., J. W. Doran, And T. L. Gilbert. 2001. Simplified method for soil particle-size
determination to accompany soil-quality analyses. Soil Science Society of America
Journal 65: 849-852.
Kovach Computing Services. 1987-2009. Multivariate Statistical Package, v. 3.1, Pentraeth,
Wales.
Lesica, P., And F. W. Allendorf. 1999. Ecological genetics and the restoration of plant
communities: Mix or match? Restoration Ecology 7: 42-50.
Malone, C. R., And V. W. Proctor. 1965. Further evidence of the passive dispersal of small
aquatic organisms via the intestinal tract of birds. Ecology 46: 728-729.
Mehltreter, K. 2010. Fern conservation. In K. Mehltreter, L. R. Walker, And J. M. Sharpe
[eds.], Fern ecology. Cambridge University Press, New York, New York.
Mejia-Dominguez, N. R., J. A. Meave, C. Diaz-Avalos, and E. J. Gonzalez. 2011. Individual
canopy-tree species effects on their immediate understory microsite and sapling
community dynamics. Biotropica 43:572-581.
Menges, E. 2008. Restoration demography and genetics of plants: when is a translocation
successful? Australian Journal of Botany 56: 187-196.
Mueller-Dombois, D., And H. Ellenberg. 1974. Aims and methods of vegetation ecology.
Wiley, New York, New York.
87
Nagalingum, N. S., H. Schneider, And K. M. Pryer. 2007. Molecular phylogenetic
relationships and morphological evolution in the heterosporous fern genus Marsilea.
Systematic Botany 32: 16-25.
Norton, D. A. 2009. Species invasions and the limits to restoration: Learning from the New
Zealand experience. Science 325:569-571.
Nybom, H. 2004. Comparison of different nuclear DNA markers for estimating intraspecific
genetic diversity in plants. Molecular Ecology 13: 1143-1155.
Palmer, D. D. 2003. Hawai'i's Ferns and Fern Allies. University of Hawai'i Press, Honolulu,
Hawai‘i.
Pritchard, J. K., M. Stephens, And P. Donnelly. 2000. Inference of population structure using
multilocus genotype data. Genetics 155: 945-959.
Ramp, J. M., S. K. Collinge, And T. A. Ranker. 2006. Restoration genetics of the vernal pool
endemic Lasthenia conjugens (Asteraceae). Conservation Genetics 7: 631-649.
Ranker, T. A., C. E. C. Gemmill, And P. G. Trapp. 2000. Microevolutionary patterns and
processes of the native Hawaiian colonizing fern Odontosoria chinensis
(Lindsaeaceae). Evolution 54: 828-839.
Rosenberg, N. A. 2004. Distruct: a program for the graphical display of population structure.
Molecular Ecology Notes 4: 137-138.
Rout, T. M., C. E. Hauser, and H. P. Possingham. 2007.Minimise long-term loss or maximise
short-term gain? Optimal translocation strategies for threatened species. Ecological
Modelling 201:67-74.
Rowland, J., and M. A. Maun. 2001. Restoration ecology of an endangered plant species:
Establishment of new populations of Cirsium pitcheri. Restoration Ecology 9:60-70.
Sakai, A. K., W. L. Wagner, And L. A. Mehrhoff. 2002. Patterns of endangerment in the
Hawaiian flora. Systematic Biology 51: 276-302.
Sales, E., S. G. Nebauer, M. Mus, And J. Segura. 2001. Population genetic study in the
Balearic endemic plant species Digitalis minor (Scrophulariaceae) using RAPD
markers. American Journal of Botany 88: 1750-1759.
88
Santiago De Freitas, A. D., T. O. Da Silva, R. S. C. Menezes, E. Sampaio, E. R. Araujo, And
V. D. Fraga. 2011. Nodulation and nitrogen fixation of caatinga forage species grown
in soils of the semiarid area of Paraiba. Revista Brasileira De Zootecnia-Brazilian
Journal of Animal Science 40: 1856-1861.
SAS Institute. 2006. Base SAS® 9.1.3 Procedures Guide, Second Edition, Volumes 1, 2, 3,
and 4. Cary, North Carolina: SAS Institute Inc.
Semchenko, M., M. Lepik, L. Gotzenberger, And K. Zobel. 2012. Positive effect of shade on
plant growth: amelioration of stress or active regulation of growth rate? Journal of
Ecology 100: 459-466.
Tryon, R. M., and A. F. Tryon. 1982. Ferns and allied plants with special reference to
tropical America. Springer-Verlag, New York, New York.
Van Der Strate, H. J., L. Van De Zande, W. T. Stam, R. J. Haroun, And J. L. Olsen. 2003.
Within-island differentiation and between-island homogeneity: non-equilibrium
population structure in the seaweed Cladophoropsis membranacea (Chlorophyta) in
the Canary Islands. European Journal of Phycology 38: 15-23.
Vergeer, P., E. Sonderen, And N. J. Ouborg. 2004. Introduction strategies put to the test:
Local adaptation versus heterosis. Conservation Biology 18: 812-821.
Vitalis, R., M. Riba, B. Colas, P. Grillas, And I. Olivieri. 2002. Multilocus genetic structure
at contrasted spatial scales of the endangered water fern Marsilea strigosa
Willd.(Marsileaceae, Pteridophyta) 1. American Journal of Botany 89: 1142-1155.
Wagner, W. L., D. R. Herbst, And S. H. Sohmer. 1999. Manual of the Flowering Plants of
Hawai'i. University of Hawai'i and Bishop Museum Press, Honolulu, Hawai‘i.
Walker, L. R., and E. A. Powell 1999. Regeneration of the Mauna Kea silversword
Argyroxiphium sandwicense (Asteraceae) in Hawai‘i. Biological Conservation 89:61-
70.
Weeks, A. R., C. M. Sgro, A. G. Young, R. Frankham, N. J. Mitchell, K. A. Miller, M.
Byrne, et al. 2011. Assessing the benefits and risks of translocations in changing
environments: a genetic perspective. Evolutionary Applications 4:709-725.
Weller, S. G., R. J. Cabin, D. H. Lorence, S. Perlman, K. Wood, T. Flynn, And A. K. Sakai.
2011. Alien plant invasions, introduced ungulates, and alternative states in a mesic
forest in Hawaii. Restoration Ecology 19: 671-680.

89
West, B. T., K. B. Welch, and A. T. Galecki. 2007. Linear mixed models: a practical guide
using statistical software. CRC Press, Boca Raton, Florida.
Wester, L. 1994. Weed management and the habitat protection of rare species - A case-study
of the endemic Hawaiian fern Marsilea villosa. Biological Conservation 68:1-9.
Wester, L., J. Delay, L. Hoang, B. Iida, N. Kalodimos, and T. Wong. 2006. Population
dynamics of Marsilea villosa (Marsileaceae) on O‘ahu, Hawai‘i. Pacific Science
60:385-402.
Zenkteler, E. K. 2002. Ex situ breeding and reintroduction of Osmunda regalis L. in Poland.
Fern Gazette 16: 371-376.