Conservation Biology Research Grants Program Minnesota...
53
THE COMMERCIAL HARVEST OF PAINTED TURTLES IN MINNESOTA FINAL REPORT TO THE MINNESOTA DEPARTMENT OF NATURAL RESOURCES, NATURAL HERITAGE AND NONGAME RESEARCH PROGRAM Tony Gamble Conservation Biology Graduate Program University of Minnesota [email protected] and Andrew M. Simons Department of Fisheries, Wildlife, and Conservation Biology Bell Museum of Natural History University of Minnesota 30 May 2003 Conservation Biology Research Grants Program Natural Heritage and Nongame Research Program Division of Ecological Services Minnesota Department of Natural Resources
Transcript of Conservation Biology Research Grants Program Minnesota...

THE COMMERCIAL HARVEST OF PAINTED TURTLES IN MINNESOTA
FINAL REPORT TO THE MINNESOTA DEPARTMENT OF NATURALRESOURCES, NATURAL HERITAGE AND NONGAME RESEARCH
PROGRAM
Tony GambleConservation Biology Graduate Program
University of Minnesota [email protected]
and
Andrew M. SimonsDepartment of Fisheries, Wildlife, and Conservation Biology
Bell Museum of Natural History University of Minnesota
30 May 2003
Conservation Biology Research Grants ProgramNatural Heritage and Nongame Research ProgramDivision of Ecological ServicesMinnesota Department of Natural Resources

THE COMMERCIAL HARVEST OF PAINTED TURTLES IN MINNESOTA
FINAL REPORT TO THE MINNESOTA DEPARTMENT OF NATURAL RESOURCES, NATURAL
HERITAGE AND NONGAME RESEARCH PROGRAM
TABLE OF CONTENTS
Abstract……………………………………………………………………………..……ii
Introduction………………………………………………………………………..……..1
Chapter One: The Impact of Commercial Harvest on Painted Turtles in
Minnesota……………………………………………………………..…….…..3
Chapter Two: A Harvest Model for Painted Turtles………………………..…….….8
Summary and Recommendations……………………………………………………18
Acknowledgements……………………………………………………………..……..18
Bibliography…………………………………………………………………..………..19
Appendix A: The Minnesota Basking Trap for Painted Turtles………………..….22
Appendix B: Lake Descriptions……………………………….…………………..….26
Appendix C: Marking Turtles………………………………………………..…….….50
i

ABSTRACT Tens of thousands of Painted Turtles (Chrysemys picta) are commercially harvested in Minnesota each year for sale to biological supply companies and the pet trade. To date, little is known about the effects of this harvest. This report documents the first attempt to assess its impact. Our results indicate that Painted Turtle populations in Minnesota have been affected by commercial harvest activities. Harvest can lower the relative abundance of Painted Turtles and alter population demographies. We have also shown, through model simulations, that the removal of even a small proportion of the females from a population can negatively affect population viability. This suggests that an unregulated commercial harvest of Painted Turtles in Minnesota could easily become unsustainable. We discuss how these results are influenced both by Painted Turtle life history and turtle harvester behavior.
ii

INTRODUCTION Human use of turtles has been implicated in the population decline and extinction of several turtle species (Thorbjarnarson et al. 2000). This harvest occurs primarily for food and the pet trade. Turtle life-history characteristics, such as delayed sexual maturity and high juvenile and adult survival, limit the harvest potential of these animals and make them vulnerable to exploitation (Congdon et al. 1993, 1994; Klemens and Thorbjarnarson 1995; Reed et al. 2002). Population models, based on long-term studies, show that a small increase in subadult and adult mortality in turtles can negatively impact long-term population viability (Congdon et al. 1993, 1994; Crouse et al. 1997; Reed et al. 2002). Harvest can also affect population demography. Close and Seigel (1997) found Red-eared Sliders (Trachemys scripta elegans) from harvested sites in Louisiana were smaller overall than turtles from similar non-harvested sites. Skewed size distributions could have negative affects on turtle populations because large turtles are responsible for most reproductive output of populations and less susceptible to predation than smaller adults (Brooks et al. 1991). Loss of these animals from populations could result in increased variance in population size potentially causing local extirpation. Existing research, along with a new awareness of an expanding domestic and international trade in turtles for food and pets, has caused many state and federal wildlife agencies to limit or prohibit commercial turtle harvesting (Anonymous 2002, Close and Seigel 1997, Thorbjarnarson et al. 2000). These regulations, however, are often made with little knowledge of the impact of harvest on populations and rarely contain supporting quantitative data, which may limit their utility. To be
effective, management and protection of harvested populations requires an understanding of population structure and the affects of harvest. These sorts of data are difficult to collect in long-lived species like turtles, but short-term studies may provide valuable information on possible affects of harvest on relative abundance and population structure. Painted Turtles (Chrysemys picta) occur throughout the northern United States and southern Canada (Starkey et al. 2003) and are typically the most abundant turtle species within their range (Ernst et al. 1994). They are Minnesota’s most common turtle and occur statewide (Oldfield and Moriarty 1994). Painted Turtles range in size from nine to 18 cm (carapace or shell length) with a maximum carapace length reported from Minnesota of 21.5cm (Oldfield and Moriarty 1994). Painted Turtles are sexually dimorphic, with females larger than males (Ernst et al. 1994). Ye
199 199 199 199 199 199
199
199
199
200
200
ar # Harvesters Total
# Harvesters C. picta # C. picta
1 62 21 124692 83 33 230843 93 30 142804 70 30 550175 69 28 228866 45 16 105627 67 23 220108 74 37 688529 82 27 440960 60 21 254991 67 21 20799
TABLE 1. Eleven year harvest summary of the turtle harvest in Minnesota from harvest license returns. Columns represent the total number of licensed harvesters for each year, the number of harvesters that reported catching Painted Turtles, and the number of Painted Turtles retained. Data courtesy of MNDNR.
1
Minnesota’s Painted Turtles are captured in large numbers for the pet and biological supply trade. Small numbers of Painted Turtles are also collected for turtle races, which are popular summer events in some central Minnesota cities. Turtle harvest permit returns, collected by the Minnesota Department of Natural Resources (MNDNR), show harvest levels vary from 12,469 Painted Turtles in 1991 to 68,852 turtles in 1998 (Table 1). Interviews with commercial harvesters and Minnesota conservation officers indicate that large numbers of turtles are often removed from a single lake. One harvester, using 60 basking traps in 1999, removed over 300 turtles from Pelican Lake in Stearns County (Mies & Rodahl pers. comm.). One harvester reported catching 800 Painted Turtles at one time from Mud Lake in southern Todd County and “thousands” of Painted Turtles over the years from Big Sauk Lake in Stearns and Todd Counties (Campbell pers. comm.). Snapping Turtles (Chelydra serpentina) and Spiny Softshell Turtles (Apalone spinifera) are also commercially harvested for food in Minnesota. In 1981 there were only 35 licensed turtle harvesters in the state (Helwig and Hora 1983) while there were at least 60 harvesters per year in all but one of the last eleven years (Table 1). The number of harvesters and captured turtles fluctuates and harvesters indicate that this is related to changing prices for turtles (harvesters receive $1.00 to $2.00 per Painted Turtle) as well as the time demands of other business ventures. Many turtle harvesters also operate commercial fisheries and will put more effort into fisheries as demand
warrants resulting in less time trapping turtles. The impact of the harvest on Painted Turtle populations in Minnesota is not known but there are concerns about its sustainability (Lang and Karns 1988). This report details the results of a two-year study on the effects of harvest on Painted Turtle populations. This study has four objectives:
1. Determine the effects of past commercial harvest on sample Painted Turtle populations in Minnesota.
2. Develop a computer model of Painted Turtle population dynamics.
3. Characterize the practices used by current commercial Painted Turtle harvesters in Minnesota.
4. Evaluate the social, cultural, and economic importance of the commercial Painted Turtle harvest in Minnesota.
Each of these objectives is fulfilled in this report. Chapter one focuses on determining the effects of past harvest. Chapter two explores computer models that simulate Painted Turtle harvest. Appendix A details harvester methods. Additional information about harvester methods as well as the social, cultural, and economic importance of the harvest occurs throughout the report. Appendix B provides information about the lakes used in this study. Appendix C provides details about the marking techniques we used so that others can identify and potentially continue monitoring the marked Painted Turtles from this study.
2

3
CHAPTER ONE: THE IMPACT OF COMMERCIAL HARVEST ON PAINTED
TURTLES IN MINNESOTA The impact of the commercial Painted Turtle harvest in Minnesota is unknown but there are concerns that it may not be sustainable (Lang and Karns 1988). Until 2002, the collection of Painted Turtles in Minnesota was regulated only by the number and type of equipment that a licensed harvester could use. This chapter reports on the impact of harvest on Painted Turtle populations by comparing relative abundance and size-sex distributions between harvested and non-harvested lakes in central Minnesota over a two-year period. The data and results presented here provide the first quantitative study of population and demographic changes resulting from Minnesota’s commercial turtle harvest.
METHODS We sampled 22 lakes ranging in size from six to 136 ha (Appendix B). Lakes were categorized as harvested or non-harvested based on recent trapping activity. Harvest status was determined based on interviews with MNDNR conservation officers, turtle harvesters, and land managers. All non-harvested lakes occurred on protected land such as state and county parks or wildlife refuges and most had no public boat access. Multiple lakes were sampled in each harvest category to minimize the confounding effects of local environmental factors such as lake size, productivity, predator abundance, and availability of nesting sites and to ensure that any effects were not due to unusual situations arising from examining only one or two lakes in each harvest condition. Each lake was sampled at
least six times from late June through September 2001 and mid May through late August 2002. Each sample period lasted approximately 24 hours. Secchi depth, used as a proxy for lake productivity, was measured for all lakes from 16 July 2002 through 23 August 2002. Turtles were captured using basking traps, baited hoop traps, and by hand. We used basking traps similar in design to the commercial harvester’s to replicate their methods (Appendix A). Hoop traps, made by Memphis Net and Twine (Memphis, TN), were 72 cm in diameter, and possessed a single ‘throat’ at the entrance. We used canned sardines packed in soybean oil as bait. Multiple sampling techniques are recommended to eliminate biases estimating population size and structure (Koper and Brooks 1998, Ream and Ream 1966). Basking traps and baited hoop traps were set in areas likely to catch turtles. Traps were placed near the shoreline adjacent to cattails and other emergent vegetation in spring and early summer and moved out from shore and set near floating mats of vegetation in mid to late summer. We also set traps near sites were C. picta were observed basking. These are the same criteria that commercial harvesters report using to set their traps. We recorded the kind of trap each turtle was caught in and measured the straight-line carapace length (CL). Measurements were taken to the nearest 0.1 cm. We used front claw length and position of the cloaca relative to the rear edge of the carapace to classify each captured turtle as male or female. Turtles with no discernable secondary sex characteristics and a carapace length less than nine to ten cm were considered juveniles. Turtles were also assigned an individual identification code that was drilled into the marginal scutes of their carapace (Appendix C).

To estimate the relative abundance of turtles, measured as catch per unit effort (CPUE), we calculated the number of captured C. picta per trap-hour for every sample interval. Trap-hours are the number of traps on a lake multiplied by the number of hours set. Catch rates for basking and hoop traps were analyzed separately based on differential trap efficiencies; basking traps caught more turtles per trap hour than hoop traps (Appendix A). The CPUE data were log transformed to correct skewed frequency distributions (lnCPUE). We used a t-test to compare mean lnCPUE for each lake between harvested and non-harvested lakes. We also compared mean lnCPUE between the two harvest conditions using a multiple
linear regression model incorporating environmental variables that affect turtle abundance. The model includes, harvest status; lake area; lake productivity, measured as secchi depth; and an interaction effect between area and secchi depth. Nested analysis of variance (ANOVA), with lakes nested within harvest condition, was used to determine whether body size (measured as CL) is correlated to harvest condition. The carapace measurements of males and females were considered separately because Painted Turtles are sexually dimorphic. We included only sexable turtles with CL greater than nine cm in these analyses.
Lake County Harvested Area (ha) Secchi (m) # marked # captured
Half Moon Hennepin No 11 1.7 71 78Spurzem Hennepin No 28 1.0 143 162Henschien Kandiyohi No 26 2.9 112 121Lake 21 (Sibley) Kandiyohi No 8 1.4 198 237Gemini East Stearns No 12 0.9 43 59Gemini West Stearns No 6 0.8 57 67Sagatagan Stearns No 64 2.6 98 98Stump Stearns No 31 1.5 88 91Bjorkland Wright No 15 0.8 75 91Maria Wright No 44 0.4 805 1124Beaver Stearns Yes 62 2.3 75 80Black Oak * Stearns Yes 48 0.7 134 138Cedar Stearns Yes 36 1.3 27 27Goodners Stearns Yes 61 1.1 50 54Long Stearns Yes 28 1.8 123 135Pelican Stearns Yes 136 3.1 53 54Sylvia Stearns Yes 33 1.4 33 41Cedar Todd Yes 64 3.6 29 29Guernsey Todd Yes 51 0.8 57 61Little Sauk Todd Yes 108 1.0 50 51Long Todd Yes 87 4.1 31 31Mary Todd/Stearn Yes 42 1.6 122 127
* Not included in analyses
TABLE 1.1. Summary of the number of Painted Turtles trapped for each lake. This includes: harvest status; lake area; secchi depth; the number of marked Painted Turtles (# marked) in the lake; and the total number of captured Painted Turtles (# captured) for each lake, including recaptures.
4
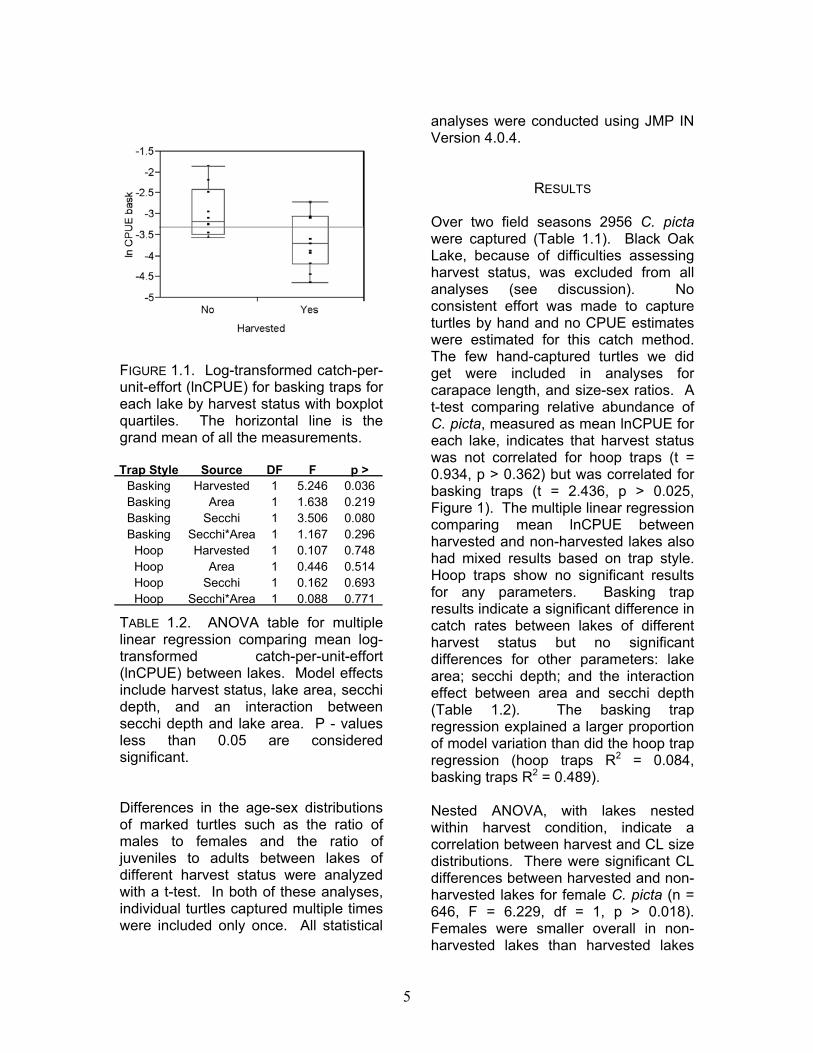
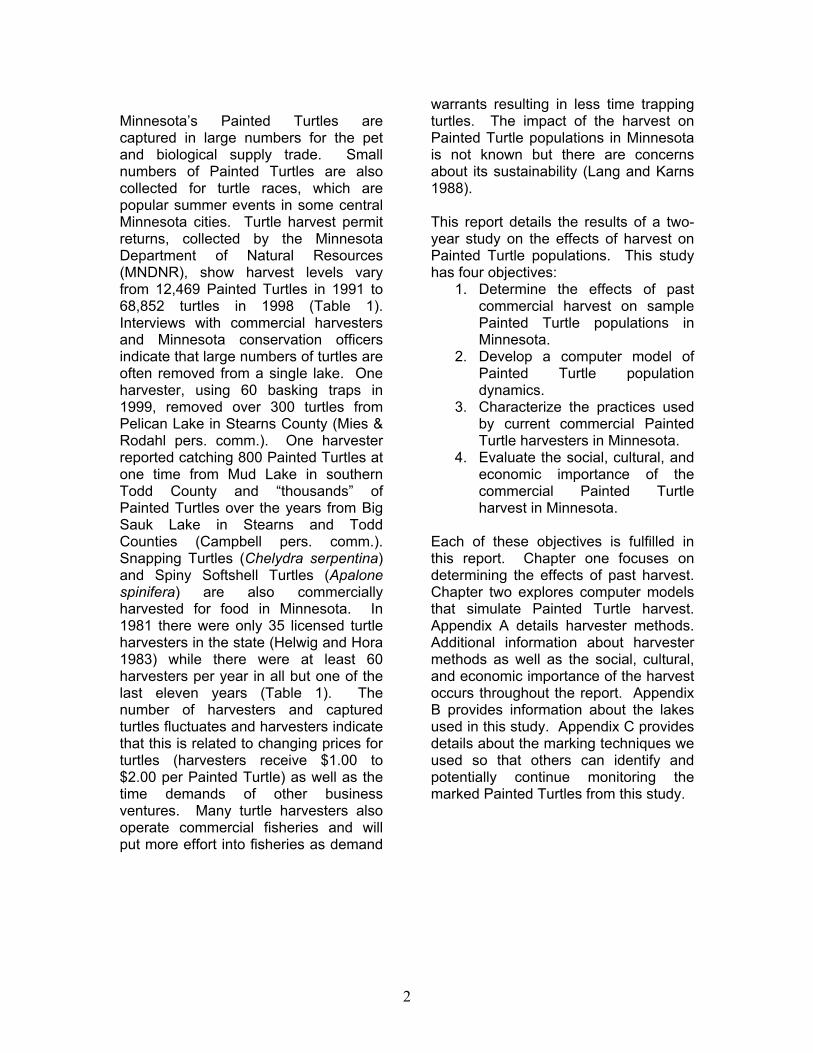
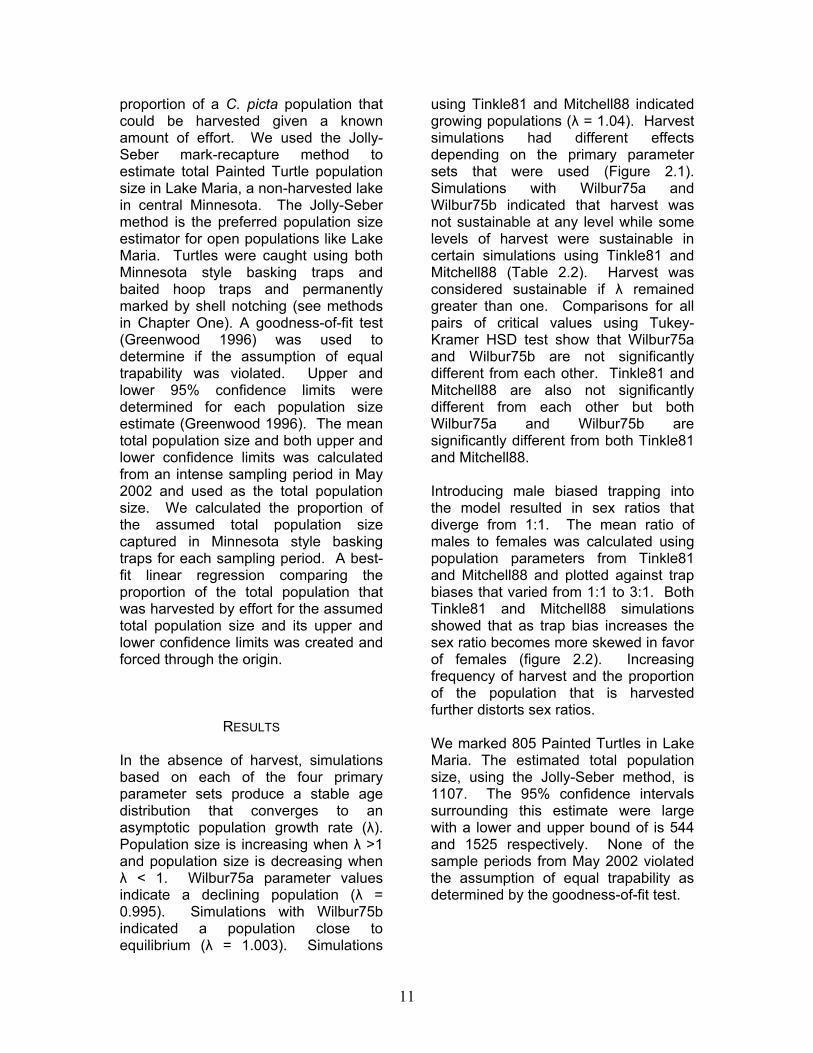
FIGURE 1.1. Log-transformed catch-per-unit-effort (lnCPUE) for basking traps for each lake by harvest status with boxplot quartiles. The horizontal line is the grand mean of all the measurements. TABLE 1.2. ANOVA table for multiple linear regression comparing mean log-transformed catch-per-unit-effort (lnCPUE) between lakes. Model effects include harvest status, lake area, secchi depth, and an interaction between secchi depth and lake area. P - values less than 0.05 are considered significant. Differences in the age-sex distributions of marked turtles such as the ratio of males to females and the ratio of juveniles to adults between lakes of different harvest status were analyzed with a t-test. In both of these analyses, individual turtles captured multiple times were included only once. All statistical
analyses were conducted using JMP IN Version 4.0.4.
RESULTS Over two field seasons 2956 C. picta were captured (Table 1.1). Black Oak Lake, because of difficulties assessing harvest status, was excluded from all analyses (see discussion). No consistent effort was made to capture turtles by hand and no CPUE estimates were estimated for this catch method. The few hand-captured turtles we did get were included in analyses for carapace length, and size-sex ratios. A t-test comparing relative abundance of C. picta, measured as mean lnCPUE for each lake, indicates that harvest status was not correlated for hoop traps (t = 0.934, p > 0.362) but was correlated for basking traps (t = 2.436, p > 0.025, Figure 1). The multiple linear regression comparing mean lnCPUE between harvested and non-harvested lakes also had mixed results based on trap style. Hoop traps show no significant results for any parameters. Basking trap results indicate a significant difference in catch rates between lakes of different harvest status but no significant differences for other parameters: lake area; secchi depth; and the interaction effect between area and secchi depth (Table 1.2). The basking trap regression explained a larger proportion of model variation than did the hoop trap regression (hoop traps R2 = 0.084, basking traps R2 = 0.489).
Trap Style Source DF F p >Basking Harvested 1 5.246 0.036Basking Area 1 1.638 0.219Basking Secchi 1 3.506 0.080Basking Secchi*Area 1 1.167 0.296
Hoop Harvested 1 0.107 0.748Hoop Area 1 0.446 0.514Hoop Secchi 1 0.162 0.693Hoop Secchi*Area 1 0.088 0.771
Nested ANOVA, with lakes nested within harvest condition, indicate a correlation between harvest and CL size distributions. There were significant CL differences between harvested and non-harvested lakes for female C. picta (n = 646, F = 6.229, df = 1, p > 0.018). Females were smaller overall in non-harvested lakes than harvested lakes
5

Close and Seigel (1997) found a correlation between the CL of Red-eared Sliders (T. s. elegans) and harvest in Louisiana. They found that large turtles were conspicuously absent from harvested lakes. Their results differ from results presented here where harvested lakes had larger female turtles overall than non-harvested lakes. The distinction could possibly indicate a different response to harvest from each species. It could also be the result of harvester selection. In Louisiana, larger T. s. elegans are more valuable to harvesters as they are sold for food or to turtle farms as breeding stock while smaller turtles generally go into the pet trade (Close and Seigel 1997). Harvesters in Minnesota, on the other hand, report that their customers prefer medium sized turtles with CL of ten to 16 cm. Harvesters occasionally keep turtles outside of this size range but most are apparently released.
(mean CL harvested = 14.6 cm ± 2.4, mean CL non-harvested = 13.8 cm ± 2.4). Size differences were also significant in females among lakes within each harvest condition (F = 1.777, df = 19, p > 0.022). We found no significant size differences in male C. picta between harvested and non-harvested lakes (n = 1348, F = 3.365, df = 1, p > 0.079). Although not statistically significant, mean male CL was slightly smaller overall in non-harvested lakes than harvested lakes (mean CL harvested = 12.6 cm ± 2.0, mean CL non-harvested = 12.0 cm ± 1.6). Male C. picta size differences were significant among lakes within each harvest condition (F = 5.834, df = 19, p > 0.0001). Age-sex distributions of marked turtles are not significantly affected by a lake’s harvest condition. This includes the ratio of males to females (t = 1.922, p > 0.0698) and the ratio of juveniles to adults (t = 0.546, p > 0.5912).
We did not to find sex ratio differences in lakes of different harvest status. Most long-term studies of Painted Turtle populations exhibit a 1:1 sex ratio (Ernst et al. 1994). When Painted Turtle sex ratios are not equal they tend to be skewed in favor of males (Ernst et al. 1994). The primary reason for this is that males mature faster than females and therefore enter the adult cohort sooner (Gibbons 1990). Gibbons (1990) lists several other factors that can influence the perceived or actual sex ratios in turtle populations, the most relevant to this study being the sample bias associated with trapping methods. Biased sex ratios in lakes of different harvest status are expected given that basking traps catch more males than females (Appendix A) and that medium sized (10 to 16 cm CL) turtles are preferred by harvesters. The failure to recover conclusive evidence of skewed sex ratios is not surprising since the methods used to reveal the sex ratios are themselves biased (Appendix A).
DISCUSSION Results of this study demonstrate that commercial harvest has significant effects on the relative abundance of Painted Turtles. We caught fewer turtles per unit effort in harvested lakes than in non-harvested lakes for basking traps. The failure to detect differences in relative abundance with hoop traps reflects the ability of turtles to escape from them (Appendix A). The poor fit of the multiple linear regression model for basking traps is likely related to weather variation. Weather is a major factor influencing C. picta basking behavior (Lefevre and Brooks 1995), and therefore the efficiency of the basking traps. We sampled each lake multiple times and in all weather conditions, and chose to leave weather as part of the error variance in these analyses.
6

Therefore, even if the sex ratios are skewed in these populations as a result of harvest, the methods we employed may not be able to recover them. Black Oak Lake, because of problems assigning harvest status, was excluded from all analyses. High water levels in mid 2002 allowed access to the northern portion of the lake that was previously untrappable. Painted Turtles in all age-sex classes were abundant in this section of the lake. Presumably, this newly accessible area was never harvested. Black Oak Lake, including the newly sampled area, seemed to fit better with the non-harvested lakes even though it had been commercially trapped. This suggests that untrappable areas, which are common around many lakes, may be an important source of turtles to repopulate harvested sites. This source-sink scenario may be one reason that harvesters are able to
repeatedly harvest these lakes without causing local extirpation. While harvest does affect the relative abundance of Painted Turtles and female body size, further work is needed to determine its long-term implications. The limitations of a two-year study are obvious and long-term monitoring of harvested and non-harvested populations is recommended. For now, cautious management actions such as those taken by the MNDNR in 2002, are warranted. These changes in harvest regulations limit the number of traps a harvester can use and prohibits new harvesters from obtaining commercial permits. These actions, while not eliminating the harvest, will halt its growth and will help ensure that Painted Turtles remain Minnesota’s most common turtle.
7

CHAPTER TWO: A HARVEST MODEL FOR PAINTED TURTLES
Painted Turtles (Chrysemys picta) are commercially harvested in Minnesota for the pet trade and the biological supply trade. This study has shown that the relative abundance and demography of painted turtle populations are affected by this harvest (Chapter One). While it is important to evaluate the past effects of harvest on Painted Turtle populations there is also a need to predict future impacts of continued harvest. This is best achieved through the application of computer modeling. Population models, based on long-term population studies, show that a small increase in subadult or adult mortality can negatively impact long-term population viability in several other turtle species (Congdon et al. 1993, 1994; Crouse et al. 1997; Reed et al. 2002). This suggests that even low levels of harvest can have harmful effects on turtle populations. Models that simulate harvest and generate population projections are important tools for fisheries and wildlife managers. They allow the user to manipulate population parameters and observe potential outcomes under a variety of management scenarios. This flexibility to manipulate parameters provides a model’s strength. Models also force managers to explicitly state their assumptions about how a system works. The violation of these assumptions in the real world often provides important insights into the
system in question (Starfield and Bleloch 1991). In this chapter, we describe the results of several simulations, based on a simple age-structured matrix model (Donovan and Welden 2002), which examines the effects of harvest on Painted Turtle populations. The results of such analyses are plausible trends in population size that can be used to develop management strategies. We ran this model varying life history parameters taken from previous long-term studies on C. picta. We also ran simulations with additional parameters added to examine the potential effects of male trap bias on Painted Turtle populations. This was done because the basking traps used by commercial turtle harvesters are biased, catching significantly more males than females (Appendix A). Additionally, field experiments were conducted that attempt to determine the proportion of the total Painted Turtle population susceptible to harvest for varying degrees of effort. This allowed us to relate harvest effort to the long-term viability of harvested Painted Turtle populations.
METHODS Little is known about the growth rates, life span, survival probabilities, or age at maturity of Painted Turtles in Minnesota, therefore model parameters were obtained from population life tables in the literature. We used results from
Adult Subadult Juvenile Nest 0.76 0.76 0.76 0.18 6.6 7 50 0.995 Wilbur, 1975 a0.85 0.82 0.82 0.08 6.6 7 50 1.003 Wilbur, 1975 b0.76 0.76 0.76 0.67 2.8 7 35 1.04 Tinkle et al. 19810.963 0.944 0.46 0.19 4.1 8 35 1.04 Mitchell 1988
Population Growth Rate SourceSurvival Fecundity Age at
maturity Max. Age
TABLE 2.1. Population model parameter values from each of the primary parameter sets.
8

9
several long-term studies to express the variation that likely occurs among populations. Data from Wilbur (1975) and Tinkle et al. (1981) are from the same C. picta population on the E. S. George reserve in Michigan that has been monitored since 1953. Wilbur (1975) presented life history data from this population in two life tables, one represents the Painted Turtle population in 1952 and the other represents it for 1972. Mitchell’s (1988) data are from a C. picta population in Virginia. Four primary parameter sets were derived from the literature: Wilbur75a, the 1972 data from Wilbur (1975); Wilbur75b, the 1954 data from Wilbur (1975); Tinkle81 (Tinkle et al. 1981), and Mitchell88 (Mitchell 1988). Model input consists of four life history parameters. The first model parameter is survival probability, which is the probability that an individual in age class i will survive to the next age class, i + 1. Different age classes have different survival probabilities and the placement of individuals into each age class varies depending on the source parameters. Wilbur (1975) and Tinkle et al. (1981), for example, had three age classes for their Painted Turtle populations while Mitchell (1988) had four. In all sources, adults were animals greater than or equal to the age at maturity, which for Wilbur (1975) and Tinkle et al. (1981) is seven-years-old and Mitchell (1988) is eight-years-old. Mitchell (1988) assigned separate survival probabilities to subadults and juveniles. Juveniles were turtles from age one to three and subadults from age four to seven. Wilbur (1975) and Tinkle et al. (1981) did not distinguish between the subadult and juvenile stages and instead have a juvenile age class that includes turtles in age class one to six-years-old. To maintain consistency with Mitchell’s (1988) parameters, we separated Wilbur (1975) and Tinkle et al.’s (1981) juvenile age class into subadult and juvenile
categories but both age classes have equal survival probabilities. Age class one represents the time from emergence from the nest through the hatchling’s first year. The final age class is for nest survival at age class zero. This is the period from egg laying to emergence from the nest. Most Painted Turtles overwinter in their nests so emergence typically occurs in following spring (Oldfield and Moriarty 1994). All survival probabilities in this model are deterministic and lack stochastic variation. Values for the survival probabilities from the literature are in Table 2.1. The second model parameter is fecundity, which is the number of female eggs produced annually by each female. This model assumes that hatchlings are produced in a 1:1 sex ratio and that all adult females produce the same number of offspring regardless of age or body size. Parameter values ranged from 2.8 to 6.6 female eggs annually per adult female Painted Turtle (Table 2.1). The third model parameter is age at maturity. This parameter, mentioned earlier, is the age at which subadult survival probabilities change to adult survival probabilities. Age at maturity also represents the age when females begin egg production. Age at maturity was seven-years-old for Wilbur (1975) and Tinkle et al. (1981) and eight-years-old for Mitchell (1988) (Table 2.1). The fourth model parameter is maximum age. Wilbur (1975) set this parameter at 50 years and Tinkle et al. (1981) at 35 years. Because Mitchell (1988) does not report longevity for his populations, this parameter was set to 35 years for the Mitchell (1988) simulations based on reported longevities from the literature (Frazer et al. 1990) and the value used by Tinkle et al (1981) (Table 2.1).

The addition of harvest adds two further parameters to the model: the proportion of the female population that is harvested and the frequency of harvest. Harvesters do not collect eggs (age class zero) and rarely capture small juveniles (age class one) therefore; the proportion of the female population harvested does not include age classes 0 or 1. Most of the assumptions associated with this model are mentioned in the previous descriptions of the parameters but other assumptions include: all individuals are equally trappable; the populations are closed, meaning there is no immigration or emigration; there is no density dependent response to harvest, that is, fecundity and individual growth rates do not change in turtle populations subject to harvest; and the overall population maintains a 1:1 sex ratio. All model simulations were run for a 100 year time period. Running simulations over this time period produced convergence on a stable age distribution where the proportion of individuals in each age class is constant. This convergence means that the time specific growth rate λt, or the change in population size from time (tt) to time (tt+1) will also converge to the asymptotic growth rate or λ. This allowed us to project population size at some point in the future and to determine if population size is increasing or decreasing. A sensitivity analysis was conducted on these harvest parameters by varying the proportion of the harvested female population from 0% to 100%, in 1% increments, and the frequency of harvest from every year to every five years. This was done for all four primary parameter sets (Wilbur75a, Wilbur75b, Tinkle81, and Mitchell88). We determined the critical values for each of the primary parameter sets. The critical value is the greatest
proportion of the female population that can be harvested before λ drops below one and the population begins to decline. We compared all pairs of these critical values using Tukey-Kramer honestly significant difference (HSD) test. This test compares multiple pairs of means to determine if they are significantly different. A variation of this model was set up to evaluate the impact of male biased trapping on Painted Turtle populations because basking traps used by commercial turtle harvesters catch significantly more males than females (Appendix A). This model includes both sexes and a new model parameter called trap bias. Trap bias is defined as the ratio of males to females captured by the basking traps. The proportion of the male population harvested was calculated by multiplying the proportion of the female population that is harvested times the trap bias parameter. The population was assumed to have a 1:1 sex ratio at the start of the simulation and males are assumed to have the same survival probabilities as females of the same age. All other assumptions were the same as the previous simulations. A sensitivity analysis was run to explore the implications of varying trap bias from a 1:1 to 3:1 male:female sex ratio. The proportion of the female population that is harvested was set at three levels, 5%, 10%, and 15%. Simulations were run over a time frame of 100 years. Standard population parameters were taken from Tinkle et al. (1981) and Mitchell (1988). Only these sources were used because both of these populations were growing (λ > 1, see results), and they provide more constructive estimates of the results of sex biased trapping than populations at equilibrium or in decline. To better understand the model results, we determined experimentally the
10
proportion of a C. picta population that could be harvested given a known amount of effort. We used the Jolly-Seber mark-recapture method to estimate total Painted Turtle population size in Lake Maria, a non-harvested lake in central Minnesota. The Jolly-Seber method is the preferred population size estimator for open populations like Lake Maria. Turtles were caught using both Minnesota style basking traps and baited hoop traps and permanently marked by shell notching (see methods in Chapter One). A goodness-of-fit test (Greenwood 1996) was used to determine if the assumption of equal trapability was violated. Upper and lower 95% confidence limits were determined for each population size estimate (Greenwood 1996). The mean total population size and both upper and lower confidence limits was calculated from an intense sampling period in May 2002 and used as the total population size. We calculated the proportion of the assumed total population size captured in Minnesota style basking traps for each sampling period. A best-fit linear regression comparing the proportion of the total population that was harvested by effort for the assumed total population size and its upper and lower confidence limits was created and forced through the origin.
RESULTS In the absence of harvest, simulations based on each of the four primary parameter sets produce a stable age distribution that converges to an asymptotic population growth rate (λ). Population size is increasing when λ >1 and population size is decreasing when λ < 1. Wilbur75a parameter values indicate a declining population (λ = 0.995). Simulations with Wilbur75b indicated a population close to equilibrium (λ = 1.003). Simulations
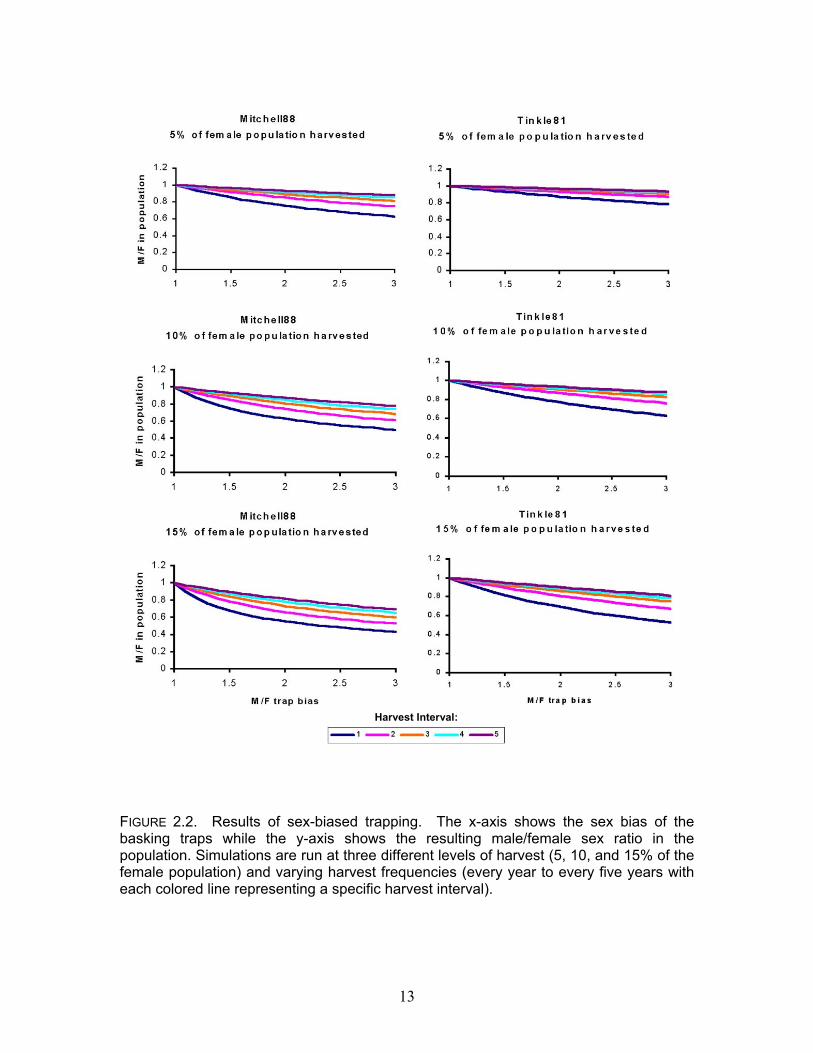
using Tinkle81 and Mitchell88 indicated growing populations (λ = 1.04). Harvest simulations had different effects depending on the primary parameter sets that were used (Figure 2.1). Simulations with Wilbur75a and Wilbur75b indicated that harvest was not sustainable at any level while some levels of harvest were sustainable in certain simulations using Tinkle81 and Mitchell88 (Table 2.2). Harvest was considered sustainable if λ remained greater than one. Comparisons for all pairs of critical values using Tukey-Kramer HSD test show that Wilbur75a and Wilbur75b are not significantly different from each other. Tinkle81 and Mitchell88 are also not significantly different from each other but both Wilbur75a and Wilbur75b are significantly different from both Tinkle81 and Mitchell88. Introducing male biased trapping into the model resulted in sex ratios that diverge from 1:1. The mean ratio of males to females was calculated using population parameters from Tinkle81 and Mitchell88 and plotted against trap biases that varied from 1:1 to 3:1. Both Tinkle81 and Mitchell88 simulations showed that as trap bias increases the sex ratio becomes more skewed in favor of females (figure 2.2). Increasing frequency of harvest and the proportion of the population that is harvested further distorts sex ratios. We marked 805 Painted Turtles in Lake Maria. The estimated total population size, using the Jolly-Seber method, is 1107. The 95% confidence intervals surrounding this estimate were large with a lower and upper bound of is 544 and 1525 respectively. None of the sample periods from May 2002 violated the assumption of equal trapability as determined by the goodness-of-fit test.
11
Harvest Interval:
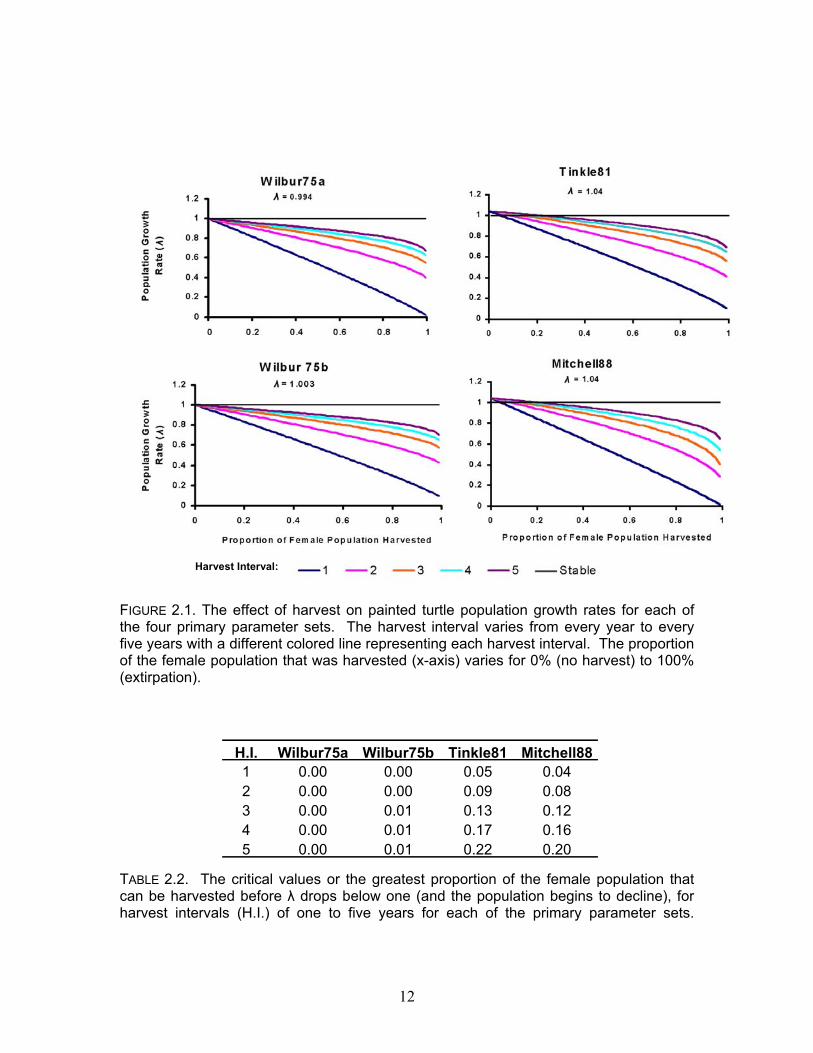
FIGURE 2.1. The effect of harvest on painted turtle population growth rates for each of the four primary parameter sets. The harvest interval varies from every year to every five years with a different colored line representing each harvest interval. The proportion of the female population that was harvested (x-axis) varies for 0% (no harvest) to 100% (extirpation). H.I. Wilbur75a Wilbur75b Tinkle81 Mitchell88
1 0.00 0.00 0.05 0.042 0.00 0.00 0.09 0.083 0.00 0.01 0.13 0.124 0.00 0.01 0.17 0.165 0.00 0.01 0.22 0.20
TABLE 2.2. The critical values or the greatest proportion of the female population that can be harvested before λ drops below one (and the population begins to decline), for harvest intervals (H.I.) of one to five years for each of the primary parameter sets.
12
Harvest Interval:
FIGURE 2.2. Results of sex-biased trapping. The x-axis shows the sex bias of the basking traps while the y-axis shows the resulting male/female sex ratio in the population. Simulations are run at three different levels of harvest (5, 10, and 15% of the female population) and varying harvest frequencies (every year to every five years with each colored line representing a specific harvest interval).
13

T.
32
61
76
1214 15
H. # of turtles N Lower C.I. Upper C.I.0 59 5.3 10.8 3.96 117 10.6 21.5 7.70 51 4.6 9.4 3.319 309 27.9 56.8 20.355 192 17.3 35.3 12.603 264 23.9 48.5 17.3
DISCUSSION Life history traits such as delayed reproduction and increased longevity make turtles sensitive to relatively small decreases in adult survivorship (Congdon et al. 1993), so that a small decrease in annual subadult or adult survival can negatively impact long-term population viability. Reed et al. (2002) showed that an annual increase in adult mortality in female Alligator Snapping Turtles (Macrochelys temminckii) by less that 1% would result in population declines. Similarly, Congdon et al. (1994) found that Snapping Turtle (Chelydra serpentina) populations would be negatively affected by an annual harvest of 10% of adult females. Our results indicate that Painted Turtles are susceptible to over harvest with an annual removal of only 4-5% of the female population (Table 2.2). This sensitivity to harvest is in line with the previously mentioned turtle species.
TABLE 2.3. Lake Maria trapping results from 2001 and 2002 showing the percentage of the total population captured when the total population (N) = 1107, Lower 95% Confidence Interval (Lower C.I.) = 544, Upper 95% Confidence Interval (Upper C.I.) = 1525. T.H. is trap hours.
An approximation of the proportion of the total population that can be captured illustrates the potential impact of commercial harvest. An increasing proportion of the total population is captured as harvest effort increases. Projections from the linear regression, for example, indicate that 20 to 30% of the total population of a lake could be harvested in 2000 trap hours (using the more realistic estimates of total population size: N and the Upper 95% C.I., see below). This is approximately two days of trapping for a commercial turtle harvester (40 traps set for 48 hours). Most commercial harvesters set their traps for longer than this (up to two weeks per lake). It’s important to note that this is an estimate based on the total population size and that less than half of the turtles captured would likely be females. The latter assumption depends on the sex bias of the trapping
FIGURE 2.3. Effect of harvest effort on the Lake Maria turtle population. Triangles (and regression line a) represent the proportion of the population removed when N = 1525 (Upper 95% C.I.); Circles (and regression line b) represent the proportion of the population removed when N = 1107 (estimated population size); and Squares (and regression line c) represent the proportion of the population removed when N = 544 (Lower 95% C.I.). The proportion of the total population that might be removed increased as harvest effort increased (Table 2.3 and Figure 2.3).
14
methods and the actual sex ratio in the population. If biased traps catch 1.5 to 3 times as many males as females (Appendix A), assuming a 1:1 sex ratio in the population, a harvester could remove approximately five to 12% of the female turtles from a lake in just two days. That is equal to or greater than the critical values that can be sustainably harvested, on an annual basis, from growing Painted Turtle populations (Table 2.2). Increasing effort by setting more traps or setting traps for longer periods of time would add to a harvester’s impact. Previous studies on the affects of reduced survival and harvest on turtle populations have focused on annual survival reductions (Congdon et al. 1993, 1994; Reed et al. 2002). This may be realistic when investigating the mortality from roads or other forms of continuous take of turtles but the Painted Turtle harvest in Minnesota is spread over many lakes and there is rarely a sustained, annual harvest on any specific population. Some commercial turtle harvesters claim to harvest specific lakes on a rotating basis every four to five years. This does not, of course, prevent other harvesters from trapping the same lake on the off years; however most lakes are normally not trapped every year. The inclusion of variable harvest frequency into the model therefore provides a more realistic impression of the possible effects of harvest on Painted Turtles in Minnesota. Infrequent harvest, allows a larger proportion of the population to be harvested (keeping λ > 1) than annual harvesting. The Tinkle81 and Mitchell88 models both had similar population growth rates (λ = 1.04) and each responded similarly to harvest pressure. This was surprising given differences in life history parameters between the two populations. Mitchell88 had higher adult
survival than Tinkle81, 0.963 vs. 0.76 respectively but lower nest survival, 0.19 vs. 0.67 respectively. Heppell (1998) analyzed several turtle species using elasticity analysis to compare the proportional contribution of vital life history parameters (such as survival probabilities and fecundity) to their annual population growth rate (λ). She found that in Mitchell’s (1988) Virginia population, adult survival probabilities had a greater proportional contribution to λ than subadult or juvenile survival probabilities and fecundity (Figure 2.4). Adult survival probabilities from the Tinkle et al. (1981) paper had a similar contribution to λ as the subadult and juvenile survival probabilities all of which contributed more than fecundity (Figure 2.4). As a parameter’s contribution to the annual population growth rate (λ) increases, small changes in that parameter will have significant influence on λ. The sensitivity to change in adult survival therefore should make a population like Mitchell’s (1988) more susceptible to harvest than the population examined by Tinkle et al. (1981). Our inability to confirm Heppell’s (1998) results is possibly due to differences in the fecundity parameter used between our study and Heppell’s. Heppell (1998) used 2.05 female eggs annually per each female based on Mitchell’s (1988) clutch size of 4.1 eggs per female. We used the same clutch size but assumed that each female laid two clutches per year based on data from Mitchell’s (1988) Table 10. Changing the fecundity parameter to 2.05 in Mitchell88 simulations, without harvest, results in a change in λ from 1.04 to 1.003. This indicates a population at or close to equilibrium rather than a growing population as inferred from our data and analyses. Differences in response to harvest between the different primary parameter sets indicate that Painted Turtle
15

FIGURE 2.4. Elasticity analysis of population parameters from three Painted Turtle studies. From Heppell (1998). populations will exhibit varying reactions to harvest. Variation in survival probabilities and their resultant population growth rates have significant importance in determining harvest response. Violations of the model assumptions can also affect predictions of a population’s reaction to harvest. The example of Black Oak Lake (Chapter One) indicates that there are areas in or adjacent to some lakes that cannot be trapped. These areas can serve as sources of immigration thereby violating the assumption of a closed population. Untrappable areas could also operate as a refuge from harvest thus violating the assumption of equal trappability. Both of these scenarios would reduce the impact of harvest on the population. Another model assumption that is most certainly violated is that input parameters behave in a deterministic fashion. Variation in parameter values and population growth rates from the single Painted Turtle population in Michigan (Wilbur 1975 and Tinkle et al. 1981) over 25 years indicates that life
history parameter values are not constant and change over time. This sort of temporal variation can be modeled stochastically but establishing the necessary parameter values is difficult to do a priori. Additionally, the output of a stochastic model takes the form of a probability (Starfield and Bleloch 1991), which can be difficult to interpret in a resource management setting. It’s not surprising that sex ratios diverge from 1:1 in simulations employing both sexes under the influence of male biased trapping. It is important to note that this model is exploring the impact on the actual sex ratios in the population as compared to the perceived or observed sex ratios. Because males mature faster than females and therefore enter the adult cohort sooner, the observed sex ratios may be male biased (Gibbons 1990). The difficulty then exists in resolving the model with nature. This study has shown that there are no significant differences in sex ratio between Painted Turtle populations in harvested and non-harvested lakes
16
(Chapter One). It is difficult to know if this reflects reality or if trap bias and differential rates of sexual maturation make it impossible to elucidate using current methods. The large confidence intervals from the Jolly-Seber estimates of population size indicate that the estimates are likely imprecise. This is compounded by the fact that the lower confidence interval is in fact smaller than the actual number of marked turtles in the population! This suggests that the actual Painted Turtle population of Lake Maria is larger than the estimate and possibly larger than the upper 95% confidence interval. The difficulty estimating population size for Painted Turtles has been reported previously and is attributed to inadequate sample size and unequal probability of capture (Koper and Brooks 1998, and Burke et al. 1995). While difficulties exist with this population size estimate it should be seen as a first step to determining the proportion of a population that can be removed per unit effort. The primary parameter sets used in this model exhibited variation between populations and temporal variation within a single population. It is possible therefore, that arbitrarily using parameters from the literature might not accurately predict the effects of harvest on any single Painted Turtle population in Minnesota. Further research into the demography of turtle populations within the state is needed focusing on survival probabilities, fecundity, age at maturity, and maximum age. It would also be useful to examine critically the assumptions of the model addressing the deterministic nature of life history parameters and the limits of populations. In this study, we defined
populations using lake margins but in reality, populations may occur over a larger or smaller area. Additionally, we focused on the effects of harvest on sex ratios and population growth rates. There may be, however, density dependent response to harvest such as increased individual growth rates, and increased fecundity. This could have a profound impact on model simulations. Investigating these possible respones will provide more insight into the effects of harvest and provide information on the basic biology of these animals. The results of these model simulations suggest that Painted Turtles respond to harvest in a manner similar to most other turtle species and that small increases in subadult and adult mortality can negatively impact long-term population viability. We have shown that these small increases in mortality are within the range of Minnesota turtle harvesters’ capability and that increasing effort has a growing negative effect on population viability. Model simulations also indicate that Painted Turtle populations will respond differently to harvest based on local life history parameters as well as the frequency and intensity of the harvest itself. Turtle populations at equilibrium or already in decline (such as Wilbur75a and Wilbur75b) cannot tolerate any level of commercial harvest while growing populations (such as Tinkle81 and Mitchell88) can tolerate some level of harvest under certain conditions. This implies that to “manage” a turtle harvest, resource managers should first define the population and then determine life history parameters specific to that population. The model we developed offers a framework to build on if this is the path that is taken.
17

SUMMARY AND RECOMMENDATIONS Painted Turtles are the most common turtle in Minnesota. Anyone who has spent time fishing on Minnesota lakes will be familiar with the sight of these turtles basking on logs and other structures. Painted Turtles are important to the economies of several rural towns. Some towns in central Minnesota sponsor turtle races in the summer that draw large crowds and provide valuable revenue. These events rely on large and accessible turtle populations. The human use of turtles has been well documented but the effect of this exploitation on wild turtle populations has rarely been evaluated (Thorbjarnarson et al. 2000). This report documents the first attempt to assess the impact of commercial harvest on Painted Turtles. The results indicate that painted turtle populations in Minnesota have been affected by commercial harvest activities. Harvest can lower the relative abundance of Painted Turtles and alter population demographies. We have also shown, through model simulations, that the removal of even a small proportion of the females from a population can negatively affect population viability and that the proportion of the population that is removed increases as harvester effort increases. This suggests that an unregulated commercial harvest of Painted Turtles in Minnesota could easily become unsustainable. This report should be viewed as a starting point for the management of Painted Turtles in Minnesota. While commercial harvest does impact Painted Turtle populations it is not the only threat. Painted Turtles are also vulnerable to lakeshore development, human subsidized predators, wetland loss, and road mortality (Boarman 1997, Gibbs and Shriver 2002, and Mitchell
and Klemens 2000). More information is needed to evaluate the impact of these threats as well as continued work on the effects of commercial harvest. Future research should: 1) determine the range of population parameters in Minnesota Painted Turtle populations; 2) examine the possibility of density-dependent response to harvest; 3) define painted turtle populations in lake-rich landscapes like Minnesota; 4) incorporate more complex population parameters such as immigration and emigration into population models. Our research describes the effects of harvest and provides managers with a model of potential response of Painted Turtle populations to continued harvest. We recommend further study to identify other possible threats to Painted Turtles to ensure that these animals remain a familiar sight and an abundant member of Minnesota’s fauna.
ACKNOWLEDGEMENTS Funding for this project was provided by Minnesota Department of Natural Resources, Division of Ecological Services, Natural Heritage and Nongame Research Program in a grant to Andrew M. Simons, Department of Fisheries, Wildlife, and Conservation Biology & the Bell Museum, University of Minnesota. Minnesota State Parks, Three Rivers Park District, St. John’s University and Abbey provided access to lakes. Roy Johannes provided access to the MN DNR harvester permit information. We are grateful to Leah Class, Jacob Egge, Tony Faust, Brett Nagle, Cassie Phillips, and Krishna Yuvaraj for their help in the field. Brian Mies and Dave Rodahl provided information about lake status and harvest operations. Jeff Lang, John Moriarty, Peter Berendzen, and Rich Baker offered helpful comments on the
18

project and the text. Rex Campbell and other commercial harvesters shared their experiences trapping Painted Turtles. Ed Quinn and Jack Wingate provided assistance with permits. All trapping was conducted under MN DNR special permits 10457 and 10785 and MN State Parks permits 2001-35 and 2002-12. Animal use follows animal care protocol No. 0105A99921.
BIBLIOGRAPHY
ANONYMOUS. 2002. Commercial herp trade ends in Nebraska / commercial snapping turtle trade ends in Maine. Turtle and Tortoise Newsletter 6:36. BIDER, J. R. AND W. HOEK. 1971. An efficient and apparently unbiased sampling technique for population studies of painted turtles. Herpetologica 27: 481-484. BOARMAN, W. I. 1997. Predation on turtles and tortoises by a “subsidized predator.” Pp 103-104. In Proceedings: Conservation, Restoration, and Managements of Tortoises and Turtles – An International Conference. J. Van Abbema (ed.). New York Turtle and Tortoise Society, New York. BROOKS, R. J., G. P. BROWN, AND D. A. GALBRAITH. 1991. Effects of a sudden increase in natural mortality of adults on a population of the common snapping turtle (Chelydra serpentina). Can J. Zool. 69:1314-1320. BURKE, V. J., J. L. GREENE, AND J. W. GIBBONS. 1995. The effect of sample size and study duration on metapopulation estimates fro slider turtles (Trachemys scripta). Herpetologica 51: 451-456. CAGLE, F. R. 1950. The life history of the slider turtle, Pseudemys scripta troostii (Holbrook). Ecol. Monogr. 20: 31-54.
CLOSE, L. M. AND R. A. SEIGEL. 1997. Differences in body size among populations of red-eared sliders (Trachemys scripta elegans) subjected to different levels of harvesting. Chelonian Conserv. Biol. 2:563-566. CONGDON, J. D., A. E. DUNHAM, AND R. C. VAN LOBEN SELS. 1993. Delayed sexual maturity and demographics of Blanding’s turtles (Emydoidea blandingii): Implications for conservation and management of long-lived organisms. Conserv. Biol. 7: 826-833. CONGDON, J. D., A. E. DUNHAM, AND R. C. VAN LOBEN SELS. 1994. Demographics of common snapping turtles (Chelydra serpentina): Implications for conservation and management of long-lived organisms. Amer. Zool. 34:397-408. CROUSE, D. T., L. B. CROWDER, AND H. CASWELL. 1997. A stage-based population model for loggerhead sea turtles and implications for conservation. Ecology 68: 1412-1423. DONOVAN, T. M. AND C. W. WELDEN. 2002. Spreadsheet Exercises in Conservation Biology and Landscape Ecology. Sinauer Associates, Inc. Sunderland. ERNST, C. H., J. E. LOVICH, AND R. W. BARBOUR. 1994. Turtles of the United States and Canada. Smithsonian Institution Press, Washington D.C. FRAZER, N. B., J. W. GIBBONS, AND J. L. GREENE. 1990. Growth, survivorship and longevity of painted turtles Chrysemys picta in southwestern Michigan marsh. Am. Midl. Nat. 125: 245-258. FRAZER, N. B., J. W. GIBBONS, AND T. J. OWENS. 1990. Turtle trapping: preliminary tests of conventional wisdom. Copeia 1990: 1150-1152.
19

20
GIBBONS, J. W. 1990. Sex Ratios and their significance among turtle populations. pp 171-182. In The Life History and Ecology of the Slider Turtle. J. W. Gibbons (ed.). Smithsonian Institution Press, Washington D.C. GIBBS, J. P. AND W. G. SHRIVER. 2002. Estimating the effects of road mortality on turtle populations. Cons. Biol. 16: 1647-1652. GREENWOOD, J. J. D. 1996. Basic Techniques. Pp 11-110. In Ecological Census Techniques a Handbook. W. J. Sutherland (ed.). Cambridge University Press, Cambridge. HELWIG, D. D. AND M. E. HORA. 1983. Polychlorinated biphenyl, mercury, and cadmium concentrations in Minnesota snapping turtles. Bull. Environm. Contam. Toxicol. 30:186-190. HEPPELL, S. S. 1998. Application of life-history theory and population model analysis to turtle conservation. Copeia 1998:367-375. KLEMENS, M. W. AND J. B. THORBJARNARSON. 1995. Reptiles as a food source. Biodiversity and Conservation 4: 281-298. KOPER, N. AND R. J. BROOKS. 1998. Population-size estimators and unequal catchability in painted turtles. Can. J. Zool. 76: 458-465. LAGLER, K. F. 1943. Methods of collecting freshwater turtles. Copeia 1943: 21-25. LANG, J. W. AND D. KARNS. 1988. Amphibians and Reptiles. pp 323-349 In Minnesota’s Endangered Flora and Fauna. B Coffin and L. Pfannmuller (eds.). University of Minnesota Press, Minneapolis.
LEFEVRE, K. AND R. J. BROOKS. 1995. Effects of sex and body size on basking behavior in a northern population of the painted turtle, Chrysemys picta. Herpetologica 51: 217-224. MACCULLOCH, R. D. AND D. M. GORDON. 1978. A simple trap for basking turtles. Herpetol. Rev. 9: 133. MITCHELL, J. C. 1988. Population ecology and life histories of the freshwater turtles Chrysemys picta and Sternotherus odoratus in an urban lake. Herp. Monogr. 2: 40-61. MITCHELL, J. C. AND M. W. KLEMENS. 2000. Primary and secondary effects of habitat alteration. Pp 5 – 32 In Turtle Conservation. M. W. Klemens (ed). Smithsonian Institution Press, Washington and London. OLDFIELD, B. AND J. J. MORIARTY. 1994. Amphibians and Reptiles Native to Minnesota. University of Minnesota Press, Minneapolis. PETOKAS, P. J. AND M. M. ALEXANDER. 1979. A new trap for basking turtles. Herpetol. Rev. 10: 90. PLUMMER, M. V. 1979. Collecting and Marking. Pp 45-60. In: Turtles: Perspectives and Research. M. Harless and H. Morlock (eds.). 1989 Reprint. Robert E. Kreiger Publishing Company, Inc., Malabar, FL. REAM, C. AND R. REAM. 1966. The influence of sampling methods on the estimation of population structure in painted turtles. Amer. Midl. Natur. 75: 325-338. REED, R. N., J. CONGDON, AND J. W. GIBBONS. 2002. The alligator snapping turtle (Macrochelys [Macroclemys] temminickii): A review of ecology, life history, and conservation, with demographic analyses of the

sustainability of take from wild populations. Report to: Division of Scientific Authority, United States Fish and Wildlife Service. SAJWAJ, T. D., S. A. PIEPGRASS, AND J. W. LANG. 1998. Blanding’s Turtle (Emydoidea blandingii) at Camp Ripley: Critical habitats, population status and management guidelines. Final Report to Nongame Wildlife Office, Minnesota DNR, Brainerd. STARFIELD, A. M. AND A. L. BLELOCH. 1986. Building Models for Conservation and Wildlife Management. Burgess International Group, Inc. Edina. STARKEY, D. E., H. B. SHAFFER, R. L. BURKE, M. R. J. FORSTNER, J. B. IVERSON, F. J. JANZEN, A. G. J. RHODIN, AND G. R. ULTSCH. 2003. Molecular systematics, phylogeography, and the
effects of Pleistocene glaciation in the painted turtle (Chrysemys picta) complex. Evolution 57:119-128. THORBJARNARSON, J., C. L. LAGEUX, D. BOLZE, M. W. KLEMENS, AND A. B. MEYLAN. 2000. Human use of turtles. Pp 33 – 84. In Turtle Conservation. M. W. Klemens (ed). Smithsonian Institution Press, Washington and London. TINKLE, D. W., J. D. CONGDON, AND P. C. ROSEN. 1981. Nesting frequency and success: Implications for the demography of painted turtles. Ecology 62: 1426-1432. WILBUR, H. M. 1975. The evolutionary and mathematical demography of the turtle Chrysemys picta. Ecology 56: 64-77.
21

APPENDIX A: THE MINNESOTA BASKING TRAP FOR TURTLES
Several designs have been published for traps to capture basking turtles. Most of these traps are bulky, difficult to build, or expensive (Cagle 1950, Lagler 1943, Petokas and Alexander 1979, Ream and Ream 1966). Other designs require the trap be emptied immediately to prevent captured turtles from escaping (Macculloch and Gordon 1978, Plummer 1979). In addition, no single method of trapping aquatic turtles is unbiased with regard to size and sex (Frazer et al. 1989, Koper and Brooks 1998, Ream and Ream 1966), see Bider and Hoek (1971) for an apparent exception. To eliminate biases, multiple sampling techniques are recommended for population size and/or structure estimates (Koper and Brooks 1998, Ream and Ream 1966). While conducting research on the commercial harvest of Painted Turtles (Chrysemys picta) we needed a trap that was both inexpensive and effective. The Minnesota design is modeled on the basking traps used by local commercial turtle harvesters. This trap is economical, compact, and retains turtles until the trap is checked. In addition, it replicates the methods used by turtle trappers for commercial harvest within the state. Here, we outline its construction and use, and illustrate its efficiency by comparing capture results of the Minnesota basking traps to baited hoop traps designed for turtles.
TRAP DESIGN AND USE
This trap operates under the principle that turtles will climb out of the water to bask on the floating wood frame (figure 1a). When returning to water, turtles that fall inside the frame are trapped
within the net. Each trap is simple to construct. It is assembled from four components: a square frame for basking; floats for buoyancy; a net basket; and an anchor. The frames are made from pine boards that are approximately 2.5 cm thick and 10 cm wide (sold as “one by fours” in the U.S.). Both ends of each board are cut at an angle so that the top of the board is approximately 48 cm long and the bottom is 60 cm long. This gives each board an isosceles trapezoid shape. These four boards are screwed together with the top edges sloping inward. A sloped design facilitates entry from the outside, and deters escape from the inside. Frame dimensions, at the base, are 60 x 60 cm. A cross board is attached to the top of the trap to stabilize the frame and to provide additional basking sites (Figure 1b). Carpet strips are added to the cross board presumably to aid turtles in climbing onto the trap, but turtles readily climb onto and enter traps without using the carpet. Foam floats are attached beneath the frame with screws and large plastic washers. The floats are 2.5 cm x 60 cm strips cut from five cm thick, polystyrene home insulation panels. The basket is stapled outside the frame. Net baskets may be constructed from scrap netting closed with plastic zip ties. The baskets we used were approximately 90 cm deep, 122 cm in circumference, and had 3.8 cm square mesh (Memphis Net and Twine, TN). Each trap is anchored by attaching a weight to the end of a 2-3 m nylon rope and tying the other end to the wood frame. The Minnesota basking trap is easy to construct and is inexpensive. Two people made 25 traps in three days for less than $23.00 each. Assembling net baskets from scrap seines or netting could greatly reduce this cost since this
22

FIGURE 1A. Photograph. Painted Turtles on a basking trap. FIGURE 1B. Diagram. Basking trap design. A. Wood frame; B. foam floats; C. net basket; and D. anchor. is the most expensive component at $17.00 each when purchased new. This design is similar to the basking trap of Petokas and Alexander (1979) with these important differences. First, the Minnesota trap is smaller making it easier to carry and set in the field. Second, the use of a flexible, nylon net basket rather than a stiff, wire basket, makes the traps stackable and easy to transport. Third, this design eliminates the need for aluminum flashing to
prevent escape relying instead on the inward slope of the wood frame. In addition, aluminum flashing may impede initial entry. Fourth, the Minnesota trap increases basking area with the extra board across the top. Turtles using this center board are more likely to be captured because they can enter the trap from either side, and avenues of exit direct the turtles into the net basket.
METHODS We sampled ten lakes in central Minnesota that range in size from six to 64 ha. All lakes were sampled at least seven times from late June through September 2001 and mid May through late August 2002. Each sample period lasted approximately 24 hours (n = 95, minimum = 17 hours, maximum = 48 hours, mean = 24.5 hours, median = 24 hours). We recorded the trap style and straight-line carapace length for every turtle. We used front claw length and position of the cloaca relative to the rear edge of the carapace to classify each turtle as male or female. Juveniles were animals with no discernable secondary sex characteristics and a carapace length less than nine or ten cm. All traps were set in areas likely to harbor turtles. Traps were placed near the shoreline adjacent to cattails and other emergent vegetation in spring and early summer and moved out from shore and set near floating mats of vegetation in mid to late summer. We also set traps near sites were C. picta were observed basking. Hoop traps, made by Memphis Net and Twine (Memphis, TN), were 72 cm in diameter, and possessed a single ‘throat’ at the entrance. We used canned sardines packed in soybean oil as bait. To compare catch rates, we standardized effort to trap-hours. Trap-hours are the number of traps on a lake multiplied by the number of hours set.
23

Lake Effort E.I. Male Female Juvenile Effort E.I. Male Female JuvenileHenschien 777 1 13 4 0 1927 2.48 62 15 25Lake 21 952 1 6 2 1 1786 1.88 124 57 45Gemini East 415 1 2 2 0 1222 2.94 20 15 20Gemini West 748 1 20 7 0 1518 2.03 22 16 2Sagatagan 1175 1 22 10 0 2139 1.82 46 18 2Stump 936 1 14 3 1 2089 2.23 42 20 11Half Moon 967 1 21 7 0 1796 1.86 30 11 9Spurzem 1564 1 37 6 1 4188 2.68 67 20 28Bjorkland 870 1 6 0 0 1370 1.57 49 23 13Maria 3013 1 97 31 2 6521 2.16 621 271 102
Totals 11417 10 238 72 5 24556 21.66 1083 466 257
Hoop Traps Basking Traps
TABLE 1. A summary of the data comparing the number of Painted Turtles captured using hoop traps and basking traps. Effort is measured in trap-hours. E.I. is effort index and is calculated using the effort spent on hoop traps as a baseline for each lake.
RESULTS Basking traps caught substantially more C. picta per unit effort than baited hoop traps (t = 4.434, df = 187, p < 0.0001; Table 1). The increase in catch per unit effort is readily apparent when effort is indexed, using the effort expended for hoop traps as the baseline. For most lakes, a doubling of effort, using the Minnesota basking traps typically caught more that twice as many turtles. On Henschien Lake, for example, we put 2.48 times more effort into Minnesota basking traps than hoop traps and caught six times as many turtles.
FIGURE 2. The proportion of C. picta in each size-sex category from the pooled data for basking and hoop traps. As trapping effort increased, both kinds
of traps caught more turtles. Using a linear regression, both trap types had slopes significantly different from zero (Basking: y = 0.0986x - 6.4175, F = 28.412, p = < 0.0001, R2 = 0.232; Hoop: y = 0.033x - 0.6823, F = 19.546, p = 0.0001, R2 = 0.172) and significantly different from each other (t = 114.86, df = 186, p < 0.0005). Overall, the Minnesota basking traps caught more turtles than conventional hoop traps for equivalent effort.
We calculated the number of turtles per trap-hour for both trap styles for every sample. We used linear regression to check for correlation between the number of turtles captured and effort and a t-test to determine whether rates of capture were significantly different between trap designs. We used the Pearson chi-square test to check whether size and sex distributions were different between trap styles. Statistical analyses were conducted using JMP IN Version 4.0.4.
24

The size-sex distributions varied with trap style (Figure 2). Basking traps caught more juvenile C. picta than hoop traps, and both designs caught more male C. picta than females in all lakes. A Pearson chi-square test rejected the null hypothesis that trap style and size-sex distributions are independent (X2 = 46.091, df = 2, p = < .0001).
DISCUSSION Variability in trap efficiency, reflected in the poor fit to the linear regression model, is attributed to variable weather. Weather is a major factor influencing C. picta basking behavior (Lefevre and Brooks 1995). In my observations, even short periods of calm and sun elicited basking by C. picta. Thus, intermittent sunshine on an otherwise cloudy or rainy day might be localized and short lived and these periods may not be apparent on daily weather summaries. As a result, “cloudy days” could still result in a fair number of turtles in the traps. We sampled these lakes multiple times and in all weather conditions, and chose to leave weather as part of the error variance in this analysis. The decreased efficiency of hoop traps might also reflect the tendency for turtles to escape from hoop traps. We
observed both C. picta and C. serpentina escaping from set hoop traps, an occurrence also reported by Frazer et al. (1990). Checking traps more often or using a ‘double-throated’ hoop trap design could reduce the number of possible escapees and might decrease the disparity between trap styles. Even so, the effectiveness of the Minnesota basking trap is impressive, particularly considering that C. picta behavior “inflates” the trap effort values. In effect, C. picta are not using the basking traps at night or in overcast or windy weather while baited hoop traps could still be attracting and catching turtles during these periods. The Minnesota basking trap, developed by commercial turtles harvesters, is efficient and easy to use. These basking traps catch significantly more juvenile C. picta than baited hoop traps. Additionally, for equivalent effort, basking traps catch and retain more C. picta than hoop traps overall. The benefits of increased juvenile catch rates and overall trap efficiency, when added to low cost and ease of use, make the Minnesota basking trap a useful addition to the turtle biologist’s toolkit.
25

26
APPENDIX B: LAKE DESCRIPTIONS We sampled 22 lakes in 2001 and 2002. The following provides a short description and map of each lake. Also included are the capture accounts for each lake. These accounts include: the date that traps were checked; the
number of trap hours for hoop traps (TH-H); the number of trap hours for basking traps (TH-B); and the number of male (M), female (F), and juvenile (J) Painted Turtles captured using hoop traps (H), basking traps (B), or by hand (HND).

Half Moon Lake Hennepin County Not Harvested Area = 11 ha Secchi Depth = 1.7 m 71 marked C. picta Half Moon Lake occurs within Baker Park Reserve and has no public boat access. The lake is undeveloped with the exception of a dock for fishing. Seven C. serpentina were captured in the lake over two years.
Date TH-H TH-B M-H F-H J-H M-B F-B J-B J-HND F-HND M-HND
6-Jul-01 168 192 1 0 0 0 1 0 0 0 010-Jul-01 168 196 0 0 0 3 0 1 0 0 011-Jul-01 138 161 0 0 0 0 1 0 0 0 014-Aug-01 60 160 8 2 0 3 0 0 0 0 015-Aug-01 66 176 3 1 0 7 3 4 0 0 031-Aug-01 82.5 137.5 1 1 0 10 5 1 0 0 012-Jul-02 120 240 0 0 0 0 0 1 0 0 022-Aug-02 68 221 5 2 0 0 0 1 0 0 023-Aug-02 96 312 3 1 0 7 1 1 0 0 0
DNR Lake Finder #27015200
27

Spurzem Lake Hennepin County Not Harvested Area = 28 ha Secchi Depth = 1.0 m 143 marked C. picta Spurzem Lake occurs within Baker Park Reserve and has one public boat access. There is a golf course on the east end of the lake. Ten C. serpentina were captured over two years.
Date TH-H TH-B M-H F-H J-H M-B F-B J-B J-HND F-HND M-HND
6-Jul-01 216 324 6 0 1 2 1 3 0 0 010-Jul-01 270 390 1 1 0 6 0 8 0 0 011-Jul-01 216 312 1 0 0 4 4 1 0 0 014-Aug-01 78 214.5 5 2 0 3 2 2 0 0 015-Aug-01 98 269.5 2 0 0 3 3 3 0 0 031-Aug-01 82.5 165 10 1 0 14 1 0 0 0 028-May-02 36 306 0 0 0 3 0 2 0 0 029-May-02 86 365.5 1 0 0 12 2 5 1 0 06-Jun-02 92.5 444 2 1 0 6 0 0 0 0 07-Jun-02 105 504 1 0 0 10 1 2 1 0 111-Jul-02 0 0 0 0 0 2 2 1 0 0 012-Jul-02 120 360 1 1 0 2 3 0 0 0 023-Aug-02 164 533 7 0 0 0 1 1 0 0 0
DNR Lake Finder #27014900
28

Henschien Lake Kandiyohi County Not Harvested Area = 26 ha Secchi Depth = 2.9 m 112 marked C. picta Henschien Lake occurs within Sibley State Park and has no public boat access. The lake has one house on the southeast corner and an unused farmstead on the northeast corner. Five C. serpentina were captured in the lake over two years.
D
ate TH-H TH-B M-H F-H J-H M-B F-B J-B J-HND F-HND M-HND31-Jul-01 110 220 0 0 0 6 2 6 0 0 010-Aug-01 90 180 0 0 0 3 0 0 0 0 018-Jun-02 114 266 1 0 0 9 7 9 1 0 019-Jun-02 153 357 0 0 0 9 2 6 1 0 030-Jul-02 117.5 352.5 0 0 0 8 3 1 0 0 027-Aug-02 92 276 9 3 0 12 1 1 0 0 028-Aug-02 100 275 3 1 0 15 0 2 0 0 0
DNR Lake Finder # N/A
29

Lake 21 Kandiyohi County Not Harvested Area = 8 ha Secchi Depth = 1.4 m 198 marked C. picta Lake 21 (also called Sibley Lake) occurs within Sibley State Park and has one canoe access. The lake is closed to gas powered motors. There is one house on the north end of the lake along with a horse pasture. Four C. serpentina were captured in the lake over two years.
10- 18-
19-
27-
28-
Date TH-H TH-B M-H F-H J-H M-B F-B J-B J-HND F-HND M-HND31-Jul-01 156 234 0 1 0 10 7 4 1 0 0
Aug-01 162 162 1 0 0 1 1 2 0 0 0Jun-02 120 240 1 1 0 6 9 3 0 0 0Jun-02 102.5 205 0 0 0 1 2 1 0 0 0
30-Jul-02 117.5 258.5 2 0 0 23 8 11 0 0 1Aug-02 132 308 1 0 0 46 20 13 0 0 0Aug-02 162 378 1 0 1 37 10 11 0 0 0
DNR Lake Finder # N/A
30

Gemini East Stearns County Not Harvested Area = 12 ha Secchi Depth = 0.9 m 43 marked C. picta Gemini East is in the Arboretum of St. John’s University and Abbey and has no public boat access. The lake holds water from the Universities’ wastewater treatment facility before it flows into the wetlands northeast of the lake. Gemini East is connected to Stump Lake through a culvert under County Road 159, which borders the western edge of the lake. The lake is drawn down several feet in late summer each year. No C. serpentina have been captured in the lake.
Date TH-H TH-B M-H F-H J-H M-B F-B J-B J-HND F-HND M-HND20-Jul-01 55 82.5 1 1 0 2 1 0 0 0 017-Aug-01 85.5 114 0 0 0 0 1 0 0 0 028-Aug-01 48 96 0 0 0 4 4 5 0 0 029-Aug-01 52 104 0 0 0 0 2 1 0 0 027-Jun-02 105 189 0 0 0 6 5 4 0 0 028-Jun-02 0 216 0 0 0 6 1 7 0 0 0
Aug-02 68 170 1 1 0 0 1 0 0 0 013-Aug-02 52 130 0 0 0 0 0 1 0 0 014-Aug-02 48 120 0 0 0 2 0 2 1 0 0
2-
DNR Lake Finder # N/A
31

Gemini West Stearns County Not Harvested Area = 6 ha Secchi Depth = 0.8 m 57 marked C. picta Gemini West is in the Arboretum of St. John’s University and Abbey and has no public boat access. County Road 159 borders the eastern edge of the lake. Two C. serpentina were captured in the lake over two years.
20-
25-
26-
Date TH-H TH-B M-H F-H J-H M-B F-B J-B J-HND F-HND M-HNDJul-01 56 84 0 0 0 2 0 0 0 0 0
17-Aug-01 56 112 0 0 0 1 2 0 0 0 028-Aug-01 24 96 2 1 0 12 8 1 0 0 029-Aug-01 26 104 0 1 0 1 2 0 0 0 0
Jun-02 120 216 2 1 0 1 2 1 0 0 0Jun-02 130 234 0 1 0 1 0 0 0 0 0
1-Aug-02 240 432 15 2 0 1 2 0 0 0 013-Aug-02 48 120 1 1 0 1 0 0 0 0 014-Aug-02 48 120 0 0 0 2 0 0 0 0 0 DNR Lake Finder # N/A
32

Sagatagan Lake Stearns County Not Harvested Area = 64 ha Secchi Depth = 2.6 m 98 marked C. picta Sagatagan is in the Arboretum of St. John’s University and Abbey and has two public boat accesses. Gas powered boats are prohibited on the lake. Sagatagan is undeveloped except on the northwest corner where there are public beaches and athletic fields. Six C. serpentina were captured in the lake over two years.
Date TH-H TH-B M-H F-H J-H M-B F-B J-B J-HND F-HND M-HND19-Jul-01 150.5 172 6 2 0 0 0 0 0 0 020-Jul-01 168 192 1 1 0 0 1 0 0 0 0
16-Aug-01 88 110 2 0 0 1 0 0 0 0 017-Aug-01 86 107.5 0 0 0 1 0 0 0 0 028-Aug-01 96 96 0 0 0 5 2 0 0 0 029-Aug-01 102 102 0 0 0 4 2 0 0 0 025-Jun-02 144 384 6 4 0 3 5 2 0 0 026-Jun-02 138 368 0 2 0 3 3 0 0 0 01-Aug-02 202.5 607.5 7 1 0 29 5 0 0 0 0
DNR Lake Finder #73009200
33

Stump (Stumpf) Lake Stearns County Not Harvested Area = 31 ha Secchi Depth = 1.5 m 88 marked C. picta Stump Lake is in the Arboretum of St. John’s University and Abbey and has no public boat access. Stump Lake connects to Gemini East through a culvert under County Road 159. Stump is undeveloped except on the northwest corner there are several apartment buildings and a small walking bridge in the center of the lake. No C. serpentina have been captured in this lake.
Date TH-H TH-B M-H F-H J-H M-B F-B J-B J-HND F-HND M-HND20-Jul-01 51 102 1 0 0 3 1 3 0 0 0
17-Aug-01 75 150 1 1 0 1 0 0 0 0 028-Aug-01 96 168 0 0 0 6 3 1 0 0 029-Aug-01 106 185.5 0 0 0 2 3 0 0 0 027-Jun-02 144 360 0 0 0 12 7 3 0 0 028-Jun-02 129 322.5 0 0 0 12 6 4 0 0 02-Aug-02 86 344 0 0 0 3 0 0 0 0 0
30-Aug-02 249 456.5 12 2 1 3 0 0 0 0 0
DNR Lake Finder #73009100
34

Bjorkland Lake Wright County Not Harvested Area = 15 ha Secchi Depth = 0.8 m 75 marked C. picta Bjorkland Lake is in Lake Maria State Park and has one public boat access. The road to get to Bjorkland is closed to motorized vehicles so there is very little boating on the lake. It is undeveloped. Eight C. serpentina have been captured in this lake.
Date TH-H TH-B M-H F-H J-H M-B F-B J-B J-HND F-HND M-HND17-Jul-01 112 168 0 0 0 4 1 1 0 0 018-Jul-01 96 144 0 0 0 13 5 5 0 0 020-Aug-01 108 108 1 0 0 6 2 1 0 0 021-Aug-01 96 96 0 0 0 15 1 2 0 0 022-Aug-01 96 96 0 0 0 1 4 2 0 0 023-Aug-01 98 98 2 0 0 1 4 1 0 0 023-Jul-02 86 215 3 0 0 8 3 1 0 0 016-Aug-02 178 445 0 0 0 1 3 0 0 0 0
DNR Lake Finder # N/A
35

Lake Maria Wright County Not Harvested Area = 44 ha Secchi Depth = 0.4 m 805 marked C. picta Lake Maria is in Lake Maria State Park and has one public boat access. It is undeveloped with the exception of three houses on the southern and western portions of the lake and a picnic area on the northeast end of the lake. Lake Maria is connected to Silver Lake at its south end through a small channel under Hwy 123. Seventeen C. serpentina and four A. spinifera have also been captured in this lake.
DNR Lake Finder # 86013700
36

Lake Maria Wright County Not Harvested 17- 18- 23- 24-
Date TH-H TH-B M-H F-H J-H M-B F-B J-B J-HND F-HND M-HNDJul-01 200 280 10 4 1 32 19 25 0 0 0Jul-01 240 336 5 2 0 27 6 8 0 0 0
20-Aug-01 192 360 2 0 0 35 28 2 0 0 021-Aug-01 192 360 3 1 0 29 13 2 0 0 022-Aug-01 192 360 8 0 0 44 13 2 0 0 023-Aug-01 200 375 3 3 0 16 7 1 0 0 030-Aug-01 108 144 13 5 0 22 15 8 0 0 031-Aug-01 132 176 4 0 0 3 7 4 0 0 014-May-02 168 384 0 3 0 24 6 6 0 0 015-May-02 168 384 0 0 0 48 20 6 0 0 016-May-02 168 360 4 1 0 70 31 6 0 0 017-May-02 50 375 11 1 0 38 6 3 0 0 030-May-02 297 675 20 6 1 103 43 15 0 0 031-May-02 225 543.8 6 1 0 100 37 11 0 0 0
Jul-02 120 384 6 3 0 21 13 1 0 0 0Jul-02 117.5 376 2 1 0 8 6 2 0 0 0
16-Aug-02 243 648 0 0 0 1 1 0 0 0 0 DNR Lake Finder # 86013700
37

Beaver Lake Stearns County Harvested Area = 62 ha Secchi Depth = 2.3 m 75 marked C. picta Beaver Lake is south of Luxemburg and has one public boat access. Approximately 2/3 of the lake is developed with houses. Most C. picta captured in the lake occurred on the southern end. Four C. serpentina have been captured in this lake.
Date TH-H TH-B M-H F-H J-H M-B F-B J-B J-HND F-HND M-HND29-Jun-01 0 192 0 0 0 4 3 0 0 0 025-Jul-01 72 126 0 2 0 5 1 0 0 0 026-Jul-01 96 168 0 1 0 5 0 1 1 0 024-Aug-01 20.5 123 0 0 0 2 3 0 0 0 020-Jun-02 63 126 1 0 0 1 2 0 0 0 021-Jun-02 78 156 0 0 0 0 0 0 0 0 026-Jul-02 82.5 165 4 2 0 13 12 1 0 0 021-Aug-02 145.5 485 1 0 0 11 5 0 0 0 0
DNR Lake Finder # 73002300
38

Black Oak Lake Stearns County Harvested Area = 48 ha Secchi Depth = 0.7 m 134 marked C. picta Black Oak Lake is south of Melrose and has one public boat access. Most of the lake is undeveloped with the exception of one house with a dock on the southeastern portion of the lake and some cattle grazing on the southwestern part of the lake. The northern part of the lake is difficult to access unless water levels high. Seven C. serpentina have been captured in this lake.
Date TH-H TH-B M-H F-H J-H M-B F-B J-B J-HND F-HND M-HND3-Jul-01 0 130 0 0 0 6 5 4 0 0 0
27-Jul-01 63 84 3 0 0 3 4 1 0 0 07-Aug-01 69 92 9 1 0 7 3 2 0 0 016-Jul-02 90 225 1 2 0 9 4 3 0 0 117-Jul-02 90 225 6 2 0 4 1 3 0 0 09-Aug-02 84 224 18 4 0 21 12 0 0 0 0
DNR Lake Finder # 73024100
39

Cedar Lake Stearns County Harvested Area = 36 ha Secchi Depth = 1.3 m 27 marked C. picta Cedar Lake is southwest of St. Rosa. The one public boat access is poorly maintained and the lake is rarely used recreationally. Most of the lake is undeveloped with the exception of two houses and some grazing on the northeastern end and an abandoned house on the southeastern end. The lake has extensive wetlands surrounding it, particularly on the southern end. Five C. serpentina have been captured in this lake.
27- 7- 16- 17- 9-
Date TH-H TH-B M-H F-H J-H M-B F-B J-B J-HND F-HND M-HND3-Jul-01 127.5 127.5 0 0 0 0 0 0 1 0 0
Jul-01 58.5 97.5 0 0 0 0 0 0 0 0 0Aug-01 63 84 7 0 0 2 0 1 0 0 0
24-May-02 225 585 0 0 0 2 2 2 0 0 0Jul-02 39 117 0 0 0 1 0 0 0 0 0Jul-02 48 144 0 0 0 1 0 1 0 0 0
Aug-02 51 153 3 2 0 0 1 1 0 0 0
DNR Lake Finder # 73022600
40

Goodner’s Lake Stearns County Harvested Area = 61 ha Secchi Depth = 1.1 m 50 marked C. picta Goodner’s Lake is west of Marty with one public boat access. Approximately 1/4 of the lake is developed with houses, mostly on the south end and the north-central portion of the lake. The lake is used extensively recreationally. There are large tracts of wetlands on the west end. Two C. serpentina have been captured in this lake.
Date TH-H TH-B M-H F-H J-H M-B F-B J-B J-HND F-HND M-HND29-Jun-01 72 168 0 0 0 3 2 1 0 0 025-Jul-01 80 160 0 2 0 0 1 0 0 0 0
26-Jun-01 102 204 0 0 0 3 0 0 0 0 024-Aug-01 102.5 164 1 2 0 0 0 0 0 0 020-Jun-02 0 192 0 0 0 4 2 2 0 0 021-Jun-02 64.5 193.5 0 1 0 0 0 1 0 0 025-Jul-02 88 220 0 0 0 1 0 2 0 0 026-Jul-02 75 250 0 0 0 4 4 1 0 0 0
21-Aug-02 194 485 4 2 1 8 2 0 0 0 0
DNR Lake Finder # 73007600
41

Long Lake Stearns County Harvested Area = 28 ha Secchi Depth = 1.8 m 123 marked C. picta Long Lake is south of St. Rosa with one public boat access. There are a few houses, mostly on the southern end and west side of the lake. Cattle graze approximately ¼ of the shoreline, primarily on the east side of the lake. Six C. serpentina have been captured in this lake.
D 3-
ate TH-H TH-B M-H F-H J-H M-B F-B J-B J-HND F-HND M-HNDJul-01 162 108 2 6 2 1 0 1 0 0 0
27-Jul-01 52.5 87.5 0 0 0 0 0 1 0 0 07-Aug-01 66 110 5 0 0 3 1 4 1 0 0
22-May-02 198 495 2 0 0 15 8 9 0 0 14-Jun-02 120 360 1 0 0 0 0 0 0 0 05-Jun-02 132.5 397.5 0 0 0 29 7 7 2 3 116-Jul-02 44 132 0 0 0 4 2 1 0 0 017-Jul-02 46 138 1 0 0 3 1 1 0 0 09-Aug-02 82.5 220 1 1 0 3 5 0 0 0 0
DNR Lake Finder # 73023100
42

Pelican Lake Stearns County Harvested Area = 136 ha Secchi Depth = 3.1 m 53 marked C. picta Pelican Lake is near of St. Anna with two public boat accesses. Approximately ¾ of the shoreline is developed with houses. The lake gets heavy recreational use. All of the turtles captured occurred on the west end and the southwest corner of the lake. Six C. serpentina have been captured in this lake.
Date TH-H TH-B M-H F-H J-H M-B F-B J-B J-HND F-HND M-HND29-Jun-01 72 120 0 0 0 0 0 0 0 0 024-Jul-01 88 88 0 0 0 0 2 0 0 0 025-Jul-01 96 96 0 0 0 0 0 0 0 0 026-Jul-01 112 112 0 0 0 3 1 6 0 0 0
24-Aug-01 82 102.5 3 2 0 0 1 0 0 0 020-Jun-02 52.5 175 0 0 0 1 1 1 0 0 021-Jun-02 78 260 0 0 0 0 0 1 0 0 025-Jul-02 104 260 3 1 0 4 5 0 0 1 026-Jul-02 78 195 2 0 0 2 5 0 0 0 0
21-Aug-02 142.5 285 0 0 0 6 2 1 0 0 0
DNR Lake Finder # 73011800
43

Sylvia Lake Stearns County Harvested Area = 33 ha Secchi Depth = 1.4 m 33 marked C. picta Sylvia Lake is north of Melrose with one public boat access. Close to 1/2 of the shoreline is developed with houses and just under ¼ is grazed with cattle. The lake gets heavy recreational use. Sylvia Lake is connected to Little Birch Lake by a stream at the north end and flows into Adley Creek at the south end. Three C. serpentina and one A. spinifera have been captured in this lake.
27- 7- 4- 5- 16-
17-
9-
Date TH-H TH-B M-H F-H J-H M-B F-B J-B J-HND F-HND M-HND3-Jul-01 88 132 0 0 0 2 2 1 0 0 0
Jul-01 46.5 77.5 0 0 0 2 0 0 0 0 0Aug-01 70.5 117.5 3 2 0 1 1 1 0 0 0
22-May-02 273 318.5 6 3 0 1 0 0 0 0 0Jun-02 112.5 225 0 0 0 1 1 0 0 0 0Jun-02 120 240 0 0 0 2 1 0 0 0 0Jul-02 49 73.5 0 0 0 1 0 0 0 0 0Jul-02 67.5 67.5 0 1 0 1 0 0 0 0 0
Aug-02 59 118 1 2 0 2 1 2 0 0 0
DNR Lake Finder # 73024900
44

Cedar Lake Todd County Harvested Area = 64 ha Secchi Depth = 3.6 m 29 marked C. picta Cedar Lake is north of Sauk Centre with one public boat access. Approximately 1/4 of the shoreline is developed with houses. The lake gets heavy recreational use. No C. serpentina have been captured in this lake.
Date TH-H TH-B M-H F-H J-H M-B F-B J-B J-HND F-HND M-HND27-Jun-01 72 96 0 0 0 0 0 0 0 0 028-Jun-01 72 96 0 0 0 0 1 0 0 0 013-Jul-01 64.5 86 3 1 0 2 0 0 0 0 08-Aug-01 63 84 3 0 0 3 0 0 0 0 09-Aug-01 72 96 1 0 0 0 2 0 0 0 011-Jun-02 72 192 0 0 0 0 2 0 0 0 012-Jun-02 70.5 188 0 1 0 0 2 1 0 0 018-Jul-02 66 66 0 0 0 0 0 0 0 0 019-Jul-02 72 72 2 1 0 0 0 2 0 0 07-Aug-02 96 384 0 0 0 1 0 1 0 0 0
DNR Lake Finder # 77016000
45

Guernsey Lake Todd County Harvested Area = 51 ha Secchi Depth = 0.8 m 57 marked C. picta Guernsey Lake is northeast of West Union. The lake is undeveloped with the exception of one boat access and some cattle grazing on the east end. The Sauk River flows into the lake in the southwest corner and out towards Little Sauk Lake from the northeast corner. One C. serpentina has been captured in this lake.
Date TH-H TH-B M-H F-H J-H M-B F-B J-B J-HND F-HND M-HND
27-Jun-01 72 72 1 3 0 0 1 0 0 0 028-Jun-01 72 72 0 0 0 0 0 0 0 0 013-Jul-01 45 12.5 0 0 0 2 1 0 0 0 08-Aug-01 69 115 1 0 0 0 0 0 0 0 09-Aug-01 72 120 0 0 0 17 8 2 0 0 0
11-Jun-02 78 156 3 1 0 3 0 1 0 0 012-Jun-02 86 172 0 0 0 9 4 0 0 0 019-Jul-02 60 210 3 0 0 0 0 0 0 0 07-Aug-02 130.5 217.5 0 0 0 0 1 0 0 0 0
DNR Lake Finder # 77018200
46

Little Sauk Lake Todd County Harvested Area = 108 ha Secchi Depth = 1.0 m 50 marked C. picta Little Sauk Lake is west of Little Sauk with one boat access. The lake is undeveloped with the exception of about seven houses and their boat docks. The Sauk River flows into the lake in the southwest corner from Guernsey Lake and flows out from the northeast corner. One C. serpentina has been captured in this lake.
Date TH-H TH-B M-H F-H J-H M-B F-B J-B J-HND F-HND M-HND27-Jun-01 72 96 0 0 0 0 0 0 0 0 028-Jun-01 72 96 0 0 0 0 0 0 0 0 013-Jul-01 105 84 0 0 0 1 0 0 0 0 08-Aug-01 66 110 0 0 0 0 0 0 0 0 09-Aug-01 69 115 0 1 0 0 0 0 0 0 0
11-Jun-02 88 176 1 0 0 14 5 2 0 0 012-Jun-02 90 20 0 0 0 1 5 2 0 0 119-Jul-02 59 177 0 0 0 6 1 0 0 0 07-Aug-02 138 230 4 2 0 4 1 0 0 0 0
DNR Lake Finder # 77016400
47

Long Lake Todd County Harvested Area = 87 ha Secchi Depth = 4.1 m 31 marked C. picta Long Lake is northeast of Sauk Centre with one boat access. The lake is undeveloped with the exception of several houses at the north end and a farm in southern end. The lake gets heavy recreational use. The lake appears to have been recently enlarged at the southern end so the recorded lake area is likely an underestimate. No C. serpentina have been captured in this lake.
Date TH-H TH-B M-H F-H J-H M-B F-B J-B J-HND F-HND M-HND27-Jun-01 72 96 0 0 0 0 0 0 0 1 028-Jun-01 72 96 0 0 0 0 0 0 0 0 013-Jul-01 43 129 1 1 0 0 1 0 0 0 08-Aug-01 54 90 0 1 0 0 0 0 0 0 09-Aug-01 81 135 0 0 0 0 1 0 0 0 018-Jul-02 96 240 0 0 0 0 0 0 0 0 019-Jul-02 88 220 3 1 0 3 2 0 0 0 07-Aug-02 103 412 0 0 0 13 3 0 0 0 0
DNR Lake Finder # 77002700
48

Mary Lake Todd County Harvested Area = 42 ha Secchi Depth = 1.6 m 122 marked C. picta Mary Lake is northeast of St. Rosa with one boat access. The shoreline is undeveloped with the exception of several houses at the north end and cattle grazing at the southern part of the lake. Three C. serpentina have been captured in this lake.
Date TH-H TH-B M-H F-H J-H M-B F-B J-B J-HND F-HND M-HND
26-Jun-01 0 1296 0 0 0 24 8 1 0 1 024-Jul-01 182 390 9 4 0 17 4 2 0 0 0
12-Sep-01 108 342 0 0 0 0 0 1 0 0 013-Jun-02 82 492 0 0 0 9 13 3 0 0 014-Jun-02 86 516 0 0 0 3 6 5 1 0 113-Aug-02 144 384 3 2 1 6 1 1 0 0 014-Aug-02 150 400 0 0 0 1 0 0 0 0 0
DNR Lake Finder # 77001900
49
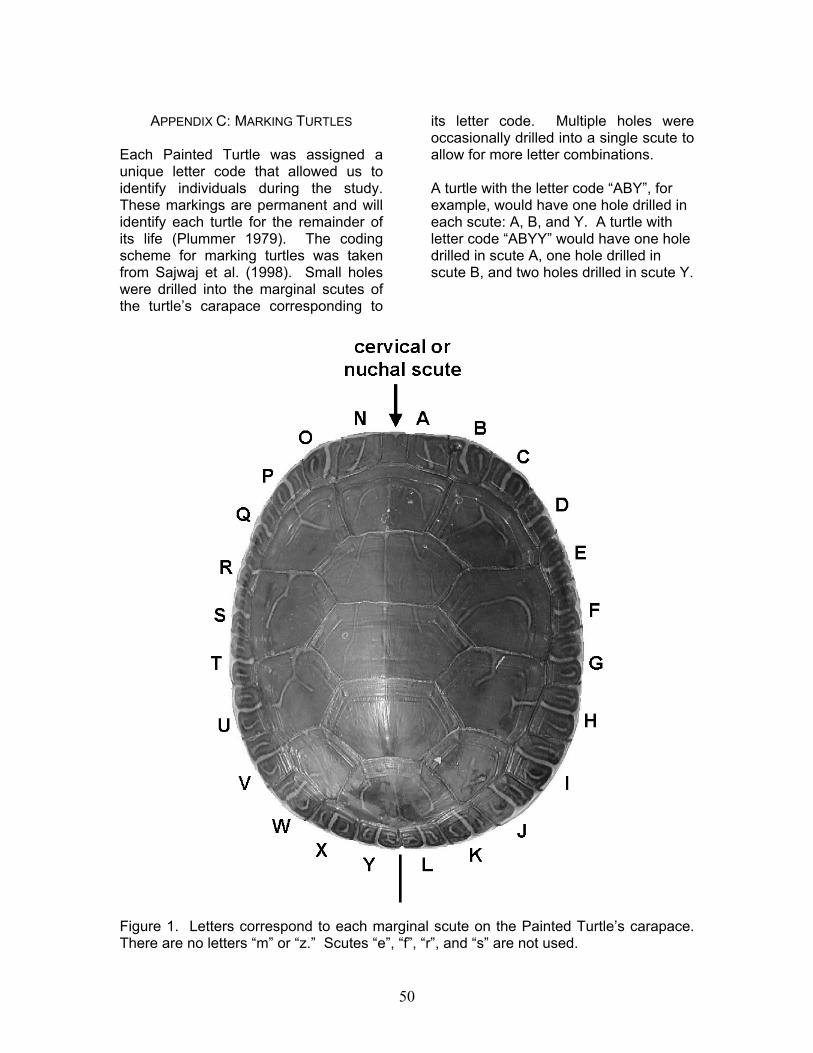
APPENDIX C: MARKING TURTLES Each Painted Turtle was assigned a unique letter code that allowed us to identify individuals during the study. These markings are permanent and will identify each turtle for the remainder of its life (Plummer 1979). The coding scheme for marking turtles was taken from Sajwaj et al. (1998). Small holes were drilled into the marginal scutes of the turtle’s carapace corresponding to
its letter code. Multiple holes were occasionally drilled into a single scute to allow for more letter combinations. A turtle with the letter code “ABY”, for example, would have one hole drilled in each scute: A, B, and Y. A turtle with letter code “ABYY” would have one hole drilled in scute A, one hole drilled in scute B, and two holes drilled in scute Y.
Figure 1. Letters correspond to each marginal scute on the Painted Turtle’s carapace. There are no letters “m” or “z.” Scutes “e”, “f”, “r”, and “s” are not used.
50