Consensus formation during strategic changegoldmark.org/livia/papers/convergence/convergence.pdf ·...
37
Consensus formation during strategic change L´ ıvia Mark´ oczy Anderson Graduate School of Management University of California, Riverside Riverside, CA 92521-0203 FAX: +1 909 787-3970 [email protected] Version 1.23 modified September 25, 2000
Transcript of Consensus formation during strategic changegoldmark.org/livia/papers/convergence/convergence.pdf ·...

Consensus formation during strategic change
Lıvia Markoczy
Anderson Graduate School of Management
University of California, Riverside
Riverside, CA 92521-0203
FAX: +1 909 787-3970
Version 1.23 modified September 25, 2000

AbstractThis paper offers a refined conceptualization of consensus formation and demon-strates in three organizations how this conceptualization enables us to uncovernew patterns of consensus building. It describes a longitudinal study which in-vestigated consensus formation in three organizations undergoing major strate-gic change. The study explored whether consensus building occurred during thestrategic change, and if so, how. Initial participants of consensus were also inves-tigated as well as changes in the scope of participants in consensus. Consensusbuilding did occur, but contrary to some views, less through an increase in thestrength of consensus and more through an increase in the scope of consensus.Additionally, initial consensus was not located among members of the top man-agement team, but more within an interest group whose members benefited fromthe given direction of the change.
Biographical NoteLıvia Markoczy is a Research Fellow at Cranfield School of Management. Shereceived her PhD from Cambridge University. She can be reached [email protected].
AcknowledgementsThis work was supported by two grants (F103 and F640) from the HungarianScientific Research Fund (OTKA). I would like to thank Jeff Goldberg for hiscomments on previous drafts of this paper and to Ferenc Toth, Tibor Pandi, andLaszlo Radacsi for assisting the data collection in the second phase of the study.
1
Introduction
It is a widely shared assumption in the strategy literature that the strategyprocess involves a consensus building process (Dess and Oringer, 1987; Nielson,1981; Lyles, 1981) during which organizational members develop a general level ofagreement “on the fundamental priorities of the organization” (Floyd and Woold-ridge, 1992, 28). The importance of consensus formation has been suggested bothin the strategic decision making process as well as in the implementation process.Whyte (1989, 41), for example, emphasized that the “task, after all, of all de-cision making groups is to produce consensus from the initial preferences of itsmembers”, while according to Floyd and Wooldridge (1992, p. 27), the “success-ful execution [of strategy] means managers acting on a common set of strategicpriorities.” This is achieved through the development of some shared understand-ing and common commitment, namely by the formation of “strategic consensus.”Despite the assumed importance of consensus formation there has been little em-pirical work conducted exploring whether consensus does in fact develop duringstrategic change. Although there have been several, mostly experimental, studiesconducted on how consensus is (or isn’t) formed in negotiating situations in smallgroups (e.g., Priem, Harrison and Muir, 1995; Schweiger, Sandberg and Ragan,1986; Cosier and Rechner, 1985), these did not and could not explore the growthof consensus in an organization as a whole. Other empirical studies, conducted inorganizational settings, were less interested in consensus formation, but insteadfocused on the degree of consensus in the top management team (tmt) and itsrelationship to organizational performance, without considering the nature of thedevelopment of consensus (e.g. Hrebiniak and Snow, 1982; Bourgeois, 1980; Dess,1987; Walsh and Fahey, 1986; DeWoot, Heyvaert and Martou, 1977–78; Grinyerand Norburn, 1977–78). However, inconsistent findings in these latter studieswhich ranged from a positive relationship between consensus and performance(Bourgeois, 1980; Dess, 1987; Hrebiniak and Snow, 1982; Stagner, 1969) to anegative relationship (Bourgeois, 1985; DeWoot et al., 1977–78) or even to norelationship at all (Grinyer and Norburn, 1977–78) called attention to a potentialproblem in our conceptualization of consensus (Dess and Oringer, 1987) and toa lack of clear understanding of the consensus formation process in organizations(Wooldridge and Floyd, 1989). This study aims to overcome these problems byinvestigating consensus building in organizational setting and by using a morecomprehensive conceptualization of consensus than was done in previous studies.
1.23 of September 25, 2000
2
Consensus as a multi-faceted conceptWooldridge and Floyd (1989) implied that one of the problems with our existingconceptualization of consensus is that previous empirical studies failed to clearlydistinguish the different facets of consensus and changes in these without whichconsensus and consensus formation may not be discussed or well understood.These authors listed the content, degree (also termed as level), and scope of con-sensus as those facets which need to be distinguished and investigated in futureempirical work. The content of consensus is what people are actually agreeingon. This may, for example, be the priority of certain organizational goals (Bour-geois, 1980; Dess, 1987) or the importance of certain competitors (Hodgkinsonand Johnson, 1994). The degree of consensus is how strongly the people involvedactually agree on the content. The scope of consensus, is how many people sharein the consensus which might range from a small team (e.g., top managementteam) to many members of the organization (Floyd and Wooldridge, 1992). Tothe above facets this paper adds a fourth one, namely the locus of consensus. Thelocus of consensus is where in an organization the consensus is primarily located.For example, consensus might develop among the members of the top manage-ment team (tmt) (Hambrick and Mason, 1984), as well as among members ofother interest groups who are in favor of change, but not necessarily are membersof the tmt (Narayanan and Fahey, 1982; Cyert and March, 1963). The scopehere is how many people share in a consensus and the locus is who those peopleare in the organization.
A brief overview of the empirical studies in the consensus literature (see below)suggests that most of these studies focused on the degree of consensus, limited theinvestigation to the tmt (or to a small team in laboratory setting) for the locus ofconsensus, held highly diverse views on the content, and almost entirely ignoredthe scope (Dess and Oringer (1987) and Priem (1990) provide a good overview ofthese studies). Furthermore, with the exception of the laboratory studies, mostof these have paid little attention to the issue of change in consensus (in any ofthese four aspects), so that we, as yet, have no empirical basis for believing thatthese facets do change.
Without understanding the strategy context some consensus facets cannotbe meaningfully investigated. For example if one wants to explore whether theprimary locus of consensus is in the tmt or instead in some other interest group,one needs to first identify the existence of such interest groups. For this to bedone, however, one needs to be familiar with the nature of the strategic changeand with the potential beneficiaries of this change who might form such interestgroups (Narayanan and Fahey, 1982).
1.23 of September 25, 2000

3
Consensus and the strategy processIt has not always been made explicit that predictions of the patterns of consen-sus and consensus development differ depending on the conceptualization of thestrategic decision making process. There are two dominant views in this respect.
By one view, strategy is conceptualized as an outcome of a rational decisionmaking process by members of the tmt, while by the other view strategy is anincremental process that could be initiated and driven by interest groups otherthan the tmt (Frederickson, 1983; Wooldridge and Floyd, 1989; Eisenhardt andBourgeois, 1988). According to the rational model, strategy is formed through acomprehensive decision making process during which members of the tmt reachconsensus in strategic issues (e.g., Andrews, 1971; Ansoff, 1965). By this view wewould expect that consensus forms in the tmt and spreads (if at all) from there.Although it often remains implicit, this is the view that underlies expectations onthe patterns of consensus building in most consensus studies.
Alternatively, the strategy process is conceptualized as a process during whichindividuals with common interest form coalitions to advocate their common inter-est (e.g., Lindblom, 1959; Quinn, 1980; Cyert and March, 1963; Narayanan andFahey, 1982). Consensus is often formed among coalition members along the linesof their common interest which allows them for effective lobbying to realize theirinterest (e.g., Cyert and March, 1963). Although members of the interest groupmight come from the tmt (Quinn, 1980), it is often the case that coalition andconsequently consensus is formed in groups distinct from the tmt (Narayananand Fahey, 1982). If the efforts of this group succeed consensus will spread fromthis group and not from the tmt . The mechanisms of consensus formation, how-ever, is not limited to political lobbying. Consensus could also emerge, if externalor internal organizational conditions favor the new strategic direction, and thisis realized by an increasing number of organizational members. Also, consensusmight just form over time after the initial turmoil of change settles. In addition,people who disagree with the change might chose to leave the organization, whilenew recruits are likely to show better fit with the new direction. Such changesin the composition of organizational members also increases the chance to reachan increased scope of consensus. Whatever is the mechanism of consensus for-mation, however, what is important here is that the incremental view of strategyformation allows for a new conceptualization of consensus, which has not beensufficiently explored by previous consensus studies. Through this lens the multi-faceted nature of consensus becomes clearer. We no longer can assume that themain locus of consensus is necessarily in the tmt and our attention is redirectedfrom the emphasis on the degree of consensus to the changes in the distribution
1.23 of September 25, 2000

4
of consensus over time.In sum, this paper argues that our understanding of consensus formation is
limited: (1) partially because various facets of consensus (and changes in these)have not been clearly distinguished in the consensus literature; (2) partially be-cause consensus was investigated outside of the strategy process context; and(3) partially because our conceptualization of consensus building was based ona one-sided view of the strategic decision making process. This study aims toovercome these limitations by refining our conceptualization of consensus. By us-ing these new concepts it also demonstrates that the actual pattern of consensusdevelopment in organizations differs from what many have assumed.
The study explored the degree, scope, and locus of consensus and changes invarious facets of consensus among 64 managers in three organizations undergoingmassive strategic change. The method is described below after a brief overviewof previous consensus studies. The purpose of this overview is to describe thefocus of these studies on various facets of consensus and serve as a basis for apre-conceptualization of those consensus facets which are explored in the presentstudy.
Characteristics of consensus
Previous non-experimental consensus studies are reviewed here considering of theirfocus and assumptions on the degree, locus, scope, and content of consensus.
Degree of consensusThe degree of consensus, namely the strength of consensus, has been the mostinvestigated facet of consensus in the non-experimental consensus-performancestudies (e.g,. Hrebiniak and Snow, 1982; Bourgeois, 1980; Dess, 1987; Walsh andFahey, 1986; DeWoot et al., 1977–78; Grinyer and Norburn, 1977–78). Thesestudies mostly focused on the relationship between the degree of consensus andorganizational performance, assuming that this relationship is positive, indepen-dent of when in the strategy process the data was collected. These studies failedto take into consideration that both the achievability and the desirability of agiven level of consensus might change as the strategic change progresses (Woold-ridge and Floyd, 1989). At an early stage of the strategy process, for example, theachievable level of consensus might be rather low. This is because strategic changeis often triggered by events such as crises (Mitroff, Pearson and Pauchant, 1992),dissatisfaction with existing organizational strategy (Narayanan and Fahey, 1982)or some invading external forces (Sales and Mirvis, 1985; Buono and Bowditch,
1.23 of September 25, 2000
5
1989) which entail diversification and confrontation of views. This low level ofconsensus, however, is not necessarily undesirable for organizational outcomes iftwo conditions are met: (1) conflicting views lead to consideration and criticalevaluation of alternative view points (Schweiger et al., 1986); and (2) initial con-frontation of views are consolidated later on in the strategy process, thus somelevel of consensus is reached (Lyles, 1981). Laboratory studies, for example, sug-gested that decision making groups which start with conflicting views and buildconsensus from these diverse views reach more efficient decision outcomes thanthose which start with a high level of consensus (Priem et al., 1995; Schweigeret al., 1986). Furthermore, as Dess and Priem (1995) suggested, an overly zealouscommitment to a certain course of action at an early stage might be problematicas it may block accommodation to changing conditions, while consensus formationin the later stage of the strategy process is desirable to ensure shared understand-ing and commitment to the strategy process by organizational members (Floydand Wooldridge, 1992).
Instead of investigating the appropriateness and desirability of consensus ata given time, it may be more meaningful to investigate and interpret changesin the degree of consensus over time. This study follows the latter approach byinvestigating whether the degree of consensus in fact increased over the strategyprocess.
Locus of consensusMost non-experimental consensus studies followed the rational-decision makingmodel assuming that the primary locus of consensus is in the top managementteam (tmt) and have thus limited the investigation to this group (e.g., Hrebiniakand Snow, 1982; Bourgeois, 1980; Dess, 1987). These studies imply that thetmt members are the ones who decide the direction of strategic change, whomanage the implementation efforts of others (Nutt, 1987; Frederickson, 1984;Frederickson, 1986), and that consensus formation is supposed to aid this processthrough developing shared strategic priorities and coordinating implementationefforts among tmt members (Andrews, 1971; Ansoff, 1965).
In accordance to the incremental view consensus, however, the primary locusof consensus might be different from the tmt. Consensus is expected to be formedamong those organizational members who share a common interest in change andwho form coalitions to advocate their common interest (Eisenhardt and Bourgeois,1988; Narayanan and Fahey, 1982). Although Quinn (1980) implied that themain advocates of change are usually members of the tmt others demonstratedthat change is often initiated by those who are not members of the tmt (e.g.,
1.23 of September 25, 2000

6
Burgelman, 1991).This study accommodates both views on the locus of consensus by exploring
whether consensus is primarily located in the tmt or in other interest groups.Potential coalition members were identified by collecting information about whowas interested in the given direction of the change and who benefited most fromthis change.
Scope of consensusOne of the least explored facets of consensus in the empirical studies on consen-sus is the scope of consensus, or more importantly an increase in the scope ofconsensus during strategic change. The little attention that has been devotedto this consensus facet is surprising as the importance of building a shared un-derstanding and commitment towards the strategy process among a wide scopeof organizational members has been widely emphasized in the strategy literature(Frederickson, 1984; Mintzberg, 1973; Mintzberg, 1978; Quinn, 1980). Accord-ing to Wooldridge and Floyd (1989, 2) “in some settings, consensus scope maybe more closely related to performance than consensus degree”. This may havebeen neglected because many feel that strategic decision making and managingthe implementation are limited to a group of strategic decision makers of the topof the organizational hierarchy (ie, the tmt) who delegate the relevant task toother organizational members (e.g., Nutt, 1987). In this view strategy formationis considered to be the domain of the tmt while the rest of the organizationalmembers are considered to focus mostly on those tasks which were delegated tothem or which are consistent with their organizational position (Lawrence andLorsch, 1967; Dearborn and Simon, 1958). Increase in the scope of consensus isnot considered to be important for effective strategy implementation under sucha view.
The tmt view is prevalent in studies which consider strategic change as anoutcome of a rational decision making process (Andrews, 1971; Ansoff, 1965) butis not so common among those who view the strategy process as an emergent pro-cess involving many members of an organization (Lindblom, 1959; Quinn, 1980).In this latter view the new direction of strategic change is advocated by vari-ous interest groups and consensus formation emerges if an increasing number oforganizational members adopt this view (Narayanan and Fahey, 1982).
This study explores both the incremental and the rational views by investigat-ing whether the scope of consensus changes over the strategy process or whetherit remains limited to the tmt or its original locus.
1.23 of September 25, 2000

7
Content of consensusThe most disagreement in the consensus literature is about the content of con-sensus. A dominating view is that consensus primarily should be around thepriorities of goals and means (Bourgeois, 1985; Bourgeois, 1980; Dess, 1987), butother content measures have also been widely used. These included priorities andcategorization of competitors (Hodgkinson and Johnson, 1994), organizationalstrengths and weaknesses (Hrebiniak and Snow, 1982), satisfaction with decisionmaking (Stagner, 1969), objectives and role perception (Grinyer and Norburn,1977–78), and perceived environmental uncertainty (Bourgeois, 1985). Such di-versity in the conceptualization of the content of consensus has been consideredby Dess and Oringer (1987) as one of the reasons for the inconsistent findings inthe consensus-performance studies.
This study does not resolve this diversity but contributes to it by using yetanother consensus measure for reasons discussed below. What is captured hereare the beliefs of managers in two domains: beliefs in what issues are the most rel-evant to the organization and beliefs in how these issues affect each other. Beliefsunderly strategic decision making and action (e.g., Dutton, Walton and Abraham-son, 1989; Dutton and Ottensmeyer, 1987; Dutton and Jackson, 1987). Decisionmakers are constantly bombarded with a vast amount of ill-defined stimuli. Whatissues decision makers pay attention to (Stewart and Latham, 1980; Lord andMaher, 1993) and how these issues are interpreted and resolved (Ford, 1985)are based on individual beliefs about relevance and causality (Fiske and Taylor,1991; Bettman and Weitz, 1983). Beliefs are basically cognitive filters that “im-pose order on the environment” (Dutton and Jackson, 1987, p: 75) and in a waymore basic to strategic decisions and actions than specific goals and means (Dessand Priem, 1995). Decision makers can lose sight of goals and means in specificcircumstances (e.g., under time pressure (Svenson and Maule, 1993)) but evenin specific circumstances the issues that receive attention and the way they aredealt with are guided by beliefs in relevance and causality. The strategy thatemerges over time is the accumulated results of decisions and actions that areguided by beliefs which may or may not correspond with the stated goals andmeans. Dess and Priem (1995) (who labelled cause-effect beliefs as “cognitivestructures”), argue that agreement in beliefs might be more relevant to effectivestrategy implementation than agreement in goals and means because “divergentcognitive structures among the members of the top management team may reflecta more basic, and perhaps more debilitating disagreement than would differencesover goals or methods”. Thus in this study the content of consensus is defined asthe agreement in relevance beliefs and causal relationships. Although I consider
1.23 of September 25, 2000
8
this new content measure as a strengths of this study I also need to acknowledgethat this weakens the generalizability of our results to previous consensus studies.
Methods
This study applies a multiple case design as this allows the findings to be com-pared and interpreted across cases (Yin, 1994), while at the same time aggregatingdata where appropriate. The investigation includes three organizations in Hun-gary each of which is a recent acquisition of previously state owned enterprises bysome “Anglo-Saxon” companies. These three organizations originally were partof a broader study (which included five companies in the first phase) which aimedto investigate the effect of individual characteristics and organizational factors inshaping beliefs (self-reference). These organizations were selected for this longitu-dinal study because they all were undergoing massive strategic change at the timeof the first phase of the data collection. The investigated companies are referredby the letters of the alphabet (A, B, C). The ordering of the letters correspondswith the order of investigation in both phases. All three companies are large (with9500, 1000, and 1300 employees, respectively), and came from the lighting, biscuitand soft drinks industries. Data collection occurred in two periods of time (endof 1992 and beginning of 1993 and end of 1994 and beginning of 1995).
In the three organizations sixty four managers took part in the first phase ofthe data collection (20, 22 and 22 managers in each company) and fifty-one in thesecond phase (14, 20 and 17 managers). Managers were selected from top downin the hierarchy (which usually included the executive director and managersone or two levels down) for two reasons: (1) to include members of tmts (ie, theexecutive director and managers one level down); and (2) to include managers whoare likely to be aware of the strategic issues, but not necessarily tmt members(Hambrick, 1981). The same managers were asked to participate in both phasesof the data collection. If this was not possible because some of the managers haveleft the organization their replacement was asked to take part in the study, unlessthe position ceased to exist (this occurred, for example, in company A where manypositions were eliminated or moved to the European headquarters).
Data sources
Data were collected on the strategy change process as well as on the beliefs ofmanagers in both stages of data collection using the data collection techniquesdescribed below.
1.23 of September 25, 2000
9
Qualitative dataInformation on the strategic change and potential coalition members was collectedfrom three sources: (1) by interviewing the managers in the sample with struc-tured, but open ended interviews; (2) by relying on the help of key informantsin gaining background information and for consultation during the data analysis;and (3) by using feed-back sessions on validating and interpreting the findings(Heller, 1969; Brown and Heller, 1981). Managers were also asked to fill out ashort questionnaire about their individual characteristics as well as were askedthree questions concerning changes in organizational performance: (1) Change inthe total growth of sales since 1992 (last time of data collection); (2) Change ingrowth in after-tax return on total assets (ROA) since 1992; (3) Change in overallfirm performance/success since 1992. Since two of the investigated companies (Band C) made it clear in the first stage of data collection that they are reluctantto give out absolute data about their performance information was collected inindirect manner (change in % in the first two items; above expectations, belowexpectations or according to expectations in overall performance).
In the first phase of the study managers were asked, among others: (1) todescribe those changes in their organizations which they thought were strategi-cally relevant (ie, include changes in goals, resource allocations (Eisenhardt andZbaracki, 1992) as well as organizational structure and values etc); (2) and todescribe the problems related to these changes. In the second phase managerswere asked to describe relevant changes since the time of the first data collection.In addition to the above, in both data collection phases, key informants providedbackground information on their companies (e.g., hiring and laying off informa-tion) and were also consulted about the changes and their interpretations whichwere drawn by the researcher from the interviews. Similar consultation was alsodone by the other managers during feed-back sessions.
Causal mappingInformation on beliefs were collected using a causal mapping technique whichwas developed by Markoczy and Goldberg (1995). Causal maps (cms) are rep-resentations of individuals’ beliefs on relevance in a given domain and on causalrelations between these issues which makes them appropriate for the purpose ofthis study. The applied causal mapping technique was chosen as it produces cmswhich are suitable for a systematic comparison of a large sample of cms. Othercausal mapping techniques are also available (Huff, 1990; Laukkanen, 1992; Eden,1992; Walsh, 1995; Ginsberg, 1990) but only a few produce maps that are suit-able for such comparison (see Daniels, Markoczy and de Chernatony (1994) for
1.23 of September 25, 2000

10
an overview).The causal mapping technique includes the following steps:
1. Development of a pool of constructs of those issues which are potentiallyrelevant to organizational success for a given sample of organizations
2. Selection of those constructs which managers consider as relevant for thesuccess of their organizations
3. Assessment of the causal relationship between pairwise constructs consider-ing those constructs which were selected as most relevant.
A brief description of the above steps are provided below. For more detail onthe method see Markoczy and Goldberg (1995).
Development of a pool of constructsThe constructs were developed from thirty interviews by (self-reference) with 15Hungarian and 15 Anglo-Saxon senior managers in international acquisitions aspart of a separate study. During these structured but open ended interviewsmanagers were asked to describe those issues, including goals, means, and envi-ronmental factors which were relevant to the success of their organizations. Theseissues were coded by two coders, both with a degree in management, into a list of60 constructs. During coding those issues with similar meaning were coded intothe same constructs. For each decision coders sought agreement, as opposed toworking independently, to utilize their complementary expertise. To ensure thatthe pool of constructs covered the major issues which might be relevant for suc-cess, the resulting list of constructs was compared with a similar list developed byWalsh (1988). From the latter list four items were added to the original list as thecoders considered these as potentially important. Note that adding new items tothis list does not constitute a validity problem since if managers did not find theseadded issues important this would only mean that they would not select these aspotentially relevant. The resulting 64 constructs went through a translation andback-translation process and two pilot studies including 3 and 49 executive-MBAmanagers. During these pilot studies managers were asked to point out missingconstructs or alternatively constructs with similar meaning. No new constructswere suggested while existing constructs with similar meaning were collapsed into49 constructs which were used in the causal mapping exercise. These constructs,with a clarifying definition provided by the author, were placed on cards for aidingthe selection procedure. The list is available from the author upon request.
1.23 of September 25, 2000

11
Selecting the constructsTo identify beliefs in relevance, managers were asked to sort the constructs intotwo piles: One with those constructs which they considered to be most relevantfor the success of their organizations, and the other pile with those which are notas relevant. The selection procedure was repeated with the “most relevant” pileuntil the managers were left with 10 or fewer constructs. In the latter case theywere asked to complement the constructs to ten from the previous pile. Limitingthe selected factors to the top ten was necessary as trial elicitations showed thatthe next elicitation step, which includes assessing the causal relationship betweenall pairwise combinations of the selected constructs, tends to exhaust the patienceof the subject beyond 10 constructs (Markoczy and Goldberg, 1995).
Causal relationshipTo identify cause-effect beliefs, for each distinct pair of constructs (90 pairs for10 constructs) subjects were asked three questions: (1) whether one constructinfluences the other (if not a new pair of constructs were considered, if yes thequestioning proceeded); (2) whether it does so positively or negatively; and (3)whether the influence is weak, moderate or strong. With this technique the exis-tence, the polarity and the strengths of the causal relationship were established.The 10 selected constructs together with the 90 causal relationship constitutedthe cm for each manager’s beliefs on the top ten relevant issues in the light of de-sirable future and the causal relationships among these issues. Figure 1 containsan example for such a cm.
The strategy process
Before discussing how cms were used to calculate various facets of consensus abrief description is provided on the change process in each company at both stagesof the data collection.
Company AMajor strategic changes in company A started by the end of 1991 following theacquisition of its shares by a large, American company.
Changes, listed by the interviewed managers (20 managers) included flatteningthe organizational hierarchy, introducing new technology, cost control and produc-tivity measures, divestment of those activities which were unrelated to light bulbproduction, simplifying the incentive system, laying off excess employees, andtraining the Hungarian employees. These changes were already in process at the
1.23 of September 25, 2000

12
Figure 1: Matrix presentation of causal map
30 47 3 5 33 43 20 3530 0 2 3 0 0 0 0 047 0 0 0 0 0 0 0 03 0 0 0 0 0 0 0 05 0 0 3 0 0 0 0 0
33 0 0 2 0 0 0 −1 043 0 0 0 0 0 0 0 020 0 0 0 −2 1 0 0 −135 0 0 0 3 0 0 0 0
3 Vision and strategic direction 5 Market share20 Competition in market 30 Leadership in organization33 Knowledge of market needs 35 Brand recognition43 Bank connections 47 Efficiency/productivity
The example causal map (from a fictitious individual) contains eight constructs (soit is smaller than the cms that were elicited from the managers that contained tenconstructs). The selected constructs are listed in the first row and first column. Matrixcells contain the existence, strengths (1 = weak, 2 = moderate, and 3 = strong) andpolarity of the causal relationship between those constructs which are listed in the rowand column. The direction of the influence is from row to column.
1.23 of September 25, 2000

13
time of data collection which started at the second part of 1992. Managers tendedto attribute these changes to the intent of the foreign partner to achieve the qual-ity and productivity standards of the foreign parent in order to eventually turncompany A into the parent’s major European production and R&D site. As oneHungarian manager said, “Our company will soon be integrated into [the acquir-ing company] and will produce to the standard which is typical in [the acquiringcompany].”
Since the change had been accompanied with laying off almost half of theemployees (altogether 8500 employees out of 18000 were laid off) and put manyremaining positions under threat the change was difficult and full of conflict.There were, however, three groups whose managers had a possible interest inthe change: (1) the foreign managers who were sent by the foreign parents tocompany A to orchestrate the change, and whose performance was judged by theresult of this change; (2) the tmt which included some of these foreign managersas well as Hungarian managers who were eager to prove themselves to the foreignparents; (3) and the production and R&D managers whose areas received mostof the new investment resources (which included, for example, setting up newproduction facilities, and receiving new technology), also these areas started hiringnew managers and employees (after an initial lay offs). These interest groups wereincluded into the analysis as potential loci for consensus.
In the second phase of the data collection (which included 14 managers), in1994, most of the changes were already completed. Changes confirmed the earlierpredictions of the managers. Company A in fact substantially improved its pro-ductivity and quality standards and was integrated into the parent company as amajor production and R&D site. Most of the other functions were centralized tothe European headquarters which was established during these three years. Dur-ing the change the company successfully improved its performance from US $105million loss in 1992 to 11,608,128 HUF gross profit (100 HUF ≈ 1 US$ in 1992) by1995 (Wall Street Journal Interactive, 1998). In the investigated period the com-pany showed a more than a 100% increase in both performance measures (totalgrowth of sales, ROA) which exceeded people’s expectations.
Company BChanges in company B started at the end of 1992 following the acquisition of thecompany by a British parent in 1991. These included the opening of a new plant,establishing a new marketing unit, setting up a new incentive system, and intro-ducing a more effective cost and quality control system. Most of these changes(except the new factory) were still in their early stages at the time of interviewing
1.23 of September 25, 2000
14
at the beginning of 1993. The major motivations for these changes were attributedby the interviewed managers (22 managers) to the intention of turning the com-pany from a previously production driven company to a market and sales orientedone. As one of the managers said, “The most important change in the company isthat we switch from the priority of the production to the priority of marketing.”
Unlike company A, changes in company B were accompanied by less conflictas these changes did not entail laying off employees. However, several interviewedmanagers expressed uncertainty and fear that this situation might change. Theinterviews implied that there were three potential groups with an interest in thechange: (1) members of the tmt that included both Hungarian and foreign man-agers and who were all included in developing a formal strategic plan which wasapproved just at the end of the first stage of the data collection; (2) the foreignmanagers who were sent to company B by the foreign parent to introduce changes;(3) the marketing and sales managers most of whom were young, highly trained,newly hired, with compensation packages, promotion possibilities and fringe ben-efits far exceeding those of other managers. As one manager from the productionarea said in a frustrated manner:
[A] new managerial group was formed here, and I refer now to the salesmanagers, who get western cars and huge salaries and other benefits. Canyou imagine this? [This] is a small town and nothing remains hidden.
These interest groups therefore were considered as potential loci of consensusin this company.
The second stage of the data collection took place in the second part of 1995with the participation of 20 managers. By this time the fear of those who wereafraid of the lay offs was justified as the company closed down one of its plants andlaid off several of its employees. This was done while the sales force of the companyhad increased. Managers also reported the first results of the new marketing andsales orientation which were shown in an increased market share in all of theproducts despite of an increase in the competition. The change was accompaniesby an increase in turnover (between 41–60%) and in profit (61–80%), and met theexpectations of most managers in overall performance.
Company CCompany C differed from the previous two companies in the sense that it was cre-ated by the acquisition and merger of six different Hungarian soft drink companiesby the Australian parent in 1991 and 1992. At the time of the interviewing in
1.23 of September 25, 2000

15
the first half of 1993 (which included 22 managers) the company was most inter-ested in developing a high market share before other major soft drink competitorsreached the Hungarian market (note, that this market was highly protected frommajor soft drink competitors before 1990). The management aimed to reach ahigh market share by turning the previously production driven acquired compa-nies into one large, marketing and sales oriented company. For this purpose theyestablished a large sales force by hiring young, highly trained, energetic managers,introduced marketing related training, and offered an attractive compensation sys-tem to the marketing and sales force. In addition to the above, other changes werealso introduced, but these were treated somewhat secondary to the effort whichwas devoted towards gaining and maintain a high market share. These latterchanges included building up a communication system across the six companies,and introducing new productivity improving and cost controlling measures.
Although integrating six companies carried many uncertainties, managers andemployees were initially not threatened by lay offs which decreased the initialconflict and resistance. But, as with company B, some managers expressed fearthat this situation might change. There were, however, three potential groupsthat managers suggested have a possible interest in the change: (1) the foreignmanagers who were sent to company C by the foreign parent to introduce changes;(2) members of the tmt that included both foreign and Hungarian managers andwho were eager to take part in the strategic management of the company; and(3) the marketing and sales managers, most of whom were seen as beneficiaries ofchange. As one manager said:
I do not think that anybody would love the sales people here, because theyare the ones who get everything good. They believed that the sales peopleare handed everything on a silver platter, which is true after all, becausesales is very important for the company.
The second stage of the data collection took part in 1995 with the participationof 17 managers. By that time the company headquarters were moved to a newsite which had good computer network facilities with contact to other plants.This improved the communication across the various plants and contributed tothe integration of the organization. By this time change related uncertaintieshad substantially decreased primarily because fears about future lay-offs provedto be unfounded. The effort of the company to maintain its originally acquiredmarket share had been successful despite a substantial increase in competition.In the investigated period the company showed a more than a 100% increase in
1.23 of September 25, 2000

16
both performance measures (total growth of sales, ROA) which exceeded mostmanagers’ expectations.
Calculation of consensus
This section describes how the various facets of consensus changed between thetwo phases of the study, and how these were calculated. Many of the types ofcalculations and their rationales are described in more detail by Markoczy andGoldberg (1995), but some are unique to this study.
The causal maps that were elicited from the managers were used for calculatingvarious facets of consensus. cms, however, do not yield well to direct statisticalanalysis. So, distances between pairs of cms form the basis for further calcula-tion. Distances between cms were calculated by using a distance formula whichwas developed by Langfield-Smith and Wirth (1992) and extended by Markoczyand Goldberg (1995). The distance between causal maps were measured as anumber between 0 and 1 inclusive, where 0 indicates identical maps and 1 totaldissimilarity.
The primary measure for degree of consensus for any group was the averagedistance (and standard deviation) between all pairs of cms from that group. Thegreater the average distance between cms, the smaller the level of consensus be-tween the people the cms were elicited from. The smaller the average distancethe greater the consensus level.1
The primary locus of consensus was measured by comparing the level of agree-ment within each group (e.g., tmt members) with the degree of agreement be-tween each member of that group with other managers in the sample. If therewas one (or more) group(s) whose members showed a substantially higher level ofagreement with each other than with others, then this group was considered tobe a locus of consensus. For example, if the cms of the members of the tmt werecloser to each other than they were to non-tmt members then the tmt would bethe locus of consensus.
Changes in the degree of consensus were measured by investigating whetherthe degree of consensus had increased in each group over time. If in the secondphase of the study there was a smaller average distance in cms for some groupthan in the first, then we can say that the degree of consensus increased for thatgroup.
1When comparing averages the standard deviation was and needs to be considered. Allmention of comparing averages in this paper should be understood as also taking variance orstandard deviations into account.
1.23 of September 25, 2000
17
Changes in the scope of consensus were measured by investigating whetherthe degree of consensus had substantially increased for the whole organization ornot. That is, if people who were not really in a group showing much consensus inthe first phase become closer to most other organization members in the secondphase, we can say that more people share in the consensus.
The locus of consensusAt the first phase of the data collection the potential locus of consensus includedthree groups in all three companies: (1) tmt members; (2) foreign managers; (3)a functional area which corresponded with the new strategic orientation of thecompanies (e.g., production-R&D or marketing-sales). These functional areas arereferred below as favored areas.2 The level of consensus was calculated for thewhole sample and for these three groups. Results are listed in Table 1.
The average distance of the cms for the whole sample inform us about thelevel or degree of consensus among the investigated managers. As indicated inthe table the lowest level of consensus (ie, the highest level of disagreement) amongthe investigated three companies was found in company C (x = 0.805). This isnot surprising given that this company seemed to be the least integrated as it wascreated from the merger of six companies.
The relative size of the average distance of the cms in each group in comparisonto the average distance of cms across the subgroup3 reflects whether they areprimary loci of consensus. In other words, the locus of consensus was establishedby comparing the average distance among the cms of the members of a subgroup(xw) with the average of distances of the cms across the subgroup (xa). SeeMarkoczy and Goldberg (1995, 321–322) for a more detailed explanation. A tvalue was then calculated for the comparison of these means. Note that these tvalues cannot be used (directly) to estimate probabilities. The locus of consensuswas considered to be limited to the given subgroup if the level of consensus withinthe subgroup was substantially higher in comparison to the outsiders (ie, the t
2The broader study, which the first phase of this study was part of, did not limit the investi-gation of the level of consensus to these groups but also investigated the agreement level amongmanagers with similar age, tenure and other characteristics. Information on all characteristicswas collected by using a questionnaire. The level of consensus among these groups are notdiscussed here as these are not relevant for the purpose of this study. The result of this broaderstudy is described in (self-reference).
3The average distance of cms across the subgroup was established by calculating distancesbetween cms of all pairs of managers one from inside the subgroup and the other from outsideof the subgroup. xa for tmt members, for example, is the average of the distances between allpairs of managers p and q such that p is a tmt member and q is not.
1.23 of September 25, 2000

18
value was large). Because it is problematic to calculate probability measures fromdistance data an indirect measure was used to gauge these probabilities.
When a subgroup of cause maps selected (let’s call this subgroup G) yields aparticular t values (tG) we can see how meaningful tG is by calculating the t valuesof every possible subgroup in the sample that is of the same size as G and see whatfraction of these t values are greater than tG. For example if tG is 1.3 and thereare eight members of G, and the sample has 20 members, then we calculate thet values for all possible combination of subgroups with 8 members of the sample(altogether 125,969 combinations) and see how many of them have a t value greaterthan 1.3. The percentage that do have a t > tG directly reflects the probability ofpicking a subgroup of that size from the sample with a greater t value. The smallerthis probability is the less likely it is that the given t value occurred by chance.This percentage is labelled %>t in the table. So instead of making a probabilityestimate, all of the alternative possibilities were literally counted. This notion ofcounting subsamples was developed for me by Jeff Goldberg and is inspired by –but is less sophisticated than – the jackknife (Efron and Tibshirani, 1993; Mooneyand Duval, 1993).4 Table 1 lists the average intra-subgroup and inter-subgroupdistances as well as the estimated standard deviations, the calculated t-values andthe indirect measures of probabilities at the time of the first data collection. Forcomparison it also lists the average distances and standard deviations of the cmsof all investigated organizational members in each organization.
Table 1 indicates that in none of the companies were the tmts the primarylocus of consensus (the relevant t-values are t = −0.775; t = 0.694; t = 0.914 forcompanies A, B and C). One locus of consensus in all three companies was thegroup of those managers who worked in the favored areas, (the relevant t-valuesare t = 3.352; t = 2.567; t = 1.211 for companies A, B and C) while in companyB the foreign managers were another locus of consensus (t = 4.588).
Changes in consensusIn the second phase of study changes in the level and scope of consensus wereinvestigated. Changes in the level of consensus are included into Table 2 for those
4One very important limitation of the technique described here is that it results in positioninga subgroup with respect to other potential subgroups within the sample, but says nothing directlyabout what can be inferred about the population from which that sample is drawn. Clearly theremust be some relationship. That relationship will depend not only on the sample size (the biggerthe better), but on the number of individuals in a tested subgroup (the closer to half the sample,the better). The appendix, by Jeff Goldberg, demonstrates that the calculated %>t values areremarkably good approximations of traditional p-values, even for the small sample and subgroupsizes used here.
1.23 of September 25, 2000

19
Table 1: Intra-subgroup distances
Subgroup M Nw Na xw xa σw σa t %>t
Company AAll 20 190 0.781 0.135tmt 11 55 99 0.796 0.778 0.132 0.134 −0.775 71.7NA-Frgn 8 28 96 0.771 0.788 0.136 0.139 0.574 30.3fas-PE+RD 6 15 84 0.658 0.778 0.105 0.131 3.352 0.5
Company BAll 22 231 0.742 0.142tmt 6 15 96 0.699 0.727 0.126 0.143 0.694 24.3fas-MA 5 10 85 0.592 0.718 0.130 0.148 2.567 1.6NA-Frgn 5 10 85 0.514 0.734 0.136 0.144 4.588 0.1
Company CAll 22 231 0.805 0.129Na-Frgn 8 28 112 0.790 0.804 0.126 0.136 0.496 30.8tmt 10 45 120 0.775 0.796 0.147 0.129 0.914 21.8fas-MA 4 6 72 0.707 0.776 0.154 0.133 1.211 10.0
M is the number of Maps, Nw is the number of distances between the mapswithin subgroups and Na is the number of distances across subgroups (ie,between maps which were within and outside of the subgroups). xw is themean distance between maps within subgroups and xa is the mean distanceacross members within and outside of the subgroups. σw is the estimatedstandard deviation within subgroups σa is the estimated standard deviationacross subgroups. The meaning of %>t is discussed in the text. Na-Frgnstands for foreign nationality (e.g., American, British, or Australian) andfas stand for the favored areas, which are R&D+production (PE+RD),and marketing+sales (MA).
1.23 of September 25, 2000
20
tmt members who took part in both stages of the data collection and for thoseforeigners and for those fa members who participated also in both stages of thedata collection. A large number of possible subgroups were tested, including allfunctional areas represented in the sample, dominant functional areas (Micheland Hambrick, 1992, 22), age, technical/non-technical education, sex, and levelof education. These subgroups are discussed by self-reference and self-reference.Those studies clearly found that the favored area was the only or primary locusof consensus and the only locus of consensus which held across five organizations(including the three discussed here) studied.5
Change in the level of consensus for any of the above groups was calculated bycomparing the average distance of the cms of the group members across the twostages of the data collection (ie, for the cms which were elicited at the first stageof the data collection and for the cms which were elicited at the second stage). Ifin any of these groups the new means were substantially smaller compared to theprevious means, without finding a substantial increase in the standard deviations,this would suggest that the level of consensus has increased in the given groupover time. The degree of change is illustrated by the last column which showshow many standard deviations away the new means are from the previous means.The table indicates that the average distance between cms decreased somewhatin most groups of managers in each organization. In other words in these groupsthe degree of consensus increased somewhat over time (the only exception fromthis are the foreign managers in company B where the average distance of cmsincreased over time from x = 0.514 to x = 0.690).
Table 2 also indicates a substantial decrease in the average distances of cmsfor the whole sample of those managers who participated in both stages of thedata collection (∆x/σ = 1.736 for company A, ∆x/σ = 1.355 for company B,∆x/σ = 4.083 for company C) which suggests that the scope of consensus hasincreased in each company during the strategy process. Within each companythe increase in consensus of all managers who participated in both stages of thedata collection was in fact larger than the increase of consensus for any of thespecific subgroup of those managers (except in company C for the group of foreignmanagers where ∆x/σ = 4.77 was slightly higher than the value for the both-phasemanagers of C, 4.083). This suggests that consensus building in each organizationoccurred not so much because the initial loci increased their degree of consensus
5If the pattern of consensus formation is as argued in this paper, we should still expect tofind that some of the other areas not listed would show substantial convergence. As people’sviews converge on that of the favored area, they will naturally be moving closer to each other.
1.23 of September 25, 2000

21
Table 2: Consensus formation over time
Subgroup N92 N95 x92 x95 σ92 σ95 ∆x/σCompany A
All 20 14 0.781 0.673 0.135 0.137 0.788Both phases 10 0.750 0.540 0.129 0.121 1.736tmt 5 0.804 0.637 0.091 0.110 1.518Na-Frgn 3 0.769 0.604 0.125 0.109 1.513fas 4 0.597 0.428 0.085 0.100 1.690
Company BAll 22 20 0.742 0.606 0.142 0.130 1.046Both phases 9 0.786 0.618 0.132 0.124 1.355tmt 5 0.715 0.606 0.124 0.130 0.838Na-Frgn 5 0.514 0.690 0.129 0.009 −1.840fas 3 0.687 0.617 0.030 0.071 0.993
Company CAll 22 17 0.805 0.575 0.129 0.115 2.000Both phases 9 0.852 0.509 0.106 0.084 4.083tmt 5 0.790 0.588 0.136 0.151 1.338Na-Frgn 3 0.882 0.405 0.095 0.100 4.770fas 4 0.789 0.527 0.035 0.083 3.157
N92 is the number of cms which were collected in 1992–93 in each orga-nization while N95 is the number of cms which were elicited in 1994–95.x92 and x95 are the mean distances of the cms, while σ92 and σ95 are theestimated standard deviations. ∆x/σ (calculated as x92 − x95/σ95) showshow many standard deviation away is the new mean from the previous one.“All” refers to the investigated sample of managers in each company, while“both phases” to only those managers who participated in both phasesof the data collection. tmt, Na-Frgn (foreign nationality), and fas markthose members of these groups who participated in both phases of the datacollection.
1.23 of September 25, 2000

22
but rather because the scope of consensus increased in each of the investigatedorganizations. That is, in each organization and for the people who participatedin both phases, the overall degree of consensus grew more than the degree ofconsensus for the original locus.
Potential causes of consensus formationAn increase in the scope of consensus might be the consequence of two changes:(1) a change in the composition of managers, namely that those who disagreed leftthe organizations; and/or (2) a convergence in beliefs. Both of these reasons areexplored below, but it should be noted that whichever reason applies, the scopeof consensus did, indeed, increase.
Whether changes in the composition of the managers or changes in the beliefsof managers contributed to the increase in the degree of consensus is derivablefrom the first two lines of Table 2 for each company. It can be inferred from thetable that after eliminating the effect of change in composition (ie, by comparingonly the means of the distances between the cms of those managers who took partin both stages of the data collection) those managers who participated in bothstages of the data collection showed larger change in their cms (∆x/σ = 1.736for company A, ∆x/σ = 1.355 for company B, ∆x/σ = 4.083 for company C)compared to the total of the managers in the sample (see ∆x/σ = 0.788 forcompany A, ∆x/σ = 1.046 for company B, ∆x/σ = 2.000 for company C).This suggests that consensus formation was not the consequence of changes inthe composition of organizational members but the consequence of changes inindividual beliefs.
This change could have occurred in three different ways. Either (1) all man-agers who participated in both stages of the data collection changed their beliefs,or (2) the beliefs of those managers who were outside of the original locus of con-sensus moved towards the beliefs of those in the original locus or (3) everybody’sbeliefs moved towards a different locus. If (2) is correct, this would be consistentwith the view that people outside of the interests groups adopted the views of theinterest groups.
To determine which of these three things occurred, further analyzes were doneon the cms of only those managers who participated in both phases and further-more who had not moved in or out of the favored areas. The calculation includedthe following steps. First pairwise distances were calculated between each man-agers’ first and second stage cm. This way the distance between the currentand past beliefs of each manager was calculated. As each managers’ belief wascompared only to his/her past belief company specificity of the cms was evened
1.23 of September 25, 2000

23
out, so data can be aggregated across organizations for this calculation. Thisaggregated subsample contained 28 managers altogether. Of these 28 managers,11 worked in the fas of their organization (where the original locus of consensuswas found), and the remaining 17 were outside of their company’s fas. As notedabove, anyone who moved either to or from the fas between the two phases ofdata collection was excluded from this subsample. This now gives us a measure ofwhich individuals changed the most and which changed the least. We can use thismeasure to see whether those individuals in the fas changed more or less thanthose outside the fas.
Those who worked outside the fas changed their beliefs more (n = 17, x =0.637, σ = 0.185) than those who worked inside the fas (n = 11, x = 0.585, andσ = 0.150) although the difference is not so large (the t value is 0.732). In sum,everyone’s beliefs ended up more similar to each other in the organization, butthe beliefs of members of the fas moved less than the beliefs of those outside ofthe fas. If everyone ended up closer to other members of the organization, butsome individuals moved less, then it follows that the others moved towards theones who moved less. So we can concluded that people outside of the fas cameto adopt the views of those within the fas. However, the non-significant t-valuerequires caution when interpreting this effect.
Discussion
This study offers a refined conceptualization of consensus formation and demon-strates how this conceptualization enables us to uncover patterns of consensusformation which shed important light on the consensus development. It is an in-vestigation of the locus, degree, and scope of consensus in three organizations allundergoing strategic change. The principal findings can be summarized in threepoints: (1) At the early stage of strategic change the primary loci of consensuswere not in the tmts but in other interest groups particularly those in the fas.(2) Consensus formation, in fact, occurred during the strategic change within allthree organizations in most of the investigated interest groups as well as amongall of the investigated organizational members. (3) Consensus building took placeless through strengthening the degree of consensus among the initial coalitionmembers but more through increasing the scope of consensus. These patterns ofconsensus and consensus development are consistent with the a incremental viewof the strategy process. Each of these findings and their implications are discussedbelow.
A major finding of this study was that the primary locus of consensus was
1.23 of September 25, 2000

24
not in the tmts in any of the investigated organizations but in other interestgroups particularly those in the fas.6 Even though our sample is small, thisdoes seriously challenge any view that expects or assumes the locus of consensusis normally in the tmt during massive strategic change. While there are manythings specific to the sample, in the absence of any prior reason to believe thatthose specific characteristics of this sample would lead to consistent and atypicalloci of consensus, the case remains very strong that the tmt in general is not thelocus of consensus during large strategic change. Had we found that the locus wasalways among the managers from the foreign parent, one might argue that thepattern uncovered would be specific to acquisitions. However, we found the foreignmanagers to be a locus in only one of the investigated companies (Company B),and even in that organization it was not the only locus. However, there was noexception to the pattern of the favored area being among the loci. So there remainsno positive reason to expect that the results are a consequence of the peculiarity ofthe sample. Until someone develops a theory that specifies the conditions underwhich the tmt is the primary locus of consensus, researchers should no longerreadily assume that the tmt is a locus. Studies on strategic decision makingin organizational contexts have already pointed out that the locus of power inshaping strategic decisions often differs from the tmt (e.g., Pettigrew, 1992). So,why would we expect that the primary locus of consensus will necessarily be inthe tmt?
Studies with a narrow focus on the tmts could easily overlook alternative lociof consensus. It is plausible, therefore, that some of the mixed results of previousconsensus-performance studies were the consequence of failing to find the truelocus of consensus. Consensus may very well matter for performance, even if thatconsensus isn’t in the tmt.
This study found that the locus of consensus was in the favored area. Thequestion “where is the locus of consensus?” could not have been asked – muchless investigated and answered – without the notion of locus of consensus. Inall three of the investigated organization those who worked in the fas showeda higher within group agreement than across group agreement. Although thesample is small, a consistent pattern across multiple cases can still be treated asan indication of some underlying relationship.7 This finding is consistent with
6In the two additional organizations discussed only in the first phase of the study the patternwas the same: The locus of consensus was never the tmt.
7At the risk of venturing into the loathsome domain of methodology, it is worth pointing outhere that for some questions even a sample size of one is interesting. If a new tool is developedwhich allows us to carefully investigate the color of swans, and upon using it on one or two
1.23 of September 25, 2000

25
the incremental view of the strategy process which calls attention to the possibleimportance of various interest groups in the strategy process. Additionally, thisstudy also found that consensus formation happened through the convergence ofthe beliefs of other organization members towards the initial loci of consensus.
Another important finding is that consensus building did occur during strate-gic change. Although many strategy researchers assume that consensus buildingdoes occur, little work has been done to find empirical support for this assump-tion. Although it can not be excluded that consensus could have formed withoutchange due to organizational members working together over time, the identifiedpattern of consensus formation suggests otherwise. Convergence occurred towardsthe interest group that was favored by the strategic change. Without a strategicchange, there could be no area favored by a (nonexistent) strategic change. Whatthis study can’t resolve is whether this consensus formation influenced the strate-gic choice of the organizations. In all three cases the choice was made prior to theperiod of the study, and the pattern observed could have been the consequenceof more and more people within the organization coming to accept that choice,while the first people to accept that choice were those in the fa . Even so, theresults are more consistent with the incremental view, otherwise we should expectto see the tmt as the primary locus with spreading of scope from there.
This study shows that consensus building occurred in the investigated organi-zations and that this took place more through an increase in the scope of consensusrather than through an increase in the degree of consensus. Consensus studieswith a narrow focus on the degree of consensus or on changes in the degree ofconsensus would entirely miss the importance of the scope of consensus in the con-sensus building process. This repeats a warning to those studying consensus notto miss the investigation of the scope of consensus when investigating consensusbuilding. The importance of the scope of consensus is recognized in the strat-egy literature (e.g., Frederickson, 1984; Mintzberg, 1973; Mintzberg, 1978; Quinn,1980), but only recently in studies on consensus (Floyd and Wooldridge, 1992).
This study did not set out to investigate the effect of consensus on performance,and the little performance data reported must be taken with a great deal ofcaution. While all three organizations dramatically improved their performancebetween the two phases of the study, there is no basis to compare whether thatis connected with consensus formation, and if it is, how. But when coupled with
swans we see that they are not actually white but only appear white, we can safely assumethat we had been mistaken about a vast number of other swans. The locus of consensus mayoccasionally be in the tmt in some organizations, but that no longer appears to be the mostlikely location.
1.23 of September 25, 2000
26
other empirical and theoretical work on consensus and performance, this studydoes have a real message to practice.
This study warns practitioners that increasing the scope of consensus mightbe more important for the organization than increasing the degree of consensusin the tmt. As a consequence we should be more skeptical of advice advocatingthe building of consensus among the tmt. Of course there may be many (other)reasons why consensus among the tmt is valuable. But the simple models ofthe relationship between consensus in the board-room and performance that havebeen assumed in some work don’t hold up under close examination. Advice basedon those models may ultimately turn out to be good advice, but not for thereasons initially suggested.
Overall, this study points to the importance of viewing consensus as a multi-faceted concept. Only by separating these facets (and looking at their interactions)can we develop clear, meaningful, and useful accounts of the relationship betweenconsensus and performance.
Despite (or actually because of) the important implications of this study itsresults need to be handled with caution. The limitations of the study both insample and in the number of things it looked at should be clear. In particular,the novel analysis techniques along with a smaller than ideal sample should be astrong reason for caution. Additionally, the study could have been improved byalso investigating organizations which were not undergoing strategic changes toprovide some control measure. Nonetheless, even without being able to producesignificance-like statistical inferencing from the sample, we do see that in all of theorganizations studied there appeared to be a locus of consensus – not in the tmt–from which the organizational consensus grew. It should also be clear that muchof what has been implicitly believed about consensus, its locus and developmentmust be explicitly reevaluated. It will take a substantial number of studies usinga variety of different methods before that question can be resolved to the field’sunderstanding. What will help that work is the awareness that one can’t simplytalk about the “quantity of consensus” as an atomic unit, but must consider itsvarious facets.
1.23 of September 25, 2000

27
References
Andrews, K. R. (1971). The concept of corporate strategy. Homewood, IL: RichardD. Irwin, Inc.
Ansoff, H. I. (1965). Corporate strategy: An analytic approach to business policyfor growth and expansion. New York: McGraw-Hill.
Bettman, J. R. and Weitz, B. A. (1983). ‘Attributions in the board room: Causalreasoning in corporate annual reports’. Administrative Science Quarterly,28, 165–183.
Bourgeois, L. J. (1980). ‘Performance and consensus’. Strategic ManagementJournal, 1, 227–248.
Bourgeois, L. J. (1985). ‘Strategic goals, perceived uncertainty, and economicperformance in volatile environment’. The Academy of Management Journal,28, 548–573.
Brown, A. and Heller, F. (1981). ‘Usefulness of group feedback analysis as aresearch method: Its application to a questionnaire study’. Human Relations,34, 2, 141–156.
Buono, A. F. and Bowditch, J. L. (1989). The human side of mergers and acqui-sitions: Managing collisions between people, cultures, and organizations. SanFrancisco, CA: Jossey-Bass.
Burgelman, R. A. (1991). ‘Intreorganizational ecology of strategy making andorganizational adaptation: Theory and field research’. Organization Science,2, 3, 239–262.
Cosier, R. A. and Rechner, P. L. (1985). ‘Inquiry method effects on performancein a simulated business environment’. Organizational Behavior and HumanDecision Processes, 36, 1, 79–95.
Cyert, R. M. and March, J. G. (1963). A behavioral theory of the firm. NewJersey: Blackwell.
Daniels, K., Markoczy, L. and de Chernatony, L. (1994). ‘Comparing cognitivemaps’. In Meindl, J. R., Porac, J. F. and Stubbart, C. (Eds), Advancesin managerial cognition and organizational information processing. Vol. 5.Greenwich, Conn: Jai Press. pp. 141–164.
1.23 of September 25, 2000

28
Dearborn, D. C. and Simon, H. A. (1958). ‘Selective perception: A note on thedepartment identification of executives’. Sociometry, 21, 140–144.
Dess, G. G. (1987). ‘Consensus formulation and organizational performance:Competitors in a fragmented industry’. Strategic Management Journal, 8,259–277.
Dess, G. G. and Oringer, N. K. (1987). ‘Environment, structure, and consensusin strategy formulation: A conceptual integration’. The Academy of Man-agement Review, 12, 2, 313–330.
Dess, G. G. and Priem, R. L. (1995). ‘Consensus-performance research: The-oretical and empirical extensions’. Journal of Management Studies, 32, 4,401–418.
DeWoot, P., Heyvaert, H. and Martou, F. (1977–78). ‘Strategic management: Anempirical study of 168 Belgian firms’. International Studies of Managementand Organization, 7, 60–75.
Dutton, J. E. and Jackson, S. E. (1987). ‘Categorizing strategic issues: Links toorganizational action’. Academy of Management Review, 12, 1, 76–90.
Dutton, J. E. and Ottensmeyer, E. (1987). ‘Strategic issue management systems:Forms, functions, and contexts’. Academy of Management Review, 12, 2,355–365.
Dutton, J. E., Walton, E. J. and Abrahamson, E. (1989). ‘Important dimen-sions of strategic issues: Separating the wheat from the chaff’. Journal ofManagement Studies, 26, 4, 379–396.
Eden, C. (1992). ‘On the nature of cognitive maps’. Journal of ManagementStudies.
Efron, B. and Tibshirani, R. J. (1993). An introduction to the bootstrap. London:Chapman and Hall.
Eisenhardt, K. M. and Bourgeois, L. J. (1988). ‘Politics of strategic decision mak-ing in high-velocity environments: Towards a midrange theory’. Academy ofManagement Journal, 31, 4, 737–770.
Eisenhardt, K. M. and Zbaracki, M. J. (1992). ‘Strategic decision making’. Strate-gic Management Journal, 13, 17–37.
1.23 of September 25, 2000

29
Fiske, S. T. and Taylor, S. E. (1991). Social Cognition. McGraw-Hill Series inSocial Psychology. second edn. New York: McGraw-Hill.
Floyd, S. W. and Wooldridge, B. (1992). ‘Managing strategic consensus: Thefoundation of effective implementation’. The Academy of Management Ex-ecutive, 6, 4, 27–39.
Ford, J. D. (1985). ‘The effects of causal attributions on decision makers’ responsesto performance downturns’. Academy of Management Review, 10, 4, 770–786.
Frederickson, J. W. (1983). ‘Strategy process research: Questions and recommen-dations’. The Academy of Management Review, 8, 4, 565–575.
Frederickson, J. W. (1984). ‘The comprehensiveness of strategic decision mak-ing processes: Extension, observations, future directions’. The Academy ofManagement Journal, 27, 399–423.
Frederickson, J. W. (1986). ‘The strategy decision process and organizationalstructure’. The Academy of Management Review, 11, 6, 280–297.
Ginsberg, A. (1990). ‘Connecting diversification to performance: A sociocognitiveapproach’. Academy of Management Review, 15, 3, 514–545.
Grinyer, P. H. and Norburn, D. (1977–78). ‘Planning for existing markets: Anempirical study’. International Studies of Management and Organization, 7,99–122.
Hambrick, D. C. (1981). ‘Strategic awareness within top management teams’.Strategic Management Journal, 2, 263–279.
Hambrick, D. C. and Mason, P. A. (1984). ‘Upper echelons: The organization as areflection of its top managers’. Academy of Management Review, 9, 193–206.
Heller, F. A. (1969). ‘Group feedback analysis: A method of field research’.Psychological Bulletin, 72, 2, 108–117.
Hodgkinson, G. P. and Johnson, G. (1994). ‘Exploring the mental models ofcompetitive strategists: The case for a processual approach’. Journal ofManagement Studies, 31, 525–551.
1.23 of September 25, 2000

30
Hrebiniak, L. G. and Snow, C. C. (1982). ‘Top-management agreement and or-ganizational performance’. Human Relations, 35, 12, 1139–1158.
Huff, A. S. (Ed) (1990). Mapping Strategic Thought. New York: John Wiley &Sons.
Langfield-Smith, K. M. and Wirth, A. (1992). ‘Measuring differences betweencognitive maps’. Journal of the Operational Research Society, 43, 12, 1135–1150.
Laukkanen, M. (1992). Comparative Cause Mapping of Management Cognitions:A Computer Database Method for Natural Data. Helsinki: Helsinki School ofEconomics and Business Administration Publications.
Lawrence, P. R. and Lorsch, J. W. (1967). Organization and Environment: Man-aging Differentiation and Integration. Cambridge, MA: Harvard UniversityPress.
Lindblom, C. E. (1959). ‘The science of ‘muddling through’’. Public Administra-tion Review, 19, 2, 78–88.
Lord, R. G. and Maher, K. J. (1993). Leadership and Information Processing:Linking Perceptions and Performance. London: Routledge.
Lyles, M. A. (1981). ‘Formulating strategic problems: Empirical analysis andmodel development’. Strategic Management Journal, 2, 61–75.
Markoczy, L. and Goldberg, J. (1995). ‘A method for eliciting and comparingcausal maps’. Journal of Management, 21, 2, 305–333.
Michel, J. G. and Hambrick, D. C. (1992). ‘Diversification posture and top man-agement team characteristics’. Academy of Management Journal, 35, 1, 9–37.
Mintzberg, H. (1973). ‘Strategy making in three modes’. California ManagementReview, 16, 2, 44–53.
Mintzberg, H. P. (1978). ‘Patterns in strategy formation’. Management Science,24, 934–948.
Mitroff, I. I., Pearson, C. and Pauchant, T. C. (1992). ‘Crises management andstrategic management: Similarities, differences and challanges’. In Shrivas-tava, P., Huff, A. and Dutton, J. (Eds), Advances in Strategic Management.Vol. 8. Greenwich, CT: Jai Press. pp. 235–260.
1.23 of September 25, 2000

31
Mooney, C. Z. and Duval, R. D. (1993). Bootstraping: A Nonparametric Approachto Statistical Inference. Number 95 In Quantitative Applications in the SocialSciences. London: Sage.
Narayanan, V. K. and Fahey, L. (1982). ‘The micropolitics of strategy formula-tion’. Academy of Management Review, 7, 25–34.
Nielson, R. P. (1981). ‘Toward a method of building consensus during strategicplanning’. Sloan Management Review, 22, 4, 29–40.
Nutt, P. C. (1987). ‘Identifying and appraising how managers install strategy’.Strategic Management Journal, 8, 1, 1–14.
Pettigrew, A. M. (1992). ‘On studying managerial elites’. Strategic ManagementJournal, 13, 162–182.
Priem, R. L. (1990). ‘Top management team group factors, consensus and firmperformance’. Strategic Management Journal, 11, 6, 469–478.
Priem, R. L., Harrison, D. A. and Muir, N. K. (1995). ‘Structured conflict andconsensus outcomes in group decision making’. Journal of Management, 21,4, 691–710.
Quinn, J. B. (1980). Strategies for change: Logical incrementalism. Homewood,IL: Dow Jones.
Sales, A. and Mirvis, P. H. (1985). ‘When cultures collide: Issues in acquisitions’.In Kimberly, J. R. and Quinn, R. E. (Eds), New Futures: The Challenge ofManaging Corporate Transitions. Homewood, IL: Dow Jones-Irwin. pp. 107–133.
Schweiger, D. M., Sandberg, W. R. and Ragan, J. W. (1986). ‘Group approachesfor improving strategy decision making: A comparative analysis of dialecti-cal inquiry, devil’s advocacy, and consensus’. The Academy of ManagementJournal, 29, 1, 51–71.
Stagner, R. (1969). ‘Corporate decision making: An empirical study’. Journal ofApplied Psychology, 53, 1–13.
Stewart, D. W. and Latham, D. R. (1980). ‘A preference mapping of organiza-tional objectives of sports franchise executives’. Journal of Applied Psychol-ogy, 65, 5, 610–615.
1.23 of September 25, 2000

32
Svenson, O. and Maule, J. A. (1993). Time pressure and stress in human judgmentand decision making. New York: Plenum.
Wall Street Journal Interactive (1998). ‘Top 100 hungarian companies. rankedby 1996 sales’. http://interactive.wsj.com/public/resources/documents/ceer-Hungar.htm. (Website, seen May, 1999).
Walsh, J. P. (1988). ‘Selectivity and selective perception: An investigation ofmanagers’ belief structures and information processing’. Academy of Man-agement Journal, 31, 4, 873–896.
Walsh, J. P. (1995). ‘Managerial and organizational cognition: Notes from a tripdown memory lane’. Organization Science, 6, 3, 280–321.
Walsh, J. P. and Fahey, L. (1986). ‘The role of negotiated belief structures instrategy making’. Journal of Management, 12, 325–338.
Whyte, G. (1989). ‘Groupthink reconsidered’. The Academy of ManagementReview, 14, 1, 40–56.
Wooldridge, B. and Floyd, S. W. (1989). ‘Strategic process effects on consensus’.Strategic Management Journal, 10, 3, 295–302.
Yin, R. K. (1994). Case study research: Design and methods. Thousand Oaks,CA: Sage.
1.23 of September 25, 2000
33
Assessing probabilities from analysis
This appendix is primarily the work of Jeffrey Goldberg and not of the authorof this paper as a whole. It very briefly describes some work done at the au-thor’s request to assess to what extent calculated %>t values can be used to makeinferences about the population as a whole.
The approach used was to run a large number of simulations with many ran-dom samples drawn from a random population and see how many “false positives”occurred for a particular combination of sample size, subgroup size and %>t value.The overall results are that even for the smallest subgroup used, the %>t valuesappear to be very good estimators of the chances of getting a stronger result froma random sample out of a random population. That is, where a %>t value is, say5%, only 5% of random samples from random populations yield a stronger (lower)%>t value.
The overall technique was to generate a random population and repeatedlyselect random samples from it, and for each sample select a single random sub-group and run the analysis described in the paper. Then it was simply a matterof tallying how many of those samples the calculated %>t was lower than thatreported for the real data.
In slightly more detail, if we wish to get some idea of how well %>t valuescorrespond to traditional significance values (p) we can generate a large randompopulation, and take random samples from that and see how those samples behave.Suppose for example we are concerned about a case where we have a sample of 20,a subgroup size of 6 and %>t of 0.5. (This is the situation with the favored areain Company A.) What we do is
1. Generate a large random population of say 100000 members. (The charac-teristics of “random” will be described below).
2. From that population select lots of samples of the size we are interested in(20 in our current example). Suppose we pick 10000 such samples.
3. For each of those samples we select randomly one subgroup of the size weare interested in (six in our current example).
4. For that subgroup we run the same statistical analysis of the cross andwithin t-tests and save the reported %>t values.
5. With a 10000 (in our example) random samples from our population we seehow many have %>t which are less than the one actually calculated from the
1.23 of September 25, 2000
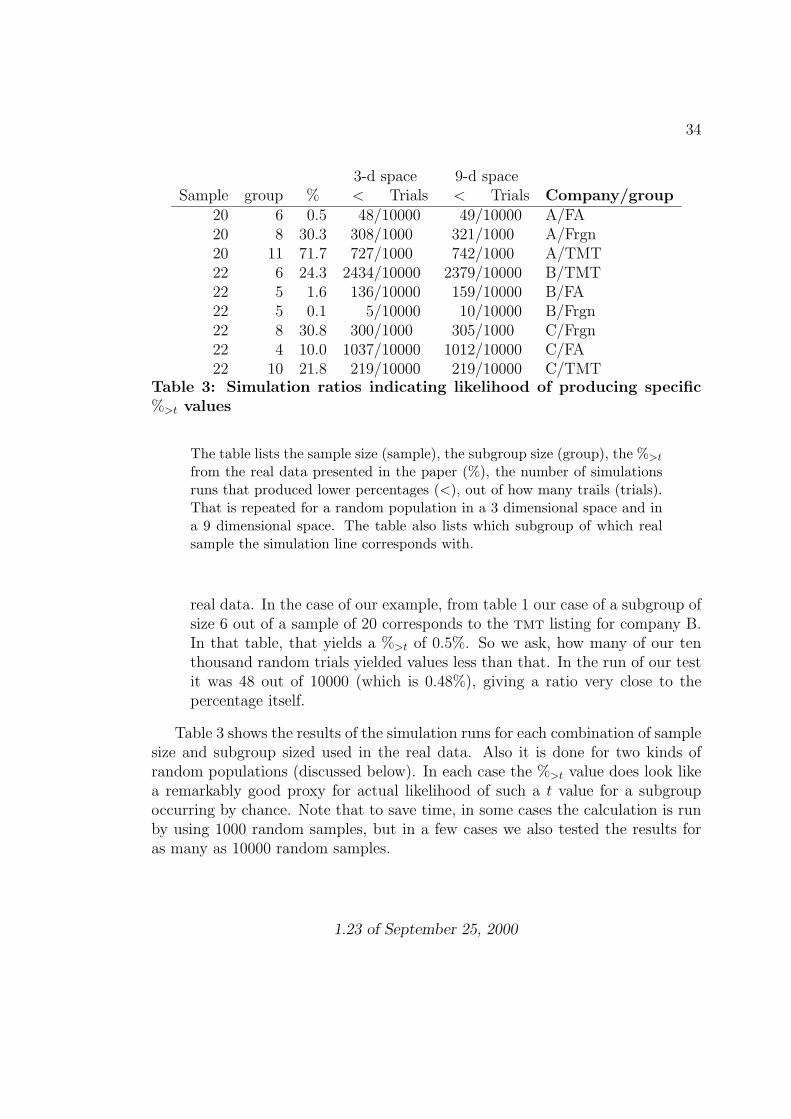
34
3-d space 9-d spaceSample group % < Trials < Trials Company/group
20 6 0.5 48/10000 49/10000 A/FA20 8 30.3 308/1000 321/1000 A/Frgn20 11 71.7 727/1000 742/1000 A/TMT22 6 24.3 2434/10000 2379/10000 B/TMT22 5 1.6 136/10000 159/10000 B/FA22 5 0.1 5/10000 10/10000 B/Frgn22 8 30.8 300/1000 305/1000 C/Frgn22 4 10.0 1037/10000 1012/10000 C/FA22 10 21.8 219/10000 219/10000 C/TMT
Table 3: Simulation ratios indicating likelihood of producing specific%>t values
The table lists the sample size (sample), the subgroup size (group), the %>t
from the real data presented in the paper (%), the number of simulationsruns that produced lower percentages (<), out of how many trails (trials).That is repeated for a random population in a 3 dimensional space and ina 9 dimensional space. The table also lists which subgroup of which realsample the simulation line corresponds with.
real data. In the case of our example, from table 1 our case of a subgroup ofsize 6 out of a sample of 20 corresponds to the tmt listing for company B.In that table, that yields a %>t of 0.5%. So we ask, how many of our tenthousand random trials yielded values less than that. In the run of our testit was 48 out of 10000 (which is 0.48%), giving a ratio very close to thepercentage itself.
Table 3 shows the results of the simulation runs for each combination of samplesize and subgroup sized used in the real data. Also it is done for two kinds ofrandom populations (discussed below). In each case the %>t value does look likea remarkably good proxy for actual likelihood of such a t value for a subgroupoccurring by chance. Note that to save time, in some cases the calculation is runby using 1000 random samples, but in a few cases we also tested the results foras many as 10000 random samples.
1.23 of September 25, 2000

35
About the random samples and populationThe results reported here are based on distances between members of a populationdistributed uniformly in a three dimensional space and in a nine dimensional space.There was no apparent difference when tested using a 2 dimensional space. Evenon test runs of buggy versions of the software, which in some versions it seededthe random number generator poorly, the results were similar.
For complete detailsFor more details about the algorithms, software and results, see http://FILL-THIS-IN-LATERwhich will include source code of the software used.
1.23 of September 25, 2000


![Review Is Rational Disagreement Possible?faculty.washington.edu/conormw/Teaching/Files/Models/... · 2019. 4. 17. · Hegselmann and Krause, 2002]. The dynamics of consensus-formation](https://static.fdocuments.net/doc/165x107/60a6069fc7860477c13322fb/review-is-rational-disagreement-possible-2019-4-17-hegselmann-and-krause.jpg)