
Characteristics Analysis of Non-linear Torsional Vibration ...

1065
Stessa 2012 – Mazzolani & Herrera (eds)© 2012 Taylor & Francis Group, London, ISBN 978-0-415-62105-2
Consecutive vibration characteristics monitoring of high-rise steel building
Y. Hayashi, M. Sugino, M. Yamada, N. Takiyama & Y. OnishiKyoto University, Kyoto, Japan
T. AkazawaGeo-Research Institute, Osaka, Japan
ABSTRACT: This paper reported the continuous seismic observation for a super-high-rise steel building in Osaka basin, Japan. We observed 16 earthquake records including the Tohoku earthquake on March 11, 2011. The signal to noise ratio is sufficiently good for all records. We estimated natural period and impulse response from those seismograms, and showed slight frequency shift due to nonlinear effect. We used microtremor records to estimate the natural period and damping of the building. By stacking sufficiently long records, we can extract those building property from microtremor records. Finally, the analysis models of the steel building used in the structure design are demonstrated based on the observed results.
stories for the penthouse, and four stories under the ground level (Fig. 1(b)). The structure is steel moment-resisting frame above ground and steel-reinforced concrete frame with shear walls under the ground level. The building is supported by the direct foundations with diaphragm walls. The depth of the direct foundation is 18 m from the ground and the diaphragm walls reaches to 35 m from the soil surface. The predominant natural periods of the design model are 2.28 seconds and 2.30 seconds in NS and EW direction, respectively (see Table 2). The designed damping factor is 2%.
1 INTRODUCTION
In Japan, probabilities of the occurrence of large inter plate earthquakes such as Nankai and Tonankai earthquakes become high, and the degree of urgency is increasing. Moreover, the occurrence probability of the earthquake of the Uemachi fault zone which runs directly under the center of the Osaka basin also belongs to the quite high cate-gory in the inland shallow earthquakes. In order to prepare for these large earthquakes, it is impor-tant that we can predict the behavior of buildings during earthquakes, and identify damage quickly from change in vibration characteristics before and after an earthquake. Then, in order to evaluate the seismic performance of a steel building and to improve vibration monitoring technology, we have started the dense consecutive vibration monitor-ing of a super-high-rise steel building. This paper reports the outline of a seismic observation system and the vibration characteristics of a super high-rise steel building based on analytical results of observed records.
2 OUTLINE OF SEISMIC OBSERVATION
2.1 Building for observation
The target building is located in the Osaka pre-fecture. The building is about 95 m in height and the floor area is about 30 square meters as shown in Fig. 1(a). The building is 21 stories with two
Figure 1. Outline of observed building and location of seismometers.
1066
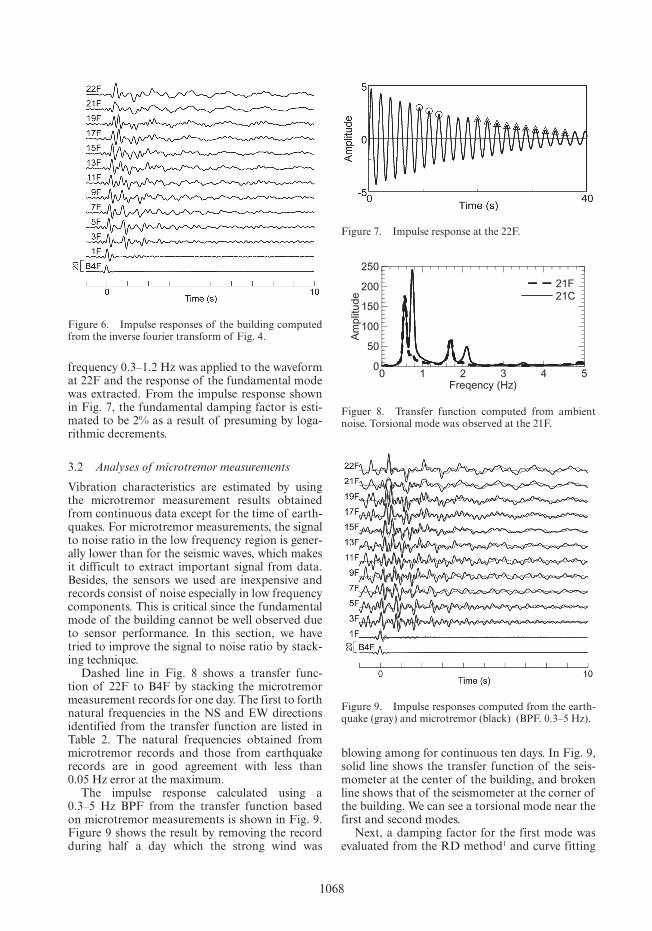
Data logger SeismometerSwitchinghub
Data collection
server
HDD
Internet
Data logger Seismometer
Data logger Seismometer
Data logger Seismometer
Data logger Seismometer
Figure 2. Outline of the continuous observation system.
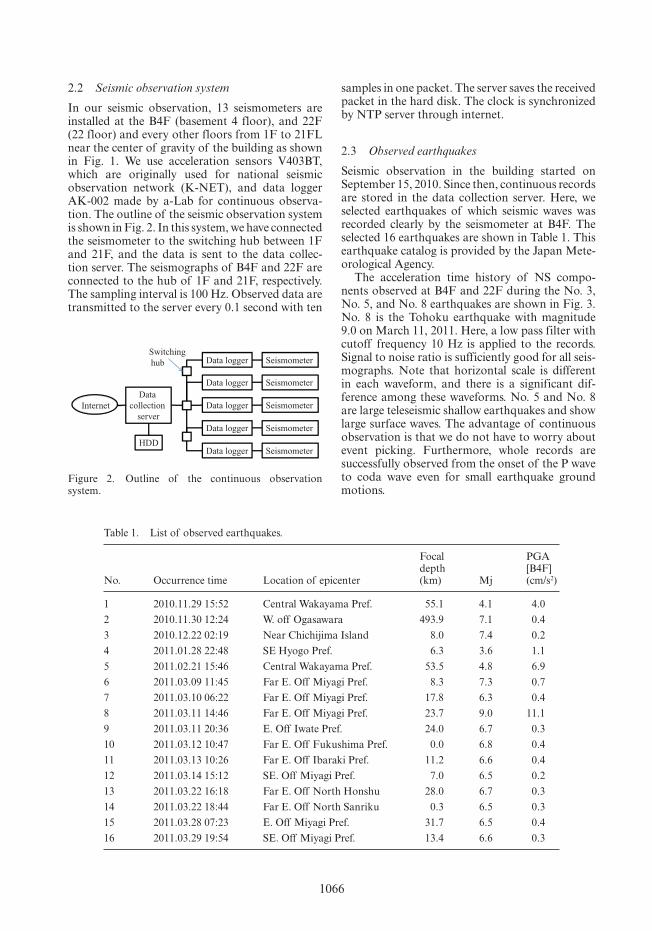
Table 1. List of observed earthquakes.
No. Occurrence time Location of epicenter
Focal depth (km) Mj
PGA [B4F] (cm/s2)
1 2010.11.29 15:52 Central Wakayama Pref. 55.1 4.1 4.0
2 2010.11.30 12:24 W. off Ogasawara 493.9 7.1 0.4
3 2010.12.22 02:19 Near Chichijima Island 8.0 7.4 0.2
4 2011.01.28 22:48 SE Hyogo Pref. 6.3 3.6 1.1
5 2011.02.21 15:46 Central Wakayama Pref. 53.5 4.8 6.9
6 2011.03.09 11:45 Far E. Off Miyagi Pref. 8.3 7.3 0.7
7 2011.03.10 06:22 Far E. Off Miyagi Pref. 17.8 6.3 0.4
8 2011.03.11 14:46 Far E. Off Miyagi Pref. 23.7 9.0 11.1
9 2011.03.11 20:36 E. Off Iwate Pref. 24.0 6.7 0.3
10 2011.03.12 10:47 Far E. Off Fukushima Pref. 0.0 6.8 0.4
11 2011.03.13 10:26 Far E. Off Ibaraki Pref. 11.2 6.6 0.4
12 2011.03.14 15:12 SE. Off Miyagi Pref. 7.0 6.5 0.2
13 2011.03.22 16:18 Far E. Off North Honshu 28.0 6.7 0.3
14 2011.03.22 18:44 Far E. Off North Sanriku 0.3 6.5 0.3
15 2011.03.28 07:23 E. Off Miyagi Pref. 31.7 6.5 0.4
16 2011.03.29 19:54 SE. Off Miyagi Pref. 13.4 6.6 0.3
2.2 Seismic observation system
In our seismic observation, 13 seismometers are installed at the B4F (basement 4 floor), and 22F (22 floor) and every other floors from 1F to 21FL near the center of gravity of the building as shown in Fig. 1. We use acceleration sensors V403BT, which are originally used for national seismic observation network (K-NET), and data logger AK-002 made by a-Lab for continuous observa-tion. The outline of the seismic observation system is shown in Fig. 2. In this system, we have connected the seismometer to the switching hub between 1F and 21F, and the data is sent to the data collec-tion server. The seismographs of B4F and 22F are connected to the hub of 1F and 21F, respectively. The sampling interval is 100 Hz. Observed data are transmitted to the server every 0.1 second with ten
samples in one packet. The server saves the received packet in the hard disk. The clock is synchronized by NTP server through internet.
2.3 Observed earthquakes
Seismic observation in the building started on September 15, 2010. Since then, continuous records are stored in the data collection server. Here, we selected earthquakes of which seismic waves was recorded clearly by the seismometer at B4F. The selected 16 earthquakes are shown in Table 1. This earthquake catalog is provided by the Japan Mete-orological Agency.
The acceleration time history of NS compo-nents observed at B4F and 22F during the No. 3, No. 5, and No. 8 earthquakes are shown in Fig. 3. No. 8 is the Tohoku earthquake with magnitude 9.0 on March 11, 2011. Here, a low pass filter with cutoff frequency 10 Hz is applied to the records. Signal to noise ratio is sufficiently good for all seis-mographs. Note that horizontal scale is different in each waveform, and there is a significant dif-ference among these waveforms. No. 5 and No. 8 are large teleseismic shallow earthquakes and show large surface waves. The advantage of continuous observation is that we do not have to worry about event picking. Furthermore, whole records are successfully observed from the onset of the P wave to coda wave even for small earthquake ground motions.

1067
3 VIBRATION CHARACTERISTICS OF OBSERVED BUILDING
3.1 Analysis of earthquakes records
The vibration property of the steel building is ana-lyzed by using earthquake records listed in Table 1. Hereafter, we use only NS component unless we specify. We use the seismic record from 1 second before the S wave arrival and end of the building response at 22F. A transfer function of each story against B4F is obtained by performing an ensem-ble average of earthquake records, and shown in Fig. 4. The peaks at less than 5 Hz in transfer func-tions are corresponding to the natural frequencies of the building. However, peaks at higher frequen-cies are due to noise. For example, the peak around 5.3 Hz in 13–19F is due to the excitation in the UD direction. The first to forth natural frequencies are identified from the transfer function of 22F in the NS and EW direction, and listed in Table 2. The fundamental natural period is 1.78 second (= 0.56 Hz), which is 0.5 second shorter than that of the design model (2.28 second (= 0.44 Hz) in NS direction and 2.30 second (= 0.44 Hz) in EW direction). Figure 5 compares the transfer func-tion for the Tohoku earthquake on March 11 and local earthquake on February 21. The first peak for the local earthquake is 0.57 Hz, and that for the Tohoku earthquake is 0.54 Hz. We can see the difference due to the nonlinear effect more clearly in the higher mode even if the maximum average shear drift angle is less than 1/2000.
Impulse responses calculated from the transfer function of Fig. 4 is shown in Fig. 6 by using a 0.3–5 Hz band-pass filter (BPF). From Fig. 6, we
Figure 3. Examples of acceleration records (upper: 22F, lower: B4F).
Figure 4. Transfer functions of the building.
Table 2. Natural frequencies obtained from analysis model and observations (unit: Hz).
Dir. 1st f1 2nd f2 3rd f3 4th f4
Shear model NS 0.44 1.20 1.93 2.57
EW 0.44 1.17 1.88 2.53
Flexure shear model
NS 0.44 1.29 2.22 3.07
EW 0.44 1.27 2.21 3.05
Earthquake records
NS 0.56 1.65 2.97 4.10
EW 0.56 1.65 2.91 4.15
Microtremor measurements
NS 0.57 1.68 2.95 4.15
EW 0.57 1.70 2.93 4.15
0
5
10
15
20
0 1 2 3 4 5
2011.02.21 15:462011.03.11 14:46
Am
plit
ude
Freqency (Hz)
Figure 5. Transfer functions for Tohoku earthquake on March 11 and local earthquake on February 21.
can recognize that the waves are traveling from B4F to 22F, and reflecting back to B4F in the building. In order to see the transient response of the building, a band-pass filter with cutoff
1068
frequency 0.3–1.2 Hz was applied to the waveform at 22F and the response of the fundamental mode was extracted. From the impulse response shown in Fig. 7, the fundamental damping factor is esti-mated to be 2% as a result of presuming by loga-rithmic decrements.
3.2 Analyses of microtremor measurements
Vibration characteristics are estimated by using the microtremor measurement results obtained from continuous data except for the time of earth-quakes. For microtremor measurements, the signal to noise ratio in the low frequency region is gener-ally lower than for the seismic waves, which makes it difficult to extract important signal from data. Besides, the sensors we used are inexpensive and records consist of noise especially in low frequency components. This is critical since the fundamental mode of the building cannot be well observed due to sensor performance. In this section, we have tried to improve the signal to noise ratio by stack-ing technique.
Dashed line in Fig. 8 shows a transfer func-tion of 22F to B4F by stacking the microtremor measurement records for one day. The first to forth natural frequencies in the NS and EW directions identified from the transfer function are listed in Table 2. The natural frequencies obtained from microtremor records and those from earthquake records are in good agreement with less than 0.05 Hz error at the maximum.
The impulse response calculated using a 0.3–5 Hz BPF from the transfer function based on microtremor measurements is shown in Fig. 9. Figure 9 shows the result by removing the record during half a day which the strong wind was
blowing among for continuous ten days. In Fig. 9, solid line shows the transfer function of the seis-mometer at the center of the building, and broken line shows that of the seismometer at the corner of the building. We can see a torsional mode near the first and second modes.
Next, a damping factor for the first mode was evaluated from the RD method1 and curve fitting
Figure 6. Impulse responses of the building computed from the inverse fourier transform of Fig. 4.
Figure 7. Impulse response at the 22F.
0
50
100
150
200
250
0 1 2 3 4 5
21F21C
Am
plit
ud
e
Freqency (Hz)
Figuer 8. Transfer function computed from ambient noise. Torsional mode was observed at the 21F.
Figure 9. Impulse responses computed from the earth-quake (gray) and microtremor (black) (BPF. 0.3–5 Hz).

1069
method for the impulse response. In the RD method, an impulse response is estimated by shift-ing at a time one peak of time histories of 22F which are filtered out using a 0.3–1.2 Hz BPF. Figure 10 shows the envelope function estimated from the RD method and curve fitting method. Line types indicate the duration of the stacking. The thick line shows the result from high-sensitive seismometer (GPL) so this line can be considered as a target. There is a minor difference depending on the stacking duration, but in general, 1 day is enough to estimate damping of the building.
Figure 11 shows effect of the stacking duration to estimate the damping factor of the building. A square symbol shows the result of high-sensitive seismometer. The estimated damping factor is about 1%. We can see the result of the RD method
using seismic observation data is consistent with the result of the RD method using GPL data. However, we need to perform more detail analysis to understand the difference and accuracy of these methods.
4 DISCUSSIONS
In this section, the design analysis models for the observed super-high-rise steel building are dis-cussed based on the observation results. The design analysis models are a multistory shear model and flexure shear model fixed at the first floor whose shear stiffness or rotational stiffness are evaluated from a frame model.
Natural frequencies obtained from the two design analysis models and observed records are listed in Table 2. Regardless of observation results or analysis results, the natural frequen-cies in the NS direction are almost same as those in EW direction. The fundamental natural fre-quency identified from microtremor measure-ments is 0.57 Hz, which is 1.3 times as large as the frequency estimated from the analysis models (0.44 Hz). We think these differences in natural fre-quencies are due to the influence of non-structural members. Then, the ratio of natural frequencies in higher mode to the fundamental natural fre-quency is shown in Fig. 12. The ratios obtained from seismic records are successfully demonstrated by using the flexure shear model rather than the shear model.
On the other hand, solid line in Fig. 8 shows the transfer function of the seismometer at the center of the building (21F in Fig. 1), and dashed line shows that of the seismometer at the edge of the building (21C in Fig. 1). We can see torsional motions near the first and second modes, at 0.75 Hz and 2.1 Hz respectively. As a standard floor plan shown in
0
0.01
0.02
0.03
0.04
0.05
0 5 10 15 20 25 30 35 40
1 day
3 day
9.5 day
10 day
GPL
Acc.
(cm
/s2)
Time (s)
(a) RD method
0
2
4
6
8
10
12
14
0 5 10 15 20 25 30 35 40
1 day3 day9.5 day10 day30 day
Am
plit
ud
e
Time (s)
(b) Transfer function
Figure 10. Envelope function of the impulse response.
0
1
2
3
1 10
Transfer func.RD method
GPL
Da
mp
ing
fa
cto
r (%
)
Period (day)
Figure 11. Relationship between damping factor and record length used in the analysis.
0
2
4
6
8
10
0 1 2 3 4 5
Shear model (NS)Flexure shear model (NS)Earthquake (NS)Microtremor (NS)
f i / f
i
Order i
Figure 12. Comparison of natural frequencies obtained from the analysis models and seismic observations.

1070
Fig. 1 (a), floor plan and column arrangement are symmetrical. However, elevators and stairs, which are not taken into account as structure compo-nents in the structural design, are asymmetrically arranged. Therefore, the asymmetric-arrangement of elevators and stairs is assumed to be the reason of tortional motion shown in Fig. 8.
We also conducted modal analysis and mode shapes were identified from microtremor records. Figure 13 shows the 1st to 3rd mode shapes from the observed seismic data and the equivalent shear analysis model mentioned above. Although the 1st mode from the observed data is almost equal to the analytical result, the differences become larger as the mode becomes higher.
The damping factor is affected by the evaluation methods as well as strong wind as we have discussed in the previous section. Although the inexpensive sensors with the insufficient signal to noise ratio in the long period components are used for con-tinuous observation, accuracy of damping factors by the RD method was sufficient. Damping factor for the first mode identified from the microtremor
measurement is about 1%, which is smaller than 2% assumed in the design analysis model.
5 CONCLUSIONS
This paper reported a dense continuous seismic observation for a super-high-rise steel building in Osaka basin, Japan. We observed 16 earthquake records including the Tohoku earthquake on March 11, 2011. The signal to noise ratio is suf-ficiently good for all records.
1. We estimated natural periods and impulse response from those seismograms, and fre-quency shift due to nonlinear effect can be detected by 1/2000 or less of the maximum shear drift angle.
2. We used microtremor records to estimate the natural period and damping of the building. By stacking sufficiently long records, we can extract and monitor those building properties from microtremor records.
3. The natural frequency, damping factor, and vibration mode shape of analysis models used at the time of structural design are demonstrated by the observed results.
REFERENCES
Akazawa, T., Araki, M., Ito, T. and Takano, K. 2010. Study on effective utilization of the K-NET95 strong-motion seismograph—Establishment of real-time strong motion observation system using low-cost data logger—, Earthquake and planet union, SSS016-P03, 2010, (in Japanese).
Tamura, Y., Sasaki, A. and Tsukagoshi, H. 1993. Evaluation of damping ratios of randomly excited buildings using the random decrement technique. Journal of Struct. Constr. Engng, AIJ; 454 pp. 29–38 (in Japanese).
Figure 13. Comparison of mode shapes obtained from equivalent shear model and microtremor measurements.