Conowingo Reservoir Infill and Its Influence on Chesapeake ... · Conowingo Reservoir Infill and...
51
Conowingo Reservoir Infill and Its Influence on Chesapeake Bay Water Quality STAC Workshop Report January 13-14, 2016 Annapolis, MD STAC Publication 16-004
Transcript of Conowingo Reservoir Infill and Its Influence on Chesapeake ... · Conowingo Reservoir Infill and...

Conowingo Reservoir Infill and Its Influence on
Chesapeake Bay Water Quality
STAC Workshop Report
January 13-14, 2016
Annapolis, MD
STAC Publication 16-004

2
About the Scientific and Technical Advisory Committee
The Scientific and Technical Advisory Committee (STAC) provides scientific and technical
guidance to the Chesapeake Bay Program (CBP) on measures to restore and protect the
Chesapeake Bay. Since its creation in December 1984, STAC has worked to enhance scientific
communication and outreach throughout the Chesapeake Bay Watershed and beyond. STAC
provides scientific and technical advice in various ways, including (1) technical reports and
papers, (2) discussion groups, (3) assistance in organizing merit reviews of CBP programs and
projects, (4) technical workshops, and (5) interaction between STAC members and the CBP.
Through professional and academic contacts and organizational networks of its members, STAC
ensures close cooperation among and between the various research institutions and management
agencies represented in the Watershed. For additional information about STAC, please visit the
STAC website at www.chesapeake.org/stac.
Publication Date: August, 2016
Publication Number: 16-004
Suggested Citation:
Linker, L., R. Hirsch, W. Ball, J. Testa, K. Boomer, C. Cerco, L. Sanford, J. Cornwell, L.
Currey, C. Friedrichs, R. Dixon. 2016. Conowingo Reservoir Infill and Its Influence on
Chesapeake Bay Water Quality. STAC Publication Number 16-004, Edgewater, MD. 51 pp.
Cover graphic from: (Hirsch 2012)
Mention of trade names or commercial products does not constitute endorsement or
recommendation for use.
The enclosed material represents the professional recommendations and expert opinion of
individuals undertaking a workshop, review, forum, conference, or other activity on a topic or
theme that STAC considered an important issue to the goals of the CBP. The content therefore
reflects the views of the experts convened through the STAC-sponsored or co-sponsored activity.
STAC Administrative Support Provided by:
Chesapeake Research Consortium, Inc.
645 Contees Wharf Road
Edgewater, MD 21037
Telephone: 410-798-1283
Fax: 410-798-0816
http://www.chesapeake.org
Workshop Steering Committee:
Lewis Linker
CBP Modeling Coordinator
U.S. EPA Chesapeake Bay Program Office
410 Severn Avenue
Annapolis, MD 214
Lee Currey
Director, Science Services Administration
MD Department of the Environment
1800 Washington Blvd
Baltimore, MD
Robert M. Hirsch
Research Hydrologist
US Geological Survey
432 National Center, USGS
Reston, VA 20192
Lawrence P. Sanford
Professor, University of Maryland Center
for Environmental Sciences
Horn Point Laboratory
Carl Cerco
Research Hydrologist
US Army Engineer Research and
Development Center
3909 Halls Ferry Road
Vicksburg MS 39180
Carl Friedrichs
Professor, Virginia Institute of Marine
Science
Gloucester Point, VA 23062
William Ball
Executive Secretary, Chesapeake Research
Consortium
Professor of Environmental Engineering,
Johns Hopkins University
645 Contees Wharf Rd.
Edgewater, MD 21037
Rachel Dixon
Scientific and Technical Advisory
Committee Staff
Chesapeake Research Consortium
645 Contees Wharf Rd.
Edgewater, MD 21037
Kathleen Bailey Boomer
Watershed Scientist
The Nature Conservancy, MD/DC Chapter
Bethesda, MD 20814
Jeremy Testa
Assistant Professor
University of Maryland Center for
Environmental Science
Chesapeake Biological Laboratory
Solomons, MD 20688
Vicksburg MS 39180
Jeff Cornwell
Research Professor
Horn Point Laboratory
Mailing Address:
P.O. Box 775
Cambridge, MD 21613

4
Acknowledgements:
STAC and the Workshop Steering Committee would like to thank Rachel Dixon and Renee
Kelly for their expert guidance and support before, during, and after the workshop. Especial
thanks goes to the invited speakers who did so much to ensure the success of the workshop
including Ben Grumbles, Secretary of the Environment; Gregory Morris, GLM Engineering
COOP; Anna Compton, CoE Baltimore District; Qian Zhang, JHU; Mike Langland, USGS; Jeff
Halka, MGS ret.; Bruce Michael, DNR; Tim Sullivan, Gomez and Sullivan; Gary Lemay,
Gomez and Sullivan; Marjie Zeff, AECOM; Cindy Palinkas, UMCES; Gopal Bhatt, PSU; Gary
Shenk, USGS/CBPO; Steve Scott, USACE/ERDC; Jim Fitzpatrick, HydroQual Inc.; Mark
Velleux, HydroQual Inc.; Marty Teal, WEST Consultants; Cassie Gurbisz, UMCES; and
Xiaohui Xie, UMCES.

5
Table of Contents
Executive Summary ........................................................................................................................ 6
Introduction ..................................................................................................................................... 9
Lower Susquehanna Reservoir Research, Monitoring, and Modeling ......................................... 15
Patterns of Deposition and Scour in Conowingo Reservoir ...................................................... 18
Chesapeake Bay Research, Monitoring, and Modeling ................................................................ 21
Sediment Trapping in Upper Chesapeake Bay and Impacts of Large flows ............................ 22
Spatial Variation and Environmental Controls on Sediment-Water Nutrient Fluxes in
Chesapeake Bay ........................................................................................................................ 27
Impact of Reservoir Sediment Scour on Chesapeake Bay Water Quality ................................ 29
Impact of Reservoir Infill on Water Quality Standards ............................................................ 29
Workshop Findings ....................................................................................................................... 30
Recommendations ......................................................................................................................... 31
References ..................................................................................................................................... 35
Appendix A: Workshop Agenda .................................................................................................. 39
Appendix B: Workshop Participants ........................................................................................... 45
Appendix C: Presentation Summaries and Links to Presentations .............................................. 47
Appendix D: Additional Resources ............................................................................................. 51

6
Executive Summary
Workshop participants expressed a general consensus with previous findings of the Lower
Susquehanna River Watershed Assessment (LSRWA) that the Conowingo Reservoir is very near
to (and essentially at) a condition of “dynamic equilibrium” with regard to discharge of fine
sediments and particle-associated nutrient loads (USACE 2016). As defined in this report, this
condition refers to a situation where fine sediments that accumulate within the reservoir under
“normal” (lower flow) conditions are eventually scoured and removed during periods of higher
flows and especially during major flood events. After such events, normal flow net deposition of
sediment and particulate nutrients continues for a period of time until another high flow scouring
episode occurs once again to remove the sediment and particulate nutrients, repeating the cycle.
As a result of Conowingo Reservoir reaching dynamic equilibrium, the average annual sediment
and particulate nutrient load reaching the Bay from the Susquehanna will be elevated relative to
the period prior to reaching equilibrium.
In addition to increased storm scour, slower on-going processes of changing bed bathymetry and
composition also affect Conowingo Reservoir retention performance at most discharge levels.
Evidence presented at the workshop demonstrated that the rates of net sediment and particulate
nutrient deposition behind the dam are decreasing over a wide range of flows – including flows
well below levels typically viewed as scour events, with commensurate increased loading of
sediment and particulate nutrients to the Bay relative to earlier periods prior to reservoir infill.
Infill is the process of geomorphic evolution that all reservoirs undergo as they fill with
suspended sediment and particulate nutrients, with changes to their bathymetry due to increased
settling within their impounded waters (Morris, current workshop).
Overall, and in the absence of dredging or other major implementations within the reservoir
system, the amount and nature of sediments and particulate nutrient species reaching the
Chesapeake Bay will, over time, obtain long-term average values that closely resemble those at
the influent of the Lower Susquehanna River Reservoir System (LSRRS). The enhanced
sediment load due to infill is a considerably different situation from the first eighty or ninety
years of reservoir operation, with important implications regarding the impacts of the
Susquehanna watershed loads on Bay water quality. Additionally, the slow ongoing changes in
the LSRRS bathymetry and bed composition will continue to alter the timing and quantity of
sediment and nutrient loads for some time to come, offering additional challenges to accurate
modeling and management of the system.
To quantify the influence that Conowingo infill has on Chesapeake water quality, the following
processes must be considered in the Conowingo Reservoir: 1) increased sediment and nutrient
loads from scour during relatively rare extreme events; 2) decreases in the scour threshold during
moderately high flow events; 3) loss of trapping capacity during low and moderate flow; and 4) a

7
variety of biogeochemical processes that influence the mobility, fate and bioavailability of the
nutrients present in the reservoir bed. The relative importance of these four processes, quantified
in terms of loads to the Bay, will continue to vary over time along with loss of reservoir
performance at “normal” conditions.
Major loads from extreme events have occurred throughout the history of the dam and are only
one component of the influence Conowingo infill has on Chesapeake water quality. Under
conditions of dynamic equilibrium, it is likely that scour events deliver greater loads than they
did in the recent past and therefore have the potential for greater acute impacts. However, our
understanding in regard to the additional loads that the Bay has been receiving due to changing
dam performance includes increased transport of sediment and particulate nutrients through the
reservoir over the full range of flow conditions. Low flows have little impact due to their
inherently low particulate loads, but they are by far more common. Additionally, moderate
flows are an important focus for continuing scientific research, as well as for future management
decisions. Moderate flows, with increased particle loading, decreased reservoir trapping, and
increased potential for scour under dynamic equilibrium, are more common than extreme flows
and therefore have the potential to introduce more total additional material to the Bay. Indeed,
statistical models indicate that loading of particulate nutrients from Conowingo Reservoir to
Chesapeake Bay has been increasing in recent years despite reductions in loads to the reservoir
system from the watershed, and that these increases are occurring despite the absence of extreme
events.
The workshop presentations and discussions focused on how the reservoir system is likely to
modulate the inputs of suspended sediment (SS), total phosphorus (TP), total nitrogen (TN), and
particulate organic carbon (POC) from the watershed to produce a set of outputs. Specific
engineering solutions, including but not limited to modifications of the dams, dredging of the
reservoirs, or creating sediment bypassing systems were not addressed at the workshop, as these
topics were extensively considered by the LSRWA report (USACE 2016). The effects of
Conowingo infill on receiving water quality was the primary focus of this STAC workshop
because of the potential for changes throughout the estuary, which is dependent on a variety of
factors. Bay water quality is influenced not only by total loads of nutrients and sediments but
also by the physical transport of sediments and associated particulate nutrients through the tidal
waters of the upper Bay, the locations of near term deposition and long-term burial of these
particles, biogeochemical processes that control the fate of nutrients bound to the particles, and
the bioreactivity of the nutrients. The biogeochemical environment of near-bottom waters and
sedimentary pore waters into which Conowingo particles are deposited strongly influence the
timing and extent of nutrient transformation and release, and hence the impact on Bay water
quality. Particulate nutrients that are delivered into the head of the deep trough of the mid-Bay
have greater impacts on water quality during summertime hypoxic (low oxygen) conditions than
particles that are deposited and buried in relatively fresh, normoxic upper Bay waters. The

8
extent to which the Susquehanna Flats and the Estuarine Turbidity Maximum (ETM) trap or
seasonally modulate the delivery of Conowingo particles is critical to a full evaluation of the
transport effect. Redistribution of newly deposited particles through resuspension and transport
by waves and tides must also be accounted for and considered within the context of other particle
sources, such as channel dredging and subsequent placement of newly dredged sediment.
Due to the evidence that substantial sediment and particulate nutrient loads are delivered under a
wide variety of flow conditions, workshop participants recommended that any future assessment
of the impacts of Conowingo infill on Chesapeake water quality standards, and ultimately on
TMDL (Total Maximum Daily Load) achievement, consider the full range of hydrologic
conditions (from low flow to extreme events). To provide a thorough understanding of water
quality effects, an estimation of sediment and nutrient delivery to the Bay would need to consider
amounts delivered from the watershed to the reservoir, storage in and release from the reservoir,
and the timing of and form in which they are delivered to the Bay. Furthermore, the ultimate
transport and fate of particulate nutrients from the lower Susquehanna after delivery to the Bay
would need to be accounted for to understand water quality effects. The analysis would need to
include seasonally variable changes in 1) the transport behavior of delivered particles, 2) particle
trapping by upper Bay physical and biological features, and 3) biogeochemical transformations
of newly deposited particles in different receiving waters, in addition to consideration of all of
these factors following rare large events.
Workshop participants acknowledged that the most conservative management assumption from
the standpoint of water quality protection is that all of the delivered organic material scoured
from Conowingo is fully degradable to inorganic nitrogen and phosphorus. Current Chesapeake
Bay Program (CBP) model assumptions for the 2010 Water Quality and Sediment Transport
Model (WQSTM) are that all the particulate organic material scoured from the Conowingo is
slowly degradable. The state of the science is currently limited on the details of these issues, but
workshop participants nonetheless supported the current approach and urged continuing
refinement of the splits of particulate organic material into labile, refractory, and inert reactive
categories as new knowledge becomes available.
The science required to predict these processes in the future is challenging. However, there is
enough known on the basis of monitoring records over the past several decades and from first
principles of sediment transport and biogeochemistry that appropriate models of the future
behavior can be constructed in the near term. Past monitoring and research data can help to
constrain such models. Fortunately, various funding parties and scientists have mounted
significant efforts in the last five years aimed at improved data collection and interpretation, and
new process research. This work is already enhancing the understanding of this changing
system. Workshop participants attest that over a period of a few years, this work will lead to
more accurate models of future system behavior. These models will continue to help managers

9
make adjustments to actions in all parts of the Chesapeake Bay watershed that will help the
Chesapeake Bay partners efficiently achieve the TMDL.
Introduction
The Susquehanna River is the largest tributary to both the Chesapeake Bay and to the Atlantic
Slope. It drains more than 71,000 square kilometers (27,500 square miles) across New York,
central and eastern Pennsylvania, and northeastern Maryland (Figure 1). Annually, the
Susquehanna River contributes about 41 percent of the total nitrogen (TN), 25 percent of the
total phosphorus (TP), and 27 percent of the suspended sediment (SS) to the tidal Bay (Linker et
al. 2016). Thus, changes in these inputs from the Susquehanna are significant to the overall
status of the Bay.
Between 1910 and 1931, a series of three hydropower plants were constructed along the lower 62
km (39 miles) to harness the river power generated by a steepened gradient and the high volume
of water which moves through a deeply incised bedrock channel before crossing the Piedmont
Fall Line (Reusser et al. 2006). Since construction, the three tiered reservoir system has neared
full sediment storage capacity (Table 1); only Conowingo Pond has limited potential to trap
additional sediments and associated nutrients, estimated at less than about 5 percent of original
storage volume. In aggregate, this system of reservoirs has come very close to its full capacity in
terms of sediment storage over the past 90 years. At present Conowingo Reservoir is estimated
to be about 94 percent full; the others approximately 100 percent full (Reed and Hoffman 1997,
USACE 2016 Langland 2015).
Table 1. Reservoir features along the Lower Susquehanna River System (source: Reed and Hoffman
1997, USACE 2016)
Reservoir
(Dam)
Area in ha/mi2
Susquehanna
River Mile
Upstream of
Havre D’Grace
Year
Completed
Watershed
Area at Dam
miles2
Initial Water
Storage
Capacity
(thousands of
acre-ft)
Estimated
Existing
Sediment
Storage
Capacity
Lake Clarke
(Safe Harbor Dam)
2,970 / 11.5
32 1931 150 0%
Lake Aldred
(Holtwood Dam)
971 / 3.75
25 1910 26,740 60 0%
Conowingo Pond
(Conowingo Dam)
3,600 / 14
10 1928 27,100 310 ~5 %

10
Figure 1. The three reservoirs of the lower Susquehanna (source: Langland, current workshop. Sediment
Transport and Bathymetric History in Three Reservoirs, Lower Susquehanna River Basin, Pennsylvania
and Maryland 1900-2015)
The Chesapeake Bay Program (CBP) is a state-federal partnership engaged in restoring the
United States’ largest estuary. Chesapeake Bay restoration work has been underway for three
decades and since 2010 has been supported by the nation’s most extensive total maximum daily
load (TMDL) program (USEPA 2010, Linker et al. 2013). The Chesapeake TMDL requires the
states of the Chesapeake watershed to establish appropriate uses for their waters, to adopt water
quality standards that are protective of those uses, and to identify and list waterways that are
impaired by pollutants, causing them to fail to meet the adopted water quality standards. The
2010 Chesapeake TMDL was developed with the assumption that the Conowingo Reservoir was
still effectively trapping nutrients and sediment. However, increasing evidence suggests that the
system may have reached its trapping capacity, and thus may no longer provide the water quality
benefits provided since dam construction. As the 2017 Midpoint Assessment and TMDL model
update approaches, assumptions regarding the reservoir’s trapping efficiency require careful
reconsideration. Loss of trapping capacity could require offsets and additional watershed
management to meet the TMDL objectives.

11
To address scientific and technical aspects of the influence Conowingo infill has on tidal
Chesapeake water quality, the CBP Scientific and Technical Advisory Committee (STAC) held a
workshop titled “Conowingo Infill Influence on Chesapeake Water Quality” on January 13-14,
2016 in Annapolis, Maryland. The workshop was a scientific discussion among a group of over
70 participants invited by the workshop steering committee. This report summarizes the ideas
(from completed scientific research or reports of work in progress) presented at the workshop
and the major consensus conclusions.
The workshop was supported by the STAC based on a recognition that on-going changes in the
net trapping efficiency of the reservoirs in the lower Susquehanna River Basin (primarily
changes in Conowingo Pond) could have substantial impact on nutrient delivery to the
Chesapeake Bay, and those impacts could limit progress in achieving the water quality and
ecosystem goals of the Bay Agreement and TMDL.
In recent decades, sediment input to the three reservoirs of the Lower Susquehanna has
diminished by about 60 percent from levels that prevailed in the early part of the 20th century,
however, in the last two decades the rate of net deposition (note that “net deposition” is the
algebraic sum of deposition minus losses from the reservoir) of this sediment has been declining
(Langland 2015). This is important to Bay water quality, particularly because the sediments
entering the Bay from the Lower Susquehanna carry a substantial fraction of the TP input of the
Susquehanna. Suspended solid loads also contain particulate organic carbon, nitrogen, and
phosphorus.
It has long been recognized that at some point the reservoir system would reach its capacity for
sediment storage and would no longer serve the role of trapping of TP, TN, and SS before
reaching the Bay (Langland and Hainly 1997). More recent evaluations by others (Hirsch 2012,
Zhang et al. 2013, Zhang et al. 2016a) have served to better quantify the nature of changes in
sediment trapping. These more recent estimates (e.g., Hirsch, current workshop, Zhang et al.
2016a), indicate that TP trapping behind the reservoir has changed from about 50 percent two
decades ago to a situation where little or no phosphorus is being trapped and, in some periods of
time, the reservoirs may even be releasing more than they receive. For TN, which occurs
predominantly in the dissolved phase, the prior removal was much less – in the range of 5 to 15
percent – two decades ago, but today the Lower Susquehanna River Reservoir System (LSRRS)
traps little to no TN and on many days is releasing more than it receives (e.g., Hirsch, current
workshop, Zhang et al. 2016a). Moreover, Zhang et al. (2016a) have recently published
estimates of output-to-input (O/I) ratios of flux for all three constituents for each of five different
ranges of discharge, covering the breadth of Susquehanna River flow. The results show
increases in O/I in recent times for all ranges of discharge, including particularly strong increases
in TP load at flows well below the median river discharge (See Figures S20, S21, and S22 in
Supporting Information to Zhang et al. 2016a). Overall, the data confirm that increased loadings

12
in recent time reflect not only the effects of scour but also a major influence of reduced
deposition at all ranges of flow, particularly so for P-laden particulates.
Specifically, recent estimates by Hirsch (2012) examined trends in flow-normalized fluxes of
sediment and nutrients at Conowingo using a statistical model known as Weighted Regressions
on Time, Discharge, and Season (WRTDS). The findings indicated a 55 percent increase in TP
and a 97 percent increase in SS in the flow-normalized flux from 1996 to 2011 at Conowingo.
The phosphorus and sediment changes estimated by Hirsch (2012) represented the changes in the
loads from the entire Susquehanna watershed as well as changes in reservoir scour and
deposition. Nevertheless, the increases in phosphorus and sediment flux from the Conowingo
Reservoir occurred despite observed reductions in the fluxes of sediment and phosphorus from
the upriver Marietta, PA gauge as well as other upstream gauges and were therefore attributed to
Conowingo infill (Zhang et al. 2013, Zhang et al. 2016b). Recent trend work by the U.S.
Geological Survey (USGS) points to similar findings (http://cbrim.er.usgs.gov/maps.html).
Based on multiple lines of evidence, the reservoir system is approaching its sediment storage
capacity. The term that is now used for this condition is “dynamic equilibrium” which simply
means that although there continue to be periods of deposition (when storage grows) and briefer
periods of loss of stored sediments (mostly due to bed scour) the net effect is that there is now
minimal change in storage for most finer fractions of sediments (all but the coarsest gravels and
rocks) when averaged over many years. In effect, the reservoir system is reverting to the
condition of a river reach that over time delivers loads equivalent to what is received (Fan and
Morris 1998). That which had been viewed, prior to 2011, as an important “future problem” has
now become recognized as a present day problem. In terms of watershed inputs of TN, TP, and
SS, the reduced trapping efficiency indicates that, relative to the first nine decades since dam
creation, increasingly greater fractions of the total upstream load (e.g., as observed at Marietta)
are now reaching the Chesapeake Bay.
Dynamic equilibrium thus does not imply equality of sediment inflow and outflow on a daily,
monthly, or even annual basis. The “dynamic” balance occurs over a longer period of time
(currently many years) determined by the frequency and magnitude of scour events, the overall
rate at which sediment enters the reservoir, and the state of the underlying (scour-resistant)
reservoir bathymetry. In the latter regard, and despite the so-called “dynamic equilibrium,” more
gradual changes are continuing to occur in the bathymetry of the bed (both before and after
major scour events) and in the size distributions of stored bed sediments at different locations in
the reservoir system. In the absence of dredging and other intervention, the durations of net
deposition for many of the smaller size fractions are likely to decrease, such that loads released
during major scour events may eventually be less than at present, reflecting lower mass
accumulations of readily mobilized sediment between events and the eventual evolution of the
bed toward coarser particle sizes.

13
Against this background, there is a considerable amount of attention being paid to the
Conowingo Dam relicensing by a variety of public and private entities. For example, the U.S.
Army Corps of Engineers (USACE) and a group of 7 partner organizations conducted a
congressionally-mandated study titled the Lower Susquehanna River Watershed Assessment
(LSRWA). The draft report was released for public comment November 13, 2014 and finalized
on March 10, 2016 (http://dnr.maryland.gov/bay/lsrwa/report.htm). STAC provided formal
comments to an earlier draft of the LSRWA report in August 2014, accessible here. In addition,
considerable research, data collection and interpretation has been conducted by the U.S.
Geological Survey (USGS) and by investigators at Johns Hopkins University dealing directly
with the historical trends of nutrient and sediment loads in the Susquehanna watershed and the
accumulation of sediments in the basin. Additionally, within the past year major new research
and data collection activities have been undertaken as part of a collaborative project involving
several organizations: Exelon Generation Company, LLC (Exelon, owners of the dam who have
provided a large share of the total funding), several of Exelon’s private contractors including
Gomez and Sullivan Engineers, AECOM, HDR, and WEST Consultants, USGS, and the
University of Maryland Center for Environmental Science (UMCES). As a result, the topic has
become one of intense political interest and active research and the subject of a rapidly growing
body of both scientific publication and news reporting in recent years. Furthermore, the CBP is
working to incorporate new information on Conowingo infill into its 2017 Midpoint Assessment
of TMDL progress. The attention to the issue can be seen in the agendas of the Bay Program’s
Modeling Workgroup and Water Quality Goal Implementation Team.
The workshop goals laid out by the steering committee were:
Given the current state of knowledge based on recorded observations and our current
understanding of first principles which can be used to build simulation models, together
with the 2017 Midpoint Assessment timeframe, what is the best approach to evaluate
impacts from the reservoir system to the Chesapeake Bay ecosystem? It is expected that
current research will advance future modeling efforts, but there is an immediate and
critical need to evaluate current and future impacts from reservoir infill and outputs based
on the best information currently available.
Formulate a plan of study and experimentation, including field data collection related to
mass balance and biogeochemical transformations, which will improve understanding of
the processes at play in these reservoirs and our ability to model the system’s response to
candidate management strategies.
Explore approaches to improving understanding and simulation of the transport and
ultimate fate of particulate nutrients from Conowingo Reservoir: including the transport,

14
settling, resuspension, chemical and biological processes taking place under all states of
flow and wind conditions, in order to better understand the impact of particulate nutrients
on Bay water quality, especially with regard to the location and timing of nutrient
remineralization, bioavailability, and burial.
Overall, the steering committee sought to find consensus among participants regarding
fundamental ideas, the relative degree of certainty concerning these ideas, and the relative
importance of various questions.
In addition to these explicit goals, there were implicit goals of achieving a higher level of
communication addressing this rapidly developing topic across a diverse range of scientists and
technical program managers in the public and private sectors. The steering committee believes
that the workshop served this purpose well, and the findings of the workshop will benefit future
research and decision-making on this topic.
The workshop presentations and discussions focused on how the reservoir system is likely to
perform in the future in terms of how it modulates the inputs of SS, TP, and TN from the
watershed to produce a set of outputs. Unaddressed were specific types of engineering solutions
having to do with modifications of the dams, dredging of the reservoirs, or creating sediment
bypassing systems, as these were extensively considered by the LSRWA report (USACE 2016)
and found to provide minimum, short-lived benefits at prohibitively high costs. In this regard
however, keynote speaker Dr. Gregory Morris highlighted three types of questions that could be
raised: (1) whether the system can be manipulated to restore its prior “removal” functions, e.g.,
renewing its sediment and nutrient storage capacity through dredging; (2) whether the dynamic
equilibrium processes can be manipulated to manage the timing of net depositional and net
scouring processes, e.g., to somehow release more sediments during “favorable” times; and (3)
whether better understanding of mechanistic processes and performance of the LSRRS can be
used to inform a more appropriate TMDL allocation process that remains protective of the Bay
and local ecosystems. In this context, the cost-effectiveness of dredging was viewed as beyond
the workshop scope and in regard to operational change, some workshop participants noted
several important current constraints (relating to power generation, nuclear power plant cooling,
and Baltimore water supply intake levels) that effectively prevent extensive manipulation of
reservoir water levels or deliberate by-passing of sediments. Only the third question fell within
the scope of the workshop’s original objectives, with the majority of subsequent presentations
and discussions focused on seeking better understanding of the water quality impacts and
informing the TMDL allocation process.
It is the expectation of the steering committee, and the STAC, that this report will help to
document the new knowledge and understanding of this issue that has developed in the last few
years, as well as provide an overview of new research currently underway. It is the intention that
15
the report will point to the most important published research as well as lay out the key
consensus views of the scientific community.
The body of the report is divided into two sections. The first section, titled Lower Susquehanna
Reservoir Research, Monitoring, and Modeling, describes the state of the science in
understanding the Conowingo infill processes and the condition of the other two reservoirs in the
Lower Susquehanna. The second section titled Chesapeake Bay Research, Monitoring, and
Modeling documents the current understanding of the impacts of particulate nutrients and
suspended sediments on Chesapeake Bay water quality from the Susquehanna and associated
Conowingo infill processes. These processes include physical transport of sediments and
associated particulate nutrients through the tidal waters of the upper Bay, the locations of initial
deposition, and the long-term transport, fate, and burial of the particles including the
biogeochemical processes that control the fate of bound nutrients, as well as the bioreactivity of
the nutrients.
Links to all of the workshop’s presentations can be found in Appendix C.
Lower Susquehanna Reservoir Research, Monitoring, and Modeling
As context for subsequent discussions on this topic, several presentations reminded workshop
participants of some well-accepted basic concepts regarding the nature and role of nutrient and
sediment loading to the Chesapeake Bay. These included the following:
1) The major source of the sediments phosphorus (P) and nitrogen (N) exiting the Conowingo
Dam is the upstream watershed of the Susquehanna River basin. In regard to sediment and
sediment-bound fractions of nutrients, a substantial fraction of the load has been
historically retained (“stored”) behind the dam. This is not the case for N, however.
2) Although phosphorus tends to be predominantly associated with sediments, LSRRS
nitrogen occurs primarily in dissolved form (predominantly nitrate), such that the N has
historically been only marginally reprocessed or removed, with the majority passing
through the LSRRS primarily in the form of nitrate and at concentrations in the effluent not
dissimilar from those in the influent.
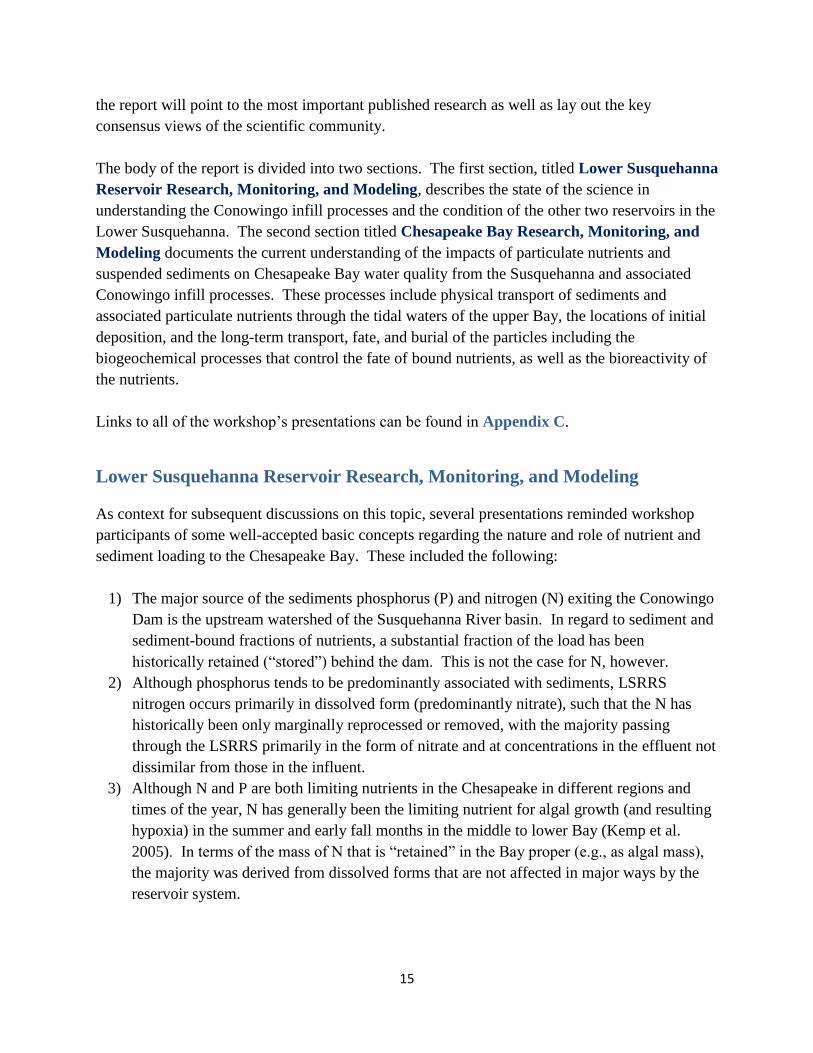
3) Although N and P are both limiting nutrients in the Chesapeake in different regions and
times of the year, N has generally been the limiting nutrient for algal growth (and resulting
hypoxia) in the summer and early fall months in the middle to lower Bay (Kemp et al.
2005). In terms of the mass of N that is “retained” in the Bay proper (e.g., as algal mass),
the majority was derived from dissolved forms that are not affected in major ways by the
reservoir system.
16
Figure 2. Seasonal and regional variations in nitrogen, phosphorus, or light limitation for phytoplankton
growth synthesized from bioassay experiments in mainstem Chesapeake Bay between 1992 and 2002
(source: Kemp et al. 2005)
Within the above context, the LSRRS has been serving for nearly 90 years to modulate the
delivery of sediment and nutrients from the Susquehanna basin to the Chesapeake Bay. Long-
term monitoring data, however, suggest changes in reservoir storage capacity have reduced
trapping efficiencies over the past thirty years, and a key question for the management of water
quality in the Bay is: How will the reservoir act in the future in terms of how it stores and
releases materials that enter it? Undoubtedly, large scour events with flow greater than 11,300
m3/s (400,000 cfs) will continue to occur in the future, and the timing and the magnitude of these
events will remain unpredictable. Less certain, however, is the magnitude of deposition and
scour associated with more frequent and typical high flow events, i.e., flows between 2,830 m3/s
(100,000 cfs) and 9,900 m3/s (350,000 cfs). These events produce loadings of nutrients and
organic matter, derived both from the watershed upstream as well as scoured from the reservoir
bottom, which will be delivered to the Bay. Following each scour event, the resulting additional
storage capacity will accommodate deposition, which will amount to diminished effluent loads

17
from the reservoir for an indeterminate period. Concurrently, the longer-term processes of
changes in the patterns of infill are reducing particle capture between the major scour events at
even low and moderate flow conditions.
Workshop participants expressed a general consensus with previous findings of the LSRWA
report (USACE 2016) that the Conowingo Reservoir is very near to (and essentially at) a
condition of “dynamic equilibrium” with regard to discharge of fine sediments and particle-
associated nutrient loads. In this state, sediments and particulate nutrients accumulate in the
reservoir until an episodic high flow scouring event occurs. The scour event then increases
storage capacity, allowing for more deposition until the reservoir gradually fills and another
scour event occurs. Dynamic equilibrium does not imply equality of sediment inflow and
outflow on a daily, monthly, or even annual basis. The balance occurs over a period of time,
currently many years, that is determined by (1) the frequency and magnitude of scour events, (2)
the overall rate at which sediment enters the reservoir, (3) the state of the underlying reservoir
bathymetry, and (4) longer-term processes of change with regard to the spatial distribution of
coarse and fine sediments in the reservoir bed. The bed-coarsening and bathymetric effects
continue to occur at a much slower rate and in this regard the system is still far from true
equilibrium.
In regard to impacts of long-term changes in the composition of the bed and its bathymetry,
evidence was presented at the workshop (from Zhang et al. 2016a) illustrating that rates of net
sediment and particulate nutrient deposition have been decreasing over a wide range of flows,
including values well below that typically associated with scour. Overall, and in the absence of
intervention, the quantity and nature of sediments and nutrients reaching the Chesapeake Bay are
likely to obtain long-term average values that more closely resemble those at the LSRRS influent
than in the first sixty years of reservoir operation, with important implications regarding the
impacts of the Susquehanna watershed loads on Bay water quality. Despite the “dynamic
equilibrium” condition, the slow on-going changes in the bed are likely to continue to alter the
timing and amounts of sediment and nutrient loads for some time to come, offering additional
challenges to modeling and management.
To quantify the influence Conowingo infill has on Chesapeake water quality, the following
processes must be considered in the Conowingo Reservoir: 1) scour during relatively rare
extreme events, e.g., 10 year storm events with flow greater than 11,300 m3/s (400,000 cfs); 2)
scour during moderately high flow events; 3) trapping during low and moderate flows; and 4)
biogeochemical nutrient cycling that influence bioavailability in the reservoir sediments,
especially under low flow conditions.
Given that particulate erosion rates increase with flow velocity, and that dissolved constituent
loadings derive substantially from groundwater sources in the watershed, it is not surprising that

18
high flow events will increase particulate loads more than dissolved nutrient loads and that we
can expect the differences to be especially pronounced under reservoir scour conditions. In this
regard, for example, the authors of the LSWRA report (USACE 2016) noted that, “[a]t the
highest observed flows, the dissolved nitrogen fraction declines [from 86 percent under normal-
flow conditions] to 60 percent or less. For example, during Tropical Storm Lee, 40 percent or
more of the nitrogen was in particulate form [and] 90 percent of the phosphorus was in
particulate form.” Previous studies primarily evaluated the risks and magnitude of scour during
major storm events with greater than 11,300 m3/s (400,000 cfs) flow; however, loss of trapping
efficiency may impose more continuous sediment and nutrient transfer from Conowingo
Reservoir to the upper Bay ecosystem (USACE 2016). Reduced reservoir deposition during
more frequent moderate to high flows, i.e., 2,830 m3/s to 11,300 m3/s (100,000 to 400,000 cfs),
could impose a more continuous supply of excess sediment and particulate nutrient loads to the
Bay ecosystem. If accumulated sediments remain susceptible to mobilization, a major event
such as Tropical Storm Agnes in 1972 could restore considerable trapping capacity (Langland
2009). However, under low to moderate flows and depositional infill, reservoir depths will
decrease resulting in a diminished cross sectional area of the reservoir which is expected to
increase flow velocities and reduce deposition (Scott, current workshop), thus leading to elevated
sediment and nutrient discharge during more frequent high flow event (< 8,500 m3/s or <300,000
cfs) conditions. Indeed, a comparison of inflow measured at the Marietta monitoring station and
outflow measured below Conowingo Dam indicated that storm flows between the 75th and 99.5th
percentile, i.e., between 1,467 m3/sec (51,800 cfs) and 7,646 m3/sec (270,000 cfs), contributed
the most TN, TP, and SS through the system, despite the sub-scour status (Zhang, current
workshop, Zhang et al. 2016a). Further, stationary-model analysis to evaluate discharge
conditions under varying reservoir infill conditions also indicated diminished trapping capacity
since 1990 (Zhang, current workshop, Zhang et al. 2016a). As previously noted, recent
publications (Hirsch 2012, Zhang et al. 2013, 2016a) have provided more specific and detailed
statistical analyses that serve to better quantify the nature of changes in sediment trapping.
Patterns of Deposition and Scour in Conowingo Reservoir - Observations and Modeling
Changes in reservoir bathymetry over time indicate changes in a reservoir’s storage capacity and
can both influence and be affected by processes of scouring and deposition (Morris and Fan
1998). In the LSRRS, a combination of increased scour potential during more frequent high
flow events and reduced deposition under low flow conditions will lead to average O/I ratios that
approach 1.0, and could increase annual nutrient and sediment loads to the Bay relative to those
observed in the past (Langland 2015). Recently published USGS summaries of decadal (2005-
2014) trends indicate decreases in loads at the Marietta gage (-12 percent for TP, -13 percent for
TN, and -23 percent for SS) and yet over this same period of time loads at the Conowingo gage
have increased (+44 percent for TP, +1 percent for TN, and +7 percent for SS)
(http://cbrim.er.usgs.gov/maps.html retrieved May 27, 2016). These results, decreasing inputs

19
and increasing outputs from the reservoir reach, fail to inform how much of the increase is due to
the remobilization of reservoir sediments and how much is due to a decrease in deposition. What
is clear is that the dynamics of the system have changed over the past several decades, coinciding
with the timeframe used to develop the TMDL. Understanding the mechanics and relative
importance of the full range of depositional and remobilization processes is critical to estimating
future impacts on loadings to the Bay under all flow conditions, including major storms, and to
evaluating the benefits of alternative management actions aimed at mitigating impacts.
Improved and more frequent mapping and spatially explicit models of active scour and
deposition zones within each of the three Lower Susquehanna reservoirs could indicate how
reservoir sediment processes influence nutrient and sediment discharges to the upper Chesapeake
Bay. To date, bathymetric surveys together with measured inflows and outflows observed
during the past 30 years indicate that the reservoir system had a long term sediment trapping
capacity of about 60 percent (Langland, current workshop). Preliminary model applications to
evaluate reservoir sediment dynamics indicate discrete areas of sediment deposition and scour
within each reservoir. The spatial extent of these processes are related to the structure of the
reservoir’s dam, the reservoir’s morphometry, as well as the influence of tributaries discharging
to a reservoir (Sullivan, current workshop). In Conowingo Reservoir, turbine operations reduce
deposition within 2 km (1.25 miles) upstream of the dam (Langland and Hainly 1997).
Furthermore, 85 percent of scour reported by Langland and Hainly (1997) for the January 1996
storm occurred in Conowingo Reservoir, with more than 40 percent of scour occurring within the
zone of turbulence generated by the dam. The flood gates, which are approximately 7 meters (23
feet) below mean lake level also reduce deposition albeit at a lesser extent than the turbines,
which are 30 meters (98 feet) below mean lake level (Langland 2009). Model results also
indicated that the scour areas expand during high flow events, mainly along the shoreline length
of Conowingo Reservoir, and that shallow, off-channel areas could continue to trap sediment and
may eventually become vegetated (Morris, current workshop).
Multiple lines of evidence suggest that scour is limited within the Lake Clarke and Lake Aldred
reservoirs and that scour potential has not changed significantly over the past 60 to 70 years. A
series of six bathymetric surveys across Lake Clarke and Lake Aldred between 1950 and 1964
indicated little change in water or sediment storage capacity (Langland 2009).
To investigate patterns of scour and deposition within Conowingo Pond, ten (10) sediment cores
were collected by AECOM in August 2015 at locations representing a range of geomorphic and
geologic conditions, including in-channel verses out-of-channel, deep versus shallow waters, and
near inflows and outflows. Results revealed classic reservoir infill patterns (Sullivan et al.,
current workshop; Morris and Fan 1998). In the upper and middle sections of Conowingo
Reservoir, distinct laminations of sand, silt, and coal suggested limited disturbance and mixing of
the layers. In the lower section of the reservoir, the cores consisted primarily of homogenous
20
clayey silt, with little distinct layering (Sullivan et al., current workshop, Palinkas, current
workshop). Results indicated a mixture of storm deposits and suspended load deposition
remobilized from upstream sources. Overall, the reservoir core samples also had relatively high
organic matter content, ranging from 2 to 45 percent of the total content with the lower reservoir
samples having an organic matter content from 7 to 45 percent (Sullivan et al, current
workshop). Pockets of soft-sediment deposition indicated downslope slumping or sliding under
influence of gravity or overloading by rapid sediment deposition, perhaps suggesting the
influence of density currents (Sullivan et al., current workshop).
Temporal and spatial patterns of sediment deposition and scour in the reservoir influence the
same biogeochemical processes that control nutrient availability in all fresh water saturated and
flooded environments. In particular, the supply of organic matter (Cornwell, current workshop)
to the reservoir sediment and the development of a reduced environment – which can develop
under low flow conditions – could significantly increase concentrations of orthophosphate (and
other redox-sensitive pollutants of concern). Recent USGS trend results estimate an increase in
dissolved orthophosphate at Conowingo of 44 percent from 2005 to 2014 and yet, over the same
period trends at Marietta noted a decrease of 34 percent (http://cbrim.er.usgs.gov/maps/,
retrieved May 27, 2016). Methane voids prominent in the clayey-silt sediments of the Lower
Conowingo Pond confirmed sediment anoxic reducing conditions (Sullivan et al., current
workshop). Storm events with flow exceeding 11,040 m3/s (390,000 cfs) could scour the anoxic
sediments just below the sediment-water interface (Langland 2009).
Overall, minor changes in the bathymetry data suggest the reservoir system has nearly reached
its full trapping capacity (Figure 3). Insufficient understanding of how reservoir bathymetry
changes in response to storm flow below 11,300 m3/s (400,000 cfs) limits the ability to
characterize how dynamic scour and deposition patterns currently influence sediment and
nutrient discharge on an average annual basis. Additional modeling and monitoring studies to
characterize the vertical and horizontal extent of scour in relation to flow discharge are needed.

21
Figure 3. Bathymetry surveys of the Conowingo Reservoir showing also the original Susquehanna River
bed and the full reservoir Sediment storage Capacity (SSC). The red box depicts the lower reservoir
section within 5 miles of the Conowingo Dam (source: Langland, current workshop. Sediment Transport
and Bathymetric History in Three Reservoirs, Lower Susquehanna River Basin, Pennsylvania and
Maryland 1900-2015)
Chesapeake Bay Research, Monitoring, and Modeling
The impacts of particulate nutrients and suspended sediments on Chesapeake Bay water quality
are determined by more than the sheer amounts that are delivered over Conowingo Dam. Other
factors influencing Bay water quality include the physical transport of sediments and associated
particulate nutrients through the tidal waters of the upper Bay, the locations of initial deposition,
and the long-term transport, fate, and burial of the particles – including the biogeochemical
processes that control the fate of nutrients bound to the particles and their bioreactivity. The
biogeochemical environment of the tidal near-bottom waters and sedimentary pore waters into
which Conowingo particles are deposited strongly influences the timing and extent of nutrient
transformation and release, and hence the impact on Bay water quality. Particulate nutrients that
are delivered into the head of the deep trough of the mid-Bay have much greater impacts on
water quality than particles that are deposited and buried in relatively fresh, normoxic upper Bay
waters. Determining the extent to which the Susquehanna Flats and Chesapeake Bay Estuarine

22
Turbidity Maximum (ETM) trap or seasonally modulate the delivery of Conowingo particles is
critical to a full evaluation of this transport effect. Redistribution of newly deposited particles
through resuspension and transport by waves and tides must also be accounted for. Finally, the
influences of channel dredging and sediment placement also need to be evaluated.
An assessment of the impacts of Conowingo infill on Chesapeake water quality standards and
ultimately on TMDL achievement needs to consider the full range of hydrologic conditions
observed in the past, including low, moderate, and extreme flow conditions. In addition,
estimation of the delivery of sediment and nutrients to the Bay must consider the timing and
form in which constituents of concern are delivered to the reservoir system and the Bay. These
factors significantly influence chemical and physical processes that control the sediment storage
and release and must be considered across the full range of stream flows and across all seasons.
Careful consideration should be given to the ultimate transport and fate of particulate nutrients
from the lower Susquehanna after delivery to the Bay. This includes seasonally variable changes
in the transport behavior of delivered particles, particle trapping by physical and biological
features in the upper Bay, and biogeochemical transformations of newly deposited particles in
different receiving waters, in addition to consideration of all of these factors following rare large
events. The most conservative management assumption is that all of the delivered organic
material scoured from Conowingo is fully degradable to inorganic nitrogen and phosphorus.
Current CBP model assumptions for the 2010 Water Quality and Sediment Transport Model
(WQSTM) are that particulate organic material scoured from the Conowingo is slowly
degradable with a reaction rate of 0.005/day. The state of the science is currently limited on the
details of these issues, but workshop participants nonetheless supported the current approach and
urged continuing refinement of the splits of particulate organic material into labile, refractory,
and inert reactive categories as new knowledge becomes available.
Sediment Trapping in Upper Chesapeake Bay and Impacts of Large flows
The Susquehanna River is the largest source of fresh water, suspended sediment, and nutrients to
upper Chesapeake Bay (Schubel and Pritchard 1986, Cronin et al. 2003). From Havre de Grace,
Maryland the river opens up to the tidal fresh Susquehanna Flats (the ‘Flats’) and connects with
the Chesapeake Bay. Above Havre de Grace the river channel depths range from 6 to 20 m (20
to 66 ft), and above Port Deposit shoal to less than 3m (10 ft) (NOAA- Office of Coast Survey;
Chart 12274, Head of Chesapeake Bay). The Flats constitute the head of the Susquehanna River
estuary, which extends almost to the mouth of the Potomac River, 161 km (100 miles) seaward
(Schubel and Pritchard 1986). The Flats describe a broad, shallow delta where predominantly
sand sized particulates are deposited where the Susquehanna River emerges from a narrow rock
walled valley as it crosses the Piedmont Physiographic Province and opens into the Chesapeake
Bay. The Flats formed during the latter stages of Susquehanna River migration up its ancestral
valley over the past 3,000 to 7,000 years in response to sea level change. Water depths on the

23
Flats are generally are less than one meter, except for the former thalweg, which hugs the
western side of the Flats, and is partially dredged to maintain navigation between Port Deposit
and the main stem of the Chesapeake Bay below Turkey Point. In the upper Chesapeake Bay a
deeper shipping channel provides a connection between the Chesapeake and Delaware Canal and
the port of Baltimore. The channel is maintained at a width of 137 m (500 ft) and depth of 11 m
(35 ft) deep (Dovel and Edmunds IV 1971). Net water movement along the shipping channel is
from the Chesapeake to the Delaware Bay and has been linked to shifts in the ecological
structure of the Upper Bay (Dovel and Edmunds IV 1971, Jackson and Jesien 1996).
The daily to weekly volume of Susquehanna freshwater discharge controls the location of the
ETM in the upper Chesapeake Bay (Schubel and Pritchard 1986, North et al. 2004, Park et al.
2007). The ETM refers to the zone of elevated suspended sediment concentrations observed
near the estuarine salt limit and induced by tidal and wind-induced scour, differences in salinity
and water density, and other physical factors (Sanford et al. 2001). The salt front is defined as
the 1 percent bottom isohaline (Jassby et al. 2012). In the Chesapeake Bay, the ETM extends
approximately 20 km (12 miles) in length from north to south, between Turkey Point and
Tolchester (latitudes 39°10’N and 39°28’N) (Sanford et al. 2001, North et al. 2004). As flow
increases, the salt front is pushed seaward and the salt ‘wedge’ is compressed, thereby
intensifying the vertical salinity gradient (Figure 4). As river flow decreases, the salt water
wedge extends northward; the bottom, saltier water advances more rapidly than surface waters,
thereby extending the longitudinal salinity gradient along the main stem of the Bay. The
response time of the ETM to changes in freshwater inflow is a matter of days to weeks, as
exemplified by the response of the 1‰ bottom isohaline following Hurricane Agnes, from June
through September, 1972 (Schubel and Pritchard 1986). Immediately following the June 21
record discharge of 32,000 m3/s (1,130,000 cfs) and stream gauge height of 11.23 m (36.85 ft),
the salt front moved 70 to 80 km (43 to 50 miles) seaward, to a location south of the William
Preston Lane Memorial Bridge. By late July, average daily flow dropped to less than 85 m3/s
(3,000 cfs), and by late August, the salt front rebounded northward, extending well into the
Susquehanna Flats. Since implementing the Susquehanna River low flow guidelines in 1987
(http://www.srbc.net/policies/lowflowpolicy.htm, retrieved July 11, 2016) the ETM generally
occurs beyond Turkey Point and migrates along the shipping channel between Baltimore and the
Chesapeake and Delaware (C&D) canal (North et al. 2004, Park et al. 2007).
The sediments deposit and accumulate in tidal Chesapeake waters in reverse order of their
particle size, beginning with sands in the Susquehanna Flats at the river mouth and grading to
clayey silts by the Annapolis Bay Bridge (Colman et al. 1979; Kerhin et al. 1988). Under normal
river flow conditions, the vast majority of sediments delivered by the Susquehanna River are
trapped and accumulate in the upper Bay above the bridge (Schubel and Pritchard 1986,
Donoghue et al. 1989), but under high flow conditions some fraction of the sediment load can be
delivered well into the mid-Bay (Stumpf 1988, Sanford et al. 2001). Furthermore, sediment
loads initially deposited on the broad shoals of the upper Bay seem to be effectively focused into

24
the shipping channels by subsequent wave-induced resuspension (Sanford 1994). Maintenance
dredging of these shipping channels may remove the majority of the trapped sediment load,
though exact calculations are difficult (Sanford et al. 2001). Locations and methods of dredged
sediment disposal will in turn influence the potential for additional environmental impacts.
Since 2010, all sediments dredged from the major shipping channels are removed from the
Chesapeake Bay and placed in confined facilities such as the Poplar Island Restoration Project or
the soon to be reactivated Pearce Creek Confined Disposal Facility.
The fate of particulate organic carbon (POC) and particulate nutrients from the river is not as
clear, though it is likely that much of this material is trapped or escapes in a similar manner to
that of fine inorganics. For example, Keller et al. (2014) found a significant transition between
riverine and estuarine phytoplankton across the location of the ETM, with indications of
significant degradation and trapping of degraded riverine phytoplankton in the ETM. Malpezzi
et al. (2013) also found that a large fraction of the POC in the ETM region was associated with
Transparent Exopolymer Polysaccharides (TEP) that likely resulted from phytoplankton
degradation and tended to be associated with large, rapidly settling aggregates (Figure 4). The
upper Bay is a region of limited new phytoplankton production due to persistent high turbidity
(Fisher et al. 1988, Smith and Kemp 2001), which makes it a net heterotrophic environment.
Figure 4. A Conceptual Model of Particle Dynamics in Chesapeake Bay ETM. ETMs are established
and maintained through a combination of near bottom transport convergence, particle settling, and tidal
resuspension. The efficiency of particle trapping is enhanced by flocculation/aggregation, which is
enhanced by biological activity (source: Sanford, current workshop. How Does the Bay Respond to Large
Freshwater Events?)

25
There are four main processes that contribute to sediment and particulate nutrient trapping in the
upper Bay above the Chesapeake Bay Bridge at Kent Island. First, the rapid expansion in cross-
sectional area where the Susquehanna River empties into Chesapeake Bay south of Havre de
Grace rapidly reduces river flow, resulting in a settling of coarse particles and continuous
formation of the broad, sandy delta known as Susquehanna Flats. Recent research also indicates
an increased tendency for fine particle trapping during summer months due to the presence of the
extensive submerged aquatic vegetation (SAV) bed over the Flats (C. Gurbisz and C. Palinkas,
personal communication). Second, fine wash-load particles from the Susquehanna River tend to
flocculate and/or agglomerate when they reach estuarine waters (Schubel and Kana 1972,
Sanford et al. 2005, Malpezzi et al. 2013), increasing their settling speeds and likelihood of being
trapped in the upper Bay. Third, the persistent ETM that forms in upper Chesapeake Bay near
the limit of near-bottom salt intrusion (between latitudes 39°10’N and 39°28’N) greatly increases
the residence time and burial rate of particles settling at intermediate speeds (Geyer 1993,
Sanford et al. 2001, North et al. 2004). Finally, deposition and burial of these particles seem to
be preferentially focused in the shipping channels of the upper Bay, most likely by wind-wave
resuspension and transport following initial deposition (Halka et al. 1991, Sanford 1994).
Sediments that are deposited in the channel downstream of the ETM can be subsequently
transported back upstream by the combined estuarine and tidal circulations.
High riverine discharge may transport fine particles beyond the turbidity maximum (Sanford et
al. 2001) resulting in sediment plumes extending from the Susquehanna to as far as the mouth of
the Potomac, visible from space (Stumpf 1988). Sediment concentrations in these plumes are
high relative to normal surface concentrations in Chesapeake Bay, but low compared to source
concentrations at the mouth of the Susquehanna River (Figure 5). High concentrations tend to be
present only in the surface layer (Cheng et al. 2013) and dissipate through settling and mixing
within a few days. There are very few in situ observations of storm plumes, but it is likely that
significant delivery of particulate nutrients from the Susquehanna to the mid-Bay is dominated
by these plume events. The fraction of the total particulate nutrient load delivered in this manner
is not yet known.
The timing of a storm event affects the magnitude of the water quality impacts on the Bay (Wang
and Linker 2005, Cerco and Noel 2016, Linker et al. 2016). A spring or summer storm event,
during critical life stages for many species of concern, poses greater risks to the Bay ecosystem
than a fall event. The worst example of this on record was Tropical Storm Agnes in 1972, which
had enormous, long-lasting impacts on Bay water quality and ecosystem dynamics (CRC 1977),
largely due to its June timing. Interestingly, many of the adverse impacts of Agnes on living
resources were attributed to the enormous freshwater inputs as well as, or instead of, the
enormous sediment inputs (CRC 1977).
Scientists continue to investigate linkages between the health of the upper Bay ecosystem and
Susquehanna discharge. Examples of sudden, rapid degradation or reestablishment of SAV in

26
the upper Chesapeake Bay suggest threshold effects have a strong role in regulating ecosystem
health (Gurbisz and Kemp 2014; Gurbisz et al. 2016). For example, abundance of SAV
precipitously declined after Tropical Storm Agnes in June 1972. For nearly 30 years, abundance
remained extremely low. In the mid-2000s, however, SAV bed health resurged to pre-Agnes
conditions on the tidal Susquehanna Flats (Gurbisz and Kemp 2014; 2016, Gurbisz, current
workshop). Although bed area declined after the 2011 Tropical Storm Lee, surveys in 2013 and
2014 showed increasing abundance and no major changes to the remaining SAV bed health
(Gurbisz et al. 2016).
Figure 5. The large sediment plume from Tropical Storm (TS) Lee (2011) was confined to the relatively
fresh upper layer (~ 5-7 m thick). In order to remain suspended, the particles must be very fine and settle
very slowly, but the finer particles are, the better they reflect light (think of fog vs. rain). Therefore, the
plumes visible from space are relatively thin and contain high, but not huge concentrations of fine
particles. For example, a suspended sediment concentration of 50 mg/l in a 5 m thick layer amounts to
0.25 kg/m2 of material, or about 1 mm of deposition on the bottom. Most of the precipitation from TS
Lee was in central Pennsylvania within the Susquehanna watershed (source: Sanford, current workshop.
How Does the Bay Respond to Large Freshwater Events?)

27
Spatial Variation and Environmental Controls on Sediment-Water Nutrient Fluxes in
Chesapeake Bay
The fate of both organic and inorganic material (carbon, nitrogen, and phosphorus) delivered to
Chesapeake Bay from external sources (including the Conowingo reservoir) is tightly connected
to controls on sediment-water nutrient and oxygen exchanges along the Bay’s salinity gradient.
This is because the majority of particulate materials discharged into the Bay sink to the bed
relatively quickly, where they are subjected to biological and chemical processing that influences
the fraction of the imported material that is released back to the water-column to support
phytoplankton growth and other processes. The nature and extent of biogeochemical processing
of these materials varies as a function of burial rate, salinity, and oxygen variability (Cowan and
Boynton 1996), all of which change dramatically as one moves from the mouth of the
Susquehanna to the lower Bay regions south of the Potomac River.
Fortunately, there are more measurements of sediment-water nutrient and oxygen exchanges in
the Chesapeake Bay than any other estuary worldwide. This abundance of high-quality data
allows for a rich data synthesis, which in combination with numerical model simulations, allows
for a relatively complete understanding of controls on sediment processes and the fate of
externally-derived carbon and nutrients (Figure 6). The first result of this synthesis revealed that
although observed sediment carbon and phosphorus content are highest in the upper Bay and
decrease down-estuary, observed sediment-water NH4+ and PO4
3- fluxes are highest in
downstream reaches of the middle Chesapeake Bay, i.e., between the Bay Bridge and Potomac
mouth (Cowan and Boynton 1996). The peaks in sediment-water fluxes occur in the mid-Bay
for several reasons, including: 1) deposition of labile organic matter derived from internal
phytoplankton production is highest here (Cowan and Boynton 1996, Brady et al. 2013); 2)
oxygen concentrations are highly depleted (hypoxia and/or anoxia) in the water-column during
warm months (Hagy et al. 2004, Testa 2014); and (3) relatively low iron (Fe) availability allows
for limited retention of phosphorus within sediments (Cornwell and Sampou 1995, Testa et al.
2013). Numerical model simulations support the finding that Bay-wide peaks in sediment-water
NH4+ and PO4
3- fluxes occur in the most oxygen-depleted regions (down-estuary of the Bay
Bridge), highlighting the role of hypoxia/anoxia in allowing for enhanced sediment nutrient
recycling via reduced coupled- nitrification-denitrification and enhanced Fe-oxide dissolution
(Testa et al. 2014). These results emphasize the fact that externally derived organic material,
such as that originating from Conowingo Reservoir, must be deposited to seaward regions of the
Chesapeake Bay in order for the associated nutrients to be significantly recycled back to the
water-column to support additional phytoplankton growth.

28
Figure 6. Particulate organic carbon (POC), particulate organic nitrogen (PON) and particulate
phosphorus (particulate inorganic phosphorus, PIP and particulate organic phosphorus, POP) from
surficial sediment cores. Still Pond is in the upper Bay off the Sassafras River, R-78 is in the upper mid-
Bay at the north end of Kent Island, R-64 is mid-Bay off the Choptank River, Point No Point is lower
mid-Bay off the Potomac, and the York. Mouth is in the lower Chesapeake off the York River (source:
Testa, current workshop. Sediment Nutrient Fluxes in the Tidal Chesapeake Bay)

29
Impact of Reservoir Sediment Scour on Chesapeake Bay Water Quality
Cerco and Noel (2014, 2016) examined the impact of a Conowingo Reservoir scour event on
Chesapeake Bay water quality, specifically dissolved oxygen (DO) concentration, chlorophyll
concentration, and light attenuation. Their investigation employed coupled multi-dimensional
hydrodynamic (Kim 2013) and eutrophication models (Cerco et al. 2010) of the Bay called the
Water Quality and Sediment Transport Model (WQSTM). Two distinguishing features of the
model were representations of sediment transport for multiple grain sizes (Cerco et al. 2013) and
of diagenetic processes in bottom sediments (DiToro 2001). Both features proved essential in
diagnosing the effect of reservoir scour on downstream water quality.
The most significant finding by Cerco and Noel (2016) was that suspended solids loads produced
by a Conowingo scour event are relatively non-detrimental to Bay water clarity and SAV
survival. For the fall and winter seasons, solids scoured from the reservoir settle out before the
season during which light attenuation is critical, and even in the spring and summer seasons of
SAV growth the suspended sediment settles quickly with minimal impacts to SAV or water
clarity. The organic matter and nutrients associated with the solids are, however, detrimental.
As illustrated in their model, this material settles to the estuary bottom and is mineralized in bed
sediments. Carbon diagenesis spurs oxygen consumption in bottom sediments and release of
reduced materials to the water column. Nutrients are recycled to the water column and stimulate
algal production. As a result of a winter scour event, computed bottom-water DO in the
subsequent summer declines up to 0.2 g m-3 although the decline is 0.1 g m-3 or less when
averaged over the summer season.
Cerco and Noel (2016) also emphasize the significance of nitrogen loading generated by a scour
event. The hypoxic volume of Chesapeake Bay is closely linked to the nitrogen load from the
Susquehanna River (Hagy 2004, Murphy et al. 2011). Based on analysis of bottom sediment
composition in the reservoir, the quantity of particulate nitrogen eroded during a scour event is
three times the quantity of phosphorus. Preceding studies (Langland and Hainly 1997, Hirsch
2012) emphasize additional phosphorus rather than nitrogen, however, because the
preponderance of the nitrogen load is in the dissolved form.
Impact of Reservoir Infill on Water Quality Standards
The projected impact of reservoir scour on downstream water quality is low when compared to
normal intra- and inter-annual variations. The most detrimental projected effect is a DO decline
of 0.1 g m-3 or less over a summer season (Cerco and Noel 2016). This amount is significant,
however, when the minimum bottom-water DO concentration, after implementation of the
TMDL, is projected to be 1 g m-3 in some regions of the Bay. Moreover, regulatory
requirements prohibit any increase in nutrient loads that cause diminishment of water quality

30
standard achievement. The impact of a scour event, with an emphasis on regulatory
requirements, was examined by Linker et al. (2016).
For assessment purposes, the Bay system is divided into 92 segments, determined by multiple
criteria including geometry, salinity, and living resources. Linker et al. (2016) examined, for
each segment and water quality standard, the percent of time and volume that a given water
quality criterion (i.e., DO, chlorophyll, water clarity) was outside an allowed exceedance.
Attaining DO standards in the volume-time integral represented by deep-channel water from
June to September is critical to the TMDL. A reservoir scour event places an additional 1
percent of the volume-time integral outside of DO standards.
Workshop Findings
Research findings indicate a need to better understand how the LSRRS influences
nutrient and sediment loads delivered to the Chesapeake Bay.
Evaluation of water quality trends upstream and downstream of the reservoir system
indicate decreased Conowingo trapping capacity since as early as 1995. Indications
suggest that substantially more sediment and P – but only slightly more N – will regularly
come from a “full” reservoir (one in a state of dynamic equilibrium) than would come
from the reservoir in its original state.
Future progress in Bay restoration depends in part on accurately predicting how upstream
inputs to the LSRRS will be modulated by reservoir processes. Analysis of historical
monitoring data can help constrain new models of how these processes will evolve in the
future.
Initial research on inflow and outflow measures, bathymetry surveys, and spatially
explicit sediment quality evaluations to better understand N and P transport to, and fate
in, tidal waters under varying flow conditions are underway and should continue.
Infilling of the Conowingo Reservoir primarily influences particulate nutrient delivery,
with negligible influence on fresh water discharge or dissolved nutrient delivery to the
Chesapeake Bay system. This is important in the context of nitrogen, which occurs
predominantly in the dissolved form. For dissolved N, extreme events are of relatively
less concern than the moderate and moderately-high flows that provide the majority of
mass over the course of the year. Moreover, and depending heavily on its time of arrival,
the N loads from extreme events may have comparatively short residence times in the
Bay and may thus contribute in only a minor way to the Bay’s N stores and hypoxia.
During extreme events (i.e., exceptionally large discharges) there is uncertainty as to
what fraction of the total load exiting the dam during such events is from the reservoir,
relative to what comes in from upstream, and as to how these ratios have changed over
time. With or without reservoir infill, loads to the Bay during such events are
exceptionally high, and timing is very important. Each event is a case in itself and there

31
is uncertainty regarding how the state of reservoir bathymetry affects sediment discharge
during these extreme events.
Under low to moderately high flow conditions, it is likely most of the sediment loading
from the Susquehanna is trapped (and buried) by processes at or before the ETM.
Therefore, the impacts of added fluxes of sediment during these “normal” flow
conditions are likely to be primarily important for the upper Bay. Thus, any effects of
dredging or other changes to reservoir bathymetry will most likely be localized to the
upper regions of the Bay.
There is significant bypassing of the ETM under very high flow conditions, but when and
how much remains to be determined.
Wind resuspension and sediment focusing into dredged channels and other deep waters
redistributes settled particles in the upper Bay.
Characterizing and parameterizing particle settling speed distributions, and possible
changes in these distributions with flow and location, is important.
The Susquehanna Flats may not be a significant long-term trap for particulate nutrients,
though seasonal modulation of nutrient loading may be more important.
Recommendations
Support sustained studies of Conowingo infill that are a combination of monitoring, data
analysis, process research, and modeling:
Changes in the functioning of the Conowingo Reservoir system are well documented. There was
consensus among workshop participants that forecasting the future performance of the system is
a complex challenge that will require multi-disciplinary research and will need to be updated in
the future as conditions evolve. There is a need to better understand how the Lower
Susquehanna reservoirs influence the delivery of nutrient species and sediments of various size
and composition to the Chesapeake Bay. Obtaining such understanding will require sustained
efforts that are a combination of monitoring, data analysis, process research, and modeling.
Estimating the impact of Conowingo infill on Chesapeake water quality:
Efforts to model the effects of Susquehanna flow and Conowingo bathymetry on net
accumulation in or release of nutrients and sediment from the reservoir should be evaluated
based on its ability to “hindcast” the documented declines in net trapping by the reservoir over
the past two decades, as inferred from water quality observations and statistical evaluations of
past data. To quantify the influence Conowingo infill has on Chesapeake water quality, the
following processes must be considered in the Conowingo Reservoir: 1) scour during relatively
rare extreme events, e.g., 10 year storm events or greater with flow greater than 11,300 m3/s
(400,000 cfs); 2) scour during moderately high flow events; 3) trapping during low and moderate
flows; and 4) biogeochemical nutrient cycling that influence bioavailability in the reservoir
sediments, especially under low flow conditions.

32
High priority science needs on Conowingo infill effects on Bay water quality:
High priority science needs include: 1) continued and enhanced measurements of inflow and
outflow of N, P, and sediment (including consideration of the roles of various sediment size
fractions); 2) regular bathymetric surveys; and 3) spatially explicit evaluations of the physical,
chemical and biological processes occurring in sediment deposits in the reservoirs and the upper
Bay to better understand the impact of particulate nutrients from behind the Conowingo Dam on
Bay water quality – especially with regard to the location and timing of nutrient remineralization,
bioavailability, and burial.
Short-term research and modeling objectives for the next six months:
In the short term (next six months) recommended research and modeling objectives include: 1)
provision of better estimates of how sediments scoured from the Conowingo Reservoir partition
into reactivity classes that will inform the WQSTM TMDL simulations; 2) provision of better
estimates of the C, N, and P content of the sediments scoured from the Conowingo Reservoir that
will inform the WQSTM TMDL simulations; 3) provision of improved
representation/parameterization of the effects of salinity on sediment phosphorus retention
capacity, which will improve the WQSTM ability to represent phosphorus dynamics under scour
and non-scour conditions; and 4) development of improved representations of the reservoir reach
within the Chesapeake Bay Watershed Model (CBWM) that reflect current and projected
relationships of sediment, phosphorus and nitrogen outputs from the reach as a function of inputs
(including water inputs) and reservoir bed configurations.
Develop scenario methodology that incorporates both extreme flow events and longer-term
trends in Conowingo solids and nutrient loads to Chesapeake Bay:
Investigations of Conowingo infill effects on Chesapeake Bay water quality have focused on a
dichotomy of approaches. One approach is represented by scour events such as the January 1996
ice melt or the 2011 Tropical Storm Lee (e.g., Cerco and Noel 2016, Linker et al. 2016). The
other approach considers changes in long-term net deposition (e.g., Hirsch 2012, Zhang et al.
2013). In fact, deposition and scour processes often occur simultaneously and both should be
considered by management. Design of management scenarios should be reconsidered with an
eye towards inclusion of long-term loading trends and extreme flow events. Going forward
beyond 2017, a more spatially-resolved model of the reservoir system that simulates a larger
suite of physical, chemical, and biological processes is recommended.
Improve representation of reactivity of particulate organic material in Conowingo outflow:
Previous and current management models for the Bay (e.g., Cerco et al. 2010, Cerco and Noel
2016) have allocated particulate organic material from the Conowingo into a refractory, slowly
reactive classification (G2). Particulate phosphorus was additionally split between a refractory
organic and a non-reactive mineral form. For deposition to bottom sediments in tidal waters, all
33
particulate organic material in the water column must be routed into sediment diagenesis model
variables. Water column algae are split into a fast reacting labile fraction (G1), a slowly reactive
refractory portion (G2), and an inert fraction (G3) according to the classification of Westrich and
Berner (1984)1. Refractory particulate organic material is routed into G2 and G3 classes only.
Both the initial allocation of the watershed particulate organic loads and the G-series splits upon
deposition to sediments were determined empirically during long-term model calibration and
validation (e.g., Cerco and Noel 2004). That is, the allocations and splits provided satisfactory
model representation of observed conditions in the water column and observed sediment-water
fluxes of DO and nutrients. The allocations and splits might be unrepresentative, however, of
extreme events such as mass scour of Conowingo bottom sediments.
Moreover, the management model has recently been revised to include particulate organic matter
classes in the water column which correspond directly to the G1, G2, and G3 classes in the bottom
sediments. Guidance will be provided by experiments underway to investigate reaction rates of
particulate organic material in Conowingo bottom sediments and at the Conowingo outfall
(Cornwell, current workshop). Model investigations are also proposed to develop guidance for
particulate organic matter classification into classes employed by the Bay model (Fitzpatrick et
al., current workshop).
Investigate modeled deposition of particulate organic matter:
Particles, both inorganic and organic, flowing over the Conowingo outfall are largely trapped in
the upper Bay’s ETM. During extreme flow events, however, particles will break through the
barrier imposed by the ETM and penetrate into the mid-Bay before settling into bottom
sediments. The location of particulate organic matter deposition influences Bay water quality
when the material is respired and mineralized. Respiration consumes DO and mineralized
nutrients feed algal production. The location of organic matter deposition in the Bay
management model remains to be investigated. This investigation should be conducted and, if
possible, model parameters may be adjusted to represent current understanding. Deposition must
be examined under typical flow conditions and also under conditions of an extreme flow event.
Investigate allocation of suspended solids into size classes:
The Bay management model (WQSTM) includes a predictive sediment transport model (Cerco
et al. 2013). The model considers four particle size classes: fine clay, clay, silt, and sand, and
assigns distinct settling velocities to each. The allocation of suspended solids loads at the
Conowingo outfall into size classes is derived from the CBWM. Until recently, no significant
data were available to validate the splits from the CBWM. Data are becoming available,
1 G1, G2, and G3 are assumed mineralization rates of particulate organic material, usually assigned on the
basis of laboratory measurements. G1 material is very labile, or reactive, and is oxidized in a matter of
days to weeks; G2 is refractory but oxidized in weeks to months and G3 is recalcitrant and relatively inert
taking many years to mineralize.

34
however (Sanford, current workshop). The particle splits employed in the current model should
be compared to the available data. Revisions, if necessary, should be conducted to the extent
that time allows before the 2017 Midpoint Assessment. Complete recalibration of the WQSTM
could be infeasible within the time available, however (Linker, personal communication), in
which case this task might be considered as a long-term model improvement.
Support Long-term improvements to the WQSTM:
Going forward, an effort to dynamically link the sediment transport component of WQSTM with
the biologically-generated organic carbon, nitrogen, and phosphorus pools from the water-
column biogeochemical model in WQSTM would be a significant movement toward first –
principal modeling of the transport and fate of organic nutrients in the tidal Bay. In addition,
there is need for a more representative model of iron dynamics in the WQSTM, particularly in
the upper Bay, that can simulate spatial and temporal variations in iron that relate to sulfur and
phosphorus dynamics, and impact the reactivity of reservoir-derived phosphorus in the tidal
Chesapeake.

35
References
Cheng, P., M. Li, and Y. Li. 2013. Generation of an estuarine sediment plume by a tropical
storm. Journal of Geophysical Research 118: 1-13.
Chesapeake Research Consortium. 1977. The Effects of Tropical Storm Agnes on the
Chesapeake Bay Estuarine System. The Johns Hopkins University Press, Baltimore.
Cerco, C., and M. Noel. 2004. The 2002 Chesapeake Bay eutrophication model. EPA 903-R-04-
004. U.S. Environmental Protection Agency Chesapeake Bay Program, Annapolis, MD.
Cerco, C., S-C Kim, and M. Noel. 2010. The 2010 Chesapeake Bay eutrophication model. U.S.
Environmental Protection Agency Chesapeake Bay Program, Annapolis, MD.
Cerco, C., S-C Kim, and M. Noel. 2013. Management modeling of suspended solids in the
Chesapeake Bay, USA. Estuarine, Coastal and Shelf Science 116: 87-98.
Cerco, C., and M. Noel. 2014. Application of the Chesapeake Bay Environmental Model
Package to examine the impacts of sediment scour in Conowingo Reservoir on water
quality in Chesapeake Bay. Appendix C to Lower Susquehanna River watershed
assessment, Maryland and Pennsylvania: Phase I. US Army Corps of Engineers, Baltimore,
MD. http://mddnr.chesapeakebay.net/lsrwa/docs/report/appc.pdf (accessed 6 Aug. 2015)
Cerco, C., and M. Noel. 2016. Impact of reservoir sediment scour on water quality in a
downstream estuary. Journal of Environmental Quality 45(3): 882-886.
Colman, S.M., J.P. Halka, and C.H. Hobbs, III. 1992. Patterns and rates of sedimentation in the
Chesapeake Bay during the Holocene rise in sea level. Pages 101-111 in C. H. Fletcher and
J. F. Wehmiller, editors. Quaternary Coasts of the United States: Marine and Lacustrine
Systems. Society for Sedimentary Geology, Special Publication No. 48, Tulsa, OK.
CRC. 1977. The Effects of Tropical Storm Agnes on the Chesapeake Bay Estuarine System.
CRC Publication 54, 643p. Chesapeake Research Consortium, Edgewater, MD.
Cronin, T.M., J. Halka, S. Phillips, and O.P. Bricker. 2003. Chapter 5: Estuarine Sediment
Sources. Pages 105-128 in T. M. H. Cronin, J.; Phillips, S.; Bricker, O. P., editor. A
Summary Report of Sediment Processes in Chesapeake Bay and Watershed. U.S.
Geological Survey, New Cumberland, Pennsylvania.
Cronin, T.M., L.P. Sanford, M.L. Langland, D. Willard, and C. Saenger. 2003. Chapter 6:
Estuarine sediment transport, deposition, and sedimentation. Pages 129-160 in T. M.
Cronin, M. L. Langland, and S. Phillips, editors. A Summary Report of Sediment Processes
in Chesapeake Bay and Watershed, Water Resources Investigations Report 03-4123. U.S.
Geological Survey, New Cumberland, Pennsylvania.

36
Cornwell, J.C. and P.A. Sampou. 1995. Environmental controls on iron sulfide mineral
formation in a coastal plain estuary. ACS Symposium Series, American Chemical Society
612: 224-242.
DiToro, D. 2001. Sediment flux modeling. John Wiley and Sons, New York.
Donoghue, J.F., O.P. Bricker, and C.R. Owen. 1989. Particle-borne radionuclides as tracers for
sediment in the Susquehanna River and Chesapeake Bay. Estuarine, Coastal and Shelf
Science 29: 341-360.
Fisher, T.R., L.W. Harding, Jr., D.W. Stanley, and L.G. Ward. 1988. Phytoplankton, nutrients,
and turbidity in the Chesapeake, Delaware, and Hudson estuaries. Estuarine, Coastal and
Shelf Science 27: 61-93.
Geyer, W.R. 1993. The Importance of Suppression of Turbulence by Stratification on the
Estuarine Turbidity Maximum. Estuaries 16: 113-125.
Gurbisz, C., and W.M. Kemp. 2014. Unexpected resurgence of a large submersed plant bed in
Chesapeake Bay: Analysis of time series data. Limnology and Oceanography 59: 482-494.
Gurbisz, C., W.M. Kemp, L.P. Sanford, and R.J. Orth. 2016. Mechanisms of Storm-Related Loss
and Resilience in a Large Submersed Plant Bed. Estuaries and Coasts 39(4): 951-966.
Halka, J., W. Panageotou, and L.P. Sanford. 1991. Consolidation and Erosion of Deposited
Cohesive Sediments in Northern Chesapeake Bay, USA. Geo-Marine Letters 11: 174-178.
Hagy, J., W. Boynton, C. Keefe, and K. Wood. 2004. Hypoxia in Chesapeake Bay, 1950-2001:
Long-term changes in relation to nutrient loading and river flow. Estuaries 27(4): 634-658.
Hirsch, R. 2012. Flux of nitrogen, phosphorus, and suspended sediment from the Susquehanna
River basin to the Chesapeake Bay during Tropical Storm Lee, September 2011, as an
indicator of the effects of reservoir sedimentation on water quality. Scientific Investigations
Report 2012-5185. U.S. Geological Survey, Reston, VA.
Keller, D.P., D.Y. Lee, and R.R. Hood. 2014. Turbidity Maximum Entrapment of Phytoplankton
in the Chesapeake Bay. Estuaries and Coasts 37: 279-298.
Kerhin, R.T., J. P. Halka, D. V. Wells, E. L. Hennessee, P. J. Blakeslee, N. Zoltan, and R.
Cuthbertson. 1988. The Surficial Sediments of Chesapeake Bay: Physical Characteristics
and Sediment Budget. Maryland Geological Survey, Report of Investigations No. 48, 160p.
Kemp, W.M., W.R. Boynton, J.E. Adolf, D.F. Boesch, W.C. Boicourt, G. Brush, J.C. Cornwell,
T.R. Fisher, P.M. Gilbert, J.D. Hagy, L.W. Harding, E.D. Houde, D.G. Kimmel, W.D.
Miller, R.I.E. Newell, M.R. Roman, E.M. Smith, and J.C. Stevenson. 2005. Eutrophication
of Chesapeake Bay: historical trends and ecological interactions. Marine Ecology Progress
Series 303: 1-29.

37
Kim, S-C. 2013. Evaluation of a three-dimensional hydrodynamic model applied to Chesapeake
Bay through long-term simulation of transport processes. Journal of the American Water
Resources Association 49(5): 1078-1090.
Langland, M., and R. Hainly. 1997. Changes in bottom-surface elevations in three reservoirs on
the lower Susquehanna River, Pennsylvania and Maryland, following the January 1996
flood - Implications for nutrient and sediment loads to Chesapeake Bay. Water-Resources
Investigations Report 97-4138. U.S. Geological Survey, Lemoyne, PA.
Langland, M.J. 2015. Sediment transport and capacity change in three reservoirs, Lower
Susquehanna River Basin, Pennsylvania and Maryland, 1900–2012: U.S. Geological
Survey Open-File Report 2014–1235, 18p.
Linker, L.C., R.A. Batiuk, G.W. Shenk, and C.F. Cerco, 2013. Development of the Chesapeake
TMDL Allocation. Journal of the American Water Resources Association 49: 986-1006.
Linker, L.C., R.A. Batiuk, C.F. Cerco, G.W. Shank, R. Tian, P. Wang, and G. Yactayo. 2016.
Influence of reservoir infill on coastal deep water hypoxia. Journal of Environmental
Quality 45(3): 887-893.
Malpezzi, M.A., L.P. Sanford, and B.C. Crump. 2013. Abundance and distribution of transparent
exopolymer particles in the estuarine turbidity maximum of Chesapeake Bay. Marine
Ecology Progress Series 486: 23-35.
Murphy, R., W. Kemp, and W. Ball. 2011. Long-term trends in Chesapeake Bay seasonal
hypoxia, stratification, and nutrient loading. Estuaries and Coasts 34: 1293-1309.
North, E.W., S.Y. Chao, L.P. Sanford, and R. Hood. 2004. The influence of wind and river
pulses on an estuarine turbidity maximum: Numerical studies and field observations in
Chesapeake Bay. Estuaries 27(1): 132-146.
Park, K., H.V. Wang, S-C. Kim, and J-H. Oh. 2007. A model study of the estuarine turbidity
maximum along the main channel of the Upper Chesapeake Bay. Estuaries and Coasts
31(1): 115-133.
Reusser, L., P. Bierman, M. Pavich, J. Larsen, and R. Finkel. 2006. An episode of rapid bedrock
channel incision during the last glacial cycle, measured with 10Be. American Journal of
Science 306: 69-102.
Sanford, L.P. 1994. Wave-forced resuspension of Upper Chesapeake Bay muds. Estuaries 17(1):
148-165.
Sanford, L.P., S.E. Suttles, and J.P. Halka. 2001. Reconsidering the physics of the Chesapeake
Bay estuarine turbidity maximum. Estuaries 24(5): 655-669.

38
Schubel, J.R., and D.W. Pritchard. 1986. Responses of Upper Chesapeake Bay to in discharge of
the variations Susquehanna River. Estuaries 9(4): 236-249.
Schubel, J.R., and T.W. Kana. 1972. Agglomeration of fine-grained suspended sediment in
Northern Chesapeake Bay. Powder Technology 6: 9-16.
Smith, E.M., and W.M. Kemp. 2001. Size structure and the production/respiration balance in a
coastal plankton community. Limnology and Oceanography 46: 473-485.
Stumpf, R.P. 1988. Sediment transport in Chesapeake Bay during floods: Analysis using satellite
and surface observations. Journal of Coastal Research 4: 1-15.
USACE. 2016. Lower Susquehanna River Watershed Assessment, Maryland and Pennsylvania.
Phase I. Baltimore, MD. Retrieved from
http://dnr2.maryland.gov/waters/bay/Pages/LSRWA/home.aspx
USEPA. 2010. Chesapeake Bay total maximum daily load for nitrogen, phosphorus, and
sediment. U.S. Environmental Protection Agency Chesapeake Bay Program Office,
Annapolis MD.
URS Corporation and Gomez and Sullivan Engineers. 2012. Final Study Report: Sediment
Introduction and Transport Study (RSP 3.15). Kennett Square, PA: Exelon Generation,
LLC.
Wang, P., and L.C. Linker. 2005. Effect of timing of extreme storms on Chesapeake submerged
aquatic vegetation. In: K.G. Sellner, Hurricane Isabel in Perspective. CRC Publication 05-
160: 177-184. Chesapeake Research Consortium, Edgewater, MD.
Westrich, J., and R. Berner. 1984. The role of sedimentary organic matter in bacterial sulfate
reduction: The G model tested. Limnology and Oceanography 29(2): 236-249.
Zhang, Q., D. Brady, and W. Ball. 2013. Long-term seasonal trends of nitrogen, phosphorus, and
suspended sediment load from the non-tidal Susquehanna River basin to Chesapeake Bay.
Science of the Total Environment 452-453: 208-221.
Zhang, Q., R.M. Hirsch, and W. Ball. 2016a. Long-Term Changes in Sediment and Nutrient
Delivery from Conowingo Dam to Chesapeake Bay: Effects of Reservoir
Sedimentation. Environmental Science & Technology 50(4): 1877-1886.
Zhang, Q., W.P. Ball, and D.L. Moyer. 2016b. Decadal-scale Export of Nitrogen, Phosphorus,
and Sediment from the Susquehanna River Basin, USA: Analysis and Synthesis of
Temporal and Spatial Patterns. Science of the Total Environment 563-564: 1016-1029.

39
Appendix A: Workshop Agenda
Scientific and Technical Advisory Committee Workshop
Conowingo Infill Influence on Chesapeake Water
Quality
January 13-14, 2016
Crowne Plaza Annapolis Hotel, 173 Jennifer Road, Annapolis, MD 21401 http://www.chesapeake.org/stac/workshop.php?activity_id=249
Workshop Goals
Given the current state of knowledge based on 1) the past record of observations, 2) first
principles which can be used to build simulation models, and 3) the 2017 Midpoint
Assessment timeframe, what would be the best approach to modeling the processes by
which inputs to the reservoirs are transformed into outputs in past, current, and in future
conditions? It is expected that as the science improves the modeling approach will evolve
and improve as well, but it is critical that current and future estimates of reservoir infill
and outputs be based on the best representation of the processes that can be made at the
present time.
Formulate a plan of study, including field data collection related to mass balance and
biogeochemical transformations, as well as experimentation that will improve
understanding of the processes at play in these reservoirs. The plan of study also needs to
consider the conceptual framework in which the field data are examined to quantify the
rates at which the major processes are taking place in the reservoir system.
Day 1: Wednesday, January 13
8:30 Registration, light breakfast (provided)
9:00 Welcome – Ben Grumbles, Secretary of the Environment
9:15 Introduction and Purpose of Workshop – Lee Currey, MDE
Plenary Speaker
9:30 Sedimentation Dynamics of Reservoirs – Gregory Morris, GLM Engineering COOP
A discussion on the world-wide situation of reservoirs that are at or near their sediment
storage capacity. What do we know about how they work? What is the state of the science
in terms of prediction of changes in their trapping efficiency as they near dynamic
equilibrium?

40
Session I: Introduction and Background
10:00 Findings of the Lower Susquehanna River Watershed Assessment (LSRWA) – Anna
Compton, CoE Baltimore District Key findings of the LSRWA report will be described.
10:20 Net Trapping Efficiency of the Lower Susquehanna Reservoirs – Qian Zhang and
Bill Ball, JHU The use of statistical inference to describe the changing behavior of the system with the
fundamental conclusions that net trapping efficiency has declined over the last 15 to 20 years.
Long-term changes in nutrient and sediment fluxes from the Lower Susquehanna reservoirs,
what this means in terms of trends in total inputs of N and P to the Bay, and thoughts about the
potential future trajectory of these inputs. How these questions motivate the need for improved
data, process research, and modeling.
10:40 Recent history of the Conowingo Reservoir Infill in the Broader Context of Trends of
Nitrogen and Phosphorus Fluxes to the Chesapeake Bay – Robert Hirsch, USGS Hirsch will present an evaluation of trends in annual average river inputs of total nitrogen and
total phosphorus from Conowingo along with inputs to Conowingo and the relationship of these
changes to inputs of N and P to the Bay from most of the other major sources. These results will
also be viewed from the perspective of changes in the N:P ratio which may have important
ecological implications.
11:00 Bathymetric history of the Lower Susquehanna River Reservoir System and History
of Scour Events from 1930 to 2015 – Mike Langland, USGS
11:20 How Does the Bay Respond to Large Freshwater Events? – Larry Sanford, UMCES
and Carl Friedrichs, VIMS
11:40 Sediment Transport and Deposition in the Upper Chesapeake – Jeff Halka, MD
Geological Survey (retired)
12:00 DISCUSSION (Moderator: Lee Currey, MDE) What are fruitful opportunities for future work, particularly as applied to downstream
Chesapeake Bay water quality?
12:30 LUNCH (provided)

41
Session II: Ongoing Lower Susquehanna Reservoir
Research, Monitoring, and Modeling
1:30 State of Current Conowingo Monitoring – Bruce Michael, DNR All aspects of monitoring including inputs of water, nutrients and sediment; nitrogen,
phosphorus and suspended sediment in the water column in the reservoirs; sediment
storage with associated nutrient storage in the reservoirs, and the outputs of water,
nutrients and sediment from the reservoir system to Chesapeake Bay will be described.
The presentation includes activities that are part of long-term monitoring programs, such
as the Chesapeake Bay Program Non-tidal monitoring network, as well as monitoring
efforts initiated over the last couple of years through funding by Exelon.
1:40 Conowingo Monitoring Study – Tim Sullivan/Gary Lemay (Gomez and Sullivan)
and Marjie Zeff (AECOM) Initial results relative to the physical parameters associated with the Conowingo
Monitoring Program (e.g., 2013 – 2015 bathymetry results for Conowingo Impoundment,
Lake Clarke and Lake Aldred/bulk density results for Conowingo) will be reported.
Characterization of the storm events monitored and sampling strategy will also be
provided.
2:00 Sediment Composition and Diagenesis – Jeff Cornwell and Jeremy Testa, UMCES The composition of Conowingo sediments in long and short cores, the estimated
reactivity of their organic material, and their estimated biogeochemical fate in tidal water
deposition will be described. Measured sediment nutrient flux rates of Conowingo
Sediment will be discussed.
2:20 Sedimentation Rates and Patterns – Cindy Palinkas (UMCES) Conowingo long cores and particle dynamics
2:40 BREAK
2:50 Simulation of the Conowingo and Lower Susquehanna Reservoirs in the Watershed
Model – Gopal Bhatt, PSU and Gary Shenk, USGS/CBPO How does the Phase 6 Watershed Model estimate the outputs of Conowingo water,
nutrients, and sediment as a function of their inputs to the reservoir system? What plans
are being considered or are being tested to modify this aspect of the watershed model in
light of new understanding of the evolving state of the reservoir system?
3:10 ADH Modeling of Conowingo Reservoir – Steve Scott, USACE/ERDC (via webinar) Quantification of shear stress for scour decreasing with infill
3:30 Lower Susquehanna River Impoundment Modeling Studies Jim Fitzpatrick/Mark
Velleux (HDR) and Marty Teal (WEST Consultants) Presentation on a sediment and nutrient mass balance model of Conowingo Pond as well
as enhanced sediment transport models of Lake Clarke and Lake Aldred. The plans and

42
schedule for completing these models, their current state and potential for integrating
with the Phase 6 Watershed model will be discussed.
4:00 DISCUSSION (Moderator: Robert Hirsch, USGS) How can the data and understanding identified in the previous two sections be best used
to characterize how the decline in reservoir storage capacity will change the outputs of
nutrients and sediment to the Chesapeake Bay? What monitoring and field studies need to
continue to improve this understanding and document the continuing evolution of this
system? What improvements should be considered for these monitoring systems and to
the analytical frameworks for evaluating that monitoring data? What additional research
is needed to enhance the state of the science on the behavior of the reservoir system and
how it modulates outputs of nutrients and sediment to the Bay?
5:00 Recess

43
Day 2: Thursday, January 14
8:00 Light breakfast (provided)
8:30 Welcome, Summary of Day 1, and Comments from Workshop Participants
Session III: Chesapeake Bay Research, Monitoring, and Modeling
8:50 Unexpected Resurgence of a Large Submersed Plant Bed in Chesapeake Bay –
Cassie Gurbisz, UMCES
An ecosystem perspective.
9:10 Sediment Nutrient Fluxes in the Tidal Chesapeake Bay – Jeremy Testa and Jeff
Cornwell, UMCES A presentation on environmental controls on sediment-water fluxes in the Chesapeake
Bay.
9:30 BREAK
9:45 Circulation, wave and sediment transport in the Chesapeake Bay – Xiaohui Xie,
UMCES New observations in Chesapeake Bay have suggested that wind can drive strong lateral
circulation and generate large amplitude internal waves near the seabed. The circulation
and wave motions may play a significant role in the lateral transport of nutrients and
sediments. A coupled modeling system (COAWST) of Chesapeake Bay is developed to
investigate how estuarine circulation and waves affect sediment transport and deposition
during storms.
10:10 Representation of Conowingo Infill in the WQSTM – Carl Cerco, USACE/ERDC What does the existing Water Quality and Sediment Transport Model (WQSTM) of the
Bay tell us about the response of the Bay ecosystem to the types of Susquehanna input
changes of nutrients, and sediment that we might expect as the trapping efficiency of the
reservoir system decreases?
10:40 DISCUSSION (Moderator: Lew Linker, EPA/CBPO) A discussion focused on how the WQSTM could be improved to better predict the key
outcomes associated with changing inputs of nutrients and sediment from Conowingo.
What additional research and monitoring should be undertaken to improve the
understanding of the linkages and lead to improved modeling? Does current
understanding and its representation in the model properly consider the different roles
played by inputs of particulate and dissolved organic and inorganic nutrients in their
various forms, including sorption to different particle sizes of sediment?
11:30 LUNCH (provided)

44
12:30 WRAP UP DISCUSSION (Moderator: William Ball, JHU/CRC) There are many physical, chemical, and biological processes that take place in the
reservoirs, in the Bay, and in the sediments that reside in their beds. In order to better
evaluate future behavior of the entire system (the reservoirs and the Bay) under a variety
of management scenarios that are focused on the Susquehanna River basin and/or its
reservoirs, what are the most important questions that need to be answered? The steps
needed to answer them may include improvements in the monitoring of the Lower
Susquehanna Reservoir system and the Upper Bay in terms of the inputs, changes in
storage, and outputs of nutrients and sediment. This includes considerations of what,
when, where and how to sample the water column (including particulates and dissolved
nutrients and biota) and the bed material (volumes, particle size distribution, chemical
composition, and redox state), and how to synthesize the data to improve understanding
of the system. Also, what laboratory and theoretical studies should be undertaken to
better understand the physical, chemical, and biological processes that control the
transport, storage, and transformation of sediment and nutrients through this
reservoir/estuary system? In addition to these longer-term science priorities, we need to
consider what steps are needed to make the best use of the current state of our
understanding to evaluate management decisions that must be made in the next year as a
part of the 2017 Midpoint Assessment. In particular, what are the most important
improvements that should be made to the suite of models (watershed and Bay) in order to
better predict how the reservoir system will modulate inputs of nutrients and sediment
into outputs and how these outputs will affect the achievement of the TMDL goals in the
Bay?
2:00 Adjourn

45
Appendix B: Workshop Participants
Name Affiliation Contact
Aunkst, Dana PA Department of Environmental Protection [email protected]
Baker, Matt UMBC [email protected]
Balay, John Susquehanna River Basin Commission [email protected]
Ball, William Chesapeake Research Consortium/JHU [email protected]
Barletta, Stephanie UMCES [email protected]
Batiuk, Rich EPA-CBPO [email protected]
Bhatt, Gopal PSU-CBPO [email protected]
Bickford, Nathan JHU [email protected]
Blakenship, Karl Bay Journal [email protected]
Blomquist, Joel USGS Maryland [email protected]
Boomer, Kathy TNC/STAC [email protected]
Boynton, Walter UMCES [email protected]
Brown, William [email protected]
Bryer, Mark TNC [email protected]
Cerco, Carl USACE-ERDC [email protected]
Claggett, Peter USGS-CBPO [email protected]
Compton, Anna USACE Baltimore District [email protected]
Cornwell, Jeff UMCES [email protected]
Currey, Lee MDE [email protected]
Dalmasy, Dinorah MDE [email protected]
Dixon, Rachel Chesapeake Research Consortium/STAC Staff [email protected]
Edward, Jim EPA-CBPO [email protected]
Fanelli, Rosemary USGS& U of Maryland @ CP [email protected]
Fitzpatrick, Jim HDR, Inc. [email protected]
Freeman, Lauren Naval Research Laboratory [email protected]
Gardner, Natalie Chesapeake Research Consortium/STAC Coordinator [email protected]
Gavin, Andrew Susquehanna River Basin Commission [email protected]
Gray, John USGS Reston (retired) [email protected]
Grumbles, Ben MDE [email protected]
Gurbisz, Cassie UMCES [email protected]
Halka, Jeff MD Geological Survey, retired [email protected]
Helfrich, Michael Lower Susquehanna Riverkeepers [email protected]
Hinson, Kyle CRC [email protected]
Hirsch, Robert USGS/STAC [email protected]
Kelly, Renee Chesapeake Research Consortium/STAC Staff [email protected]
Langland, Mike USGS [email protected]
Lemay, Gary Gomez and Sullivan [email protected]
Lindner, Anne Exelon [email protected]
46
Linker, Lewis EPA-CBPO [email protected]
Long, Kimberly Exelon [email protected]
McGee, Beth Chesapeake Bay Foundation [email protected]
Michael, Bruce MD DNR [email protected]
Miller, Andrew UMBC/STAC [email protected]
Montali, David WV Department of Environmental Protection [email protected]
Morris, Gregory GLM Engineering COOP [email protected]
Moyer, Doug USGS Richmond [email protected]
Ortt, Richard MD Geological Survey, Director [email protected]
Palinkas, Cindy UMCES [email protected]
Pendick, Daniel Maryland Sea Grant [email protected]
Pizzuto, James University of Delaware [email protected]
Prestegaard, Karen University of Maryland College Park [email protected]
Russ, Emily UMCES [email protected]
Sanford, Larry UMCES [email protected]
Scott, Steve USACE-ERDC, retired [email protected]
Shenk, Gary USGS-CBPO [email protected]
Skalak, Katherine USGS Reston [email protected]
Staver, Ken University of Maryland [email protected]
Sullivan, Tim Gomez and Sullivan [email protected]
Sullivan, Tom Gomez and Sullivan [email protected]
Swanson, Ann Chesapeake Bay Commission [email protected]
Teal, Marty WEST Consultants [email protected]
Testa, Jeremy UMCES [email protected]
Velleux, Mark HDR [email protected]
Viducich, Jon WEST Consultants [email protected]
Vulgaropulos, Zoe UMCES [email protected]
Xie, Xiaohui UMCES [email protected]
Zeff, Marjorie AECOM [email protected]
Zhang, Qian JHU [email protected]

47
Appendix C: Presentation Summaries and Links to Presentations
Plenary Session
Sedimentation Dynamics of Reservoirs – Gregory Morris, GLM Engineering COOP.
Morris described and gave international examples of the 1) variability of sediment transport over
time, 2) the geomorphic evolution of reservoirs, 3) the changes in depositional patterns and
resulting changes in reservoir geometry, and 4) management options for sediment in reservoirs.
http://www.chesapeake.org/stac/presentations/249_Morris%20Conowingo.pdf
Session I: Introduction and Background
Key Findings of the Lower Susquehanna River Watershed Assessment (LSRWA) – Anna
Compton, USACE Baltimore District.
The LSRWA goals were to 1) determine Bay health effects due to the loss of Conowingo
trapping capacity, 2) describe the sediment and associated nutrient transport effects during high
flow storm events, and 3) evaluate sediment and associated nutrient load reduction strategies
http://www.chesapeake.org/stac/presentations/249_Compton_LSRWASTAC13Jan2016.pdf
Net Trapping Efficiency of the Lower Susquehanna Reservoirs – Qian Zhang and Bill Ball,
Johns Hopkins University.
The Susquehanna River, the bay’s largest tributary, has drawn attention because SS loads from
behind Conowingo Dam (near the river’s mouth) have been rising dramatically. To better
understand these changes, we evaluated histories of concentration and loading (1986–2013)
using data from sites above and below Conowingo Reservoir. First, observed concentration-
discharge relationships show that SS and TP concentrations at the reservoir inlet have declined
under most discharges in recent decades, but without corresponding declines at the outlet,
implying recently diminished reservoir trapping. Second, best estimates of mass balance suggest
decreasing net deposition of SS and TP in recent decades over a wide range of discharges, with
cumulative mass generally dominated by the 75∼99.5th percentile of daily Conowingo
discharges. Finally, stationary models that better accommodate effects of river flow variability
also support the conclusion of diminished trapping of SS and TP under a range of discharges that
includes those well below the literature-reported scour threshold. Overall, these findings suggest
that decreased net deposition of SS and TP has occurred at sub-scour levels of discharge, which
has significant implications for the Chesapeake Bay ecosystem.
http://www.chesapeake.org/stac/presentations/249_ZhangBall_v2.pdf
Link to paper: <http://pubs.acs.org/doi/abs/10.1021/acs.est.5b04073>
Recent history of the Conowingo Reservoir Infill in the Broader Context of Trends of
Nitrogen and Phosphorus Fluxes to the Chesapeake Bay – Robert Hirsch, USGS Hirsch presented an evaluation of trends in annual average river inputs of total nitrogen and total
phosphorus from Conowingo along with inputs to Conowingo and the relationship of these
changes to inputs of N and P to the Bay from most of the other major sources.
http://www.chesapeake.org/stac/presentations/249_Hirsch_Conowingo%20Workshop_rev.pdf

48
Bathymetric history of the Lower Susquehanna River Reservoir System and History of
Scour Events from 1930 to 2015 – Mike Langland, USGS A comprehensive history of Conowingo infill was described. The historical context to
transported sediment loads into and out of the reservoirs of the lower Susquehanna was provided
And major influences on sediment load transport were discussed. The loss of the Conowingo
Reservoir sediment storage capacity (SSC) over time was quantified.
http://www.chesapeake.org/stac/presentations/249_Langland%20STAC_Res_mtng_1-
2016_new.pdf
How Does the Bay Respond to Large Freshwater Events? – Larry Sanford, UMCES and
Carl Friedrichs, VIMS http://www.chesapeake.org/stac/presentations/249_SanfordSTACConowingoPresentation011316
Sediment Transport and Deposition in the Upper Chesapeake – Jeff Halka, MD Geological
Survey (retired) http://www.chesapeake.org/stac/presentations/249_Halka%20STAC%201-13-16.pdf
Session II: Ongoing Lower Susquehanna Reservoir Research, Monitoring, and Modeling
State of Current Conowingo Monitoring – Bruce Michael, MD Department of Natural
Resources.
All aspects of monitoring including inputs of water, nutrients and sediment; nitrogen, phosphorus
and suspended sediment in the water column in the reservoirs; sediment storage with associated
nutrient storage in the reservoirs, and the outputs of water, nutrients and sediment from the
reservoir system to Chesapeake Bay will be described. The presentation includes activities that
are part of long-term monitoring programs, such as the Chesapeake Bay Program Non-tidal
monitoring network, as well as monitoring efforts initiated over the last couple of years through
funding by Exelon.
http://www.chesapeake.org/stac/presentations/249_Michael_STAC%20Conowingo%20Infill%2
0Workshop%201%2013%2016_Final.pdf
Conowingo Monitoring Study – Tim Sullivan/Gary Lemay, Gomez and Sullivan and
Marjorie Zeff, AECOM. Initial results relative to the physical parameters associated with the Conowingo monitoring
program, e.g., 2013 – 2015 bathymetry results for Conowingo Reservoir, Lake Clarke and Lake
Aldred and bulk density results for Conowingo, were described. Characterization of the storm
events monitored and the sampling strategy was also discussed.
http://www.chesapeake.org/stac/presentations/249_Conowingo%20Monitoring%20Study%20-
%2001.13.2016%20[FINAL].pdf

49
Sediment Composition and Diagenesis – Jeff Cornwell and Jeremy Testa, UMCES. The composition of Conowingo sediments in long and short cores, the estimated reactivity of
their organic material, and their estimated biogeochemical fate in tidal water deposition was
described and measured sediment nutrient flux rates of Conowingo Sediment was discussed.
http://www.chesapeake.org/stac/presentations/249_Cornwell%20STAC%20Meeting%20FINAL.
Sedimentation Rates and Patterns – Cindy Palinkas, UMCES. http://www.chesapeake.org/stac/presentations/249_STAC16_palinkas.pdf
Simulation of the Conowingo and Lower Susquehanna Reservoirs in the Watershed Model
– Gopal Bhatt, PSU and Gary Shenk, USGS/CBPO. Initial Phase 6 Watershed Model estimates of the outputs of Conowingo water, nutrients, and
sediment as a function of their inputs to the reservoir system were presented as well as the plans
to modify the Phase 6 Conowingo infill simulation in light of new understanding of the evolving
state of the reservoir system.
http://www.chesapeake.org/stac/presentations/249_20160113%20-%20BHATT%20-
%20Simulation%20of%20the%20Conowingo%20and%20Lower%20Susquehanna%20Reservoir
s%20in%20Phase%206.pdf
ADH Modeling of Conowingo Reservoir – Steve Scott, USACE/ERDC (via webinar).
The key points of Scott’s ADH model presentation were his findings that:
Reservoir capability to store sediments was at a maximum after construction in the
1920’s.
Over time sedimentation changed the hydrodynamics of the Conowingo Reservoir.
As the reservoir becomes shallower velocities increase.
Increased velocity results in higher bed shear stress and scour potential.
Turbulence increases at lower discharges increasing sediment transport.
http://www.chesapeake.org/stac/presentations/249_Scott_Conowingo.pdf
Lower Susquehanna River Impoundment Modeling Studies – Jim Fitzpatrick, Mark
Velleux, HDR and Marty Teal, WEST Consultants.
A sediment and nutrient mass balance model of Conowingo Pond as well as enhanced sediment
transport models of Lake Clarke and Lake Aldred were described. The plans and schedule for
completing these models, their current state and their potential for integrating with the Phase 6
Watershed Model were discussed.
http://www.chesapeake.org/stac/presentations/249_LSR%20Impoundment%20Modeling%20Stu
dies%20-%2001.13.2016%20[FINAL].pdf

50
Session III: Chesapeake Bay Research, Monitoring, and Modeling
Unexpected Resurgence of a Large Submersed Plant Bed in Chesapeake Bay – Cassie
Gurbisz, UMCES. http://www.chesapeake.org/stac/presentations/249_Gurbisz_conowingo_meeting.pdf
Sediment Nutrient Fluxes in the Tidal Chesapeake Bay – Jeremy Testa and Jeff Cornwell,
UMCES. A presentation on environmental controls on sediment-water fluxes in the Chesapeake Bay.
http://www.chesapeake.org/stac/presentations/249_Testa_Bay_Sediment%20Fluxes_Final.pdf
Circulation, wave and sediment transport in the Chesapeake Bay – Xiaohui Xie, UMCES. New observations in Chesapeake Bay have suggested that wind can drive strong lateral
circulation and generate large amplitude internal waves near the seabed. The circulation and
wave motions may play a significant role in the lateral transport of nutrients and sediments. A
coupled modeling system (COAWST) of Chesapeake Bay is developed to investigate how
estuarine circulation and waves affect sediment transport and deposition during storms.
http://www.chesapeake.org/stac/presentations/249_Xie_Circulation%20wave%20and%20sedime
nt%20transport%20_xxh.pdf
Representation of Conowingo Infill in the WQSTM – Carl Cerco, USACE/ERDC. The Conowingo Reservoir is situated at the lower terminus of the Susquehanna River watershed,
immediately above Chesapeake Bay. Since construction, the reservoir has been filling with
sediment to the point where storage capacity is nearly exhausted. The potential for release of
accumulated sediments, organic matter and nutrients, especially through the action of storm
scour, causes concern for water quality in Chesapeake Bay. We used hydrodynamic and
eutrophication models to examine the effects of watershed loads and scour loads on bay water
quality under total maximum daily load conditions. Results indicate that increased suspended
solids loads are not a threat to Bay water quality. For most conditions, solids scoured from the
reservoir settle out before the season during which light attenuation is critical. The organic
matter and nutrients associated with the solids are, however, detrimental. This material settles to
the estuary bottom and is mineralized in bed sediments. Carbon diagenesis spurs oxygen
consumption in bottom sediments and in the water column via release of chemical oxygen
demand. The nutrients are recycled to the water column and stimulate algal production. As a
result of a scour event, bottom-water dissolved oxygen declines up to 0.2 g m-3 although the
decline is 0.1 g m-3 or less when averaged over the summer season. Surface chlorophyll
increases 0.1 to 0.3 mg m-3 during the summer growing season.
http://www.chesapeake.org/stac/presentations/249_Cerco_011416.pdf

51
Appendix D: Additional Resources
ERDC report: "Sediment Transport Characteristics of Conowingo Reservoir"
http://dnr.maryland.gov/bay/lsrwa/docs/report/appb.pdf
Langland, M., E. Koerkle. 2014. Calibration of a One-Dimensional Hydraulic Model (HEC-
RAS) for Simulating Sediment Transport through Three Reservoirs, Lower Susquehanna
River Basin, 2008-2011. U.S. Army Corps of Engineers.
Palinkas, C.M., J.P. Halka, M. Li, L.P. Sanford, P. Cheng. 2014. Sediment deposition from
tropical storms in the upper Chesapeake Bay: Field observations and model simulations.
Continental Shelf Research 86: 6-16.
STAC Review of the Lower Susquehanna River Watershed Assessment (LSRWA) Report
http://www.chesapeake.org/stac/stac_rw_details.php?activity_id=247