CONNECTKaro 2015 - Session 7A - GPC - Modeling Energy Demand from India’s Transport Sector
25
Modeling energy demand from India’s transport sector Scenario building using a bottom-up national transport demand model 16 th April 2015 ConnectKaro, New Delhi 1
-
Upload
embarq -
Category
Government & Nonprofit
-
view
114 -
download
0
Transcript of CONNECTKaro 2015 - Session 7A - GPC - Modeling Energy Demand from India’s Transport Sector

Modeling energy
demand from
India’s transport
sector
Scenario building using a
bottom-up national
transport demand model
16th April 2015
ConnectKaro, New Delhi
1
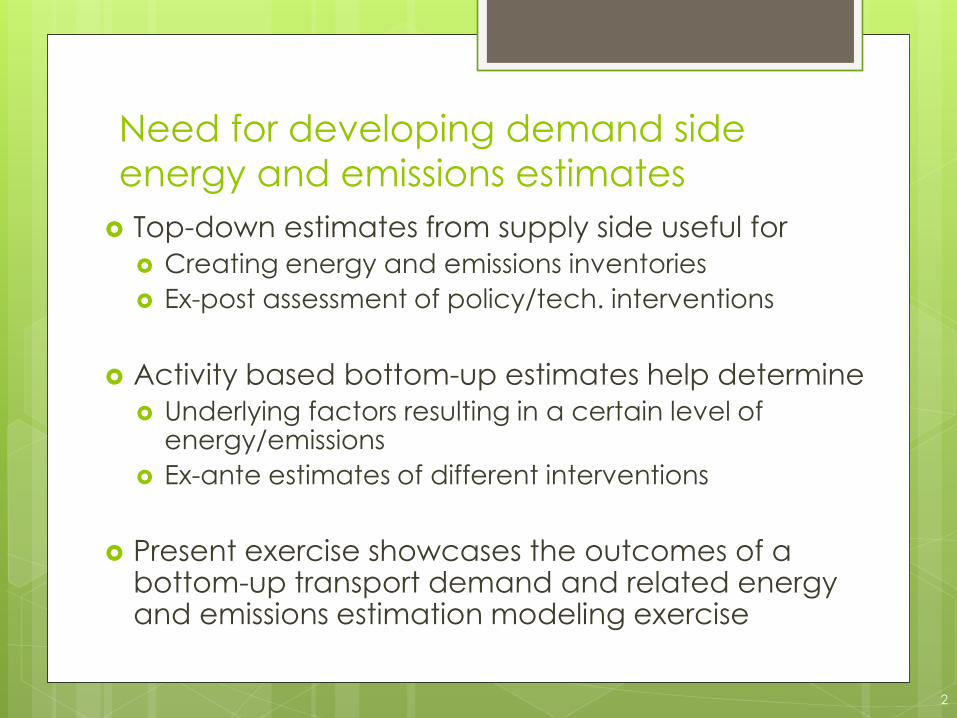
Need for developing demand side
energy and emissions estimates
Top-down estimates from supply side useful for
Creating energy and emissions inventories
Ex-post assessment of policy/tech. interventions
Activity based bottom-up estimates help determine
Underlying factors resulting in a certain level of energy/emissions
Ex-ante estimates of different interventions
Present exercise showcases the outcomes of a bottom-up transport demand and related energy and emissions estimation modeling exercise
2
Objective of the exercise
Determining the present and
future demands of energy
by the transport sector in
India and identifying ways to
reduce its energy needs
under various scenarios
3
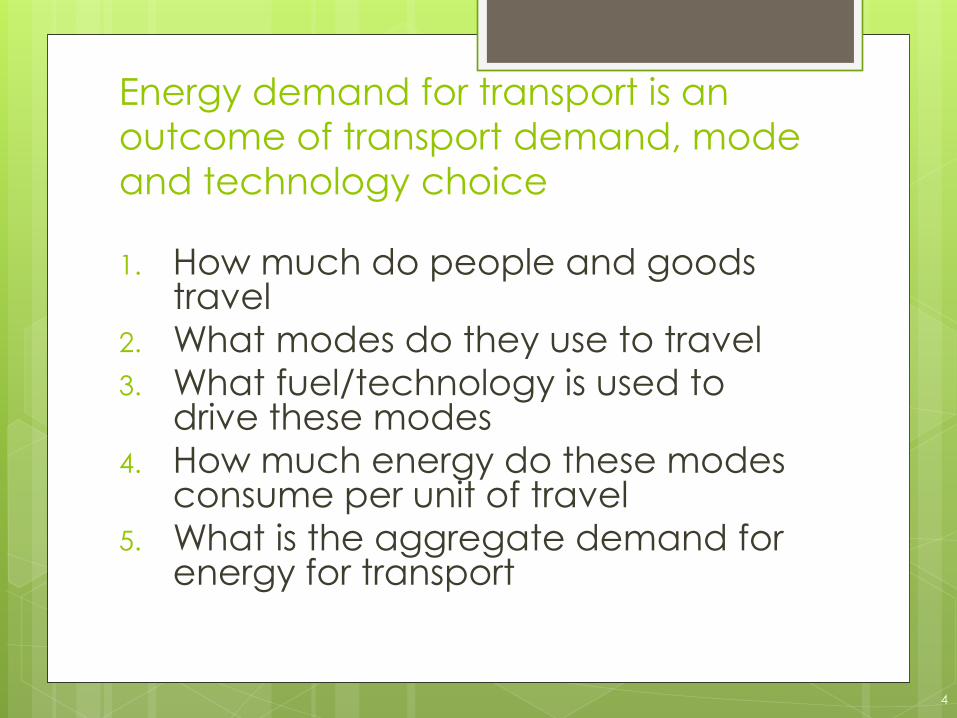
Energy demand for transport is an
outcome of transport demand, mode
and technology choice
1. How much do people and goods travel
2. What modes do they use to travel
3. What fuel/technology is used to drive these modes
4. How much energy do these modes consume per unit of travel
5. What is the aggregate demand for energy for transport
4

Bottom-up transport demand
estimation
Passenger
Vehicle types
Utilizations
Occupancies
Technologies
Efficiencies
5
Activity Mode Share
Intensity Fuel Mix
ASIF Framework
Freight
Vehicle types
Utilizations
Loadings
Technologies
Efficiencies

An example of the bottom up transport
demand and energy estimation
Estimating passenger transport demand met by cars
Total volume of registered cars (-) life of vehicles = total volume of on-road cars (x) Daily utilization of cars (km) (x) Fleet utilization – avg. percentage of cars being used
daily (%)
(x) Occupancy (Average no. of passengers) = PASSENGER KILOMETERS generated on cars
Segregating this number by vehicle fuel efficiencies give the resulting fuel used, and thereby the energy
6
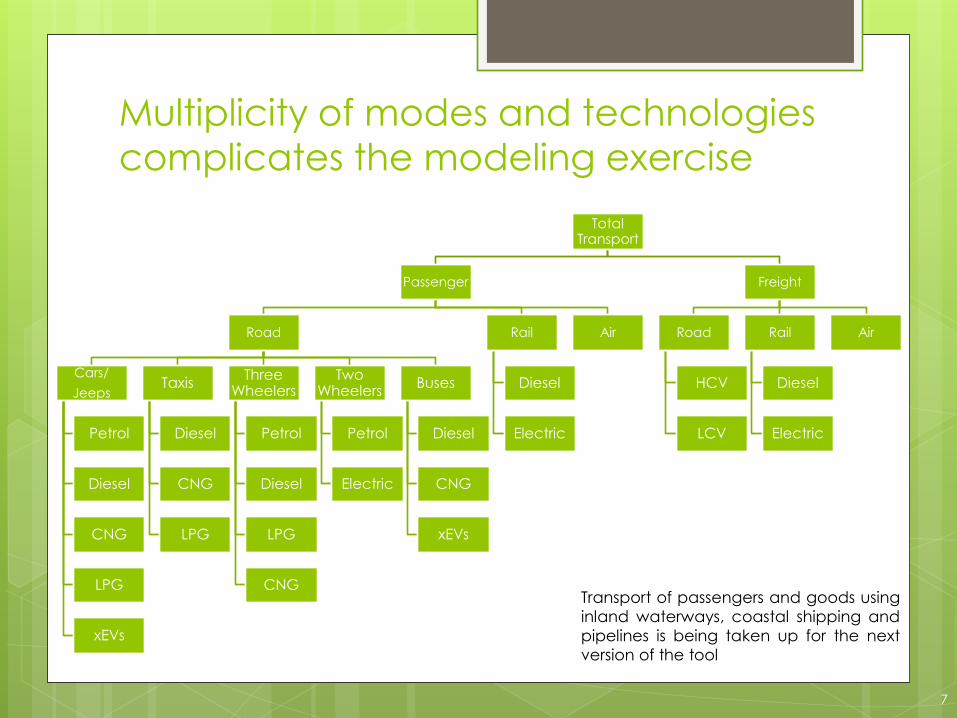
Total Transport
Passenger
Road
Cars/
Jeeps
Petrol
Diesel
CNG
LPG
xEVs
Taxis
Diesel
CNG
LPG
Three Wheelers
Petrol
Diesel
LPG
CNG
Two Wheelers
Petrol
Electric
Buses
Diesel
CNG
xEVs
Rail
Diesel
Electric
Air
Freight
Road
HCV
LCV
Rail
Diesel
Electric
Air
Multiplicity of modes and technologies
complicates the modeling exercise
7
Transport of passengers and goods using
inland waterways, coastal shipping and
pipelines is being taken up for the next
version of the tool
Model outcome Estimates of transport demand and energy
8
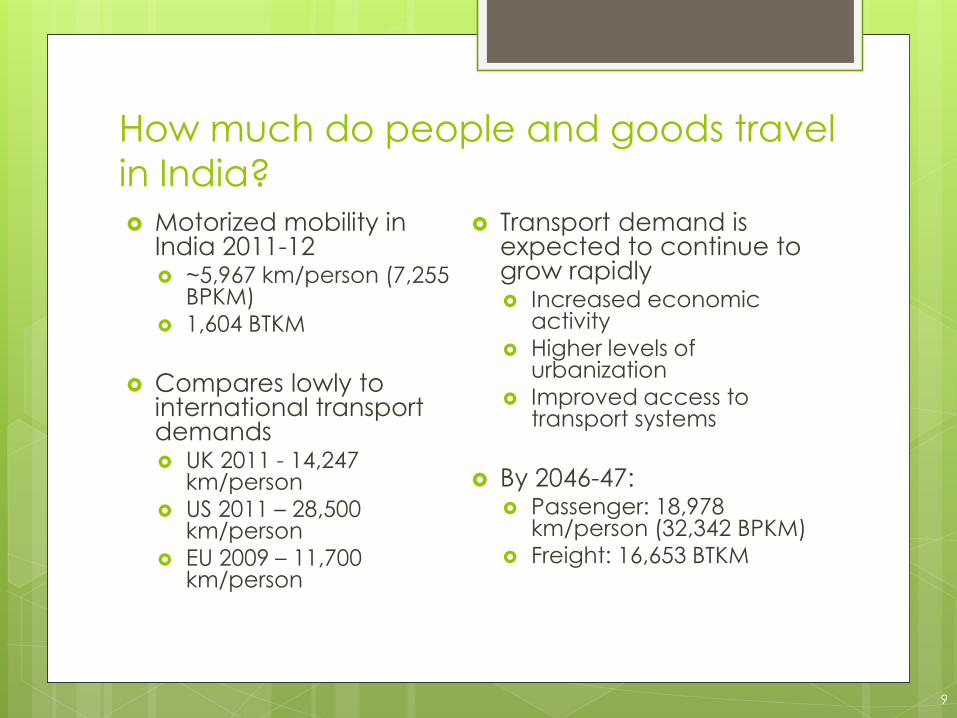
How much do people and goods travel
in India? Motorized mobility in
India 2011-12 ~5,967 km/person (7,255
BPKM) 1,604 BTKM
Compares lowly to international transport demands UK 2011 - 14,247
km/person US 2011 – 28,500
km/person EU 2009 – 11,700
km/person
Transport demand is expected to continue to grow rapidly Increased economic
activity Higher levels of
urbanization
Improved access to transport systems
By 2046-47: Passenger: 18,978
km/person (32,342 BPKM) Freight: 16,653 BTKM
9
0
100
200
300
400
500
600
2012 2017 2022 2027 2032 2037 2042 2047
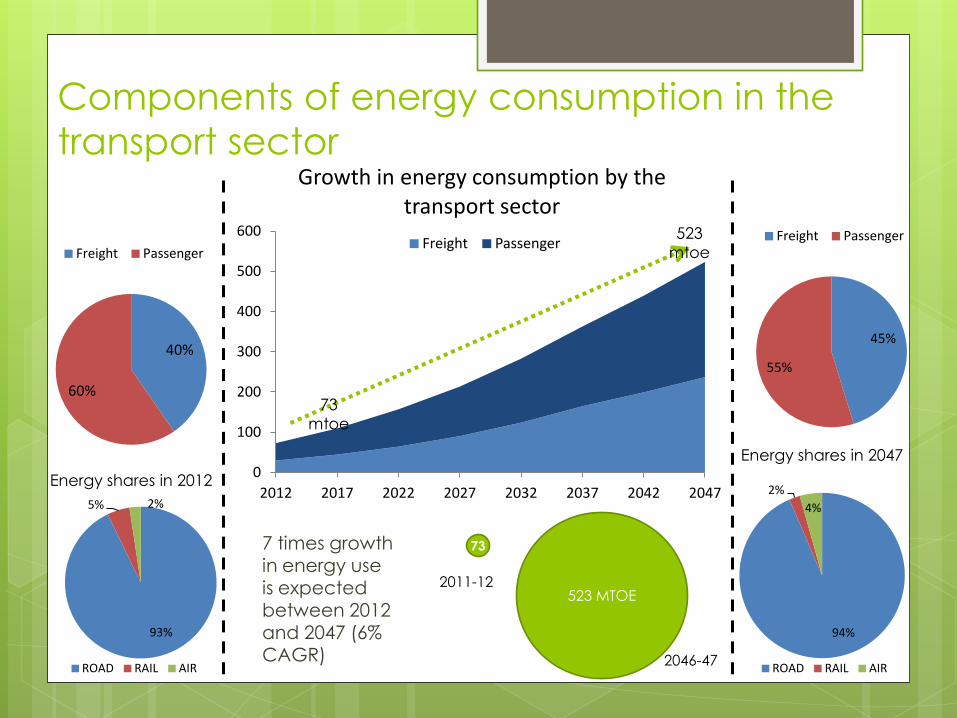
Growth in energy consumption by the transport sector
Freight Passenger
Components of energy consumption in the
transport sector
7 times growth in energy use
is expected between 2012 and 2047 (6% CAGR)
40%
60%
Freight Passenger
45%
55%
Freight Passenger
Energy shares in 2012
Energy shares in 2047
73
mtoe
523
mtoe
93%
5% 2%
ROAD RAIL AIR
94%
2%
4%
ROAD RAIL AIR
73
523 MTOE 2011-12
2046-47
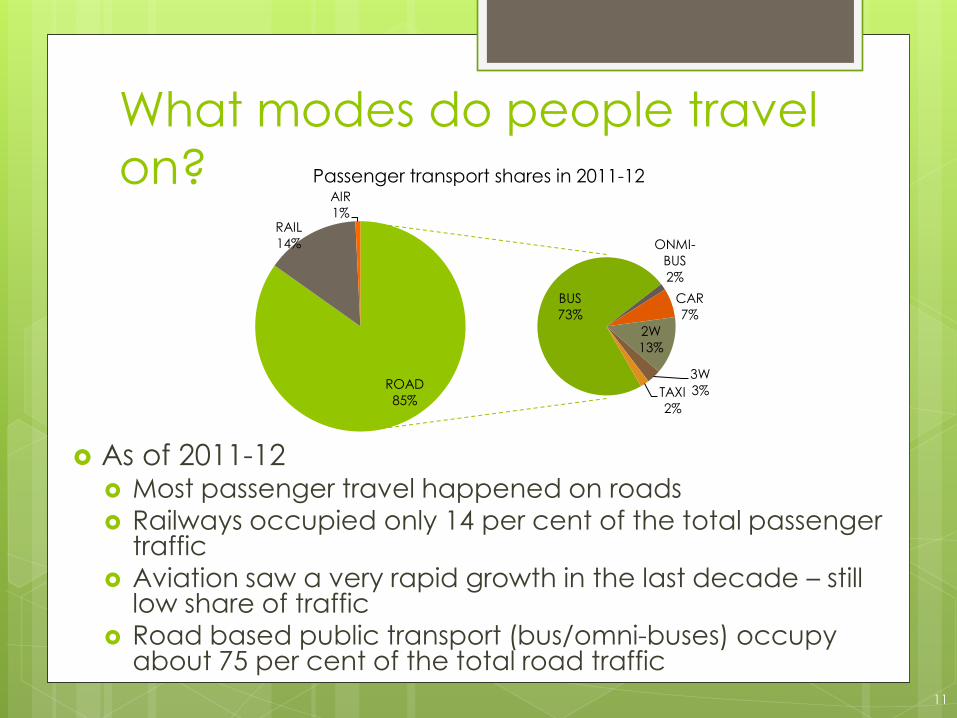
What modes do people travel
on?
As of 2011-12 Most passenger travel happened on roads
Railways occupied only 14 per cent of the total passenger traffic
Aviation saw a very rapid growth in the last decade – still low share of traffic
Road based public transport (bus/omni-buses) occupy about 75 per cent of the total road traffic
11
ROAD
85%
RAIL
14%
AIR
1%
BUS
73%
ONMI-
BUS
2%
CAR
7%
2W
13%
3W
3% TAXI
2%
Passenger transport shares in 2011-12
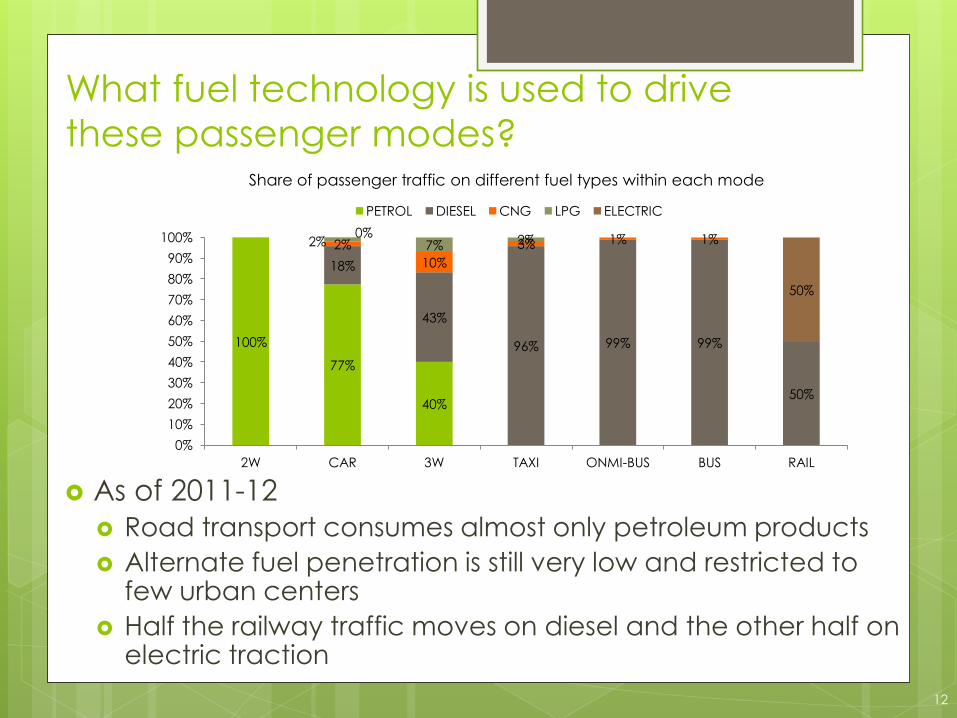
What fuel technology is used to drive
these passenger modes?
As of 2011-12
Road transport consumes almost only petroleum products
Alternate fuel penetration is still very low and restricted to few urban centers
Half the railway traffic moves on diesel and the other half on electric traction
12
100%
77%
40%
18%
43%
96% 99% 99%
50%
2%
10%
3% 1% 1% 2% 7% 2% 0%
50%
0%
10%
20%
30%
40%
50%
60%
70%
80%
90%
100%
2W CAR 3W TAXI ONMI-BUS BUS RAIL
Share of passenger traffic on different fuel types within each mode
PETROL DIESEL CNG LPG ELECTRIC
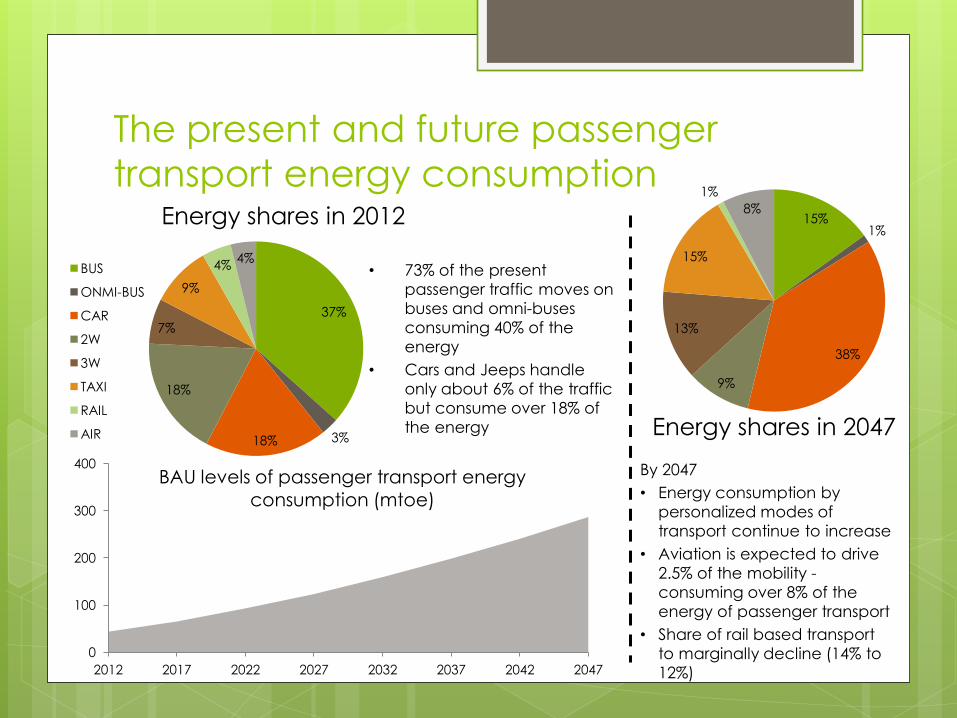
The present and future passenger
transport energy consumption
37%
3% 18%
18%
7%
9%
4% 4%
BUS
ONMI-BUS
CAR
2W
3W
TAXI
RAIL
AIR
15% 1%
38%
9%
13%
15%
1%
8% Energy shares in 2012
Energy shares in 2047
0
100
200
300
400
2012 2017 2022 2027 2032 2037 2042 2047
BAU levels of passenger transport energy
consumption (mtoe)
• 73% of the present
passenger traffic moves on
buses and omni-buses
consuming 40% of the
energy
• Cars and Jeeps handle
only about 6% of the traffic
but consume over 18% of
the energy
By 2047
• Energy consumption by
personalized modes of
transport continue to increase
• Aviation is expected to drive
2.5% of the mobility - consuming over 8% of the
energy of passenger transport
• Share of rail based transport
to marginally decline (14% to
12%)

Creating Energy Security
Scenarios Various types of scenarios created for the
Indian Energy Security Scenarios 2047 tool

Methods of reducing energy demand
for passenger transport considered
Considered four possible ways of reducing the energy demand for passenger transport
1. Reducing the total demand for passenger mobility Better planning and strategic urban development to cut
down travel
2. Shifting mobility to more energy efficient modes Mode shift from air and road to rail based transport
3. Increasing the share of road based public transport More urban bus services and introduction of transport
demand measures to reduce private vehicle use
4. Introduction of energy efficient road vehicles Increasing the energy efficiency of private road vehicles
by introduction of electric, hybrid and fuel cell vehicles
15
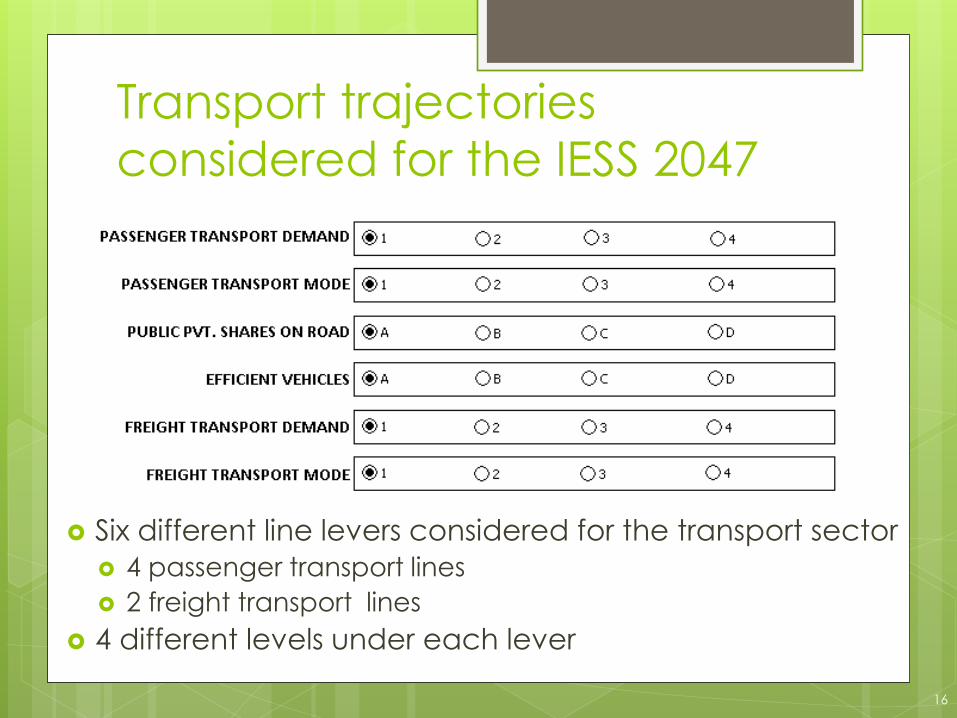
Transport trajectories
considered for the IESS 2047
Six different line levers considered for the transport sector
4 passenger transport lines
2 freight transport lines
4 different levels under each lever
16

Reducing levels of passenger
transport demand Four levels of passenger transport demand considered
Level 1: Business as usual levels of demand
Increased economic growth, increased access to transport
Continuous increase in the annual distance travelled per person
Level 2: Moderate effort (~10% demand reduction)
Increase in the number of activity centers across the country
Increasing urbanization leading to reduced migration trips
A reduction of per capita mobility demands in smart cities
Level 3: Dedicated effort (~20% demand reduction)
Aggressive use of ITES applications reducing the demand for travel
Corporate and industrial personnel travel planning
Level 4: Herculean effort (~30% demand reduction)
Herculean effort scenario, with incentive schemes to reduce commute trips
Work – residence – recreation trips better organized to reduce travel demand
17
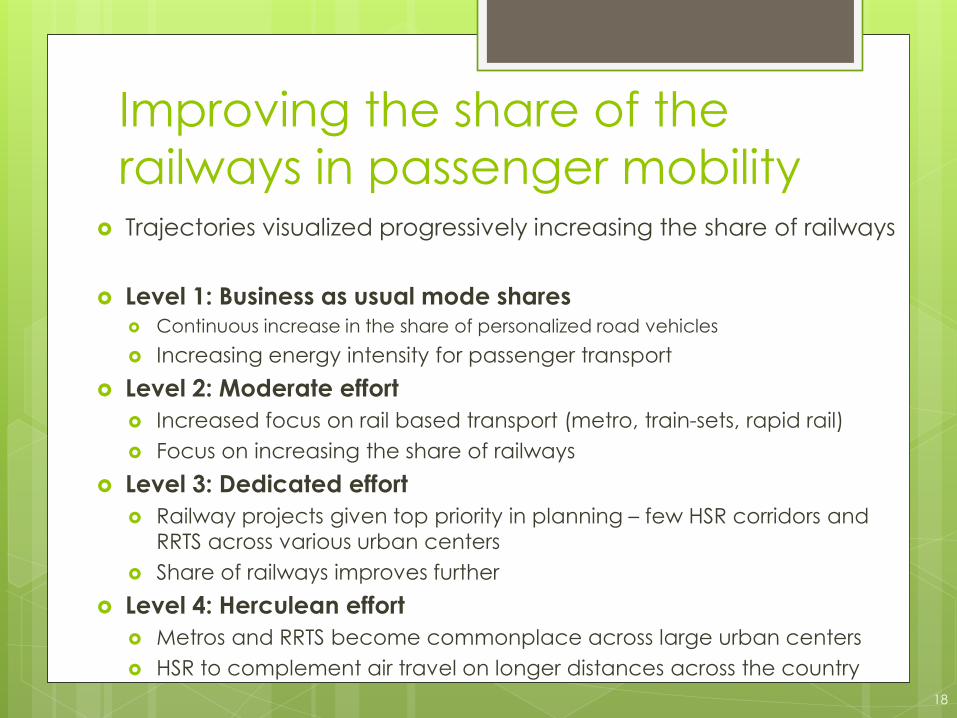
Improving the share of the
railways in passenger mobility Trajectories visualized progressively increasing the share of railways
Level 1: Business as usual mode shares Continuous increase in the share of personalized road vehicles
Increasing energy intensity for passenger transport
Level 2: Moderate effort
Increased focus on rail based transport (metro, train-sets, rapid rail)
Focus on increasing the share of railways
Level 3: Dedicated effort
Railway projects given top priority in planning – few HSR corridors and
RRTS across various urban centers
Share of railways improves further
Level 4: Herculean effort
Metros and RRTS become commonplace across large urban centers
HSR to complement air travel on longer distances across the country
18
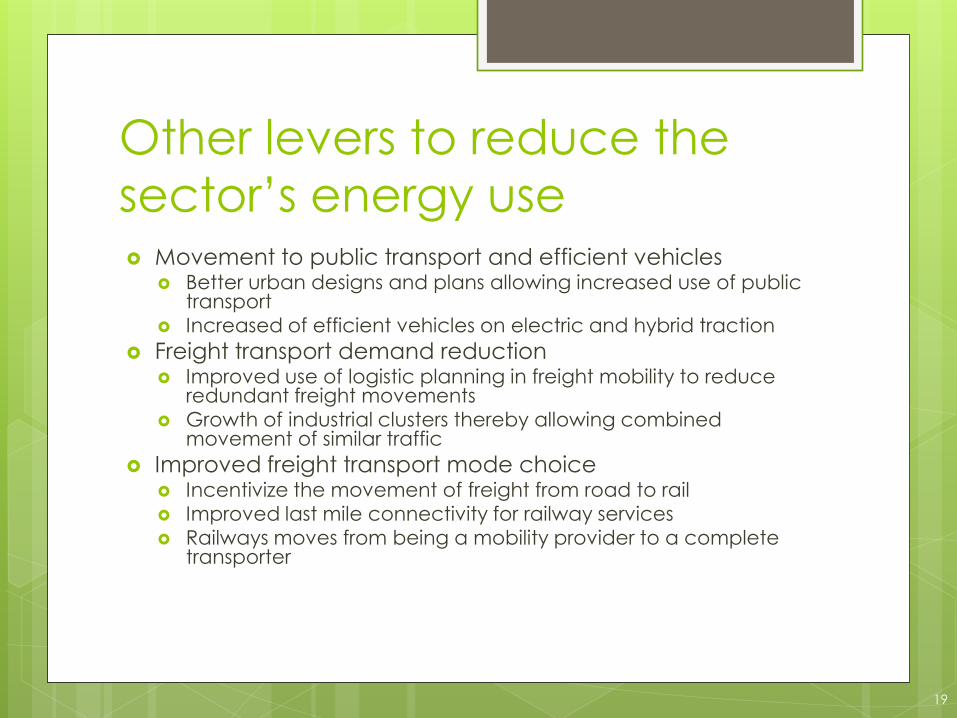
Other levers to reduce the
sector’s energy use Movement to public transport and efficient vehicles
Better urban designs and plans allowing increased use of public transport
Increased of efficient vehicles on electric and hybrid traction
Freight transport demand reduction Improved use of logistic planning in freight mobility to reduce
redundant freight movements
Growth of industrial clusters thereby allowing combined movement of similar traffic
Improved freight transport mode choice Incentivize the movement of freight from road to rail
Improved last mile connectivity for railway services
Railways moves from being a mobility provider to a complete transporter
19
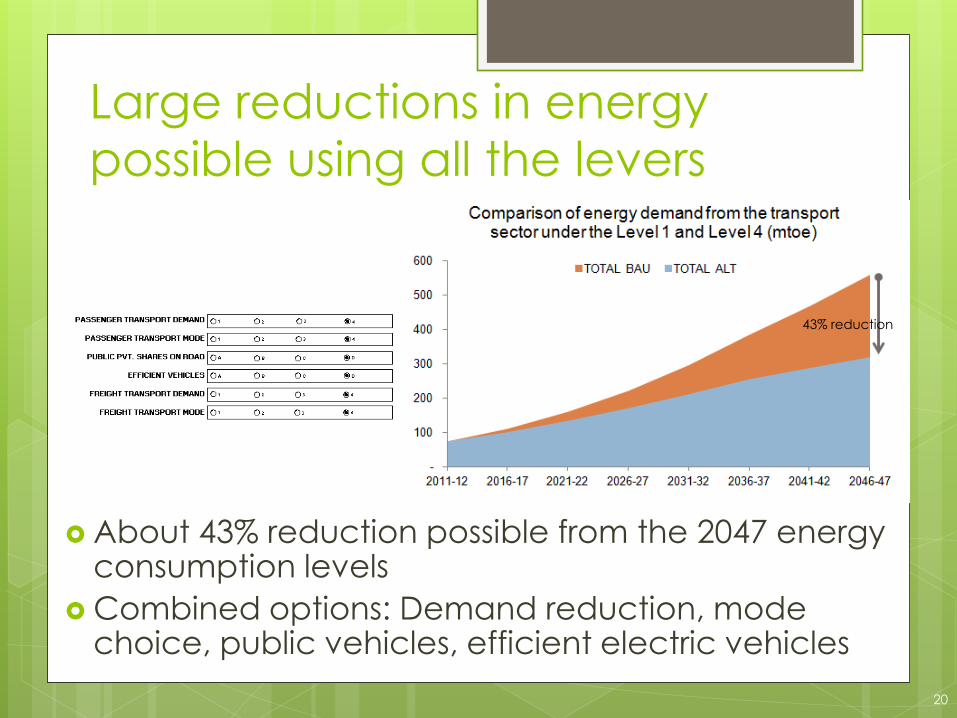
Large reductions in energy
possible using all the levers
About 43% reduction possible from the 2047 energy consumption levels
Combined options: Demand reduction, mode choice, public vehicles, efficient electric vehicles
20
43% reduction
Limitations, lessons learnt
and the way forward Outlining the issues for building activity based
transport sector energy and emissions estimation
models
21

Limitations of the activity based energy
estimation methodology
Methodology useful for a closed system
such as the domestic transport sector
Difficult to implement under porous
systems such as states or cities/urban
centers
Difficult to determine appropriate boundary
conditions for non-stationary sector like
transport
Requires a large number of data items
to increase the robustness of the model 22

Lessons learnt from developing a transport
demand and energy estimation model
Useful methodology for estimating impacts of
mode and technology choice changes at a
macro-national level
Tool is easily customizable to evaluate the
impacts of various kinds of policies/programs
Acute limitation in the availability of data
related to transport use in India
Identified a very long list of data items that
could be useful for increasing the robustness
of the model
23
Way forward
Increase the use of such scientific methods in making infrastructure investment choices
Possible to incorporate costs and pricing
Fine tune methodology to also develop state, regional and city level energy emissions transport models
Start incentivizing different transport related agencies for collecting various data items
Need to put in place systems to regularly collect transport activity related data at all levels (urban, rural, intercity)
24
THANK YOU
For more information on Transport Modeling exercise: [email protected]
India Energy Security Scenarios 2047: http://indiaenergy.gov.in/
25