CONNECTIVITY OF THE HUMAN WORKING MEMORY SYSTEM … · CONNECTIVITY OF THE HUMAN WORKING MEMORY...
148
CONNECTIVITY OF THE HUMAN WORKING MEMORY SYSTEM by CARLOS CESAR FARACO (Under the Direction of L. Stephen Miller) ABSTRACT The working memory system is vital to performing everyday functions that require attentive, non-automatic processing of information. Cortical regions associated with the human working memory system have been determined through postmortem investigation of lesioned brains, through neuropsychological studies of lesioned patients, and most recently through neuroimaging of healthy and patient populations. Regions typically involved in working memory are the prefrontal cortex (PFC), anterior cingulate cortex (ACC), superior parietal lobule (SPL), and inferior parietal lobule (IPL). However, much less is known about the structural connectivity of this system. To attempt to characterize this, fMRI was performed on participants while they performed the operation span (OSPAN) task. Regions of activation were then used as seeds and targets for DTI based tractography. Activated regions were in accordance with those typically found in the literature. Structural connectivity was observed mainly through the superior longitudinal fasciculus II (SLF II) and the fronto-occipital fasciculus (FOF). INDEX WORDS: Working memory, Operations span (OSPAN), Functional magnetic resonance imaging (fMRI), Diffusion tensor imaging (DTI), White matter, Superior longitudinal fasciculus (SLF), Fronto-occipital fasciculus (FOF)
Transcript of CONNECTIVITY OF THE HUMAN WORKING MEMORY SYSTEM … · CONNECTIVITY OF THE HUMAN WORKING MEMORY...

CONNECTIVITY OF THE HUMAN WORKING MEMORY SYSTEM
by
CARLOS CESAR FARACO
(Under the Direction of L. Stephen Miller)
ABSTRACT
The working memory system is vital to performing everyday functions that require
attentive, non-automatic processing of information. Cortical regions associated with the human
working memory system have been determined through postmortem investigation of lesioned
brains, through neuropsychological studies of lesioned patients, and most recently through
neuroimaging of healthy and patient populations. Regions typically involved in working memory
are the prefrontal cortex (PFC), anterior cingulate cortex (ACC), superior parietal lobule (SPL),
and inferior parietal lobule (IPL). However, much less is known about the structural connectivity
of this system. To attempt to characterize this, fMRI was performed on participants while they
performed the operation span (OSPAN) task. Regions of activation were then used as seeds and
targets for DTI based tractography. Activated regions were in accordance with those typically
found in the literature. Structural connectivity was observed mainly through the superior
longitudinal fasciculus II (SLF II) and the fronto-occipital fasciculus (FOF).
INDEX WORDS: Working memory, Operations span (OSPAN), Functional magnetic
resonance imaging (fMRI), Diffusion tensor imaging (DTI), White matter,
Superior longitudinal fasciculus (SLF), Fronto-occipital fasciculus (FOF)

CONNECTIVITY OF THE HUMAN WORKING MEMORY SYSTEM
by
CARLOS CESAR FARACO
B.A., Florida International University, 2003
A Thesis Submitted to the Graduate Faculty of The University of Georgia in Partial Fulfillment
of the Requirements for the Degree
MASTER OF SCIENCE
ATHENS, GEORGIA
2009

© 2009
Carlos Cesar Faraco
All Rights Reserved

CONNECTIVITY OF THE HUMAN WORKING MEMORY SYSTEM
by
CARLOS CESAR FARACO
Major Professor: L. Stephen Miller Committee: Steven Beach Nathan Yanasak Qun Zhao Electronic Version Approved: Maureen Grasso Dean of the Graduate School The University of Georgia December 2009

iv
ACKNOWLEDGEMENTS
I would just like to thank everybody that lent a hand through all the stages of this project;
beginning with my undergraduate assistants, Devin Smith and John Evan Mackey, who were
greatly involved in the data collection process and made my life just a little easier during the
initial stages of the project. To Stephen Miller, who is my major advisor and provided advice
when he could on the DTI modality used in this project, which was a first for the BIRC and
UGA, and who also granted me the hours, along with the BIRC SAC, to conduct this study. To
Qun Zhao and Jason Langley, who patiently put up with my relentless MRI related and
theoretical physics questions. To Nash Unsworth, for introducing me to the OSPAN task and
whom I also hounded several times as to the differences between the endless working memory
models and what those differences actually mean. Special thanks go out the FSL developers and
the members of the FSL listserv, without these two resources I would definitely not have been
able to complete this project. Also, many special thanks to Nathan Yanasak, who originally
convinced me to take on this very complicated project. Last, but definitely not least, thanks to
Kim Mason for being the best MRI tech, ever, her support during this process, and her many
endless and seemingly unrelated stories which often served as good distracters. It was a long,
difficult road, but I have definitely learned much about MRI, and also myself, in the process.

v
TABLE OF CONTENTS
Page
ACKNOWLEDGEMENTS........................................................................................................... iv
LIST OF FIGURES ...................................................................................................................... vii
LIST OF TABLES....................................................................................................................... viii
CHAPTER
1 INTRODCUTION AND LITERATURE REVIEW ...............................................1
Working Memory.....................................................................................................4
Working Memory Tasks Used in the Clinic ..........................................................12
Working Memory Task Used in the Laboratory....................................................13
Deficits in Select Clinical Populations; Working Memory and Related Executive
Functions....................................................................................................14
Neuroimaging Findings in Clinical Populations....................................................26
Brain Regions Involved in Working Memory .......................................................28
Purpose of Study ....................................................................................................30
References..............................................................................................................32
2 METHODS ............................................................................................................49
Participants.............................................................................................................49
Measures ................................................................................................................49
Task and Stimulus Presentation .............................................................................50
Imaging ..................................................................................................................51
Procedure ...............................................................................................................51

vi
Data Analysis .........................................................................................................52
References..............................................................................................................59
3 ELICITING WORKING MEMORY CORTICAL ACTIVITY THROUGH A
COMPLEX SPAN TASK......................................................................................62
Introduction............................................................................................................63
Materials and Methods...........................................................................................69
Discussion..............................................................................................................75
Conclusion..............................................................................................................81
References ..............................................................................................................83
4 STRUCTURAL CONNECTIVITY OF CORTICAL WORKING MEMORY
SPAN REGIONS ...................................................................................................96
Introduction............................................................................................................97
Materials and Methods.........................................................................................101
Results..................................................................................................................105
Discussion............................................................................................................107
Conclusion ...........................................................................................................113
References............................................................................................................116
5 CONCLUSION....................................................................................................132
References............................................................................................................136
APPENDIX
A MRI SAFETY FORM..........................................................................................138

vii
LIST OF FIGURES
Page
Figure 1.1: Cowan’s embedded-processes working memory model .................................47
Figure 1.2: Example BOLD signal after stimulus presentation .........................................47
Figure 1.3: A diffusion tensor ............................................................................................48
Figure 2.1: Working memory task block design................................................................61
Figure 3.1: Working memory task block design................................................................91
Figure 3.2: OSPAN and Arithmetic activation maps.........................................................92
Figure 3.3: Activation map for OPSAN – Arithmetic contrast..........................................93
Figure 4.1: Masks.............................................................................................................126
Figure 4.2: Tractography results ......................................................................................127
Figure 4.3: Superior longitudinal fasciculus tracts...........................................................128
Figure 4.4: Fronto-Occipital Fasciculus tracts .................................................................129

viii
LIST OF TABLES
Page
Table 3.1: Behavioral measures .........................................................................................94
Table 3.2: Sites of activation; OSPAN – Arithmetic .........................................................94
Table 3.3: Positive correlations..........................................................................................95
Table 3.4: Negative correlations ........................................................................................95
Table 4.1: Associative/Inter-lobar fiber tracts..................................................................130
Table 4.2: Intra-lobar fiber tracts .....................................................................................131

1
CHAPTER 1
INTRODUCTION AND LITERATURE REVIEW
The working memory system is arguably one of the most important to human cognition
and is essential for everyday functioning, appropriate social interaction, and maintenance of an
independent lifestyle. A dysfunctional working memory system leads to a variety of related
deficits such as reduced attentional capacity (increased susceptibility to interference), inability to
multi-task, inability to transfer items currently in the focus of attention to long term memory,
difficulty in learning new materials, problems with delayed responses, among others ((Lezak,
Howieson, Loring, 2004, pp, 80-82). Such deficits, for example, are observed in patients with
Alzheimer’s disease (AD) throughout the progression of the disease. One of the characteristics of
AD is atrophy of the parietal lobes (e.g., Davatzikos, Resnick, Wu, Pampri, & Clark, 2008;
Lehéricy, Marjanska, Mesrob, Sarazin, Kinkingnehun, 2007), which have been shown to be a
key component of working memory, mainly involved in the storage and manipulation of
information currently in the focus of attention (Champod & Petrides, 2007; McNab & Klingberg,
2008).
The cortical regions associated with some of these deficits, and therefore working
memory, have mainly been discovered through methods of anatomical investigation that are able
to note structural abnormalities, such as postmortem investigation (e.g., Braak, Braak, & Bohl,
1993; Delacourte et al., 1999; Huesgen, Burger, Craw, & Johnson, 1993; Kung & Roberts, 1999;
Roberts, Roche, & Conley, 2005) Magnetic Resonance Imaging (MRI; e.g., Chetelat & Baron,
2003; Jack et al., 2002; Onitsuka et al., 2006; Silbert et al., 2003), and functional studies of the
brain using neuroimaging techniques such as functional MRI (fMRI) and Positron Emission

2
Tomography (PET; e.g., Haznedar et al., 2004; Mosconi, 2005; Small et al., 2006; Yetkin,
Rosenberg, Weiner, Purdy, & Cullum, 2006; Zedkova, Woodward, Harding, Tibbo, & Purdon,
2006). For example, a review of the neuroimaging literature (Wager & Smith, 2003) has
indicated that the dorsolateral prefrontal cortex (DLPFC) is involved in executive functions
while the ventrolateral prefrontal cortex is involved in processes related to storage. Brodmann
area 7 (in the parietal lobe) is thought to be involved in maintaining and organizing items held in
the working memory store (Wendelken, 2008). Knowledge of the role of white matter structures
in human cognition, however, is somewhat limited and has typically been derived from invasive
tracer and autoradiographic studies of non-human animals (e.g., Petrides & Pandya, 1984, 2006;
Schmahmann et al., 2007; Van Essen, Newsome, Maunsell, & Bixby, 1986). Knowledge gained
from animal studies, however, may be of limited use when applied to a highly specialized human
cognitive function such as working memory.
Within the past few years, the MRI-based modality known as diffusion tensor imaging
(DTI) has become increasingly important in the neuroimaging community. DTI depends on strict
mathematical, theoretic constructs in conjunction with the MRI technique of diffusion weighted
(DW) imaging, and utilizes tensor information to represent the diffusion properties of water
within tissue (e.g., Melhem et al., 2002). The diffusion characteristics of water are affected by
the structures and the properties of the structures containing it. For example, in the brain
diffusion is very anisotropic, or non-spatially uniform, in areas of white matter, as it is composed
of highly structured bundles of axons (Le Bihan et al., 2001). A variety of other factors may also
play a role in influencing the direction and rate of diffusion, but it is believed the greatest impact
on diffusion may occur due to the tight packing of fibers and the inherent properties of the cell
membranes (Beaulieu, 2002). The fatty composition, and therefore hydrophobic nature, of the
myelin sheath was originally thought to be the most influential factor in the diffusion

3
characteristics of white matter tissue, but examination of non-myelinated garfish olfactory nerves
demonstrated it was not as relevant as once thought (Beaulieu and Allen, 1994). The intra-axonal
supporting structures of the neurons, the neurofibrils, are thought to significantly influence tissue
diffusion characteristics, especially within the neurons themselves. Given that tissue properties
influence diffusion properties, the diffusion information yielded by the tensors (axes and rate of
diffusion) informs us of the general tissue structure within a given region of interest. DTI
therefore allows us to infer the white matter tracts linking different regions (structural
connectivity) through measures such as fractional anisotropy (FA), which indicates the degree to
which diffusion is restricted, and tractography, which is thought to track neural fiber bundles
based on the directional information provided by the diffusion tensor.
White matter maps of the human brain have already been produced using information
gained from DTI (e.g., Mori, Wakana, Nagae-Poetscher, van Zijl, 2005). Even though such maps
are crucial to the development of anatomical knowledge of the human brain, they do not
necessarily inform us of the role of white matter in cognition. A logical next step in the advance
of neuroimaging techniques would be to use the information gained from DTI to determine the
structural connectivity or integrity of brain regions involved in specific cognitive processes. One
method that can yield such information is the combination of DTI tractography and fMRI
modalities. In this method fMRI-defined ROIs are used as seeding and target points for DTI-
based tractography (e.g., Conturo, et al., 1999; Lanyon et al. 2009; Saur et al., 2008; Yang et al.,
2009). As previously stated, the working memory system is crucial to a variety of aspects
necessary for normal, independent function. Brain regions associated with the working memory
system have been designated through a number of methods including fMRI. Even though maps
of the human white matter system have been developed (e.g., Hagmann et al., 2006; Mori et al),
the specific structural connectivity network of this cognitive system is not yet known. By using

4
fMRI to determine the cortical areas involved in a complex working memory span task, such as
the operation span (OSPAN) task, and using these regions as seed and target points for DTI
based tractography, one could begin to map out what is likely a complex, interconnected network
from which the individual cognitive processes involved in working memory emerge. This map
could then be detailed with anisotropy and connectivity strength measures. Such a detailed map
could prove to be a useful diagnostic and treatment tool for patients exhibiting working memory
dysfunction. A patient’s overall connectivity between these regions, or anisotropy measures in
grey and white matter regions, could be compared to the map to determine where impairment
may be originating. Knowledge of dysfunctional connectivity in a region would allow for more
efficacious treatments. For example, therapies such as induced neurogenesis could be directed to
the abnormal brain region.
Working Memory
The concept of a limited capacity memory system for objects in immediate attention has
at least been around since Ebbinghaus’ (1885/1964) description of his limited capacity to recall
nonsense syllables. James (1890) was the first to propose a distinction between this limited
capacity store, termed primary memory (what is now working memory), and a more permanent,
unlimited store, termed secondary memory (what is now long term memory). Atkinson &
Shiffrin (1968) appear to have been the first to develop a theory of how the working memory
system may be structured. They proposed a three component system, by which information is
input through the sensory registers into a short-term store (STS), where it can be manipulated
(working memory) and then possibly directed into the long term store (LTS). Information fed
into STS can also be retrieved from that already in LTS, such as when someone is calling a
certain set of information into attention, or consciousness. The manipulations (control processes)
applied to the information in the STS and the consequent flow of information through the

5
memory system are believed to be controlled by the individual. Therefore, the manipulation, or
calling, of information into attention can best be thought of as “the flow of information into and
out of short-term storage, and the subject’s control of that flow” (Atkinson & Shiffrin, 1971). As
such, performance on tasks, or everyday events, is highly dependent on the controlled processes
employed by the individual. For example, the control process of rehearsal is believed to be one
of the most influential in respect to information maintenance in STS. In one experiment
(Atkinson & Shiffrin, 1971), subjects were presented with a list of words and the method of
rehearsal was directly manipulated. Subjects either rehearsed the most recently viewed item three
times before presentation of the next or they maintained a three item rehearsal set in which the
first word was rehearsed three times, the next word was rehearsed once with the first being
rehearsed twice, and so on until the rehearsal set consisted of three distinct words. A delayed-
recall test given at the end of the experiment indicated that the number of rehearsals for a given
word was closely related to the ability of the subject to recall that word from LTS. Results also
demonstrated that the recency effect appeared in both conditions after each trial indicating that
even when items are dropped from rehearsal (the one item rehearsal set) it takes a certain amount
of time for their trace to become extinct from STS.
Atkinson and Shiffrin emphasized the idea that memories, or memory traces, are lost
from these systems (mainly the sensory registers and STS) through the process of decay. As a
result, when information is transferred to another component of the system, for example from
one of the sensory stores to STS, the information is copied to STS and becomes non-existent in
the sensory store through decay, not deletion as a result of transfer. Inability to access memories
from LTS, on the other hand, is not as much of a matter of the information having decayed from
LTS, but is most probably due to a deficient search process. In other words, and as stated above,
information is called from LTS to STS through activating a portion of the information in LTS

6
given certain search criteria; if these criteria are incorrect the proper subset of information in
LTS will not be activated (copied into STS) and another search may ensue. The new search may
be modified by the subject depending on their given strategy or may also be deficient in that it
may use the same probe/s, or criteria, as the first search.
Since Atkinson and Shiffrin’s model is highly dependent on the idea that information
enters LTS through the control processes employed by the individual on the information in STS,
it is suggested that if individuals exhibited deficits in STS they would consequently show deficits
in LTS. In a study by Baddeley and Hitch (1974) the availability of subjects’ short-term memory
was depleted and resulted in noticeable deficits in LTM, but not as significant as would have
been suggested by Atkinson and Shiffrin's model. Baddeley and Hitch therefore proposed a three
component model of working memory, which became the most widely accepted of the models
for some time. It consists of the central executive, a control system with limited attentional
ability that is supported by the phonological loop and the visuospatial sketchpad.
The phonological loop is the verbal component of Baddeley and Hitch's (1974) three
component model of working memory and is the one of which the most is known. It consists of a
phonological store (a STM store of limited capacity) and a sub-vocal process which can be used
to rehearse the information within the phonological store. The phonological loop is able to store
only a limited amount of verbal information for a limited period, but information can be retained
for longer periods if rehearsed. Functioning of the phonological store can be assessed through the
recall of similar and dissimilar letters, sounds, or words. It has been shown that subjects'
performance decreases when they are presented with items which are phonologically similar,
otherwise known as the acoustic similarity effect (Conrad & Hull, 1964; Baddeley, 1966).
Function of the rehearsal mechanism is assessed through the presentation of longer words.
Baddeley, Thomson, and Buchanan (1975) were able to show that recall of words dropped from

7
90% for two syllable words, to 50% for five syllable words. This significant decrease is thought
to occur mainly because longer words require more time to rehearse, leading to decay of memory
traces for the words, and therefore forgetting.
The visuospatial sketchpad is the equivalent of the phonological loop for visually
presented material. The main difference being the sketchpad does not possess a rehearsal
mechanism. Additionally, since objects are located in a position within space, the visuospatial
sketchpad is able to store and manipulate object location. For example, the sketchpad is involved
in many daily activities such as visualizing the spatial layout of a home and the various locations
where objects may have been stored. Interestingly, some research studies and
neuropsychological measures suggest that visual and spatial information are stored separately, as
evidenced by performance on spatial tasks being disrupted more by spatial interference than
visual interference and vice versa (e.g., Della Sala, Gray, Baddeley, Allamano, & Wilson, 1999).
The central executive is believed to be the system which guides attentional control, and as
such, is thought to play a role in such behaviors as set-shifting, regulating inhibition, planning,
and manipulating information (Baddeley, 1996; Baddeley, 2003). These are higher order
cognitive functions that are thought to regulate lower level processes and be involved in goal
directed behaviors (Alvarez & Emory, 2006), otherwise known as executive functions. These
functions, especially the manipulation of information, are key to the concept of working
memory. Through these functions, the central executive is thought to direct experiences into long
term memory.
Baddeley (2000) recently modified the Baddeley and Hitch (1974) model to include
another component called the episodic buffer. The episodic buffer is believed to function
similarly to the phonological loop and visuo-spatial sketchpad in the sense that it is a limited
capacity store, but is believed to surpass the ability of these two in that it can integrate

8
information from different modalities (Baddeley, 2000). The episodic buffer was added to
account for: 1) the finding that articulatory suppression does not have as great of an impact on
the recall of visually presented numbers as would be expected; 2) the process of chunking, in
which information from LTM is used to group the information being attended to into more easily
manageable portions, allowing for greater recall of information (the prose recall problem; the
problem of how the information interacts with information in LTM); 3) the problem of storage
and rehearsal, whereby it is difficult to explain how in the phonological loop rehearsal and
storage can occur in the same location; and 4) the binding problem, in which different types of
sensory and/or cognitive information are integrated to form a more complete perception or
understanding; such as linking information from sensory modalities (vision and hearing) and
integrating visual or auditory information with that residing in LTM (Roskies, 1999). Baddeley
(2000) also proposed the episodic buffer is involved in linking separate elements of information
residing in LTM, as well as linking these elements with any new information residing in the
working memory system. The process of linking allows for more efficient problem solving and
the formation of new environmental representations. However, the problem with proposing a
component that is capable of accomplishing all these goals is that it appears to eliminate the need
for separate verbal and visuo-spatial stores; this seems to lead us back to a two-store model of
working memory. Even though Baddeley and Hitch’s description of working memory became
the standard since it was proposed in 1974, quite a few different working memory mechanisms
have been proposed since then, some using Atkinson and Shiffrin’s model as a basis.
One of the more well known models is Cowan’s (1988, 1999) embedded processes model
(Fig. 1). Here, the emphasis is placed more on the process of attention and its relation to working
memory capacity, rather than on a specific template of the structure and interaction of the
components that constitute the system, as is evidenced by his formulation of working memory.

9
Cowan (2005) has structured his model and view of working memory as such because he
believes it is an exhaustive formulation. Cowan’s model proposes that working memory is the
portion of LTM that has been activated through certain sensory perceptions and that a specific
subset of that, the “focus of attention,” is what we are currently perceiving. This focus of
attention is being controlled, or manipulated, by the central executive and is also subject to the
influence of environmental stimuli. Working memory capacity differences between individuals
stem from their ability to keep their focus of attention on the task at hand while suppressing
interference from environmental stimuli or the activation of other regions of LTM caused by
irrelevant cognitions. In other words, even though environmental stimuli may activate other
networks present within LTM, the individual’s executive processes must keep the focus of
attention on the current subset of activated memory for optimal task performance. Since attention
is being directed at a specific network of processes, the activation of other portions of LTM by
external stimuli is believed to be an automatic process. Automatic processing, however, is
believed to occur only for the physical features of the stimuli, while semantic processing requires
this information to enter into the focus of attention (Conway, Cowan, & Bunting, 2001); if the
physical features are processed as a discrepancy through one of the networks, attention may be
directed towards the stimulus by an orienting response (Näätänen, Teder, Alho, & Lavikainen,
1992).
Even though, as Cowan (2005) states, “activated memory was meant to serve the same
purpose as Baddeley’s two buffer stores together (phonological and visuospatial), plus any other
buffer stores that might be posited in the future,” there are key differences between the models.
In a review of the capacity limit literature, Cowan (2001) discerned that the capacity limit is due
to significant levels of proactive interference in the focus of attention preventing proper storage
of information in LTM. Stated differently, previous stimuli whose representations are still within

10
the realm of activated memory are being brought into the focus of attention, due to a lack of
controlled attention, and displacing the representations of more current stimuli which are
residing there. The latter occurs because the focus of attention is a limited capacity store.
Another key difference in Cowan’s model, related to the capacity limit, is that increasing the task
load or difficulty assumed by central executive processes, and thereby interfering with the
storage capabilities of the focus of attention, results in overall impaired storage ability. Baddeley
and Hitch’s experiments resulting in findings which led to the proposal of separate storage
systems for phonological and visuo-spatial information may not have strained the central
executive sufficiently to determine whether perception of these types of stimuli depended on
shared resources. In an embedded paradigm designed to test just this, Morey and Cowan (2004)
found that a large verbal memory load consisting of novel information significantly interfered
with performance of a visual-array task. Morey and Cowan (2005) performed a similar
embedded task study in which the verbal load was overtly articulated before or after presentation
of the visual array. Findings indicated that when rehearsal began after presentation of the visual
stimulus, what would be its encoding phase, interference was greater. Together, these findings
demonstrate that excessive task demands on the central executive disrupt storage capabilities.
Engle, Kane, and Tuholski (1999) take a similar approach to Cowan’s in stating that the
“capacity for controlled, sustained attention in the face of interference or distraction” of an
individual is manifested as that individual’s working memory capacity. Even so, they disagree
with Cowan’s view that STM is part of the WM system (it should be noted that within Cowan’s
model STM is termed STS and may have the same distinction as that stated by Atkinson and
Shiffrin). To determine whether STM and WM are distinct memory systems Engle, Tuholski,
Laughlin, and Conway (1999) had participants perform tasks which are seen as valid measures of
WM (operation span, counting span, and reading span) and STM (forward-word spans with

11
similar and dissimilar words and backward-word span with dissimilar words). Structural
equation modeling relating the constructs STM and WM to their respective tasks and to general
fluid intelligence revealed that a two-factor model was a better fit than one having STM equated
with WM. It should be noted though that the two constructs were highly related.
A study by Tuholski (1997) aimed to show whether controlled attention is the essential
factor in determining WM capacity and whether it is also what links WM capacity, general fluid
intelligence, and higher order functions. A speeded counting task was given to high and low WM
span participants (determined so by performance on the operation span task), with vertical
yellow bars as the stimuli. Each trial had a different number of items presented on the screen,
ranging from one to twelve, at random locations. Tuholski hypothesized that high and low span
individuals would not differ significantly in their ability to count up to four objects; it has been
proposed that the short term store is only capable of holding, at the most, four objects (e.g.,
Cowan, 2001). It was hypothesized that when more than four objects were presented, exceeding
the individuals ability to subitize (determine how many objects there are without actually
counting, an “instant” process), high span individuals should perform the task faster. Results
confirmed these hypotheses and also demonstrated that these differences correlated with
measures of general fluid intelligence and WM. In a second experiment, Tulhoski implemented a
controlled counting manipulation by including physically and non-physically similar objects to
the set of stimuli. This manipulation would force controlled counting over the individual’s
subitizing range for the physically similar distractor condition. Results supported this hypothesis
and further demonstrated that controlled attention, in this case the ability to determine how many
and which objects had been counted, is key to WM capacity.

12
Working Memory Tasks used in the Clinic
Neuropsychological assessments examine a variety of cognitive domains. These include
perceptual organization, immediate memory, delayed memory, working memory, language
processing, executive functioning, daily functioning, and even physical abilities. As such, there
are numerous tests that are used to assess these domains and multiple tests for each domain.
Examples of tests used to assess working memory abilities in the clinical setting are the Paced
Auditory Serial Addition Test (PASAT; Gronwall, 1977), Digits Backwards, and Letter-Number
Sequencing, the latter two which are found in the Wechsler series of tests such as the Wechsler
Adult Intelligence Scale, 3rd edition (WAIS-III; Wechsler, 2008). During the PASAT,
individuals are presented with a series of 60 pairs of digits, with each series having different time
intervals per digit presented (1.2 sec – 2.4 sec, in .4 sec intervals). The purpose of the task is to
add a digit to the digit immediately preceding it. The task has been shown to be very difficult, as
normal adults achieve 72% correct on the slowest time interval and only 45% correct at the
fastest (Fisk & Archibald, 2001). Digits Backwards requires subjects to repeat a series of
numbers in the reverse order they were presented. This task involves what is termed mental
double-tracking, meaning that memorizing and reversing operations must be performed
simultaneously (Lezak, Howieson, & Loring, 2004). Letter-Number Sequencing is similar to
Digits Backwards in that it requires mental double-tracking because the stimuli must be
reorganized upon repetition. Individuals are presented with both letters and numbers and are
asked to repeat them in numerical and alphabetical order with the numbers always first. Given
these tests can be very taxing on working memory, they are very sensitive to a number of brain
disorders or injuries, such as AD, multiple sclerosis, left hemisphere lesions, frontal lesions, and
damage from solvent inhalation (Black, 1986; Earnst, et al., 2001; Fisk & Archibald, 2007;
Hohol, et al., 1997; Leskela et al., 2004; Morrow, Robin, Hodgson, & Kamis, 1992).
13
Working Memory Tasks Used in the Laboratory
There are a number of tasks used in the laboratory to assess the construct of working
memory. Some of the tasks most commonly used are the item recognition task, the N-back, the
continuous performance task, or a variation of one of these (Wager & Smith, 2003). During the
item recognition task (Sternberg, 1966), subjects are shown a set of letters or numbers and are
later shown a probe which they must identify as being or not being in the set. During the N-back
task (Gevins & Cutillo, 1993), subjects are presented with a series of stimuli and are asked either
if the present stimulus matches a stimulus presented n trials back (usually 1 to 3) or to identify
how many trials back the present stimulus was shown. Some have argued increasing n to 3 or
more during the N-back takes regions associated with working memory capacity limits past their
limits, yielding invalid activation during functional imaging (Callicott et al., 1999). What is
meant by invalid activation, in this case, is overall decreased activity of the capacity limited
regions due to overload. Taken from a different perspective, though, eliciting system overload
and therefore decreased activity does not necessarily need to be viewed as an undesirable effect.
This may be beneficial if one is attempting to measure the characteristics of the system under
excessive strain, or more generally speaking, when attempting to plot the system’s overall
characteristics.
Even though the N-back task has been shown to correlate highly with the construct of
working memory (Kane, Conway, Miura, & Colflesh, 2007), a potentially more valid task, the
operation span (OSPAN) task has been developed by Turner and Engle (1989). During the
OSPAN, subjects are asked to memorize a series of words, or letters, in serial order while they
are being alternately presented with and distracted by mathematical operations they must judge
to be correct or incorrect. As the number of words and operations presented increases, the harder
it is for subjects to recall the correct stimuli. This task appears to have greater reliability and

14
internal consistency than other tasks used to assess working memory (Klein & Fiss, 1999). An
automated version of the OSPAN, such as might be used in a functional imaging study, has also
demonstrated high levels of reliability and internal consistency, and shown high levels of
correlation with other measures of WM (Unsworth, Heitz, Schrock, & Engle, 2005). It is
important to note that even though all these tasks access working memory, they do not all rely on
the same executive functions.
Deficits in Select Clinical Populations; Working Memory and Related Executive Functions
Patients who have lesions to areas involved in WM will likely display deficits in aspects
of WM regulated by the affected regions. Additionally, regions functionally connected to the
aforementioned regions may also malfunction due to improper or inadequate input, leading to
further cognitive impairment. Patients with severe psychopathology or neurodegenerative
disorders may also exhibit WM deficits, as these disease processes impact the structural integrity
of the brain, whether in the form of developmental malformation or degeneration of previously
intact regions. Given the typically widespread impact of these processes on the brain, these
patients tend to exhibit global deficits rather than the more specific deficits (e.g., problems with
short term memory, loss of problem solving skills) focal lesion patients may exhibit.
Persons with schizophrenia are known to exhibit a variety of deficits in working
memory. Conklin, Curtis, Katsanis, & Iacono (2000) administered the Wechsler Digit Span Task
to persons with schizophrenia, their first-degree relatives, and controls, and found that patients
and their first-degree relatives scored significantly different than controls on the backward digit
span task, a measure of verbal working memory. Additionally, only persons with schizophrenia
scored significantly different on the forward digit span task, which is a measure of attention.
Fleming et al. (1997) found that persons with schizophrenia exhibited marked deficits in
visuospatial working memory, even when there was only a minimal time delay. Furthermore,

15
deficits in visuospatial working memory are more apparent and predictable than those in verbal
working memory. A meta-analysis by Lee and Park (2005) found that aside from the modality-
specific deficits found in schizophrenia, working memory deficits are modality independent,
suggesting that “common cognitive processes necessary to perform working memory tasks may
be abnormal” (p. 602). On the Stroop task, a measure of attention and inhibition, persons with
schizophrenia tend to perform significantly worse than controls (Barch, Carter, & Cohen, 2004;
Henik et al., 2002). It should be noted that some persons with schizophrenia score in the normal
range on working memory measures; however, this does not mean their current abilities reflect
their premorbid abilities. In other words, a patient may achieve a score classified as average,
while premorbidly they may have scored in the superior range.
Another clinically important group of patients exhibiting cognitive deficits are those with
neurodegenerative dementias. AD patients, for example, are physiologically characterized by
neuronal loss, granulovacuolar degeneration, neurofibrillary tangles, and neuritic plaques. As
such, they exhibit a variety of memory and working memory deficits, due to the disease's
invasion of the hippocampus, frontal and parietal lobes, and other cortical areas. Working
memory deficits include poor attention span (Della Sala et al. 1995; Parasuraman et al. 1995;
Simone & Baylis, 1997), decreased ability to retain visual information (Baddeley, Cocchini,
Della Sala, Logie, & Spinnler, 1999), and decreased vigilance when subjected to a cognitive load
(Baddeley et al.). Patients with frontotemporal dementia (FTD), which is characterized by frontal
and/or temporal lobe atrophy, also exhibit a number of executive deficits, which appear earlier in
the course of the disease and which are initially more pronounced than those seen in AD.
Gregory, Orrell, Sahakian, and Hodges (1997) found neuropsychological differences between the
early stages of AD and FTD to be relatively small; however, on the Clinical Dementia Rating
Scale, FTD patients were found to exhibit severe deficits in a number of areas relating to daily

16
functioning. These types of patients can give us further insight into the functioning of the
working memory system by examining them through postmortem, neuropsychological, or
neuroimaging modalities.
Imaging
Magnetic Resonance Imaging
MRI is a structural imaging technique which makes use of the phenomenon of nuclear
magnetic resonance (NMR), first observed by Rabi (1937) and detected through electromagnetic
methods by both Bloch (1946) and Purcell (1946). NMR is based upon the intrinsic angular
momentum, or spin, of nuclear subatomic particles. The particles of interest in NMR (protons
and neutrons) possess half-integer spins, such as 1/2, or -1/2. When an odd number of protons
and/or neutrons are present in a nucleus, their spins will not cancel each other and the nucleus
will have an overall net spin. Non-zero spin is accompanied by a magnetic moment, which is
ultimately the source of the MR signal. NMR proceeds as follows: when a nucleus with a net
spin, while in the presence of a strong magnetic field, is exposed to a radiofrequency (RF) pulse
that is equal to its resonant frequency, the atom consequently absorbs the RF energy. This
absorption changes its energy state and the orientation of its magnetic moment. Since the
particles are precessing around the static magnetic field, any change in their net magnetization,
caused by the application of an RF pulse, can be detected by the voltage changes induced in a
coil through Faraday’s law. Additionally, even though a wide variety of nuclei can be examined
in NMR, the one most commonly used is 1H.
A critical breakthrough came in the mid-1970s, when Paul Lauterbur was able to
demonstrate that NMR frequencies could be used to produce two-dimensional (2-D) images of
samples, ranging from vials of water to a pecan nut to a live clam, as long as the samples
contained resonating nuclei such as 1H. Since the human body is mainly composed of water and

17
fat, 1H nuclei, which consist of a single proton, serve as the source of the signal in Magnetic
Resonance Imaging (MRI). Initially, the hydrogen nuclei magnetic moments are in random
orientations relative to each other; this is assumed to produce a net magnetization of zero. When
an external magnetic field (B0) is applied the nuclei align to it. Nuclei will either be in low-
energy states, aligned parallel to the external magnetic field, or in high energy states, aligned
anti-parallel to it. Even though the nuclei are constantly oscillating between states, there will
always be a small excess of low-energy nuclei (it is “easier” to be in a lower energy state) that
are not canceled out by high-energy nuclei; these create the net magnetization. The number of
nuclei in a lower energy state is proportional to the temperature. The higher the temperature, the
fewer nuclei there will be in a lower energy state as there is more energy available to flip to a
high energy state. In order to acquire a signal, the spin state of the nuclei must be altered by
applying an RF pulse. The required frequency is determined by the Larmor equation, w0 = γ * B0,
where w0 is the Larmor value and γ is the gyromagnetic-ratio. Since γ is a constant, the Larmor
value is dependent upon the energy of B0.
MZ, the longitudinal magnetization component, is originally aligned along B0. Saturating
MZ with RF results in two changes: MZ gradually reduces as the transverse magnetization
component, MXY, increases. This causes the net magnetization to precess around B0 at the
Larmor Frequency and, when the proper RF refocusing pulses are applied, the nuclei to be in
phase. The former is what enables a magnetic resonance device to differentiate the object under
examination from B0. In other words, what is being detected is the apparent change in orientation
of the bulk magnetization.
The time required to reduce the difference between MZ and B0 by a factor of e is referred
to as spin-lattice relaxation time (T1). In other words, this describes the recovery function of the
longitudinal magnetization. A second time component, spin-spin relaxation time (T2 ), describes
18
the dephasing of the transverse magnetization; the particles experience a de-phasing due to
inhomogeneities in the field. T2 is the time required for particles to lose the transverse
magnetization by a factor of e. Since the strength of the signal of interest (the transverse
magnetization) is influenced by phase coherence of the nuclei, a loss of phase results in gradual
signal loss. More specifically, signal loss occurs exponentially but is influenced by the structure
of the medium the nuclei reside in. It is important to note that T1 relaxation and T2 decay occur
simultaneously but at different rates, with the only restriction being that T2 decay rate must be
faster than T1 relaxation rate.
MRI routinely makes use of the time components T2 and T1 to contrast tissue types. As
mentioned above, when the net magnetization of the particles is equal to B0, a signal cannot be
acquired because there is no difference in the magnetic fields. As the magnetization in the
transverse plane increases, either of the time components can be used to generate different image
contrasts through the manipulation of the parameters time to repetition (TR) and echo time (TE).
The TR parameter specifies the amount of time allowed between particle excitations, while TE
specifies the amount of time between the application of the RF pulse and image acquisition. A
T1-weighted image requires a short TR and TE. As lower TR times are used some particles are
not allowed to fully relax longitudinally. Since different tissues have different T1 times the
differences in longitudinal relaxation for each result in contrasted images. A T2-weighted image,
on the other hand, requires a longer TR and TE. The longer TE permits for larger phase
discrepancies to accumulate between protons as a result of tissue differences and magnetic field
inhomogeneities. The amount of accumulated phase difference overpowers the T1 relaxation
differences resulting in a different type of contrast. Additionally, it is also worth noting that the
diffusion of water also causes T2 relaxation and also contributes to signal loss and therefore

19
contrast differences. In the end, the case is that long TRs avoid T1 weighting, while short TEs
avoid T2 weighting.
Due to the varied levels of signal loss, and therefore increased contrast, observed in T1-
weighted images, they are often used to attain highly detailed images of the anatomy, and are
also known as anatomical images. T2-weighted images on the other hand are the result of
significant signal loss in some tissue types. The discrepancy in signal loss between different
tissue types is highly beneficial when searching for pathological regions. The increase or
decrease of water retention in affected regions results in a slower or faster T2 decay rate,
respectively, which greatly contrasts with the surrounding tissue.
It is important to note there are different ways to alter the phase coherence and
magnetization of particles. As previously mentioned, a RF pulse can be used to alter the
transverse magnetization of a particle and to align the spins of the particles. However, a gradient
can also be used to alter these characteristics. RF pulses are usually 90º or 180º pulses and
prepare the particles to be detected. Gradient pulses, on the other hand, can have flip angles of
varying degrees. Using angles that initially do not fully turn the particles onto the transverse
plain allows some particles to fully relax and realign with B0. Through subsequent pulses the
phase coherence of the particles that do not relax will be significantly different from those that
do. This allows for differentiation between similar tissue types and is the reason why MRI is one
of the preferred techniques for structural images of the brain.
Functional Magnetic Resonance Imaging
Typical functional imaging of the brain is based on the idea that active regions will
exhibit greater metabolic activity. PET, for example, uses flourodeoxyglucose (FDG; a positron
emitting variant of the glucose binding molecule 2-deoxyglucose) to detect increased levels of
metabolism. As activity increases in a region, blood flow increases in order to provide that

20
region with sufficient energy (glucose), among other things, for metabolism to take place. The
concentration of FDG subsequently increases in regions where higher levels of metabolic activity
are occurring, resulting in increased signal in the region and excellent contrast between active
and inactive regions. As interesting an idea as it may be to monitor the metabolic activity
occurring within the brain, there are a few drawbacks in using PET for functional imaging in
research settings. Firstly, the local increase in FDG takes a long time, about one hour; therefore,
typical PET imaging has little to no temporal resolution. Secondly, PET has poor spatial
resolution. PET images are collected by detecting the radioactive gamma particles emitted by
positrons in FDG. These gamma particles are emitted at approximately a 180° from each other,
and their location of origin is calculated from Δt and points at which they collide with the gamma
detector. Lastly, and possibly of most importance in research settings is that the fluorine isotope
of FDG is radioactive.
FMRI, on the other, does not use radioactive substances to detect changes in brain
function. The first fMRIs of the human brain were acquired through perfusion of gadolinium, a
non-radioactive contrast agent (Belliveau et al., 1991). As it circulated through the blood stream
the concentration of gadolinium would increase in regions of increased neuronal activity due to
the increased cerebral blood volume in those regions. It was later found that fMRI could detect
increases in regional cerebral blood flow by detecting increases in oxyhemoglobin (hemoglobin
molecule bound to oxygen), and the first non-invasive functional images of the human brain
were produced (Kwong et al., 1992; Ogawa et al., 1992). To be more specific, oxyhemoglobin is
a diamagnetic substance (it does not develop a net magnetic field in reaction to an external
magnetic field) and therefore does not cause local inhomogeneities within the B0.
Deoxyhemoglobin (a hemoglobin molecule not bound to oxygen), on the other hand, is a
paramagnetic substance (develop a net magnetic field in reaction to an external magnetic field)

21
and causes local disturbances within B0. As the neurons that compose the active regions in the
brain fire at a rate greater than their steady state, they diminish the local supply of
oxyhemoglobin. The neurons require more oxyhemoglobin to sustain the increased metabolic
activity and the brain responds by increasing blood flow to the region. These regional increases
in blood flow result in a higher ratio of oxyhemoglobin to deoxyhemoglobin than in “non-
active”brain regions. As a result, during an fMRI scan a regional increase in the ratio of
oxyhemoglobin to deoxyhemoglobin reduces the local attenuation of the signal caused by
deoxyhemoglobin. The improved signal is assumed to be correlated with increased neuronal
activity and is termed the Blood Oxygen Level Dependent (BOLD) contrast or response. From
the BOLD signal the HRF (hemodynamic response function) is formed. This function presents
the increased BOLD signal for a voxel or region of interest over a specified time course, i.e. over
a portion of a task.
Aside from being a non-invasive technique, fMRI also has the advantage of having
excellent spatial resolution. With fMRI we can have an idea as to where cerebral blood flow
changes are occurring down to the millimeter level, this is especially true with high-field strength
scanners which are able to provide higher resolution and signal to noise. The main drawback to
typical block- fMRI studies, however, is that they sample a region’s BOLD response over the
same time course. The BOLD response typically requires about 1-4 seconds to develop and
about, 15-20 seconds to fully resolve (Fig. 2); this leads to poor temporal resolution when
compared to other neuroimaging techniques such as electro- and magneto-encephalography. A
number of methods have been developed to overcome this limitation. One is to perform event-
related designs in which brain regions are sampled at different points allowing for an accurate
representation of that region’s HRF to be formed. Another method is to perform a functional
connectivity analysis which can demonstrate how different regions activate in synchrony. A

22
useful tool which has been developed to map structural connectivity, and which may be used to
guide fMRI analysis, is DTI tractography; a technique performed using diffusion weighted (DW)
images.
Diffusion Weighted Imaging
Diffusion Weighted Imaging (DWI) is a form of MRI T2-weighted imaging that has been
developed to specifically detect the diffusion of water molecules in biological systems. The
apparent diffusion coefficient (ADC) is the scalar quantity which describes the flow of water
within a voxel, and is so termed because the flow of water in biological systems is contributed to
by other processes such as “Brownian motion (thermal molecular motion), possibly cell
streaming, and/or movement of molecules across cell membranes (Neil et al., 1997).
Nonetheless, diffusion is the movement of molecules from areas of high concentrations to areas
of low concentrations and occurs because of the intrinsic thermal energy that particles possess.
This intrinsic energy causes the molecules to diffuse across a concentration gradient in a random
motion (Brownian motion). As previously mentioned, diffusion causes T2 relaxation, therefore,
areas of restricted diffusion will appear less attenuated than those with greater diffusion.
In order to enhance the difference in diffusivity contrast between different tissue types, a
pair of bipolar gradient pulses is usually applied to the magnetic field as per the principles
introduced by Stejskal and Tanner (1965). Acquiring a diffusion weighted image requires that
the degree of sensitivity to diffusion be specified; this is termed the diffusion weighting. The
diffusion weighting of an image is described by its b-value, in the equation:
b = γ2 G2 δ2 (Δ−δ/ 3),
where G and δ are the strength and duration of the pulsed gradients, respectively, Δ is the
duration between the application of the gradients, and γ is the gyromagnetic ratio. B-values
usually range from 0 to about 3000, with average b-values being around 1000. These values
23
weight diffusion in an inverse proportion; with 1000 typically being a value that provides image
intensities that enable the diffusion of water through different tissue types to be differentiated
easily while maintaining an adequate signal to noise ratio (Jones & Basser, 2004). The degree of
signal attenuation is described in the equation:
S(b)/S(0) = e(-bD)
where S(b) is the signal intensity at a given b-value, S(0) is the signal intensity at b = 0, b is the
b-value, and D is the scalar ADC for a gradient direction. The ADC maps are calculated by
acquiring at least one diffusion-weighted image and contrasting it with another image, usually a
T2 non-diffusion-weighted image (i.e., b = 0). Using two different b-values allows the ADC map
to be formed based on the differences in diffusivity. Given the above equation, chosen b-values
should be significantly spaced apart in order to properly fit the slope of D. Being that the slope of
the line is negative, as indicated by -b, b-values should not be too high (e.g., over 4000) as the
signal becomes increasingly attenuated as b-values increase. However, using higher b-values
also results in increased contrast which is beneficial for clinical purposes (Assaf et al, 2002;
Peled, Whalen, Jolesz, & Golby, 2009). Higher b-values also result in non-monoexponential
signal decay, enabling the detection of two diffusion components from the water signal decay
when more complex methods of DWI, such as q-ball imaging, are implemented.
The diffusion characteristics of water are influenced by the structures surrounding it and
their properties. In the brain, diffusion of water in white matter areas is influenced by factors
such as intra-axonal organization, myelination of the axons, fiber diameter, and fiber orientation
(Pierpaoli, Jezzard, Basser, Barnett, & Di Chiro, 1996). The factor having the greatest influence
on diffusion, however, may be the tight packing of fibers and the inherent properties of the cell
membranes (Beaulieu, 2002). All these factors significantly decrease the rate of diffusion,
leading diffusion in white matter to be more anisotropic than in grey matter and cerebro-spinal

24
fluid. Diffusion is less impeded in grey matter because it consists of neuronal somas and because
axons in grey matter lack a bundled organization. Diffusion is practically isotropic in the
cerebrospinal fluid because it lacks structure altogether. The influence on surrounding structures
on diffusion rate has allowed DWI to be a very effective tool in the detection of ischemic
infarcts. During an ischemic infarct cells swell and change the apparent structure of the area,
thereby decreasing the rate of diffusion and increasing the signal to noise ratio (Pfeuffer, Dreher,
Sykova, & Leibfritz, 1998). Use of DWI in the detection of ischemic infarct is so effective it can
detect them within minutes of their occurrence (Moseley, et al., 1990).
Diffusion Tensor Imaging
DTI is an imaging method which builds on the principles of DWI. A DTI sequence needs
to collect at least six DWIs, but usually at least 25 separate directions are acquired or a lesser
number of directions is sampled multiple times. Analysis of these images is able to describe in
greater detail the diffusion characteristics of water within the tissue of interest. When diffusion is
isotropic it can be easily and accurately described by a scalar quantity such as the ADC.
However, when diffusion is anisotropic, such as in white matter or cardiac muscle, it can be
more appropriately described by the next most complex model of diffusion, the apparent or
effective diffusion tensor, D. A tensor is an ellipsoidal, vector representation of a three
dimensional space, and in the case of diffusion, describes the three principal axes of diffusion
(Fig. 3). These three axes are the eigenvectors (v1, v2, v3), and the strength or rate of diffusion
along those axes is defined by their respective eigenvalues (λ1, λ2, λ3). D itself is represented as:
Dxx Dxy Dxz D = Dyx Dyy Dyz Dzx Dzy Dzz Since measurements of D are usually made in the laboratory frame of reference (the magnetic
gradients of the scanner), which do not correspond with the frame of reference of the tissue, the

25
matrix will have nine elements, six of which are unique. Since the tensor is symmetric, by
constraint of the model, its calculation only requires the application of six unique diffusion
sensitizing gradients, instead of nine. In other words, and as just mentioned above, the
calculation requires the acquisition of only six DWIs. Another property of the tensor is that it can
be diagonalized. This diagonalization results in the three eigenvalues mentioned above.
Given that white matter structures greatly influence the diffusion of water and that DTI is
able to provide a complex model of the diffusion characteristics of water within different tissue
types, it is possible to map, or track, neural fiber bundles. Fiber tracking (tractography) is
typically performed by determining whether the main eigenvectors (the principal diffusion
direction) of adjacent voxels follow similar orientations. However, there are a variety of
available tracking algorithms, each with its own assumptions to determine how to track a fiber
bundle and when a particular bundle begins or ends. For example, one algorithm may base
tractography on the primary eigenvector and also implement a noise-filter, while another
algorithm may try to define the energy minimized path (the path with the maximum alignment to
the tensor field). Other subtle variations in these algorithms include the allowable angle of
deviation between the main eigenvectors and the overall allowable curvature of the fiber track
(Cheng et al., 2006, Melhem et al., 2002); typically these can be set by the user.
Therefore, the use of different algorithms for the same information may lead to different
or even conflicting results. As such, some algorithms may be better able to differentiate where
some fibers cross or meet. For example, results from two different algorithms may show fibers
briefly meeting and then forking off or may show them meeting and joining. However, all
algorithms suffer from the fact that a tensor is being used to determine diffusion; this results in
an inability to model intravoxel crossing and is one of the main challenges of DTI (Hagmann et
al. 2006; Mori & van Zijl, 2002). It should also be noted that DTI fiber tracking is not able to

26
determine the direction in which action potentials typically run through axonal processes. In
other words, in looking at connectivity between two regions, we are not able to determine which
region activates the other during a given process.
Neuroimaging Findings in Clinical Populations
Neuroimaging studies of patient populations provide an excellent example of how patient
examination plays a significant role in determining the brain regions involved in specific
cognitive operations. There are a number of methods through which this may be accomplished,
but in fMRI it is typically done by observing activation differences in controls and patients and
by correlating task performance with brain activation. In DTI based studies FA values or
connectivity strength measures of certain regions may be examined. One clinical population that
has undergone extensive neuroimaging is schizophrenia patients. Patients with schizophrenia
have been found to display abnormal activation in various cortical regions. One of the most
consistent findings is that they exhibit hypoactivity in the DLPFC (Glahn et al., 2005). Many of
the executive deficits exhibited by persons with schizophrenia have been attributed to the
hypoactivity observed in this region. Other regions though, such as the ACC, also exhibit
abnormal activation. Unfortunately, research into this area has not shown patterns of activation
as consistent as those seen in the DLPFC. In other words, some studies have found hypoactivity
(e.g., Carter, Mintun, Nichols, & Cohen, 1997; Yucel et al., 2002), while others have found
hyperactivity (e.g., Nordahl et al., 2001). Regardless of hypo or hyperactivity, persons with
schizophrenia tend to show impaired conflict monitoring and attentional control, deficits which
greatly affect working memory performance and are attributed to ACC dysfunction (Kerns et al.,
2005). Abnormal activation patterns are not limited to these regions and have been found to
occur in a variety of cortical areas. The abnormal activation in these areas, though, may not only
be due to local malfunction, but may also be due to problems with white matter connectivity.

27
The DTI studies which have been conducted on persons with schizophrenia have shown
mixed findings, but there are a few structures which have been identified as possibly having
reduced anisotropy: the cingulum bundle (a pathway linking the DLPFC to the cingulate gyrus,
amygdala, medial dorsal thalamus, and nucleus accumbens; Ardekani et al., 2003; Kubicki et al.,
2003; Wang et al., 2004) and the uncinate fasciculus (which links the inferior prefrontal cortex to
anterior temporal regions, and frontal white matter tracts; Buchsbaum et al., 2006; Kitamura et
al., 2005; Kubicki et al.). In a study by Nestor et al. (2004), patients with schizophrenia were
imaged using DTI and were administered neuropsychological measures. Correlations between
lower left uncinate fasciculus FA values and deficits in declarative-episodic memory, and lower
left cingulate bundle FA values and deficits in executive functioning were found.
Another group of patients which has greatly informed the knowledge base of brain
functioning is Alzheimer’s disease patients. An MRI and single positron emission computed
tomography (SPECT) study found structural and regional cerebral blood flow differences
between AD and FTD patients (Varma, et al. 2002). FTD patients showed significantly more
atrophy in frontal, lateral temporal, and parietal regions than those with AD; mild parietal and
temporal atrophy was also seen in many of the patients with AD. Regional cerebral blood flow
was significantly reduced in frontal and temporal regions for FTD patients, while the most
common reduction for AD patients was in the parietal region. Rombouts et al. (2003) found that
fMRI can be used to discriminate between the early stages of AD and FTD. In the early stages of
FTD patients exhibited significantly less frontal, parietal, and ACC activation than those with
early AD, while early AD patients showed frontal activation similar to that of healthy controls.
The functional activation differences between these groups of patients are important because
they likely reflect the underlying white matter degeneration is occurring.
Even though DTI studies of AD patients are somewhat more limited than in

28
schizophrenia, there appear to be some consistent abnormalities. One of the first DTI studies on
AD patients performed on a 3.0T MRI (Takahashi et al. 2002) found significantly reduced FA
values in temporal lobe white matter, posterior corpus callosum, and posterior and anterior
cingulate bundles. Medina et al. (2006) observed decreased FA in cortico-thalamic and thalamo-
cortical bundles passing through the internal capsule, superior longitudinal bundles, and the
posterior cingulate bundle. Another study (Duan et al., 2006) found decreased FA in the
splenium of the corpus callosum, and the temporal, parietal, and frontal lobes. It should be noted
that the studies (Takahashi et al; Medina et al.) which have found abnormalities in the posterior
cingulate bundle, have found this region to be particularly affected.
Brain Regions Involved in Working Memory
Neuroimaging studies, lesion studies, aging studies, and neuropsychological tests of
patients have shown a number of brain areas are involved in working memory. Initially, lesion
studies of patients and animals were used to gather this information. For example, Kleist (1935)
examined World War I veterans who had received lesions to the posterior cortex from missile
explosions. These patients were found to have deficits in recognizing object forms and displayed
impairments in their spatial abilities. Executive functions, such as attentional control, set shifting,
inhibition, and planning, are necessary for proper working memory performance and are assessed
using measures such as the Wisconsin Card Sorting Test (WCST, Ref). The WCST requires the
use of many cognitive functions, but mainly requires use of the ability to shift sets based on
reinforcement. The poor performance on this task by patients with frontal lobe lesions indicates
that at least some executive functions are governed by the frontal lobes (Demakis, 2003).
Currently it appears neuroimaging has become one of the preferred methods for
determining the brain regions constituting the working memory system. Neuroimaging studies of
working memory have detected activation in a variety of cortical and sub-cortical regions when
29
individuals are presented with working memory tasks. Consistent activation, though, has been
observed in the prefrontal cortex (PFC), anterior cingulate cortex (ACC), and the inferior and
superior parietal lobules.
The PFC is believed to be the main structure contributing to the processes of working
memory (D’Esposito, Postle, & Rypma, 2000; Owen, McMillan, Laird, & Bullmore, 2005;
Wager & Smith, 2003) and as such, significantly more information has been gathered on it.
Additionally, functional specificity of the areas within the PFC has been possible. A meta-
analysis by Owen and colleagues reported the dorsolateral prefrontal cortex (DLPFC) is involved
in many cognitive functions relevant to working memory such as holding spatial information on-
line, monitoring and manipulation within working memory, implementation of strategies to
facilitate memory, response selection, organization of material before encoding, and verification
and evaluation of representations that have been retrieved from long-term memory. The DLPFC
is also believed to assist the anterior cingulate cortex (ACC) in conflict monitoring during a
working memory task by imposing an attentional set (Banich et al., 2000; MacDonald, Cohen,
Stenger, & Carter, 2000). The same meta-analysis also found the mid-ventrolateral prefrontal
cortex (VLPFC) to be involved in such functions as holding nonspatial information online,
stimulus selection, the specification of retrieval cues, and the “elaboration encoding” of
information into episodic memory. A review by Rajah and D'Esposito (2005) also reported the
VLPFC was activated during various working memory tasks.
In a meta-analysis of neuroimaging working memory studies, Wager and Smith (2003)
found the ACC was activated during spatial tasks and when selective attention was required. The
involvement of the ACC in the attention process has led many to believe its main function is that
of error detection, in which it activates when an incorrect response has been made (Bernstein,
Scheffers, & Coles, 1995), or conflict monitoring, where it activates when the individual is

30
presented with conflicting responses (MacDonald, Cohen, Stenger, & Carter, 2000; Botvinick,
Braver, Barch, Carter, & Cohen, 2001). Both of these latter processes are attentional control
processes and as such the ACC is believed to be critical to cognitive control (Jonides & Smith,
1999; Osaka et al., 2003). Furthermore, Kaneda & Osaka (2008) suggest that the ACC may play
a greater role in executive functioning than the DLPFC.
The parietal lobes are thought to play a role as an associative center and be involved in
higher level cognitive processes. Parietal regions are believed to be crucial to working memory
processes and are generally thought to function as a storage regions for working memory
(Hamidi, Tononi, & Postle, 2008; Postle, 2006; Postle & D’Esposito, 1999; Rowe, Toni,
Josephs, Frackowiak, & Passingham, 2000; Srimal & Curtis, 2008). More specifically, the
superior parietal lobule / precuneus (Brodmann area 7) is believed to be crucial in maintaining
and organizing items held in the working memory store (Wager & Smith; Wendelken, 2008),
while the supramarginal gyrus is thought to retrieve the temporal ordering of items that have
been displaced from the focus of attention through serial scanning (Öztekin, McElree, Staresina,
& Davachi, 2008). Another function of the parietal cortex is thought to be stimulus-response
mapping, which is the selection of an appropriate response for a specific stimulus (Corbetta &
Shulman, 2002; Miller, 2000; Miller & Cohen, 2001).
Purpose of Study
The aim of the present study was to combine fMRI data with DTI tractography to develop
a map of the white matter tracts linking the cortical regions involved in the human working
memory system, one of the cognitive systems critical for proper, everyday functioning.
Specifically, we aimed to develop connectivity maps for the areas involved in storage, retrieval,
and updating during a complex span task. Takahashi, Ohki, and Kim (2007) used areas that were
found to be active during an encoding and retrieval memory task as seeding points. Overall, they

31
found areas in the left DLPFC and left VLPFC connected with areas in the left parietal and
temporal cortices which are usually associated with memory functioning. Audoin et al. (2007)
assessed the impact of MS on integrity of white matter tracts linking the supposed regions of the
executive system of working memory. They found bilateral connections between the anterior
cingulate, BA9, BA 45/46, and the thalami, but knowledge of the working memory system
gained from this study may be limited given the few ROIs used and the large size of the ROIs.
In order to elicit activity in regions associated with the above mentioned cognitive
operations we used a modified version of the OSPAN task (Kondo et al, 2004). The original
version of this task has been reported to show greater reliability than many of the other tasks
used to assess working memory (Klein & Fiss, 1999). It has also been shown to show high levels
of reliability and internal consistency in an automated version similar to the one used in this
study (Unsworth et al., 2005). Following the reported studies reviewed, and the only reported
fMRI study to use the OSPAN task (Kondo et al.) we hypothesized increased BOLD activity in
the VLPFC, DLPFC, ACC, superior and inferior parietal lobules, and the premotor cortex.
To develop the structural connectivity map of the cortical regions involved in storage,
retrieval, and updating roles during a complex working memory span task, we used the fMRI
defined ROIs as seeding and target points for DTI based tractography. Given the anatomical
knowledge already gleamed from neuroanatomical findings (e.g., Broadbent et al., 2006; Potvin
et al., 2006), diffusion based white matter maps (Hagmann et al., 2008; Mori et al., 2005), and
combined fMRI and DTI based tractography studies, we expected to find that the superior
longitudinal fasciculus (SLF), the frontal-occipital fasciculus (FOF), and the inferior longitudinal
fasciculus (ILF) constitute the main crux of the fibers connecting these regions. We specifically
expected to find strong associative connections between the frontal and parietal regions involved
in the working memory processes of interest.

32
References
Ardekani, B. A., Nierenberg, J., Hoptman, M. J., Javitt, D. C., & Lim, K. O. (2003). MRI study
of white matter diffusion anisotropy in schizophrenia. Neuroreport, 14, 2025-2029.
Assaf, Y., Ben-Bashat, D., Chapman, J., Peled, S., Biton, I. E., Kafri, M., et al. (2002). High b-
value q-space analyzed diffusion-weighted MRI: application to multiple sclerosis.
Magnetic Resonance In Medicine: Official Journal Of The Society Of Magnetic
Resonance In Medicine / Society Of Magnetic Resonance In Medicine, 47, 115-126.
Atkinson, R. & Shriffin, R. (1968). Human Memory: a proposed system and its control
processes. In K. Spence & J. Spence (Eds.), The psychology of learning and motivation:
Advances in research and theory (Vol. 2, pp. 89-115). New York: Academic Press.
Atkinson, R.C., & Shiffrin, R. M. (1971, August). The control of short-term memory. Scientific
American, 82-90.
Audoin, B., Guye, M., Reuter, F. o., Au Duong, M.-V., Confort-Gouny, S., Malikova, I., et al.
(2007). Structure of WM bundles constituting the working memory system in early
multiple sclerosis: a quantitative DTI tractography study. Neuroimage, 36, 1324-1330.
Baddeley, A. D. (1966). The influence of acoustic and semantic similarity on long-term memory
for word sequences. Quarterly Journal of Experimental Psychology, 18, 302-309.
Baddeley, A. D. (1996). Exploring the central executive. The Quarterly Journal of Experimental
Psychology, 49, 5-28.
Baddeley, A. D. (2000). The episodic buffer: A new component of working memory? Trends in
Cognitive Sciences, 4, 417-423.
Baddeley, A. D. (2003). Working memory and language: an overview. Journal of
Communication Disorders, 36, 189-208.
Baddeley, A., Cocchini, G., Della Sala, S., Logie, R. H., & Spinnler, H. (1999). Working
33
memory and vigilance: evidence from normal aging and Alzheimer's disease. Brain and
Cognition, 41, 87-108.
Baddeley, A. D., & Hitch, G. (1974). Working memory. In G.H. Bower (Ed.), The psychology of
learning and motivation: Advances in research and theory (Vol. 8, pp. 47-89). New
York: Academic Press.
Baddeley, A. D., Thomson, N., & Buchanan, M. (1975). Word length and the structure of short
term memory. Journal of Verbal Learning and Verbal Behavior, 14, 575-589.
Banich, M. T., Milham, M. P., Atchley, R. A., Cohen, N. J., Webb, A., Wszalek, T., et al. (2000).
Prefrontal regions play a predominant role in imposing an attentional 'set': evidence from
fMRI. Cognitive Brain Research, 10, 1-9.
Barch, D. M., Carter, C. S., & Cohen, J. D. (2004). Factors influencing Stroop performance in
schizophrenia. Neuropsychology, 18, 477-484.
Beaulieu, C. (2002). The basis of anisotropic water diffusion in the nervous system - a technical
review. NMR In Biomedicine, 15, 435-455.
Berg, E.A.,1948. A simple objective for measuring flexibility in thinking. Journal of General
Psychology, 39, 15–22.
Belliveau, J. W., Kennedy, D. N., McKinstry, R. C., Buchbinder, B. R., Weisskoff, R. M.,
Cohen, M. S., et al. (1991). Functional mapping of the human visual cortex by magnetic
resonance imaging. Science, 254, 716-719.
Behrens, T. E., Woolrich, M. W., Jenkinson, M., Johansen-Berg, H., Nunes, R. G., Clare, S., et
al. (2003). Characterization and propagation of uncertainty in diffusion-weighted MR
imaging. Magnetic Resonance in Medicine, 50, 1077-88.
Bernstein, P. S., Scheffers, M. K., & Coles, M. G. (1995). "Where did I go wrong?" A
psychophysiological analysis of error detection. Journal of Experimental Psychology:

34
Human Perception and Performance, 21, 1312-1322.
Black, F. (1986). Digit repetition in brain-damaged adults: Clinical and theoretical implications.
Journal of Clinical Psychology, 42, 770-782.
Bloch, F. (1946). Nuclear induction. Physical Review, 70, 460-474.
Botvinick, M. M., Braver, T. S., Barch, D. M., Carter, C. S., & Cohen, J. D. (2001). Conflict
monitoring and cognitive control. Psychological Review, 108, 624-652.
Braak, H. Braak, E., & Bohl, J. (1993). Staging of Alzheimer-related cortical destruction.
European Neurology, 33, 403-408.
Broadbent, N. J., Squire, L. R., & Clark, R. E. (2006). Reversible hippocampal lesions disrupt
water maze performance during both recent and remote memory tests. Learning and
Memory, 13, 187-191.
Buchsbaum, M. S., Friedman, J., Buchsbaum, B. R., Chu, K. W., Hazlett, E. A., Newmark, R., et
al. (2006). Diffusion tensor imaging in schizophrenia. Biological Psychiatry, 60, 1181-
1187.
Callicott, J. H., Mattay, V. S., Bertolino, A., Finn, K., Coppola, R., Frank, J. A., et al. (1999).
Physiological characteristics of capacity constraints in working memory as revealed by
functional MRI. Cerebral Cortex, 9, 20-26.
Carter, C. S., Mintun, M., Nichols, T., & Cohen, J. D. (1997). Anterior cingulate gyrus
dysfunction and selective attention deficits in schizophrenia: [15O]H2O PET study
during single-trial Stroop task performance. American Journal of Psychiatry, 154, 1670-
1675.
Cheng, P., Magnotta, V. A., Wu, D., Nopoulus, P., Moser, D. J., Paulsen, J., et al. (2006).
Evaluation of the GTRACT diffusion tensor tractography algorithm: A validation and
reliability study. NeuroImage, 31, 1075-7085.

35
Chetelat, G. & Baron, J. C. (2003). Early diagnosis of Alzheimer's disease: Contribution of
structural neuroimaging. Neuroimage, 18, 525-541.
Conklin, H. M., Curtis, C. E., Katsanis, J., & Iacono, W. G. (2000). Verbal working memory
impairment in schizophrenia patients and their first-degree relatives: evidence from the
digit span task. American Journal of Psychiatry, 157, 275-277.
Conrad, R. & Hull, A. J. (1964). Information, acoustic confusion, and memory span. British
Journal of Psychology, 55, 429-432.
Conturo, T. E., Lori, N. F., Cull, T. S., Akbudak, E., Snyder, A. Z., Shimony, et al. (1999).
Tracking neuronal fiber pathways in the living human brain. Proceedings of the National
Academy of Sciences of the United States of America, 96, 10422-10427.
Conway, A. R., Cowan, N., & Bunting, M. F. (2001). The cocktail party phenomenon revisited:
the importance of working memory capacity. Psychonomic Bulletin & Review, 8, 331-
335.
Cowan, N. (1988). Evolving conceptions of memory storage, selective attention, and their
mutual constraints within the human information-processing system. Psychological
Bulletin, 104, 163-191.
Cowan, N. (1999). An embedded-processes model of working memory. In A. Miyake & P. Shah
(Ed.), Models of working memory (pp. 62-101). Cambridge: Cambridge University Press.
Cowan, N. (2001). The magical number 4 in short-term memory: a reconsideration of mental
storage capacity. The Behavioral And Brain Sciences, 24, 87.
Cowan, N. (2005). Working memory capacity. New York: Psychology Press.
Corbetta, M., & Shulman, G. L. (2002). Control of goal-directed and stimulus-driven attention in
the brain. Nature Reviews Neuroscience, 3, 201-215.
Delacourte, A., David, J. P., Sergeant, N., Buee, L., Wattez, A. Vermersch, P., et al. (1999). The
36
biochemical pathway of neurofibrillary degeneration in aging and Alzheimer's disease.
Neurology, 52, 1158-1165.
Della Sala, S., Gray, C., Baddeley, A., Allamano, N., & Wilson, L. (1999). Pattern span: a tool
for unwelding visuo-spatial memory. Neuropsychologia, 37, 1189-1199.
Della Sala, S., Laiacona, M., Spinnler, H., & Trivelli, C. (1995). Poppelreuter-Ghent's
Overlapping Figures Test: its sensitivity to age, and its clinical use. Archives of Clinical
Neuropsychology, 10, 511-534.
Demakis, G. J. (2003). A meta-analytic review of the sensitivity of the Wisconsin Card Sorting
Test to frontal and lateralized frontal brain damage. Neuropsychology, 17, 255-264.
D'Esposito, M., Postle, B. R., & Rypma, B. (2000). Prefrontal cortical contributions to working
memory: evidence from event-related fMRI studies. Experimental Brain Research, 133,
3-11.
Duan, J. H., Wang, H. Q., Xu, J., Lin, X., Chen, S. Q., Kang, Z., et al. (2006). White matter
damage of patients with Alzheimer's disease correlated with the decreased cognitive
function. Surgical and Radiologic Anatomy, 28, 150-156.
Earnst, K. S., Wadley, V. G., Aldrige T. M., Steenwyk, A. B., Hammond, A. E., Harrell, L. E., et
al. (2001). Loss of financial capacity in Alzheimer's disease: The role of working
memory. Aging, Neuropsychology, and Cognition, 8, 109-119.
Ebbinghaus, H. (1964). Memory: A contribution to experimental psychology (H. A. Ruger & C.
E. Bussenius, Trans.). New York: Dover. (Original work published 1885)
Engle, R. W., Kane, M. J., & Tuholski, S. W. (1999). Individual differences in working memory
capacity and what they tell us about controlled attention, general fluid intelligence, and
functions of the prefrontal cortex. In A. Miyake & P. Shah (Ed.), Models of working
memory (pp. 103-134). Cambridge: Cambridge University Press.

37
Engle, R. W., Tuholski, S. W., Laughlin, J. E., & Conway, A. R. (1999). Working memory,
short-term memory, and general fluid intelligence: a latent-variable approach. Journal Of
Experimental Psychology General, 128, 309-331.
Fisk, J. D., & Archibald, C. J. (2001). Limitations of the Paced Auditory Serial Addition Test as
a measure of working memory in patients with multiple sclerosis. Journal of the
International Neuropsychological Society, 7, 363-372.
Fleming, K., Goldberg, T. E., Binks, S., Randolph, C., Gold, J. M., & Weinberger, D. R. (1997).
Visuospatial working memory in patients with schizophrenia. Biological Psychiatry, 41,
43-49.
Gevins, A. S. & Cutillo, B. C. (1993). Neuroelectric evidence for distributed processing in
human working memory. Electroencephalography and Clinical Neurophysiology, 87,
128-143.
Glahn, D. C., Ragland, J. D., Abramoff, A., Barrett, J., Laird, A. R., Bearden, C. E., et al. (2005).
Beyond hypofrontality: a quantitative meta-analysis of functional neuroimaging studies
of working memory in schizophrenia. Human Brain Mapping, 25, 60-69.
Gregory, C. A., Orrell, M., Sahakian, B., & Hodges, J. R. (1997). Can frontotemporal dementia
and Alzheimer's disease be differentiated using a brief battery of tests? International
Journal of Geriatric Psychiatry, 12, 375-383.
Gronwall, D. M. (1977). Paced auditory serial-addition task: A measure of recovery from
concusion. Perceptual and Motor Skills, 44, 367-373.
Hagmann, P., Cammoun, L., Gigandet, X., Meuli, R., Honey, C. J., Wedeen, V. J., et al. (2008).
Mapping the structural core of human cerebral cortex. Plos Biology, 6, e159-e159.
Haznedar, M. M., Buchsbaum, M. S., Hazlett, E. A., Shihabuddin, L., New, A., & Siever, L. J.
(2004). Cingulate gyrus volume and metabolism in the schizophrenia spectrum.

38
Schizophrenia Research, 71, 249-262.
Henik, A., Carter, C. S., Salo, R., Chaderjian, M., Kraft, L., Nordahl, T. E., et al. (2002).
Attentional control and word inhibition in schizophrenia. Psychiatry Research, 110, 137-
149.
Hohol, M. J., Guttmann, C. R., Orav, J., Mackin, G. A., Kikinis, R., Khoury, S. J., et al. (1997).
Serial neuropsychological assessment and magnetic resonance imaging analysis in
multiple sclerosis. Archives Of Neurology, 54, 1018-1025.
Huesgen, C. T., Burger, P. C., Crain, B. J., & Johnson, G. A. (1993). In vitro MR spectroscopy
of the hippocampus in Alzheimer's disease. Neurology, 43, 145-152.
Jack, C. R., Dickson, D. W., Parisi, J. E., Xu, Y. C., Cha, R. H., O'Brien, P. C., et al. (2002).
Antemortem MRI findings correlate with hippocampal neuropathology in typical aging
and dementia. Neurology, 58, 750-757.
James, W. (1890). Principles of psychology. New York: Holt.
Jones, D. K., & Basser, P. J. (2004). "Squashing peanuts and smashing pumpkins": how noise
distorts diffusion-weighted MR data. Magnetic Resonance In Medicine: Official Journal
Of The Society Of Magnetic Resonance In Medicine / Society Of Magnetic Resonance In
Medicine, 52, 979-993.
Jonides, J., Schumacher, E. H., Smith, E. E., Koeppe, R. A., Awh, E., Reuter-Lorenz, P. A., et al.
(1998). The role of parietal cortex in verbal working memory. Journal of Neuroscience,
18, 5026-5034.
Kane, M. J., Conway, A. R. A., Miura, T. K., & Colflesh, G. J. H. (2007). Working memory,
attention control, and the N-back task: A question of construct validity. Journal of
Experimental Psychology-Learning Memory and Cognition, 33, 615-622.
Kaneda, M., & Osaka, N. (2008). Role of anterior cingulate cortex during semantic coding in

39
verbal working memory. Neuroscience Letters, 436, 57-61.
Kitamura, H., Matsuzawa, H., Shioiri, T., Someya, T., Kwee, I. L., & Nakada, T. (2005).
Diffusion tensor analysis in chronic schizophrenia. A preliminary study on a high-field
(3.0T) system. European Archives of Psychiatry and Clinical Neuroscience, 255, 313-
318.
Klein, K., & Fiss, W. H. (1999). The reliability and stability of the Turner and Engle working
memory task. Behavioral Research Methods, Instruments, & Computers, 31, 429-432.
Kleist, K. (1935). Uber form und orstsblindheit bei verletzungen des hinterhautlappens. Deutsch
Z Nervenheilk, 138, 206-214.
Kondo, H., Morishita, M. Osaka, N., Osaka, M., Fukuyama, H., & Shibasaki, H. (2004).
Functional roles of the cingulo-frontal network in performance on working memory.
Neuroimage, 21, 2-14.
Kubicki, M., Westin, C. F., Nestor, P. G., Wible, C. G., Frumin, M., Maier, et al. (2003).
Cingulate fasciculus integrity disruption in schizophrenia: a magnetic resonance diffusion
tensor imaging study. Biological Psychiatry, 54, 1171-1180.
Kung, L., & Roberts, R. C. (1999). Mitochondrial pathology in human schizophrenic striatum: a
postmortem ultrastructural study. Synapse, 31, 67-75.
Kwong, K. K., Belliveau, J. W., Chesler, D. A., Goldberg, I. E., Weisskoff, R. M., Poncelet, B.
P., et al. (1992). Dynamic magnetic resonance imaging of human brain activity during
primary sensory stimulation. Proceedings of the National Academy of Sciences of the
United States of America, 89, 5675-5679.
Lanyon, L. J., Giaschi, D., Young, S. A., Fitzpatrick, K., Diao, L., Bjornson, B. H., et al. (2009).
Combined functional MRI and diffusion tensor imaging analysis of visual motion
pathways. Journal Of Neuro-Ophthalmology: The Official Journal Of The North

40
American Neuro-Ophthalmology Society, 29, 96-103.
Le Bihan, D., Mangin, J. F., Poupon, C., Clark, C. A., Pappata, S., Molko, N., & et al. (2001).
Diffusion tensor imaging: concepts and applications. Journal of Magnetic Resonance
Imaging, 13, 534-546.
Lee, J., & Park, S. (2005). Working memory impairments in schizophrenia: a meta-analysis. J
Abnormal Psychology, 114, 599-611.
Leskel ä, M., Hietanen, M., Kalska, H. Yikoski, R., Pohjasvaara, T., Mantyla, R., et al. (1999).
Executive functions and speed of mental processing in elderly patients with frontal or
nonfrontal ischemic stroke. European Journal of Neurology, 6, 653-661.
Leskelä, U. S., Melartin, T. K., Lestel ä-Mielonen, P. S., Rytsälä, H. J., Sokero, T. P., Heikkinen,
M. E., et al. (2004). Life events, social support, and onset of major depressive episode in
Finnish patients. The Journal Of Nervous And Mental Disease, 192, 373-381.
Lezak, M. D., Howieson, D. B., & Loring, D. W. (2004). Neuropsychological Assessment (4th
ed.). New York: Oxford University Press.
MacDonald, A. W., Cohen, J. D., Stenger, V. A., & Carter, C. S. (2000). Dissociating the role of
the dorsolateral prefrontal and anterior cingulate cortex in cognitive control. Science, 288,
1835-1838.
Medina, D., DeToledo-Morrell, L., Urresta, F., Gabrieli, J. D., Moseley, M., Fleischman, D., et
al. (2006). White matter changes in mild cognitive impairment and AD: A diffusion
tensor imaging study. Neurobiology of Aging, 27, 663-672.
Melhem, E. R., Mori, S. Mukundan, g., Kraut, M. A., Pomper, M. G., & van Zijl, P. C. (2002).
Diffusion tensor MR imaging of the brain and white matter tractography. American
Journal of Roentgenology, 178, 3-16.
Middleton, J., Neil, S., Wintle, J., Clark-Lewis, I., Moore, H., Lam, C., et al. (1997).

41
Transcytosis and surface presentation of IL-8 by venular endothelial cells. Cell, 91, 385-
395.
Miller, E. K. (2000). The neural basis of top-down control of visual attention in the prefrontal
cortex. In S. Monsell & J. Driver (Eds.), Attention and Performance (pp. 511-534).
Cambridge, MA: Massachusetts Institute of Technology Press.
Miller, E. K., & Cohen, J. D. (2001). An integrative theory of prefrontal cortex function. Annual
Review of Neuroscience, 24, 167-202.
Morey, C. C., & Cowan, N. (2004). When visual and verbal memories compete: evidence of
cross-domain limits in working memory. Psychonomic Bulletin & Review, 11, 296-301.
Morey, C. C., & Cowan, N. (2005). When do visual and verbal memories conflict? The
importance of working-memory load and retrieval. Journal Of Experimental Psychology.
Learning, Memory, And Cognition, 31, 703-713.
Mori, S., Wakana, S., Nagae-Poetscher, L. M., & van Zijl, P. C. (2005). MRI atlas of human
white matter. Amsterdam: Elsevier.
Morrow, L. A., Robin, N., Hodgson, M. J., & Kamis, H. (1992). Assessment of attention and
memory efficiency in persons with solvent neurotoxicity. Neuropsychologia, 30, 911-
922.
Mosconi, L. (2005). Brain glucose metabolism in the early and specific diagnosis of Alzheimer's
disease. FDG-PET studies in MCI and AD. European Journal of Nuclear Medicine and
Molecular Imaging, 32, 486-510.
Moseley, M. E., Kucharczyk, J., Mintorovitch, J., Cohen, Y., Kurhanewicz, J., Derugin, N., et al.
(1990). Diffusion-weighted MR imaging of acute stroke: correlation with T2-weighted
and magnetic susceptibility-enhanced MR imaging in cats. American Journal of
Neuroradiology, 11, 423-429.

42
Näätänen, R., Teder, W., Alho, K., & Lavikainen, J. (1992). Auditory attention and selective
input modulation: a topographical ERP study. Neuroreport, 3, 493-496.
Nestor, P. G., Kubicki, M., Gurrera, R. J., Niznikiewicz, M., Frumin, M., McCarley, R. W., & et
al. (2004). Neuropsychological correlates of diffusion tensor imaging in schizophrenia.
Neuropsychology, 18, 629-637.
Nordahl, T. E., Carter, C. S., Salo, R. E., Kraft, L., Baldo, J., Salamat, S., et al. (2001). Anterior
cingulate metabolism correlates with stroop errors in paranoid schizophrenia patients.
Neuropsychopharmacology, 25, 139-148.
Ogawa, S., Tank, D. W., Menon, R., Ellermann, J. M., Kim, S.G., Merkle, H., et al. (1992).
Intrinsic signal changes accompanying sensory stimulation: functional brain mapping
with magnetic resonance imaging. Proceedings of the National Academy of Sciences of
the United States of America, 89, 5951-5955.
Onitsuka, T., Niznikiewicz, M. A., Spencer, K. M., Frumin, M., Kuroki, N., Lucia, L. C., et al.
(2006). Functional and structural deficits in brain regions subserving face perception in
schizophrenia. American Journal of Psychiatry, 163, 455-462.
Osaka, M., Osaka, N., Kondo, H., Morishita, M., Fukuyama, H., Aso, T., et al. (2003). The
neural basis of individual differences in working memory capacity: an fMRI study.
Neuroimage, 18, 789-797.
Owen, A. M., McMillan, K. M., Laird, A. R., & Bullmore, E. (2005). N-back working memory
paradigm: a meta-analysis of normative functional neuroimaging studies. Human Brain
Mapping, 25, 46-59.
Parasuraman, R., Greenwood, P. M., & Alexander, G. E. (1995). Selective impairment of spatial
attention during visual search in Alzheimer's disease. Neuroreport, 6, 1861-1864.
Peled, S., Whalen, S., Jolesz, F. A., & Golby, A. J. (2009). High b-value apparent diffusion-

43
weighted images from CURVE-ball DTI. Journal Of Magnetic Resonance Imaging:
JMRI, 30, 243-248.
Petrides, M., & Pandya, D. N. (1984). Projections to the frontal cortex from the posterior parietal
region in the rhesus monkey. The Journal Of Comparative Neurology, 228, 105-116.
Petrides, M., & Pandya, D. N. (2006). Efferent association pathways originating in the caudal
prefrontal cortex in the macaque monkey. The Journal Of Comparative Neurology, 498,
227-251.
Pfeuffer, J., Dreher, W., Sykova, E., & Leibfritz, D. (1998). Water signal attenuation in
diffusion-weighted 1H NMR experiments during cerebral ischemia: Influence of
intracellular restrictions, extracellular turtuosity, and exchange. Magnetic Resonance
Imaging, 16, 1023-1032.
Pierpaoli, C., Jezzard, P., Basser, P. J., Barnett, A., & Di Chiro, G. (1996). Diffusion tensor MR
imaging of the human brain. Radiology, 201, 637-648.
Postle, B. R. & D'Esposito, M. (1999). “What”--Then--”Where” in visual working memory: An
event-related fMRI study. Journal of Cognitive Neuroscience, 11, 585-597.
Potvin, O., Allen, K., Thibaudeau, G., Dore, F. Y., & Goulet, S. (2006). Performance on spatial
working memory tasks after dorsal or ventral hippocampal lesions and adjacent damage
to the subiculum. Behavioral Neuroscience, 120, 413-422.
Purcell, E. M., Torrey, H. C., & Pound, R. V. (1946). Resonance absorption by nuclear magnetic
moments in a solid. Physical Review, 69, 37-38.
Rabi, I. I. (1937). Space quantization in a gyrating magnetic field. Physical Review, 51, 652-654.
Rajah, M. N. & D'Esposito, M. (2005). Region-specific changes in prefrontal function with age:
A review of PET and fMRI studies on working memory and episodic memory. Brain,
128, 1964-1983.

44
Roberts, R. C., Roche, J. K., & Conley, R. R. (2005). Synaptic differences in the postmortem
striatum of subjects with schizophrenia: a stereological ultrastructural analysis. Synapse,
56, 185-197.
Rombouts, S. A., van Swieten, J. C., Pijnenburg, Y. A., Goekoop, R., Barkhof, F., & Scheltens,
P. (2003). Loss of frontal fMRI activation in early frontotemporal dementia compared to
early AD. Neurology, 60, 1904-1908.
Roskies, A. L. (1999). The binding problem. Neuron, 24, 7.
Rowe, J. B., Toni, I., Josephs, O. Frackowiak, R. S., & Passingham, R. E. (2000). The prefrontal
cortex: response selection or maintenance within working memory? Science, 288, 1656-
1660.
Schmahmann, J. D., Pandya, D. N., Wang, R., Dai, G., D'Arceuil, H. E., de Crespigny, A. J., et
al. (2007). Association fibre pathways of the brain: parallel observations from diffusion
spectrum imaging and autoradiography. Brain: A Journal Of Neurology, 130, 630-653.
Silbert, L. C., Quinn, J. F., Moore, M. M., Corbridge, E., Ball, M. J., Murdoch, G., at al. (2003).
Changes in premorbid brain volume predict Alzheimer's disease pathology. Neurology,
61, 487-492.
Simone, P. M., & Baylis, G. C. (1997). Selective attention in a reaching task: effect of normal
aging and Alzheimer's disease. Journal of Experimental Psychology: Human Perception
and Performance, 23, 595-608.
Small, G. W., Kepe, V., Ercoli, L. M., Siddarth, P., Bookheimer, S. Y., Miller, K. J., et al.
(2006). PET of brain amyloid and tau in mild cognitive impairment. The New England
Journal of Medicine, 355, 2652-2663.
Sternberg, S. (1966). High-speed scanning in human memory. Science, 153, 652-654.
Stejskal, E. O. & Tanner, J. E. (1965). Spin diffusion measurements: spin echoes in the presence

45
of a time-dependent field gradient. The Journal of Chemical Physics, 42, 288–292.
Takahashi, E., Ohki, K., & Kim, D. S. (2007). Diffusion tensor studies dissociated two fronto-
temporal pathways in the human memory system. Neuroimage, 34, 827-838.
Takahashi, S., Yonezawa, H., Takahashi, J., Kudo, M., Inoue, T., & Tohgi, H. (2002). Selective
reduction of diffusion anisotropy in white matter of Alzheimer disease brains measured
by 3.0 Tesla magnetic resonance imaging. Neuroscience Letters, 332, 45-48.
Tuholski, S. W. (1997). Examining the relationships among attentional resources, working
memory and fluid intelligence. Unpublished doctoral dissertation, University of South
Carolina, Columbia, S.C.
Turner, M. L. & Engle, R. W. (1989). Is working memory capacity task dependent? Journal of
Memory and Language, 28, 127-154.
Unsworth, N., Heitz, R. R., Schrock, J. C., & Engle, R. W. (2005). An automated version of the
operation span task. Behavior Research Methods, 37, 498-505.
Van Essen, D. C., Newsome, W. T., Maunsell, J. H., & Bixby, J. L. (1986). The projections from
striate cortex (V1) to areas V2 and V3 in the macaque monkey: Assymetries, areal
boundaries and patchy connections. Journal of Comparative Neurology, 244, 451-480.
Varma, A. R., Adams, W., Lloyd, J. J., Carson, K. J., Snowden, J. S., Testa, H. J., et al. (2002).
Diagnostic patterns of regional atrophy on MRI and regional cerebral blood flow change
on SPECT in young onset patients with Alzheimer's disease, frontotemporal dementia
and vascular dementia. Acta Neurologica Scandinavica, 105, 261-269.
Wager, T. D. & Smith, E. E. (2003). Neuroimaging studies of working memory: a meta-analysis.
Cognitive, Affective, & Behavioral Neuroscience, 3, 255-274.
Wang, F., Sun, Z., Cui, L., Du, X., Wang, X., Zhang, H., et al. (2004). Anterior cingulum
abnormalities in male patients with schizophrenia determined through diffusion tensor

46
imaging. The American Journal of Psychiatry, 161, 573-575.
Wechsler D. (2008). Wechsler Adult Intelligence Scale (4th ed). San Antonio, TX: The
Psychological Corporation.
Wendelken, C., Bunge, S. A., & Carter, C. S. (2008). Maintaining structured information: an
investigation into functions of parietal and lateral prefrontal cortices. Neuropsychologia,
46, 665-678.
Yang, D. S., Hong, J. H., Byun, W. M., Kwak, S. Y., Ahn, S. H., Lee, H., et al. (2009).
Identification of the medial lemniscus in the human brain: combined study of functional
MRI and diffusion tensor tractography. Neuroscience Letters, 459, 19-24.
Yetkin, F. Z., Rosenberg, R. N., Weiner, M. F., Purdy, P. D., & Cullum, C. M. (2006). FMRI of
working memory in patients with mild cognitive impairment and probable Alzheimer's
disease. European Radiology, 16, 193-206.
Yucel, M., Pantelis, C., Stuart, G. W., Wood, S. J., Maruff, P., Velakoulis, D., (2002). Anterior
cingulate activation during Stroop task performance: A PET to MRI coregistration study
of individual patients with schizophrenia. The American Journal of Psychiatry, 159, 251-
254.
Zedkova, L., Woodward, N. D., Harding, I., Tibbo, P. G., & Purdon, S. E. (2006). Procedural
learning in schizophrenia investigated with functional magnetic resonance imaging.
Schizophrenia Research, 88, 198-207.

47
Figure 1.1. Cowan’s embedded-processes working memory model. Taken from Cowan,
2005.
Stimulus Onset, 0 s 2 s 20 s
Figure 1.2. Example BOLD signal after stimulus presentation.

48
Λ1v1
Λ2v2
Λ3v3
Figure 1.3. A diffusion tensor.

49
CHAPTER 2
METHODS
Participants
Twenty-five control participants were recruited to take part in this study. They were
recruited through the Psychology department's undergraduate research participant pool (a
research pool in which students in introductory psychology courses are required to participate)
and through local advertisement. Undergraduate students that participated in the study by
application through the research pool received the appropriate amount of hourly credit to be
applied towards their class. As an incentive, research and non-research pool participants received
structural images of their brain on a CD. Exclusion criteria included reports of previous head
injury, history of loss of consciousness, current drug abuse, evidence of neurodegenerative
process, and an estimated IQ below average. Participants could also not have a history of, present
clinical signs of, or currently be under treatment for, any major psychiatric symptoms or
disorders. The exception to the latter exclusion criteria was a history of depression, since a
significant portion of the population may have at one point presented with clinically diagnosable
symptoms (Pratt & Brody, 2008). Incompatibility with the MRI environment (e.g., metallic
implants, pacemakers, stents, etc.) was assessed through a standardized screening form (see
Appendix A) and participants were excluded given any signs of incompatibility.
Measures
Participants were made aware of the exclusion criteria before participating in the study.
Upon meeting with the investigator, participants were fully screened. Screening included
completing the MRI screening form, answering questions from the psychotic symptoms

50
screening portion of the Structured Clinical Interview for DSM-IV (SCID-I; First et al., 1997),
and being asked the exclusion criteria questions described earlier. Additionally, female
participants were asked to take a pregnancy test; even though the MRI environment has been
shown to have no adverse side-effects, this was taken as a precautionary measure. If screening
was successful, participants were given a brief IQ estimate, the Wechsler Test of Adult Reading
(WTAR; Wechsler, 2001) to rule out below average IQ.
fMRI Task and Stimulus Presentation
Participants were placed in a 3.0T GE Signa HDx MRI scanner, running software
v.14M5, and were presented with an fMRI compatible version of the OSPAN task, designed in
E-Prime, version 1.2 (Psychology Software Tools, 2006 ), Stimuli were presented through MRI
compatible goggles (Resonance Technology Inc.), participants responded through GE MRI
compatible response pads, and responses and reaction times (RTs) were recorded by E-Prime.
The procedure for this OSPAN task followed the sequence presented in Kondo et al. (2004) with
some modifications. Participants underwent two runs, each lasting 6m and 45s. Each run
contained 15 epochs that were presented in a fixed alternating order. Six of these were a baseline
condition in which participants were presented with arrows pointing either left or right and
responded by pressing the appropriate button on the response pad. Baseline epochs lasted for
30s. Three epochs consisted of the modified OSPAN task in which participants were presented
with an equation consisting of two operations and an answer (Turner and Engle, 1989). Their
task was to judge whether the equation was true or false, and they responded by pressing the
appropriate button on the response pad. Subsequently, they were presented with a letter which
they had to remember for later testing. Equations were presented for 4s, letters for 2s, and the
sequence repeated 5 times for a total of 30s. Participants were then presented with 5 arrays, each
consisting of 4 letters, for 3s each, for a total of 15s (Fig. 1). Participants were to identify the

51
letters presented, in serial order, with the appropriate button presses. In other words, for the first
array the participant identified which of the letters was the first letter presented, for the second
array they identified which was the second letter presented, and so on. For any of the epochs, if
the participants responded to a prompt after the allotted time, the response was considered
incorrect. The other three epochs consisted of an arithmetic only condition which was the same
as during the OSPAN task, except that no letters were presented. As in Kondo, et al. (2004),
participants were subject to the same amount of visual stimulation and motor output as during
the OSPAN. However, during the target letter portion they were instead presented with an
asterisk, thereby eliminating the memory component.
Imaging
3D structural scans were acquired using a fast spoiled gradient recall (FSPGR) protocol;
TE = min full, TR = 7.5 ms, flip angle = 20°, 154 axial slices, slice thickness = 1.2 mm, and
FOV = 256 x 256 mm. These images covered from the top of the head to the brainstem and
acquisition time took 6m and 20s. Functional scans were acquired using a T2*-weighted single
shot echo planar imaging (EPI) sequence; TE = 25 ms, TR = 1500 ms, 90° RF pulse, 30
interleaved slices, acquisition matrix = 64x64, spacing = 0 mm, slice thickness = 4 mm, FOV =
220 x 220 mm, and ASSET factor = 2, aligned to the inter-commissural (AC-PC) line and
covered from the top of the head to the temporal lobes. There were 2 runs, each consisting of 270
volumes, each run lasting for 6m and 45s. Diffusion weighted scans were acquired using a single
shot diffusion weighted EPI ASSET sequence and were in the same space as the fMRI images;
TE = min full, TR = 15100 ms, 90° RF pulse, 60 interleaved slices, spacing = 0 mm, 2 mm
isotropic voxels, acquisition matrix = 128x128, FOV = 256x256 mm, ASSET factor = 2.0, b-
value: 1000, and 30 gradient directions with 3 b0 images. Total scan time for the DTI acquisition
was 8m and 30s.

52
Procedure
Participants underwent a full screening, as outlined above, upon meeting with the
investigator the day of the experiment. A consent form was presented and signed and any
additional questions the participant may have had were answered at that time. If screening was
successful, participants were given the WTAR. After completing these measures, participants
were instructed on how to perform the OSPAN task. They practiced the task by viewing it on a
computer monitor and tapping their finger to the appropriate response as they would in the MRI.
This was supervised by the researcher to ensure participants were performing the task correctly.
After practice, participants were placed in the MRI scanner and were subjected to structural,
functional, and diffusion imaging sequences using the procedures previously specified. During
the structural scan participants performed a full, practice run of the OSPAN in order to further
become acquainted with the task and scanner environment. Behavioral data was acquired during
the practice run. Participants then completed both fMRI scans and later the DTI scan.
Correct responses were analyzed though E-Prime software and later correlated with fMRI
defined regions of activation for the main contrast of interest, OSPAN - Arithmetic. All imaging
data was processed using the FMRIB Software Library (FSL; Smith et al., 2004). The fMRI data
was analyzed using the fMRI Expert Analysis Tool (FEAT; Beckmann, Jenkinson, & Smith,
2003; Woolrich, Ripley, Brady, & Smith, 2001) provided in the FSL suite. DTI data was
analyzed using the software programs within FMRIB’s Diffusion Toolbox (FDT).
Data Analysis
Participants whose behavioral data indicated they were performing below chance levels
would have had their MRI data excluded from analysis. However, performance for all the
participants was above chance levels so this step was not necessary. Before MRI data was
analyzed using FSL, it was converted from its native GE DICOM format to NIFTI format. This

53
was done using the dcm2nii conversion tool (Rorden, 2007). After conversion fMRI data was
input into FEAT and analysis parameters were specified. FEAT calls on a number of procedures
during its operation and the specifics of these are outlined here. The first portion of the analysis
consisted of examining each participant’s runs separately. For the “Pre-stats” portion of the
analysis, the images were initially motion corrected using Motion Correction FLIRT (MCFLIRT;
Jenkinson, Bannister, Brady, & Smith, 2002), a variant of the linear registration tool, FMRIB
Linear Registration Tool (FLIRT; Jenkinson et al., 2002) that has been developed to specifically
correct motion during fMRI acquisition. The images were then slice time corrected, to account
for the interleaved acquisition, so that each voxel’s time series could be appropriately examined
relative to the TR. Each participant’s fMRI images were also brain extracted using the Brain
Extraction Tool (BET; Smith, 2002), using the default fractional intensity threshold of 0.4 that is
suited for brain extraction of fMRI data. As a procedural matter, FEAT then thresholds the
images at 10% of their robust range and creates a mask from this thresholded image that is used
to specify what area of the original images are going to be to subject to smoothing. The purpose
of creating a mask from a thresholded image is so the mask has less chance encompassing non-
brain regions. Using this mask, FEAT smoothed the images at the user specified value of
6.875mm, twice the voxel dimensions in the x and y planes. A high-pass temporal filter,
calculated at 135s (OSPAN + Response + Baseline + Arithmetic + Baseline times) was then
applied to the data to remove any low frequency linear signal variation introduced by scanner
drift.
For the “stats” portion of the fMRI analysis, the data were first prewhitened to remove
inter-voxel auto-correlation. The three non-baseline portions of the experiment, OSPAN,
Response, and Arithmetic, and their respective time courses were specified to FEAT. The
following contrasts were then set up: OSPAN – Baseline, OSPAN – Arithmetic, Arithmetic –

54
Baseline, and Arithmetic – OSPAN. The Response portion of the experiment was not of interest
(the focus of this experiment was not serial identification/recall) but was specified so that it
would not be included as part of the Baseline, which is considered an intrinsic variable by the
General Linear Model. Before statistical analysis was performed, the head motion parameters
estimated from MCFLIRT were added as confound/regressor variables to the design. This was
done to help remove any false positives that may have occurred as a result of motion.
FEAT’s statistical analysis initially consists of fitting a model of the experimental time
course to each voxel and determining how well it fits. Since the sharp cutoffs of the on/off
periods for the blocks do not correspond with the way blood flow increases and decreases in the
brain, the hemodynamic response function was convolved with the time course to alleviate this
problem. This produced a more accurate model of what the time course for a given a voxel
related to the model of interest should resemble. The fit of the model at each voxel, or the
parameter estimate (PE) as it is termed in FEAT, was then converted into a T statistic by the
equation T = PE/ standard error (PE) (Jezzard and Smith, 2001), and then converted into a
standardized Z –value. A Z-statistic image was then available for the OSPAN and Arithmetic
conditions minus the Baseline. To determine which of these conditions best fit each voxel, the
PEs for the conditions of interest were subtracted from each other, the standard error calculated,
and turned into T and Z statistic images; the contrasts for this experiment were specified above.
After analysis, the individual’s brain, with the un-thresholded fMRI data represented as Z-values,
was warped to the 91x109x91mm MNI standard brain. This was done by calculating a 6-degree
affine transform to the individual’s 3D structural scan, then calculating a 12-degree affine
transform from the 3D brain to the MNI standard brain. These transforms were then combined to
allow the fMRI data to be properly warped into MNI space.
Second level analysis consisted of running a fixed effects analysis, rather than a mixed

55
effects analysis, in order to conserve the variance unique to each individual. This resulted in
another set of Z-statistic images. The third level analysis, which combines the averaged data for
the individuals into one group Z-statistic image, was performed using a typical mixed-effects
model. Given the extensive amount of comparisons that were performed throughout the images,
these images were thresholded using a cluster thresholding method. In this method, a set number
of contiguous voxels must all pass a specified statistical threshold before the cluster is considered
a site of activation. In FEAT, the default number of minimum voxels is 26, the default Z
threshold is 2.3, and the default p is 0.05. For this experiment the cluster threshold was left at 26,
the Z was increased to 4.0, and the p to 0.03. The latter two were changed from their default
values in order to increase the specificity of the results. Aside from the main contrasts of
interests, another third level analysis was performed using the number of correct letter
identification responses as a regressor. This analysis yielded regions that were positively and
negatively correlated with number of correct letter responses. In other words, this analysis
yielded regions whose activation or de-activation during the storage, retrieval, and updating
operations significantly correlated with correct letter identification during the response period.
Sites of activation can be determined in a number of ways when using FSL. The FEAT
analysis results are initially output in HTML format. These results list the activation clusters and
their corresponding local maxima and voxel locations. Careful examination of this list can yield
valuable information not immediately apparent from solely examining the highest activated
voxel within a cluster. In other words, examining only the highest activated voxel within a
cluster is misleading. This is because sites of activation may blend into each other, obscuring the
user from extracting pertinent information from regions whose voxels may exhibit a lower level
of activity. By examining the list of local maxima in the HTML file, peaks of activation not
initially apparent may be defined. However, this list may at times not be sufficient and the use of

56
the FEATQuery tool may be necessitated. The FEATQuery tool allows the user to inquire as to
whether a region of interest exhibits activation that is above threshold but was not initially easily
differentiable from within, say, a large cluster of 3,000 voxels. After running through the
FEATQuery tool, a much better understanding of the activation patterns seen within the group,
or an individual if one so chooses, can be reached. For the group analysis in this experiment it
was necessary to call on the FEARQuery program in order to more accurately define active brain
regions.
After determining the cortical sites of activation for the group, the peak activation voxels
within those regions were used as the basis for seeding and tracking points for DTI-based
tractography. A 6mm dilation radius was specified for each of the voxels, resulting in masks
consisting of 123, 2mm isotropic voxels. The 6mm radius was chosen for the masks based on the
size range of the activation sites. In other words, a 6mm radius mask would not cover a region
that would be larger than the smallest sites of activation used as a ROIs. Additionally, using too
large of a mask might have reduced the specificity of the yielded tracts connecting the ROIs.
After making the spherical masks, they were transformed to each individual’s DWI space
through a non-linear transformation. The non-linear transformation matrices were calculated by
transforming the standard FA map to each individual’s FA map (calculated using DTIFIT from
FDT). The procedure went as follows: First, the standard FA map included in FSL was
transformed from a 1mm isotropic voxel image (182 x 218 x 182 mm) to a 2mm isotropic voxel
image (91 x 108 x 91 mm) in order to match the space of the masks. For each individual, a linear
affine transform for the standard FA map was estimated using FLIRT. This linear transform was
then used as a basis to estimate a non-linear transform for the same.
To prepare the DWI images for tractography in FDT, they first underwent a number of
pre-processing steps. These images were first eddy current corrected and realigned using the first
57
b0 image as a reference. They were then brain extracted using BET, while specifying a lenient
value of .25 for the fractional intensity threshold. This value was chosen for brain extraction
based upon visual inspection of a variety of BETed DWI using different threshold values. The
default value, .50, does not seem appropriate for the contrast of DWI images and removed
excessive amounts of brain tissue. The adjusted value, .25, while possibly leaving some CSF in
the image, leaves the brain intact and is sufficient to adequately remove the skull. After brain
extraction the 4D series of DWIs was temporally split, resulting in 33 separate images (3 b0 and
30 DWIs). The 3 b0 images were averaged and a brain mask was created from the average image
for later use by the FDT sub-routines. The images (averaged b0 and 30 DWIs) were then
reassembled into a 4D file and were input into BEDPOSTX (Bayesian Estimation of Diffusion
Parameters Obtained using Sampling Techniques; Behrens, Berg, Jbabdi, Rushworth, &
Woolrich, 2007), which performed a Bayesian estimation of the diffusion parameters by
repetitively sampling diffusion pathways at each voxel through Markov Chain Monte Carlo
simulations.
The data was then run through the tractography program PROBTRACKX (Probabilistic
Tractography of Crossing fibers; Behrens et al., 2007). PROBTRACKX takes the diffusion
distributions estimated in BEDPOSTX and uses those as a basis for a probabilistic tractography
technique. In other words, “it repetitively samples from the distributions on voxel-wise principal
diffusion directions, each time computing a streamline through these local samples to generate a
probabilistic streamline or a sample from the distribution on the location of the true streamline”
(FSL website; http://www.fmrib.ox.ac.uk/fsl/fdt/fdt_probtrackx.html). The details of the tracking
method performed for this experiment were as follows: First, a symmetric tracking scheme was
used, meaning that for a pair of masks A and B, used as seeds and targets, tractography was
performed twice with the masks playing opposite roles in each tracking; in one instance A was a

58
seed and B a target and in the other instance B was a seed and A a target. This was done to help
ensure that tractography results represented the true nature of the fiber pathways as accurately as
possible. Additionally, each target mask was specified as a waypoint and termination mask,
meaning that any tract depicted in the results must have reached the target and that tracking
should stop when the streamlining process reached the target. For the streamlining process itself,
15,000 streamlines were sent out from each voxel. This was done, again, to help ensure a more
accurate representation of the actual fiber pathways. The curvature threshold, the maximum
allowable curve a pathway may have before it is terminated, was 80°, the step length was .5mm,
and the number of steps was 2,000. Also, any pathways that looped back on themselves were
terminated. After all the tracts had been calculated for an individual they were thresholded at a
value of 5 to remove any “stray” or noisy fibers. Tracts were then combined into a single image
to form the working memory structural connectivity map for each individual. These maps were
then converted to standard space in the same manner as the masks were transformed to the
individual’s space. To make the group connectivity map the images were binarized and then
combined into a single image. The values in this map indicated how many individuals had a tract
passing through a given voxel.

59
References
Beckmann, C. F., Jenkinson, M., & Smith, S. M. (2003). General multilevel linear modeling for
group analysis in FMRI. Neuroimage, 20, 1052-1063.
Behrens, T. E. J., Berg, H. J., Jbabdi, S., Rushworth, M. F. S., & Woolrich, M. W. (2007).
Probabilistic diffusion tractography with multiple fibre orientations: What can we gain?
Neuroimage, 34, 144-155.
First, M. B., Spitzer, R. L., Gibbon, M., & Williams, J. B. (1997). Sctructured Clinical Interview
for DSM-IV Axis I Disorders (SCID-I), Clinical Version. Arlington, VA: American
Psychiatric Publishing, Inc.
Jenkinson, M., Bannister, P., Brady, M., & Smith, S. (2002). Improved optimization for the
robust and accurate linear registration and motion correction of brain images.
Neuroimage, 17, 825-841.
U.S. Department of Health and Human Services. (2008). Depression in the United States
household population, 2005-2006 (DHHS Publication (PHS) 2008-1209). Hyattsville,
MD: Pratt, L. A. & Brody, D. J.
PST (2006). E-Prime (Version 1.2.1.845). Pittsburgh: Psychology Software Tools.
Rorden, C. (2007). DCM2NII (Version October 7) [Computer software].
Smith, S. M. (2002). Fast robust automated brain extraction. Human Brain Mapping, 17, 143-
155.
Smith, S. M., Jenkinson, M., Woolrich, M. W., Beckmann, C. F., Behrens, T. E., Johansen-Berg,
H., et al. (2004). Advances in functional and structural MR image analysis and
implementation as FSL. Neuroimage, 23 Suppl 1, S208-219.
Turner, M. L., & Engle, R. W. (1989). Is Working Memory Capacity Task Dependent. Journal
of Memory and Language, 28, 127-154.

60
Wechsler D. (2001). Wechsler Test of Adult Reading. San Antonio, TX: The Psychological
Corporation.
Woolrich, M. W., Ripley, B. D., Brady, M., & Smith, S. M. (2001). Temporal autocorrelation in
univariate linear modeling of FMRI data. Neuroimage, 14, 1370-1386.

61
Condition O R B A B Duration (s) 30 15 30 30 30 Figure 2.1. Working memory task block design. O: OSPAN, R: word recognition, B: baseline, and A: arithmetic condition.

62
CHAPTER 3
ELICITING WORKING MEMORY CORTICAL ACTIVITY THROUGH A COMPLEX SPAN
TASK1
1Faraco, C. C., Smith, D., Unsworth, N., Li, K., Langley, J. and Miller, L. S. To be submitted to Neuroimage

63
Introduction
Working memory (WM) is thought of as a system in which information currently in the
focus of attention can be maintained and manipulated if desired. It is also seen as a gateway
through which sensory information can enter into long term memory (LTM) or through which
information can be recruited from LTM into the focus of attention (Atkinson & Shiffrin, 1968;
Baddeley & Hitch, 1974; Cowan, 1988; Engle, Kane, & Tuholski, 1999; Unsworth & Engle,
2007). WM functioning, therefore, is critical to the operation of many cognitive processes. For
example, WM is recruited while performing everyday tasks such as grocery shopping, while also
being recruited for tasks as abstract as letter-number sequencing. A properly functioning WM
system enables an individual to keep attention on the desired goal (keeping the grocery list in
mind in order to gather the desired items) while preventing other environmental or cognitive
stimuli (e.g., thoughts of goals to be completed the following work day) from interfering with the
completion of the desired goal. Furthermore, working memory is crucial when attempting to
override our automatic responses through a set a cognitions (Unsworth & Engle).
Depending on the task at hand, the WM system may implement a number of different
procedures, including: encoding, storage, retrieval, maintenance, manipulation, and updating
(Cowan, 2005). Using the grocery shopping list as an example by which to define some of these
components, the encoding portion is the perception of the cognitions needed to create the
shopping list; storage is the process of placing these perceptions/cognitions into LTM, which
may be occurring simultaneously to encoding; retrieval is the process of accessing these
memories from LTM; and updating is the process by which the list is revised to reflect the items
already acquired. WM itself though is a short-term store where information retrieved from LTM,
or newly acquired information that has been linked with other information in LTM (necessary in
order to attach meaning to the new information), is manipulated, updated, and maintained in

64
accordance with the aim of the present goal state. Even though WM functioning can be logically
discretized into these processes, it is relatively difficult to determine which of these components
may be defective in an individual exhibiting poor WM performance. In schizophrenia patients,
for example, working memory deficits are a core aspect of the disorder (Forbes, Carrick,
McIntosh, & Lawrie, 2009; Piskulic, Olver, Norman, & Maruff, 2007; Reichenberg & Harvey,
2007). These deficits materialize in a variety of different ways such as poor verbal WM
(Conklin, Curtis, Katsanis, & Iacono, 2000; Zilles, Burke, Schneider-Axmann, Falkai, & Gruber,
2009), poor visuospatial WM (Fleming et al., 1997; Pantelis et al. 2009), and low attention-span
(Ragland, Yoon, Minzenberg, & Carter, 2007). The underlying causes of these deficits are
thought to be dysfunctional cortical regions and/or dysfunctional connectivity between regions.
Neuroimaging studies of working memory have demonstrated that a variety of cortical
regions are involved in this complex cognitive process. The prefrontal cortex (PFC) is believed
to be integral to working memory and executive control (D’Esposito, Postle, & Rypma, 2000;
Owen, McMillan, Laird, & Bullmore, 2005; Wager & Smith, 2003). Sub-sections of the PFC,
such as ventrolateral prefrontal cortex (VLPFC) and dorsolateral prefrontal cortex (DLPFC),
have been said to be involved in object and spatial domain specific processing (Courtney, Petit,
Haxby, & Ungerleider, 1998; Smith & Jonides, 1999), respectively. However, an extensive
review of the neuroimaging literature by Wager and Smith indicated that PFC sub-regions were
not so much domain specific as they were process specific, with the DLPFC being involved in
executive processes, such as attentional control, and the VLPFC in storage-related processes.
The anterior cingulate cortex (ACC) is also believed to be necessary for proper working memory
function and is believed to be involved in conflict monitoring and error detection (Bernstein,
Scheffers, & Coles, 1995; Botvinick, Braver, Barch, Carter, & Cohen, 2001; MacDonald, Cohen,
Stenger, & Carter, 2000). Both of these latter processes are attentional control processes and as

65
such the ACC is believed to be critical to cognitive control (Smith & Jonides; Osaka et al.,
2003). Furthermore, Kaneda et al. (2008) suggest that the ACC may play a greater role in
executive functioning than the DLPFC.
The parietal lobes are thought to play a role as an associative center and be involved in
higher level cognitive processes. Parietal regions are believed to be crucial to working memory
processes and are generally thought to function as storage regions (Hamidi, Tononi, & Postle,
2008; Postle, 2006; Postle & D’Esposito, 1999; Rowe, Toni, Josephs, Frackowiak, &
Passingham, 2000; Srimal & Curtis, 2008). More specifically, the superior parietal lobule (SPL)
and/or precuneus (Brodmann area 7) is believed to be crucial in maintaining and organizing
items held in the working memory store (Wager & Smith; Wendelken, 2008), while the
supramarginal gyrus is thought to retrieve the temporal ordering of items that have been
displaced from the focus of attention through serial scanning (Öztekin, McElree, Staresina, &
Davachi, 2008). Another function of the parietal cortex is thought to be stimulus-response
mapping, which is the selection of an appropriate response for a specific stimulus (Corbetta &
Shulman, 2002; Miller, 2000; Miller & Cohen, 2001).
Several models of the WM system have been proposed since Atkinson and Shiffrin’s
(1968) description, widely known as the two-store model. They proposed the WM system
consisted of three components: the sensory registers which detect environmental stimuli and
input this information into the system, a short term store for this information, and a long term
store where information can be stored for an unspecified amount of time for possible retrieval at
another point. WM is then thought of as the retrieval of information from the long-term store by
the short-term store, whereby the information can then be manipulated. Baddeley and Hitch
(1974) modified this theory, based on experimental results of short term memory depletion, and
divided it into a three store system consisting of a central executive that controls the visuo-spatial

66
sketchpad and phonological loop slave systems; a fourth component, an episodic buffer, was
added later (Baddeley, 2000). The slave system constructs demonstrate the idea that inter-modal
sensory information is initially manipulated and processed independently. The episodic buffer
acts as an integration system for different modalities.
Others have adopted views that echo the core assumptions of Atkinson and Shiffrin
(1968) and Baddeley and Hitch (1974); information is at some point stored in a location, i.e.,
LTM, from which it is then retrieved by another system, i.e., STM, to be manipulated, but have
emphasized the concept of capacity limits. Cowan’s (1988, 1999) embedded processes model is
concerned with the portion of information residing in LTM that has been activated and the sub-
portion of this that we are consciously aware of, known as the focus of attention. Working
memory capacity differences arise from the ability to keep the focus of attention on the task at
hand while suppressing interference from environmental stimuli or irrelevant cognitions caused
by the activation of other regions of LTM. Engle, Kane, and Tuholski’s (1999) controlled
attention model takes a similar approach to Cowan’s embedded-processes model by stating that
the “capacity for controlled, sustained attention in the face of interference or distraction” of an
individual is manifested as that individual’s working memory capacity. However, they argue that
short-term memory is not a component of WM. Structural equation modeling relating the
constructs short-term memory and WM to their respective tasks and to general fluid intelligence
revealed that a two-factor model was a better fit than one having STM equated with WM (Engle,
Tuholski, Laughlin, & Conway, 1999).
Several tasks have traditionally been used to assess working memory ability, with many
of these being span tasks designed to test capacity limits. For example the digits backwards and
letter-number sequencing tasks both assess capacity while at the same time requiring the ability
of mental double-tracking, meaning that memorizing and reversing/ordering operations must be

67
performed simultaneously (Lezak, Howieson, & Loring, 2004, pp. 359-363). Other tasks like
Daneman and Carpenter’s (1980) reading span task and Turner and Engle’s (1989) operation
span (OSPAN) task are complex span tasks requiring the participant to engage in a processing
activity that is irrelevant to the information to be memorized. Typically a task such as the n-Back
(Gevins & Cutillo, 1993) has been used for functional neuroimaging of WM. During the n-back
task, subjects are presented with a series of stimuli and are asked either if the present stimulus
matches a stimulus presented n trials back (usually 1 to 3) or to identify how many trials back the
present stimulus was shown The n-back task has been shown to consistently activate: 1) bilateral
and medial posterior parietal cortex; 2) bilateral premotor cortex; 3) dorsal cingulate/medial
premotor cortex, including supplementary motor area; (4) bilateral rostral prefrontal cortex
(rPFC) or frontal pole; 5) bilateral dorsolateral prefrontal cortex (DFPFC); and (6) bilateral mid-
ventrolateral prefrontal cortex (mvPFC) or frontal operculum (Owen, et al., 2005). The n-back
has been shown to account for variability in general fluid intelligence (Gf), but only under a 3-
back condition, and this variance in Gf is separate than that accounted for by WM span (Kane,
Conway, Miura, & Colflesh, 2007).Even though the n-back may require a specific type of
working memory, it has also been shown to exhibit weak correlations with WM span in general
(Oberauer, 2005). WM span, though, has been shown to account for up to half the variability in
Gf (Conway, Kane, & Engle, 2003; Kane, Hambrick, & Conway, 2005). The OSPAN task itself
has been shown to have high levels of reliability and internal consistency (Klein & Fiss, 1999),
but unfortunately has not seen much use in neuroimaging studies. An automated version of the
OSPAN, such as might be used in a functional imaging study, has also demonstrated high levels
of reliability and internal consistency, and shown high levels of correlation with other measures
of WM (Unsworth, Heitz, Schrock, & Engle; 2005). Kondo et al. (2004) used a modified version
of the OSPAN task to assess the functional connectivity differences of the cingulo-frontal

68
network between high-span and low-span individuals. The OSPAN was found to elicit activation
in regions usually activated during the n-back across both groups, while the high-span group also
exhibited significant activation in the inferior temporal cortex.
In this study we aimed to expand on the findings of Kondo et al. (2004) by determining
the cortical regions involved in the interdependent processes of storage, retrieval, and updating,
as used during a complex working memory span task. We believe Kondo et al. is an important
paper in the neuroimaging WM literature because it was the first to demonstrate that the OSPAN
task can be used during fMRI acquisition. However, we felt Kondo et al. may have had some
limitations, mainly in terms of the lack of discussion on the activation differences between the
complex and simple span tasks. We have improved on Kondo et al. in several respects. Firstly, a
3T MRI was used with the aim of improving detection power; secondly, the time to repetition
(TR) was reduced to 1.5s, with the aim of improving the time course mapping for each voxel;
and thirdly, the slice thickness was reduced to 4mm, with the aim of improving spatial
specificity. The OSPAN task presentation used for this study was also modified in several ways.
Firstly, the task presentation was shorter, since we were able to acquire the same amount of
volumes in half the time; secondly, since we were focusing on examining regions activated
during the storage, retrieval, and updating processes of working memory we omitted a block
devoted solely to examining maintenance and updating (a block where only letters were
presented); and lastly, the to-be-remembered items were consonants, instead of words.
Consonants were chosen for this version to prevent the participant from using higher level verbal
and/or visual strategies to represent the to-be-remembered stimuli.
To determine the regions involved in storage, retrieval, and updating, we contrasted
activity observed during the OSPAN letter and Arithmetic presentation block with that of the
Arithmetic block. The cognitive operations occurring during the arithmetic manipulations in both

69
blocks should be the same, as the complexity of the arithmetic task should displace the letters
from the focus of attention during the OSPAN. Therefore, contrasting the two blocks should
yield the regions involved in storing the letters upon their presentation, retrieving them from
LTM after the presentation of the equation, and updating the letter set as new letters are
presented. We hypothesized these operation would still yield activation in regions commonly
associated with working memory, such as VLPFC, DLPFC, anterior cingulate, SPL, and inferior
parietal lobule (IPL). Additionally, Kondo et al. (2004) found activation in the premotor cortex
for the low span group. Since we did not divide individuals into low and high span, and have
increased detection ability, we hypothesize to find premotor activation across the group of
individuals.
Materials and Methods
Participants
Twenty-five students from the University of Georgia were recruited for this study
through the university’s research pool and through word of mouth; 17 females and 8 males,
average age = 24.8 ± 2.8. Exclusion criteria included self-report of previous head injury, history
of loss of consciousness, current drug abuse, evidence of neurodegenerative processes, and an
estimated below average IQ. Participants could also not have a history of, present clinical signs
of, or currently be under treatment for, any major psychiatric symptoms or disorders. The
exception to the latter exclusion criteria was a past history of depression, since a significant
portion of the population may have at one point presented with clinically diagnosable symptoms
(Pratt & Brody, 2008). Incompatibility with the MRI environment (e.g., metallic implants,
pacemakers, stents, etc.) was assessed through a standardized screening form and participants
were excluded given any signs of incompatibility.
Measures

70
Participants were made aware of the exclusion criteria before participating in the study.
Upon meeting with the investigator, participants were fully screened. Screening included
completing the MRI screening form, answering questions from the psychotic symptoms
screening portion of the Structured Clinical Interview for DSM-IV (SCID-I; First et al., 1997),
and being asked the exclusion criteria questions described earlier. Additionally, female
participants were asked to take a pregnancy test; even though the MRI environment has been
shown to have no adverse side-effects, this was taken as a precautionary measure. If screening
was successful, participants were given a brief IQ estimate, the Wechsler Test of Adult Reading
(WTAR; Wechsler, 2001) to rule out below average IQ.
Stimulus presentation
Participants performed the OSPAN task in a similar fashion to Kondo et al. (2004), with
the main difference being that the Memory condition was excluded from the presentation because
activation during this encoding condition did not appear to reveal information above and beyond
what could be gained without it. Excluding this condition also helped to significantly reduce
scanning time. The full presentation of the task lasted 6 m and 45 s, with fixed alternating
conditions of OSPAN (Arithmetic + Memory), Arithmetic, and Baseline; there were 3 OSPAN
and Arithmetic epochs, and 6 Baseline epochs, each lasting 30 s. The OSPAN epochs were
always followed by 15 s Response epochs (Fig. 3.1). Participants initially practiced the task by
viewing it on a computer monitor and tapping their finger to the appropriate response as they
would with the response pads in the MRI. This was supervised to ensure participants were
performing the task correctly. After practice, participants were placed in the MRI scanner.
During the structural scan participants performed a practice run of the task in order to further
become acquainted with the task and scanner environment. Participants then performed 2 runs
while functional data was acquired. The task was designed in E-Prime, version 1.2 (Psychology

71
Software Tools, 2006), stimuli were presented through MRI compatible goggles (Resonance
Technology Inc.), participants responded through GE MRI compatible response pads by using
their index and middle fingers, and responses and reaction times (RTs) were recorded by E-
Prime. Behavioral data was acquired during all 3 runs in the scanner.
OSPAN Paradigm
Each run was preceded by a set of visual instructions and contained 15 epochs; 3 OSPAN
+ 3 Response + 3 Arithmetic + 6 Baseline. The OSPAN, Arithmetic, and Baseline conditions
were structured so that participants received similar amounts of visual input and gave the same
amount of motor output. During the Baseline condition participants were presented with arrows
pointing either left or right (4 s duration) and responded by indicating which direction the arrow
was pointing with the appropriate button press. Presentation of arrows alternated with the
presentation of asterisks (2 s duration). During the OSPAN (Turner and Engle, 1989) condition
participants were presented with an equation consisting of two operations. Their task was to
judge whether the equation was true or false and to respond by pressing the appropriate button on
the response pad. Subsequently, they were presented with a letter which they had to remember
for later testing. Equations were presented for 4 s, letters for 2 s, and the sequence repeated 5
times. Participants were then presented with 5 arrays, each consisting of 4 letters, for 3 s each.
They were to identify the letters presented, in serial order, with the appropriate button presses. In
other words, for the first array the participant identified which of the letters was the first letter
presented, for the second array they identified which was the second letter presented, and so on.
For any of the epochs, if the participants responded to a prompt after the allotted time, the
response was considered incorrect. The Arithmetic condition was the same as during the OSPAN
task except that there were no to-be-remembered letters; asterisks were instead presented in their
place thereby eliminating the memory component. As in Kondo, et al. (2004), participants were

72
subject to the same amount of visual stimulation and motor output as during the OSPAN.
MRI acquisition
3D structural scans were acquired using a fast spoiled gradient recall (FSPGR) protocol;
TE = min full, TR = 7.5 ms, flip angle = 20°, 154 axial slices, slice thickness = 1.2 mm, and
FOV = 256 x 256 mm. These images covered from the top of the head to the brainstem and
acquisition took approximately 6m and 20s. Functional scans were acquired using a T2*-
weighted single shot echo planar imaging (EPI) sequence and were aligned to the
intercommisural line (AC-PC line); TE = 25 ms, TR = 1500 ms, 90° RF pulse, 30 interleaved
slices, acquisition matrix = 64x64, spacing = 0 mm, slice thickness = 4 mm, FOV = 240 x 240
mm, and ASSET factor = 2. Functional images were covered the entire cortical surface and a
portion of the cerebellum. Each run consisted of 270 volumes and 10 dummy samples were
discarded during the initial acquisition.
Data analysis
All data were processed using FMRIB Software Library (FSL; Smith et al., 2004). Before
MRI data was analyzed using the FMRI Expert Analysis Tool (FEAT), it was converted from its
native GE DICOM format to NIFTI format using the dcm2nii conversion tool (Rorden, 2007).
Each participant’s fMRI data was motion corrected using the Motion Correction FMRIB Linear
Registration Tool (MCFLIRT; Jenkinson, Bannister, Brady, & Smith, 2002). The images were
then slice time corrected to account for the interleaved acquisition and then brain extracted using
the Brain Extraction Tool (BET; Smith, 2002). Images were smoothed using a 6.875 mm
isotropic Gaussian filter, twice the voxel dimensions in the x and y planes. A high-pass temporal
filter, calculated at 135s (OSPAN + Response + Baseline + Arithmetic + Baseline times), was
applied. The data were prewhitened to remove inter-voxel auto-correlation. Head motion
parameters estimated from MCFLIRT were added as confound/regressor variables to the design.

73
This was done to help remove any false positives that may have occurred as a result of motion. A
standard hemodynamic response function was convolved with each run’s time course. For each
run four contrasts were specified, these were: OSPAN – Baseline, OSPAN – Arithmetic,
Arithmetic – OSPAN, and Arithmetic – Baseline. The Response period of the task was not
contrasted, since it was not of interest for the purposes of this study, but was specified in the
model so that it would not be confused with the implicit Baseline variable. The main contrast of
interest was the OSPAN – Arithmetic contrast, since this would yield the areas associated with
the storage, retrieval, and updating operations under investigation. The OSPAN – Baseline and
Arithmetic – Baseline conditions were also interest of because an examination of these would
show the regions of activation common to both tasks. After analysis, the results were warped to
the 91x109x91mm MNI standard brain.
A second level analysis, which combined each individual’s runs, was performed using a
fixed effects analysis. A third level analysis, which combined the averaged data for the
individuals into one group Z-statistic image, was performed using a mixed-effects model. Images
were thresholded using a cluster threshold of 26 voxels (default), a Z-value of 4.0, and a p of
0.03. Another third level analysis, using voxel thresholding (p = 0.05), was performed using the
number of correct letter identification responses as a regressor. This analysis yielded regions that
were positively and negatively correlated with number of correct letter responses. In other words,
this analysis yielded regions whose activation or de-activation during the storage, retrieval, and
updating operations significantly correlated with correct letter identification during the response
period.
Results
Behavioral results
All participants completed both functional runs; answering the equations during the

74
OSPAN and Arithmetic conditions at 87% (M = 13, SD = 2.35) and 85% (M = 12.8, SD = 2.93)
accuracy, respectively, and recalling the letters in serial order during the OSPAN at 87% (M =
13.04, SD = 3.43) accuracy (Table 3.1). Average RTs for the equations were 2371.29 ms (SD =
169.31) for the OSPAN blocks and 2458.11 ms (SD = 175.39) for the Arithmetic blocks (Table
3.1). Paired sample t-tests revealed a significant effect for equation verification RT, t(24) = 4.15,
p < .001, with RTs during the OSPAN blocks occurring faster; no significant effect was found
for number of correct equations t(24) = .661, p < .515. These RT results are in accordance with
those in Kondo et al (2004).
fMRI results
Activation sites for the OSPAN and Arithmetic tasks were very similar, with more robust
activation occurring during the OSPAN (Fig. 3.2a-b, respectively).
Activation sites of interest were related to the OSPAN – Arithmetic (complex span task –
single task) contrast; this contrast was designed to reveal letter storage, retrieval, and updating
activation that took place during the OSPAN task. The average group activation map,
thresholded at a cluster size of 26, Z = 4.0, and p = 0.03, revealed very robust, but defined
activation in a variety of regions associated with working memory (Fig. 3.3). Activated regions
of interest were determined by two methods. The first was to examine the list of local maxima
for each cluster. The second was to look for specific ROIs whose local maxima were within large
clusters with many other local maxima. This latter method was specifically used to determine the
local maxima for the ACC since it was a predefined region of interest (ROI), it’s local maximum
was not on the initial cluster list, and the cluster encompassing it contained 3,484 voxels. The list
of activated regions for the OSPAN – Arithmetic contrast and their corresponding Z values are
listed in Table 3.2. Activation was seen in all expected ROIs; with many of the ROIs exhibiting
multiple activation sites. For example, in the frontal lobes activation was observed in the left pars

75
opercularis of the inferior frontal gyrus (-54, 12, 20, Z = 5.92), and bilateral DLPFC (R = 30, 38,
24, Z = 6.44; L = -38, 42, 32, Z = 6.18) and precentral gyrus (R = 48, 2, 38, Z = 5.47; L = -50, -
10, 48, Z = 6.72). In the parietal cortex, activation was observed in the left SPL (-26, -56, 44, Z =
5.98), bilateral precuneus cortex (R = 12, -66, 38, Z = 6.22; L = -8, 74, 38, Z = 5.14), and the IPL
(R angular gyrus = 44, -48, 24, Z = 5.18; L supramarginal gyrus = -44, -46, 34, Z = 6.01). Large
regions of activation were seen encompassing the juxtapostional lobule (supplementary motor
cortex) and the precentral gyrus. Activity was also observed in regions less commonly reported
in working memory studies, such as the right insula (34, 16, 6, Z = 5.09).
Additional analyses, voxel-wise corrected at p < .05, using the average number of letters
correctly identified per participant as a regressor yielded regions positively (Table 3.3) and
negatively (Table 3.4) correlated with the number of correct responses. Regions positively
correlated with letter identification accuracy included left paracingulate/ACC (-2, 54, 6, Z =
3.16), left medial temporal gyrus (-52, -46-, -8, Z = 4.28), right frontal pole (2, 60, 12, Z = 4.16),
and pars opercularis of the right inferior frontal gyrus (60, 14, 18, Z = 4.09). Regions negatively
correlated with letter identification accuracy included left superior parietal lobule BA (-22, -44,
60, Z = 3.21), right lateral occipital/cuneal cortex (14, -82, 42, Z = 4.18), left parietal operculum
cortex (-54, -38, 22, Z = 4.19), right postcentral gyrus (34, -34, 66, Z = 3.11), and left angular
gyrus (-40, -60, 18, Z = 4.27).
Discussion
The aim of the present study was to determine regions involved in WM storage, retrieval,
and updating during a complex working memory span task, while also demonstrating that the
OSPAN task is a valid and desirable task to use for an fMRI WM paradigm. The fMRI activation
map of interest for the above mentioned cognitive functions was calculated from the OSPAN –
Arithmetic contrast. This contrast should theoretically yield activation related to these functions,

76
since the Arithmetic block controls for all the motor and basic cognitive operations the OSPAN
block requires except for serial encoding, storage, retrieval, and updating of the letters; and task
switching. We felt that letter encoding would most likely not be reflected in the contrast due to
the extensive amount of encoding that is already occurring during equation verification.
Additionally, given the controlled attention (Engle, Kane, & Tuhoslki, 1999) and embedded
processes models (Cowan 1988; Cowan 1999), it is likely that the letters are not maintained in
WM throughout the performance of the OSPAN but that the letter sequence is stored before the
equation verification and retrieved after the equation verification to be updated with the newly
presented letter (N. Unsworth, personal communication, May 2009). Put differently, the equation
verification occurring during this task is a complex process which likely occupies the whole of
the current focus of attention. As such, the letter sequence must be displaced to the portion of
memory that is only in an activated state (above threshold) and is later retrieved and placed back
into the focus of attention to be updated with the newly presented letters. Within the scope of the
OSPAN task, these cognitive processes are conceived as task switching. It was important that
activation related to task switching/attentional control be reflected in the contrast because the
additional attentional load and interference assumed under this type of complex task should be
reflective of many real world working memory circumstances.
Equation verification RTs
We found that RTs for equation verification were significantly quicker under the OSPAN
than the Arithmetic condition. These results are consistent with Kondo et al (2004), but do not
appear to be typically found in the literature. We have also found the same results in a yet
unpublished study by our group (Smith, Faraco, & Miller, 2009) examining the differences
between mutipli-concussed young adults and matched controls. Both concussed and non-
concussed individuals exhibited decreased RTs for the equations verification during the OSPAN

77
task. We hypothesize this could be due to a combination of the increased attentional control
required whilst performing the OSPAN task and the fixed stimulus presentation for the equation
verification under both the OSPAN and Arithmetic conditions. Such that participants realize they
have four seconds to verify the equation and take their time to do so under the Arithmetic
condition; while under the OSPAN condition they realize they also have a set of letters to
remember and organize so they verify the equation more quickly in order to allot more time to
rehearse the letters.
Tasks – Baseline Activations
Cortical areas of activation during the OSPAN and Arithmetic conditions were very
similar (Fig. 3.2a-b, respectively), with the OSPAN exhibiting more robust activation in regions
common to both tasks. This similar pattern would be expected given both tasks have a common
component, arithmetic, but it also consistent with the dual/complex task literature which states
that dual/complex tasks will have similar but more intense and dispersed regions of activity
(Adcock, Constable, Gore, & Goldman-Rakic, 2000; Bunge, Klingberg, Jacobsen, Gabrieli,
2000). The nature of the arithmetic computations may be contributing to a unique pattern of
cortical activity, but it appears that most of the regions seen to be active are consistent with
regions typically associated with working memory tasks in general. Regions seen to be active in
both conditions and commonly associated with WM are DLPFC (BA 9 & 46), inferior frontal
gyrus (IFG; BA 45), middle frontal gyrus (MFG; BA 6 & 9), precuneus cortex (BA 7), superior
parietal lobule (SPL; BA 7, and ACC (BA 32). DLPFC has typically been associated with
overall executive functioning (Wager & Smith, 2003), but more recent evidence suggests that it
is specifically involved in focusing attention on task relevant info in LTM (Abe et al., 2007),
possibly through boosting WM capacity in parietal regions (Edin et al., 2009). Bilateral DLPFC
activity seen in this study is consistent with these descriptions in that participants must keep a

78
varied set of task instructions readily available while also performing a series of complex tasks.
Additionally, Bunge et al. (2001) had found that DLPFC activity in the MFG was most
significantly correlated with task interference.
Parietal regions, such as the precuneus and SPL, are seen to be active during a number of
different cognitive processes. A review of the precuenus by Cavanna and Trimble (2006)
indicated that this region is involved in a diverse array of highly integrated functions, which is
consistent with its role as an associative region given and its high level of cortico-cortical
connectivity. Wager and Smith (2003) indicate that BA7 is the most significantly activated
region during the executive processes of updating, order, and manipulation. These views appear
to be consistent with activation observed in this region. As for the IPL, it has been shown to be
more active when identifying old and new items correctly (Wagner, 2005). It is possible that
activation in this region occurs as participants bring the stored letter set back into the focus of
attention and add the newly presented letters to it. Another likely possibility is that the IPL is
also serving associative roles as it has been shown to form part of the structural core of the
human brain (Hagmann et al., 2008)
Fronto-parietal functional networks are frequently discussed in the working
memory/arithmetic literature, and activation in these regions during both the OSPAN and
Arithmetic tasks lends further support to their existence. Wood et al. (2008) demonstrated that
DLPFC and inferior parietal regions are involved in information source monitoring and
recruitment of arithmetic facts, respectively. Our findings correlating activity in frontal and
parietal regions with correct responses during letter recall lend further support to this idea.
Arithmetic related activity is important to address because participants performed
complex manipulation of numbers, which is a considerably different process than the fact-
retrieval that usually occurs during simple arithmetic calculations. Kong et al. (2005) indicated

79
that complex arithmetic procedures are supported by bilateral MFG and ACC activation.
Increased activation in these regions may be due to the increased attention and monitoring that a
complex manipulation requires. The present study demonstrated robust activations in these
regions during both conditions, indicating that the arithmetic process is likely responsible for a
significant portion of the activation seen in these regions. Precuneus activation was observed
during both simple and complex arithmetic tasks, supporting the idea that the precuneus is highly
responsible for updating and manipulating information (Fehr, Code, & Hermann, 2007).
OSPAN – Arithmetic Contrast Activation
This contrast yielded very robust and bilateral activation in a number of regions (Fig.
3.3). Due to this, a high Z-value and more stringent p-value than normal were used to analyze the
data with the cluster thresholding method implemented in FEAT. These more stringent values
yielded a more precise activation map, allowing more accurate identification of the cortical
regions involved in storage, retrieval, and updating. The activation map was thresholded using a
Z-value of 4.0 and p-value of .03; activation still appeared robust, but much more precise than at
lower values. As expected, bilateral activation was evidenced in various regions in the frontal
and parietal cortices. Bilateral activation was also evidenced in premotor (BA 4/6) and lateral
occipital regions (BA 18); this differed from the unilateral activation found in these regions in
Kondo, et al (2004). Unilateral activation was detected in the right temporal/insular and anterior
cingulate cortices.
This contrast demonstrates quantitatively what is observed qualitatively in the single and
complex task maps, that activity during the complex task resembles that of the single task but is
much more robust. Previous neuroimaging WM findings are consistent with this pattern. This is
interesting because it is indicative of a platform or base network by which the WM system
operates. Even though a number of different cognitive operations may be implemented

80
depending on the task at hand, these operations may all be related in the sense that all emerge
from the interaction of similar brain regions. Nevertheless, their emergence is possibly due to the
order of interactions (functional connectivity) of these brain regions. In the end, the heightened
activity demonstrated that the OSPAN condition required an executive process such as
attentional control be implemented as during the single task, but with the need for this process to
operate at a higher level. In other words, the heightened level of activity can partly be said to
represent the prevention of proactive and retroactive interference from the arithmetic equations
and previously presented letters, respectively. More importantly, the heightened activity also
represents the processes of storage and retrieval needed for the OSPAN task, and the additional
updating that occurs for the letter sets.
How do these findings relate to the embedded processes and controlled attention WM models?
Using the number of correct letter responses as a regressor in the fMRI analysis yielded
results that can be interpreted as being consistent with the embedded processes and controlled
attention models, mainly in that frontal/temporal activation, including that in dorsal ACC
(dACC), middle temporal gyrus, and IFG (pars opercularis), tended to positively correlate with
number of correct letter identification responses, and that parietal activation, in regions such as
SPL, IPL, cuneal cortex, parietal operculum, and post-central gyrus, tended to negatively
correlate with these responses. If frontal regions are involved in regulating the influence of
interfering information it is probable they are working at a heightened level in individuals who
are successfully filtering this information compared to those who are not. An effective frontal
filter would then limit the amount of information entering into the focus of attention and would
help to reduce the information load parietal regions may have to engage or manipulate, thereby
reducing parietal activation. A similar view of frontal and parietal interaction was also recently
espoused by (Edin, et al., 2009). Through a computational model, verified by analysis of actual

81
fMRI data, they demonstrated that DLPFC boosts the visuospatial WM capacity of parietal
regions through increased functional coupling between the regions. The middle and superior
frontal gyri, which are thought to play a regulatory role in relation to the DLPFC, also evidenced
activation consistent with a boosting function. Even though frontal regions of activation differed
between Edin et al and the present study, a finding that may be attributed to differences between
the WM tasks implemented, taken together, these two separate findings support the embedded
processes and controlled attention models view of WM. They both indicate that frontal regions
play a role in attentional regulation/control, or enhancing WM capacity in parietal regions, while
parietal regions play a role in storing and manipulating the contents in the focus of attention.
Therefore, an individual’s non-domain specific WM capacity can be said to be limited by the
degree of interaction, or coupling, between frontal and parietal regions.
Conclusion
Overall, we have demonstrated that the OSPAN task yields robust activation in regions
typically associated with WM (Wager & Smith, 2003), including BAs 9, 44, 32, and 7. We have
also demonstrated that the OSPAN can be used as a reliable fMRI paradigm to examine WM
span by replicating many of the activation sites found in Kondo, et al (2004). Furthermore, given
the increased detection power afforded when using a 3T MRI over a 1.5T, we have also shown
more localized regions of activation in the frontal and parietal lobes. Given the OSPAN’s high
correlation with WM span and analyses revealing positive correlations and negative correlations
with a number of frontal and parietal regions with number of correct letter responses,
respectively, it appears that the WM system as defined by span measures is formed in part by a
complex fronto-parietal cortical network. These results also lend further support to the embedded
processes and controlled attention models by indicating that the interaction of frontal and parietal
regions is likely the source of WM capacity limits. Future work should focus on further defining

82
the functional connectivity of the WM network as defined by span measures and should also
look to parse out storage, retrieval, and updating processes as they occur under the increased
attentional control required during a complex span task.

83
References
Abe, M., Hanakawa, T., Takayama, Y., Kuroki, C., Ogawa, S., & Fukuyama, H. (2007).
Functional coupling of human prefrontal and premotor areas during cognitive
manipulation. The Journal Of Neuroscience: The Official Journal Of The Society For
Neuroscience, 27, 3429-3438.
Adcock, R. A., Constable, R. T., Gore, J. C., & Goldman-Rakic, P. S. (2000). Functional
neuroanatomy of executive processes involved in dual-task performance. Proceedings Of
The National Academy Of Sciences Of The United States Of America, 97, 3567-3572.
Atkinson, R. C. & Shiffrin, R. M. (1968). Human Memory: A proposed system and its control
processes. In K.W. Spence & J.T. Spence (Ed.), The psychology of learning and
motivation (Vol. 2). New York: Academic Press.
Baddeley, A. D. (2000). The episodic buffer: A new component of working memory? Trends in
Cognitive Sciences, 4, 417-423.
Baddeley, A. D. & Hitch, G. J. (1974). Working Memory. In G.A. Bower (Ed.), Recent advances
in learning and motivation (Vol. 8, pp. 47-89). New York: Academic Press.
Bernstein, P. S., Scheffers, M. K., & Coles, M. G. (1995). "Where did I go wrong?" A
psychophysiological analysis of error detection. Journal of Experimental Psychology:
Human Perception and Performance, 21, 1312-1322.
Botvinick, M. M., Braver, T. S., Barch, D. M., Carter, C. S., & Cohen, J. D. (2001). Conflict
monitoring and cognitive control. Psychological Review, 108, 624-652.
Bunge, S. A., Klingberg, T., Jacobsen, R. B., & Gabrieli, J. D. (2000). A resource model of the
neural basis of executive working memory. Proceedings Of The National Academy Of
Sciences Of The United States Of America, 97, 3573-3578.
Bunge, S. A., Ochsner, K. N., Desmond, J. E., Glover, G. H., & Gabrieli, J. D. (2001). Prefrontal

84
regions involved in keeping information in and out of mind. Brain: A Journal Of
Neurology, 124, 2074-2086.
Cavanna, A. E. T., M. R. (2006). The precunes: A review of its functional anatomy and
behavioural correlates. Brain, 129, 564-583.
Conklin, H. M., Curtis, C. E., Katsanis, J., & Iacono, W. G. (2000). Verbal working memory
impairment in schizophrenia patients and their first-degree relatives: evidence from the
digit span task. The American Journal Of Psychiatry, 157, 275-277.
Conway, A. R., Kane, M. J., & Engle, R. W. (2003). Working memory capacity and its relation
to general intelligence. Trends In Cognitive Sciences, 7, 547-552.
Corbetta, M., & Shulman, G. L. (2002). Control of goal-directed and stimulus-driven attention in
the brain. Nature Reviews Neuroscience, 3, 201-215.
Courtney, S. M., Petit, L., Haxby, J. V., & Ungerleider, L. G. (1998). The role of prefrontal
cortex in working memory: examining the contents of consciousness. Philosophical
Transactions Of The Royal Society Of London. Series B, Biological Sciences, 353, 1819-
1828.
Cowan, N. (1988). Evolving conceptions of memory storage, selective attention, and their
mutual constraints within the human information-processing system. Psychological
Bulletin, 104, 163-191.
Cowan, N. (1999). An embedded-processes model of working memory. In A. Miyake & P. Shah
(Ed.), Models of working memory (pp. 62-101). Cambridge: Cambridge University Press.
Cowan, N. (2005). Working memory capacity. New York: Psychology Press.
Daneman, M., & Carpenter, P. A. (1980). Individual-Differences in Working Memory and
Reading. Journal of Verbal Learning and Verbal Behavior, 19, 450-466.
D'Esposito, M., Postle, B. R., & Rypma, B. (2000). Prefrontal cortical contributions to working

85
memory: evidence from event-related fMRI studies. Experimental Brain Research, 133,
3-11.
Edin, F., Klingberg, T., Johansson, P., McNab, F., Tegner, J., & Compte, A. (2009). Mechanism
for top-down control of working memory capacity. Proceedings Of The National
Academy Of Sciences Of The United States Of America, 106, 6802-6807.
Engle, R. W., Kane, M. J., & Tuholski, S. W. (1999). Individual differences in working memory
capacity and what they tell us about controlled attention, general fluid intelligence, and
functions of the prefrontal cortex. In A. Miyake & P. Shah (Ed.), Models of working
memory (pp. 103-134). Cambridge: Cambridge University Press.
Engle, R. W., Tuholski, S. W., Laughlin, J. E., & Conway, A. R. (1999). Working memory,
short-term memory, and general fluid intelligence: a latent-variable approach. Journal Of
Experimental Psychology General, 128, 309-331.
Fehr, T., Code, C., & Herrmann, M. (2007). Common brain regions underlying different
arithmetic operations as revealed by conjunct fMRI-BOLD activation. Brain Research,
1172, 93-102.
First, M. B., Spitzer, R. L., Gibbon, M., & Williams, J. B. (1997). Sctructured Clinical Interview
for DSM-IV Axis I Disorders (SCID-I), Clinical Version. Arlington, VA: American
Psychiatric Publishing, Inc.
Fleming, K., Goldberg, T. E., Binks, S., Randolph, C., Gold, J. M., & Weinberger, D. R. (1997).
Visuospatial working memory in patients with schizophrenia. Biological Psychiatry, 41,
43-49.
Forbes, N. F., Carrick, L. A., McIntosh, A. M., & Lawrie, S. M. (2009). Working memory in
schizophrenia: a meta-analysis. Psychological Medicine, 39, 889-905.
Hagmann, P., Cammoun, L., Gigandet, X., Meuli, R., Honey, C. J., Wedeen, V. J., et al. (2008).
86
Mapping the structural core of human cerebral cortex. Plos Biology, 6, e159-e159.
Hamidi, M., Tononi, G., & Postle, B. R. (2008). Evaluating frontal and parietal contributions to
spatial working memory with repetitive transcranial magnetic stimulation. Brain
Research, 1230, 202-210.
Jenkinson, M., Bannister, P., Brady, M., & Smith, S. (2002). Improved optimization for the
robust and accurate linear registration and motion correction of brain images.
Neuroimage, 17, 825-841.
Kane, M. J., Conway, A. R. A., Miura, T. K., & Colflesh, G. J. H. (2007). Working memory,
attention control, and the N-back task: A question of construct validity. Journal of
Experimental Psychology-Learning Memory and Cognition, 33, 615-622.
Kane, M. J., Hambrick, D. Z., & Conway, A. R. A. (2005). Working memory capacity and fluid
intelligence are strongly related constructs: comment on Ackerman, Beier, and Boyle
(2005). Psychological Bulletin, 131, 66.
Kaneda, M., & Osaka, N. (2008). Role of anterior cingulate cortex during semantic coding in
verbal working memory. Neuroscience Letters, 436, 57-61.
Klein, K., & Fiss, W. H. (1999). The reliability and stability of the Turner and Engle working
memory task. Behavioral Research Methods, Instruments, & Computers, 31, 429-432.
Kondo, H., Morishita, M. Osaka, N., Osaka, M., Fukuyama, H., & Shibasaki, H. (2004).
Functional roles of the cingulo-frontal network in performance on working memory.
Neuroimage, 21, 2-14.
Kong, J., Wang, C., Kwong, K., Vangel, M., Chua, E., & Gollub, R. (2005). The neural substrate
of arithmetic operations and procedure complexity. Brain Research. Cognitive Brain
Research, 22, 397-405.
Lezak, M. D., Howieson, D. B., & Loring, D. W. (2004) Neurospychological Assessment (Fourth

87
Edition ed., pp. 359-363). New York: Oxford Univeristy Press.
MacDonald, A. W., Cohen, J. D., Stenger, V. A., & Carter, C. S. (2000). Dissociating the role of
the dorsolateral prefrontal and anterior cingulate cortex in cognitive control. Science, 288,
1835-1838.
Miller, E. K. (2000). The neural basis of top-down control of visual attention in the prefrontal
cortex. In S. Monsell & J. Driver (Eds.), Attention and Performance (pp. 511-534).
Cambridge, MA: Massachusetts Institute of Technology Press.
Miller, E. K., & Cohen, J. D. (2001). An integrative theory of prefrontal cortex function. Annual
Review of Neuroscience, 24, 167-202.
Oberauer, K. (2005). Binding and inhibition in working memory: individual and age differences
in short-term recognition. Journal Of Experimental Psychology. General, 134, 368-387.
Owen, A. M., McMillan, K. M., Laird, A. R., & Bullmore, E. (2005). N-back working memory
paradigm: a meta-analysis of normative functional neuroimaging studies. Human Brain
Mapping, 25, 46-59.
Öztekin, I., McElree, B., Staresina, B. P., & Davachi, L. (2008). Working memory retrieval:
Contributions of the left prefrontal cortex, the left posterior parietal cortex, and the
hippocampus. Journal of Cognitive Neuroscience, 21, 581-593.
Pantelis, C., Wood, S. J., Proffitt, T. M., Testa, R., Mahony, K., Brewer, W. J., et al. (2009).
Attentional set-shifting ability in first-episode and established schizophrenia:
Relationship to working memory. Schizophrenia Research, 112, 104-113.
Piskulic, D., Olver, J. S., Norman, T. R., & Maruff, P. (2007). Behavioural studies of spatial
working memory dysfunction in schizophrenia: a quantitative literature review.
Psychiatry Research, 150, 111-121.
Postle, B. R. (2006). Working memory as an emergent property of the mind and brain.

88
Neuroscience, 139, 23-38.
Postle, B. R. & D'Esposito, M. (1999). “What”--Then--”Where” in visual working memory: An
event-related fMRI study. Journal of Cognitive Neuroscience, 11, 585-597.
U.S. Department of Health and Human Services. (2008). Depression in the United States
household population, 2005-2006 (DHHS Publication (PHS) 2008-1209). Hyattsville,
MD: Pratt, L. A. & Brody, D. J.
PST (2006). E-Prime (Version 1.2.1.845). Pittsburgh: Psychology Software Tools.
Ragland, J. D., Yoon, J., Minzenberg, M. J., & Carter, C. S. (2007). Neuroimaging of cognitive
disability in schizophrenia: search for a pathophysiological mechanism. International
Review Of Psychiatry (Abingdon, England), 19, 417-427.
Reichenberg, A., & Harvey, P. D. (2007). Neuropsychological impairments in schizophrenia:
Integration of performance-based and brain imaging findings. Psychological Bulletin,
133, 833-858.
Rorden, C. (2007). DCM2NII (Version October 7) [Computer software].
Rowe, J. B., Toni, I., Josephs, O. Frackowiak, R. S., & Passingham, R. E. (2000). The prefrontal
cortex: response selection or maintenance within working memory? Science, 288, 1656-
1660.
Smith, S. M. (2002). Fast robust automated brain extraction. Human Brain Mapping, 17, 143-
155.
Smith, D., Faraco., C. C., & Miller, L. S. (2009). Unpublished manuscript. University of
Georgia.
Smith, S. M., Jenkinson, M., Woolrich, M. W., Beckmann, C. F., Behrens, T. E., Johansen-Berg,
H., et al. (2004). Advances in functional and structural MR image analysis and
implementation as FSL. Neuroimage, 23 Suppl 1, S208-219.

89
Smith, E. E., & Jonides, J. (1999). Storage and executive processes in the frontal lobes. Science
(New York, N.Y.), 283, 1657-1661.
Srimal, R., & Curtis, C. E. (2008). Persistent neural activity during the maintenance of spatial
position in working memory. Neuroimage, 39, 455-468.
Turner, M. L., & Engle, R. W. (1989). Is Working Memory Capacity Task Dependent. Journal
of Memory and Language, 28, 127-154.
Unsworth, N., & Engle, R. W. (2007). The nature of individual differences in working memory
capacity: active maintenance in primary memory and controlled search from secondary
memory. Psychological Review, 114, 104-132.
Unsworth, N., Heitz, R. R., Schrock, J. C., & Engle, R. W. (2005). An automated version of the
operation span task. Behavior Research Methods, 37, 498-505.
Wager, T. D. & Smith, E. E. (2003). Neuroimaging studies of working memory: a meta-analysis.
Cognitive, Affective, & Behavioral Neuroscience, 3, 255-274.
Wagner, A.D., Shannon, B. J., Kahn, I., & Buckner, R. L. (2005) Parietal lobe contributions to
episodic memory retrieval. Trends in Cognitive Science, 9, 445–453
Wendelken, C., Bunge, S. A., & Carter, C. S. (2008). Maintaining structured information: an
investigation into functions of parietal and lateral prefrontal cortices. Neuropsychologia,
46, 665-678.
Wechsler D. (2001). Wechsler Test of Adult Reading. San Antonio, TX: The Psychological
Corporation.
Wood, G., Nuerk, H.-C., Moeller, K., Geppert, B., Schnitker, R., Weber, J., et al. (2008). All for
one but not one for all: how multiple number representations are recruited in one
numerical task. Brain Research, 1187, 154-166.
Zilles, D., Burke, S., Schneider-Axmann, T., Falkai, P., & Gruber, O. (2009). Diagnosis-specific

90
effect of familial loading on verbal working memory in schizophrenia. European
Archives Of Psychiatry And Clinical Neuroscience, 259, 309-315.

91
Condition O R B A B Duration (s) 30 15 30 30 30 Figure 3.1. Working memory task block design. O: OSPAN, R: word recognition, B: baseline, and A: Arithmetic condition.

92
a
b
Figure 3.2. OSPAN and Arithmetic activation maps. A) OSPAN – Baseline and b) Arithmetic – Baseline contrasts. Notice that activation for the OSPAN condition is very similar, but much more robust.

93
Figure 3.3. Activation map for OSPAN – Arithmetic contrast. Thresholded at Z = 4.0, p = 0.03, and minimum cluster size of 26. DLPFC = Dorsolateral Prefrontal Cortex; MFG = Middle Frontal Gyrus; PCG = Precentral Gyrus; SMC = Supplementary Motor Cortex; and SPL = Superior Parietal Lobule

94
Table 3.1. Behavioral measures. Block Mean SD OSPAN Equation Correct Responses 13 of 15, 87% 2.35 Equation RT (ms) 2371.29 169.31 Letter Recognition 13 of 15, 87% 3.42 Letter RT (ms) 1009.42 131.04 Arithemtic Equation Correct Responses 12.8 of 15, 85% 2.93 Equation RT (ms) 2458.11 175.39
Statistics for behavioral measures acquired during OSPAN presentation.
Table 3.2. Sites of activation; OSPAN - Arithmetic. Cluster Cluster
Size Cortical Region Brodmann
Area Coordinates in
MNI, mm Z-score
x y z 13 3484 L Juxtapositional Lobule
(Supplementary Motor Cortex) 6 0 0 64 7.63
L Precentral Gyrus 3/4 -50 -10 48 6.72 L Middle Frontal Gyrus 6 -26 -4 54 6.71 12 461 R Cerebellum, Anterior 4 -50 -28 5.76 11 422 L Dorsolateral Prefrontal Cortex 9 -38 42 32 6.18 10 378 R Dorsolateral Prefrontal Cortex 9 30 38 24 6.44 9 365 R Precuneus 7 12 -66 38 6.22 8 311 R Precentral Gyrus 6 48 2 38 5.47 7 226 R Angular Gyrus 39 44 -48 24 5.18 R Lateral Occipital Cortex,
superior division 19 38 -68 34 5.15
6 205 L Superior Parietal Lobule 7 -26 -56 44 5.98 L Precuneus 7 -8 -74 38 5.14 5 166 L Supramarginal Gyrus 40 -44 -46 34 6.01 4 132 R Insula 13 34 16 6 5.09 3 127 R Lateral Occipital Cortex 18 28 -84 2 5.99 2 118 R Precentral Gyrus 44/6 58 6 12 5.81 1 101 L Lateral Occipital Cortex 18 -26 -86 -8 5.21 Maxima Detected through Featquery R Paracingulate/Cingulate Gyrus 32/6 8 12 46 6.71 L Inferior Frontal Gyrus, Pars
Opercularis 44 -54 12 20 5.92
OSPAN – Arithmetic. Z = 4.0, p < .03.

95
Table 3.3. Positive correlations. Cluster Cluster
Size Cortical Region Brodmann
Area Coordinates in
MNI, mm Z-score
x y z 5 49 L Paracingulate/Anterior
Cingulate Cortex and Frontal Pole
32/10 -2 54 6 3.16
4 45 L Middle Temporal Gyrus -52 -46 -8 4.28 3 38 R Occipital Pole 17 12 -92 -6 4.21 2 27 R Frontal Pole and
Paracingulate/Anterior Cingulate Cortex
10/32 2 60 12 4.16
1 24 R Inferior Frontal Gyrus, Pars Opercularis
44 60 14 18 4.09
Regions from the OSPAN – Arithmetic contrast positively correlated with correct letter responses; corrected at the voxel level, p =0.05.
Table 3.4. Negative correlations.
Cluster Cluster Size
Cortical Region Brodmann Area
Coordinates in MNI, mm
Z-score
x y z 8 102 L Superior Parietal Lobule 5 -22 -44 60 3.21 7 94 R Precentral Gyrus 6 20 -18 62 4.18 6 84 R Lateral Occipital
Cortex/Cuneal Cortex 7/19 14 -82 42 4.18
5 64 L Parietal Operculum Cortex 40 -54 -38 22 4.19 4 58 R Post-central Gyrus 3 34 -34 66 3.11 3 50 L Angular Gyrus 39 -40 -60 18 4.27 2 31 L Superior Parietal
Lobule/Lateral Occipital Cortex
7 34 -58 62 4.05
1 25 L Superior Frontal Gyrus, Premotor Cortex
6 -16 -6 74 3.05
Regions from the OSPAN – Arithmetic contrast negatively correlated with correct letter responses; corrected at the voxel level, p =0.05.

96
CHAPTER 4
STRUCTURAL CONNECTIVITY OF CORTICAL WORKING MEMORY SPAN REGIONS1
1Faraco, C.C., Yanasak, N., Zhao, Q., Langley, J., and Miller, L.S. To be submitted to Human
Brain Mapping

97
Introduction
Developmental and degenerative disease processes are known to result in abnormalities
of various grey and white matter brain regions. Some oft noted examples of such disease
processes are Alzheimer’s disease (AD), fronto-temporal dementia (FTD), multiple sclerosis
(MS), and schizophrenia. These patients additionally exhibit cognitive deficits such as
compromised executive functions, episodic memory amnesia/deficits, (Benedict et al, 2006;
Della Sala, Laiacona, Spinnler, & Trivelli, 1995; Heinrichs & Zakzanis, 1998; Lee & Park, 2005;
Parasuraman, Greenwood, & Alexander, 1995; Perry, Watson, & Hodges, 2000; Sartori & Edan,
2006; Simone & Baylis, 1997), and poor working memory (Della Sala & Logie, 2001; Sartori &
Edan; Wilk, et al. 2005). The working memory system is arguably one of the most important to
human cognition and is essential for everyday functioning, appropriate social interaction, and
maintenance of an independent lifestyle. A dysfunctional working memory system leads to a
variety of related deficits such as reduced attentional capacity (increased susceptibility to
interference), inability to multi-task, inability to transfer items currently in the focus of attention
to long term memory, difficulty in learning new materials, problems with delayed responses,
among others (Lezak, Howieson, Loring, 2004, pp, 80-82). Such deficits, for example, are
observed in patients with AD throughout the progression of the disease. One of the
characteristics of AD is atrophy of the parietal lobes (e.g., Davatzikos, Resnick, Wu, Pampri, &
Clark, 2008; Lehéricy, Marjanska, Mesrob, Sarazin, Kinkingnehun, 2007), which have been
shown to be a key component of working memory, mainly involved in the storage and
manipulation of information currently in the focus of attention (Champod & Petrides, 2007;
McNab & Klingberg, 2008).
The cortical regions associated with some of these deficits, and therefore working
memory, have mainly been discovered through methods of anatomical investigation that are able

98
to note structural abnormalities, such as postmortem investigation (e.g., Braak, Braak, & Bohl,
1993; Delacourte et al., 1999; Huesgen, Burger, Craw, & Johnson, 1993; Kung & Roberts, 1999;
Roberts, Roche, & Conley, 2005) and Magnetic Resonance Imaging (MRI; e.g., Chetelat &
Baron, 2003; Jack et al., 2002; Onitsuka et al., 2006; Silbert et al., 2003), and functional studies
of the brain using neuroimaging techniques, such as functional MRI (fMRI) and Positron
Emission Tomography (PET; e.g., Haznedar et al., 2004; Mosconi, 2005; Small et al., 2006;
Yetkin, Rosenberg, Weiner, Purdy, & Cullum, 2006, Zedkova, Woodward, Harding, Tibbo, &
Purdon, 2006). Many fMRI studies have delineated the cortical regions involved in working
memory functioning through the use of a variety of working memory tasks. Regions traditionally
shown to be active during these working memory tasks include the DLPFC, ventrolateral
prefrontal cortex, anterior cingulate cortex, and superior parietal regions.
A potential problem with working memory tasks typically used in functional studies, such
as the n-back, is that they have not shown high levels of correlation with WM span (Kane,
Conway, Miura, & Colflesh, 2007). Furthermore, the n-back has been shown to account for
separate variability in general fluid intelligence than WM span (Kane et al.), while WM span has
been shown to account for up to half the variability in general fluid intelligence (Conway, Kane,
& Engle, 2003; Kane, Hambrick, & Conway, 2005). Span tasks such as reading, counting, and
operation span (OSPAN) tasks, on the other hand, have been shown to demonstrate high levels
of reliability (Klein & Fiss, 1999). The OSPAN has also been shown to exhibit high levels of
reliability and internal consistency in an automated version (Unsworth, Heitz, Schrock, & Engle;
2005). In a working memory study performed by our group (Faraco et al., 2009), the OSPAN
task was used to delineate the cortical regions involved in storage, retrieval, and updating of
WM. Regions seen to be active in Faraco et al. were fairly consistent with those seen to be active
in other functional studies of working memory and included the DLPFC, ventrolateral prefrontal

99
cortex, anterior cingulate cortex, and superior parietal lobule (SPL) / precuneus, but also
included other regions such as the supplementary motor cortex, precentral gyrus, insular cortex,
and inferior parietal lobule (IPL; angular and supramarginal gyri). An interesting question would
be to examine how these regions are connected by white matter fibers; are these regions
connected mainly through major tracts or are their connections more intricate? Knowledge of the
role of white matter structures in human cognition, however, is somewhat limited and has
typically been derived from invasive tracer and autoradiographic studies of non-human animals
(e.g., Petrides & Pandya, 1984, 2006; Schmahmann et al., 2007; Van Essen, Newsome,
Maunsell, & Bixby, 1986). Also, knowledge gained from animal studies may be of limited use
when applied to a highly specialized human cognitive function such as working memory.
Within the past few years, the MRI-based modality known as diffusion tensor imaging
(DTI) has become increasingly important in the neuroimaging community. DTI depends on strict
mathematical, theoretic constructs in conjunction with the MRI technique of diffusion weighted
(DW) imaging, and utilizes tensor information to represent the diffusion properties of water
within tissue (e.g., Melhem et al., 2002). The diffusion characteristics of water are affected by
the properties of the structures containing it. In the brain it is believed the greatest impact on
diffusion may occur due to the tight packing of fibers and the inherent properties of the cell
membranes (Beaulieu, 2002). The intra-axonal supporting structures of the neurons, the
neurofibrils, are thought to significantly influence tissue diffusion characteristics, especially
intra-axonal diffusion. Given that tissue properties influence diffusion properties, the diffusion
information yielded by the tensors (axes and rate of diffusion) informs us of the general tissue
structure within a given region of interest. DTI therefore allows us to infer the white matter tracts
linking different regions (structural connectivity) through measures such as fractional anisotropy
(FA) and tractography.
100
White matter maps of the human brain have already been produced using information
gained from DTI (Mori, Wakana, Nagae-Poetscher, & van Zijl, 2005). Even though such maps
are crucial to the development of anatomical knowledge of the human brain, they do not
necessarily inform us of the role of white matter pathways in cognition. A logical next step in the
advance of neuroimaging techniques would be to use the information gained from DTI to
determine the structural connectivity or integrity of brain regions involved in specific cognitive
processes. One method that can yield such information is the combination of DTI tractography
and fMRI modalities. In this method fMRI-defined ROIs are used as seeding and target points
for DTI-based tractography (e.g., Conturo, et al., 1999; Lanyon et al. 2009; Saur et al., 2008;
Yang et al., 2009).
In this paper we aimed to combine fMRI data with DTI tractography to develop a map of
the white matter tracts linking the cortical regions involved in the human working memory
system, one of the cognitive systems which is critical for proper, everyday functioning.
Specifically, we aimed to develop connectivity maps for the areas involved in storage, retrieval,
and updating during a complex span task. Audoin et al. (2007) assessed the impact of MS on
integrity of white matter tracts linking the supposed regions of the executive system of working
memory. They found bilateral connections between the anterior cingulate, BA9, BA 45/46, and
the thalami, but knowledge of the working memory system gained from this study may be
limited given the few ROIs used and the large size of the ROIs. To develop the structural
connectivity map of the cortical regions involved in storage, retrieval, and updating roles during
a complex working memory span task, we used areas defined in Faraco et al (2009) as seeding
and target points for DTI based tractography. Given the anatomical knowledge already gleamed
from DW based white matter maps (Hagmann et al., 2008; Mori et al., 2005) and that many of
these regions consisted of frontal and parietal regions, we expected to find that major associative

101
pathways such as the superior longitudinal fasciculus (SLF), the fronto-occipital fasciculus
(FOF), and the inferior longitudinal fasciculus (ILF) constitute the main crux of the fibers
connecting these regions.
Materials and Methods
Participants
Twenty-five students from the University of Georgia were recruited for this study
through the university’s research pool and through word of mouth (17 females, 8 males, average
age = 24.8 ± 2.8). Exclusion criteria included reports of previous head injury, history of loss of
consciousness, current drug abuse, evidence of neurodegenerative process, and an estimated
below average IQ. Participants could also not have a history of, present clinical signs of, or
currently be under treatment for, any major psychiatric symptoms or disorders. The exception to
the latter exclusion criteria was a history of depression, since a significant portion of the
population may have at one point presented with clinically diagnosable symptoms (Pratt &
Brody, 2008). Incompatibility with the MRI environment (e.g., metallic implants, pacemakers,
stents, etc.) was assessed through a standardized screening form and participants were excluded
given any signs of incompatibility.
Measures
Participants were made aware of the exclusion criteria before participating in the study.
Upon meeting with the investigator, participants were fully screened. Screening included
completing the MRI screening form, answering questions from the psychotic symptoms
screening portion of the Structured Clinical Interview for DSM-IV (SCID-I; First et al., 1997),
and being asked about the exclusion criteria described earlier. Additionally, female participants
were asked to take a pregnancy test; even though the MRI environment has been shown to have
no adverse side-effects, this was taken as a precautionary measure. If screening was successful,

102
participants were given a brief IQ estimate, the Wechsler Test of Adult Reading (WTAR;
Wechsler, 2001), to rule out below average IQ.
MRI acquisition
3D structural scans were acquired using a fast spoiled gradient recall (FSPGR) protocol;
TE = min full, TR = 7.5 ms, flip angle = 20°, 154 axial slices, slice thickness = 1.2 mm, and
FOV = 256 x 256 mm. These images covered from the top of the head to the brainstem and
acquisition took approximately 6m 20s. DW scans were acquired using a single shot DW EPI
ASSET sequence, were aligned to the intercommisural line (AC-PC line), and were in the same
space as the fMRI images; TE = min full, TR = 1500 ms, 90° RF pulse, 60 interleaved slices,
spacing = 0 mm, 2 mm isotropic voxels, acquisition matrix = 128x128, FOV = 256x256 mm,
ASSET factor = 2, b-value: 1000, and 30 gradient directions with 3 b0 images. Total scan time
for the DTI acquisition was 8m and 30s. fMRI acquisition protocols were as follows: TE = 25
ms, TR = 1500 ms, 90° RF pulse, 30 interleaved slices, acquisition matrix = 64x64, spacing = 0
mm, slice thickness = 4 mm, FOV = 220 x 220 mm, and ASSET factor = 2.
OSPAN Paradigm
The paradigm presented to participants during the functional scans was composed of
blocks of a complex span task (OSPAN condition), an simple span task (Arithmetic condition),
and a baseline motor task. For the OSPAN and Arithmetic conditions participants were
instructed to verify, through a response pad, equations with two arithmetic operators. During the
OSPAN condition participants were given the extra task of remembering a set of letter in serial
order. The letters were presented in an alternating fashion with the equations. After the equations
and letters were presented, participants had to indicate in which order the letters were presented
by choosing the letters from a display of arrays. The baseline condition had participants indicate
the direction of arrows pointing left or right with button responses. These responses accounted

103
for the motor responses during the OSPAN and Arithmetic conditions.
Data analysis
The FMRIB Software Library (FSL; Smith et al, 2004) was used for all steps involved in
these analyses. Before being processed data were converted from GE DICOM format to NIFTI
using dcm2nii (Rorden, 2007). Peak activation voxels and local maxima from the OSPAN –
Arithmetic contrast (Faraco et al., 2009) were used as the basis for tractography. This contrast
indicated the regions responsible for storage, retrieval, and updating during a complex working
memory span task. Regions used for tractography were: inferior frontal gyrus (pars opercularis),
bilateral DLPFC, middle frontal gyrus, anterior cingulate cortex, supplementary motor cortex,
precentral gyrus (PCG), bilateral precuneus, SPL, IPL, and lateral occipital cortex. A 6mm
dilation radius was specified for each of the voxels, resulting in masks consisting of 123, 2mm
isotropic voxels. The 6mm radius was chosen for the masks based on the size range of the
activation sites. In other words, a 6mm radius mask would not cover a region that would be
larger than the smallest sites of activation. Additionally, using too large of a mask might have
reduced the specificity of the yielded tracts connecting the ROIs.
Each mask was then transformed to each individual’s DWI space through a non-linear
transformation. The non-linear transformation matrices were calculated by transforming the
standard FA map to each individual’s FA map, which were calculated using DTIFIT (Behrens et
al., 2003b). The procedure went as follows: First, the standard FA map included in FSL was
transformed from a 1mm isotropic voxel image (182 x 218 x 182 mm) to a 2mm isotropic voxel
image (91 x 108 x 91 mm) in order to match the space of the masks. For each individual, a linear
affine transform for the standard FA map was estimated using FLIRT (Jenkinson, Bannister,
Brady, & Smith, 2002). This linear transform was then used as a basis to estimate a non-linear
transform for the same.

104
To prepare the DWI images for tractography in FDT, they were first eddy current
corrected and realigned using the first b0 image as a reference. They were then brain extracted
using Brain Extraction Tool (BET; Smith, 2002), The 3 b0 images were averaged and a brain
mask was created from the average image for later use by the FDT sub-routines. The images
(averaged b0 and 30 DWIs) were input into BEDPOSTX (Bayesian Estimation of Diffusion
Parameters Obtained using Sampling Techniques; Behrens, Berg, Jbabdi, Rushworth, &
Woolrich, 2007) to estimate the appropriate number of fiber orientations per voxel. BEDPOSTX
was set to determine a maximum of 2 fiber orientations per voxel. The diffusion distributions
estimated in BEDPOSTX and the DTI data were then input into PROBTRACKX (Probabilistic
Tractography of Crossing fibers; Behrens et al), to run probabilistic tractography.
The details of the tracking method performed for this experiment were as follows: First, a
symmetric tracking scheme was used, meaning that for a pair of masks A and B, used as seeds
and targets, tractography was performed twice with the masks playing opposite roles in each
tracking; in one instance A was a seed and B a target and in the other instance, B was a seed and
A was a target. This was done to help ensure that tractography results represented the true nature
of the fiber pathways as accurately as possible. Additionally, each target mask was specified as a
waypoint and termination mask, meaning that any tract depicted in the results must have reached
the target and that tracking should have stopped when the streamlining process reached the
target. Tractography parameters were: 15,000 streamlines, curvature threshold = 80°, step length
= 0.5 mm, number of steps = 2,000. After all the tracts had been calculated for an individual they
were thresholded at a value of 5 to remove any “stray” or noisy fibers, those fibers considered to
have a very low probability of existence. Every tract for every individual was then non-linearly
transformed to standard space. Group maps for each tract were made by binarizing each
individual tract and summing the corresponding tracts. The values in each voxel of these group

105
maps indicated how many individuals had overlap at a given voxel. The maximum overlap value
in each image was used a probability measure for the existence of that tract.
Results
All regions were used as seeds and targets. Tracts connecting the cortical regions
involved in the execution of the storage, retrieval, and updating functions occurring during a
complex span working memory task, the OSPAN, were identified as follows (Fig. 4.1). Frontal
seed and target regions were bilateral precentral gyrus (left: BA 3/4; right BA 6) and dorsolateral
prefrontal cortex (BA 9); left supplementary motor area (BA 6) and inferior frontal gyrus, pars
opercularis (BA 44); and right cingulate gyrus (BA 32/6). Parietal seed and target regions were
bilateral precuneus (BA 7); left superior parietal lobe (BA 7) and supramarginal gyrus (BA 39);
and right angular gyrus (BA 40). Occipital tracking regions included the right lateral occipital
cortex, superior division (BA 19) and the right and left lateral occipital cortices (BA 18).
Tracking was also performed from the right insula (BA 13).
Overall, the tractography results indicate that many of the ROIs, as expected, are
connected by means of well known fiber tracks, specifically the SLF and the FOF (Fig. 4.2 a,b).
Since a portion of the right cingulate gyrus was used as a seed/target for right frontal to parietal
tracking, the right cingulum bundle is also seen (Fig 4.2 c).
To assess the existence and variability of a fiber tract across individuals, the maximum
intensity value that occurred at any given voxel for a specific tract was taken as a probability
measure. Since the tracts for each individual were binarized and then summed to develop group
maps for each tract, the intensity value at each voxel represented the amount of overlap across
individuals for that voxel. Tracts were classified into high (≥ 17 individuals), medium (≤ 16 but
≥ 9 individuals), and low (≤ 8 individuals) probability of existence categories based on this
overlap.
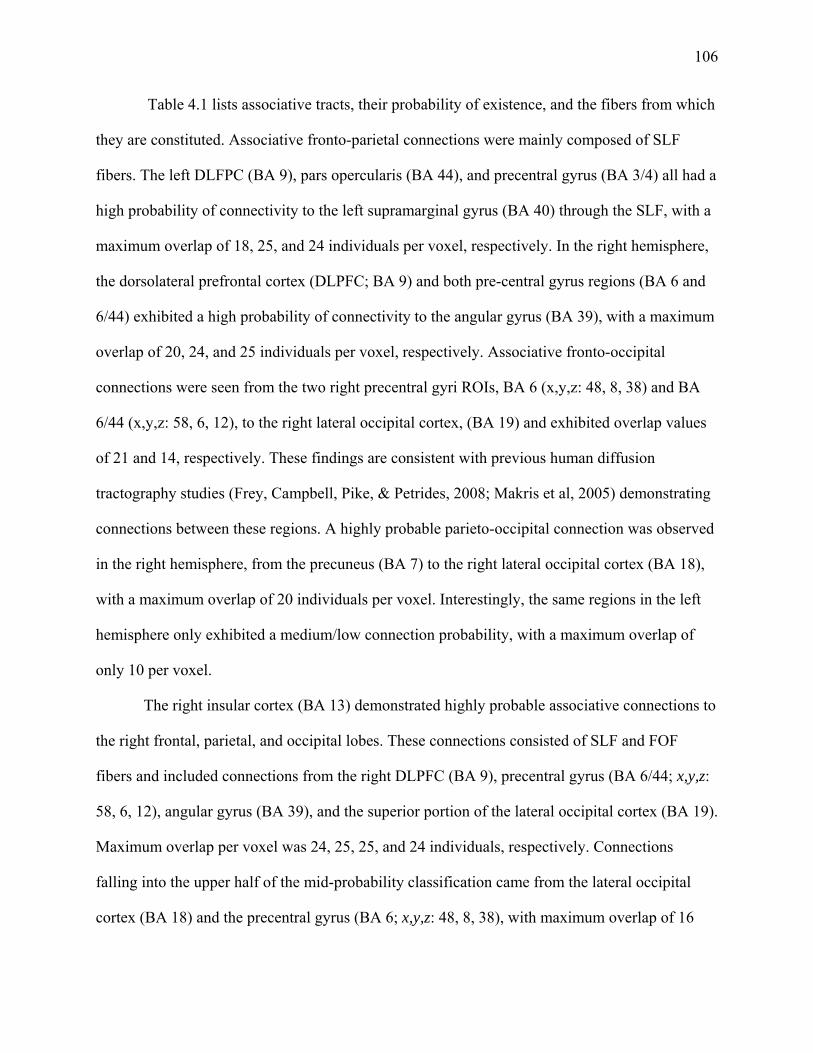
106
Table 4.1 lists associative tracts, their probability of existence, and the fibers from which
they are constituted. Associative fronto-parietal connections were mainly composed of SLF
fibers. The left DLFPC (BA 9), pars opercularis (BA 44), and precentral gyrus (BA 3/4) all had a
high probability of connectivity to the left supramarginal gyrus (BA 40) through the SLF, with a
maximum overlap of 18, 25, and 24 individuals per voxel, respectively. In the right hemisphere,
the dorsolateral prefrontal cortex (DLPFC; BA 9) and both pre-central gyrus regions (BA 6 and
6/44) exhibited a high probability of connectivity to the angular gyrus (BA 39), with a maximum
overlap of 20, 24, and 25 individuals per voxel, respectively. Associative fronto-occipital
connections were seen from the two right precentral gyri ROIs, BA 6 (x,y,z: 48, 8, 38) and BA
6/44 (x,y,z: 58, 6, 12), to the right lateral occipital cortex, (BA 19) and exhibited overlap values
of 21 and 14, respectively. These findings are consistent with previous human diffusion
tractography studies (Frey, Campbell, Pike, & Petrides, 2008; Makris et al, 2005) demonstrating
connections between these regions. A highly probable parieto-occipital connection was observed
in the right hemisphere, from the precuneus (BA 7) to the right lateral occipital cortex (BA 18),
with a maximum overlap of 20 individuals per voxel. Interestingly, the same regions in the left
hemisphere only exhibited a medium/low connection probability, with a maximum overlap of
only 10 per voxel.
The right insular cortex (BA 13) demonstrated highly probable associative connections to
the right frontal, parietal, and occipital lobes. These connections consisted of SLF and FOF
fibers and included connections from the right DLPFC (BA 9), precentral gyrus (BA 6/44; x,y,z:
58, 6, 12), angular gyrus (BA 39), and the superior portion of the lateral occipital cortex (BA 19).
Maximum overlap per voxel was 24, 25, 25, and 24 individuals, respectively. Connections
falling into the upper half of the mid-probability classification came from the lateral occipital
cortex (BA 18) and the precentral gyrus (BA 6; x,y,z: 48, 8, 38), with maximum overlap of 16

107
and 13 individuals, respectively. Lastly, the right anterior cingulate (BA 32) only exhibited a
highly probable connection to the right precuneus (BA 7) by way of the cingulum bundle, with a
maximum overlap of 22 individuals.
Table 4.2 lists the details for intra-lobar (local) fiber tracts. Left frontal fiber tracts
demonstrated the lowest overall consistency across individuals. The only tract to fall into the
high probability category was from BA 44 to BA 9. Two of three left parietal tracts were highly
probable; from the SPL (BA 7) to the precuneus (BA 7) and supramarginal gyrus (BA 40). This
is not surprising given that two of these ROIs are in the same Brodmann region and that BA 40 is
adjacent to BA 7. All three right frontal tracts were likely probable and are believed to be
pathways consisting of the SLF or the FOF. Two of three right parietal connections were highly
probably; from BA 19 to BA 7 and BA 39. Overall, associative and local tracts with a high
probability of existence and associative tracts with a medium probability overlapped with known
tracts. Tracts with a low probability of existence mostly consisted of pathways not defined in the
John Hopkins University (JHU) white-matter tractography atlas (Mori et al., 2005).
Discussion
Recently, a few maps of the human white matter system have emerged. This has resulted
from the surge in the use of in-vivo methods capable of inferring white matter structure, such as
DTI and the more complex method of diffusion spectrum imaging (DSI). Mori et al. (2005)
developed an extensive map of the human white matter structure using DTI and Hagmann et al.
(2008) mapped the structural core of the human brain using DSI. As informative as these maps
may be, they do not define how these fibers are connected to form cognitive networks. In this
study, we used cortical ROIs defined in Faraco et al. (2009), using the OPSAN task, to track the
cortico-cortical fibers which structurally define the emergent working memory system used
during a complex working memory span task. More specifically, we defined the pathways

108
involved in storage, retrieval, and updating. This is the first study that we are aware of which has
attempted to map the cortico-cortical connections of the human working memory system based
on fMRI defined regions of activation from a complex span task.
Tracts
Tracts were identified through a combination of information from the JHU atlas included
in the FSL package and research articles that delineate the trajectories of specific tracts such as
the SLF, middle/inferior longitudinal fascicles, and FOF (Frey et al., 2008; Hua et al., 2009;
Makris et al 2005, 2007a; Saur et al., 2008; Schmahmann et al., 2007). Individuals demonstrated
a high degree of overlap across associative fasciculi such as the SLF, FOF, and the cingulum
bundle; this was especially true when fibers were traced inter-lobarly. Intra-lobar connections
seemed to have a greater degree of variation across individuals. It is important to note that the
overlap measure used in this study does not necessarily indicate that only n individuals shared a
tract. Given the morphological differences between brains, it is the case that different brains
possess the same structural connections between different regions, but that these fiber tracts may
follow slightly, or somewhat, different trajectories. Therefore, even though all 25 individuals
may possess the same tract, it is possible that the maximum overlap for the group map at any
given voxel may be less than 25. Nonetheless, since brains do share the same features and the
tracts were non-linearly warped into standard space, it is not likely the difference between the
maximum value at a voxel and the maximum number of individuals sharing a tract differs by a
significant amount for most of the tracts. As such, this overlap measure is more accurately seen
as a probability of existence measure. Furthermore, as Hua et al. indicated, this type of
probability measure reflects the cortical variability that occurs across individuals and should not
be thought of as a measure of connectivity strength.
Using the maximum intensity value as an existence measure lends itself very well for

109
classifying tracts as those exhibiting a high or low probability of existence, such that in this case
those with a high probability of existence fell into the upper 1/3 of the overlap range (≥ 17) and
those a low probability of existence fell into the lower 1/3 of the overlap range (≤ 8). There were
very few tracts in the middle 1/3 (≤16 but ≥9) of the overlap range; these tracts were sometimes
questionable and required further investigation to determine whether they agreed with current
anatomical knowledge of the human brain.
Superior Longitudinal Fasciculus
The SLF is a major associative, likely bi-directional, fiber pathway in primates. Through
the integration of isotope and diffusion imaging studies in monkeys (Petrides & Pandya, 1984,
2006; Schmahmann et al., 2007) and diffusion studies in humans (Makris et al., 2005) it has been
shown that the SLF has at least three subdivisions in primates, SLF I, SLF II, and SLF III, and
that in humans there is a fourth division, the arcuate fasciculus, with SLF II being the main
constituent portion. Tractography analysis revealed that most of the associative, fronto-parietal
connections overlapped with regions of the SLF. The subdivisions specified in Makris et al.,
along with the regions encompassing the ends of the SLF were used to classify the SLF fibers
observed in this study. According to this classification scheme, most of the associative tracts
consist of SLF II.
SLF II tracts demonstrating a high probability of connectivity (defined as tracts in which
the voxels composing the tracts show a high degree of overlap across individuals, 66% or more;
Fig. 4.3, a-f) between frontal and parietal regions included fibers connecting the left DLPFC (BA
9) and precentral gyrus (BA 4) to the left supramarginal gyrus (BA 40), the right DLPFC (BA 9)
and precentral gyrus regions (BA 6) to the right angular gyrus (BA 39), and the right precentral
gyrus (BA6) to the superior division of the right lateral occipital cortex (BA 19). The only
associative tract demonstrating high correspondence with SLF I was a bundle of fibers

110
connecting the left precentral gyrus (BA 4) to the left SPL (BA 7); Fig. 4.3g. The same holds for
SLF III, where a bundle of fibers connecting the left inferior frontal gyrus, pars opercularis (BA
44), to the left supramarginal gyrus (BA 40) was the only tract observed; Fig. 4.3h. Tracts where
the right insula (BA 13) served as an ROI also demonstrated the use of the SLF as a connection
pathway.
These results are exciting because they demonstrate that many of the frontal regions
involved in a complex working memory span task exhibit direct associative connections to
parietal regions. It is also interesting to note that regions which are more superior or inferior
exhibit less connections than those across the midline. This is probably due to the fact those
along the midline encounter SLF II, the major component of the SLF and one of the major
pathways in the human brain. According to Makris et al. (2005) SLF II is involved in
communicating spatial information from parietal to pre-frontal regions, while prefrontal regions
relay information regulating focusing of spatial attention to parietal. This is likely true given that
parietal regions are involved in many spatial functions (e.g., Goodrich-Hunsacker, Howard,
Hunsaker, & Kesner, 2008; Sack, 2009; Vandenberghe & Gillebert, 2009). We propose further,
but related, functions for SLF II given that: 1) the OSPAN task used in Faraco et al (2009) is a
verbal working memory task and 2) SLF II is the main fiber tract used for communicating
information relevant to this verbal working memory task. We believe SLF II serves a non-
domain specific feedback role in attention, relaying information that is currently in the focus of
attention from parietal to prefrontal regions, while prefrontal regions perform top-down control
functions such as monitoring, regulating, and updating the focus of attention (Champod &
Petrides, 2007; Gazzaley et al., 2007; Postle et al. (2007); Rossi, Bichot, Desimone, &
Ungerleider, 2007; Rossi, Pessoa, Desimone, & Ungerleider, 2009; Schreppel et al., 2007)
through SLF II.

111
Fronto-occipital Fasciculus
The JHU White matter atlas has divided the FOF into inferior and superior portions.
However, the existence of inferior and superior divisions of the frontal occipital fascicle in the
primate brain has been highly debated in the literature (Schmahmann and Pandya, 2007). Recent,
in-depth diffusion tractography and isotope tracer studies (Makris et al., 2007a, 2007b;
Schmahmann et al., 2007) of humans and monkeys along with a review Schmahmann and
Pandya’s review of the history of the FOF have concluded that the FOF is a single entity not
divisible into inferior and superior trajectories. For our analysis we have followed these
suggestions and have ignored the labels applied to the FOF in JHU white-matter atlas. Strong
connectivity through the FOF was observed in the right hemisphere, mostly from the insula (BA
13) and mainly to BAs 18, 19, and 39 (Fig. 4.4). The FOF’s medial location and anterior to
posterior orientation place it close to the insular cortex for a portion of its trajectory (Makris et
al.). Dejerine (1895; as cited in Schmahmann and Pandya, 2006) indicated that the FOF connects
to the insula through the fibers of the external capsule.
Makris et al. suggested the FOF plays roles in “action tracking and reaching,” through its
connections to dorsal stream visual areas, and in “object discrimination and object emotional
reactivity,” through its connections with ventral visual stream regions. Previous work has shown
that the insular cortex is involved in emotional processing of sensory information, as indicated in
a meta-analysis by Mutschler et al. (2009). Taking this into account, along with the nature of the
OSPAN task, the FOFs connectivity to the insula lends further support to the idea that FOF
conveys emotional and attentional information about present sensory stimuli, but also items
currently in the focus of attention. More specifically, the emotional nature of the information
could be used to help guide and judge the integration of current stimuli with previous task-
relevant stimuli. Using the OSPAN task as an example, this could manifest as an emotional

112
judgment about the ordering of the letters as they are retrieved from long tem memory to be
integrated with the newly presented letter. In other words, the FOF may convey emotional
information designed to evaluate items in the focus of attention. As stated previously, the
tractography analysis revealed SLF II connections from the insula. These same results are also
the ones depicting FOF tracts from the insula to the same target regions. Along with the roles
proposed for SLF II above, we further propose that it may play a part in an emotional feedback
loop with the FOF.
Inferior Parietal Lobule, Working Memory Network Connection Hub
Of greater importance than the direct connections between cortical regions are the
pathways, or networks, that are formed from these connections. As previously mentioned,
Hagmann et al. (2008) developed a connectivity map of the human brain using DSI that focused
on defining the structural cores of the fiber networks in the human brain. They found that many
of the cores were focused towards the posterior portions of the brain. Given that this study only
examined a few regions of interest for tractography, we were only able to detect one region in
each hemisphere that appeared to serve as a connection core or hub; the supramarginal gyrus in
the left hemisphere and the angular gyrus in the right. We have dubbed these two ROIs
connection hubs based on the fact that most of the other ROIs exhibited connections to them.
Since the supramarginal and angular gyri are part of the IPL, it can be stated more generally that
the IPL serves as a connection hub for the working memory system cortico-cortical network
elicited during a complex working memory span task. In this study it was often the case that fiber
tracts leading to IPL regions had a high probability of existence. For example, tracts leading
from left BA 9, BA 4, BA 44, and the SPL (BA 7) to the left supramarginal gyrus had a
maximum overlap of 18, 24, 25, and 24 individuals, respectively. Tracts with a high probability
of existence leading from right BA 9, BA 6, insular cortex, and BA 19 to the right IPL had a

113
maximum overlap of 20, 25, 25, and 24 individuals, respectively. Furthermore, Hagmann et al
(2008), found the IPL to be one of the main connections hubs in the entire brain. The findings of
this study, taken along with those of Hagmann et al, indicate that not only is the IPL a connection
hub for the entire brain, but also lend further support to the prominent belief that complex
cognitive processes take place in the IPL (Grefkes & Fink, 2005; Sack, 2009; Vandenberghe &
Gilebert, 2008). These findings are also exciting because data from DTI, which is known to have
problems resolving crossing fibers (Hagmann et al. 2006; Mori & van Zijl, 2002), is in
agreement with DSI which has much higher angular resolution and is able to resolve the
problems with crossing fibers encountered with DTI (Wedeen et al. 2008)
Conclusion
The cortico-cortical connections, as inferred by DTI-based tractography, between the
regions required for the performance of storage, retrieval, and updating functions during a
complex working memory span revealed a complex network of structural interconnectedness,
with bilateral IPL as the connection hub, or main relay/processing center. Most connections to
the IPL were connections with a high probability of existence and these connections appeared to
be dominated by SLF II, one of the largest associative fiber bundles in the brain. Taking into
account the cognitive processes required in performing the OSPAN task, and the previously
related information regarding SLFII’s role in spatial attention, we believe SLFII is essential in
communicating non-domain specific information relevant to attentional control. Another major
fiber tract that contributed to connections between working memory regions of interest was the
FOF. The FOF, however, was not involved in many of the connections to the IPL. Nonetheless,
since the FOF serves as a communicatory route from the right insular cortex, it is possible FOF
plays a role in conveying emotional judgments about items in the focus of attention. Of further
interest is that DTI tractography demonstrated that pathways between some regions had an
114
intermingling of FOF and SLF II fibers. Since these fiber pathways are significant in size and run
in such close proximity to each other, it is very possible they actually interact with each other.
On the other hand, it is possible these observations may be due to some of the limitations
inherent to DTI based tractography. As mentioned, one of the drawbacks typically attributed to
DTI-based tractography is its inability to resolve crossing fibers. Typically the complaint is that
fibers crossing at approximately perpendicular angles produce diffusion tensors with non-
dominant eigenvectors. When typical tractography algorithms encounter tensors without a
dominant eigenvector, they tend to terminate the tract in question. Additionally, fibers crossing at
more acute angles may result in the estimation of a diffusion tensor with a dominant eigenvector
representing both tracts, causing the tractography algorithm to perceive the tracks as one. Even
though this is a possibility in the current study, the FDT package used for probabilistic fiber
tracking analysis implements a Bayesian estimation to infer multiple fiber orientations per voxel.
Inferring multiple fiber orientations per voxel helps in greatly reducing the false positives and
negatives that result from inferring a maximum of one fiber orientation per voxel, as occurs in
more traditional tractography methods (Behrens, 2007). Additionally, the use of Bayesian
shrinkage priors allows data-based model flexibility to determine whether single or multiple
fibers will be inferred at any given voxel.
A further limitation of this study is that tractography was only performed using intra-
hemispheric cortical seeds and targets. This limits the extent to which conclusions can be drawn
about communication between regions, since it is possible that some intra-hemispheric regions
may communicate through inter-hemispheric connections. Also, the activation sites for the
contrast of interest in Faraco et al (2009) yielded mostly cortical sites of activation with the
exception of 2 cerebellar sites. The validity of activation in these regions was debatable because
fMRI brain coverage terminated somewhere in the middle of the cerebellum for most

115
individuals. Nevertheless, there are subcortical regions, such as the hippocampus, that play a role
in working memory functions (e.g., Budson, 2009; Head, Rodrigue, Mennedy, & Raz, 2009), and
regions, such as the thalamus, which serve as relay centers for all types of cognitive functions
(e.g., Swartz, Stuss, Gao, & Black, 2008; Wang et al., 2008). Since the brain is a vast, inter-
connected network, not having used these regions constrains the extent to which we can make
claims about the connectivity of the working memory system as used during a complex span
task. Future research examining this topic should look into using regions such the thalamus and
the hippocampus as seed and target regions. Behrens et al (2003a) parcellated the thalamus into
its nuclei and noted each nucleus had connections to specific cortical regions. Connections
through the thalamus likely serve as alternate connections between some regions already
connected by the SLF and FOF and probably connect regions that did not show viable
connections in the present study. As for the hippocampus, it is probably not involved in all the
cognitive operations examined in this study, but it is well known to play a role in encoding and
storage operations (e.g., Muzzio, Kentros, & Kandel, 2009). A future tractography study looking
to develop a connectivity map for regions involved in the successful storage of information
during a complex span task would greatly benefit from using the hippocampus as a seeding and
targeting region.

116
References
Audoin, B., Guye, M., Reuter, F. o., Au Duong, M.-V., Confort-Gouny, S., Malikova, I., et al.
(2007). Structure of WM bundles constituting the working memory system in early
multiple sclerosis: a quantitative DTI tractography study. Neuroimage, 36, 1324-1330.
Beaulieu, C. (2002). The basis of anisotropic water diffusion in the nervous system - a technical
review. NMR In Biomedicine, 15, 435-455.
Behrens, T. E. J., Berg, H. J., Jbabdi, S., Rushworth, M. F. S., & Woolrich, M. W. (2007).
Probabilistic diffusion tractography with multiple fibre orientations: What can we gain?
Neuroimage, 34, 144-155.
Behrens, T. E. J., Woolrich, M. W., Jenkinson, M., Johansen-Berg, H., Nunes, R. G., Clare, S., et
al. (2003). Characterization and propagation of uncertainty in diffusion-weighted MR
imaging. Magnetic Resonance in Medicine, 50, 1077-1088.
Behrens, T. E. J., Johansen-Berg, H., Woolrich, M. W., Smith, S. M., Wheeler-Kingshott, C. A.
M., Boulby, P. A., et al. (2003). Non-invasive mapping of connections between human
thalamus and cortex using diffusion imaging. Nature Neuroscience, 6, 750-757.
Benedict, R. H. B., Bruce, J. M., Dwyer, M. G., Abdelrahman, N., Hussein, S., Weinstock-
Guttman, B., et al. (2006). Neocortical atrophy, third ventricular width, and cognitive
dysfunction in multiple sclerosis. Archives Of Neurology, 63, 1301-1306.
Braak, H. Braak, E., & Bohl, J. (1993). Staging of Alzheimer-related cortical destruction.
European Neurology, 33, 403-408.
Budson, A. E. (2009). Understanding memory dysfunction. The Neurologist, 15, 71-79.
Champod, A. S., & Petrides, M. (2007). Dissociable roles of the posterior parietal and the
prefrontal cortex in manipulation and monitoring processes. Proceedings Of The National
Academy Of Sciences Of The United States Of America, 104, 14837-14842.

117
Chetelat, G. & Baron, J. C. (2003). Early diagnosis of Alzheimer's disease: Contribution of
structural neuroimaging. Neuroimage, 18, 525-541.
Conturo, T. E., Lori, N. F., Cull, T. S., Akbudak, E., Snyder, A. Z., Shimony, J. S., et al. (1999).
Tracking neuronal fiber pathways in the living human brain. Proceedings Of The
National Academy Of Sciences Of The United States Of America, 96, 10422-10427.
Conway, A. R., Kane, M. J., & Engle, R. W. (2003). Working memory capacity and its relation
to general intelligence. Trends In Cognitive Sciences, 7, 547-552.
Davatzikos, C., Resnick, S. M., Wu, X., Parmpi, P., & Clark, C. M. (2008). Individual patient
diagnosis of AD and FTD via high-dimensional pattern classification of MRI.
Neuroimage, 41, 1220-1227.
Dejerine, J. J. (1895). Anatomie de centres nerveux. Paris: Rueff et Cie.
Delacourte, A., David, J. P., Sergeant, N., Buee, L., Wattez, A. Vermersch, P., et al. (1999). The
biochemical pathway of neurofibrillary degeneration in aging and Alzheimer's disease.
Neurology, 52, 1158-1165.
Della Sala, S., Laiacona, M., Spinnler, H., & Trivelli, C. (1995). Poppelreuter-Ghent's
Overlapping Figures Test: its sensitivity to age, and its clinical use. Archives of Clinical
Neuropsychology, 10, 511-534.
Faraco, C.C., Smith, D., Unsworth, N., Li, K., Langley, J., & Miller, L. S. (2009). Eliciting
working memory cortical activity through a complex span task. Unpublished manuscript,
University of Georgia.
First, M. B., Spitzer, R. L., Gibbon, M., & Williams, J. B. (1997). Sctructured Clinical Interview
for DSM-IV Axis I Disorders (SCID-I), Clinical Version. Arlington, VA: American
Psychiatric Publishing, Inc.
Frey, S., Campbell, J. S. W., Pike, G. B., & Petrides, M. (2008). Dissociating the human

118
language pathways with high angular resolution diffusion fiber tractography. The Journal
Of Neuroscience: The Official Journal Of The Society For Neuroscience, 28, 11435-
11444.
Gazzaley, A., Rissman, J., Cooney, J., Rutman, A., Seibert, T., Clapp, W., et al. (2007).
Functional interactions between prefrontal and visual association cortex contribute to top-
down modulation of visual processing. Cerebral Cortex (New York, N.Y.: 1991), 17
Suppl 1, i125-135.
Goodrich-Hunsaker, N. J., Howard, B. P., Hunsaker, M. R., & Kesner, R. P. (2008). Human
topological task adapted for rats: Spatial information processes of the parietal cortex.
Neurobiology Of Learning And Memory, 90, 389-394.
Grefkes, C., & Fink, G. R. (2005). The functional organization of the intraparietal sulcus in
humans and monkeys. Journal Of Anatomy, 207, 3-17.
Hagmann, P., Cammoun, L., Gigandet, X., Meuli, R., Honey, C. J., Wedeen, V. J., et al. (2008).
Mapping the structural core of human cerebral cortex. Plos Biology, 6, e159-e159.
Hagmann, P., Jonasson, L., Maeder, P., Thiran, J.-P., Wedeen, V. J., & Meuli, R. (2006).
Understanding diffusion MR imaging techniques: from scalar diffusion-weighted
imaging to diffusion tensor imaging and beyond. Radiographics: A Review Publication
Of The Radiological Society Of North America, Inc, 26 Suppl 1, S205-223.
Haznedar, M. M., Buchsbaum, M. S., Hazlett, E. A., Shihabuddin, L., New, A., & Siever, L. J.
(2004). Cingulate gyrus volume and metabolism in the schizophrenia spectrum.
Schizophrenia Research, 71, 249-262.
Head, D., Rodrigue, K. M., Kennedy, K. M., & Raz, N. (2008). Neuroanatomical and cognitive
mediators of age-related differences in episodic memory. Neuropsychology, 22, 491-507.
Heinrichs, R. W., & Zakzanis, K. K. (1998). Neurocognitive deficit in schizophrenia: A

119
quantitative review of the evidence. Neuropsychology, 12, 426-445.
Hua, K., Oishi, K., Zhang, J., Wakana, S., Yoshioka, T., Zhang, W., et al. (2009). Mapping of
functional areas in the human cortex based on connectivity through association fibers.
Cerebral Cortex (New York, N.Y.: 1991), 19, 1889-1895.
Huesgen, C. T., Burger, P. C., Crain, B. J., & Johnson, G. A. (1993). In vitro MR spectroscopy
of the hippocampus in Alzheimer's disease. Neurology, 43, 145-152.
Jack, C. R., Dickson, D. W., Parisi, J. E., Xu, Y. C., Cha, R. H., O'Brien, P. C., et al. (2002).
Antemortem MRI findings correlate with hippocampal neuropathology in typical aging
and dementia. Neurology, 58, 750-757.
Jenkinson, M., Bannister, P., Brady, M., & Smith, S. (2002). Improved optimization for the
robust and accurate linear registration and motion correction of brain images.
Neuroimage, 17, 825-841.
Kane, M. J., Conway, A. R. A., Miura, T. K., & Colflesh, G. J. H. (2007). Working memory,
attention control, and the N-back task: A question of construct validity. Journal of
Experimental Psychology-Learning Memory and Cognition, 33, 615-622.
Kane, M. J., Hambrick, D. Z., & Conway, A. R. A. (2005). Working memory capacity and fluid
intelligence are strongly related constructs: comment on Ackerman, Beier, and Boyle
(2005). Psychological Bulletin, 131, 66.
Klein, K., & Fiss, W. H. (1999). The reliability and stability of the Turner and Engle working
memory task. Behavioral Research Methods, Instruments, & Computers, 31, 429-432.
Kung, L., & Roberts, R. C. (1999). Mitochondrial pathology in human schizophrenic striatum: a
postmortem ultrastructural study. Synapse, 31, 67-75.
Lanyon, L. J., Giaschi, D., Young, S. A., Fitzpatrick, K., Diao, L., Bjornson, B. H., et al. (2009).
Combined functional MRI and diffusion tensor imaging analysis of visual motion

120
pathways. Journal Of Neuro-Ophthalmology: The Official Journal Of The North
American Neuro-Ophthalmology Society, 29, 96-103.
Lee, J., & Park, S. (2005). Working memory impairments in schizophrenia: a meta-analysis. J
Abnormal Psychology, 114, 599-611.
Lehéricy, S. p., Marjanska, M., Mesrob, L., Sarazin, M., & Kinkingnehun, S. (2007). Magnetic
resonance imaging of Alzheimer's disease. European Radiology, 17, 347-362.
Lezak, M. D., Howieson, D. B., & Loring, D. W. (2004) Neurospychological Assessment (Fourth
Edition ed., pp. 80-82). New York: Oxford Univeristy Press.
Makris, N., Kennedy, D. N., McInerney, S., Sorensen, A. G., Wang, R., Caviness, V. S., Jr., et
al. (2005). Segmentation of subcomponents within the superior longitudinal fascicle in
humans: a quantitative, in vivo, DT-MRI study. Cerebral Cortex (New York, N.Y.: 1991),
15, 854-869.
Makris, N., Papadimitriou, G. M., Sorg, S., Kennedy, D. N., Caviness, V. S., & Pandya, D. N.
(2007). The occipitofrontal fascicle in humans: a quantitative, in vivo, DT-MRI study.
Neuroimage, 37, 1100-1111.
Makris, N., Papadimitriou, G. M., van der Kouwe, A., Kennedy, D. N., Hodge, S. M., Dale, A.
M., et al. (2007). Frontal connections and cognitive changes in normal aging rhesus
monkeys: a DTI study. Neurobiology Of Aging, 28, 1556-1567.
McNab, F., & Klingberg, T. (2008). Prefrontal cortex and basal ganglia control access to
working memory. Nature Neuroscience, 11, 103-107.
Melhem, E. R., Mori, S. Mukundan, g., Kraut, M. A., Pomper, M. G., & van Zijl, P. C. (2002).
Diffusion tensor MR imaging of the brain and white matter tractography. American
Journal of Roentgenology, 178, 3-16.
Mori, S., Wakana, S., Nagae-Poetscher, L. M., & van Zijl, P. C. (2005). MRI atlas of human

121
white matter. Amsterdam: Elsevier.
Mori, S., & van Zijl, P. C. (2002). Fiber tracking: principles and strategies - a technical review.
NMR In Biomedicine, 15, 468-480.
Mosconi, L. (2005). Brain glucose metabolism in the early and specific diagnosis of Alzheimer's
disease. FDG-PET studies in MCI and AD. European Journal of Nuclear Medicine and
Molecular Imaging, 32, 486-510.
Mutschler, I., Wieckhorst, B., Kowalevski, S., Derix, J., Wentlandt, J., Schulze-Bonhage, A., et
al. (2009). Functional organization of the human anterior insular cortex. Neuroscience
Letters, 457, 66-70.
Muzzio, I. A., Kentros, C., & Kandel, E. (2009). What is remembered? Role of attention on the
encoding and retrieval of hippocampal representations. The Journal Of Physiology, 587,
2837-2854.
Onitsuka, T., Niznikiewicz, M. A., Spencer, K. M., Frumin, M., Kuroki, N., Lucia, L. C., et al.
(2006). Functional and structural deficits in brain regions subserving face perception in
schizophrenia. American Journal of Psychiatry, 163, 455-462.
Parasuraman, R., Greenwood, P. M., & Alexander, G. E. (1995). Selective impairment of spatial
attention during visual search in Alzheimer's disease. Neuroreport, 6, 1861-1864.
Perry, R. J., Watson, P., & Hodges, J. R. (2000). The nature and staging of attention dysfunction
in early (minimal and mild) Alzheimer's disease: relationship to episodic and semantic
memory impairment. Neuropsychologia, 38, 252-271.
Petrides, M., & Pandya, D. N. (1984). Projections to the frontal cortex from the posterior parietal
region in the rhesus monkey. The Journal Of Comparative Neurology, 228, 105-116.
Petrides, M., & Pandya, D. N. (2006). Efferent association pathways originating in the caudal
prefrontal cortex in the macaque monkey. The Journal Of Comparative Neurology, 498,

122
227-251.
U.S. Department of Health and Human Services. (2008). Depression in the United States
household population, 2005-2006 (DHHS Publication (PHS) 2008-1209). Hyattsville,
MD: Pratt, L. A. & Brody, D. J.
Roberts, R. C., Roche, J. K., & Conley, R. R. (2005). Synaptic differences in the postmortem
striatum of subjects with schizophrenia: a stereological ultrastructural analysis. Synapse,
56, 185-197.
Rorden, C. (2007). DCM2NII (Version October 7) [Computer software].
Rossi, A. F., Bichot, N. P., Desimone, R., & Ungerleider, L. G. (2007). Top down attentional
deficits in macaques with lesions of lateral prefrontal cortex. The Journal Of
Neuroscience: The Official Journal Of The Society For Neuroscience, 27, 11306-11314.
Rossi, A. F., Pessoa, L., Desimone, R., & Ungerleider, L. G. (2009). The prefrontal cortex and
the executive control of attention. Experimental Brain Research. Experimentelle
Hirnforschung. Expérimentation Cérébrale, 192, 489-497.
Sack, A. T. (2009). Parietal cortex and spatial cognition. Behavioural Brain Research, 202, 153-
161.
Sartori, E., & Edan, G. (2006). Assessment of cognitive dysfunction in multiple sclerosis.
Journal Of The Neurological Sciences, 245, 169-175.
Saur, D., Kreher, B. r. W., Schnell, S., Kümmerer, D., Kellmeyer, P., Vry, M.-S., et al. (2008).
Ventral and dorsal pathways for language. Proceedings Of The National Academy Of
Sciences Of The United States Of America, 105, 18035-18040.
Schmahmann, J. D., & Pandya, D.N. (2006). Fiber Pathways in the Brain. New York: Oxford University Press.
Schmahmann, J. D., & Pandya, D. N. (2007). The complex history of the fronto-occipital
123
fasciculus. Journal of the History of the Neurosciences, 16, 362-377.
Schmahmann, J. D., Pandya, D. N., Wang, R., Dai, G., D'Arceuil, H. E., de Crespigny, A. J., et
al. (2007). Association fibre pathways of the brain: parallel observations from diffusion
spectrum imaging and autoradiography. Brain: A Journal Of Neurology, 130, 630-653.
Schreppel, T., Egetemeir, J., Schecklmann, M., Plichta, M. M., Pauli, P., Ellgring, H., et al.
(2008). Activation of the prefrontal cortex in working memory and interference
resolution processes assessed with near-infrared spectroscopy. Neuropsychobiology, 57,
188-193.
Silbert, L. C., Quinn, J. F., Moore, M. M., Corbridge, E., Ball, M. J., Murdoch, G., at al. (2003).
Changes in premorbid brain volume predict Alzheimer's disease pathology. Neurology,
61, 487-492.
Small, G. W., Kepe, V., Ercoli, L. M., Siddarth, P., Bookheimer, S. Y., Miller, K. J., et al.
(2006). PET of brain amyloid and tau in mild cognitive impairment. The New England
Journal of Medicine, 355, 2652-2663.
Smith, S. M. (2002). Fast robust automated brain extraction. Human Brain Mapping, 17, 143-
155.
Smith, S. M., Jenkinson, M., Woolrich, M. W., Beckmann, C. F., Behrens, T. E., Johansen-Berg,
H., et al. (2004). Advances in functional and structural MR image analysis and
implementation as FSL. Neuroimage, 23 Suppl 1, S208-219.
Swartz, R. H., Stuss, D. T., Gao, F., & Black, S. E. (2008). Independent cognitive effects of
atrophy and diffuse subcortical and thalamico-cortical cerebrovascular disease in
dementia. Stroke; A Journal Of Cerebral Circulation, 39, 822-830.
Unsworth, N., Heitz, R. R., Schrock, J. C., & Engle, R. W. (2005). An automated version of the
operation span task. Behavior Research Methods, 37, 498-505.

124
Van Essen, D. C., Newsome, W. T., Maunsell, J. H., & Bixby, J. L. (1986). The projections from
striate cortex (V1) to areas V2 and V3 in the macaque monkey: Assymetries, areal
boundaries and patchy connections. Journal of Comparative Neurology, 244, 451-480.
Vandenberghe, R., & Gillebert, C. l. R. (2009). Parcellation of parietal cortex: convergence
between lesion-symptom mapping and mapping of the intact functioning brain.
Behavioural Brain Research, 199, 171-182.
Wang, L., Mamah, D., Harms, M. P., Karnik, M., Price, J. L., Gado, M. H., et al. (2008).
Progressive deformation of deep brain nuclei and hippocampal-amygdala formation in
schizophrenia. Biological Psychiatry, 64, 1060-1068.
Wedeen, V. J., Wang, R. P., Schmahmann, J. D., Benner, T., Tseng, W. Y. I., Dai, G., et al.
(2008). Diffusion spectrum magnetic resonance imaging (DSI) tractography of crossing
fibers. Neuroimage, 41, 1267-1277.
Wechsler D. (2001). Wechsler Test of Adult Reading. San Antonio, TX: The Psychological
Corporation.
Wilk, C. M., Gold, J. M., McMahon, R. P., Humber, K., Iannone, V. N., & Buchanan, R. W.
(2005). No, it is not possible to be schizophrenic yet neuropsychologically normal.
Neuropsychology, 19, 778-786.
Yang, D. S., Hong, J. H., Byun, W. M., Kwak, S. Y., Ahn, S. H., Lee, H., et al. (2009).
Identification of the medial lemniscus in the human brain: combined study of functional
MRI and diffusion tensor tractography. Neuroscience Letters, 459, 19-24.
Yetkin, F. Z., Rosenberg, R. N., Weiner, M. F., Purdy, P. D., & Cullum, C. M. (2006). FMRI of
working memory in patients with mild cognitive impairment and probable Alzheimer's
disease. European Radiology, 16, 193-206.
Zedkova, L., Woodward, N. D., Harding, I., Tibbo, P. G., & Purdon, S. E. (2006). Procedural

125
learning in schizophrenia investigated with functional magnetic resonance imaging.
Schizophrenia Research, 88, 198-207.

126
L IFGR Insula
R PCG, BA 44/6
R Angular R DLPFC L DLPFC
R PCG, BA Figure 4.1. Masks. Slice views of masks used as seeding and target regions, from inferior to superior, in radiologic orientation. Masks appear to be different sizes solely because of the slice from which the images were taken. All masks have a 6mm radius and contain 123, 2mm voxels. DLPFC = Dorsolateral Prefrontal Cortex; MFG = Middle Frontal Gyrus; PCG = Precentral Gyrus; SMC = Supplementary Motor Cortex; and SPL = Superior Parietal Lobule
R Lateral Occipital Cortex
L
R & L
R ACC L MFG, BA L SMA
R PCG, BA L

127
R SLF L SLF
A
R Cingulum
B
R SLF
R FOF
C
5 25
Figure 4.2. Tractography results. These depict the main fiber tracts connecting regions involved in storage, retrieval, and updating during a complex working memory span task. A) The right and left superior longitudinal fascicule; b) the right cingulum bundle; c) the right frontal occipital fasciculus and superior longitudinal fasciculus. This image also depicts how these two fiber tracts interact.

128
A CB
E D
H
F
G
5 25
Figure 4.3. Superior longitudinal fasciculus tracts. Presented are associative connections of SLF I, II, and III. The first 6 tracts correspond to SLF II connections between a) L DLPFC and L supramarginal syrus; b) L PCG (BA 6) and L supramarginal gyrus; c) R DLPFC and R angular gyrus; d,e) R PCG (BA 6) and R angular gyrus; and f) R PCG and the superior division of the R lateral occipital cortex. G) An SLF I connection from L PCG (BA 4) to L SPL. H) An SLF III connection from the pars opercularis (BA 44) to the L supramarginal gyrus.

129
DC
BA
5 2
Figure 4.4. Fronto-occiptal fasciculus tracts. These tracts are all associative connections from the R Insula to occipital and parietal regions. A) Axial view of FOF connection from to BA 18; b) sagittal view of the latter; c) FOF tract to BA 19; d) FOF tract to BA 39. Images c and d also demonstrate how the FOF intermingles with the SLF.

130
Table 4.1. Associative/Inter-lobar fiber tracts.*
ASSOCIATIVE/INTER-LOBAR CONNECTIONS
Number of subjects,
Probability of Tract
Existence Fiber Track High Probability L IFG Pars opercularis to L Supramarginal 25 SLF III R Angular to R PCG 25 SLF II R Insula to R PCG, BA 44/6 25 SLF R Angular 7D to R Insula 25 SLF and FOF R PCG to R Angular 24 SLF II L PCG to L Supramarginal 24 SLFII R DLPFC to R Insula 24 FOF R ACC to R Precuneus 22 Cingulum Bundle R Lateral Occipital, Superior division to R PCG, BA 6 21 SLF II R DLPFC to R Angular 20 SLF II R Lateral Occipital to R Precuneus 20 FOF L PCG to LSPL 18 SLFI L DLPFC to L Supramarginal 18 SLFII R Lateral Occipital to R Lateral Occipital, Superior division 17 FOF Medium Probability R Lateral Occipital to R Insula 16 FOF R Lateral Occipital, Superior division to R PCG, BA 44/6 14 SLF II R PCG, BA 6 to R Insula 13 SLF II R DLPFC to R Lateral Occipital, Superior division 10 FOF L Lateral Occipital to L Precuneus 10 R Insula to R Precuneus.nii.gz 9 FOF L SMC to L Supramarginal 9 SLFII L IFG Pars opercularis to L SPL 9 Some SLF Low Probability L DLPFC to L SPL 8 L MFG to LSPL 7 L SMC to LSPL 7 SLFI? L Lateral Occipital to L SPL 7 R Lateral Occipital to R PCG, BA 44/6 6 L Lateral Occipital to L Supramarginal 5 R Lateral Occipital to R DLPFC 4 L SMC to L Precuneus 4 SLFI? L MFG to L Supramarginal 4 R DLPFC to R Precuneus 3 R Lateral Occipital to R PCG, BA 6 3 R PCG to R Precuneus 2 RACCD to R Insula 2 L DLPFC to L Precuneus 1 L IFG Pars opercularis to L Precuneus 1 L MFG to L Precuneus 1 R PCG to R Precuneus 1

131
Table 4.1. Continued R Lateral Occipital to R ACC 0 R ACC to R Lateral Occipital, Superior division 0 R ACC to R Angular 0 L Lateral Occipital to L DLPFC 0 L Lateral Occipital to L IFG Pars opercularis 0 L Lateral Occipital to L MFG 0 L Lateral Occipital to L PCG 0 L Lateral Occipital to L SMC 0
*This table includes all tracts and has not been thresholded. All tracts are shown in order to give the reader an idea of how many tracts were below threshold Table 4.2. Intra-lobar fiber tracts.*
INTRALOBAR CONNECTIONS
Number of Subjects, Probability
of Tract Existence Fiber Track
High Probability R Lateral Occipital, Superior Division to R Angular 24 SLF II LSupraMarginal_5D to LSPL_6D.nii.gz 23 SLF R DLPFC to RPCG, BA 44/6 21 FOF and SLF L IFG Pars opercularis to L DLPFC 19 SLF
L Precuneus to L SPL 19 SLF I and Callosal Body
R DLPFC to R PCG, BA 6 19 Partial overlap SLF R Lateral Occipital, Superior Division to R Precuneus 17 Partial overlap SLF PCG BA 6 to R PCG, BA 44/6 17 SLF Medium Probability L IFG Pars opercularis to L SMC 11 L PCG to L DLPFC 11 Low Probability L MFG to L SMC 8 L DLPFC to L SMC 7 L IFG Pars opercularis to L PCG 7 L IFG Pars opercularis to LMFG 6 L PCG to L MFG 6 R ACC to R DLPFC 6 R Angular to R Precuneus 5 L MFG to L DLPFC 5 L PCG to L SMC 5 L Supramarginal to LPrecuneus 3 R ACC to RPCG, BA 44/6 1 R ACC to R PCG BA 6 0
*This table includes all tracts and has not been thresholded. All tracts are shown in order to give the reader an idea of how many tracts were below threshold

132
CHAPTER 5
CONCLUSION
This study has demonstrated the feasibility of integrating fMRI and DTI-based
tractography to develop structural connectivity maps of specific cognitive networks. In this case,
a structural connectivity map of the cortical regions involved in storage, retrieval, and updating
during a complex working memory span task was developed. Initially, fMRI activation during
the OSPAN task was contrasted with activation during an arithmetic condition. This contrast
yielded activation that should be related to the storage, retrieval, and updating of the letters
presented during the OSPAN task, as the arithmetic operations occurring in both the OSPAN and
Arithmetic conditions should nullify each other. Results revealed robust activation in regions
typically associated with WM (Wager and Smith, 2003), including BAs 9, 44, 32, and 7. It was
also shown that the OSPAN can be used as a reliable fMRI paradigm to examine WM span by
replicating many of the activation sites found in Kondo et al (2004). Furthermore, given the
increased detection power afforded when using a 3T MRI over a 1.5T, more localized regions of
activation were evidenced in the frontal and parietal lobes compared to Kondo et al.
Given the OSPAN’s high correlation with WM span and analyses revealing positive
correlations and negative correlations with a number of frontal and parietal regions with number
of correct letter responses, respectively, it appears that the WM system as defined by span
measures is formed in part by a complex cortical network. This complex network also appears to
rely on the interaction of frontal and parietal regions. Overall, these results lend further support
to the embedded processes and controlled attention models by indicating that the interaction of
frontal and parietal regions is likely the source of WM capacity limits.

133
The cortico-cortical connections, as inferred by DTI-based tractography, between the
regions required for the performance of storage, retrieval, and updating functions during the
OSPAN revealed a complex network of structural connectivity, with bilateral IPL as the
connection hub, or main relay/processing center. Most connections to the IPL were connections
with a high probability of existence and these connections seemed to be dominated by SLF II,
one of the largest associative fiber bundles in the brain. Taking into account the cognitive
processes required in performing the OSPAN task, and information regarding SLFII’s role in
spatial attention (Makris et al.2005), it appears SLFII is essential in communicating non-domain
specific information relevant to attentional control. Another major fiber tract that contributed to
connections between working memory regions of interest was the FOF. The FOF, however, was
not involved in many of the connections to the IPL. Nonetheless, since the FOF serves as a
communicatory route from the right insular cortex, it is possible FOF plays a role in conveying
emotional judgments about items in the focus of attention. Of further interest is that DTI
tractography demonstrated that pathways between some regions had an intermingling of FOF
and SLF II fibers. Since these fiber pathways are significant in size and run in such close
proximity to each other, it is very possible they actually interact with each other.
On the other hand, it is possible these observations may be due to some of the limitations
inherent to DTI based tractography. One of the drawbacks typically attributed to DTI-based
tractography is its inability to resolve crossing fibers (Hagmann et al. 2006; Mori & van Zijl,
2002) Typically the complaint is that fibers crossing at approximately perpendicular angles
produce diffusion tensors with non-dominant eigenvectors. When typical tractography
algorithms encounter tensors without a dominant eigenvector, they tend to terminate the tract in
question. It is also possible that fibers may cross at angles approaching a parallel orientation.
These separate, but parallel, fiber tracks may result in the estimation of a diffusion tensor with a

134
dominant eigenvector representing both tracts, causing the tractography algorithm to perceive the
tracks as one. Even though this is a possibility in the current study, the FDT package used for
probabilistic fiber tracking analysis implements a Bayesian estimation to infer multiple fiber
orientations per voxel. Inferring multiple fiber orientations per voxel helps in greatly reducing
the false positives and negatives that result from inferring a maximum of one fiber orientation
per voxel, as occurs in more traditional tractography methods (Behrens, 2007). Additionally, the
use of Bayesian shrinkage priors allows data-based model flexibility to determine whether single
or multiple fibers will be inferred at any given voxel.
A further limitation of this study is that tractography was only performed using intra-
hemispheric cortical seeds and targets. This limits the extent to which conclusions can be drawn
about communication between regions, since it is possible that some intra-hemispheric regions
may communicate through inter-hemispheric connections. Also, the activation sites for the
contrast of interest yielded mostly cortical sites of activation with the exception of 2 cerebellar
sites. The validity of activation in these regions was debatable because fMRI brain coverage
terminated somewhere in the middle of the cerebellum for most individuals. Nevertheless, there
are subcortical regions, such as the hippocampus, that play a role in working memory storage
functions (e.g., Budson, 2009; Head, Rodrigue, Mennedy, & Raz, 2009) and regions, such as the
thalamus, which serve as relay centers for all types of cognitive functions (e.g., Swartz, Stuss,
Gao, & Black, 2008; Wang et al., 2008). Since the brain is a vast, inter-connected network, not
having used these regions constrains the extent to which claims can be made about the
connectivity of the working memory system as used during a complex span task.
Future research examining the topic of WM system connectivity would benefit from a
few suggestions. 1) FMRI analysis should focus on defining the functional connectivity of the
WM network as defined by span measures and should also look to parse out storage, retrieval,

135
and updating processes as they occur under the increased attentional control required during a
complex span task. 2) DTI tractography studies would likely reveal further complexity of the
structural connectivity of the WM network by using the thalamus as seed and target region.
Behrens et al (2003) parcellated the thalamus into its nuclei and noted each nuclei had
connections to specific cortical regions. Connections through the thalamus likely serve as
alternate connections between some regions already connected by the SLF and FOF and
probably connect regions that did not show viable connections in the present study. 3) As for the
hippocampus, it is probably not involved in all the cognitive operations examined in this study,
but again, is well known to play a role in encoding and storage operations (e.g., Muzzio, Kentros,
& Kandel, 2009). A future tractography study looking to develop a connectivity map for regions
involved in the successful storage of information during a complex span task would greatly
benefit from using the hippocampus as a seeding and targeting region.

136
References
Behrens, T. E. J., Johansen-Berg, H., Jbabdi, S., Rushworth, M. F. S., & Woolrich, M. W.
(2007). Probabilistic diffusion tractography with multiple fibre orientations: What can we
gain? Neuroimage, 34, 144-155.
Behrens, T. E. J., Johansen-Berg, H., Woolrich, M. W., Smith, S. M., Wheeler-Kingshott, C. A.
M., Boulby, P. A., et al. (2003). Non-invasive mapping of connections between human
thalamus and cortex using diffusion imaging. Nature Neuroscience, 6, 750-757.
Budson, A. E. (2009). Understanding memory dysfunction. The Neurologist, 15, 71-79.
Head, D., Rodrigue, K. M., Kennedy, K. M., & Raz, N. (2008). Neuroanatomical and cognitive
mediators of age-related differences in episodic memory. Neuropsychology, 22, 491-507.
Hagmann, P., Jonasson, L., Maeder, P., Thiran, J.-P., Wedeen, V. J., & Meuli, R. (2006).
Understanding diffusion MR imaging techniques: from scalar diffusion-weighted
imaging to diffusion tensor imaging and beyond. Radiographics: A Review Publication
Of The Radiological Society Of North America, Inc, 26 Suppl 1, S205-223.
Kondo, H., Morishita, M. Osaka, N., Osaka, M., Fukuyama, H., & Shibasaki, H. (2004).
Functional roles of the cingulo-frontal network in performance on working memory.
Neuroimage, 21, 2-14.
Mori, S., & van Zijl, P. C. (2002). Fiber tracking: principles and strategies - a technical review.
NMR In Biomedicine, 15, 468-480.
Makris, N., Kennedy, D. N., McInerney, S., Sorensen, A. G., Wang, R., Caviness, V. S., Jr., et
al. (2005). Segmentation of subcomponents within the superior longitudinal fascicle in
humans: a quantitative, in vivo, DT-MRI study. Cerebral Cortex (New York, N.Y.: 1991),
15, 854-869.
Muzzio, I. A., Kentros, C., & Kandel, E. (2009). What is remembered? Role of attention on the

137
encoding and retrieval of hippocampal representations. The Journal Of Physiology, 587,
2837-2854.
Swartz, R. H., Stuss, D. T., Gao, F., & Black, S. E. (2008). Independent cognitive effects of
atrophy and diffuse subcortical and thalamico-cortical cerebrovascular disease in
dementia. Stroke; A Journal Of Cerebral Circulation, 39, 822-830.
Wager, T. D. & Smith, E. E. (2003). Neuroimaging studies of working memory: a meta-analysis.
Cognitive, Affective, & Behavioral Neuroscience, 3, 255-274.
Wang, L., Mamah, D., Harms, M. P., Karnik, M., Price, J. L., Gado, M. H., et al. (2008).
Progressive deformation of deep brain nuclei and hippocampal-amygdala formation in
schizophrenia. Biological Psychiatry, 64, 1060-1068.

138
APPENDIX A
MRI SAFETY FORM

139