
A sustainable growth plan for building global connectivity ...
Connectivity and growth2017 edition
www.pwc.com/gx/en/industries/capital-projects-infrastructure.html
November 2017
Contents | PwC | Connectivity and growth
Introduction 1
Aviation growth in a changing world 2
Economic growth and air traffic: developments in Australia and Britain 6
Air connectivity: Why it matters and how to support growth 14
Aeronautical charges and air traffic demand risk: what is within our control? 22
Are European airport valuations taking off? 28

Introduction | 1
Introduction
This has been a year of record prices and valuations for airport assets – yet the perfect storm of low interest rates, low oil prices and increasing airline yields seems to be drawing to a close. With airline failures, such as Monarch and Air Berlin, and expectations of tightening airline margins from overcapacity and higher oil prices – can the good times last?
Yet, passenger demand and growth remain strong, and both airports and airlines continue to innovate to improve efficiency and provide new services and revenue streams. With these market headwinds, and the potential turmoil of Brexit yet to impact, signs of any reduction in investor appetite for airports will be closely assessed.
In this, our fifth annual compendium we again open with Andrew Sentence’s observations on the potential of the aviation market, and the issues that may impact growth. We have updated our analysis for the key themes of traffic, connectivity and valuations – core considerations for airport investment.
I hope you find this year’s new and updated articles a source of interest and debate, and I look forward to discussing these issues with you over the coming year.
Best Regards,
Michael Burns Partner, PwC UK
2 | PwC | Connectivity and growth
Aviation growth in a changing world
We live in a world of political uncertainty, yet the global economy is looking relatively strong. The latest forecasts published by the International Monetary Fund (IMF) in October point to the strongest global growth in 2017 and 2018 since 2010/11. All the three main engines of world economic growth – North America, Europe and Asia – are firing together for the first time in the post-crisis recovery. We can see the impact of this in terms of strong growth of demand in the airline industry. In August 2017, global passenger travel was up over 7% on a year ago and air cargo was up over 12% – according to IATA.
The political events of 2016 in the UK and US created a sense of upheaval. The UK referendum vote for “Brexit” and the election of Donald Trump as the 45th US President sent shockwaves through the political systems on both sides of the Atlantic. They have also raised a new set of economic uncertainties – particularly relating to the stability and future direction of the world trading system. In 2017, political developments in the major western economies have been more reassuring – with France electing the reform-minded President Macron and Angela Merkel returned to power in Germany.
What do these developments mean for the world of aviation? Aviation has been a major beneficiary of the globalisation of the world economy which has been underway since the 1990s. The opening up of major emerging markets like China and India to the global economy, the development of the Single European Market and other regional trade blocs, and the strong growth of trade and investment worldwide, have all benefited the growth of the aviation industry in the past three decades.
In the short-term, the aviation industry is benefitting from the upswing in the global economy. But there is still a possibility of disruption to established patterns of trade and investment over the longer term, with the UK set to leave the European Union (EU) and a growing threat of protectionism if President Trump’s more extreme proposals were carried through. If this protectionist threat materialises, the world of aviation and its future growth would be very significantly affected.
It will take time for it to become clear how seriously the aviation industry should take these protectionist worries. The Brexit negotiations are proceeding slowly. They were disrupted by the General Election in the UK in June 2017,
Dr Andrew Sentance, PwC UK
and both sides seem to have different objectives and strategies. The EU is seeking to secure its financial position and the rights of EU citizens. The UK is more concerned with a post-Brexit trade deal and securing a reasonable transition to a new relationship with the EU.
Talk from senior UK government figures of “No Deal” with the EU is worrying to many business executives. As long as this “cliff-edge” scenario is avoided, it will not be until the 2020s that a Brexit agreement will be properly implemented with more fundamental changes to the relationship between the UK and its European neighbours.
Meanwhile, across the Atlantic in the United States, the Trump administration is still clarifying its policy agenda and has yet to establish a good working relationship with the Houses of Congress. The immediate threat of new protectionist measures has not been realised. But it has not totally gone away either. The tax reforms promised by Trump and his team have yet to attract the necessary support in the Senate and the House of Representatives. Meanwhile, global tensions on the Korean peninsula have been rising following a series of missile tests by North Korea. Global security concerns are generally bad for air travel and aviation more generally, though they do not seem to be having much impact yet on the strong growth recorded by the airline industry.

Aviation growth in a changing world | 3
Though these political developments are creating an air of heightened uncertainty, the world economy continues to grow well (see Figure 1). 2017-18 looks set to see the strongest period of global growth since 2010-11 when the world economy bounced back from the depths of the Global Financial Crisis. The main exception to this global upswing is the UK, where economic growth has slowed from around 2.5% in the three years 2014 to 2016 to a projected 1.5% in 2017 and a PwC forecast of 1.4% in 2018.
Elsewhere within Europe, there has been a turnaround in growth in a number of economies over the past few years. Spain is the most striking example, where growth of around 3% is expected this year, followed by 2.3% in 2018. France and Italy are also reporting better growth prospects, while most countries in Northern and Eastern Europe continue to report strong growth. Meanwhile, across the
1. https://www.pwc.com/gx/en/issues/economy/the-world-in-2050.html
Atlantic, the US economy is forecast to grow by over 2% this year and next, with Canada expected to record a similar growth rate. Despite the lack of clarity surrounding the policy agenda of the Trump Presidency, consumers and businesses have remained confident and the US economy has continued to grow steadily. The modest interest rate rises implemented by the US Federal Reserve have not seriously disrupted economic growth.
Asia also continues to power ahead, led by the large population economies – China, India and Indonesia. Chinese growth is expected to be over 6% in 2018 with India growing by over 7%. The Asia-Pacific region is already substantially larger than the other major regions in the world economy – accounting for around one-third of global GDP, compared with the EU’s share of just over 20% and North America’s contribution of around a quarter. By 2030, PwC’s “World in 2050”
projections1 suggest that the Asia-Pacific economies will account for a larger share of world GDP than Europe and North America combined. Also by this date, China will have overtaken the United States as the world’s largest economy, a position that the US has held for around 150 years. Against this backdrop, it is perhaps not surprising that US politicians are particularly sensitive about the rise of China and the role it is playing in the world economy.
Greece
Russia
UK
US
Brazil
India
Spain
Key
Canada
Mexico
South Africa
Australia
Japan
Italy
Ireland
France
China
= GDP growth in 2017
2.2
1.9 Germany
1.9
2.8
6.22.3
X.X
1.7
1.6
1.71.2
1.1
1.4
0.7
1.4
7.4
3.4
1.7
Figure 1: Outlook for global economy in 2017
Source: PwC Oct/Nov 2017 Forecasts
Note: Weather icons are for indicative/descriptive purposes only
4 | PwC | Connectivity and growth
Looking ahead to the 2020s, it is possible to envisage two scenarios for the global economy as the current period of political uncertainty plays itself out. The first – and most likely – scenario is that the present highly globalised economy remains broadly intact and countries in the western world adapt to the rise of China and other large Asian economies. This scenario might be characterised as “adjustment and acceptance”: an acceptance of the changing world economic order and an adjustment of economic policies to adapt to the new world order.
A more worrying and negative scenario is that a new form of economic rivalry develops between the major economic powers – as the US and Europe adopt a protectionist stance to the rise of China and other emerging economies. At present this seems the less likely scenario, but the upheaval of Brexit and the protectionist rhetoric from President Trump, means it cannot be ruled out. This more protectionist scenario would be associated with much slower economic growth and more volatility than the more benign “adjustment and acceptance” scenario.
How should airlines and airports respond to these developments in their business planning and investment? The most immediate consequence of the recent change in the political climate is a rise in risk and uncertainty. That points to the need to consider a wider range of scenarios for growth in the current environment. A continuation of recent healthy growth of air traffic demand should be considered the most likely scenario for the short-term outlook (see Figure 2). However, looking ahead, it makes sense to be cautious about the medium-term outlook for a number of reasons.
First, the world economic recovery which began in mid-2009 is now into its ninth year. Periods of growth can only continue for so long before an economic shock or some series of unforeseen events come along to disrupt it. Periods of sustained global economic growth lasting longer than ten years are relatively unusual. Second, a lapse into a more protectionist and defensive world in the 2020s would be associated with much weaker economic growth and a much less co-operative approach to trade, investment and the movement of people. That is not the
central scenario – but if such a world did emerge, it would be much less favourable for the aviation industry. So it makes sense for businesses and regulators to consider how robust plans and forecasts are to a more serious disruption to world trade and investment and a less positive outcome from both Brexit and the Trump presidency in the US.
The fundamentals of planning for sustainable growth remain the same, however. For airlines, the watchwords should be profitable growth, cost control and connectivity. Growth opportunities need to be profitable. Chasing volume growth supported by declining yields has brought financial ruin and disaster to many airlines and their investors. So airlines need to undertake a careful evaluation of growth opportunities, both in terms of new routes and additional frequency of service. They should not be seduced by the optimistic forecasts presented to them by aircraft manufacturers, which rarely mention the profitability of growth opportunities. To achieve profitable growth, airlines need to control costs and develop their networks by improving connectivity.

Aviation growth in a changing world | 5
Connectivity is at the heart of what makes airlines successful – finding new routes, either directly or via an efficient hub-and-spoke network operation.
Airports face a different set of growth issues. Unlike airlines, which can expand capacity quite quickly by ordering a few more planes and finding new runway slots to operate, airport capacity expansion is more lumpy, requiring longer lead times, as well as much more intensive stakeholder discussion and dialogue. This is most noticeable in the major Western economies. In the UK, we have had 15 years of discussion about new runway options at the major London airports, and still no firm decision has been made – let alone any concrete or tarmac laid. The UK may be an extreme example, but similar issues exist in many other advanced economies where there is great sensitivity about the local and environmental impacts of aviation expansion.
In developing and emerging markets, airport expansion appears easier – and is often supported strongly by the regulating authorities as a means of providing strategic support to economic growth in a region or nation. But that carries a different risk – of over-ambitious expansion – akin to the problems that the airline industry has experienced by over-investing in capacity in the past. Also, alongside airports, airspace capacity needs to be developed. In Europe and North America, there is a high degree of capability in airspace management which can be deployed in Asia, the Middle East and Africa as these regions start to experience airspace congestion around major cities and airport hubs.
The final issue bearing on the aviation growth agenda – which affects aircraft/ engine manufacturers, airlines, airports and airspace managers alike – is the environmental challenges facing the
expansion of the industry. These environmental challenges arise both at the local level – where the main issues are noise, air quality and surface access – and globally, where the main challenge is the impact of the industry on climate change. It is encouraging that the global aviation industry has recently agreed an approach to limiting its contribution to climate change – though much of the detail remains to be worked out. On the other hand, this is another area where a change of direction following the US presidential election could create disruption and additional uncertainty.
The aviation industry worldwide has been remarkably resilient in the aftermath of the global financial crisis. The industry coped much better than after 9/11, which created more financial distress and business failures. But there is now growing political uncertainty following the UK’s referendum decision to leave the EU and the US presidential election.
The short-term economic outlook is favourable – but there are growing risks to longer-term economic prospects which need to recognised. The current economic upswing is becoming more mature. And there is a danger of a lapse into a more protectionist world in which globalisation moves into reverse. While that is not the central scenario, a more protectionist and defensive global economic and political climate in the 2020s would not be a good business environment for the aviation industry. The risks of a less positive economic outlook in the next decade therefore need to be taken into account in planning and investment decisions.
About the author: Andrew Sentance is a Senior Economic Adviser at PwC UK and is a former Chief Economist at British Airways (1998–2006) and a former member of the Bank of England Monetary Policy Committee (2006–2011). He is based in London.
E: [email protected] T: +44 (0) 20 7213 2068
The fundamentals of planning for sustainable growth remain the same, however. For airlines, the watchwords should be profitable growth, cost control and connectivity.
Source: IMF and ICAO/IATA
Figure 2: Global growth is a key driver of air travel
Air traffic (RPKs) and World GDP – % per annum change
-3%
0%
3%
6%
9%
12%
15%
-2%
0%
2%
4%
6%
8%
GDP (LH scale) RPKs (RH scale)

6 | PwC | Connectivity and growth
Global air traffic has grown a substantial 78%1 in the past decade. Innovations in the aviation market, such as deeper aviation market liberalisation in developed economies and the rising prominence of low-cost carriers in intra-regional routes have helped spur this growth. However, propensity to fly has also been associated with global economic growth, both in emerging and developed markets. There is little consensus on the question of causality in the relationship between passenger numbers and GDP. Some think GDP drives air passenger demand; others think that better air travel infrastructure leads to GDP growth; whilst still others suggest there is a two-way-causality. Mukkala and Tervo (2013)2, Ishutkina and Hansman (2009)3, and Green (2007)4 all reach different conclusions on the issue. However, for the purposes of this report, the issue of causality is less important as only the correlation is needed to forecast air traffic demand.
In this article, we will look into the relationship between air traffic demand and GDP in two countries: Britain and Australia, employing our econometric and forecasting techniques as well as industry expertise.
1. Sourced from the World Bank’s World Development Index database.2. Mukkala, K and Tervo, H. (2013), ‘Air transportation and regional growth: which way does the causality run?’ Environment and Planning A, 45:1508-15203. Ishutkina, Marya and Hansman, R. John (2009), ‘Analysis of the interaction between air transportation and economic activity: a worldwide perspective’,
MIT International Center for Air Transportation Report No. ICAT-2009-24. Green, R. (2007), ‘Airports and economic development’, Real Estate Economics, 35:91-112.
We first explain the methodology we have used, what it reveals with regards to the GDP-passenger demand relationship in the UK and Australia, and the latest developments in the two markets. Then we look into how volatility in passenger numbers vary from airport to airport, and potential reasons behind it. Finally, we apply our model to forecast passenger demand as a result of revised economic outlook that follows the Brexit vote in the UK. Our key findings are:
• On the country level, in both Britain and Australia, the relationship remains strong and significant. But while we observed that the 2008 Financial Crisis is correlated to a downward level shift in air passenger demand in the UK, we did not find a similar association in Australia.
• On the airport level, we find that passenger numbers at London Heathrow are least responsive to GDP among the UK’s four busiest airports. This is followed by London Gatwick and Manchester. London Stansted has the most volatile passenger level: demand at London Stansted is found to be around four times as responsive to UK’s GDP as demand at Heathrow.
Passenger numbers at Sydney and Melbourne, meanwhile, are responsive to Australian GDP to a similar extent.
• Brexit: As a consequence of revised economic outlook made by the Office of Budget Responsibility (OBR) after the referendum last year, our forecast trajectory for UK passenger number has been adjusted downward accordingly, and the difference between two trajectories would each 4.6 million in 2020..
The GDP-air passenger demand relationship: A tale of two aviation marketsWe start our analysis with a case study of the link between national income and air travel in the UK and Australia. We obtained passenger number data from the Civil Aviation Authority (CAA) of the UK and Bureau of Infrastructure, Transport, and Regional Economics (BITRE) of Australia, and official GDP figures from the Office of National Statistics (ONS of the UK) and the Reserve Bank of Australia (RBA) respectively.
Economic growth and air traffic: developments in Australia and Britain
Edmond Lee and Shivangi Jain
Economic growth and air traffic: developments in Australia and Britain | 7
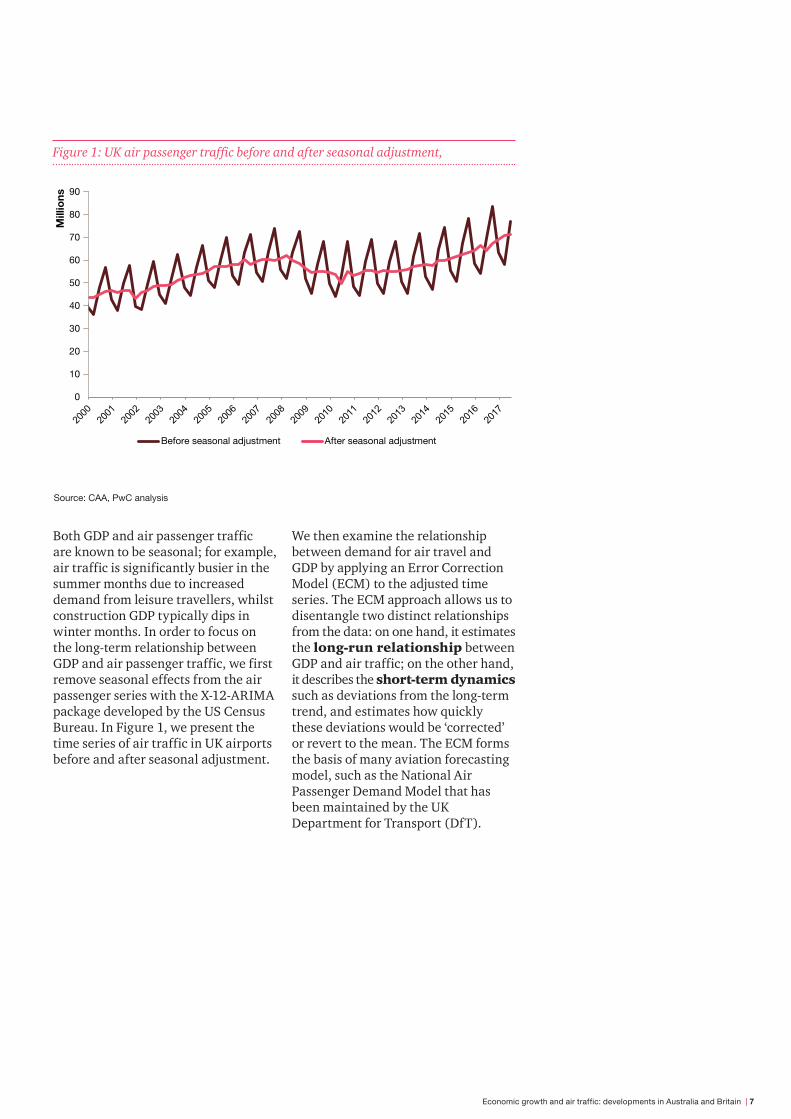
Figure 1: UK air passenger traffic before and after seasonal adjustment,
Both GDP and air passenger traffic are known to be seasonal; for example, air traffic is significantly busier in the summer months due to increased demand from leisure travellers, whilst construction GDP typically dips in winter months. In order to focus on the long-term relationship between GDP and air passenger traffic, we first remove seasonal effects from the air passenger series with the X-12-ARIMA package developed by the US Census Bureau. In Figure 1, we present the time series of air traffic in UK airports before and after seasonal adjustment.
We then examine the relationship between demand for air travel and GDP by applying an Error Correction Model (ECM) to the adjusted time series. The ECM approach allows us to disentangle two distinct relationships from the data: on one hand, it estimates the long-run relationship between GDP and air traffic; on the other hand, it describes the short-term dynamics such as deviations from the long-term trend, and estimates how quickly these deviations would be ‘corrected’ or revert to the mean. The ECM forms the basis of many aviation forecasting model, such as the National Air Passenger Demand Model that has been maintained by the UK Department for Transport (DfT).
0
10
20
30
40
50
60
70
80
90
Mill
ions
Before seasonal adjustment After seasonal adjustment
Source: CAA, PwC analysis
8 | PwC | Connectivity and growth
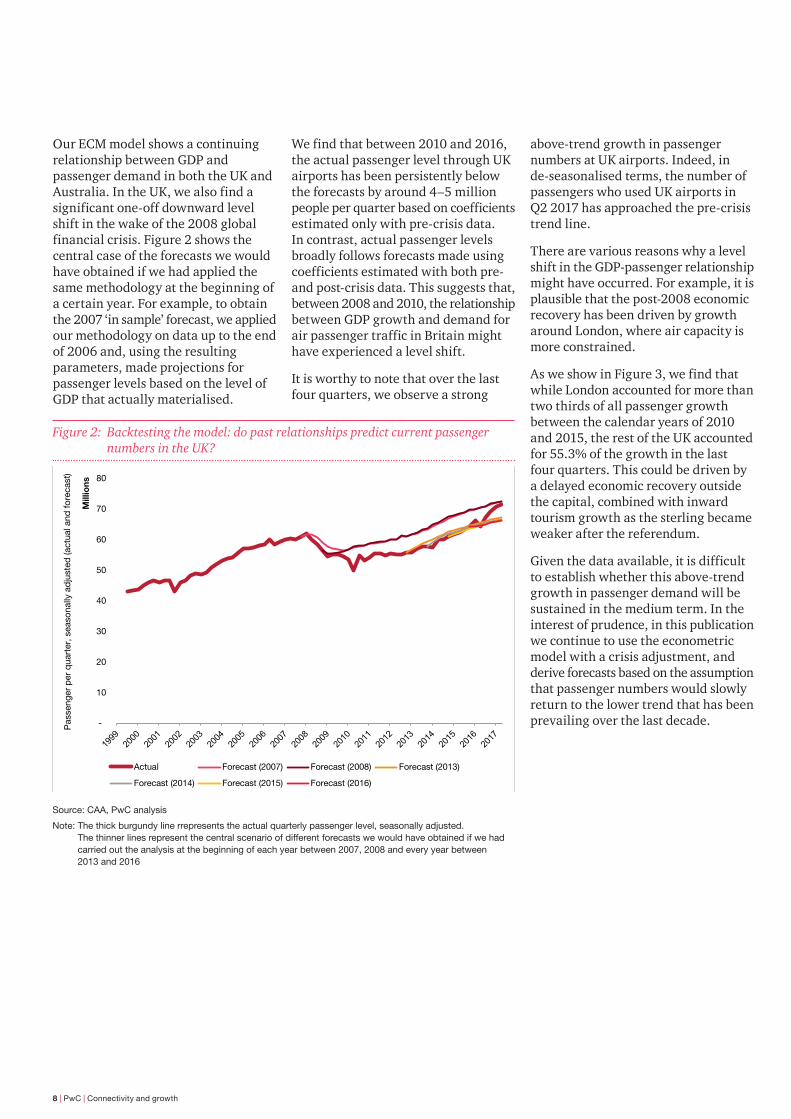
Figure 2: Backtesting the model: do past relationships predict current passenger numbers in the UK?
Source: CAA, PwC analysis
Note: The thick burgundy line rrepresents the actual quarterly passenger level, seasonally adjusted. The thinner lines represent the central scenario of different forecasts we would have obtained if we had carried out the analysis at the beginning of each year between 2007, 2008 and every year between 2013 and 2016
-
10
20
30
40
50
60
70
80
Mill
ions
Actual Forecast (2007) Forecast (2008) Forecast (2013)
Forecast (2014) Forecast (2015) Forecast (2016)
Pas
seng
er p
er q
uart
er, s
easo
nally
ad
just
ed (a
ctua
l and
fore
cast
)
Our ECM model shows a continuing relationship between GDP and passenger demand in both the UK and Australia. In the UK, we also find a significant one-off downward level shift in the wake of the 2008 global financial crisis. Figure 2 shows the central case of the forecasts we would have obtained if we had applied the same methodology at the beginning of a certain year. For example, to obtain the 2007 ‘in sample’ forecast, we applied our methodology on data up to the end of 2006 and, using the resulting parameters, made projections for passenger levels based on the level of GDP that actually materialised.
We find that between 2010 and 2016, the actual passenger level through UK airports has been persistently below the forecasts by around 4–5 million people per quarter based on coefficients estimated only with pre-crisis data. In contrast, actual passenger levels broadly follows forecasts made using coefficients estimated with both pre- and post-crisis data. This suggests that, between 2008 and 2010, the relationship between GDP growth and demand for air passenger traffic in Britain might have experienced a level shift.
It is worthy to note that over the last four quarters, we observe a strong
above-trend growth in passenger numbers at UK airports. Indeed, in de-seasonalised terms, the number of passengers who used UK airports in Q2 2017 has approached the pre-crisis trend line.
There are various reasons why a level shift in the GDP-passenger relationship might have occurred. For example, it is plausible that the post-2008 economic recovery has been driven by growth around London, where air capacity is more constrained.
As we show in Figure 3, we find that while London accounted for more than two thirds of all passenger growth between the calendar years of 2010 and 2015, the rest of the UK accounted for 55.3% of the growth in the last four quarters. This could be driven by a delayed economic recovery outside the capital, combined with inward tourism growth as the sterling became weaker after the referendum.
Given the data available, it is difficult to establish whether this above-trend growth in passenger demand will be sustained in the medium term. In the interest of prudence, in this publication we continue to use the econometric model with a crisis adjustment, and derive forecasts based on the assumption that passenger numbers would slowly return to the lower trend that has been prevailing over the last decade.

Economic growth and air traffic: developments in Australia and Britain | 9
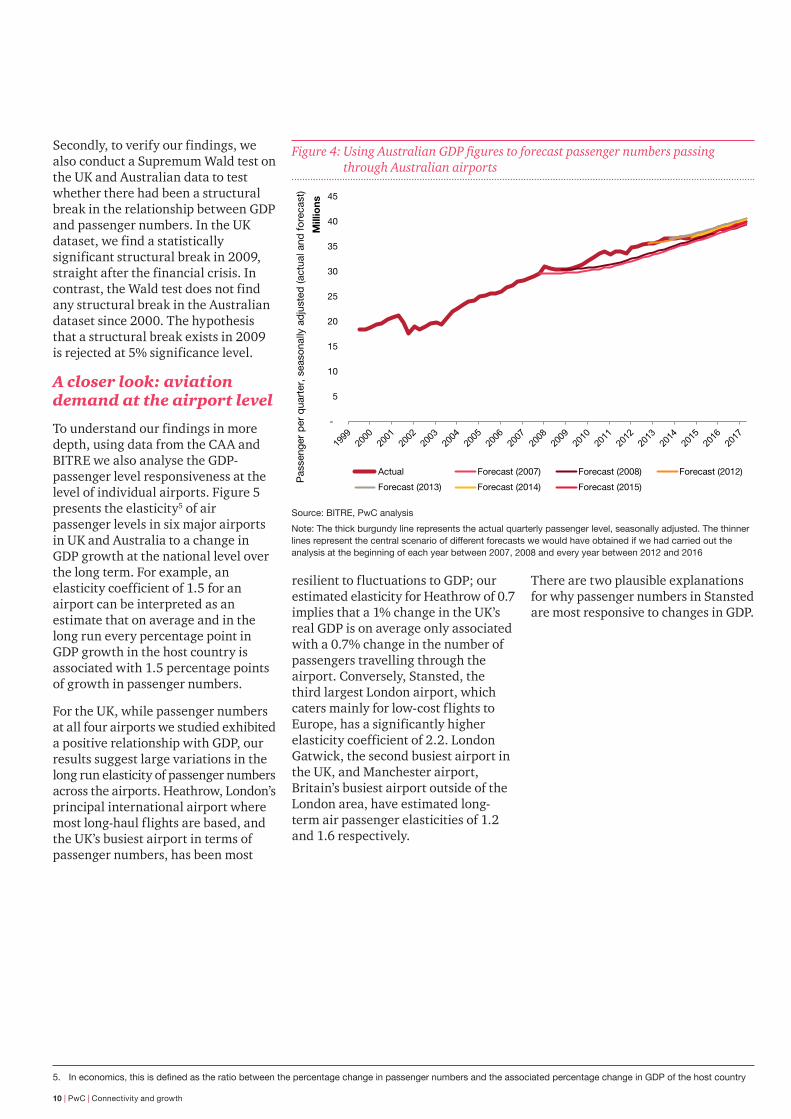
On the contrary, we do not observe a similar structural break in the long-term relationship between GDP and passenger numbers in Australia throughout the 2007–2017 period. As shown in Figure 3, we find the financial crisis to have had relatively little effect on the degree of association between Australian GDP and the number of passengers going through Australian airports. Our Australian forecasts lie only slightly below the actual passenger numbers between 2008 and 2017, and they share the
same growth trend without any statistically significant break in the wake of the financial crisis.
This highlights some interesting differences between the UK and Australian aviation markets.
Firstly, the 2008 financial crisis had a smaller impact on the Australian economy, which relies less on financial services (which was heavily affected) and more on commodities and mining (which were less affected). This is
reflected in the fact that Australia never fell into a recession throughout the period. Australia has also benefited from a fast recovery in its trading partners, especially China, and the fiscal and monetary response of Australian institutions. Finally, Australian airports have not faced similar restrictions to growth as have the UK’s largest airports, and it is plausible that this has allowed the strong relationship between the two variables to continue.
Source: CAA, PwC analysis
Figure 3: Drivers of passenger volume growth in the UK
22.4%
9.1%
21.9%
17.1%
9.7%
7.1%
14.7%
11.5%
13.2%
14.2%
18.1%
41.1%
0% 10% 20% 30% 40% 50% 60% 70% 80% 90% 100%
2010 to 2015
YE Jun 2016 to YE Jun 2017
Heathrow Gatwick Stansted Other London Airports Manchester Other non-London airports
London: 68.6%
London: 44.7%
Rest of UK: 31.4%
Rest of UK: 55.3%
10 | PwC | Connectivity and growth
Secondly, to verify our findings, we also conduct a Supremum Wald test on the UK and Australian data to test whether there had been a structural break in the relationship between GDP and passenger numbers. In the UK dataset, we find a statistically significant structural break in 2009, straight after the financial crisis. In contrast, the Wald test does not find any structural break in the Australian dataset since 2000. The hypothesis that a structural break exists in 2009 is rejected at 5% significance level.
A closer look: aviation demand at the airport level
To understand our findings in more depth, using data from the CAA and BITRE we also analyse the GDP-passenger level responsiveness at the level of individual airports. Figure 5 presents the elasticity5 of air passenger levels in six major airports in UK and Australia to a change in GDP growth at the national level over the long term. For example, an elasticity coefficient of 1.5 for an airport can be interpreted as an estimate that on average and in the long run every percentage point in GDP growth in the host country is associated with 1.5 percentage points of growth in passenger numbers.
For the UK, while passenger numbers at all four airports we studied exhibited a positive relationship with GDP, our results suggest large variations in the long run elasticity of passenger numbers across the airports. Heathrow, London’s principal international airport where most long-haul flights are based, and the UK’s busiest airport in terms of passenger numbers, has been most
5. Ineconomics,thisisdefinedastheratiobetweenthepercentagechangeinpassengernumbersandtheassociatedpercentagechangeinGDPofthehostcountry
resilient to fluctuations to GDP; our estimated elasticity for Heathrow of 0.7 implies that a 1% change in the UK’s real GDP is on average only associated with a 0.7% change in the number of passengers travelling through the airport. Conversely, Stansted, the third largest London airport, which caters mainly for low-cost flights to Europe, has a significantly higher elasticity coefficient of 2.2. London Gatwick, the second busiest airport in the UK, and Manchester airport, Britain’s busiest airport outside of the London area, have estimated long-term air passenger elasticities of 1.2 and 1.6 respectively.
There are two plausible explanations for why passenger numbers in Stansted are most responsive to changes in GDP.
Source: BITRE, PwC analysis
Note: The thick burgundy line represents the actual quarterly passenger level, seasonally adjusted. The thinner lines represent the central scenario of different forecasts we would have obtained if we had carried out the analysis at the beginning of each year between 2007, 2008 and every year between 2012 and 2016
Figure 4: Using Australian GDP figures to forecast passenger numbers passing through Australian airports
-
5
10
15
20
25
30
35
40
45
Mill
ions
Actual Forecast (2007) Forecast (2008) Forecast (2012)
Forecast (2013) Forecast (2014) Forecast (2015)
Pas
seng
er p
er q
uart
er, s
easo
nally
ad
just
ed (a
ctua
l and
for
ecas
t)

Economic growth and air traffic: developments in Australia and Britain | 11
Firstly, Stansted is dominated by low-cost carriers such as Ryanair and easyJet. These airlines have a higher proportion of leisure passengers, who are more sensitive to fluctuations in the business cycle.
Secondly, the effect of an economic downturn may differ across airports as the airline industry may choose to absorb the decrease in demand by cutting capacity in a less preferred airport; for example, the full-service carriers may scale back their Gatwick operations, which started as Heathrow overspill. The available capacity at Gatwick could then be filled by budget airlines as they move some operations from Stansted into the more preferred Gatwick. As a result, it is perhaps not surprising that Stansted benefits most from the additional passenger flow
that a stronger economy brings, and is also the most negatively affected by an economic downturn.
The case of Manchester airport also helps puts this into context. Manchester is the busiest British airport outside of the London area, and has a more balanced mix between long-haul and European flights as well as between business and leisure customers. While the London airports are substitutes for each other, Manchester is a catch-all airport that serves the North of England with few close alternatives. It is not surprising that Manchester has an elasticity coefficient that lies between the three London airports, despite its passenger levels being comparable to that of Stansted in the last decade.
Looking next at the two largest airports in Australia, Melbourne and Sydney, our analysis suggests less variation in the elasticity of passenger numbers to changes in GDP compared to that observed in the UK. With estimated long-run elasticities of 1.7 and 1.6 in Melbourne and Sydney respectively, we find that passenger demand at Sydney and Melbourne airports is significantly more responsive to real GDP than Heathrow and Gatwick, and about as responsive as passenger numbers in Manchester. These findings might be attributed to two factors.
Firstly, Sydney and Melbourne airports are not close substitutes for each other; they are around nine hours apart in terms of car journey times, and their catchment areas rarely overlap. As a consequence, the order-of-preference effect that may have been in play in the London area is unlikely to be significant between Sydney and Melbourne, and it is therefore not surprising to find that their elasticities are similar to that of Manchester Airport in the UK.
Secondly, the two Australian airports do not face the same capacity constraints that have been rife for London airports, particularly Heathrow and Gatwick: new flights are more likely to be scheduled in response to economic growth in Sydney and Melbourne than in Heathrow and Gatwick. This also supports the finding that GDP has been a better predictor of passenger numbers in Australia than it has been in the UK, while other factors, such as capacity constraints, are less influential.
Source: PwC analysis
Note:Wepresentourpointestimateinsoliddots,withthe95%marginoferror(confidenceinterval)inapalershade around it.
Figure 5: Estimated relationship between growth rates of passenger numbers and GDP
0.0
0.5
1.0
1.5
2.0
2.5
3.0
London Heathrow London Gatwick London Stansted Manchester Melbourne Sydney
Long
term
ela
stic
ity c
oeffi
cien
ts
12 | PwC | Connectivity and growth
Brexit in the Air
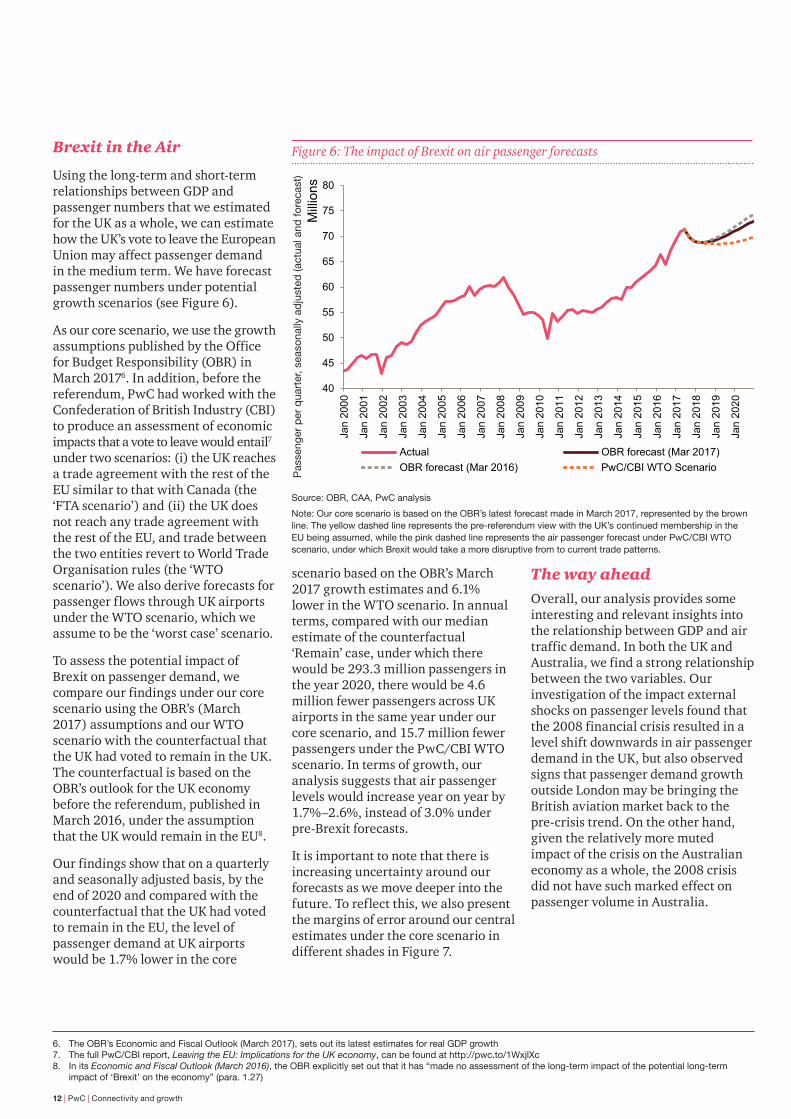
Using the long-term and short-term relationships between GDP and passenger numbers that we estimated for the UK as a whole, we can estimate how the UK’s vote to leave the European Union may affect passenger demand in the medium term. We have forecast passenger numbers under potential growth scenarios (see Figure 6).
As our core scenario, we use the growth assumptions published by the Office for Budget Responsibility (OBR) in March 20176. In addition, before the referendum, PwC had worked with the Confederation of British Industry (CBI) to produce an assessment of economic impacts that a vote to leave would entail7 under two scenarios: (i) the UK reaches a trade agreement with the rest of the EU similar to that with Canada (the ‘FTA scenario’) and (ii) the UK does not reach any trade agreement with the rest of the EU, and trade between the two entities revert to World Trade Organisation rules (the ‘WTO scenario’). We also derive forecasts for passenger flows through UK airports under the WTO scenario, which we assume to be the ‘worst case’ scenario.
To assess the potential impact of Brexit on passenger demand, we compare our findings under our core scenario using the OBR’s (March 2017) assumptions and our WTO scenario with the counterfactual that the UK had voted to remain in the UK. The counterfactual is based on the OBR’s outlook for the UK economy before the referendum, published in March 2016, under the assumption that the UK would remain in the EU8.
Our findings show that on a quarterly and seasonally adjusted basis, by the end of 2020 and compared with the counterfactual that the UK had voted to remain in the EU, the level of passenger demand at UK airports would be 1.7% lower in the core
6. The OBR’s Economic and Fiscal Outlook (March 2017), sets out its latest estimates for real GDP growth7. The full PwC/CBI report, Leaving the EU: Implications for the UK economy, can be found at http://pwc.to/1WxjlXc8. In its Economic and Fiscal Outlook (March 2016), the OBR explicitly set out that it has “made no assessment of the long-term impact of the potential long-term
impact of ‘Brexit’ on the economy” (para. 1.27)
scenario based on the OBR’s March 2017 growth estimates and 6.1% lower in the WTO scenario. In annual terms, compared with our median estimate of the counterfactual ‘Remain’ case, under which there would be 293.3 million passengers in the year 2020, there would be 4.6 million fewer passengers across UK airports in the same year under our core scenario, and 15.7 million fewer passengers under the PwC/CBI WTO scenario. In terms of growth, our analysis suggests that air passenger levels would increase year on year by 1.7%–2.6%, instead of 3.0% under pre-Brexit forecasts.
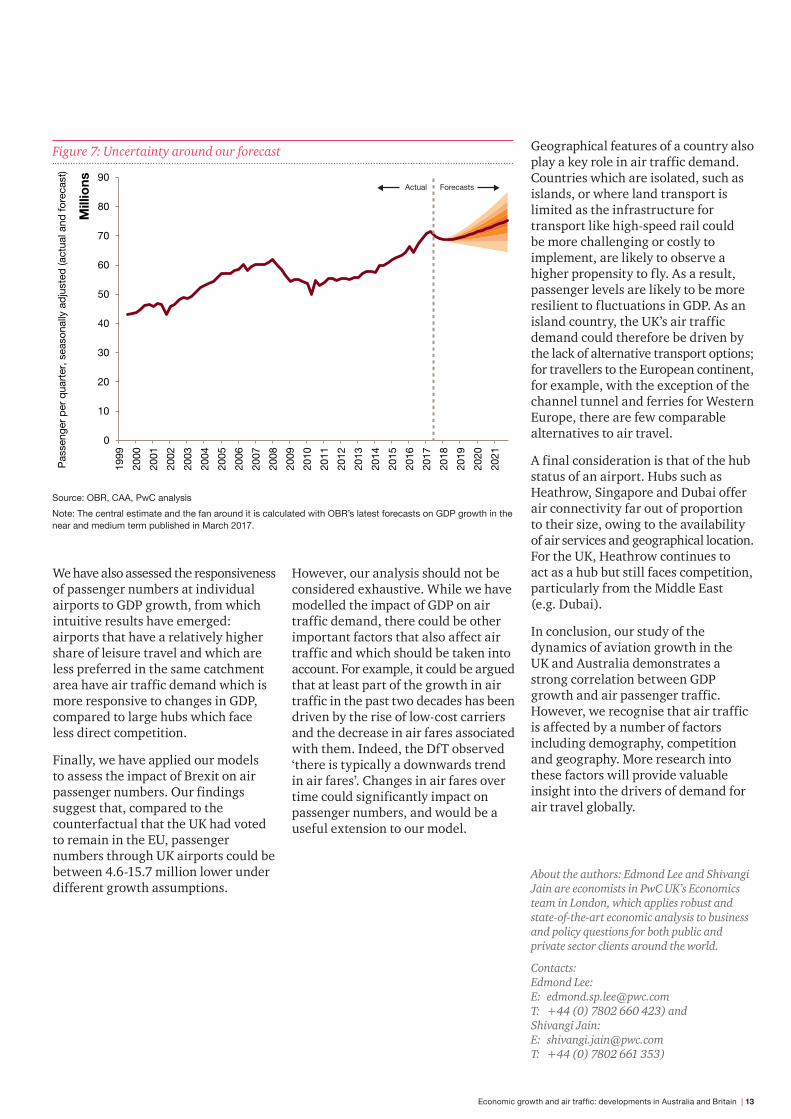
It is important to note that there is increasing uncertainty around our forecasts as we move deeper into the future. To reflect this, we also present the margins of error around our central estimates under the core scenario in different shades in Figure 7.
The way aheadOverall, our analysis provides some interesting and relevant insights into the relationship between GDP and air traffic demand. In both the UK and Australia, we find a strong relationship between the two variables. Our investigation of the impact external shocks on passenger levels found that the 2008 financial crisis resulted in a level shift downwards in air passenger demand in the UK, but also observed signs that passenger demand growth outside London may be bringing the British aviation market back to the pre-crisis trend. On the other hand, given the relatively more muted impact of the crisis on the Australian economy as a whole, the 2008 crisis did not have such marked effect on passenger volume in Australia.
40
45
50
55
60
65
70
75
80
Jan
2000
Jan
2001
Jan
2002
Jan
2003
Jan
2004
Jan
2005
Jan
2006
Jan
2007
Jan
2008
Jan
2009
Jan
2010
Jan
2011
Jan
2012
Jan
2013
Jan
2014
Jan
2015
Jan
2016
Jan
2017
Jan
2018
Jan
2019
Jan
2020
Milli
ons
Actual OBR forecast (Mar 2017)OBR forecast (Mar 2016) PwC/CBI WTO Scenario
Pas
seng
er p
er q
uart
er, s
easo
nally
ad
just
ed (a
ctua
l and
fore
cast
)
Figure 6: The impact of Brexit on air passenger forecasts
Source: OBR, CAA, PwC analysis
Note: Our core scenario is based on the OBR’s latest forecast made in March 2017, represented by the brown line. The yellow dashed line represents the pre-referendum view with the UK’s continued membership in the EU being assumed, while the pink dashed line represents the air passenger forecast under PwC/CBI WTO scenario, under which Brexit would take a more disruptive from to current trade patterns.
Economic growth and air traffic: developments in Australia and Britain | 13
We have also assessed the responsiveness of passenger numbers at individual airports to GDP growth, from which intuitive results have emerged: airports that have a relatively higher share of leisure travel and which are less preferred in the same catchment area have air traffic demand which is more responsive to changes in GDP, compared to large hubs which face less direct competition.
Finally, we have applied our models to assess the impact of Brexit on air passenger numbers. Our findings suggest that, compared to the counterfactual that the UK had voted to remain in the EU, passenger numbers through UK airports could be between 4.6-15.7 million lower under different growth assumptions.
However, our analysis should not be considered exhaustive. While we have modelled the impact of GDP on air traffic demand, there could be other important factors that also affect air traffic and which should be taken into account. For example, it could be argued that at least part of the growth in air traffic in the past two decades has been driven by the rise of low-cost carriers and the decrease in air fares associated with them. Indeed, the DfT observed ‘there is typically a downwards trend in air fares’. Changes in air fares over time could significantly impact on passenger numbers, and would be a useful extension to our model.
Geographical features of a country also play a key role in air traffic demand. Countries which are isolated, such as islands, or where land transport is limited as the infrastructure for transport like high-speed rail could be more challenging or costly to implement, are likely to observe a higher propensity to fly. As a result, passenger levels are likely to be more resilient to fluctuations in GDP. As an island country, the UK’s air traffic demand could therefore be driven by the lack of alternative transport options; for travellers to the European continent, for example, with the exception of the channel tunnel and ferries for Western Europe, there are few comparable alternatives to air travel.
A final consideration is that of the hub status of an airport. Hubs such as Heathrow, Singapore and Dubai offer air connectivity far out of proportion to their size, owing to the availability of air services and geographical location. For the UK, Heathrow continues to act as a hub but still faces competition, particularly from the Middle East (e.g. Dubai).
In conclusion, our study of the dynamics of aviation growth in the UK and Australia demonstrates a strong correlation between GDP growth and air passenger traffic. However, we recognise that air traffic is affected by a number of factors including demography, competition and geography. More research into these factors will provide valuable insight into the drivers of demand for air travel globally.
About the authors: Edmond Lee and Shivangi Jain are economists in PwC UK’s Economics team in London, which applies robust and state-of-the-art economic analysis to business and policy questions for both public and private sector clients around the world.
Contacts: Edmond Lee: E: [email protected] T: +44 (0) 7802 660 423) and Shivangi Jain: E: [email protected] T: +44 (0) 7802 661 353)
0
10
20
30
40
50
60
70
80
90
1999
2000
2001
2002
2003
2004
2005
2006
2007
2008
2009
2010
2011
2012
2013
2014
2015
2016
2017
2018
2019
2020
2021
Mill
ions
Pas
seng
er p
er q
uart
er, s
easo
nally
ad
just
ed (a
ctua
l and
fore
cast
)
Actual Forecasts
Figure 7: Uncertainty around our forecast
Source: OBR, CAA, PwC analysis
Note: The central estimate and the fan around it is calculated with OBR’s latest forecasts on GDP growth in the near and medium term published in March 2017.
14 | PwC | Connectivity and growth
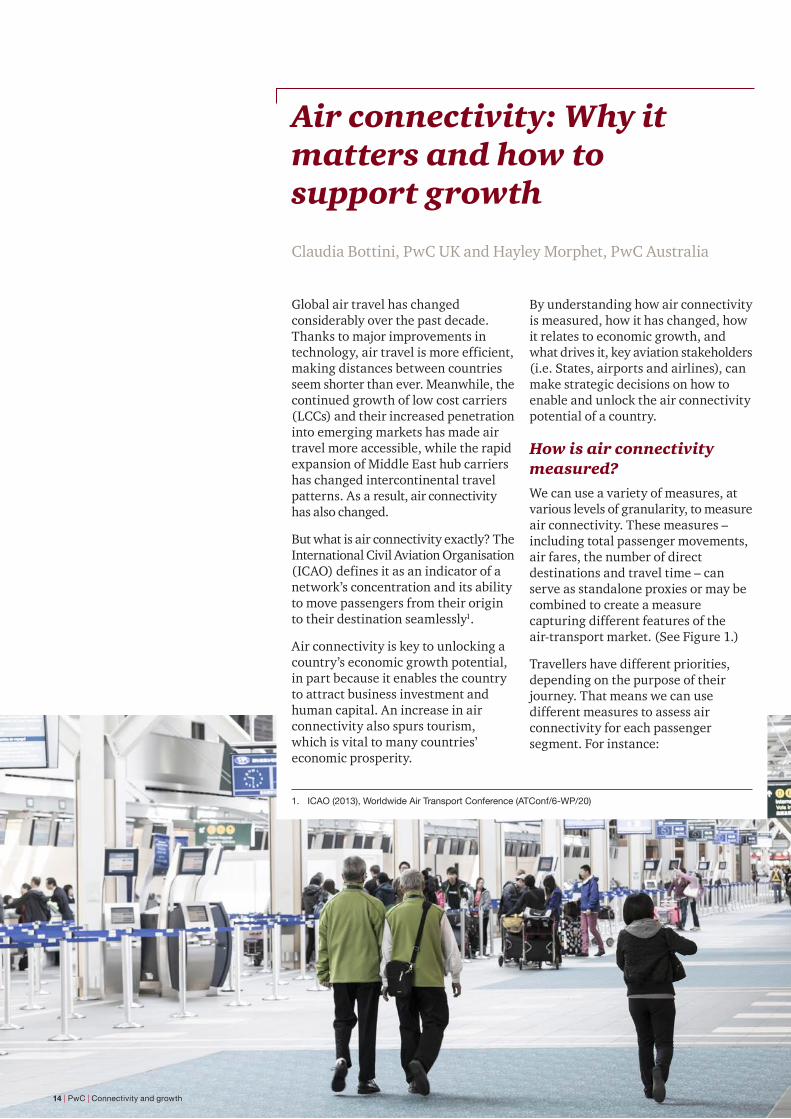
Air connectivity: Why it matters and how to support growth
Global air travel has changed considerably over the past decade. Thanks to major improvements in technology, air travel is more efficient, making distances between countries seem shorter than ever. Meanwhile, the continued growth of low cost carriers (LCCs) and their increased penetration into emerging markets has made air travel more accessible, while the rapid expansion of Middle East hub carriers has changed intercontinental travel patterns. As a result, air connectivity has also changed.
But what is air connectivity exactly? The International Civil Aviation Organisation (ICAO) defines it as an indicator of a network’s concentration and its ability to move passengers from their origin to their destination seamlessly1.
Air connectivity is key to unlocking a country’s economic growth potential, in part because it enables the country to attract business investment and human capital. An increase in air connectivity also spurs tourism, which is vital to many countries’ economic prosperity.
1. ICAO (2013), Worldwide Air Transport Conference (ATConf/6-WP/20)
By understanding how air connectivity is measured, how it has changed, how it relates to economic growth, and what drives it, key aviation stakeholders (i.e. States, airports and airlines), can make strategic decisions on how to enable and unlock the air connectivity potential of a country.
How is air connectivity measured?We can use a variety of measures, at various levels of granularity, to measure air connectivity. These measures – including total passenger movements, air fares, the number of direct destinations and travel time – can serve as standalone proxies or may be combined to create a measure capturing different features of the air-transport market. (See Figure 1.)
Travellers have different priorities, depending on the purpose of their journey. That means we can use different measures to assess air connectivity for each passenger segment. For instance:
Claudia Bottini, PwC UK and Hayley Morphet, PwC Australia

Air connectivity: Why it matters and how to support growth | 15
Figure 1: Air connectivity measures
• Direct seat capacity
• Availability of direct flights
• Direct destinations
• Average daily frequency/route
• Convenience of schedule
• Distance to city centre
• Access to flexible fares
• Travel time
• Passenger movements
• Average seats per movement
• Indirect one-stop destinations
• Country GDP/GDP per capita
• Route network concentration
• Airline concentration
• Route stability
• Access to sales channels
• Air fares
• Availability of seats
• Choice of destination
Business Leisure
• Business travellers tend to be time sensitive and relatively indifferent to fare levels. Frequent and flexible service that enables passengers to quickly change flights to a more convenient time, coupled with easy surface accessibility, matter most to this segment. Thus air connectivity for them could be measured by frequency of service, convenience of schedule, travel time, number of direct routes available and proximity to the city centre.
• Leisure travellers care more about fares, with cost-effectiveness often the most important factor in decisions about whether to travel and where, especially for short breaks. An unacceptably high fare could cause them to change their mind about their destination. Measurements of air connectivity for this segment should therefore include fares.
How has air connectivity changed? Over the past decade, the aviation industry has experienced the effects of various shocks (such as terrorist attacks, natural disasters and pandemics), a weak economy and rising fuel prices. The industry has shown its resilience by adapting itself to satisfy the needs of an ever-evolving market.
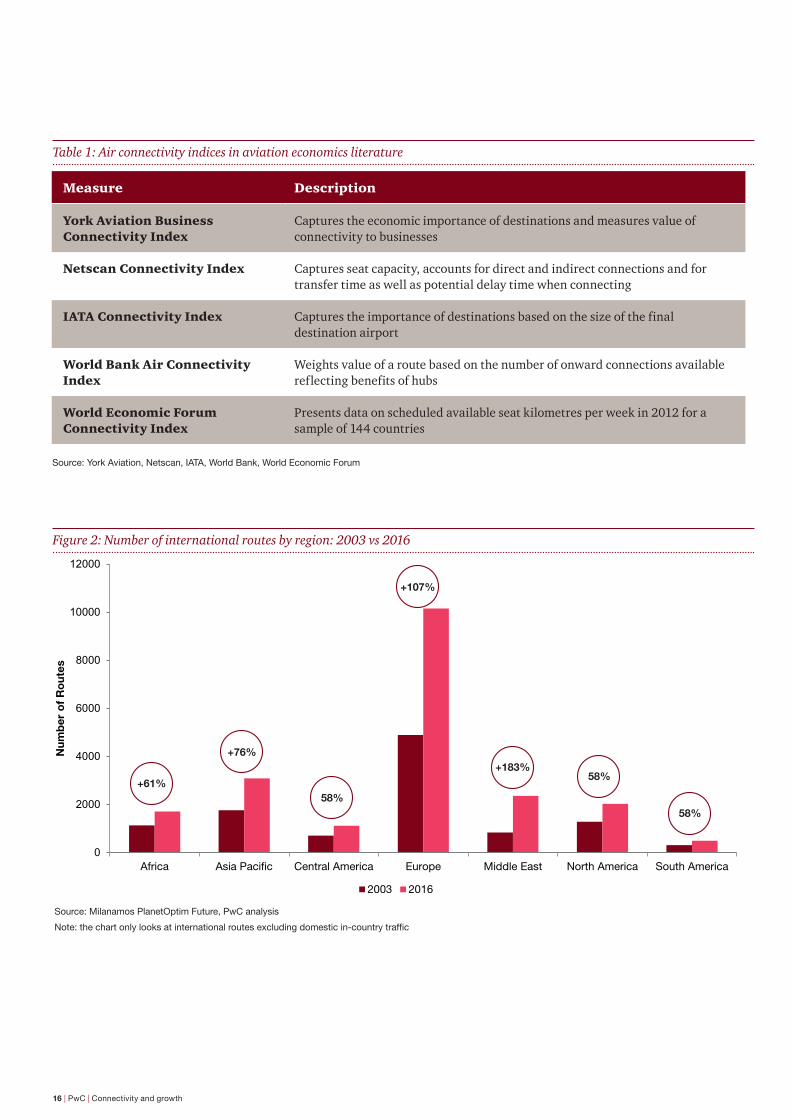
If we consider the number of direct international routes as a proxy to measure connectivity at a regional level, we can see that a significant increase was observed in the Middle East and Asia, with Europe’s routes increasing by 107% since 2003 as a result of the increased penetration of low-cost carriers and the subsequent increase in point-to-point services. (See Figure 2.)
• Travellers visiting friends and relatives fly primarily to see loved ones. In some markets, this category of travel is substantial. Passengers travelling for this purpose tend to consider fares a major factor in determining how frequently they travel. However, unlike leisure passengers, they don’t have the option of changing their travel destinations if fares are too high.
The importance of air connectivity has led to the development of a number of indices in aviation economics literature (See Table 1.) Each measure aims to capture a range of factors influencing connectivity. At the same time, aviation stakeholders looking to understand the integration of country (or city) within the global air network can tailor their choice of air connectivity indices to suit their needs by identifying the criteria most important to the country (or city) they’re interested in and by developing an integrated index which takes multiple variables into account.
Source: PwC analysis
Note: VFR is a subset of leisure travel. However, this segment differs from leisure in that passengers don’t have a choice of destinations and appear to be less sensitive to price. (Price, however, may determine how frequently they travel).
16 | PwC | Connectivity and growth
Figure 2: Number of international routes by region: 2003 vs 2016
Source: Milanamos PlanetOptim Future, PwC analysis
Note:thechartonlylooksatinternationalroutesexcludingdomesticin-countrytraffic
0
2000
4000
6000
8000
10000
12000
Africa Asia Pacific Central America Europe Middle East North America South America
Num
ber
of
Ro
utes
2003 2016
+107%
+183%
+61%
+76%
58%
58%
58%
Measure Description
York Aviation Business Connectivity Index
Captures the economic importance of destinations and measures value of connectivity to businesses
Netscan Connectivity Index Captures seat capacity, accounts for direct and indirect connections and for transfer time as well as potential delay time when connecting
IATA Connectivity Index Captures the importance of destinations based on the size of the final destination airport
World Bank Air Connectivity Index
Weights value of a route based on the number of onward connections available reflecting benefits of hubs
World Economic Forum Connectivity Index
Presents data on scheduled available seat kilometres per week in 2012 for a sample of 144 countries
Table 1: Air connectivity indices in aviation economics literature
Source: York Aviation, Netscan, IATA, World Bank, World Economic Forum
Air connectivity: Why it matters and how to support growth | 17
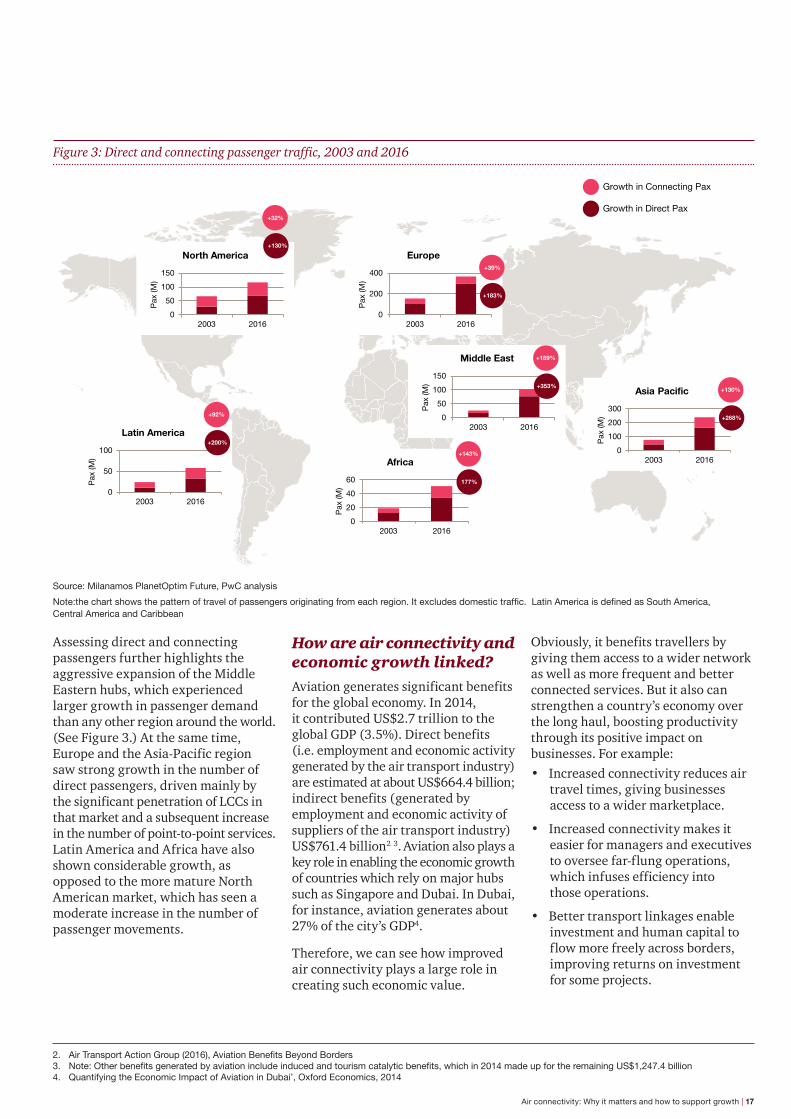
Assessing direct and connecting passengers further highlights the aggressive expansion of the Middle Eastern hubs, which experienced larger growth in passenger demand than any other region around the world. (See Figure 3.) At the same time, Europe and the Asia-Pacific region saw strong growth in the number of direct passengers, driven mainly by the significant penetration of LCCs in that market and a subsequent increase in the number of point-to-point services. Latin America and Africa have also shown considerable growth, as opposed to the more mature North American market, which has seen a moderate increase in the number of passenger movements.
2. AirTransportActionGroup(2016),AviationBenefitsBeyondBorders3. Note:Otherbenefitsgeneratedbyaviationincludeinducedandtourismcatalyticbenefits,whichin2014madeupfortheremainingUS$1,247.4billion4. Quantifying the Economic Impact of Aviation in Dubai’, Oxford Economics, 2014
How are air connectivity and economic growth linked?Aviation generates significant benefits for the global economy. In 2014, it contributed US$2.7 trillion to the global GDP (3.5%). Direct benefits (i.e. employment and economic activity generated by the air transport industry) are estimated at about US$664.4 billion; indirect benefits (generated by employment and economic activity of suppliers of the air transport industry) US$761.4 billion2 3. Aviation also plays a key role in enabling the economic growth of countries which rely on major hubs such as Singapore and Dubai. In Dubai, for instance, aviation generates about 27% of the city’s GDP4.
Therefore, we can see how improved air connectivity plays a large role in creating such economic value.
Obviously, it benefits travellers by giving them access to a wider network as well as more frequent and better connected services. But it also can strengthen a country’s economy over the long haul, boosting productivity through its positive impact on businesses. For example:• Increased connectivity reduces air
travel times, giving businesses access to a wider marketplace.
• Increased connectivity makes it easier for managers and executives to oversee far-flung operations, which infuses efficiency into those operations.
• Better transport linkages enable investment and human capital to flow more freely across borders, improving returns on investment for some projects.
0
50
100
150
2003 2016
Pax
(M)
North America
0
50
100
2003 2016
Pax
(M)
Latin America
0
200
400
2003 2016
Pax
(M)
Europe
0
20
40
60
2003 2016
Pax
(M)
Africa
0
50
100
150
2003 2016P
ax (M
)
Middle East
0
100
200
300
2003 2016
Pax
(M)
Asia Pacific
177%
+143%
+268%
+130%
Growth in Connecting Pax
Growth in Direct Pax
+183%
+39%
+130%
+32%
+353%
+189%
+200%
+92%
Source: Milanamos PlanetOptim Future, PwC analysis
Note:thechartshowsthepatternoftravelofpassengersoriginatingfromeachregion.Itexcludesdomestictraffic.LatinAmericaisdefinedasSouthAmerica,Central America and Caribbean
Figure 3: Direct and connecting passenger traffic, 2003 and 2016
18 | PwC | Connectivity and growth
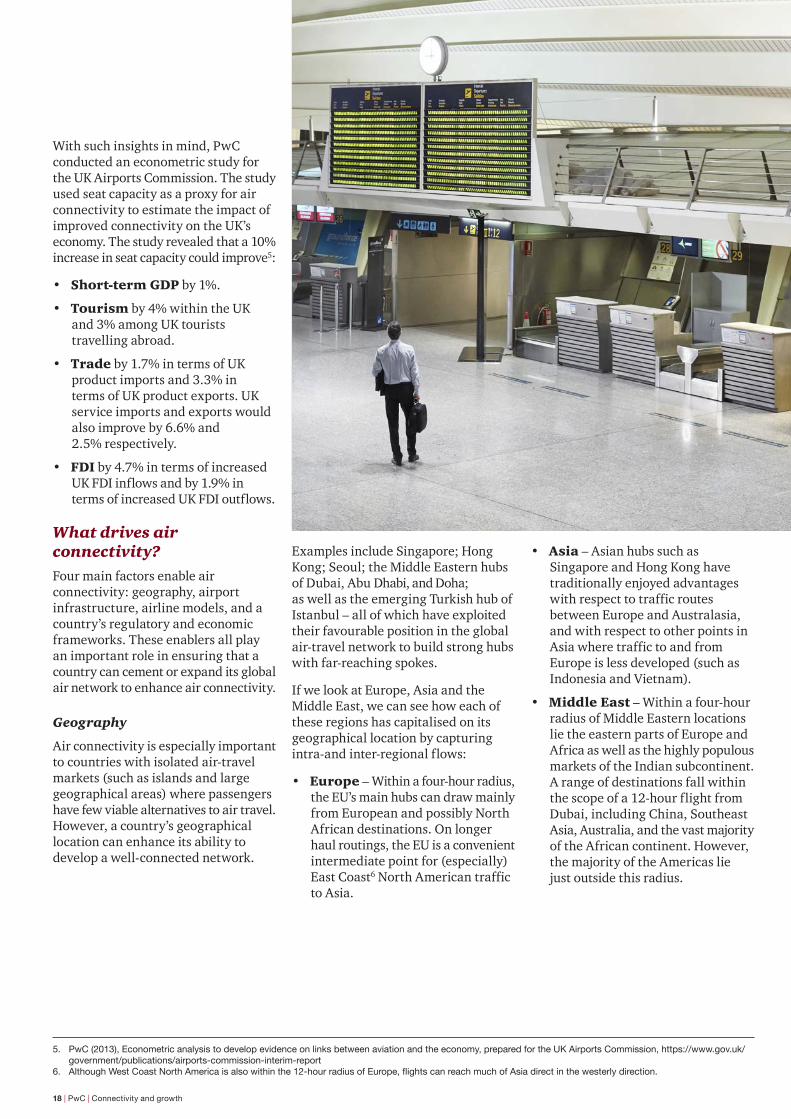
With such insights in mind, PwC conducted an econometric study for the UK Airports Commission. The study used seat capacity as a proxy for air connectivity to estimate the impact of improved connectivity on the UK’s economy. The study revealed that a 10% increase in seat capacity could improve5:
• Short-term GDP by 1%.
• Tourism by 4% within the UK and 3% among UK tourists travelling abroad.
• Trade by 1.7% in terms of UK product imports and 3.3% in terms of UK product exports. UK service imports and exports would also improve by 6.6% and 2.5% respectively.
• FDI by 4.7% in terms of increased UK FDI inflows and by 1.9% in terms of increased UK FDI outflows.
What drives air connectivity?Four main factors enable air connectivity: geography, airport infrastructure, airline models, and a country’s regulatory and economic frameworks. These enablers all play an important role in ensuring that a country can cement or expand its global air network to enhance air connectivity.
Geography
Air connectivity is especially important to countries with isolated air-travel markets (such as islands and large geographical areas) where passengers have few viable alternatives to air travel. However, a country’s geographical location can enhance its ability to develop a well-connected network.
5. PwC(2013),Econometricanalysistodevelopevidenceonlinksbetweenaviationandtheeconomy,preparedfor theUKAirportsCommission,https://www.gov.uk/government/publications/airports-commission-interim-report
6. AlthoughWestCoastNorthAmericaisalsowithinthe12-hourradiusofEurope,flightscanreachmuchofAsiadirectinthewesterlydirection.
Examples include Singapore; Hong Kong; Seoul; the Middle Eastern hubs of Dubai, Abu Dhabi, and Doha; as well as the emerging Turkish hub of Istanbul – all of which have exploited their favourable position in the global air-travel network to build strong hubs with far-reaching spokes.
If we look at Europe, Asia and the Middle East, we can see how each of these regions has capitalised on its geographical location by capturing intra-and inter-regional flows:
• Europe – Within a four-hour radius, the EU’s main hubs can draw mainly from European and possibly North African destinations. On longer haul routings, the EU is a convenient intermediate point for (especially) East Coast6 North American traffic to Asia.
• Asia – Asian hubs such as Singapore and Hong Kong have traditionally enjoyed advantages with respect to traffic routes between Europe and Australasia, and with respect to other points in Asia where traffic to and from Europe is less developed (such as Indonesia and Vietnam).
• Middle East – Within a four-hour radius of Middle Eastern locations lie the eastern parts of Europe and Africa as well as the highly populous markets of the Indian subcontinent. A range of destinations fall within the scope of a 12-hour flight from Dubai, including China, Southeast Asia, Australia, and the vast majority of the African continent. However, the majority of the Americas lie just outside this radius.
Air connectivity: Why it matters and how to support growth | 19
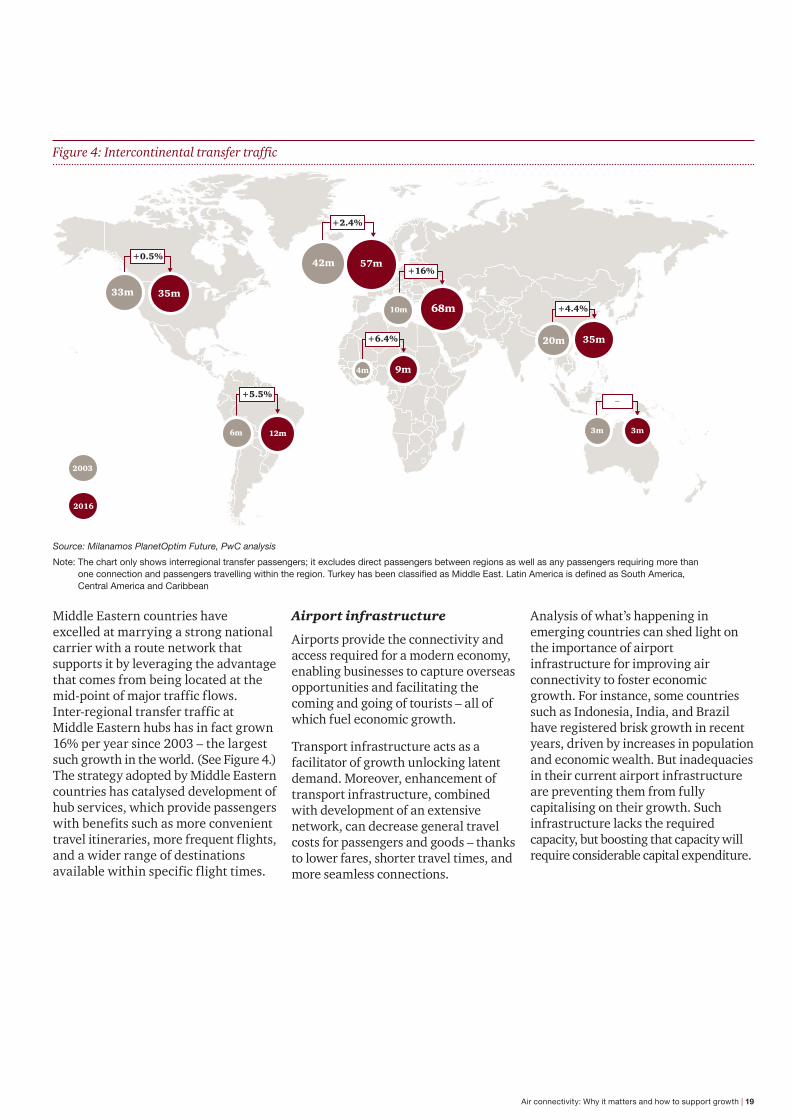
Middle Eastern countries have excelled at marrying a strong national carrier with a route network that supports it by leveraging the advantage that comes from being located at the mid-point of major traffic flows. Inter-regional transfer traffic at Middle Eastern hubs has in fact grown 16% per year since 2003 – the largest such growth in the world. (See Figure 4.) The strategy adopted by Middle Eastern countries has catalysed development of hub services, which provide passengers with benefits such as more convenient travel itineraries, more frequent flights, and a wider range of destinations available within specific flight times.
Airport infrastructure
Airports provide the connectivity and access required for a modern economy, enabling businesses to capture overseas opportunities and facilitating the coming and going of tourists – all of which fuel economic growth.
Transport infrastructure acts as a facilitator of growth unlocking latent demand. Moreover, enhancement of transport infrastructure, combined with development of an extensive network, can decrease general travel costs for passengers and goods – thanks to lower fares, shorter travel times, and more seamless connections.
Figure 4: Intercontinental transfer traffic
9m
3m
35m
57m
35m
68m33m
42m
11.7m
20m
3m
+0.5%
+5.5%
+2.4%
+6.4%
+4.4%
+16%
–
2003
2016
12m6m
4m
10m
Source: Milanamos PlanetOptim Future, PwC analysis
Note: The chart only shows interregional transfer passengers; it excludes direct passengers between regions as well as any passengers requiring more than oneconnectionandpassengerstravellingwithintheregion.TurkeyhasbeenclassifiedasMiddleEast.LatinAmericaisdefinedasSouthAmerica,Central America and Caribbean
Analysis of what’s happening in emerging countries can shed light on the importance of airport infrastructure for improving air connectivity to foster economic growth. For instance, some countries such as Indonesia, India, and Brazil have registered brisk growth in recent years, driven by increases in population and economic wealth. But inadequacies in their current airport infrastructure are preventing them from fully capitalising on their growth. Such infrastructure lacks the required capacity, but boosting that capacity will require considerable capital expenditure.

20 | PwC | Connectivity and growth
of low fares has opened the market to a wider group of consumers and has enhanced connectivity by establishing services to and from secondary airports.
Network carriers mainly operate radial networks centred on their main base or hubs. Their networks provide a wide range of destinations and frequent and flexible services that meet the needs of both business and leisure travellers. A hub-and-spoke model consolidates traffic through a hub and allows for lower-density routes to become viable that may not have been viable as a point-to-point service. This helps to provide a country (or city) with important links and increased frequency of services to the global air travel network.
Point to point(secondary airports)
Short- tomedium-haul intl
Homogenousfleet
Lowerfrequency
1 passengerclass
One-way tari
Hub and spokenetwork
Domestic,short-to long-
haul intl
Multi-fleet
High frequency
2-4 passengerclasses
Multiple
LCC
Hybrid
Network carrier
Structure ofnetwork
Fleet
Geographicalnetwork coverage
Schedules
Cabin class
Fares
Alliances andloyalty programmes
No alliances
Sales and distribution
Online sales
Alliance/loyaltyprogrammes
Agents/GDS,online sales
Figure 5: Three airline business models
Airline business models
Airlines’ business models can directly affect air connectivity. Indeed, over the past decade, carriers have adopted new models to survive in the face of often unfavourable market conditions. Such models fall into three broad categories: low-cost carrier, network carrier, and hybrid. (See Figure 5.)
In the past, LCCs have targeted mainly the leisure passenger segment. The low-cost model has traditionally provided a ‘no-frills’ service that can create demand by offering very low fares and by serving destinations that were previously not served or only connected via a hub. The availability
With the most recent global financial crisis, many business travellers have gravitated toward LCCs for short-haul travel. To capture this new market, some airlines are transitioning to a hybrid model, providing reasonable fares combined with the flexible and frequent service business travellers want.
Countries that can rely on strong network carriers that use their hubs efficiently are more likely to achieve greater air connectivity than countries served only by LCCs. However, this likelihood also depends on what type of air connectivity is central to a nation’s economy; specifically, what their leisure-and business-travel markets want.
Source: PwC analysis
Air connectivity: Why it matters and how to support growth | 21
Regulatory and economic framework
Public policy and regulation can powerfully facilitate air connectivity, or hinder it, by constraining development of a country’s air-transport network. Since the 1940s, international air services have been governed by a complex web of bilateral air services agreements (ASAs) between States. Such agreements determine the number of airlines that may compete in any given market, the routes that airlines may operate, capacity (in terms of frequency and often the number of seats offered) that airlines may provide, and airfares. In recent years, some States have moved to liberalise ASAs; for example, through so-called ‘open skies’ agreements. Yet despite these open-access models, restrictions remain. Notably, when it comes to ownership and control of airlines, most ASAs allow governments to reject the designation of any airline that is not owned and controlled by the designating party. For the foreseeable future, the prospect of ‘normalisation’ of air transport, particularly with respect to consolidation or cross-border mergers of airlines, remains limited.
Governments trying to decide the degree to which they want to liberalise their ASAs would generally take a number of factors into account. For example, a country’s geographic features influences the extent to which liberalisation will boost air travel and connectivity. Geography also dictates the features of a country’s air-travel market; in particular, whether it is mainly a domestic market, an international market, or a transit point for global traffic flows. The attractiveness of the country to tourists and businesses also matters, with population affecting the size of the potential market. For instance, geographically isolated countries may be more likely to see liberalisation as being in their economic interest,
especially if they’re not attractive to tourists or they don’t have the population density needed to build a competitive air-transport network.
Size and geographic location may also influence a government’s attitude toward liberalisation of airline ownership provisions. Unfortunately, ownership decisions can’t be made unilaterally. Countries need agreement from ALL the bilateral partners who are most significant to their markets – or they risk having airlines with foreign ownership rejected. This is a problem of growing significance for governments seeking fresh capital investment in their airlines. As former flag carriers experience distress, the need to maintain air connectivity will raise new questions about the role of public – and private-sector investment in the industry.
How can stakeholders facilitate connectivity growth?With the exception of external factors such as geography that are beyond one’s control, stakeholders have the ability to influence many of the factors that enable achievement of greater air connectivity. For instance, emerging countries can achieve greater air connectivity by:
• Focusing on the development of aviation infrastructure (such as airports) – attracting new investors and ensuring that enough capacity is created to accommodate demand.
• Ensuring that airlines continue to establish and build up their networks to support the linkages a country has with the rest of the world.
• Developing regulatory and economic frameworks which reflect the characteristics and needs of the country, whilst at the same time fostering air transport growth.
On the other hand, mature economies would need to ensure that air connectivity is sustained by:
• Maintaining the current aviation infrastructure (such as airports) and ensuring any need for additional aviation capacity is promptly addressed to avoid loss of air connectivity to other competing neighbouring countries.
• Ensuring that airlines continue to find new routes to enhance their network connectivity, which is vital to the success of an airline. These opportunities may be found in emerging markets.
• Ensuring that regulatory and economic frameworks enable continued growth.
The importance of air connectivity to a country’s economic prosperity calls for stakeholders to work together and take the right steps to improve or maintain the global position of a country (or city) within the global air network.
About the authors: Hayley Morphet and Claudia Bottini are air traffic demand modelling professionals based in PwC Australia and UK, respectively.
E: [email protected] T: +61 (0) 7 3257 5314 and,
E: [email protected] T: +44 (0) 20 7213 5292).
22 | PwC | Connectivity and growth
Aeronautical charges and air traffic demand risk: what is within our control?
Airports are an extremely high profile part of a country’s critical national infrastructure and bring a complex network of stakeholders, including owners, operators, governments, regulators, airlines and local community. Airports also provide a wide range of transport and business services, with extensive supply chains intertwined with national and regional economies. Governments place focus on airport infrastructure as a facilitator for connectivity and economic growth – making it important to understand the impact an airport has on regional and local economies and communities.
Airports face increasing service expectations (from both passengers and airlines); regulator-imposed constraints on aeronautical charges; and the need to fulfil a national, regional, or municipal development role to drive efficiency, service quality improvement, and passenger growth.
Claudia Bottini, PwC UK and Hayley Morphet, PwC Australia
The global trend towards airport privatisation and increased private-sector participation continues as governments look to transfer potential capital costs to the private sector and seek greater commerciality in airport operations. Private financial investors look at airport infrastructure as a generator of stable, long-term cash flows as well as an opportunity to participate in commercial and property developments. This has led to a transformation of how airports manage risk and optimise profits.
Air passenger growth is the key driver of airport value and is subject to a range of demand and supply side factors and risks. (See Figure 1.)

Aeronautical charges and air traffic demand risk: what is within our control? | 23
Airlines and airports have very little control over many of the drivers impacting their market – including fluctuating fuel prices, economic conditions that affect consumer and corporate appetite for travel, geopolitical incidents and inconsistent regulatory costs and policies. How does the industry better understand how to respond to these market conditions, what is within their control, and how do they account for risk?
In our paper ‘ Economic growth and air traffic: developments in Australia and Britain’ (see page 6), we address the key risk to demand – economic growth. In this paper, we explore the question of whether aeronautical charges set by airports and regulators influence network decisions by airlines and therefore expose the airport to demand risk.
Figure 1: Drivers of air traffic demand
• Fares
• Exchange rates
• Attractiveness of destination
• Economic growth
• Geopolitical events
• Regulation
• Market size
• Yield (fare revenue and operating costs)
• Constraints
PassengerDrivers
AirlineDrivers
SupplyDemand
Source: PwC analysis

24 | PwC | Connectivity and growth
Impact of charges on passenger demandAeronautical charges are set by airports and regulators (where applicable). Changes in the level of charges are typically linked to regulation, market power, expansion, cost of capital and investment. There is empirical evidence that the impact on demand of changes in passenger charges (either airport charges or passenger taxes) can be significant. Case studies have been considered in order to understand how demand may respond to changes in passenger charges. It should be noted that it is challenging to isolate the impact from other factors.
Stansted Airport increased its charges per passenger by 74% between 2006–2007 and 2007–2008 following the regulatory review. Between 2006–2007 and 2013–2014, Stansted’s share of the London air passenger market declined from 17.4% to 12.9%. Ryanair, Stansted’s key customer, reduced seat capacity from Stansted by 9% while simultaneously doubling its total network capacity1. In the press, Ryanair has often cited increases in aeronautical charges as the reason for these reductions2. In 2013, Ryanair and Stansted signed a 10-year agreement to lower airport charges and raise airline growth targets. This resulted in a return to growth of Ryanair services between 2013–2014 and 2015–2016 of 26% in terms of seat capacity.
1. Source for Stansted Airport case study: ‘13. Cost and Commercial Viability: Funding and Financing’, PwC for Airports Commission, 2014 (https://www.gov.uk/government/uploads/system/uploads/attachment_data/file/372807/funding-and-financing.pdf)
2. Seeforexample:JosieEnsor(2March2013),‘RyanairtocutdownflightsfromStanstedoverlandingfeerow’,TheTelegraph,http://www.telegraph.co.uk/finance/newsbysector/transport/9904233/Ryanair-to-cut-down-flights-from-Stansted-over-landing-fee-row.html, accessed 11 November, 2016.
3. Source: IATA Airport Charges Monitor4. Source: ‘13. Cost and Commercial Viability: Funding and Financing’, PwC for Airports Commission, 2014 (https://www.gov.uk/government/uploads/system/uploads/
attachment_data/file/372807/funding-and-financing.pdf)5. Usinga‘Contractsandcommitmentsframework’whereagreementsaremadebetweentheairportandthe airlines(whereservicelevelstandards[‘commitments’]
are monitored), rather than a price cap set by the regulator.6. See for example: UK Department for Transport (2008), Decision on the Regulatory Status of Stansted Airport, pp. 11-12, http://webarchive.nationalarchives.
gov.uk/20081231144027/http:/www.dft.gov.uk/consultations/archive/2007/consulstatusstansted/decisionstanstedairport.pdf, and UK Department for Transport (2007), Decision on the Regulatory Status of Manchester Airport, p. 6, http://webarchive.nationalarchives.gov.uk/http:/www.dft.gov.uk/consultations/archive/2007/consulstatusmanchester/decisionmanchesterairport.pdf.
The Netherlands Air Passenger Tax was introduced in July 2008 and imposed on departing passengers (transfer passengers and freight were exempt). The tax was levied at the rate of €11.25 for short haul traffic and €45 for all other traffic3. From the point of view of the airline, a tax can be seen as largely equivalent to an increase in aeronautical charges. Although the impact was disguised by the downturn in the economy, there was a substantial reduction in terminating (origin-destination) passengers around the same time (i.e. by 8%–10% more than the downturn in transfer passengers)4.After 12 months the tax was withdrawn, suggesting that the Dutch government considered that the demand reduction was caused, at least in part, by the tax; demand appears to have recovered since. (See Figure 2.)
Economic regulation of Manchester and Stansted airports was removed in 2009 and 2014 respectively and Gatwick airport regulation was transformed5 in 2014. It is worth noting that at various points in their history, Manchester and Stansted airports were unable to price up to their regulated cap6. This suggests that aeronautical charges can be an important factor for airlines when considering where to fly.
Tax period
NL GDP TransferOD
-20%
-15%
-10%
-5%
0%
5%
10%
15%
2007Q1
2007Q2
2007Q3
2007Q4
2008Q1
2008Q2
2008Q3
2008Q4
2009Q1
2009Q2
2009Q3
2009Q4
2010Q1
2010Q2
2010Q3
2010Q4
Less impact on transfer passengers
Recovery coincided with an upturn in the economy and the
abolition of the tax
Introduction of tax – OD passengers down significantly on previous year, also coinciding with the economic downturn
Source: Schiphol Group, OECD
Figure 2: Quarterly change in passengers at Amsterdam Schiphol Airport and Netherlands Real GDP Growth (compared with same quarter previous year)
Aeronautical charges and air traffic demand risk: what is within our control? | 25
In 2012, charges at AENA’s airports in Spain were increased, with the key airports of Madrid seeing an increase of 60% and Barcelona of 50%7. While Barcelona’s traffic proved to be relatively resilient (largely as a result of the growth of Barcelona based carrier Vueling), demand at Madrid declined significantly over the years following the increase (likely due, in part, to restructuring activity at Iberia). This suggests that demand responses to aeronautical charge changes may be different across different airports, but also highlights the difficulty in assessing precisely what is caused by the impact of changes in aero charges rather than other factors (e.g. airlines at Barcelona may have absorbed the increases, while at Madrid, these may have been passed through to the passenger).
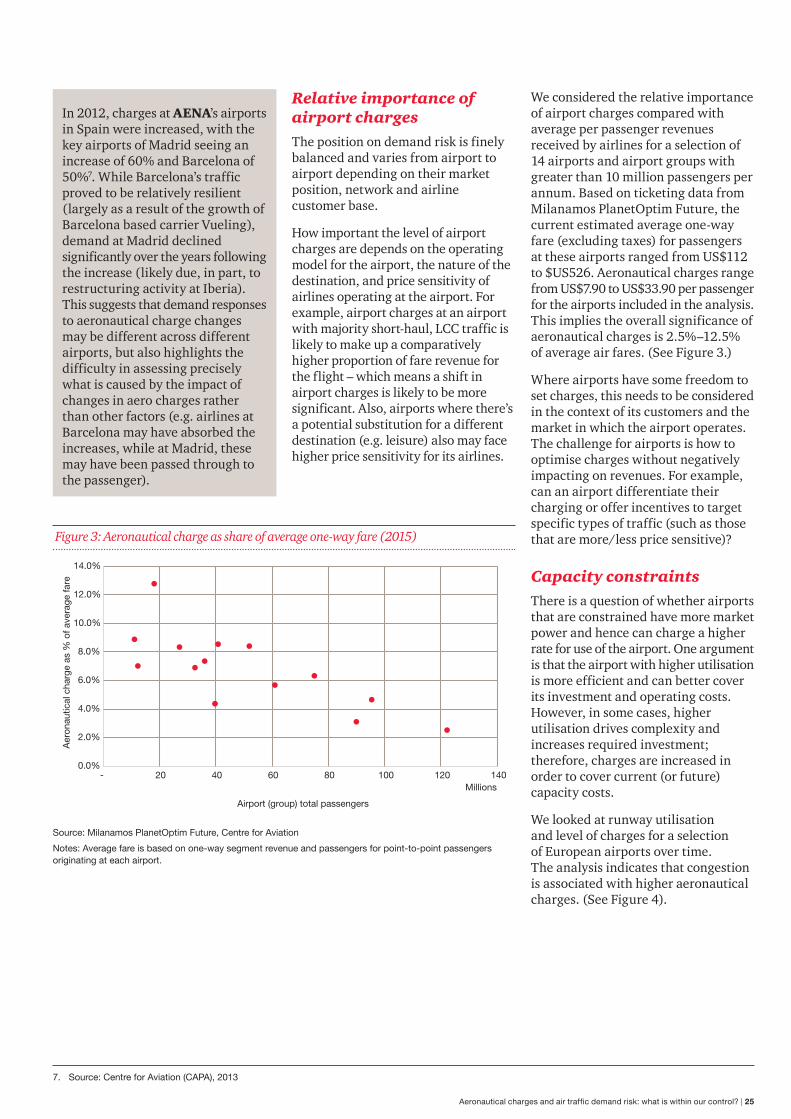
7. Source: Centre for Aviation (CAPA), 2013
Relative importance of airport chargesThe position on demand risk is finely balanced and varies from airport to airport depending on their market position, network and airline customer base.
How important the level of airport charges are depends on the operating model for the airport, the nature of the destination, and price sensitivity of airlines operating at the airport. For example, airport charges at an airport with majority short-haul, LCC traffic is likely to make up a comparatively higher proportion of fare revenue for the flight – which means a shift in airport charges is likely to be more significant. Also, airports where there’s a potential substitution for a different destination (e.g. leisure) also may face higher price sensitivity for its airlines.
We considered the relative importance of airport charges compared with average per passenger revenues received by airlines for a selection of 14 airports and airport groups with greater than 10 million passengers per annum. Based on ticketing data from Milanamos PlanetOptim Future, the current estimated average one-way fare (excluding taxes) for passengers at these airports ranged from US$112 to $US526. Aeronautical charges range from US$7.90 to US$33.90 per passenger for the airports included in the analysis. This implies the overall significance of aeronautical charges is 2.5%–12.5% of average air fares. (See Figure 3.)
Where airports have some freedom to set charges, this needs to be considered in the context of its customers and the market in which the airport operates. The challenge for airports is how to optimise charges without negatively impacting on revenues. For example, can an airport differentiate their charging or offer incentives to target specific types of traffic (such as those that are more/less price sensitive)?
Capacity constraintsThere is a question of whether airports that are constrained have more market power and hence can charge a higher rate for use of the airport. One argument is that the airport with higher utilisation is more efficient and can better cover its investment and operating costs. However, in some cases, higher utilisation drives complexity and increases required investment; therefore, charges are increased in order to cover current (or future) capacity costs.
We looked at runway utilisation and level of charges for a selection of European airports over time. The analysis indicates that congestion is associated with higher aeronautical charges. (See Figure 4).
0.0%
2.0%
4.0%
6.0%
8.0%
10.0%
12.0%
14.0%
- 20 40 60 80 100 120 140
Aer
onau
tical
cha
rge
as %
of a
vera
ge fa
re
Airport (group) total passengers
Millions
Source: Milanamos PlanetOptim Future, Centre for Aviation
Notes: Average fare is based on one-way segment revenue and passengers for point-to-point passengers originating at each airport.
Figure 3: Aeronautical charge as share of average one-way fare (2015)

26 | PwC | Connectivity and growth
Capacity constraints may also affect the fares that passengers pay for travel as constraints may put a limit on supply, which theoretically would increase prices. Where the supply of available seats is limited – be that through constraints on airline capacity or limitations on airport or airspace infrastructure – it is expected that the price paid, either by the passenger through air fares or the airline through airport charges, may be higher.
8. https://www.gov.uk/government/uploads/system/uploads/attachment_data/file/372332/economic-analysis-consultants-reports.zip. (‘PwC Fare Differentials’)9. All airports with scheduled passenger services in France, Spain, Italy, Germany, Netherlands and the UK were included in the analysis.10.Constrainedairportsweredefinedasthoseoperatingatabove95%oftheirstatedcapacityintermsofairtransportmovementsinanygivenyear.
Given the many airport and airline specific factors that affect fares, we conducted an analysis on behalf of the UK Airports Commission8 in 2013, which attempted to isolate the effect of capacity constraints on fares. We have updated this analysis to cover the period from 2004–2015. This study used ticketing data from Milanamos PlanetOptim Future for a selection of European airports9 (both constrained10 and unconstrained) and a variety of analytical techniques to examine the relationship. (See Case Study on page 27.)
ConclusionsThere is clear evidence that changes in aeronautical charges impact on airline network decisions; however, the level of impact varies from airport to airport depending on a range of factors such as market power, regulation, route network and airline customer base. We found that capacity constraints are associated with higher aeronautical charges and higher air fares – impacting on consumer benefits and demand. This usually results in the economic regulation of capacity constrained airports.
The structure of aeronautical charges need to be aligned with an airport’s strategy and what they are trying to achieve in terms of services offered. Setting the level of charges requires a delicate balance to optimise revenues. If you reduce your charges too much, are you throwing away revenue? And if you increase them too much, are you throwing away growth? Identifying this ‘sweet spot’ is challenging. For example, the value in lowering charges may be disproportionate to the benefits in terms of overall financial performance. It needs to be considered that throughput drives non-aeronautical revenues; therefore, even if there is a net negative impact on aeronautical revenues as a result of reducing aeronautical charges and increasing demand, this may be offset by positive impact on non-aeronautical activities.
About the authors: Hayley Morphet and Claudia Bottini are air traffic demand modelling professionals based in PwC Australia and UK, respectively.
E: [email protected] T: +61 (0) 7 3257 5314 and,
E: [email protected] T: +44 (0) 20 7213 5292).
Source: PwC analysis of airport annual reports and various sources for runway utilisation estimates
Note:Acorrelationcoefficientof0.36indicatesacleartrend/relationshiporiginatingateachairport.
0%
20%
40%
60%
80%
100%
120%
0 5 10 15 20 25
Aeronautical charge per passenger (USD)
Run
way
uti
lisat
ion
The correlation coefficient between airport charge and utilisation is 0.36
Figure 4: Runway utilisation (%) vs aeronautical charge per passenger

Aeronautical charges and air traffic demand risk: what is within our control? | 27|
Case Study – The impact of capacity constraints on air fares
Hypothesis
Capacity constraints may affect the fares that passengers pay for travel. Where the supply of available seats is limited, be that through constraints on airline capacity or limitations on airport or airspace infrastructure, it is expected that the price paid, either by the passenger through air fares or the airline through airport charges, may be higher.
Given the many airport and airline specific factors which affect fares, we conducted an analysis to attempt to isolate the effect of capacity constraints on fares at European Airports (UK, Germany, France, Spain, Italy and the Netherlands) for the period of 2004 to 2015.
Ho: Capacity constraints lead to higher fares
Econometric analysis
Model: log-log model, capacity constraint dummy for all routes (excluding LCCs)
Dependent variable: Fare revenue per passenger mile, including tax (total, economy, premium)
Independent variables: capacity constraint dummy, frequency, number of airlines, seats per movements, route distance, segment passengers, GDP per capita for the origin country, GDP per capita for the destination country
Coefficient for capacity constraint
Output
Total 0.228***
Short haul 0.162***
Long haul 0.154***
Significant at *** for 1%
Results
We found evidence of higher fares being associated with airports with capacity constraints. Across all airports and routes included in the study, fare revenue per passenger mile was found to be circa 22% higher for constrained airports relative to unconstrained airports.
The higher fare revenue per passenger mile observed at constrained airports might be the result of various factors, including the attractiveness of the destination served as well as the necessity by the airlines to cover higher airport charges and other operating costs.
Approach
As part of our approach to understand the impact of capacity constraints on air fares, we conducted two types of analyses:
• Trend analysis
• Detailed econometric analysis based on a panel data approach. This type of approach was selected given the nature of the data and its availability, e.g. limited time series, non-continuous data, wide variety of variables and use of dummy variables in the dataset. We conducted various tests to determine the best approach between Random Effect and Fixed Effect models. The Fixed Effect model was deemed as the most appropriate.
Trend analysis
As a first step we analysed trends to identify key drivers in air fares (e.g. route distance, competition, frequency, etc.) and the impact of airport capacity constraints. The trend analysis, however, did not provide any clear indication of the impact of constraints on air fares.
Capacity utilisation data for a sample of airports in Europe
VariablesScheduled airline data – seat capacity, frequency and seat miles by route, airline and year
Airline ticketing data – point-to-point passengers and average air fare by route, airline, class of travel and year
Air passenger taxes – air passenger taxes by country have also been considered in the analysis
Aeronautical charges – aeronautical charges have also been sourced based on the average aeronautical revenue of the origin and destination airport
Other derived key indicators – competing airlines on route; revenue per air passenger mile with and without taxes and charges for all classes, as well as for premium and economy classes; origin and destination airport size; seats per movement
Economic indicators – origin and destination country GDP per capita, crude oil prices
Data sources:Airline ticketing and schedule data: Milanamos Planet Optim Future
Air passenger taxes – IATA charges monitor
Aero-charges and economic data – various
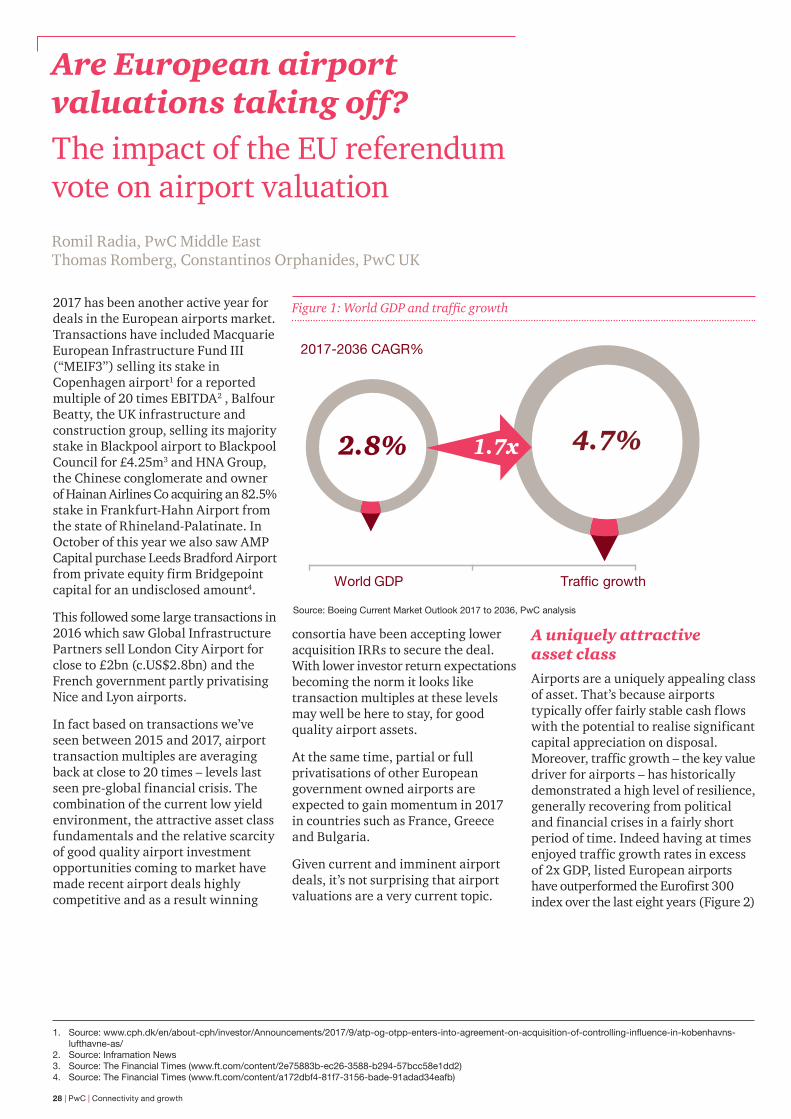
28 | PwC | Connectivity and growth
Are European airport valuations taking off?The impact of the EU referendum vote on airport valuation
2017 has been another active year for deals in the European airports market. Transactions have included Macquarie European Infrastructure Fund III (“MEIF3”) selling its stake in Copenhagen airport1 for a reported multiple of 20 times EBITDA2 , Balfour Beatty, the UK infrastructure and construction group, selling its majority stake in Blackpool airport to Blackpool Council for £4.25m3 and HNA Group, the Chinese conglomerate and owner of Hainan Airlines Co acquiring an 82.5% stake in Frankfurt-Hahn Airport from the state of Rhineland-Palatinate. In October of this year we also saw AMP Capital purchase Leeds Bradford Airport from private equity firm Bridgepoint capital for an undisclosed amount4.
This followed some large transactions in 2016 which saw Global Infrastructure Partners sell London City Airport for close to £2bn (c.US$2.8bn) and the French government partly privatising Nice and Lyon airports.
In fact based on transactions we’ve seen between 2015 and 2017, airport transaction multiples are averaging back at close to 20 times – levels last seen pre-global financial crisis. The combination of the current low yield environment, the attractive asset class fundamentals and the relative scarcity of good quality airport investment opportunities coming to market have made recent airport deals highly competitive and as a result winning
1. Source: www.cph.dk/en/about-cph/investor/Announcements/2017/9/atp-og-otpp-enters-into-agreement-on-acquisition-of-controlling-influence-in-kobenhavns-lufthavne-as/
2. Source: Inframation News3. Source: The Financial Times (www.ft.com/content/2e75883b-ec26-3588-b294-57bcc58e1dd2)4. Source: The Financial Times (www.ft.com/content/a172dbf4-81f7-3156-bade-91adad34eafb)
consortia have been accepting lower acquisition IRRs to secure the deal. With lower investor return expectations becoming the norm it looks like transaction multiples at these levels may well be here to stay, for good quality airport assets.
At the same time, partial or full privatisations of other European government owned airports are expected to gain momentum in 2017 in countries such as France, Greece and Bulgaria.
Given current and imminent airport deals, it’s not surprising that airport valuations are a very current topic.
A uniquely attractive asset classAirports are a uniquely appealing class of asset. That’s because airports typically offer fairly stable cash flows with the potential to realise significant capital appreciation on disposal. Moreover, traffic growth – the key value driver for airports – has historically demonstrated a high level of resilience, generally recovering from political and financial crises in a fairly short period of time. Indeed having at times enjoyed traffic growth rates in excess of 2x GDP, listed European airports have outperformed the Eurofirst 300 index over the last eight years (Figure 2)
Romil Radia, PwC Middle East Thomas Romberg, Constantinos Orphanides, PwC UK
Source: Boeing Current Market Outlook 2017 to 2036, PwC analysis
Figure 1: World GDP and traffic growth
2.8% 4.7%1.7x
World GDP Traffic growth
2017-2036 CAGR%
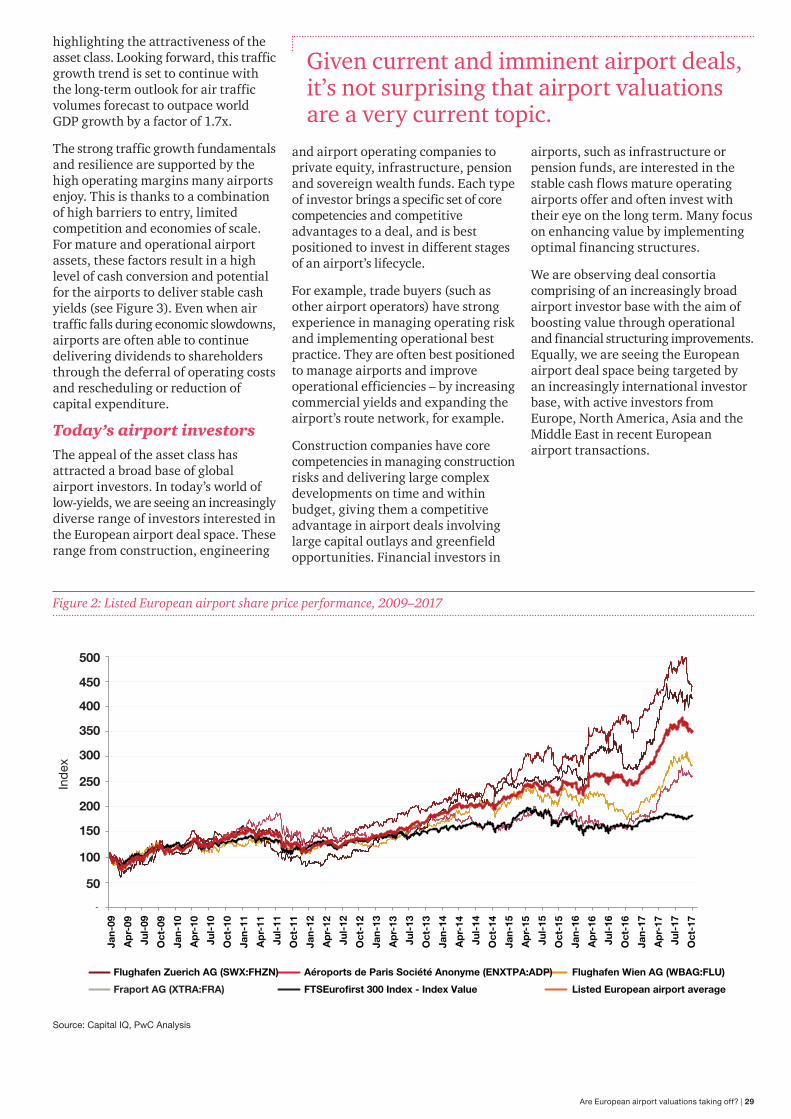
Are European airport valuations taking off? | 29
Given current and imminent airport deals, it’s not surprising that airport valuations are a very current topic.
Source: Capital IQ, PwC Analysis
Figure 2: Listed European airport share price performance, 2009–2017
50
100
150
200
250
300
350
400
Ind
ex
Flughafen Zuerich AG (SWX:FHZN) Aéroports de Paris Société Anonyme (ENXTPA:ADP) Flughafen Wien AG (WBAG:FLU)
Fraport AG (XTRA:FRA) FTSEurofirst 300 Index - Index Value Listed European airport average
Jan-
09
Ap
r-09
Jul-
09
Oct
-09
Jan-
10
Ap
r-10
Jul-
10
Oct
-10
Jan-
11
Ap
r-11
Jul-
11
Oct
-11
Jan-
12
Ap
r-12
Jul-
12
Oct
-12
Jan-
13
Ap
r-13
Jul-
13
Oct
-13
Jan-
14
Ap
r-14
Jul-
14
Oct
-14
Jan-
15
Ap
r-15
Jul-
15
Oct
-15
Jan-
16
Ap
r-16
Jul-
16
Oct
-16
-
450
500Ja
n-17
Ap
r-17
Jul-
17
Oct
-17
highlighting the attractiveness of the asset class. Looking forward, this traffic growth trend is set to continue with the long-term outlook for air traffic volumes forecast to outpace world GDP growth by a factor of 1.7x.
The strong traffic growth fundamentals and resilience are supported by the high operating margins many airports enjoy. This is thanks to a combination of high barriers to entry, limited competition and economies of scale. For mature and operational airport assets, these factors result in a high level of cash conversion and potential for the airports to deliver stable cash yields (see Figure 3). Even when air traffic falls during economic slowdowns, airports are often able to continue delivering dividends to shareholders through the deferral of operating costs and rescheduling or reduction of capital expenditure.
Today’s airport investors The appeal of the asset class has attracted a broad base of global airport investors. In today’s world of low-yields, we are seeing an increasingly diverse range of investors interested in the European airport deal space. These range from construction, engineering
and airport operating companies to private equity, infrastructure, pension and sovereign wealth funds. Each type of investor brings a specific set of core competencies and competitive advantages to a deal, and is best positioned to invest in different stages of an airport’s lifecycle.
For example, trade buyers (such as other airport operators) have strong experience in managing operating risk and implementing operational best practice. They are often best positioned to manage airports and improve operational efficiencies – by increasing commercial yields and expanding the airport’s route network, for example.
Construction companies have core competencies in managing construction risks and delivering large complex developments on time and within budget, giving them a competitive advantage in airport deals involving large capital outlays and greenfield opportunities. Financial investors in
airports, such as infrastructure or pension funds, are interested in the stable cash flows mature operating airports offer and often invest with their eye on the long term. Many focus on enhancing value by implementing optimal financing structures.
We are observing deal consortia comprising of an increasingly broad airport investor base with the aim of boosting value through operational and financial structuring improvements. Equally, we are seeing the European airport deal space being targeted by an increasingly international investor base, with active investors from Europe, North America, Asia and the Middle East in recent European airport transactions.
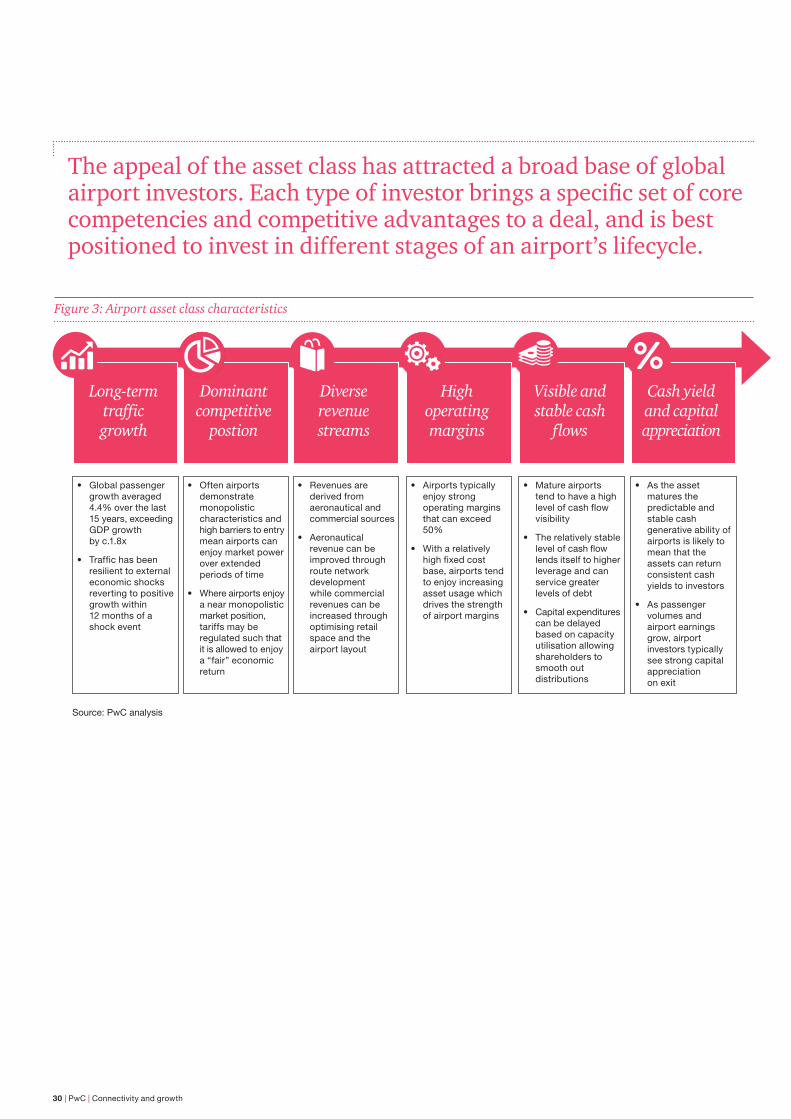
30 | PwC | Connectivity and growth
The appeal of the asset class has attracted a broad base of global airport investors. Each type of investor brings a specific set of core competencies and competitive advantages to a deal, and is best positioned to invest in different stages of an airport’s lifecycle.
Figure 3: Airport asset class characteristics
Long-term traffic growth
• Global passenger growth averaged 4.4% over the last 15 years, exceeding GDP growth by c.1.8x
• Traffic has been resilient to external economic shocks reverting to positive growth within 12 months of a shock event
• Often airports demonstrate monopolistic characteristics and high barriers to entry mean airports can enjoy market power over extended periods of time
• Where airports enjoy a near monopolistic market position, tariffs may be regulated such that it is allowed to enjoy a “fair” economic return
• Revenues are derived from aeronautical and commercial sources
• Aeronautical revenue can be improved through route network development while commercial revenues can be increased through optimising retail space and the airport layout
• Airports typically enjoy strong operating margins that can exceed 50%
• With a relatively high fixed cost base, airports tend to enjoy increasing asset usage which drives the strength of airport margins
• Mature airports tend to have a high level of cash flow visibility
• The relatively stable level of cash flow lends itself to higher leverage and can service greater levels of debt
• Capital expenditures can be delayed based on capacity utilisation allowing shareholders to smooth out distributions
• As the asset matures the predictable and stable cash generative ability of airports is likely to mean that the assets can return consistent cash yields to investors
• As passenger volumes and airport earnings grow, airport investors typically see strong capital appreciation on exit
Dominant competitive
postion
Diverse revenue streams
High operating margins
Visible and stable cash
flows
Cash yield and capital appreciation
Source: PwC analysis

Are European airport valuations taking off? | 31
Airport assets that are expected to come to market over the next 12 to 18 months generally fall into two categories: government-led privatisation initiatives or infrastructure funds looking to monetise their airport investments as funds reach the end of their life. Deal pipelineFinancial investors – specifically, pension and sovereign wealth funds – tend to hold operationally mature airport investments for a longer term, reaping benefits from the relatively steady cash yield. This means that airports held by these investors rarely come to market but when they do they are highly sought after.
Looking at the pipeline of airport investments that, based on publicly available information, are expected to come to market in the short term (Figure 4) we observe that there are a number of short term opportunities in European OECD countries – though the timing that these will come to market remains uncertain.
Figure 4: Short-term airport pipeline opportunities
Source: InfraNews, publicly available information, PwC analysis.
United Kingdom
Brownfield opportunities:Potential infrastructure fund divestments in Belfast City airport, Gatwick airport and possibly Heathrow airport
Belgium
Brownfield opportunity:Brussels airport
Brownfield opportunity:Copenhagen airport
Denmark
Brazil
Greenfield opportunities:Four international airport concessions in Florianopolis, Fortalenza, Porto Alegre and Salvador.
Greece
Brownfield opportunities:Privatisation programme which includes Athens airport and a number of regional airports
Bulgaria
Brownfield opportunity:Sofia International airport concession
Japan
Brownfield opportunities:Six international airport concessions (Fukuoka, Hiroshima, Hokkaido New Chitose, Kobe, Mount Fuji Shizuoka and Takamatsu).
India
Greenfield opportunities:Two airport concessions for Bhogapuram International airport and Navi Mumbai airport.
United States (Puerto Rico)
Brownfield opportunity:Luis Munoz Marin airport
Lithuania
Brownfield opportunity:Privatisation of Vilnius, Kaunas and Palang airports.
Philippines
Greenfield opportunities:Five airport privatisations (Iloilo, Bacolod, Laguindingan, Bohol and Davao airports) and expansion of Manilla’s NinoyAquino International airport.
Serbia
Brownfield opportunity:Nicola Tesla airport (Belgrade)
Sri Lanka
Brownfield opportunity:Mattala Rajapaksa International airport concession.
Canada
Brownfield OpportunitiesToronto Pearson
Riyadh airport minority stake sale
Saudi Arabia
Brownfield opportunity:
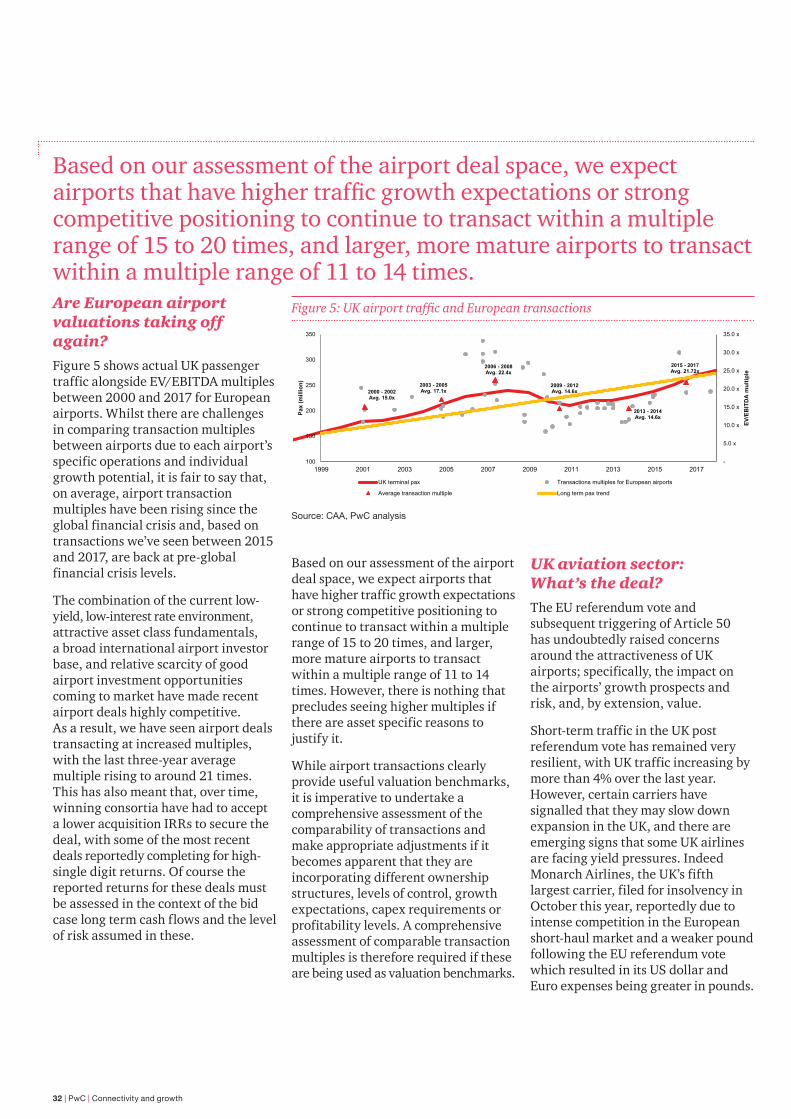
32 | PwC | Connectivity and growth
Are European airport valuations taking off again? Figure 5 shows actual UK passenger traffic alongside EV/EBITDA multiples between 2000 and 2017 for European airports. Whilst there are challenges in comparing transaction multiples between airports due to each airport’s specific operations and individual growth potential, it is fair to say that, on average, airport transaction multiples have been rising since the global financial crisis and, based on transactions we’ve seen between 2015 and 2017, are back at pre-global financial crisis levels.
The combination of the current low-yield, low-interest rate environment, attractive asset class fundamentals, a broad international airport investor base, and relative scarcity of good airport investment opportunities coming to market have made recent airport deals highly competitive. As a result, we have seen airport deals transacting at increased multiples, with the last three-year average multiple rising to around 21 times. This has also meant that, over time, winning consortia have had to accept a lower acquisition IRRs to secure the deal, with some of the most recent deals reportedly completing for high-single digit returns. Of course the reported returns for these deals must be assessed in the context of the bid case long term cash flows and the level of risk assumed in these.
Based on our assessment of the airport deal space, we expect airports that have higher traffic growth expectations or strong competitive positioning to continue to transact within a multiple range of 15 to 20 times, and larger, more mature airports to transact within a multiple range of 11 to 14 times. However, there is nothing that precludes seeing higher multiples if there are asset specific reasons to justify it.
While airport transactions clearly provide useful valuation benchmarks, it is imperative to undertake a comprehensive assessment of the comparability of transactions and make appropriate adjustments if it becomes apparent that they are incorporating different ownership structures, levels of control, growth expectations, capex requirements or profitability levels. A comprehensive assessment of comparable transaction multiples is therefore required if these are being used as valuation benchmarks.
Figure 5: UK airport traffic and European transactions
-
5.0 x
10.0 x
15.0 x
20.0 x
25.0 x
30.0 x
35.0 x
100
150
200
250
300
350
1999 2001 2003 2005 2007 2009 2011 2013 2015 2017
EV/E
BIT
DA
mul
tiple
Pax
(mill
ion)
UK terminal pax Transactions multiples for European airports
Average transaction multiple Long term pax trend
2006 - 2008Avg. 22.4x
2003 - 2005Avg. 17.1x2000 - 2002
Avg. 15.0x
2009 - 2012Avg. 14.6x
2015 - 2017Avg. 21.72x
2013 - 2014Avg. 14.6x
Source: CAA, PwC analysis
UK aviation sector: What’s the deal?The EU referendum vote and subsequent triggering of Article 50 has undoubtedly raised concerns around the attractiveness of UK airports; specifically, the impact on the airports’ growth prospects and risk, and, by extension, value.
Short-term traffic in the UK post referendum vote has remained very resilient, with UK traffic increasing by more than 4% over the last year. However, certain carriers have signalled that they may slow down expansion in the UK, and there are emerging signs that some UK airlines are facing yield pressures. Indeed Monarch Airlines, the UK’s fifth largest carrier, filed for insolvency in October this year, reportedly due to intense competition in the European short-haul market and a weaker pound following the EU referendum vote which resulted in its US dollar and Euro expenses being greater in pounds.
Based on our assessment of the airport deal space, we expect airports that have higher traffic growth expectations or strong competitive positioning to continue to transact within a multiple range of 15 to 20 times, and larger, more mature airports to transact within a multiple range of 11 to 14 times.

Are European airport valuations taking off? | 33
The longer-term direction of UK airport valuations will ultimately depend on the broader implications of the Brexit deal negotiated for the aviation sector, the speed at which it is concluded, and the impact of the Brexit deal on UK and European economic activity. Consequently it may be too early to assess any significant longer-term traffic trends resulting from the vote. Meanwhile, European-listed airports have outperformed the overall market since the referendum vote, suggesting no material value impact from the Brexit decision.
In the short term, any lower economic activity and post-Brexit uncertainty may lead to some reduction in UK passenger and freight traffic. In the event of a slowdown, discretionary outbound leisure demand is likely to be most affected, although higher inbound traffic (from a weakening pound) will also cushion any decline. Equally, the short-term depreciation of the sterling makes UK airport assets more attractive to global airport investors with a longer-term investment horizon; sterling depreciation will also stimulate regional export-oriented UK economies, resulting in a positive impact on passenger and cargo traffic.
At present there is uncertainty around the form any deal negotiated between the UK and EU for the aviation sector may take; however, some of the factors that will determine the outcome include the extent of access to a single aviation market, the direction of aviation market liberalisation and free trade agreements signed with non-EU countries (see Figure 6). In the event that airlines face increased regulatory costs to access the UK/EU markets or face higher US$-denominated oil prices, these costs could in turn be passed on to passengers through higher air fares with a consequential impact on traffic demand.
Figure 6: Brexit impact on the aviation sector
Leisure segment• Degree of border
formalities• Attractiveness of UK
for inbound tourism
Visiting Friends and Relatives• Net migration• Constraints on
movement of labour• Real wage impact
(combined w/fx)• UK plc reputation
and brand
Business segment• Location of corporate
operations • Strength of financial
services• Transaction cost of
business w/UK
Cargo and Freight• Level of
international trade• Extent of EU trade
barriers• FTAs with non EU
countries
All Aviation• Economic activity• Foreign exchange• Access to single
aviation market• Free aviation/Liberal
traffic rights• Infrastructure • Fuel price
Busines
s
LeisureVFR
Cargo
Source: PwC analysis
destinations, which could strengthen demand for long-haul travel, favouring larger UK airports with some hub connectivity. More long-haul flights attract higher aeronautical charges and increase throughput, particularly for capacity constrained airports, while intra-EU Duty Free could be an important new revenue stream for both airports and airlines.
The longer-term direction of UK airport valuations will ultimately depend on the broader implications of the Brexit deal negotiated for the aviation sector, the speed at which it is concluded, and the impact of the Brexit deal on UK and European economic activity.
Indeed, depending on the outcome of the Brexit deal negotiated for the aviation sector, there may be winner and loser airports within the UK. For example, UK airports with a higher proportion of outbound traffic and a route network with a higher exposure to European destinations will likely be impacted to a greater extent. UK route networks may shift focus to non-EU

34 | PwC | Connectivity and growth

Are European airport valuations taking off? | 35|
1. Given the attractiveness of the airport asset class, the broad international nature of airport investors, long-term investment horizons of funds and scarcity in the opportunity pipeline, we expect European and UK airport multiples to be maintained at current levels in the short term, absent any economic slowdown or shock.
2. A broadening base of international airport investors are joining forces to deliver airport value enhancements – we are observing an increasing trend of construction, engineering and airport operators forming consortia with financial investors with the aim of delivering value enhancement through both operational and financial structuring improvements.
3. Cyclicality should be built into long-term cash flow projections – when assessing the value of an airport, it is essential to recognise the cyclicality of the industry, consider where we currently sit in the economic cycle and build sensitivities into cash flow projections to reflect economic downturns and other risks. One impact of the Brexit vote has been to increase uncertainty around future potential outcomes for the UK and European aviation sector, making sensitivity testing around possible post Brexit scenarios even more important.
4. Brexit may create winners and losers in the UK airport sector but the relative impact will depend on the Brexit aviation deal negotiated.
About the authors: Romil Radia heads PwC’s Middle East valuations practice and leads airport and airline sector valuations at PwC. He is currently based in Dubai. Thomas Romberg leads the PwC UK infrastructure valuations team and is based in London. Constantinos Orphanides is an airport valuations professional at PwC UK based in London.
Contacts:
E: [email protected] T: +971 1 304 3723;
E: [email protected], T: +44 (0)20 7804 0860;
E: [email protected], T: +44 (0)20 7213 3929).
If you’re thinking about investing...
2017 has shown that UK and European airports continue to attract significant interest among airport investors, with strong expected demand for UK and European assets coming to market in the short term. Our key messages around airport valuations in the current environment are the following:

36 | PwC | Connectivity and growth
To have a conversation about how this subject may affect your business, please contact:
Michael Burns
+44 (0)20 7804 4438 [email protected]
Are European airport valuations taking off? | 37

www.pwc.com
This publication has been prepared for general guidance on matters of interest only, and does not constitute professional advice. You should not act upon the information contained in this publication without obtaining specific professional advice. No representation or warranty (express or implied) is given as to the accuracy or completeness of the information contained in this publication, and, to the extent permitted by law, PwC does not accept or assume any liability, responsibility or duty of care for any consequences of you or anyone else acting, or refraining to act, in reliance on the information contained in this publication or for any decision based on it.
© 2017 PwC. All rights reserved. “PwC” refers to the PwC network and/or one or more of its member firms, each of which is a separate legal entity. Please see www.pwc.com/structure for further details.
171017-091721-KG-UK


