CONNECTING THE FUTURE - Annual report ASM...
177
CONNECTING THE FUTURE STATUTORY ANNUAL REPORT 2014
Transcript of CONNECTING THE FUTURE - Annual report ASM...

CONNECTING THE FUTURE
STATUTORY ANNUAL REPORT 2014

TABLE OF CONTENTSOUR COMPANY 3ABOUT 4AT A GLANCE 7LETTER TO SHAREHOLDERS 10STRATEGY & FOCUS AREAS 13TECHNOLOGY & INNOVATION 16CONNECTING THE FUTURE 21MANAGEMENT 25SHAREHOLDER INFORMATION 26LOCATIONS WORLDWIDE 29
CORPORATE GOVERNANCE 31GENERAL 32MANAGEMENT BOARD 33SUPERVISORY BOARD 36SUPERVISORY BOARD REPORT 42SHARES AND SHAREHOLDERS’ RIGHTS 45EXTERNAL AUDITOR 49DECLARATIONS 50
RISK MANAGEMENT 51RISK MANAGEMENT 52RISK FACTORS 54
MANAGEMENT REPORT 68SUMMARY 69CRITICAL ACCOUNTING POLICIES 72OPERATIONS UPDATE 74LIQUIDITY AND CAPITAL RESOURCES 82OUTLOOK 83CONTRACTUAL OBLIGATIONS, CONTINGENT LIABILITIES AND COMMITMENTS 84MARKET RISK DISCLOSURE 85BUSINESS OVERVIEW 88
ANNUAL ACCOUNTS 99
2
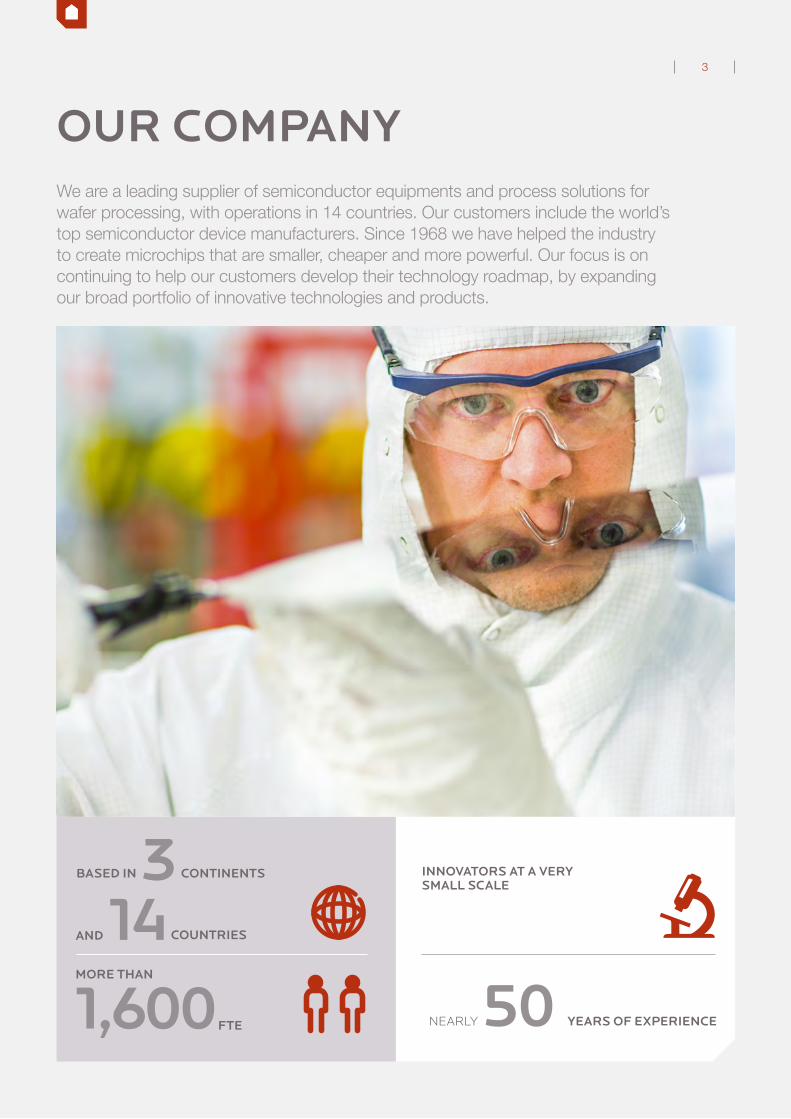
We are a leading supplier of semiconductor equipments and process solutions for wafer processing, with operations in 14 countries. Our customers include the world’s top semiconductor device manufacturers. Since 1968 we have helped the industry to create microchips that are smaller, cheaper and more powerful. Our focus is on continuing to help our customers develop their technology roadmap, by expanding our broad portfolio of innovative technologies and products.
OUR COMPANY
CONTINENTS
AND COUNTRIES
BASED IN314
YEARS OF EXPERIENCE
INNOVATORS AT A VERY SMALL SCALE
50FTE
MORE THAN
1,600 NEARLY
3

ABOUT
ASM International NV (‘ASMI’) is a leading supplier of semiconductor wafer processing equipment. We design, manufacture and sell equipment, process solutions and services to our customers for the production of semiconductor devices.
ASMI’s innovative technologies and products are being used by all of the top semiconductor manufacturers in the world, primarily for the deposition of thin films. We are a truly global company. Based in 14 countries, we benefit from the advantages of bringing together the best brains in the world to help our customers progress along their technology roadmap.
UNIVERSITY RESEARCH/R&D INSTITUTES
ASMI
MATERIALSSUPPLIERS
SEMICONDUCTORsuPPLIERS
ELECTRONICSINDUSTRY CONSUMERS
FAB EQUIPMENTSUPPLIERS
THE VALUE CHAIN IN OUR INDUSTRY
WAFER PROCESSINGWe focus primarily on equipment and process solutions for the deposition of thin films. Our core strengths are in atomic layer deposition (‘ALD’), plasma enhanced ALD (‘PEALD’), epitaxy, plasma enhanced chemical vapor deposition (‘PECVD’), low pressure chemical vapor deposition (‘LPCVD’) and oxidation/diffusion. In order to meet our customers’ needs. we have developed - and are still developing - many new materials. With this portfolio of established and newer technologies, we are addressing many of the key areas on the semiconductor industry roadmap, including: › high-k metal gate; › new applications for advanced FinFET transistors; › dielectrics for spacer-defined double patterning; › low-k dielectrics for interconnect; and › strained silicon.
Enabling the industry to move to smaller line widths and better transistors that use new materials. Our discoveries are resulting in greater efficiencies for businesses and greater opportunities for everyone.
ASM INTERNATIONAL | STATUTORY ANNUAL REPORT 2014
OUR COMPANY | ABOUT 4
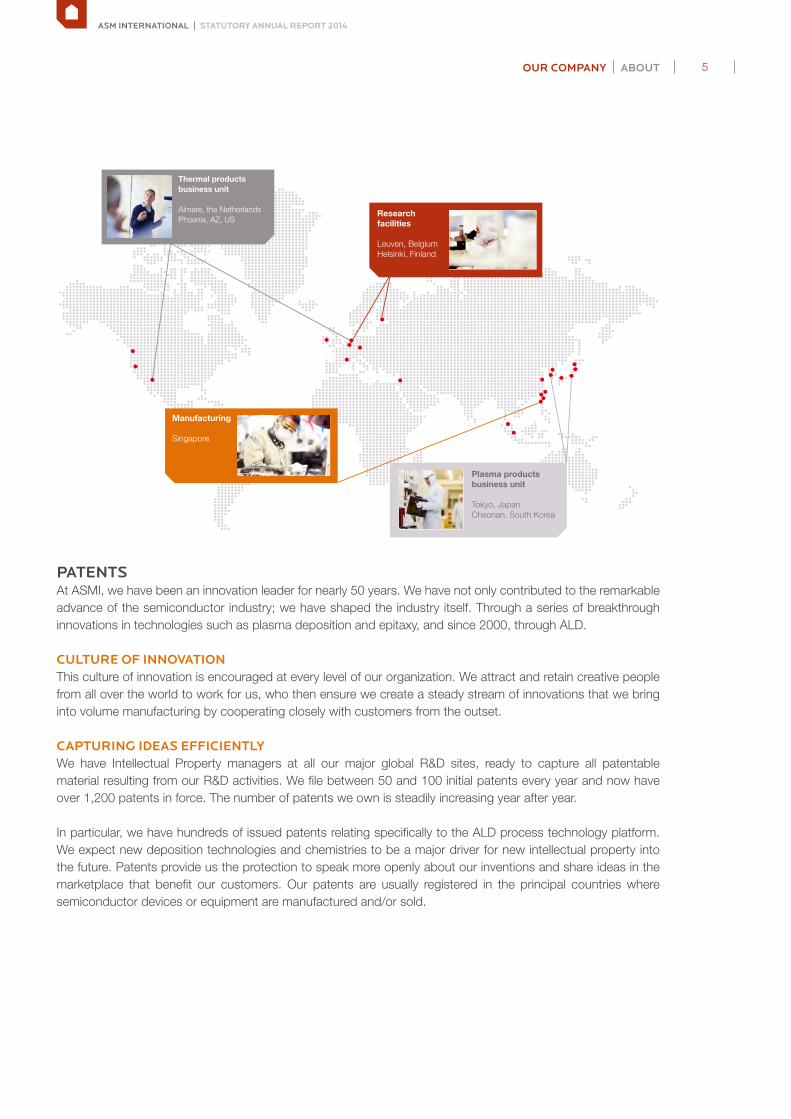
Thermal products business unit
Almere, the NetherlandsPhoenix, AZ, US
Plasma products business unit
Tokyo, JapanCheonan, South Korea
Researchfacilities
Leuven, BelgiumHelsinki, Finland
Manufacturing
Singapore
PATENTS At ASMI, we have been an innovation leader for nearly 50 years. We have not only contributed to the remarkable advance of the semiconductor industry; we have shaped the industry itself. Through a series of breakthrough innovations in technologies such as plasma deposition and epitaxy, and since 2000, through ALD.
CULTURE OF INNOVATIONThis culture of innovation is encouraged at every level of our organization. We attract and retain creative people from all over the world to work for us, who then ensure we create a steady stream of innovations that we bring into volume manufacturing by cooperating closely with customers from the outset.
CAPTURING IDEAS EFFICIENTLYWe have Intellectual Property managers at all our major global R&D sites, ready to capture all patentable material resulting from our R&D activities. We file between 50 and 100 initial patents every year and now have over 1,200 patents in force. The number of patents we own is steadily increasing year after year.
In particular, we have hundreds of issued patents relating specifically to the ALD process technology platform. We expect new deposition technologies and chemistries to be a major driver for new intellectual property into the future. Patents provide us the protection to speak more openly about our inventions and share ideas in the marketplace that benefit our customers. Our patents are usually registered in the principal countries where semiconductor devices or equipment are manufactured and/or sold.
ASM INTERNATIONAL | STATUTORY ANNUAL REPORT 2014
OUR COMPANY | ABOUT 5

PATENTS IN FORCE
20112009 2010 2012 2013 2014
INITIAL PATENT FILINGS
20112009 2010 2012 2013 20140
20
40
60
80
100
6163
51
34
46
661,166
1,0811,050935
798
1,266
0
400
800
1,200
1,600
2,000
TRADEMARK LIST AS OF JANUARY 1, 2015We have registered a number of trademarks covering our product portfolio in the principal countries.
ASM, the ASM International logo, Advance, Aurora, Dragon, Eagle, EmerALD, Epsilon, Intrepid, Polygon, Pulsar and Silcore are registered trademarks of ASM International NV. A400, A412, ALCVD, Atomic Layer CVD, Horizon, Loadstar, Medallion, NCP, PEALD, Previum are our trademarks. ‘The Switch Is On’ and ‘Drive Innovation. Deliver Excellence.’ are our service marks.
ASM INTERNATIONAL | STATUTORY ANNUAL REPORT 2014
OUR COMPANY | ABOUT 6

AT A GLANCE
ASM International NV (‘ASMI’) is a leading supplier of semiconductor wafer processing equipment and process solutions. Our customers include all of the top semiconductor device manufacturers in the world. We help them create faster, cheaper and more powerful semiconductors that bring greater opportunities for people to understand, create and share more.
ORGANIZATION STRUCTURE ASMI organizes its activities in two operating segments, Front-end (wafer processing) and Back-end (assembly and packaging).
ASM INTERNATIONALHEADQUARTERS: ALMERE, THE NETHERLANDS
ASMWaFEr proCEssing
ASM PACIFIC tECHNOLOGYASSEMBLY & PACKAGING
SURFACE MOUNT TECHNOLOGY39.75% ownErship
TICKER: EURONEXT: ASMNASDAQ: ASMI
HIGHLIGHTS
NET EARNINGS*EUR million
141RESULT ON INVESTMENTs*EUR million
62 2.49OPERATIONAL CASH FLOWEUR million
125
STAFFFTE
1,635
BOOKINGSEUR million
602NET SALESEUR million
546
386
OPERATING RESULT(EBIT)EUR million
EARNINGS PER SHARE*(DILUTED)
93
CASHEUR million
(NO DEBT)
* Excluding effects sale ASMPT shares
ASM INTERNATIONAL | STATUTORY ANNUAL REPORT 2014
OUR COMPANY | AT A GLANCE 7
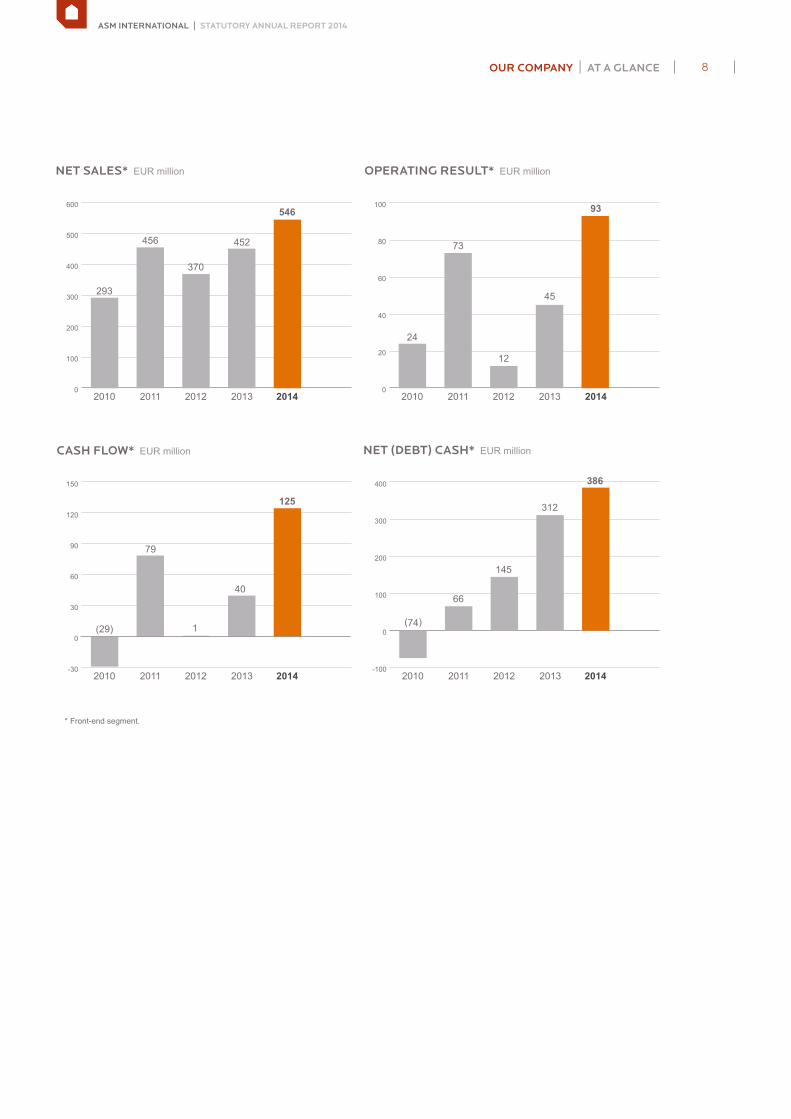
456
293
370
452
546
(29)
79
1
40
125
OPERATING RESULT* EUR million
NET (DEBT) CASH* EUR million
NET SALES* EUR million
CASH FLOW* EUR million
* Front-end segment.
(74)
66
145
73
24
12
45
93
386
312
20112010 2012 2013 20140
100
200
300
400
500
600
20112010 2012 2013 2014-30
0
30
60
90
120
150
20112010 2012 2013 2014-100
0
100
200
300
400
20112010 2012 2013 20140
20
40
60
80
100
ASM INTERNATIONAL | STATUTORY ANNUAL REPORT 2014
OUR COMPANY | AT A GLANCE 8

KEY FIGURES
EUR EUR EUR EUR EUR
(millions, except per share data and full-time equivalents) 2010 2011 2012 2013 3) 2014
Operations
Net sales
Front-end 293 456 370 452 546
Back-end 930 1,178 1,048 160 -
Result from operations
Front-end 24 73 12 45 93
Back-end 313 304 87 (4) -
Net earnings (loss) from continuing operations 243 316 40 (343) 138
Net earnings (loss) from discontinued operations 1,405 3
Net earnings (loss) from operations 1,062 141
Balance sheet
Net working capital 1) 289 430 477 109 108
Total assets 1,214 1,582 1,500 1,608 1,889
Net cash 2) 125 215 230 312 386
Backlog:
Front-end 163 105 92 115 176
Back-end 337 226 198 - -
Number of staff
Full-time equivalents
Front-end 1,450 1,631 1,636 1,502 1,635
Back-end 15,249 14,563 15,768 - -
Per share data
Net earnings (loss) on operations per share
Basic net earnings (loss) 2.26 3.52 0.28 16.81 2.23
Diluted net earnings (loss) 2.22 3.27 0.28 16.55 2.20
Weighted average number of shares used in computing per share amounts (in thousands)
Basic 52,435 55,210 56,108 63,202 63,510
Diluted 62,316 64,682 56,767 64,196 64,209
1 Net working capital includes accounts receivable, inventories, other current assets, accounts payable, provision for warranty and accrued expenses and other. Since 2009 Evaluation tools at customers are no longer reported under inventories but under non-current assets. The historical figures have been adjusted for this reclassification.
2 Net cash includes cash and cash equivalents less long-term debt, convertible subordinated debt, the conversion option and notes payable to banks.3 ASMPT (Back-end) was deconsolidated as from March 15, 2013
ASM INTERNATIONAL | STATUTORY ANNUAL REPORT 2014
OUR COMPANY | AT A GLANCE 9
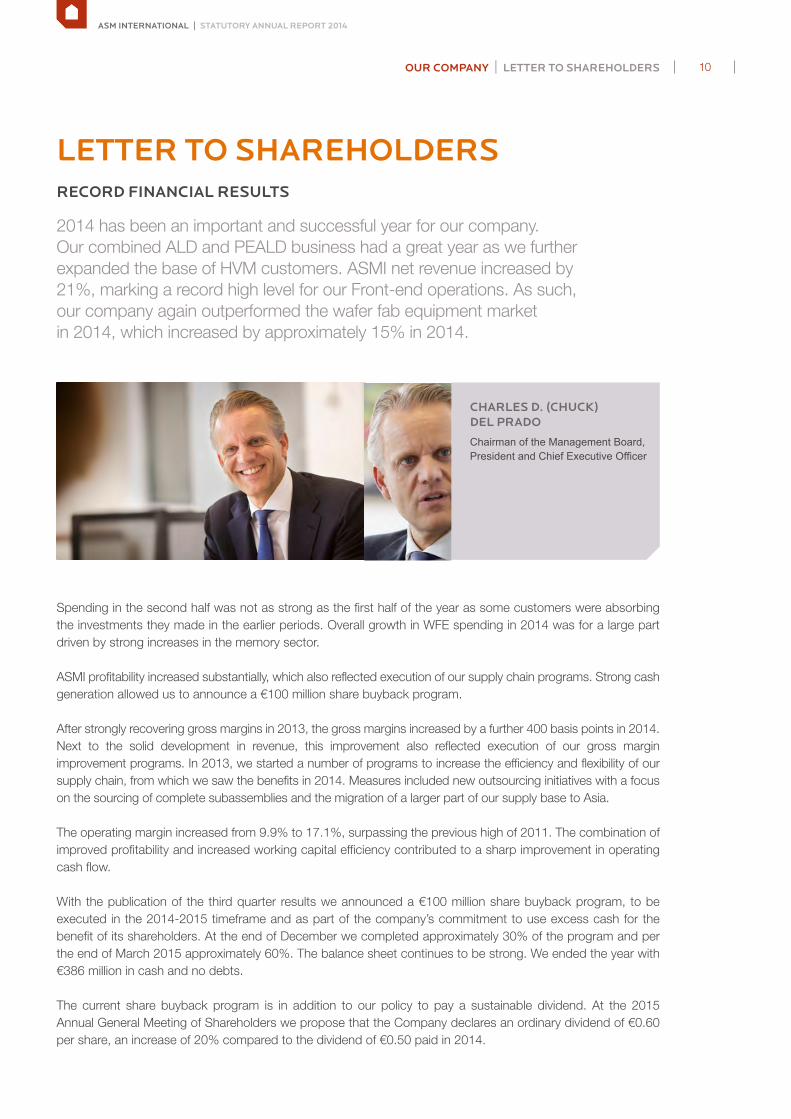
LETTER TO SHAREHOLDERSRECORD FINANCIAL RESULTS
2014 has been an important and successful year for our company. Our combined ALD and PEALD business had a great year as we further expanded the base of HVM customers. ASMI net revenue increased by 21%, marking a record high level for our Front-end operations. As such, our company again outperformed the wafer fab equipment market in 2014, which increased by approximately 15% in 2014.
CHARLES D. (CHUCK) DEL PRADO Chairman of the Management Board, President and Chief Executive Officer
Spending in the second half was not as strong as the first half of the year as some customers were absorbing the investments they made in the earlier periods. Overall growth in WFE spending in 2014 was for a large part driven by strong increases in the memory sector.
ASMI profitability increased substantially, which also reflected execution of our supply chain programs. Strong cash generation allowed us to announce a €100 million share buyback program.
After strongly recovering gross margins in 2013, the gross margins increased by a further 400 basis points in 2014. Next to the solid development in revenue, this improvement also reflected execution of our gross margin improvement programs. In 2013, we started a number of programs to increase the efficiency and flexibility of our supply chain, from which we saw the benefits in 2014. Measures included new outsourcing initiatives with a focus on the sourcing of complete subassemblies and the migration of a larger part of our supply base to Asia.
The operating margin increased from 9.9% to 17.1%, surpassing the previous high of 2011. The combination of improved profitability and increased working capital efficiency contributed to a sharp improvement in operating cash flow.
With the publication of the third quarter results we announced a €100 million share buyback program, to be executed in the 2014-2015 timeframe and as part of the company’s commitment to use excess cash for the benefit of its shareholders. At the end of December we completed approximately 30% of the program and per the end of March 2015 approximately 60%. The balance sheet continues to be strong. We ended the year with €386 million in cash and no debts.
The current share buyback program is in addition to our policy to pay a sustainable dividend. At the 2015 Annual General Meeting of Shareholders we propose that the Company declares an ordinary dividend of €0.60 per share, an increase of 20% compared to the dividend of €0.50 paid in 2014.
ASM INTERNATIONAL | STATUTORY ANNUAL REPORT 2014
OUR COMPANY | LETTER TO SHAREHOLDERS 10

ANOTHER STRONG YEAR FOR OUR COMBINED ALD AND PEALD BUSINESS Following several years of rapid growth in customer deployment and the development of new applications ALD and PEALD has turned into a key growth driver for our company. Our combined ALD and PEALD product lines accounted for more than half of total equipment revenue in 2014. Over time we have established ALD and PEALD as mainstream technologies for the advanced nodes in close cooperation with several of the world’s leading semiconductor manufacturers. Some of our leading customers have already ramped multiple technology generations using our ALD equipment. In the more recent years, we have successfully penetrated additional customers. In 2014, we have seen several of these new customers deploying our ALD and PEALD systems for the first time in substantial volumes.
Driven by the success of our ALD and PEALD technologies, we have steadily expanded our presence in the logic/foundry segment and also built strong customer relationships in the memory sector. Our PEALD equipment is an enabling technology for spacer-defined double patterning, which supports our customers in staying on Moore’s Law. With this application we have achieved a strong position with virtually all of the leading memory customers. On the back of our increased exposure to the memory segment we were able to take full advantage of the strong demand from memory customers for leading edge equipment during the year.
CORPORATE RESPONSIBILITY In 2014 we have stepped up our efforts to become a leader in responsible, sustainable business practices. During the year, we established a dedicated internal Corporate Responsibility organization. We also made significant progress on embedding the Electronics Industry Citizenship Coalition (‘EICC’) Code of Conduct throughout our organization and into our supply chain, led by the formation of a Senior Management EICC Committee. In 2015, we are also releasing our first Corporate responsibility report with the 2014 Annual report.
ASMPT In March 2013, we sold 12% of the total ASMPT shares outstanding, reducing our stake from 52% to approximately 40%. At that time, we returned the largest part of the proceeds to our shareholders and used the balance to strengthen our financial position. As of the date of the stake sale we deconsolidated the back-end business and since then our consolidated results only reflect our Front-end operations.
We believe this step has increased the visibility of the strong performance of our Front-end business in the market and contributed positively to shareholder value creation.
Our 40% shareholding in ASMPT contributed positively to the increase in ASMI’s normalized net earnings in 2014. 2014 marked a year of strong recovery for ASMPT. From a leadership in the market for traditional Back-end equipment ASMPT has expanded in recent years its addressable market to include SMT equipment, which it further strengthened by the acquisition of DEK in 2014. On the back of the rise in revenue and improving margins, ASMPT increased net profits threefold during the year.
The overall strong performance of ASMI in 2014 strengthens us in our belief that we have taken the right strategic steps over the last years, aimed at creating sustainable value for our shareholders, customers, employees and the communities in which we operate.
OUTLOOKThe semiconductor wafer fab equipment market has started the year 2015 with good momentum, with healthy spending in DRAM, on the 20nm node, and NAND flash on the 18-16nm node. Industry observers expect mid-single digit growth year-over-year for our industry in 2015. While in the logic/foundry sector wafer fab equipment spending is expected to be driven by investments in the 16nm and 14nm nodes, the exact timing of these investments is still uncertain.
ASM INTERNATIONAL | STATUTORY ANNUAL REPORT 2014
OUR COMPANY | LETTER TO SHAREHOLDERS 11

Smartphones are again expected to account for the largest part of the semiconductor market growth thanks to continued volume growth and enhanced functionality. A new long-term driver is emerging in the form of the Internet-of-Things. Advanced connectivity of devices will be the next step in our increasingly connected future. The infrastructure needed to process and store the data created by an ever higher number of connected devices will also increase the demand for more advanced semiconductor devices.
Our customers continue executing their roadmaps towards ever smaller, faster and more power efficient semiconductor devices. Complex node migrations are more and more enabled by the introduction of new materials and three-dimensional chip architectures such as FinFET. The need for more precise and highly conformal thin films at the next generation technology nodes is expected to drive a further increase in the use of ALD and PEALD. As a market leader in ALD we are well positioned for further growth.
We are proud of the outstanding commitment and hard work of all our employees that contributed to another year of success and achievement. We are also grateful for the trust of our customers and the continued support of our shareholders. Our focus remains the creation of sustainable value for all our stakeholders.
April 9, 2015
Charles D. (Chuck) del Prado President and Chief Executive Officer
ASM INTERNATIONAL | STATUTORY ANNUAL REPORT 2014
OUR COMPANY | LETTER TO SHAREHOLDERS 12

STRATEGY & FOCUS AREAS
At ASMI, our track record as experienced innovation leaders is a result of focusing on key issues on the semiconductor technology roadmap – the areas where we can make the greatest difference to our customers. These issues may change over time but one thing will always remain the same – we will keep bringing the results of our breakthrough technologies through to volume manufacturing for the benefit of our customers.
MISSION AND STRATEGYOur mission and vision guide our activities, our current strategy describes how we will achieve our mission, and our focus areas indicate where we will invest our energy. The markets we address and the products we target in these markets fall within our focus areas.
MISSIONASMI’s mission is to provide our customers with the most advanced, cost-effective, and reliable products, service and global support network in the semiconductor industry and beyond. We bring forward the adoption of our technology platforms by developing new materials and process applications that support our customers’ long-term technology roadmaps. Since atomic layer deposition (‘ALD’) provides us with a basic platform for a whole new generation of technologies and processes, it acts as a strategic enabler for our business.
VISIONWe aim to delight our customers, employees and shareholders by driving innovation with new technologies and delivering excellence with dependable products. By doing this, we will create new possibilities for everyone to understand, create and share more of what they love.
STRATEGYOur strategic objective is to realize profitable, sustainable growth by capitalizing on our innovative strength, operational excellence and our leadership in ALD and other business segments we are active in. The key elements of our strategy include:
> Innovative strengthASMI has always been recognized for its technology leadership. Today, we provide leading technologies that support our customers in staying on the curve of Moore’s Law. Our innovative strength is what differentiates us in the marketplace and continues to be the cornerstone of our strategy. Apart from our internal R&D efforts we are continuously expanding and deepening our strategic cooperation with key customers, suppliers, chemicals manufacturers and research institutes such as imec. We also expand our patent portfolio where it is necessary and beneficial.
> Leadership in ALDALD and PEALD technologies have been established as mainstream technologies in high volume manufacturing, supporting virtually all of the leading customers in the semiconductor industry. As a leader in this space, ALD and PEALD have turned into a key growth driver for our business. We expect that the trends of continued scaling and evolution towards 3D device structures will further expand the number of applications for ALD. We aim to maintain our leading position in ALD by leveraging on our strong expertise and established customer relationships, and by developing new applications to support our customers with increasingly complex device node transitions.
ASM INTERNATIONAL | STATUTORY ANNUAL REPORT 2014
OUR COMPANY | STRATEGY & FOCUS AREAS 13

> Operational excellenceWhile technology leadership remains crucial, we continue to focus on further improving the effectiveness of our organization and the efficiency of processes. We aim to provide our customers with dependable leading-edge products and services at a consistent quality and the best cost of ownership. To this end, we continue to optimize our manufacturing and global sourcing processes, including the migration to common product platforms.
Innovative strength
Operational excellence Consistent leading-edge products & services
Continued scaling & 3D evolution
Co-creation & competitive edge
KEY ELEMENTS
HOW WE WILLDO THIS
THE IMPACT
OUR STRATEGY
Investing in our own R&D, as well as continuously expanding and deepening our strategic cooperation with key customers, suppliers, chemicals manufacturers and research institutes.
Focus on leveraging on our strong expertise and established customer relationships, and by developing new applications to support our customers with increasingly complex device node transitions.
Continue to optimize our manufacturing and global sourcing processes, including the migration to common product platforms.
Leadership in ALD
ASM INTERNATIONAL | STATUTORY ANNUAL REPORT 2014
OUR COMPANY | STRATEGY & FOCUS AREAS 14

FOCUS AREASWithin wafer processing, we focus primarily on equipment and process solutions for the deposition of thin films.
Our core strengths are in atomic layer deposition (‘ALD’), plasma enhanced ALD (‘PEALD’), epitaxy, plasma enhanced chemical vapor deposition (‘PECVD’), low pressure chemical vapor deposition (‘LPCVD’) and oxidation/diffusion. With this portfolio of technologies, we are addressing many of the key areas on the semiconductor industry roadmap, including: › high-k metal gate; › new applications for advanced FinFET transistors; › dielectrics for spacer-defined double patterning; › low-k dielectrics for interconnect; and › strained silicon.
Our breakthrough technologies enable the industry to move to smaller line widths and better transistors that use new materials. In addition to addressing the technology needs of our customers, and in order to meet the requirements of the industry to reduce cost, we focus on further increasing equipment throughput and equipment reliability, further lowering the cost per wafer of our wafer processing systems. In addition, in order to enable further efficiencies in our manufacturing process, we spend significant effort on improving the level of standardization in our equipment portfolio by migrating to common platforms, sub-assemblies and components.
MARKETS & PRODUCTSASMI is a leading player in the market for semiconductor manufacturing equipment. The semiconductor capital equipment market is composed of three major market segments: wafer processing equipment, assembly and packaging equipment, and test equipment. We operate in the semiconductor wafer processing equipment market.
MARKETSOur semiconductor wafer processing business supplies equipment to the leading semiconductor manufacturers in the logic, foundry and memory markets, primarily for the deposition of thin films. The logic market is made up of manufacturers who create chips that are used to process data, the foundry market consists of businesses that operate semiconductor fabrication plants to manufacture the designs of other semiconductor companies, and the memory market covers manufacturers who make chips that store information either temporarily or permanently such as Random Access Memory (‘RAM’). We also supply equipment to leading manufacturers of analog semiconductor devices that are important for enabling the increasing semiconductor content in most products in use worldwide.
We have a strong position in leading-edge technologies. Our portfolio of atomic layer deposition (‘ALD’) products is an enabling technology for our customers, helping them to manufacture semiconductor devices at smaller line widths with new materials and 3D architectures. These new semiconductor devices are a major driver behind the introduction of new products such as smartphones and tablets with higher performance and reduced energy consumption.
PRODUCTSOur wafer processing products come from a number of product platforms, each designed to host and enable specified process technologies. Products in each product platform are linked by common technology elements like a common in-system software framework, common critical components or similar logistics (batch or single wafer processing).
The XP is our standard single wafer processing platform. It is designed to accommodate ALD, PEALD, PECVD and epitaxy process application modules with common platform standards. The XP8 is a high productivity platform for PECVD and PEALD. It is based on our common XP platform standard with an expanded configuration that enables up to eight chambers to be integrated on one wafer-handling platform. The A400 and A412 are our batch vertical furnace products offering oxidation/diffusion, LPCVD and ALD.
ASM INTERNATIONAL | STATUTORY ANNUAL REPORT 2014
OUR COMPANY | STRATEGY & FOCUS AREAS 15

TECHNOLOGY & INNOVATION
ASMI is a leading supplier of semiconductor process equipment for wafer processing. Our broad portfolio of innovative technologies and products is being used right now by the most advanced semiconductor fabrication plants around the world. Helping them to achieve their technology roadmap. Making integrated circuit chips smaller, faster and more powerful for everyone.
CREATING POSSIBILITIESWe have a proven track record of innovation that spans a wide range of technologies that have become standard among the top semiconductor manufacturers in the world. Using these technologies enables them to create semiconductors the size of a thumbnail, today, that are more powerful than computers the size of a small car were a few decades ago. Progress has been fast and the pace unrelenting. Our ability to bring innovations from R&D into volume manufacturing is as sought after now as it was when we were founded in 1968.
INNOVATIVE TECHNOLOGIES, RELIABLE RESULTSAt ASMI, we have grown by meeting customer demand for more sophisticated wafer processing. From the very start of the semiconductor industry to the present day, we have helped to keep our customers delivering in line with Moore’s Law, by developing ever more sophisticated technologies to put more transistors on a single chip.
LAYERINGIn order to create ever smaller components on a chip, the industry had to invent new process technologies. ASMI’s atomic layer deposition (‘ALD’) technology is one of these advancements. ALD is a surface-controlled layer-by-layer process that results in the deposition of thin films one atomic layer at a time, which enables precise control of film thickness and chemical composition.
BREAKTHROUGH TECHNOLOGIESWe were one of the first companies to have the vision to realize the potential of atomic layer deposition (‘ALD’) technology for the semiconductor industry. In 1999, we acquired Microchemistry in Finland, forming ASM Microchemistry. Originally developed for use in the flat panel display industry, ALD had already been researched for various applications for over 20 years. We dedicated a further eight years R&D to turning it into a process that could be used reliably and efficiently by advanced semiconductor chip manufacturers.
Precursor
By product
By productOxidant
1
4 3
2
PURGE
ALD CYCLE
PURGE
ATOMIC LAYER DEPOSITION
ASM INTERNATIONAL | STATUTORY ANNUAL REPORT 2014
OUR COMPANY | TECHNOLOGY & INNOVATION 16

INCREDIBLE PRECISIONWhat benefits does ALD bring? Using ALD allows semiconductor manufacturers to form thin films atom by atom, assuring incredible precision. Creating nanoscale structures and devices with unique properties to meet the challenges posed by very small dimensions.
To put it in perspective, a 22 nanometer (‘nm’) transistor is roughly 3000 times thinner than a single hair. And a single strand of human DNA is 2.5 atoms wide. ALD creates films as thin as a single atom thick. Building devices, atom by atom, gives us very precise control over the process. It means we can deposit materials at a uniform thickness over all types of topographies. Such precision also enables the use of materials that could not be considered before.
ALD – A DRIVER OF FUTURE GROWTHUsing ALD, we are now able to deposit new materials several atoms thick on wafers at low temperatures, producing ultra-thin films of exceptional quality and uniformity. In plasma ehanced ALD (‘PEALD’), a plasma is used to further enhance the process. Using ALD technology, we have been able to scale devices to smaller dimensions while reducing the power consumption of transistors. All of which helps to keep the industry on Moore’s Law.
ALD is now our basic platform for the development of a wide range of new materials. Our research centers in Finland, the US, Japan, South Korea, the Netherlands, and Belgium are all working on ALD. We are also conducting joint research projects with Europe’s largest independent research institute imec. All this is helping to make ALD one of the principal drivers of future growth in microelectronics.
ALD IS NOW MAINSTREAMALD and PEALD are now both mainstream technologies used in volume manufacturing in the semiconductor industry. ASMI’s ALD technology is now being used to build a wide range of applications such as leading-edge products like high-performance computers as well as wireless handheld smart devices. The results of ALD are everywhere in the world around us.
Enhancing innovationPlasma enhanced ALD (‘PEALD’) is another in the line of ASMI innovations. It widens the spectrum of materials that can be deposited. Its capability to deposit materials at temperatures as low as room temperature makes it possible to carry out processes on temperature-sensitive substrates like photoresist. This technology is currently in use for spacer-defined double patterning (‘SDDP’). A technique that can reduce device dimensions at 32nm and below, postponing the need for new lithography technologies. This is just one example of how ALD continues to open up new possibilities for further process breakthroughs.
GLOBAL RESEARCH AND DEVELOPMENTThe key to our success lies in our commitment to research and development (‘R&D’). We maintain the widest and most diverse ALD development organization in the industry. We are active at all stages in its life cycle, from developing the basic chemistry to implementing at our customer’s production sites. Our research centers in Finland, US, Japan, South Korea, the Netherlands, and Belgium are all working on ALD. We also have joint research projects with Europe’s largest independent research institute, imec, in Belgium. ASMI is a truly global company. Diversity means that we get the benefit of wider viewpoints while being able to bring together the best minds in the world to create new breakthroughs. We will continue to expand the scope and depth of our research and development capabilities through strategic alliances with independent research institutes, universities, customers and suppliers. We will also keep expanding our patent portfolio where necessary and beneficial.
ASM INTERNATIONAL | STATUTORY ANNUAL REPORT 2014
OUR COMPANY | TECHNOLOGY & INNOVATION 17

SUSTAINABLE GROWTH FOR THE NEXT DECADEThis is just the beginning. Fundamentally, ALD has been around for 30 years, but as a technology in semiconductor manufacturing it is still relatively new. We expect it to be one of the principal drivers of growth in microelectronics over the coming decade. At ASMI, we will continue to develop the huge potential of ALD in support of the semiconductor industry. Helping the industry to support future demands from consumers.
CHIP MAKINGSemiconductors are everywhere. In the dishwashers, microwaves and TVs in our homes. In our smartphones, PCs and tablets. In our workplaces and in the transportation we use – cars, trains, ships and planes. Driving the everyday devices we have come to take for granted for nearly 50 years. Their use has revolutionized how we live, work and play. Enabling us to understand, create and share information faster and more easily. We now assume that devices will get more powerful and ever smaller every year. But, despite this, how semiconductors are actually made remains a mystery to the general public. To explain how this works, let’s take a look at how a chip is made. There are two basic parts to chip manufacturing. We refer to them as wafer processing and assembly and packaging. ASMI is an equipment supplier for the Front-end part: wafer processing. During wafer processing – the start of the manufacturing ‘line’ – manufacturers process wafers made of silicon, on which the electrical components are formed. During assembly and packaging – the end of the manufacturing ‘line’ – the wafers are divided up into individual chips and tested before being assembled and packaged.
CHIP MAKING PROCESS
4
7 8 9
2
5
3
6
1
ASM INTERNATIONAL | STATUTORY ANNUAL REPORT 2014
OUR COMPANY | TECHNOLOGY & INNOVATION 18

1. FROM SAND TO PURE SILICONIt all starts with one simple, common substance – sand. The silicon found in sand is in the form of silicon dioxide. To make chips, manufacturers need pure silicon so the first step in the process is to separate the silicon from the oxygen molecules. The pure silicon needed to make silicon chips can have only one foreign atom for every billion silicon atoms. It must also be in mono-crystalline form. The way atoms are organized in this form of silicon is essential to some of the later processes.
2. WAFER BLANKSThe silicon is then extracted, or pulled, from liquid silicon in the form of long cylindrical ingots at around 1,400 degrees centigrade.
3. WAFERS ARE CUTWafers are cut from the ingots before being polished to produce a smooth surface. They are then sent to chip manufacturers for processing. The following steps in wafer processing are then repeated many times to create the finished wafer containing chips.
4. COATING A WAFERThe wafer is put into a high-temperature furnace and exposed to oxygen, forming a layer of silicon dioxide on the surface. Then chemical vapor deposition (‘CVD’) is used to add a layer or film of nitride.
5. CREATING MASKSOnce the circuit layout of the chips has been designed, glass plates or masks are created which help copy the design onto the surface of the wafer. Several masks are used in sequence to add more and more complexity to the chips.
6. ADDING A PATTERNNow it’s time to begin creating the design on the surface of the wafer using the masks as a guide. Photolithography, a type of optical printing, is used. The wafer is first coated with photoresist, that changes when exposed to ultraviolet (‘UV’) light. The mask is placed above the wafer and precisely aligned with it. UV light shining above the mask reacts with the exposed parts of the photoresist, creating a pattern. The wafer is covered with a developing solution to develop these patterns, that are then etched, leaving the parts not exposed to UV light intact. The surface now contains ‘trenches’ that run across the surface.
DepositionA dielectric or insulating film is deposited in the trenches by one of a number of deposition technologies such as chemical vapor deposition (‘CVD’), atomic layer deposition (‘ALD’) or plasma enhanced ALD (‘PEALD’). Gates are formed between the trenches, creating part of the many millions of transistors that may be created on a single chip. Gates can be switched to allow charge carriers like electrons to flow or to prevent them from flowing. Contacts are formed by each gate to create a source and drain. Ion implantation is used to implant special elements into the wafer for the source and drain. The charge carrier enters a gate channel at the source contact and exits at the drain contact.
ConnectOnce the basic chip components have been created, they need to be connected. The same processes of lithography, etching and deposition are used to form trenches filled with metal connections. These connections between components are created not just on one level but on many. The finished wafer will contain up to several thousand individual chips in a space of 200 to 300mm, and some chips can hold billions of transistors.
ASM INTERNATIONAL | STATUTORY ANNUAL REPORT 2014
OUR COMPANY | TECHNOLOGY & INNOVATION 19

7. WAFERS SEPARATED INTO INDIVIDUAL CHIPSOnce wafer processing has been completed, the finished wafers are transported to another plant for cutting, assembly and packaging. The individual wafers are cut into separate chips.
8. LEAD FRAMESThe chips are then placed in a lead frame forming a protective housing.
9. TESTING PACKINGEach chip is then tested before being packaged to be sent for placement on circuit boards.
SUMMARYThe equipment and processes used to create chips are very complex and draw on leading-edge research. But the objective is simple. To keep enabling us to understand, create and share more of what people love.
ASM INTERNATIONAL | STATUTORY ANNUAL REPORT 2014
OUR COMPANY | TECHNOLOGY & INNOVATION 20

CONNECTING THE FUTURE
Content available mid March
ASM INTERNATIONAL | STATUTORY ANNUAL REPORT 2014
1OUR COMPANY | CONNECTING THE FUTURE
CONNECTINGTHE FUTURE
VALUE-DRIVEN INNOVATION SHAPING TOMORROW EXISTING EVERYWHERE
THE DESIRE TO BE FULLY
CONNECTED AT ALL TIMES
IS EXPLODING.
THIS IS DRIVING THE DEMAND
FOR SMALLER, FASTER, CHEAPER
CHIPS. WE ARE COMMITTED
TO DEVELOPING INNOVATIVE
SOLUTIONS THAT HELP TO ENABLE
MANY OF THE PRODUCTS WITHIN
THE INTERNET OF THINGS.
ASM INTERNATIONAL | STATUTORY ANNUAL REPORT 2014
OUR COMPANY | CONNECTING THE FUTURE 21

VALUE-DRIVEN INNOVATION SHAPING TOMORROW EXISTING EVERYWHERE
ASM INTERNATIONAL | STATUTORY ANNUAL REPORT 2014
2OUR COMPANY | CONNECTING THE FUTURE
VALUE-DRIVEN INNOVATIONInnovation and collaboration go hand-in-hand. Value-driven innovation is required to sustain the industry, and we believe in an industry that collaborates from the start. We also believe that we need to be closely integrated with our customers’ technology roadmaps. The result? We help them continue to offer ever greater computing power at lower costs, enabling applications that will create a better future for everyone.
INNOVATIONCUSTOMER
DEMANDNEW MATERIALS3D TECHNOLOGY
MORE DEVICES CONNECTIVITY SUSTAINABILITY
ASM INTERNATIONAL | STATUTORY ANNUAL REPORT 2014
OUR COMPANY | CONNECTING THE FUTURE 22

VALUE-DRIVEN INNOVATION SHAPING TOMORROW EXISTING EVERYWHERE
SHAPING TOMORROWWe invest in the best. To prosper, we need talented people who are true innovators. People who are able to provide our customers with a constant supply of value-added solutions. People who share our fascination and passion for the future, but want answers today. At ASM, we start by connecting atoms and end up connecting the world. To help us do this, we are always looking for the best and the brightest graduates.
ASM INTERNATIONAL | STATUTORY ANNUAL REPORT 2014
3OUR COMPANY | CONNECTING THE FUTURE
ASM INTERNATIONAL | STATUTORY ANNUAL REPORT 2014
OUR COMPANY | CONNECTING THE FUTURE 23

VALUE-DRIVEN INNOVATION SHAPING TOMORROW EXISTING EVERYWHERE
EXISTING EVERYWHERE
ASM INTERNATIONAL | STATUTORY ANNUAL REPORT 2014
4OUR COMPANY | CONNECTING THE FUTURE
The Internet of Things (IoT) will have a profound impact on the semiconductor industry. Pervasive computing will create smart products that communicate unobtrusively. Products are interconnected and the data they generate is easily available. This will help address complex business, healthcare and education issues facing society. With our advanced technologies we are committed to developing innovative solutions that help to enable many of the products within the IoT.
WEARABLES
BY 2020WEARABLE DEVICES MAY HELP SAVE 1.3 MILLION LIVES(SOURCE: SOREON RESEARCH)
CONNECTED CARS
BY 2020250 MILLION CONNECTED CARS ACROSS THE GLOBE(SOURCE: GARTNER INC.)
CONNECTED CITIES
BY 2020SMART CITY MARKET TO TOP1.5 TRILLION US DOLLARS(SOURCE: FROST & SULLIVAN)
INDUSTRIAL INTERNET
BY 2020GLOBAL INVESTMENT IN INDUSTRIAL IoT 500 BILLION US DOLLARS(SOURCE: ACCENTURE)
CONNECTED HOMES
BY 2020ANNUAL GROWTH RATE OF 27%(SOURCE: RESEARCH & MARKETS)
ASM INTERNATIONAL | STATUTORY ANNUAL REPORT 2014
OUR COMPANY | CONNECTING THE FUTURE 24
MANAGEMENTSUPERVISORY BOARD
JAN C. LOBBEZOO Chairman of the Supervisory Board
JOHAN M.R. DANNEELSMember of the Supervisory Board
HEINRICH W. KREUTZER Member of the Supervisory Board
MARTIN C.J. VAN PERNIS Member of the Supervisory Board
ULRICH H.R. SCHUMACHERMember of the Supervisory Board
SENIOR MANAGEMENT
CHARLES D. (CHUCK) DEL PRADOChairman of the Management Board, President and Chief Executive Officer
PETER A.M. VAN BOMMELMember of the Management Board, Chief Financial Officer
HICHEM M’SAAD (PEO HANSSON UNTIL MARCH 16, 2015)General Manager Thermal Products Business Unit, General Manager ASM America Inc and ASM Europe BV
TOMINORI YOSHIDAGeneral Manager Plasma Products Business Unit, General Manager ASM Japan KK and ASM Genitech Korea Ltd
PETER GAUDETTEVice President Operational Excellence
FOKKO LEUTSCHERVice President Global Operations
J.M.M. (IVO) RAAIJMAKERSChief Technology Officer and Director of Research & Development
RALPH OTTEVice President Global Human Resources
J.F.M. (HAN) WESTENDORPVice President Corporate Marketing
TOM WUVice President Global Sales & Services
RICHARD W. (DICK) BOWERSChief Legal Officer
HONORY CHAIRMAN
ARTHUR H. DEL PRADO Chairman of the Board of ASM Pacific Technology Ltd
ASM INTERNATIONAL | STATUTORY ANNUAL REPORT 2014
OUR COMPANY | MANAGEMENT 25

SHAREHOLDER INFORMATIONASMI’s shares are listed on the NYSE Euronext Stock Exchange in Amsterdam (symbol: ‘ASM’) where ASMI is included in the Midcap index. Our shares also trade on the Nasdaq stock exchange (symbol: ‘ASMI’).
Of our 62,718,937 outstanding common shares at March 13, 2015, 2,142,039 are registered with us in the Netherlands, 58,150,696 are registered with our transfer agent in the Netherlands, ABN AMRO Bank NV and 2,426,202 are registered with our transfer agent in the United States, Citibank, NA, New York.
MARKET CAPITALIZATION At year end, ASMI had a total of 62,968,184 outstanding. The total market capitalization of ASMI amounted to €2,210 million on December 31, 2014, based on the closing share price of €35.10 at Euronext Amsterdam on the corresponding day.
The average daily trading volume of ASMI shares on Euronext Amsterdam amounted to 208,872 in 2013.
An overview of the largest reported shareholders can be found in chapter Corporate governance on page 47.
Key figures per share
(EUR, except number of shares) 2012 2013 2014
Net earnings per share, diluted 0.28 16.55 2.20
Normalized net earnings per share, diluted 0.28 0.71 2.49
Outstanding shares (thousand) 63,096 63,468 62,968
Average shares basic 56,108 63,202 63,510
Average shares diluted 56,767 64,196 64,209
Dividend per share 0.50 0.50 0.601)
Capital distribution per share – 4.25 –
Shareholders’ equity 12.45 23.94 27.66
Closing share price Euronext Amsterdam
Year end 27.16 23.95 35.10
High 32.89 31.30 35.10
Low 22.64 22.64 23.54
1 Proposed.
2012 2013 2014
SHARE PRICE PERFORMANCE AND TOTAL SHARE RETURN %
Share price performance ASMI (Euronext Amsterdam)
Total share return ASMI (Euronext Amsterdam)-20
0
20
40
60
80
2015
ASM INTERNATIONAL | STATUTORY ANNUAL REPORT 2014
OUR COMPANY | SHAREHOLDER INFORMATION 26

DIVIDENDS AND CAPITAL REPAYMENTASMI aims, as part of its financing policy, to pay a sustainable annual dividend.
In 2012, 2013 and 2014 we paid a dividend of €0.50 per common share.
We intend to propose to the forthcoming 2015 Annual General Meeting of Shareholders (‘AGM’) to declare a dividend of €0.60 per share.
2011 2012 2013 201400.40 0.50 0.50
4.25
0.50
DIVIDEND PAID EUR
Ordinary dividend per share
Extraordinary capital distribution per sale0
1
2
3
4
5
2015*
* Proposed.
0.60
In addition, ASMI distributed €4.25 per ordinary share to its shareholders in July. This followed on the sale of 12% of the total shares in ASMPT in March 2013.
SHARE BUYBACK PROGRAM 2014-2015 On October 29, 201 4, ASMI announced a share buyback program, to purchase up to an amount of €100 million of its own shares within the 2014-2015 time frame. The repurchase program is part of ASMI’s commitment to use excess cash for the benefit of its shareholders. ASMI intends to use part of the shares for commitments under employee share -based compensation schemes. The program does not include the repurchase of ASMI’s Nasdaq-listed New York Registry Shares.
The program started on November 24, 2014, and will end on completion of the program but ultimately on November 20, 2015. Up until December 31, 2014, we repurchased in total 953,552 shares for a total amount of €31.9 million.
ANNUAL GENERAL MEETING OF SHAREHOLDERSThe Annual General Meeting of Shareholders will be held on May 21, 2015.
ASM INTERNATIONAL | STATUTORY ANNUAL REPORT 2014
OUR COMPANY | SHAREHOLDER INFORMATION 27

FINANCIAL CALENDAR
APRIL 23, 2015Announcement of first quarter results 2015
JULY 29, 2015Announcement of second quarter results 2015
OCTOBER 28, 2015Announcement of third quarter results 2015
INVESTOR RELATIONS CONTACTS
VICTOR BAREÑOAlmere, the Netherlands T: +31 88 100 8500 E: [email protected]
MARY JO DIECKHAUS, DD&W LTDNew York, NY, United States T: +1 212 986 2900 E: [email protected]
ASM INTERNATIONAL | STATUTORY ANNUAL REPORT 2014
OUR COMPANY | SHAREHOLDER INFORMATION 28

LOCATIONS WORLDWIDEEUROPE
THE NETHERLANDSASM International NV (HEADQUARTERS)Versterkerstraat 81322 AP AlmereT: +31 88 100 8810F: +31 88 100 8830
ASM Europe BVVersterkerstraat 81322 AP AlmereT: +31 36 540 6711F: +31 36 540 6710
BELGIUMASM Belgium NVKapeldreef 753001 LeuvenT: +32 16 28 1639
FINLANDASM Microchemistry OyPietari Kalmin katu 1 F 200560 HelsinkiT: +358 9 525 540F: +358 9 525 54600
FRANCEASM France SARL223 Rue de Bécasses38920 CrollesT: +33 4 7692 2824F: +33 4 3892 0472
GERMANYASM Germany Sales BVPeter-Henlein-Strasse 2885540 HaarT: +49 89 462 3650F: +49 89 462 36566
IRELANDASM Services & Support Ireland LtdUnit 23, Hills Industrial EstateLucan, Co DublinT: +353 1 621 9100F: +353 1 628 0206
ISRAELASM Services & Support Israel LtdIntel2 Hazaron StKiryat-Gat 82109T: +972 8 6123077
NORTH AMERICA
UNITED STATESASM America, Inc3440 East University DrivePhoenix, AZ 85034-7200T: +1 602 470 5700
Regional Sales/Service Office:97 East Brokaw RoadSuite 100San Jose, CA 95112-4209T: +1 408 451 0830
Regional Service Office:2500 NW 229th AvenueSuite 100Hillsboro, OR 97124-7114T: +1 503 629 1360
ASIA
CHINAASM China LtdA/N, 15F , No 720 Pudong AvenueShanghai 200120T: +86 21 50 368588F: +86 21 50 368878
JAPANASM Japan KK23-1, 6-chome NagayamaTama-shiTokyo 206-0025T: +81 42 337 6311F: +81 42 389 7555
Kumamoto Service Center3F, Mayfair-Suizenji21-30, 1-chome, SuizenjiChuo-ku, Kumamoto-shiKumamoto, 862-0950T: +81 96 387 7300F: +81 96 387 7301
ASM INTERNATIONAL | STATUTORY ANNUAL REPORT 2014
OUR COMPANY | LOCATIONS WORLDWIDE 29

Nagaoka Factory392-1 MishimashimboNagaoka-shiNiigata 940-2311T: +81 258 42 2400 F: +81 258 41 2490
Yokkaichi Service Center2F-D, NJ Building1-7 Shimizucho, Yokkaichi-shiMie 510-0814T: +81 59 332 3537F: +81 59 332 3598
MALAYSIAASM Services & Support Malaysia Sdn BhdSuite 17 and 18, First FloorIncubator Block, Kulim Techno CentreKulim Hi-Tech Park09000, Kulim Kedah Darul AmanT: +604 403 9330F: +604 403 9330
SINGAPOREASM Front-End Manufacturing Singapore Pte Ltd543 Yishun Industrial Park ASingapore 768765T: +65 6512 2922F: +65 6512 2966
ASM Wafer Process Equipment Singapore Pte Ltd543 Yishun Industrial Park ASingapore 768765T: +65 6512 2962F: +65 6512 2961
SOUTH KOREAASM Genitech Korea LtdBunDang Branch Office10F, 1-Dong, 17 , 228 st, Pankyo-roBundang-ku, Sungnam-si Kyounggi-do, 463-400T: +82 70 7596 7788F: +82 31 8016 9970
ASM Genitech Korea LtdHead OfficeSungKong-kwan 1 DongCheonan Valley, ChungNam Techno Park136, Jiksan-ro, Jiksan-eup, Seobuk-kuCheonan-si, Chungcheongnam-do, 330-858T: +82 70 7596 7800F: +82 41 5890 201
TAIWANASM Front-End Sales & Services Taiwan Co, LtdHsin-Chu Office2F-5, No 1, Jinshan 8th StEast Dist, Hsinchu City 300T: +886 3 666 7722F: +886 3 564 8899
ASM Front-End Sales & Services Taiwan Co, LtdTai-Chung OfficeNo 20-2, Ln 1230, Sec 4, Taiwan BlvdXitun Dist, Taichung City 407T: +886 4 2465 1086F: +886 4 2463 3707
ASM Front-End Sales & Services Taiwan Co, LtdTai-Nan OfficeRm 612, 6F, No 13, Guoji RdXinshi Dist, Tainan City 744T: +886 6 589 2368F: +886 6 589 2710
ASM INTERNATIONAL | STATUTORY ANNUAL REPORT 2014
OUR COMPANY | LOCATIONS WORLDWIDE 30

Good corporate governance is about following sound business practices. At ASMI we do business in an ethical and transparent manner. We achieve this by setting up transparent processes and following internal policies and procedures that enable us to operate in the best interests of all our stakeholders, and which comply with applicable US and Dutch corporate governance requirements, as far as is possible and desirable.
CORPORATE GOVERNANCE
SUPERVISORY BOARD Top left to rightJ.C. Lobbezoo - Chairman, J.M.R. Danneels, H.W. Kreutzer
Bottom left to rightM.C.J. van Pernis, U.H.R. Schumacher
> MIS
SIO
N
>
O
BJE
CT
IVE
S
>
VISION
STR ATEGY
>
MANAGEMENT BOARD,
SUPERVISORY BOARD AND
COMMITTEES
VALUES AND ETHICS
CORPORATE GOVERNANCE
POLICIES & REGULATORY
FRAMEWORKS
MONITORING AND INTERNAL
CONTROL
RISK AND PERFORMANCE MANAGEMENT
TRANSPARENCY AND
ACCOUNTABILITY
31

GENERALASMI aspires to high standards of corporate governance and ethics practices. Sound corporate governance is a key component of ASMI’s culture, behavior and management and is consistent with our core values. Our corporate governance is supported by a strong focus on integrity, transparency and clear and timely communication. We endeavor to ensure that our policies and procedures comply with both applicable US and Dutch corporate governance requirements, to the extent possible and desirable, and that our corporate governance structure best supports our business and meets the needs of our stakeholders.
ASM International NV is a public company established under Dutch law. The company’s management and supervision structure is organized in a two-tier system, comprising a Management Board, solely composed of executive directors, and a Supervisory Board, solely composed of non-executive directors. The Company’s Management Board has ultimate responsibility for the overall management of ASMI. The Management Board is supervised and advised by an independent Supervisory Board. The Management Board and the Supervisory Board are accountable to ASMI’s shareholders.
ASMI is listed on both the Nasdaq Global Select Market (‘Nasdaq’) and the NYSE Euronext Amsterdam Stock Exchanges and required to comply with the applicable Sarbanes-Oxley Act corporate governance requirements, applicable best practices set out by Nasdaq, the US Securities and Exchange Commission (‘SEC’) and the Dutch Corporate Governance Code adopted in 2003 and amended in 2008 (‘the Code’).
Corporate governance-related documents are available on our website, these include:
> MIS
SIO
N
>
O
BJE
CT
IVE
S
>
VISION
STR ATEGY
>
MANAGEMENT BOARD,
SUPERVISORY BOARD AND
COMMITTEES
VALUES AND ETHICS
CORPORATE GOVERNANCE
POLICIES & REGULATORY
FRAMEWORKS
MONITORING AND INTERNAL
CONTROL
RISK AND PERFORMANCE MANAGEMENT
TRANSPARENCY AND
ACCOUNTABILITY
› Supervisory Board Profile; › Supervisory Board Rules; › Management Board Rules; › Audit Committee Charter; › Nomination, Selection and Remuneration Committee Charter;
› Remuneration Policy; › Code of Ethics; › Whistleblower Policy; › Anti-Fraud Policy; and › Rules concerning Insider Trading.
ASM INTERNATIONAL | STATUTORY ANNUAL REPORT 2014
CORPORATE GOVERNANCE | GENERAL 32

MANAGEMENT BOARDThe Management Board, supervised and advised by the Supervisory Board, manages ASMI’s strategic, commercial, financial and organizational matters, and appoints senior managers. The Supervisory Board appoints and discharges members of the Board of Management and establishes their individual remuneration within the boundaries of the remuneration policies approved by the General Meeting of Shareholders and the recommendations by the Nomination, Selection and Remuneration Committee.
COMPOSITION OF THE MANAGEMENT BOARD
CHARLES D. (CHUCK) DEL PRADO Chairman of the Management Board, President and Chief Executive Officer
PETER A.M.VAN BOMMEL Member of the Management Board and Chief Financial Officer
Charles D. (Chuck) del Prado - CEOMr Del Prado was appointed as a member of the Management Board in May 2006 and President and Chief Executive Officer on March 1, 2008. Between 1989 and 1996 Mr Del Prado held several marketing and sales positions at IBM Nederland NV. From 1996 to 2001 he worked in various management positions at ASML, in manufacturing and sales in Taiwan and the Netherlands. He was appointed Director Marketing, Sales & Service of ASM Europe in March 2001. From 2003 to 2007 he was President and General Manager of ASM America. From January 1, 2008 to February 29, 2008, he acted as Executive Vice President Front-end Operations at ASM America. He holds a Master’s of Science degree in Industrial Engineering and Technology Management from the University of Twente, the Netherlands. Mr Del Prado is a Dutch national.
Peter A.M. van Bommel - CFOMr Van Bommel was appointed as a member of the Management Board on July 1, 2010 and became Chief Financial Officer on September 1, 2010. Mr Van Bommel has more than twenty years of experience in the electronics and semiconductor industry. He spent most of his career at Philips, which he joined in 1979. From the mid-1990s until 2005 he acted as CFO of several business units of the Philips group. Between 2006 and 2008 he was CFO at NXP, formerly Philips Semiconductors. He was CFO of Odersun AG, a manufacturer of thin-film solar cells and modules until August 31, 2010. In April 2012 Mr Van Bommel was appointed a member of the Supervisory Board and a member of the Audit Committee of the Royal KPN NV. He holds a Master’s degree in Economics from the Erasmus University Rotterdam, the Netherlands. Mr Van Bommel is a Dutch national.
The Management Board is currently composed solely of men. The Company recognizes the importance of diversity in its members in respect to gender and makes all reasonable efforts to ensure a balanced participation by men and women in the Management Board. However, the Company has not achieved the requisite gender balance for the current Management Board because the pool of suitable candidates, in terms of relevant expertise and industry experience, is very limited at the moment. When this situation changes, the Company shall make all reasonable efforts to see that 30% of the seats of the Management Board are taken by women.
ASM INTERNATIONAL | STATUTORY ANNUAL REPORT 2014
CORPORATE GOVERNANCE | MANAGEMENT BOARD 33

RESPONSIBILITIESIn addition to the duties of the Management Board stipulated by law and our Articles of Association, the Management Board has the following responsibilities: › achieving the aims, strategy, policy and results of the Company; › managing the risks associated with the activities of the Company; › ensuring proper financing of the Company; › establishing and maintaining disclosure controls and procedures that ensure that all major financial information is known to the Management Board in order to ensure that the external financial reporting is achieved in a timely, complete and accurate manner; and › determining relevant aspects and achieving aims relating to corporate social responsibility and sustainability.
The Management Board is guided by the interests of the Company taking the interests of all stakeholders into consideration.
The members of the Management Board are collectively responsible for managing the Company. They are collectively and individually accountable to the Supervisory Board and the General Meeting of Shareholders for executing the Management Board’s responsibilities. The Management Board has the general authority to enter into binding agreements with third parties.
The Management Board shall ensure that the Company has an adequately functioning Internal risk management and Control framework. A comprehensive Risk management and Control framework, based on the ‘three lines of defense model’, has been established that allows the Audit Committee and the Management Board a clear overview of the effectiveness of internal controls and risk management. This is explained in more detail in the Risk management chapter.
The Management Board periodically discusses the internal risk management and control systems with the Supervisory Board and the Audit Committee. The Management Board provides the Supervisory Board with all information required for the fulfillment of their obligations and the exercise of their powers.
The Management Board provides the General Meeting of Shareholders with all information reasonably required for the fulfillment of its obligations and the exercise of its powers in a timely fashion. The Management Board is responsible for the quality and completeness of financial and other reports that are publicly disclosed by or on behalf of the Company, including all reports and documents the Company is required to file with regulatory agencies.
CONFLICTS OF INTERESTEach Management Board member shall immediately report any potential conflict of interest to the Chairman of the Supervisory Board and to the other Management Board members. In such cases a Management Board member shall provide the Chairman of the Supervisory Board and the other Management Board members with all information relevant to the conflict and follow the procedures as set out in the Management Board Rules.
APPOINTMENT, SUSPENSION AND DISMISSALThe General Meeting of Shareholders appoints a Management Board member based on a binding nomination drawn up by the Supervisory Board. The General Meeting of Shareholders may set aside a binding nomination by a resolution taken with an absolute majority of the votes cast, representing at least one third of the share capital. If such a binding nomination is set aside, a new binding nomination will be drawn up by the Supervisory Board and submitted to a newly called General Meeting of Shareholders. If this binding nomination is set aside, the General Meeting of Shareholders is free to appoint a Management Board member, but only with an absolute majority of the votes cast representing at least one third of our issued capital.
A Management Board member may be suspended at any time by the Supervisory Board. A Management Board member may, in accordance with a proposal by the Supervisory Board, be dismissed by the General Meeting of Shareholders through a majority vote. A resolution to suspend or to dismiss a member of the
ASM INTERNATIONAL | STATUTORY ANNUAL REPORT 2014
CORPORATE GOVERNANCE | MANAGEMENT BOARD 34

Management Board, other than in accordance with a proposal of the Supervisory Board, shall require the affirmative vote of a majority of the votes cast at a meeting. The affirmative votes must represent at least one third of the issued capital.
REMUNERATION The remuneration of individual members of the Management Board is decided upon by the Supervisory Board, based on the recommendations by the Nomination, Selection and Remuneration Committee of the Supervisory Board and on the Company’s Remuneration Policy. Our Remuneration Policy was last adopted by the General Meeting of Shareholders in 2014. The remuneration structure includes five components: a fixed (base) salary component, a variable component (annual bonus or short-term incentive), a long-term component (performance shares and stock options), pension provisions and fringe benefits. The remuneration structure reflects short-term and long-term elements of the responsibilities of members of the Management Board.
In 2011 a new stock option plan was adopted by the Company. At the 2014 Annual General Meeting of Shareholders a revision of the Company’s remuneration policy for the members of the Management Board was adopted. The purpose of the revision is to bring the remuneration policy more in line with current market standards and governance practices.
The principal revisions of the Remuneration Policy are the following: › the annual bonus for the CEO is set at up to 100% of the annual fixed salary for on target performance and up to a maximum of 150% in case of out-performance; › the annual bonus for other members of the Management Board is set at up to 75% of the annual fixed salary for on-target performance and up to a maximum of 125% in the case of out-performance; › performance shares are introduced as part of the long-term component for the Management Board; › the total value of stock options and performance shares for the CEO will be 133% of the annual base salary for on-target performance and up to a maximum of 200% of annual fixed salary in case of out-performance; › the total value of stock options and performance shares for other members of the Management Board will be 100% of the annual base salary for on-target performance and up to a maximum of 150% of annual fixed salary in the case of out-performance; › performance shares will become unconditional after three years depending on the achievement of pre-determined financial targets for those three years; and › members of the Management Board are required to hold the vested performance shares for an additional two years after vesting.
The relevant targets will be set annually by the Supervisory Board upon the recommendation of the NSR Committee. These targets will be pre-determined, assessable, influenceable and supportive of the Company’s long-term strategy in accordance with the best practices of the Dutch Corporate Governance Code.
For further information regarding the remuneration of the Management Board, please see the Remuneration Policy, which is posted on our website, the Remuneration report 2014, and the report of the Supervisory Board 2014, which is included in our Statutory annual report 2014.
In order to limit potential dilution of the long-term incentive to be awarded to the Management Board and the restricted shares to be awarded to other employees, the Supervisory Board reduced the maximum previously applicable dilution percentage of 7.5% of the issued ordinary share capital of ASMI to 5% of the issued ordinary share capital of ASMI. This previous applied dilution limit of 7.5% was applicable to the number of outstanding (vested and non-vested) stock options granted to the Management Board and other employees up to and including 2014. In order to facilitate the transition to the new share- and option-based program and to attain this dilution limit of 5%, the Supervisory Board will apply a transition period of maximum four years, during which the potential dilution may exceed 5% but will not exceed 7.5%. In addition, ASMI may repurchase outstanding shares in order to mitigate possible dilution.
ASM INTERNATIONAL | STATUTORY ANNUAL REPORT 2014
CORPORATE GOVERNANCE | MANAGEMENT BOARD 35

SUPERVISORY BOARD
Top left to rightJ.C. Lobbezoo - ChairmanJ.M.R. Danneels H.W. Kreutzer
Bottom left to rightM.C.J. van Pernis U.H.R. Schumacher
The Supervisory Board oversees strategic and commercial policymaking by the Management Board and the way in which it manages and directs ASMI’s operations and affiliated/associated companies. Members of the Supervisory Board are appointed by the Annual General Meeting of Shareholders upon binding nomination by the Supervisory Board.
COMPOSITION
NAME POSITION NATIONALITY YEAR OF BIRTHINITIAL
APPOINTMENT TERM EXPIRES
Jan C. Lobbezoo 1) 2) Chairman of the Supervisory Board Dutch 1946 2009 2017
Johan M.R. Danneels 2) Member of the Supervisory Board Belgian 1949 2000 2016
Heinrich W. Kreutzer 1) Member of the Supervisory Board German 1949 2006 2018
Martin C.J. van Pernis 2) Member of the Supervisory Board Dutch 1945 2010 2018
Ulrich H.R. Schumacher 1) Member of the Supervisory Board German 1958 2008 2016
1 Member of Audit Committee. 2 Member of Nomination, Selection and Remuneration Committee.
Jan C. LobbezooMr Lobbezoo was elected as a member of the Supervisory Board in May 2009, reappointed on May 16, 2013 for a period of four years, and Chairman of the Supervisory Board since July 2013. Mr Lobbezoo was Executive Vice President and Chief Financial Officer of the semiconductor division of Royal Philips Electronics from 1994 to 2005. He was a member of the Board of Taiwan Semiconductor Manufacturing Company (‘TSMC’) for 12 years until 2007 and remains its adviser, specifically in the areas of US corporate governance, international reporting and financial review. He is on the Board of FEI, a US-based nanotechnology equipment company, and on the one-tier Board of TMC Group NV (Non-Executive Member). He is also on the Supervisory Board of Mutracx BV (Chairman) and Point One Innovation Fund (Chairman). He holds a Master’s degree in Business Economics from Erasmus University Rotterdam, the Netherlands and is a Dutch Registered Accountant. Mr Lobbezoo is a Dutch national.
ASM INTERNATIONAL | STATUTORY ANNUAL REPORT 2014
CORPORATE GOVERNANCE | SUPERVISORY BOARD 36

Johan M.R. DanneelsMr Danneels was initially elected as a member of the Supervisory Board in May 2000 and was reappointed on May 15, 2012 for a period of four years. Prior to his retirement mid 2014, Mr Danneels was Chief Executive Officer at Essensium, the company he founded in 2005 as a spin-off from the Interuniversity Microelectronics Centre (‘imec’) research institute. He was Chairman of imec from 2000 to 2005. Prior to that he spent 25 years at Alcatel. He held several management positions for all major product lines, was Corporate Executive Vice President of Alcatel NV, Chief Executive Officer of Alcatel Microelectronics and, most recently, Group Vice President of STMicroelectronics. He holds a PhD in Engineering from the Catholic University of Leuven, Belgium and an MBA from Boston University. Mr Danneels is a Belgian national.
Heinrich W. KreutzerMr Kreutzer was initially elected as a member of the Supervisory Board in November 2006 and was reappointed on May 21, 2014 for a period of four years. Between 1999 and 2003, Mr Kreutzer was a member of the Management Board as Chief Operating Officer and Chief Technology Officer of Alcatel Germany. From 2004 to 2006, he was Managing Director of Kabel Deutschland GmbH in Munich, Germany. Prior to that he worked at several companies including General Telephone & Electronics in Waltham, US and Alcatel in Stuttgart, Germany. Mr Kreutzer is currently on the Board of Directors of Micronas Semiconductor AG (Chairman) in Zurich, Switzerland, Micronas Semiconductor GmbH (Chairman) in Freiburg, Germany and BKtel Communications GmbH (Chairman), Germany. He holds a Master’s degree in Engineering and a Master’s degree in Economics, and studied at the Technical University of Berlin and the University of Hagen, Germany. Mr Kreutzer is a German national.
Martin C.J. van PernisMr Van Pernis was elected as a member of the Supervisory Board in May 2010 and was reappointed on May 21, 2014 for a period of four years. Mr Van Pernis joined Siemens in 1971 and retired from the Siemens Group at the end of 2009 as Chairman of the Management Board of Siemens Nederland NV. He is on the Supervisory Board of Batenburg Techniek NV (Chairman), Aalberts Industries NV (Vice Chairman), Rotterdam Philharmonisch Orkest - RPho (Chairman), President of The Royal Institute of Engineers - KIVI, and Member of the Advisory Board of G4S. Mr Van Pernis is a Dutch national.
Ulrich H.R. SchumacherMr Schumacher was initially elected as a member of the Supervisory Board in May 2008 and was reappointed on May 15, 2012 for a period of four years. Currently Mr Schumacher is Chairman of the Executive Board and CEO of Zumtobel AG. From 1986 to 1999, he held various engineering and management positions at Siemens AG. Between 1996 and 1999, he was CEO and President of Siemens Semiconductor Group, and became President and CEO of Infineon Technologies AG after the spin-off from Siemens Semiconductor Group in 1999. From 2004 to 2007, he was a Partner at Francisco Partners, a private equity investment company based in the US. Between 2007 and 2010, he was the CEO and President of Grace Semiconductor Manufacturing Corporation. Most recently he was Managing Director of CGS DS. He is on the Supervisory Board of PACT XPP Technologies AG (Chairman). He holds a PhD in Electrical Engineering from the University of Aachen, Germany and has completed further education in Business Administration. Mr Schumacher is a German national.
ASM INTERNATIONAL | STATUTORY ANNUAL REPORT 2014
CORPORATE GOVERNANCE | SUPERVISORY BOARD 37

RESPONSIBILITIESThe supervision over the policies of our Management Board and the general course of our business, and the related management actions, is entrusted to the Supervisory Board. In our two-tier structure under applicable Dutch law, the Supervisory Board is a separate body independent from the Management Board.
The Supervisory Board supervises and advises the Management Board in executing its responsibilities, particularly regarding: › achievement of the Company’s objectives; › corporate strategy and the risks inherent in the business activities; › structure and operation of the internal risk management and control systems; › financial reporting process; › compliance with legislation and regulations; › relation of the Company to its shareholders; and › relevant aspects of corporate social responsibility.
The Supervisory Board is responsible for monitoring and assessing its own performance.
CONFLICTS OF INTERESTA Supervisory Board member facing a conflict of interest shall, in accordance with Article 13 of our Supervisory Board Rules, inform the Chairman of the Supervisory Board immediately. The Chairman shall, if possible in consultation with the other members of the Supervisory Board, determine the course of action to be taken.
APPOINTMENTIn accordance with Dutch law and the Code, the Supervisory Board has drawn up a profile for its own composition. This Supervisory Board Profile is available on our website. The Supervisory Board shall consist of at least three members. The members should operate independently of each other and within a good relationship of mutual trust. They should be experienced in the management of an international, publicly listed company, and have sufficient time available to fulfill the function of a Supervisory Board member. The Supervisory Board members appoint a Chairman from among themselves.
The Supervisory Board is currently composed of five members. Supervisory Board members serve a four-year term and may be re-elected twice. Pursuant to section III.3.5 of the Code, a Supervisory Board member can serve for a maximum period of three four-year terms. However, the Code includes best practices only and deviations are possible on the basis of the ‘comply or explain’ principle.
Mr Danneels was initially appointed to the Supervisory Board at the AGM in 2000 and has served on the Supervisory Board for three consecutive four-year terms. The Supervisory Board is of the opinion that in the case of the nomination of Mr Danneels for a fourth four-year term a deviation from the Code is justified because such deviation is under the circumstances in the best interest of the Company. Mr Danneels is a well-known industry expert and represents key industry expertise on the Supervisory Board. The General Meeting of Shareholders approved the nomination for a fourth term of Mr Danneels on May 15, 2012.
The Supervisory Board is currently composed solely of men. The Company recognizes the importance of diversity in its members in respect to gender and makes all reasonable efforts to ensure a balanced participation by men and women in the Supervisory Board. However, the Company has not achieved the requisite gender balance for the current Supervisory Board because the pool of suitable candidates in terms of relevant expertise and industry experience is very limited at the moment. When this situation changes, the Company shall make all reasonable efforts to see that 30% of the seats of the Supervisory Board are taken by women.
ASM INTERNATIONAL | STATUTORY ANNUAL REPORT 2014
CORPORATE GOVERNANCE | SUPERVISORY BOARD 38

Any appointment or reappointment to the Supervisory Board shall be based on the candidate’s match with the Supervisory Board Profile. For reappointment, the candidate’s performance during the previous period shall be taken into account. A Supervisory Board member who is available for reappointment must be interviewed by the Chairman of the Nomination, Selection and Remuneration Committee. The Chairman of the Nomination, Selection and Remuneration Committee must be interviewed by the Chairman of the Supervisory Board. All members of the Supervisory Board follow an introduction program after their first appointment, in which financial and legal aspects as well as financial reporting and specific features of ASMI are discussed.
REMUNERATIONThe remuneration of the members of the Supervisory Board is not dependent on our financial results. No member of the Supervisory Board personally maintains a business relationship with ASMI other than as a member of the Supervisory Board. The Nomination, Selection and Remuneration Committee is responsible for reviewing and, if appropriate, recommending changes to the remuneration of the Supervisory Board. Any recommended changes to the remuneration of the members of the Supervisory Board must be submitted to the General Meeting of Shareholders for approval.
The remuneration of the Supervisory Board was approved by the shareholders in the 2011 Annual General Meeting of Shareholders. The Supervisory Board’s annual remuneration has been fixed as follows:
Base remuneration(Amount in euro)
- Member of the Supervisory Board (other than the Chairman) 45,000
- Chairman of the Supervisory Board 60,000
Additional remuneration
- Member of the Audit Committee (other than the Chairman) 5,000
- Chairman of the Audit Committee 7,500
- Member of the Nomination, Selection and Remuneration Committee (other than the Chairman) 5,000
- Chairman of the Nomination, Selection and Remuneration Committee 7,500
INDEPENDENCEThe Supervisory Board is of the opinion that its current members are all independent as defined by the Nasdaq regulations and the Code. Neither the Chairman nor any other member of the Supervisory Board is a former member of ASMI’s Management Board, or has another relationship with ASMI which can be judged ‘not independent’ of ASMI.
ASM INTERNATIONAL | STATUTORY ANNUAL REPORT 2014
CORPORATE GOVERNANCE | SUPERVISORY BOARD 39

COMMITTEESIn order to more efficiently fulfill its role and in compliance with the Code, the Supervisory Board has created two committees: the Audit Committee and the Nomination, Selection and Remuneration Committee.
Audit CommitteeThe Audit Committee assists the Supervisory Board in its responsibility to oversee ASMI’s financing, financial statements, financial reporting process and system of internal business controls and risk management.
The Audit Committee consists of: › Heinrich Kreutzer (Chairman); › Jan Lobbezoo; and › Ulrich Schumacher.
The Audit Committee supervises the activities of the Management Board with respect to: › the structure and operation of the internal risk management and control systems, including supervision of the enforcement of the relevant legislation and regulations; › role and functioning of Internal Audit; › policy on tax planning; › the applications of information and communication technology; › financing of the Company; › compliance with recommendations and observations of internal and external auditors; › release of financial information; and › relations with the external auditor including, in particular, its independence, remuneration and any non-audit services performed for us.
The Audit Committee meets periodically to: › consider the adequacy of the internal control procedures and the procedures; › review our operating results with management and the independent auditors; › review the scope and results of the audit with the independent auditors; › review the scope and results of internal audits with Internal Audit; › nominate a firm to be appointed as independent auditors; › performance evaluations relating to the auditor’s independence; and › review performance and services of the external auditor.
The Chief Executive Officer, Chief Financial Officer, Director Internal Audit, Director External Reporting & Treasury and representatives of the external auditor are invited to, and also attend, the Audit Committee meetings.
Mr Lobbezoo, Chairman of the Supervisory Board and member of the Audit Committee, is the Supervisory Board’s financial expert, taking into consideration his extensive financial background and experience.
Nomination, Selection and Remuneration CommitteeThe Nomination, Selection and Remuneration Committee (‘NSR Committee’) advises the Supervisory Board on matters relating to the selection and nomination of the members of the Management Board and Supervisory Board. The Committee further monitors and evaluates the Remuneration Policy for the Management Board.
The NSR Committee consists of: › Martin van Pernis (Chairman); › Johan Danneels; and › Jan Lobbezoo.
ASM INTERNATIONAL | STATUTORY ANNUAL REPORT 2014
CORPORATE GOVERNANCE | SUPERVISORY BOARD 40

The objective of the Remuneration Policy is two-fold: › to create a remuneration structure that will allow ASMI to attract, reward and retain qualified executives who will lead ASMI in achieving its strategic objectives; and › to provide and motivate these executives with a balanced and competitive remuneration.
The remuneration structure includes five elements: › base salary; › annual incentive (bonus); › long-term share-based incentive; › pension; and › other arrangements.
This remuneration structure reflects short-term and long-term elements of the responsibilities of members of the Management Board.
The NSR Committee ensures that a competitive remuneration structure is provided by benchmarking with other multinational companies of comparable size and complexity operating in comparable geographical and industrial markets. The NSR Committee evaluates the achievement of performance criteria specified per Management Board member. After the evaluation, it recommends the level of remuneration to the Supervisory Board.
On an annual basis, the NSR Committee reports to the Supervisory Board on the application of the Remuneration Policy in the previous year and recommends the Remuneration Policy for the following years.
The Chief Executive Officer and the Vice President Global Human Resource are invited to, and also attend, the Nomination, Selection and Remuneration Committee meetings.
ASM INTERNATIONAL | STATUTORY ANNUAL REPORT 2014
CORPORATE GOVERNANCE | SUPERVISORY BOARD 41

REPORT OF THE SUPERVISORY BOARD TO THE SHAREHOLDERSDuring the year under review, the Supervisory Board performed its duties in accordance with applicable legislation and the Articles of Association of ASM International NV and supervised and advised the Management Board on an ongoing basis.
FINANCIAL STATEMENTSWe present the ASMI 2014 Statutory annual report in accordance with IFRS, as prepared by the Management Board and reviewed by the Supervisory Board. Our independent auditors, Deloitte Accountants BV have audited these Annual accounts and issued an unqualified opinion. Their report appears on pages 172 to 176 of the Annual accounts.
All of the members of the Supervisory Board have signed the Financial statements in respect of the financial year 2014.
SupervisionSupervision of the Management Board, its policy decisions and actions are entrusted to the Supervisory Board. In accordance with Dutch law, the Supervisory Board is a separate body, independent of the Management Board. The Supervisory Board supervises and advises the Management Board in executing its responsibilities. The profile of the Supervisory Board describes the range of expertise that should be represented within the Board. The procedures of the Supervisory Board and the division of its duties are laid down in the Supervisory Board Rules. Both documents are available on our website (www.asm.com).
Meetings of the Supervisory BoardDuring 2014, the Supervisory Board met with the Management Board on eight occasions. Furthermore, the Supervisory Board held one conference calls without the Management Board participating. Jan Lobbezoo and Heinrich Kreutzer attended all Supervisory Board meetings with the Management Board, Johan Danneels and Martin van Pernis attended all meetings except one, while Ulrich Schumacher attended all meetings except two. In these meetings, the Boards discussed strategy, operations, business risks, product and market developments, the Company’s organization, management and financial structure and performance, including further profitability improvements. In 2014, the Company announced a share buyback program of €100 million with the announcement of the third quarter results, in line with the earlier communicated message that the Company uses excess cash for the benefit of its shareholders.
In addition, the Supervisory Board discussed the functioning of the Supervisory Board and its individual members, the relationship between the Supervisory Board and the Management Board, the composition of the Management Board, its performance, and the performance of its individual members without the members of the Management Board attending.
Corporate GovernanceIncluded in the responsibilities of the Supervisory Board is to oversee the Company’s compliance with corporate governance standards and best practices in the Netherlands and the United States. The changes to the amended Dutch Corporate Governance Code relate, amongst others, to risk management of the Company, remuneration of Management Board members and corporate social responsibility issues. These matters were broadly discussed within the Supervisory Board. The Supervisory Board is of the opinion that the Company complies with the Sarbanes-Oxley Act and applicable corporate governance requirements and best practices set out by Nasdaq, the US Securities and Exchange Commission (‘SEC’), and the Dutch Corporate Governance Code, except for those discussed in the Corporate Governance section, which follows this report.
SUPERVISORY BOARD REPORT
ASM INTERNATIONAL | STATUTORY ANNUAL REPORT 2014
CORPORATE GOVERNANCE | SUPERVISORY BOARD REPORT 42

Supervisory Board CompositionThe Supervisory Board is composed of five members. In 2014 Heinrich Kreutzer and Martin van Pernis were reappointed to the Supervisory Board for a four-year term.
Management Board CompositionThe Management Board is composed of two members. During the Annual General Meeting (‘AGM’) in May 2014, Chuck del Prado and Peter van Bommel were reappointed for a four-year term as members of the Management Board.
Supervisory Board CommitteesAudit CommitteeThe role of the Audit Committee is described in its charter, which is available on the Company’s website (www.asm.com). The Audit Committee consists of Messrs Heinrich Kreutzer (Chairman), Jan Lobbezoo and Ulrich Schumacher.
During the year, the Audit Committee met with the Management Board and Deloitte Accountants, the Company’s independent auditors, on four occasions, and in one conference call. Audit Committee discussions included: the Company’s financial reporting including the application of accounting principles; the Company’s financial position and financing programs; the Company’s internal risk management systems; effectiveness of internal controls including the testing required by Section 404 of the Sarbanes-Oxley Act; the establishment of an internal audit function; the appointment of Deloitte Accountants; the selection process of a new auditor as from 2016 onwards; the audit performed, and its findings, the Annual report and Annual accounts; and the budget and the quarterly progress reports prepared by the Management Board. The internal auditor participated in all four Audit Committee meetings presenting his own actions and findings.
On several occasions, the Audit Committee met with Deloitte Accountants, without the members of the Management Board present, to discuss the risk of fraud. Furthermore, the Audit Committee discussed the auditor’s performance with the Management Board without Deloitte Accountants present.
To comply with new established governance regulations regarding rotation of external auditors the Audit Committee together with management started a selection process to appoint a new external auditor. After careful consideration KPMG was selected to become our new selected auditor as from the accounting year 2015, which was approved in May 2014.
Nomination, Selection and Remuneration CommitteeThe role of the Nomination, Selection and Remuneration Committee is described in its charter, which is available on the Company’s website (www.asm.com). In general, the Committee advises the Supervisory Board on matters relating to the selection and nomination of new Management Board members, as well as the remuneration of the members of the Management Board. This Committee consists of Messrs Martin van Pernis (Chairman), Jan Lobbezoo and Johan Danneels.
In 2014, the Nomination, Selection and Remuneration Committee held one meeting and one conference call. The topics discussed included the remuneration of the individual members of the Management Board. During the meetings of the Committee, the Chief Executive Officer was present, except on the occasion when his own remuneration was discussed. During the AGM of May 2014 the revised Remuneration Policy was adopted by the shareholders.
The remuneration of the members of the Management Board is Note 27 to the Financial statements of the Statutory annual report. The remuneration of the members of the Management Board during 2014 is fully in accordance with the Remuneration Policy.
ASM INTERNATIONAL | STATUTORY ANNUAL REPORT 2014
CORPORATE GOVERNANCE | SUPERVISORY BOARD 43

Word of ThanksWe extend gratitude and appreciation to ASMI employees worldwide for their many contributions and enduring commitment to the Company. It is their commitment and determination that enabled us to make substantial progress in 2014. We recognize that the cumulative efforts of our workforce are truly creating real value for all of our stakeholders.
Supervisory BoardJ.C. Lobbezoo, ChairmanJ.M.R. DanneelsH.W. KreutzerM.C.J. van PernisU.H.R. Schumacher
Almere, the NetherlandsApril 9, 2015
ASM INTERNATIONAL | STATUTORY ANNUAL REPORT 2014
CORPORATE GOVERNANCE | SUPERVISORY BOARD 44

SHARES AND SHAREHOLDERS’ RIGHTS
GENERAL MEETING OF SHAREHOLDERSASMI shareholders exercise their rights through Annual and Extraordinary General Meetings of Shareholders. ASMI is required to convene an Annual General Meeting of Shareholders in the Netherlands each year, no later than six months after the end of the Company’s financial year. Additional Extraordinary General Meetings of Shareholders may be convened at any time by the Supervisory Board or the Management Board.
The convocation date is legally set at 42 days prior to the date of the Annual General Meeting of Shareholders.
The record date is legally set at 28 days prior to the date of the General Meeting of Shareholders. Those who are registered as shareholders at the record date are entitled to attend the meeting and to exercise other shareholder rights. Shareholders may be represented by written proxy.
The Annual report, the Financial statements and other regulated information such as defined in the Dutch Act on Financial Supervision (‘Wet op het Financieel Toezicht’), will solely be published in English on the Company’s website (www.asm.com).
The draft minutes of the General Meeting of Shareholders are available on the Company’s website no later than three months after the meeting. Shareholders may provide their comments in the subsequent three months. Thereafter the minutes are adopted.
On May 21, 2014 ASMI held its Annual General Meeting of Shareholders in Almere, the Netherlands. The attendance rate was 66.8% of the total issued share capital of ASMI as per the registration date. In line with the ASMI Boards’ recommendations, the shareholders approved all resolutions as proposed to the Annual General Meeting of Shareholders.
The main resolutions were as follows: › the financial statements for the year 2013 were adopted and the shareholders granted discharge to the members of the Management Board and the Supervisory Board from liability in relation to the exercise of their duties in the financial year 2013; › the shareholders voted in favor of the dividend payment of €0.50 per ordinary share; › the shareholders voted in favor of the reappointment of Mr C.D. del Prado and Mr P.A.M. van Bommel as members of the Management Board and Mr H.W. Kreutzer and Mr M.C.J. van Pernis as members of the Supervisory Board; and › finally, the revised Remuneration Policy was adopted by the shareholders.
VOTING RIGHTSIn the General Meeting of Shareholders, each ordinary share with a nominal value of €0.04 entitles the holder to cast one vote, each financing preferred share with a nominal value of €40.00 entitles the holder to cast one thousand votes and each preferred share with a nominal value of €40.00 entitles the holder to cast one thousand votes. Presently there are no preferred shares and financing preferred shares outstanding. Treasury shares held by the Company cannot be voted on.
The authorized capital of the Company amounts to 110,000,000 shares of €0.04 par value common shares, 118,000 shares of €40 par value preferred shares and 8,000 shares of €40 par value financing preferred shares, of which 62,968,184 common shares, no preferred and no financing preferred shares were outstanding as at December 31, 2014. All per December 31, 2014 outstanding common shares were fully paid.
ASM INTERNATIONAL | STATUTORY ANNUAL REPORT 2014
CORPORATE GOVERNANCE | SHARES AND SHAREHOLDERS’ RIGHTS 45
Of our 62,718,937 outstanding common shares at March 13, 2015, 2,142,039 are registered with us in the Netherlands, 58,150,696 are registered with our transfer agent in the Netherlands, ABN AMRO Bank NV and 2,426,202 are registered with our transfer agent in the United States, Citibank, NA, New York. Our common shares registered with Citibank, NA, New York are listed on the Nasdaq Global Select Market under the symbol ‘ASMI’. As of March 13, 2015 there were approximately 100 record holders of our common shares registered with Citibank. ASMI’s Ordinary Shares are listed on NYSE Euronext in Amsterdam (symbol: ‘ASM’) and also trade on Nasdaq (symbol: ‘ASMI’).
Financing preferred shares are designed to allow ASMI to finance equity with an instrument paying a preferred dividend, linked to EURIBOR loans and government loans, without the dilutive effects of issuing additional common shares.
Preferred and financing preferred shares are issued in registered form only and are subject to transfer restrictions. Essentially, a preferred or financing preferred shareholder must obtain the approval of the Company’s Supervisory Board to transfer shares. If the approval is denied, the Supervisory Board will provide a list of acceptable prospective buyers who are willing to purchase the shares at a cash price to be fixed by consent of the Supervisory Board and seller within two months after the approval is denied. If the transfer is approved, the shareholder must complete the transfer within three months, at which time the approval expires.
Preferred shares are entitled to a cumulative preferred dividend based on the amount paid-up on such shares. Financing preferred shares are entitled to a cumulative dividend based on the par value and share premium paid on such shares.
On May 28, 1997, we entered into an agreement with Stichting Continuïteit ASM International (‘Stichting’), pursuant to which Stichting was granted an option to acquire up to a number of our preferred shares corresponding with a total par value equal to 50% of the par value of our common shares issued and outstanding at the date of the exercise of the option. Stichting is a non-membership organization organized under Dutch law. The objective of Stichting is to serve the interests of the Company. To that objective Stichting may, amongst others, acquire, own and vote our preferred shares in order to maintain our independence and/or continuity and/or identity.
The members of the board of Stichting are: › Jan Klaassen (Chairman), Emeritus Professor, Vrije Universiteit Amsterdam; › Dick Bouma, Retired Chairman Board Pels Rijcken & Droogleever Fortuijn; and › Rinze Veenenga Kingma, President Archeus Consulting BV.
On May 14, 2008, Stichting exercised its right to acquire preferred shares in the Company and acquired 21,985 preferred shares representing 21,985,000 votes, which constituted 29.9% of the total voting power of our outstanding capital stock as of May 14, 2008. Stichting paid €219,850, which constituted one-fourth of the nominal value of the preferred shares acquired, in accordance with the option agreement. This amount was paid by Stichting using an existing credit line. On May 14, 2009, the Annual General Meeting of Shareholders resolved to cancel the outstanding preferred shares and to re-issue an option to Stichting Continuïteit to acquire preferred shares.
Except as described above regarding Stichting, we are unaware of any arrangement which we anticipate will result in a change in control of ASM International NV. All shares of our common stock (including shares held by major shareholders) entitle the holder to the same voting rights. Our preferred shares entitle the holder to 1,000 votes per share.
ASM INTERNATIONAL | STATUTORY ANNUAL REPORT 2014
CORPORATE GOVERNANCE | SHARES AND SHAREHOLDERS’ RIGHTS 46

POWERSThe powers of the General Meeting of Shareholders are defined in our Articles of Association. The main powers of the shareholders are to: › appoint, suspend and dismiss members of the Management Board and Supervisory Board; › adopt the financial statements; › declare dividends; › discharge the Management Board and Supervisory Board from responsibility for the performance of their respective duties for the previous financial year; › appoint the external auditors; › adopt amendments to the Articles of Association; › issue shares and grant subscriptions for shares; › authorize the Management Board to issue shares and grant subscriptions for shares; › withdraw pre-emptive rights of shareholders upon issuance of shares; › authorize the Management Board to withdraw pre-emptive rights of shareholders upon issuance of shares; and › authorize the Management Board to repurchase or cancel outstanding shares.
MAJOR SHAREHOLDERSPursuant to the Dutch Financial Supervision Act (‘Wet op het financieel toezicht’ or ‘Wft’), legal entities as well as natural persons must immediately notify the Dutch Authority for the Financial Markets (‘AFM’) when a shareholding equals or exceeds 3% of the issued capital. The AFM must be notified again when this shareholding subsequently reaches, exceeds or falls below a threshold. This can be caused by the acquisition or disposal of shares by the shareholder or because the issued capital of the issuing institution is increased or decreased. Thresholds are: 3%, 5%, 10%, 15%, 20%, 25%, 30%, 40%, 50%, 60%, 75% and 95%. The AFM incorporates the notifications in the public register, which is available on its website. Failure to disclose the shareholding qualifies as an offense, and may result in civil penalties, including suspension.
The following table sets forth information with respect to the ownership of our common shares as of March 13, 2015 by each beneficial owner known to us of more than 3% of our common shares:
NUMBER OF SHARES PERCENT
NUMBER OF VOTING RIGHTS PERCENT 1)
Arthur H. del Prado 2) 11,346,323 18.1% 11,346,323 18.1%
J.P. Morgan Chase & Co 3) 8,619,109 13.7% 8,619,109 13.7%
Eminence Capital, LLC 4) 6,480,170 10.3% 2,906,450 4.6%
Massachusetts Financial Services Company 5) 3,204,564 5.1% 3,766,156 6.0%
Norges Bank 6) 2,090,606 3.3% 2,090,606 3.3%
1 Calculated on the basis of 62,718,937 common shares outstanding as of March 13, 2015, and without regard to options.2 Includes 3,039 common shares owned by Stichting Administratiekantoor ASMI, a trust controlled by Mr Arthur H. del Prado and 713,000 common
shares beneficially owned by Mr Chuck D. del Prado, Mr Arthur H. del Prado’s son.3 Of the share capital interest and voting rights held by J.P. Morgan Chase & Co 3,284,284 shares are indirectly actual and 5,334,825 are indirectly
potential. Based on the notification filed with the AFM on February 11, 2015.4 Of the share capital interest that Eminence Capital, LLC holds 2,906,450 shares are directly actual and 3,573,720 are directly potential. Based on the
AFM notification dated January 8, 2015.5 Massachusetts Financial Services Company’s capital interest amounts to 3,120,793 shares held directly actual and 83,771 shares indirectly actual.
Of the voting rights 3,317,786 are held directly actual and 448,370 indirectly actual. Based on the notification filed with the AFM on March 13, 2015.6 Norges Bank’s capital interest amounts to 1,436,813 shares held directly actual and 653.793 shares directly potential. Based on the AFM notification
dated February 12, 2015.
ASM INTERNATIONAL | STATUTORY ANNUAL REPORT 2014
CORPORATE GOVERNANCE | SHARES AND SHAREHOLDERS’ RIGHTS 47

A ‘beneficial owner’ of a security includes any person who, directly or indirectly, through any contract, arrangement, understanding, relationship, or otherwise has or shares (i) voting power which includes the power to vote, or to direct the voting of, such security and/or (ii) investment power which includes the power to dispose, or to direct the disposition, of such security. In addition, a person shall be deemed to be the beneficial owner of a security if that person has the right to acquire beneficial ownership of such security, as defined above, within 60 days, including but not limited to any right to acquire: (i) through the exercise of any option, warrant or right; (ii) through the conversion of a security; or (iii) pursuant to the power to revoke, or pursuant to the automatic termination of, a trust, discretionary account, or similar arrangement.
DIVIDENDASMI aims, as part of its financing policy, to pay a sustainable annual dividend. Annually the Supervisory Board, upon proposal of the Management Board, will assess the amount of dividend that will be proposed to the Annual General Meeting of Shareholders. The decision that a dividend be proposed to the Annual General Meeting of Shareholders will be subject to the availability of distributable profits as well as retained earnings and may be affected by our potential future funding requirements. Accordingly, dividend payments may fluctuate and could decline or be omitted in any year.
In 2007, we paid an interim dividend of €0.10 per common share. We did not pay dividends in 2008, 2009, 2010 and in any year prior to 2007. In 2011, we paid a dividend of €0.40 per common share. In 2012, 2013 and 2014, we paid a dividend of €0.50 per common share and in July 2013 we paid €4.25 per common share as an extraordinary capital repayment subsequent to the realized gain on the sale of a 12% share in our associate ASMPT. We intend to propose to the forthcoming 2015 Annual General Meeting of Shareholders to declare a dividend of €0.60 per share.
ASM INTERNATIONAL | STATUTORY ANNUAL REPORT 2014
CORPORATE GOVERNANCE | SHARES AND SHAREHOLDERS’ RIGHTS 48

EXTERNAL AUDITORThe General Meeting of Shareholders appoints the external auditor. The Audit Committee recommends to the Supervisory Board the external auditor to be proposed for (re)appointment by the General Meeting of Shareholders. In addition, the Audit Committee evaluates and, where appropriate, recommends the replacement of the external auditors. On May 21, 2014, the General Meeting of Shareholders re-appointed Deloitte Accountants BV as external auditor for the Company for the financial year 2014.
Pursuant to the Dutch Audit Profession Act (Wet op het Accountantsberoep), for the audit of the financial year 2016 the audit firm of a so-called public interest entity (such as a listed company) will have to be replaced if the audit firm performed the statutory audits of the company for a period of eight consecutive years. In anticipation of this legislation the Company changes its external auditor with effect as of its financial year 2015. On May 21, 2014 the General Meeting of Shareholders appointed KPMG Accountants NV as the Company’s external auditor for the financial year 2015 in order to facilitate a smooth handover. KPMG Accountants NV was selected following an extensive selection procedure, chaired by the chairman of the Audit Committee.
The external auditor is present at our General Meeting of Shareholders to respond to questions, if any, from the shareholders about the auditor’s report on the financial statements.
The Audit Committee has determined that the provision of services by Deloitte and its member firms is compatible with maintaining Deloitte’s independence. All audit and permitted non-audit services provided by Deloitte and its member firms during 2014 were pre-approved by the Audit Committee.
The Audit Committee has adopted the following policies and procedures for pre-approval of all audit and permitted non-audit services provided by our independent registered public accounting firm:
Audit services Management submits to the Audit Committee for pre-approval the scope and estimated fees for specific services directly related to performing the independent audit of our statutory and consolidated financial statements for the current year.
Audit-related services The Audit Committee may pre-approve expenditures up to a specified amount for services included in identified service categories that are related extensions of audit services and are logically performed by the auditors. Additional services exceeding the specified pre-approved limits require specific Audit Committee approval.
Tax servicesThe Audit Committee may pre-approve expenditures up to a specified amount per engagement and in total for identified services related to tax matters. Additional services exceeding the specified pre-approved limits, or involving service types not included in the pre-approved list, require specific Audit Committee approval.
Other services In the case of specified services for which utilizing our independent registered public accounting firm creates efficiencies, minimizes disruption or preserves confidentiality, or for which management has determined that our independent registered public accounting firm possesses unique or superior qualifications to provide such services, the Audit Committee may pre-approve expenditures up to a specified amount per engagement and in total. Additional services exceeding the specified pre-approved limits, or involving service types not included in the pre-approved list, require specific Audit Committee approval.
ASM INTERNATIONAL | STATUTORY ANNUAL REPORT 2014
CORPORATE GOVERNANCE | EXTERNAL AUDITOR 49

DECLARATIONS
COMPLIANCE WITH DUTCH CORPORATE GOVERNANCE CODEThe Dutch Corporate Governance Code was last amended on December 10, 2008. The full text of the Dutch Corporate Governance Code can be found on the website of the Monitoring Commission Corporate Governance Code (www.commissiecorporategovernance.nl).
ASMI applies the relevant principles and best practices of the Code applicable to the Company, to the Management Board and to the Supervisory Board, in the manner set out in this Corporate Governance section, as long as it does not entail disclosure of commercially sensitive information, as accepted under the Code.
In general, ASMI agrees with rule II.2.8 of the Code that in most circumstances a maximum severance payment of one year for Management Board members is appropriate. However, we want to reserve the right to agree to different amounts in case we deem this to be required by the circumstances. Any deviations will be disclosed.
Pursuant to section III.3.5 of the Code, a Supervisory Board member can serve for a maximum period of three four-year terms. However, the Code includes best practices only and deviations are possible on the basis of the ‘comply or explain’ principle.
Mr Danneels was first appointed to the Supervisory Board at the AGM in 2000 and has served on the Supervisory Board for three consecutive four-year terms. The Supervisory Board is of the opinion that in the case of the nomination of Mr Danneels for a fourth four-year term a deviation from the Code is justified because such deviation is under the circumstances in the best interest of the Company. Mr Danneels is a well-known industry expert and represents key industry expertise on the Supervisory Board. The General Meeting of Shareholders approved the nomination for a fourth term of Mr Danneels on May 15, 2012.
RESPONSIBILITY STATEMENTThe members of the Management Board state that, to the best of their knowledge, the statutory financial statements prepared in accordance with IFRS-EU and Title 9 of part 2 of the Dutch Civil Code as included in this Statutory annual report 2014 provide a true and fair view of the assets, liabilities, financial position and results of the Company and its subsidiaries included in the consolidated statements and that the management report provides a true and fair view of the position and the business of the Company and its subsidiaries, and the Statutory annual report 2014 provides a description of the principal risks and uncertainties that the Company faces.
CORPORATE GOVERNANCE STATEMENTAccording to the Government Code, the Company is required to publish a statement on corporate governance. This statement has to report on compliance with the Code. Furthermore, a description must be included of the main characteristics of the internal risk management and control systems connected with the Company’s financial reporting process. The corporate governance statement must also provide information on the functioning of the General Meeting of Shareholders, including its main rights, the composition of the Management Board and the Supervisory Board, including its committees.
The Management Board states that the information required by the December 23, 2004 (as lastly amended on December 10, 2009) decree is included in this Corporate governance chapter and in the Risk management chapter.
Corporate governance-related documents are available on our website. These include the Supervisory Board Profile, Supervisory Board Rules, Management Board Rules, the Audit Committee Charter, the Nomination, Selection and Remuneration Committee Charter, the Code of Ethics, the Whistleblower Policy, the Anti-Fraud Policy, the Rules concerning Insider Trading, and the Remuneration Policy.
DECREE ARTICLE 10 EU TAKEOVER DIRECTIVEThe Management Board states that the information required under Article 10 of the EU Takeover Directive Decree is disclosed in this Corporate governance chapter to the extent that it is applicable to ASMI.
ASM INTERNATIONAL | STATUTORY ANNUAL REPORT 2014
CORPORATE GOVERNANCE | DECLARATIONS 50

MANAGEMENT BOARD
FIRST LINE OF DEFENCE
OWNERSHIP & MANAGEMENT RISK & CONTROL FUNCTIONSINDEPENDENT OBJECTIVE
ASSURANCE
BUSINESS & OPERATIONSMANAGEMENT OVERSIGHT FUNCTIONS INTERNAL AUDIT
SECOND LINE OF DEFENCE THIRD LINE OF DEFENCE
Being in business involves taking risks. In this chapter we describe these risks and discuss the Risk Management and Control Framework we have developed to help manage and mitigate them. We provide an assessment of the key strategic, operational, financial and compliance risks which might affect us.
RISK MANAGEMENT
51

RISK MANAGEMENTDoing business inherently involves taking risks. ASMI strives for a culture of openness and transparency in which identified risks are disclosed pro-actively and unexpected events are reported as soon as they occur. The following is an overview of ASMI’s approach to risk management and control systems. Also, we include an assessment of the key strategic, operational, financial and compliance risks that we consider currently impact ASMI.
RISK APPETITEUndertaking business activity inevitably leads to the taking of risks. ASMI’s risk appetite is primarily established based on the defined and agreed strategy and the individual objectives within this strategy. Risk appetite is further supported by our code of ethics as well as detailed policies and procedures.
RISK MANAGEMENT AND CONTROL SYSTEMA comprehensive Risk management and Control framework, based on the ‘three lines of defense model’, has been established that allows the Audit Committee and the Management Board a clear overview of the effectiveness of internal controls and risk management. Within the framework the Management Board is responsible for designing, implementing and operating an adequately functioning Internal risk management and Control framework in the Company. The objective of this framework is to identify and manage the strategic, operational, financial, financial reporting and compliance risks to which the Company is exposed, to promote effectiveness and efficiency in the Company’s operations, to promote reliable financial reporting and to promote compliance with laws and regulations. The Management Board is aware that such a framework can neither provide absolute assurance that its objectives will be achieved, nor can it entirely prevent material errors, losses, fraud and the violation of laws and regulations.
MANAGEMENT BOARD
FIRST LINE OF DEFENCE
OWNERSHIP & MANAGEMENT RISK & CONTROL FUNCTIONSINDEPENDENT OBJECTIVE
ASSURANCE
BUSINESS & OPERATIONSMANAGEMENT OVERSIGHT FUNCTIONS INTERNAL AUDIT
SECOND LINE OF DEFENCE THIRD LINE OF DEFENCE
ASM INTERNATIONAL | STATUTORY ANNUAL REPORT 2014
RISK MANAGEMENT | RISK MANAGEMENT 52

Supporting the Management Board are the following three pillars: › Business & Operations management. These management functions own and manage risk, and are responsible for maintaining effective controls and for executing risk and control procedures on a daily basis. This involves identifying and assessing risks being undertaken and establishing appropriate controls to mitigate the risks. There are adequate management controls in place to monitor ongoing compliance and to highlight control breakdowns; › Oversight functions. These management functions support Business & Operations management and help ensure that the risk and control procedures are operating as intended; › Internal audit. This function provides independent objective assurance on the effectiveness of governance, risk management and internal controls including the manner in which Business & Operations Management and the oversight functions manage and control risk. Internal audit brings a systematic, disciplined approach to evaluate and improve the effectiveness of risk management, control and governance processes.
Our Internal risk management and Control framework is based on the framework in Internal Control - Integrated Framework issued by the Committee of Sponsoring Organizations of the Treadway Commission (‘COSO’). The Framework aims to provide reasonable assurance regarding effectiveness and efficiency of an entity’s operations, reliability of financial reporting, prevention of fraud, and compliance with laws and regulations.
We have embedded an Internal risk management and Control framework in the Company. Within the Framework, we continue to enhance our identification and assessment of our strategic, operational, financial, financial reporting and compliance risks, and continue to expand our risk management policies. We have documented our internal controls for all significant risks and continuously assess such internal controls. We have identified key controls over financial reporting and embedded these in common business and financial reporting processes to provide further assurance for the reliability of our financial reporting.
INTERNAL AUDITThe internal audit function of ASMI forms one of the key elements to address the topics of risk management and internal control over financial reporting as required under the Code and the Sarbanes-Oxley Act, respectively. To ensure the independence of this function, the Director Internal Audit reports to the Management Board and the Audit Committee. The Audit Committee is involved in drawing up the work schedule and audit scope of the internal auditor. The internal auditor regularly provides updates on its findings to the Audit Committee.
CONTROL EFFECTIVENESS STATEMENTThe Internal risk management and Control framework and the evaluation of the effectiveness of our internal controls and areas for improvement are regularly discussed with the Audit Committee and Deloitte Accountants, our external auditor. The Audit Committee reports on these matters to the Supervisory Board.
The Management Board conducted an evaluation of the effectiveness of our internal control over financial reporting (as defined in Exchange Act Rules 13a-15(f) and 15(d)-15(f)) based on the Internal Control – Integrated framework issued by the Committee of Sponsoring Organizations of the Treadway Commission (‘COSO’). Based on this evaluation of the effectiveness of the Company’s internal control over financial reporting, in accordance with the requirements of Section 404 of the Sarbanes-Oxley Act of 2002 (‘SOX 404’), all members of the Management Board concluded that, as of December 31, 2014, the Company’s internal control over financial reporting was effective and provides reasonable assurance for the reliability of financial reporting and the preparation of financial statements for external purposes in accordance with generally accepted accounting principles. In addition, to the best of the knowledge of the Management Board, the management report includes a fair review of the development and performance of the business and the position of the Company and the undertakings included in the consolidation as a whole, as well as a description of the principal risks and uncertainties that the Company faces. No changes to the Company’s internal control over financial reporting have occurred during 2014 that have materially affected, or are reasonably likely to materially affect, the Company’s internal control over financial reporting.
ASM INTERNATIONAL | STATUTORY ANNUAL REPORT 2014
RISK MANAGEMENT | RISK MANAGEMENT 53
All internal control systems, no matter how well designed and implemented, have inherent limitations. Even systems determined to be effective may not prevent or detect misstatements or fraud and can only provide reasonable assurance with respect to disclosure and financial statement presentation and reporting. Additionally, projections of any evaluation of effectiveness to future periods are subject to the risk that controls may become inadequate because of changed conditions and that the degree of compliance with the policies or procedures may deteriorate.
In view of all of the above, the Management Board believes that it complies with the requirements of rule II.1.5 of the Code.
RISK FACTORSIn conducting our business, we face a number of risks that may interfere with our business objectives. Some of these risks relate to our operational processes, while others relate to our business environment. It is important to understand the nature of these risks and the impact they may have on our business, financial condition and results of operations. Some of the more relevant risks are described below, which may not be in order of likelihood or materiality. These risks are not the only ones we face. Some risks may not yet be known to us and certain risks that we do not currently believe to be material could become material in the future.
RISKS RELATED TO THE SEMICONDUCTOR INDUSTRYThe semiconductor industry is highly cyclical.We sell our products to the semiconductor manufacturing industry, which is subject to the industry’s business cycles, of which the timing, duration and volatility are difficult to predict. The semiconductor industry has historically been cyclical.
Semiconductor manufacturers may contribute to the severity of downturn and upturn cycles by misinterpreting the conditions in the industry and over-investing or under-investing in semiconductor manufacturing capacity and equipment. In any event, the lag between changes in demand for semiconductor devices and changes in demand for our products by semiconductor manufacturers accentuates the intensity of these cycles in both expansion and contraction phases. We may not be able to respond in a timely and effective manner to these industry cycles in the expansion and contraction phases.
Industry downturns historically have been characterized by reduced demand for semiconductor devices and equipment, production over-capacity and a decline in average selling prices. During periods of declining demand, we must quickly and effectively reduce expenses. However, our ability to reduce expenses is limited by our need for continued investment in engineering, research and development and extensive ongoing customer service and support requirements. In addition, in a downturn, our ability to reduce inventories quickly is limited by the long lead time for production and delivery of some of our products, reduced sales, order cancellations and delays, and delays associated with reducing deliveries from our supplier pipeline. During an extended downturn, a portion of our inventory may have to be written down as excess or obsolete if it is not sold in a timely manner. Additionally, during a significant downturn, workforce reductions that we may seek to implement to reduce costs may be delayed due to labor laws and practices applicable in the various jurisdictions we operate.
Industry upturns have been characterized by fairly abrupt increases in demand for semiconductor devices and equipment and insufficient production capacity. During a period of increasing demand and rapid growth, we must be able to quickly increase manufacturing capacity to meet customer demand and hire and assimilate a sufficient number of additional qualified personnel, as well as to fund such an increase of manufacturing capacity. Our inability to quickly respond in times of increased demand, because of the effect, for example, of our ongoing programs to reduce expenses and regulate the rate of purchases from our suppliers, could harm our reputation and cause some of our existing or potential customers to place orders with our competitors rather than us.
ASM INTERNATIONAL | STATUTORY ANNUAL REPORT 2014
RISK MANAGEMENT | RISK FACTORS 54

Our industry, along with global financial markets and regions, have been in flux since 2008. In particular, financial turmoil in the Eurozone has in past years been unsettling, including the debt burden of certain nations and their ability to meet future obligations, euro currency stability, and the continued suitability of the euro as a single currency. These concerns could possibly result in the reintroduction of individual currencies or even the dissolution of the euro itself. If the euro ended, the contractual and legal consequences for holders of euro-denominated obligations cannot be predicted; however, these possible developments and fluid market perceptions could negatively affect the value of euro-denominated obligations and assets. These financial concerns in Europe, as well as the health of the overall global financial markets and an uncertain or a weaker or deteriorating global economy, could also adversely impact our business, financial condition and operating results, such as lower sales due to decreased capital purchases by our customers, financial instability or insolvency of suppliers and customers, and other such similar or related adverse effects.
Our industry is subject to rapid technological change and we may not be able to forecast or respond to commercial and technological trends in time to avoid competitive harm.Our future success depends upon commercial acceptance of products incorporating new technologies we are developing, such as new plasma enhanced and atomic layer deposition processes, new epitaxy processes and new materials and chemistries. The semiconductor industry and the semiconductor equipment industry are subject to rapid technological change and frequent introductions of enhancements to existing products which can result in significant writedowns and impairment charges and costs. Technological changes have had, and will continue to have, a significant impact on our business. Our operating results and our ability to remain competitive are affected by our ability to accurately anticipate customer and market requirements and develop technologies and products to meet these requirements. Our success in developing, introducing and selling new and enhanced products depends upon a variety of factors, including, but not limited to: › successful innovation of processes and equipment; › accurate technology and product selection; › timely and efficient completion of product design, development and qualification; › timely and efficient implementation of manufacturing and assembly processes; › successful product performance in the field; › effective and timely product support and service; and › effective product sales and marketing.
We may not be able to accurately forecast or respond to commercial and technical trends in the semiconductor industry or to the development of new technologies and products by our competitors. Our competitors may develop technologies and products that are more effective than ours or that may be more widely accepted. We may also experience delays and technical and manufacturing difficulties in future introductions or volume production of new systems or enhancements. Significant delays can occur between a product’s introduction and the commencement of volume production of that product. Any of these events could materially and negatively impact our operating results and our ability to generate the return we intend to achieve on our investments in new products.
If we fail to adequately invest in research and development, we may be unable to compete effectively.We have limited resources to allocate to research and development, and must allocate our resources among a wide variety of projects in our businesses. If we have insufficient cash flow from our businesses to support the necessary level of research and development, we will have to fund such expenditures by diminishing our cash balances, or utilizing our credit facilities or reducing our level of research and development expenses.
Because of intense competition in our industry and constant technological evolution, the consequences of failing to invest in strategic developments are significant. In order to enhance the benefits obtained from our research and development expenditures, we have contractual and other relationships with independent research institutes. If we fail to adequately invest in research and development or lose our ability to collaborate with these independent research entities, we may be unable to compete effectively in the Front-end and Back-end markets in which we operate.
ASM INTERNATIONAL | STATUTORY ANNUAL REPORT 2014
RISK MANAGEMENT | RISK FACTORS 55

We face intense competition from companies which have greater resources than we do, and potential competition from new companies entering the market in which we compete. If we are unable to compete effectively with these companies, our market share may decline and our business could be harmed.We face intense competition in our operating segments of the semiconductor equipment industry from other established companies. Our primary competitors include Applied Materials, LAM Research Corporation, Tokyo Electron, Hitachi Kokusai, Wonik IPS and Jusung. A number of our competitors have substantially greater financial, technological, engineering, manufacturing, marketing and distribution resources, which may enable them to: › better withstand periodic downturns in the semiconductor industry; › compete more effectively on the basis of price, technology, service and support; › more quickly develop enhancements to and new generations of products; and › more effectively retain existing customers and attract new customers.
In addition, new companies may enter the markets in which we compete, further increasing competition in the semiconductor equipment industry.
We believe that our ability to compete successfully depends on a number of factors, including, without limitation: › our success in developing new products and enhancements; › performance of our products; › quality of our products; › ease of use of our products; › reliability of our products; › cost of ownership of our products; › our ability to ship products in a timely manner; › quality of the technical service we provide; › timeliness of the services we provide; › responses to changing market and economic conditions; and › price of our products and our competitors’ products.
Some of these factors are outside our control. We may not be able to compete successfully in the future, and increased competition may result in price reductions, reduced profit margins, loss of market share, and inability to generate cash flows that are sufficient to maintain or expand our development of new products.
Industry alliances may not select our equipment.Our customers are entering into alliances or other forms of cooperation with one another to expedite the development of processes and other manufacturing technologies. One of the results of this cooperation may be the definition of a system or particular tool set for a certain function or a series of process steps that uses a specific set of manufacturing equipment. These decisions could work to our disadvantage if a competitor’s equipment becomes the standard equipment for such a function or process. Even if our equipment was previously used by a customer, that equipment may be displaced in current and future applications by the equipment standardized through such cooperation. These forms of cooperation may have a material adverse effect on our business, financial condition and results of operations.
ASM INTERNATIONAL | STATUTORY ANNUAL REPORT 2014
RISK MANAGEMENT | RISK FACTORS 56

RISKS RELATED TO OUR BUSINESSOur customers face challenges in economic downturns and if they cannot meet their obligations to us our financial results will suffer.We face increased payment and performance risk in economic downturns from our customers. If any of our customers become insolvent or commence bankruptcy or similar proceedings, our receivables from such customers may become uncollectable. In order to promote sales, we may be required to provide extended payment terms, financing arrangements or other modified sale terms for some customers, which will increase our sales expenses and further increase our exposure to customer credit risk, all in an environment of downward pressure on average selling prices. Even though we may be a secured creditor in these arrangements with rights in the underlying equipment, the equipment may have only limited valuefollowing a customer default, especially if activity in our markets remains at low levels, which may result in substantial write-downs upon any such default.
If we do not accurately evaluate our customers’ creditworthiness in connection with sales financing arrangements involving increased exposure to customer payment risk, our bad debt expense will increase. If we are too cautious in our sales practices because of this, we may lose sales. In either case, our results of operations and financial condition would be negatively affected.
We derive a significant percentage of our revenue from sales to a small number of large customers, and if we are not able to retain these customers, or if they reschedule, reduce or cancel orders, or fail to make payments, our revenues would be reduced and our financial results would suffer.Our largest customers account for a significant percentage of our revenues. Our largest customer accounted for 26.7% of our net sales in 2014. Our ten largest customers accounted for 84.1% of our net sales in 2014. Sales to, and the relative importance of, these large customers have varied significantly from year to year and will continue to fluctuate in the future. These sales also may fluctuate significantly from quarter to quarter. We may not be able to retain our key customers or they may cancel purchase orders or reschedule or decrease their level of purchases from us, which would reduce our revenues and negatively affect our financial results, perhaps materially. In addition, any difficulty in collecting amounts due from one or more key customers could harm our financial results.
We may need additional funds to finance our future growth and ongoing research and development activities. If we are unable to obtain such funds, we may not be able to expand our business as planned.In the past, we have experienced capital constraints that adversely affected our operations and ability to compete. We may require additional capital to finance our future growth and fund our ongoing research and development activities. We have only limited ability to obtain funds from our investment in ASMPT and some limitations on our ability to reallocate funds among our internal businesses.
If we raise additional funds through the issuance of equity securities, the percentage ownership of our existing shareholders would be diluted. If we finance our capital requirements with debt, we may incur significant interest costs. Additional financing may not be available to us when needed or, if available, may not be available on terms acceptable to us, particularly in times of global or European financial crisis or uncertainty that may dramatically affect the availability of bank and other sources of debt financing.
If we are unable to raise needed additional funds, we may have to reduce the amount we spend on research and development, slow down our introduction of new products, reduce capital expenditures necessary to support future growth and/or take other measures to reduce expenses which could limit our growth and ability to compete.
ASM INTERNATIONAL | STATUTORY ANNUAL REPORT 2014
RISK MANAGEMENT | RISK FACTORS 57

Our products generally have long sales cycles and implementation periods, which increase our costs of obtaining orders and reduce the predictability of our earnings.Our products are technologically complex. Prospective customers generally must commit significant resources to test and evaluate our products and to install and integrate them into larger systems. In addition, customers often require a significant number of product presentations and demonstrations, in some instances evaluating equipment on site, before reaching a sufficient level of confidence in the product’s performance and compatibility with the customer’s requirements to place an order. As a result, our sales process is often subject to delays associated with lengthy approval processes that typically accompany the design and testing of new products. Accordingly, the sales cycles of our products often last for many months or even years, thereby requiring us to invest significant resources in attempting to complete sales.
Long sales cycles also subject us to other risks, including customers’ budgetary constraints, internal acceptance reviews and cancellations. In addition, orders expected in one quarter could shift to another because of the timing of customers’ purchase decisions. The time required for our customers to incorporate our products into their systems can vary significantly with the needs of our customers and generally exceeds several months, which further complicates our planning processes and reduces the predictability of our earnings from operations.
Our ability to compete could be jeopardized if we are unable to protect our intellectual property rights from challenges by third parties; claims or litigation regarding intellectual property rights could require us to incur significant costs.Our success and ability to compete depend in large part upon protecting our proprietary technology. We rely on a combination of patent, trade secret, copyright and trademark laws, non-disclosure and other contractual agreements and technical measures to protect our proprietary rights and confidential information. These agreements and measures may not be sufficient to protect our technology from third party infringement or to protect us from the claims of others. In addition, patents issued to us may be challenged, invalidated or circumvented, rights granted to us under patents may not provide competitive advantages to us, and third parties may assert that our products infringe their patents, copyrights or trade secrets. Third parties could also independently develop similar products or duplicate our products.
Intellectual property laws may not adequately support our proprietary rights or may change in an unfavorable manner. Patent rights may not be granted or construed as we expect, and key patents may expire, resulting in technology becoming available that may hurt our competitive position.
In addition, monitoring unauthorized use of our products is difficult and we cannot be certain that the steps we have taken will prevent unauthorized use of our technology. The laws of some countries in which our products are or may be developed, manufactured or sold, including various countries in Asia, may not protect our products or intellectual property rights to the same extent as do the laws of the Netherlands and the United States and thus make the possibility of piracy of our technology and products more likely in such countries. If competitors are able to use our technology as their own, our ability to compete effectively could be harmed.
In past years, there has been substantial litigation regarding patent and other intellectual property rights in our semiconductor and related technology industries. In the future, litigation may be necessary to enforce patents issued to us, to protect trade secrets or know-how owned by us or to defend us against claimed infringement of the rights of others and to determine the scope and validity of the proprietary rights of others.
Claims that our products infringe the proprietary rights of others would force us to defend ourselves and possibly our customers or suppliers against the alleged infringement. Such claims, if successful, could subject us to significant liability for damages and potentially invalidate our proprietary rights. Regardless of the outcome, patent infringement litigation is time-consuming and expensive to resolve, and diverts management time and attention.
ASM INTERNATIONAL | STATUTORY ANNUAL REPORT 2014
RISK MANAGEMENT | RISK FACTORS 58
Intellectual property litigation could force us to do one or more of the following, any one of which could severely harm our business with adverse financial consequences: › forfeit proprietary rights; › stop manufacturing or selling our products that incorporate the challenged intellectual property; › obtain from the owner of the infringed intellectual property right a license to sell, produce, use, have sold, have produced or have used the relevant technology, which license may not be available on reasonable terms or at all or may involve significant royalty payments; › pay damages, including potential treble damages and attorney’s fees in some circumstances; or › redesign those products that use the challenged intellectual property.
We license the use of some patents from a competitor pursuant to a settlement agreement; if the agreement is terminated, our business could be adversely affected.In October 1997, we entered into an agreement to settle mutual patent infringement litigation with Applied Materials, which was amended and restated in 1998, pursuant to which Applied Materials agreed to grant us a worldwide, non-exclusive and royalty-bearing license to use all of the litigated patents and certain additional patents that were not part of the litigation. In return we agreed to pay Applied Materials a settlement fee and to grant it a worldwide, non-exclusive and royalty-free license to use a number of our patents, including but not limited to, those patents which we were enforcing in the litigation. All licenses granted by Applied Materials to us expire at the end of the life of the underlying patents, which expire at various times through approximately 2016. Our obligation to pay certain royalties to Applied Materials generally continues until the expiration of the corresponding underlying patent to the extent we practice such a patent. In addition, the settlement agreement included covenants for limited periods during which the parties would not litigate the issue whether certain of our products infringe any of Applied Materials’ patents that were not licensed to us under the settlement agreement. These covenants, which lasted for different periods of time for different products, have expired. Upon the occurrence of an event of default or other specified events, including, among other things, our failure to pay royalties, a change of control of ASM International, and improper use of the licenses, Applied Materials may terminate the settlement agreement, including the licenses included in the agreement.
Additional litigation with Applied Materials regarding the operation of the settlement agreement or other matters could occur. Litigation with Applied Materials, which has greater financial resources than we do, could negatively impact our earnings and financial position.
Our net earnings could be negatively impacted by currency fluctuations.Our assets, liabilities and operating expenses and those of our subsidiaries are to a large extent denominated in the currency of the country where each entity is established. Our financial statements, including our Consolidated Financial Statements, are expressed in euro. The translation exposures that result from the inclusion of financial statements of our subsidiaries and investments that are expressed in the currencies of the countries where the subsidiaries are located are not hedged. As a result, our assets, liabilities and operating expenses are exposed to fluctuations of various foreign currency exchange rates, most significantly to the HK$ following the remeasurement of the investment in ASMPT.
In addition, foreign currency fluctuations may affect the prices of our products. Prices for our products for sales to our customers throughout the world are currently denominated in various foreign currencies including, but not limited to, US dollar, euro, Japanese yen and Chinese yuan. If there is a significant devaluation of the currency in a specific country, the prices of our products will increase relative to that country’s currency, and could increase relative to prices of our competitors, and our products may be less competitive in that country. Also, we cannot be sure that our international customers will continue to be willing to place orders denominated in these currencies. If they do not, our revenue and earnings from operations could be subject to additional foreign exchange rate fluctuations.
ASM INTERNATIONAL | STATUTORY ANNUAL REPORT 2014
RISK MANAGEMENT | RISK FACTORS 59

Although we monitor our exposure to currency fluctuations, these fluctuations could negatively impact our financial position, net earnings and cash flow.
Substantially all of our equipment orders are subject to operating, performance, safety, economic specifications and other contractual obligations. We occasionally experience unforeseen difficulties in compliance with these criteria, which can result in increased design, installation and other costs and expenses.Substantially all of our equipment sales are conditioned on our demonstration, and our customer’s acceptance, that the equipment meets specified operating and performance criteria, either before shipment or after installation in a customer’s facility. We occasionally experience difficulties demonstrating compliance with such terms, which can lead to unanticipated expenses for the performance of the contract or the redesign, modification and testing of the equipment and related software. To the extent this occurs in the future, our cost of goods sold and earnings from operations will be adversely affected. If we are not able to demonstrate compliance with the particular contract or the performance and operating specifications in respect of specific equipment, we may have to pay penalties to the customer, issue credit notes to the customer and/or take other remedial action, including payment of damages or adjusted pricing, any one of which could negatively affect our earnings from operations.
We are subject to various legal proceedings and claims, the outcomes of which are uncertain. If we fail to accurately evaluate the probability of loss or the amount of possible losses, an adverse outcome may materially and adversely affect our financial condition and results of operations.We are party from time to time to various legal proceedings and claims generally incidental to our business including without limitation intellectual property and product liability claims. For each of these proceedings and claims, our management evaluates, based on the relevant facts and legal principles, the likelihood of an unfavorable outcome and whether the amount of the loss can be reasonably estimated, in connection with our determination of whether or not to record a charge to earnings. Significant subjective judgments are required in these evaluations, including judgments regarding the validity of asserted claims and the likely outcome of legal, arbitration and administrative proceedings. The outcome of these proceedings is subject to a number of factors beyond our control. In addition, estimates of the potential costs associated with legal, arbitration and administrative proceedings frequently cannot be subjected to any sensitivity analysis, as damage estimates or settlement offers by claimants may bear little or no relation to the eventual outcome. Finally, in any particular proceeding, even where we believe that we would ultimately prevail, we may agree to settle or to terminate a claim or proceeding where we believe that doing so, when taken together with other relevant commercial considerations, is more cost-effective than engaging in an expensive and protracted contest. If we do not accurately assess the probability of an unfavorable outcome or the range of possible loss, an unfavorable outcome could have a material adverse impact on our financial condition and results of operations.
If our products are found to be defective, we may be required to recall and/or replace them, which could be costly and result in a material adverse effect on our business, financial position and net earnings.One or more of our products may be found to be defective after we have already shipped the products in volume, requiring a product replacement or recall. We may also be subject to product returns and product liability claims that could impose substantial costs and have a material and adverse effect on our business, financial position and net earnings.
ASM INTERNATIONAL | STATUTORY ANNUAL REPORT 2014
RISK MANAGEMENT | RISK FACTORS 60

We may not be able to recruit or retain qualified personnel or integrate qualified personnel into our organization. Consequently, we could experience reduced sales, delayed product development and diversion of management resources.Our business and future operating results depend in part upon our ability to attract and retain qualified management, technical, sales and support personnel for our operations on a worldwide basis. Competition for qualified personnel is intense, and we cannot guarantee that we will be able to continue to attract and retain qualified personnel, particularly during sustained economic upturns in the industry. Availability of qualified technical personnel varies from country to country, and may affect the operations of our subsidiaries in some parts of the world. Our operations could be negatively affected if we lose key executives or employees or are unable to attract and retain skilled executives and employees as needed. In particular, if our growth strategies are successful, we may not have sufficient personnel to manage that growth and may not be able to attract the personnel needed. We have agreements with some, but not all, key employees, restricting their ability to compete with us after their employment terminates. We do not maintain insurance to protect against the loss of key executives or employees. Our future growth and operating results will depend on: › our ability to continue to broaden our senior management group; › our ability to attract, hire and retain skilled employees; and › the ability of our officers and key employees to continue to expand, train and manage our employee base.
We have in the past experienced intense competition for skilled personnel during market expansions and believe competition will be intense if the semiconductor market experiences a sustained expansion. Consequently, we generally attempt to minimize reductions in skilled personnel in reaction to industry downturns, which reduces our ability to lower costs by payroll reduction.
Because the costs to semiconductor manufacturers of switching from one semiconductor equipment supplier to another can be high, it may be more difficult to sell our products to customers having a competing installed base, which could limit our growth in sales and market share.We believe that once a semiconductor manufacturer has selected a supplier’s equipment for a particular product line, that manufacturer generally continues to rely on that supplier for future equipment requirements, including new generations of similar products. Changing from one equipment supplier to another is expensive and requires a substantial investment of resources by the customer. Accordingly, it is difficult to achieve significant sales to a customer using another supplier’s equipment. Our inability to sell our products to potential customers who use another supplier’s equipment could adversely affect our ability to increase revenue and market share.
Our reliance on a limited number of suppliers and a single manufacturing facility could result in disruption of our operations.We outsource a significant portion of the manufacturing of our business to a limited number of suppliers. If our suppliers were unable or unwilling to deliver products in a timely manner to us in the quantities we require for any reason – including but not limited to – capital constraints, natural disaster, labor unrest, capacity constraints, supply chain management problems or contractual disputes, we may be unable to fill customer orders on a timely basis, which could negatively affect our customer relationships and financial performance. Many of our suppliers face economic challenges in a depressed or difficult global economy, which increases our risk of disruption from a supplier’s failure to perform its obligations to us in a timely manner.
We have shifted much of our manufacturing and assembly to our Front-end Manufacturing Singapore (‘FEMS’) facility. If this facility experiences a manufacturing disruption for any reason – including but not limited to – natural disaster, labor unrest, capacity constraints, supply chain management problems or contractual disputes, our ability to timely meet our customers’ needs may be impaired, which would negatively affect our customer relationships and financial performance.
ASM INTERNATIONAL | STATUTORY ANNUAL REPORT 2014
RISK MANAGEMENT | RISK FACTORS 61

We operate worldwide; economic, political, military or other events in a country where we make significant sales or have significant operations could interfere with our success or operations there and harm our business.We market and sell our products and services throughout the world. We have operating facilities in the Netherlands, the United States, Japan, Singapore, Malaysia and South Korea. Our operations are subject to risks inherent in doing business internationally, including, but not limited to: › unexpected changes in regulatory or legal requirements or changes in one country in which we do business which are inconsistent with regulations in another country in which we do business; › potentially adverse tax consequences; › fluctuations in foreign currency exchange rates and foreign currency controls; › political conditions and instability; › economic conditions and instability; › terrorist activities; › human health emergencies, such as the outbreak of infectious diseases or viruses; › tariffs and other trade barriers, including current and future import and export restrictions and compliance requirements, and freight rates; › difficulty in staffing, coordinating and managing international operations; › burden of complying with a wide variety of foreign laws and licensing requirements; › differences in intellectual property right protection; › differences in rights to enforce agreements; › differences in commercial payment terms and practices; and › business interruption and damage from natural disasters, such as earthquakes, tsunamis and floods.
These factors could increase our costs of doing business in a particular region or result in delays or cancellations of purchase orders or disrupt our supply chain, any of which could materially and adversely impact our business and operating results.
Environmental laws and regulations and operation of our equipment may expose us to liability and increase our costs.Our operations are subject to many environmental laws and regulations wherever we operate, governing, among other things, air emissions, wastewater discharges, the use and handling of hazardous substances, waste disposal and the investigation and remediation of soil and groundwater contamination. To the extent such regulations or directives apply to our business throughout the world, these measures could adversely affect our manufacturing costs or product sales by forcing us or our suppliers to change production processes or use more costly or scarce materials. As with other companies engaged in similar activities, we face inherent risks of environmental liability in our current and historical manufacturing, R&D activities, and operations. Accordingly, costs and regulatory fines associated with such future environmental compliance or remediation obligations could adversely affect our business. We seek to mitigate these environmental and operational risks through preventative and protective safety and health practices, but there is no assurance that such measures will eliminate all such risks, which could result in significant adverse effects on our business, financial condition and operational results.
A significant disruption in our information technology systems could adversely affect our business.Our internal information technology systems are a fundamental component of our business operations. In today’s world, these systems are subject to compromise by aging other matters such as computer viruses, unauthorized access and general system failures or unforeseen difficulties. We focus on proactive measures to prevent and mitigate such risks; however, such incidents could compromise our systems, resulting in business disruption and theft of confidential information. In addition to potential negative business effects and financial impact, we may incur significant costs to remedy such issues and resultant damage.
ASM INTERNATIONAL | STATUTORY ANNUAL REPORT 2014
RISK MANAGEMENT | RISK FACTORS 62

Any acquisitions or investments we may make could disrupt our business and harm our financial condition.We may consider from time to time additional investments in complementary businesses, products or technologies. We may not be able to successfully integrate these businesses, products, technologies or personnel that we might acquire in the future, and accordingly we may not realize the anticipated benefits from such acquisitions. In particular, our operation of acquired businesses involves numerous risks, including wbut not limited to: › problems integrating the purchased operations, technologies or products; › unanticipated costs and liabilities for which we are not able to obtain indemnification from the sellers; › diversion of management’s attention from our core business; › adverse effects on existing business relationships with customers; › risks associated with entering markets in which we have no, or limited, prior experience; › risks associated with installation, service and maintenance of equipment of which we have limited or no prior experience; › limited technical documentation of the equipment developed in the acquired company; and › potential loss of key employees, particularly those of the acquired organizations.
In addition, in the event of any future acquisitions of such businesses, products or technologies, we could: › issue shares that would dilute our current shareholders’ percentage ownership; › incur debt; › assume liabilities; › incur impairment expenses related to goodwill and other intangible assets; or › incur substantial accounting write-offs.
RISKS RELATED TO OUR MINORITY INTEREST IN ASM PACIFIC TECHNOLOGYA significant portion of our total assets is composed of our minority interest in ASMPT. Changes in ASMPT’s market, business or results of operations may adversely impact our reported earnings and the trading price of our common shares.Prior to March 2013, we owned approximately 52% of the outstanding equity of ASMPT, and the assets and operating results of ASMPT were reported by us on a consolidated basis. On March 15, 2013, we disposed of a 12% stake in ASMPT, which reduced our ownership to approximately 40% of the outstanding equity. As a result of this, ASMPT ceased to be a consolidated subsidiary as of that date and our pro rata interest in the net earnings of ASMPT is reported in our Consolidated statements of operations on the line, result from investments. See for further information Note 3 Divestment and Note 12 Investments and associates to the Consolidated financial statements.
The trading price of our shares may be adversely impacted by developments affecting ASMPT’s business, results of operations or prospects. Although ASMPT operates in the same industry as ASM International, ASMPT addresses a different segment of the industry, which may involve different market dynamics and competitive factors from time to time, as well as different business risks unique to their operations. ASMPT is a public company traded on the Hong Kong Stock Exchange and further information is provided in their public reports.
The management of ASMPT may respond to market, business or other developments in a manner different than we would under similar circumstances, and in a manner that may not be in our best interests. Although we are the largest shareholder of ASMPT, we do not possess the right to control ASMPT. Accordingly, the value of our equity interest in ASMPT, and our pro rata share of ASMPT’s net earnings reported in our Consolidated statements of operations on the line, result from investments could change materially due to factors outside of our control and unrelated to our business or markets, which could materially and adversely impact our net income and the trading price of our common shares.
ASM INTERNATIONAL | STATUTORY ANNUAL REPORT 2014
RISK MANAGEMENT | RISK FACTORS 63

Although we are a substantial shareholder, ASMPT is not obligated to pay dividends to us and may take actions or enter into transactions that are detrimental to us.We currently own 39.75% of the outstanding common shares of ASMPT. In addition both members of our Management Board are also members of the ASMPT Board of Directors. However, these directors are under no obligation to take any actions as directors of ASMPT that are beneficial to us. Issues and conflicts of interest therefore may arise which might not be resolved in our best interest.
In addition, the directors of ASMPT are under no obligation to declare a payment of dividends to shareholders. As a shareholder of ASMPT, we cannot compel the payment or amount of dividends. With respect to the payment of dividends, the directors must consider the financial position of ASMPT after the dividend. Cash dividends received from ASMPT totaled €29.6 million, €10.3 million and €20.0 million in 2012, 2013, and 2014, respectively.
The directors of ASMPT owe their fiduciary duties to ASMPT and may approve transactions to which we are a party only if the transactions are commercially beneficial to ASMPT. Further, under the listing rules of the Hong Kong Stock Exchange, directors who are on the boards of both ASMPT and ASM International are not permitted to vote on a transaction involving both entities. This would disqualify all affiliates of ASM International who serve on the board of ASMPT from voting on any such transaction.
As a shareholder of ASMPT, we can vote our shares in accordance with our own interests. However, we may not be entitled to vote on transactions involving both us and ASMPT under the listing rules of the Hong Kong Stock Exchange and the Hong Kong Takeovers Code.
RISKS RELATED TO AN INVESTMENT IN OUR SHARESOur founder, who is also Chairman of the Board of ASMPT, controlled as per December 31, 2014 approximately 18.02% of the voting power, which gives him significant influence over matters voted on by our shareholders, including the election of members of our Supervisory Board and Management Board, and makes it substantially more difficult for a shareholder group to remove or elect such members without his support.Our founder, Arthur H. del Prado, controlled approximately 18.02% of the voting power of our outstanding common shares as of December 31, 2014. Accordingly, he has significant influence on the outcome of matters submitted to a shareholder vote, such as the election of the members of our Supervisory Board and Management Board. Persons nominated by the Supervisory Board for appointment by the shareholders to the Supervisory Board or Management Board at a general meeting of shareholders will be elected if they receive a majority of the votes cast at the meeting. Nominees to the Supervisory Board or Management Board who are not proposed by the Supervisory Board are appointed if they receive the affirmative vote of a majority of the votes cast at the meeting, provided such affirmative votes represent at least one third of our issued capital. Members of the Supervisory and Management Boards may be removed only by the affirmative vote of a majority of the votes cast at a meeting, and, unless such removal is recommended by the Supervisory Board, the affirmative votes must represent at least one third of our issued capital. This makes it difficult for a group of shareholders to remove or elect members of our Supervisory Board or Management Board without the support of our founder.
ASM INTERNATIONAL | STATUTORY ANNUAL REPORT 2014
RISK MANAGEMENT | RISK FACTORS 64
Our anti-takeover provisions may prevent a beneficial change of control.The Company has granted to Stichting Continuïteit ASM International (‘Stichting’) – a non-membership organization – with a board composed of three members independent of ASMI, the right to acquire and vote our preferred shares. The objective of Stichting is to serve the interests of the Company. To that objective, Stichting may, among other things, acquire, own and vote our preferred shares in order to maintain our independence and/or continuity and/or identity. This may prevent a change of control from occurring that shareholders may otherwise support. On May 14, 2008, Stichting exercised this right in response to a perceived threat to our continuity and acquired shares of our preferred stock representing 29.9% of the total voting power of our outstanding capital shares at that time. These shares were retired in 2009 and a new right was issued to Stichting to acquire and vote preferred shares in certain situations in the future. For additional information regarding Stichting, see Item 7, Major shareholders and related party transactions.
The voting power of Stichting makes it more difficult for a shareholder or a group of shareholders to cause us to enter into a change of control transaction not supported by Stichting, even if such a transaction offers our shareholders an opportunity to sell their shares at a premium over the market price.
We must offer a possible change of control transaction to Applied Materials first.Pursuant to our 1997 settlement agreement with Applied Materials, as amended and restated in 1998, if we desire to effect a change of control transaction, as defined in the settlement agreement which generally involves our operations and not our holdings in ASMPT, with a competitor of Applied Materials, we must first offer the change of control transaction to Applied Materials on the same terms as we would be willing to accept from that competitor pursuant to a bona fide arm’s length-offer made by that competitor.
Our stock price has fluctuated and may continue to fluctuate widely.The market price of our common shares has fluctuated substantially in the past. Between January 1, 2014 and December 31, 2014, the sale price of our common shares, as reported on the Nasdaq Global Select Market, ranged from a low of US$32.06 to a high of US$44.17. The market price of our common shares will continue to be subject to significant fluctuations in the future in response to a variety of factors, including the risk factors discussed in this report and the following, but not limited to: › future announcements concerning our business or that of our competitors or customers; › the introduction of new products or changes in product pricing policies by us or our competitors; › litigation regarding proprietary rights or other matters; › changes in analysts’ earnings estimates and recommendations; › developments in the financial markets; › quarterly fluctuations in operating results; › hedge fund and shareholder activist activities; › general economic, political and market conditions, such as recessions or foreign currency fluctuations; and › general conditions in the semiconductor- and semiconductor equipment industries.
In addition, public stock markets frequently experience substantial price and trading volume volatility, particularly in the high technology sectors of the market. This volatility has significantly affected the market prices of securities of many technology companies for reasons frequently unrelated to or disproportionately impacted by the operating performance of these companies. These broad market fluctuations may adversely affect the market price of our common shares.
ASM INTERNATIONAL | STATUTORY ANNUAL REPORT 2014
RISK MANAGEMENT | RISK FACTORS 65

Our quarterly revenues and earnings from operations have varied significantly in the past and may vary in the future due to a number of factors, including, but not limited to:
› cyclicality and other economic conditions in the semiconductor industry; › production capacity constraints: › the timing of customer orders, cancellations and shipments; › the length and variability of the sales cycle for our products; › the introduction of new products and enhancements by us and our competitors; › the emergence of new industry standards; › product obsolescence; › disruptions in sources of supply; › our ability to time our expenditures in anticipation of future orders: › our ability to fund our capital requirements; › changes in our pricing and pricing by our suppliers and competitors; › our product and revenue mix; › seasonal fluctuations in demand for our products; › foreign currency exchange rate fluctuations; e.g. appreciation of the euro versus the Japanese yen and US dollar, which would negatively affect the competitiveness of those manufacturing activities that are domiciled in countries whose currency is the euro; and › economic conditions generally or in various geographic areas where we or our customers do business.
In addition we derive a substantial portion of our net sales from products that have a high average selling price and significant lead times between the initial order and delivery of the product. The timing and recognition of net sales from customer orders can cause significant fluctuations in our earnings from operations from quarter to quarter. Gross margins realized on product sales vary depending upon a variety of factors, including the mix of products sold during a particular period, negotiated selling prices, the timing of new product introductions and enhancement,s and manufacturing costs. A delay in a shipment near the end of a fiscal quarter or year, due, for example, to rescheduling or cancellations by customers or to unexpected manufacturing difficulties experienced by us, may cause sales in a particular period to fall significantly below our expectations and may materially adversely affect our earnings from operations for that period. Further, our need to continue expenditures for research and development, and engineering make it difficult for us to reduce expenses in a particular quarter even if our sales goals for that quarter are not met. Our inability to adjust spending quickly enough to compensate for any sales shortfall would magnify the adverse impact of a sales shortfall on our earnings from operations. In addition, announcements by us or our competitors of new products and technologies could cause customers to defer purchases of our existing systems, which could negatively impact our financial position and net earnings.
As a result of these factors, our revenues or earnings from operations may vary significantly from quarter to quarter. Any shortfall in revenues or earnings from operations from levels expected by securities analysts and investors could cause a decrease in the trading price of our common shares.
ASM INTERNATIONAL | STATUTORY ANNUAL REPORT 2014
RISK MANAGEMENT | RISK FACTORS 66

The significant risks currently considered relevant, potential consequences, and applicable mitigating actions can be outlined as follows:
RISK POTENTIAL CONSEQUENCES MITIGATING MEASURES
Strategic
Ability to respond to changes in product demand and technology change.
Financial loss due to decreased orders and/or reputation damage.
- Appropriate investment in R&D initiatives to support both strategic objectives and customer requests.
Ability to attract and retain appropriately qualified and experienced personnel.
Reduced sales, delayed product development and diversion of management resources.
- Robust talent management and succession planning tools.
Cyclical nature of the semiconductor market. Financial loss due to reduced demand and fixed overheads during industry downturns. Abrupt increases in demand for semiconductor devices and insufficient production capacity during industry upturns.
- Outsourcing generic manufacturing.
Dependence on small number of large customers.
Loss of a customer or significant reduction in demand could result in significant downturn in financial results.
Commitment to: - delivering quality tools and equipment with
robust quality assurance processes and controls in place;
- timely response to customer requests; and- pro-actively working with customers to
strengthen relationships and ensure as far as possible we meet expectations.
Operational
Failure to adequately protect our Intellectual Property (‘IP’) and/or leakage of our IP.
Loss of competitive advantage could adversely impact demand and financial performance.
Robust governance framework and controls in place to establish maintain and protect our intellectual property rights. Control framework established to minimize as far as possible the risk of data leakage.
Failure to deliver product of sufficient quality or on time.
Financial loss due to penalties, rework and/or reduced future demand.
Commitment to:- delivering quality tools and equipment with
robust quality assurance processes and controls in place; and
- timely response to customer requests through 24/7.
IT security breaches including cyber attacks. Reputation damage. IT risk management framework.
Failure of contract manufacturer to deliver. Financial loss due to penalties, rework and/or reduced future demand.
Effective disaster recovery plan in place for contract manufacturers.
Disruption of material supplies. Loss of reputation and/or financial loss. Effective disaster recovery plan to ensure continuity of material supplies.
Disruption of critical business processes through IT downtime.
Potential loss of reputation and/or financial loss.
Comprehensive IT disaster recovery plan based on detailed business impact analysis.
Safety, health and environment. Incidents and accidents in the supply chain. Effective global SHE organization and tracking, monitoring and evaluation of accidents.
Financial
Financial reporting is not complete or accurate.
Reputation damage and/or financial loss. Finance control framework.
Compliance
Non adherence to laws and regulations in respect of environment, labor and data privacy.
Reputation damage and/or financial loss. Detailed policies, procedures and work instructions.
ASM INTERNATIONAL | STATUTORY ANNUAL REPORT 2014
RISK MANAGEMENT | RISK FACTORS 67

2014 was a successful year for the company, with record revenues for the Front-end business. We further expanded the number of customers using our ALD and PEALD solutions, and continued to focus on developing our leadership in ALD. In this chapter we expand on the year’s key operational developments, and summarise our business and strategic objectives. We also provide an overview of the business, including our products and processes, R&D, customers and competition.
MANAGEMENT REPORT
MANAGEMENT BOARD
CHARLES D. (CHUCK) DEL PRADO
Chairman of the Management Board President and
Chief Executive Officer
PETER A.M. VAN BOMMEL
Member of the Management Board
Chief Financial Officer
68

MANAGEMENT’S DISCUSSION AND ANALYSIS OF FINANCIAL CONDITION AND RESULTS OF OPERATIONS
INTRODUCTIONWe are an equipment supplier mainly to the semiconductor manufacturing industry. We design, manufacture and sell equipment and services to our customers for the production of semiconductor devices, or integrated circuits. The semiconductor capital equipment market is composed of three major market segments: wafer processing equipment, assembly and packaging equipment, and test equipment. ASMI through its Front-end business is active in the wafer processing segment. In addition, we have a 39.75% investment in ASM Pacific Technology, which is a leading supplier of assembly and packaging equipment to the semiconductor, LED and electronics markets.
ASMI sells its products to the semiconductor manufacturing industry and, through its 40% stake in ASMPT, to the assembly industry, which is subject to sudden, extreme, cyclical variations in product supply and demand. We conduct our Front-end business through wholly-owned subsidiaries, the most significant being ASM Front-end Manufacturing Singapore Pte Ltd (‘FEMS’), located in Singapore, ASM Europe BV (‘ASM Europe’), located in the Netherlands, ASM America, Inc (‘ASM America’), located in the United States, ASM Japan KK (‘ASM Japan’), located in Japan, and ASM Genitech Korea Ltd (‘ASM Genitech’) located in South Korea. The location of our facilities allows us to interact closely with customers in the world’s major geographical market segments: Europe, North America, and Asia.
Our wafer processing business supplies equipment to the leading semiconductor manufacturers in the logic, foundry and memory markets, primarily for the deposition of thin films. The logic market is made up of manufacturers who create chips that are used to process data, the foundry market consists of businesses that operate semiconductor fabrication plants to manufacture the designs of other semiconductor companies, and the memory market covers manufacturers who make chips that store information either temporarily or permanently, such as Random Access Memory (‘RAM’). We also supply equipment to leading manufacturers of analog semiconductor devices.
The principal markets that we address in wafer processing are selected segments of the deposition equipment market. The total deposition equipment market is estimated to be US$7.8 billion in 2014 (VLSI Research, January 2015). Within this market we focus on the following segments: vertical furnaces, epitaxy, PECVD and ALD. ALD is an advanced technology that deposits atomic layers one at a time on wafers. This process is used to create ultra-thin films of exceptional quality and flatness. Plasma is sometimes used to enhance the process further (plasma enhanced ALD, or PEALD) and may enable the deposition at reduced process temperature.
MOORE’S LAWA key driver in the semiconductor industry is the continuous demand for smaller, faster and cheaper semiconductor components. Through technology advances in the manufacturing process, semiconductor manufacturers are continuously scaling chips to smaller dimensions. This enables more transistors to fit in the same physical space, thereby reducing the costs and increasing the speed and the performance of a device. Another trend is that towards vertical or 3D transistors. This trend also helps to keep the industry on track with Moore’s Law (processor speeds, or overall processing power for computers will double every two years).
The manufacture of ever smaller and more complex devices requires more advanced and precise deposit techniques. ALD and PEALD offer the precision needed to deposition ultra-thin and highly conformal films, even on challenging 3D surfaces. Our portfolio of atomic layer deposition (‘ALD’) products is an enabling technology for our customers, helping them to manufacture semiconductor devices at smaller line widths with new materials and 3D architectures. Our technologies support our customers in their roadmap towards chips with a higher performance and reduced energy consumption, which in turn enables the introduction of new and
SUMMARY
ASM INTERNATIONAL | STATUTORY ANNUAL REPORT 2014
MANAGEMENT REPORT | SUMMARY 69

more advanced products ranging from high-end servers to smartphones, wearable devices and automotive electronics.
Our investment in ASM Pacific Technology represents the Back-end business. The Back-end operations are conducted through facilities in Hong Kong, the People’s Republic of China, Singapore, Malaysia and Germany. On March 15, 2013 we reduced our shareholding in ASMPT from 52% to 40%. The sale of the 12% stake in ASMPT caused and required the deconsolidation of ASMPT. Since that date our share of the net result of ASMPT is reported on the line result from investments.
STRATEGYOur strategic objective is to realize profitable, sustainable growth by capitalizing on our innovative strength, operational excellence and our leadership in ALD and other business segments we are active in. The key elements of our strategy include:
Innovative strengthASM has always been recognized for its technology leadership. Today, we provide leading technologies that support our customers in staying on the curve of Moore’s Law. Our innovative strength is what differentiates us in the marketplace and continues to be the cornerstone of our strategy. Apart from our internal R&D efforts, we are continuously expanding and deepening our strategic cooperation with key customers, suppliers, chemicals manufacturers, and research institutes such as imec. We also expand our patent portfolio where it is necessary and beneficial.
Leadership in ALDALD and PEALD technologies have been established as mainstream technologies in high-volume manufacturing supporting virtually all of the leading customers in the semiconductor industry. As a leader in this space, ALD and PEALD have turned into a key growth driver for our business. We expect that the trends of continued scaling and evolution towards 3D device structures will further expand the number of applications for ALD. We aim to maintain our leading position in ALD, by leveraging on our strong expertise and established customer relationships, and by developing new applications to support our customers with increasingly complex device node transitions.
Operational excellence While technology leadership remains crucial, we continue to focus on further improving the effectiveness of our organization and the efficiency of processes. We aim to provide our customers with dependable leading-edge products and services at a consistent quality and the best cost of ownership. To this end, we continue to optimize our manufacturing and global sourcing processes, including the migration to common product platforms.
OPERATIONSFollowing a drop in 2013, global spending on wafer fab equipment strongly rebounded in 2014. Gartner estimated that the semiconductor equipment market grew by 17% in 2014. While spending in the foundry and logic segments remained at healthy levels, the memory segment accounted for the largest part of the increase in the overall equipment market. Leading-edge equipment continued to represent the largest part of global equipment spending in 2014.
We increased our revenue by 21% to a record high level for our Front-end operations. After a strong out-performance in 2013 our revenue grew again faster than the broader equipment market in 2014. Growth in our sales in 2014 was mainly driven by increased tool volumes in our combined ALD and PEALD business.
ASM INTERNATIONAL | STATUTORY ANNUAL REPORT 2014
MANAGEMENT REPORT | SUMMARY 70
ALD has become a mainstream technology for high-k metal gate applications. Some of our customers have already ramped as many as four technology generations using our ALD equipment. In the more recent years, we have successfully penetrated additional customers. Our PEALD business posted strong growth on the back of the increase in spending on leading-edge equipment. With this technology we have a strong position in spacer-defined double patterning, which is used extensively in the memory market. Importantly, we have successfully increased our penetration in the memory market in recent years. Some of these new customers started to deploy our PEALD technology for the first time in substantial volumes in 2014. We also benefited from new PEALD applications in the logic and foundry segments, which started to contribute to revenue in 2014. Following several years of steady growth in customer deployment and the development of new applications, ALD has turned into a key growth driver for our company. Our ALD and PEALD product lines accounted for more than half of total equipment revenue in 2014.
Building on the strong momentum in the second half of 2013, revenue increased to new record highs in the first half of 2014 for our Front-end business. While still higher year-over-year revenue in the second half decreased sequentially, as some of our customers were absorbing the investments that they had made in earlier quarters. Nevertheless, underlying demand remained healthy, particularly in the memory segment, as reflected by bookings that were even higher in the second half compared to the already strong levels achieved in the first half of the year. For the year in total our new bookings increased by 26% in 2014. We finished the year with an order backlog of €176 million, a 53% increase compared to the end of 2013.
Gross margin increased by 400 basis points in 2014. This follows on a strong increase of 500 basis points in 2013. The improvement in 2013 was driven by the increase in sales and continued high levels of utilization. Next to the solid development in revenue, the improvement in 2014 also reflected execution of our gross margin improvement measures. In 2013, we started a number of programs to further increase the efficiency and flexibility of our manufacturing operations and supply chain, from which we saw the benefits in 2014. Measures included new outsourcing initiatives, a stronger focus on the sourcing of complete sub-assemblies and the migration of a larger part of our supply base to Asia. On a quarterly basis, differences in gross margins were mainly impacted by changes in the sales mix.
Selling, general and administrative expenses as a percentage of sales dropped from 15.3% in 2013 to 14.7% in 2014. Research and development expenses excluding impairment charges on capitalized development costs remained 11% of sales. Operating profit more than doubled from €44.9 million in 2013 to €93.4 million in 2014.
Results from investments contributed €38.6 million, primarily reflecting our 40% shareholding in ASMPT. Excluding a net book profit of €1 billion in 2013 on the sale of 12% of the ASMPT shares and the effects of purchase price allocation, results from investment increased from €23.7 million for the prior year to €61.2 million for 2014. ASMPT showed a strong recovery in results in 2014, with revenue increasing by 31%. Next to an overall recovery in market conditions, ASMPT benefited from new products addressing the advanced packaging segment, share gains in the SMT equipment market and the acquisition of DEK. On the back of the rise in revenue and improving margins, ASMPT increased net profits which includes a provision for a tax settlement of ASMPT in Hong Kong for the period 2001-2010 with an impact of €9 million almost threefold during the year.
ASM INTERNATIONAL | STATUTORY ANNUAL REPORT 2014
MANAGEMENT REPORT | SUMMARY 71

CRITICAL ACCOUNTING POLICIES
INTRODUCTIONSince the initial listing of ASMI on Nasdaq Global Select Market in the United States of America, ASMI has followed accounting principles generally accepted in the United Stated of America (‘US GAAP’), both for internal as well as external purposes. We are required by European Regulations to also publish Consolidated financial statements in accordance with International Financial Reporting Standards (‘IFRS’) from 2005 onwards. The accompanying Consolidated financial statements, prepared for statutory purposes, have been prepared in accordance with IFRS as endorsed by the European Union.
For ASMI, the principal differences per December 31, 2014 between US GAAP and IFRS relate to accounting for goodwill, accounting for development expenses, accounting for inventory obsolescence reserve, pensions and accounting for debt issuance fees.
Our discussion and analysis of our financial condition and results of operations are based upon our Consolidated financial statements, which have been prepared in accordance with IFRS. We apply the going concern basis in preparing our Consolidated financial statements. Historical cost is used as the measurement basis unless otherwise indicated. The preparation of consolidated financial statements and related disclosures in conformity with IFRS requires management to make judgments, assumptions and estimates that affect the amounts reported. Note 1 of Notes to Consolidated financial statements describes the significant accounting policies used in the preparation of the Consolidated financial statements. Certain of these significant accounting policies are considered to be critical accounting policies.
CRITICAL ACCOUNTING POLICIES AND ESTIMATESThe preparation of Consolidated financial statements and related disclosures in conformity with IFRS requires management to make judgments, assumptions and estimates that affect the amounts reported. Note 1 of Notes to Consolidated financial statements provides a summary of our significant accounting policies used in the preparation of the consolidated financial statements. Some of these significant accounting policies are considered to be critical accounting policies.
A critical accounting policy is defined as one that is both material to the presentation of ASMI’s consolidated financial statements and that requires management to make difficult, subjective or complex judgments that could have a material effect on ASMI’s financial condition or results of operations. Specifically, these policies have the following attributes: (1) ASMI is required to make assumptions about matters that are highly uncertain at the time of the estimate; and (2) different estimates ASMI could reasonably have used, or changes in the estimate that are reasonably likely to occur, would have a material effect on ASMI’s financial condition or results of operations.
Estimates and assumptions about future events and their effects cannot be determined with certainty. ASMI bases its estimates on historical experience and on various other assumptions believed to be applicable and reasonable under the circumstances. These estimates may change as new events occur, as additional information is obtained and as ASMI’s operating environment changes. These changes have historically been minor and have been included in the Consolidated financial statements as soon as they became known. In addition, management is periodically faced with uncertainties, the outcomes of which are not within its control and will not be known for prolonged periods of time. These uncertainties include those discussed in the chapter Risk management. Based on a critical assessment of its accounting policies and the underlying judgments and uncertainties affecting the application of those policies, management believes that ASMI’s Consolidated financial statements are fairly stated in accordance with IFRS, and provide a meaningful presentation of ASMI’s financial condition and results of operations. An analysis of specific sensitivity to changes of estimates and assumptions is included in the notes to the financial statement.
ASM INTERNATIONAL | STATUTORY ANNUAL REPORT 2014
MANAGEMENT REPORT | CRITICAL ACCOUNTING POLICIES 72

Management believes that the following are critical accounting policies: › revenue recognition; › inventories; › warranty allowance: › evaluation of long-lived assets for impairment; › evaluation of investments in associates for impairment; › contingencies and litigation; and › income taxes.
For information regarding new accounting pronouncements, see Note 1 to our Consolidated financial statements.
ASM INTERNATIONAL | STATUTORY ANNUAL REPORT 2014
MANAGEMENT REPORT | CRITICAL ACCOUNTING POLICIES 73

OPERATIONS UPDATE
RESULTS OF OPERATIONS 2014 COMPARED TO 2013
ResultsAs a result of the sale on March 15, 2013 of a 12% share in ASMPT, ASMI lost control over ASMPT, the Back-end segment. Following the cease of control ASMPT was presented as a discontinued operation. Consequently the historic net results of ASMPT as well as the gain on the sale of the ASMPT share and the remeasurement gain are presented in the consolidated statement of income on the line results from discontinued operations. From the date ASMI lost control the investment in ASMPT has been accounted for under the equity method and the related results are presented under results from investments and associates (see Note 3 to the consolidated annual accounts).
The following table shows the operating performance for the year 2014, compared to the year 2013:
(EUR million) 2013 2014 CHANGE
New orders 479.6 602.1 26%
Backlog 114.8 176.1 53%
Book-to-bill 1.1 1.1
Net sales 452.0 545.6 21%
Gross profit 176.2 235.3 34%
Gross profit margin % 39.0% 43.1%
Selling, general and administrative expenses (61.6) (80.0) 30%
Research and development expenses (58.1) (60.4) 4%
Impairment charges property, plant and equipment and other intangible assets (8.6) (0.9) n/a
Amortization other intangible assets (0.5) (0.5) -%
Restructuring expenses (2.5) (0.1) n/a
Operating result 44.9 93.4 48.5
Operating margin % 9.9% 17.1%
Financing income/(costs) (10.2) 24.8 35.0
Income tax (8.9) (19.4) (10.5)
NET EARNINGS BEFORE RESULTS FROM INVESTMENTS 25.8 98.8 73.0
Result from investments (368.3) 39.4 407.7
Result from discontinued operations 1,402.6 3.2 (1,399.4)
Net earnings 1,060.1 141.3 (918.8)
Net earnings allocated to the shareholders of the Company 1,062.7 141.3 (921.4)
Net earnings per share, diluted €16.55 €2.20 €(14.35)
Net earnings per share excluding remeasurement gain, realized gain on sale of ASMPT shares, amortization, impairment and fair value adjustments €0.71 €2.49 €1.78
ASM INTERNATIONAL | STATUTORY ANNUAL REPORT 2014
MANAGEMENT REPORT | OPERATIONS UPDATE 74

The following table shows certain consolidated statement of operations data as a percentage of net sales for our continued operations for the years 2013 and 2014:
2013 2014
Net sales 100.0% 100.0%
Cost of sales (61.0%) (56.9%)
GROSS PROFIT 39.0% 43.1%
Selling, general and administrative expenses (13.6%) (14.7%)
Research and development expenses (12.8%) (11.1%)
Amortization of other intangible assets (0.1%) (0.1%)
Impairment charges (1.9%) (0.2%)
Restructuring expenses (0.5%) -%
EARNINGS (LOSS) FROM OPERATIONS 9.9% 17.1%
Net interest income (expense) (0.3%) (0.3%)
Foreign currency exchange gains (losses) (2.0%) 4.8%
Result from investments (81.5%) 7.2%
EARNINGS (LOSS) BEFORE INCOME TAXES (73.8%) 28.9%
Income tax income / (expense) (2.0%) (3.6%)
NET EARNINGS (LOSS) FROM CONTINUING OPERATIONS (75.8%) 25.3%
Net earnings from discontinued operations 310.3% 0.6%
NET EARNINGS FROM OPERATIONS 234.5% 25.9%
Allocation of net earnings (loss):
Shareholders of the parent 235.1% 25.9%
Minority interest (0.6%) –%
Net salesThe sales cycle from quotation to shipment for our Front-end equipment generally takes several months, depending on capacity utilization and the urgency of the order. Usually acceptance is within one to three months after shipment. The sales cycle is longer for equipment which is installed at the customer’s site for evaluation prior to sale. The typical trial period ranges from six months to one year after installation.
Our sales are concentrated in the United States, Europe and Asia. The following table shows the geographic distribution of our sales from continuing operations for the years 2013 and 2014:
YEAR ENDED DECEMBER 31,
(EUR million) 2013 2014
United States €131.2 29.0% €177.0 32.4%
Europe 73.1 16.2% 94.5 17.3%
Taiwan 78.2 17.3% 81.1 14.9%
Japan 33.8 7.5% 62.5 11.5%
South Korea 110.6 24.5% 93.6 17.2%
China 20.0 4.4% 24.6 4.5%
Other 5.1 1.1% 12.3 2.3%
€452.0 100% €545.6 100%
ASM INTERNATIONAL | STATUTORY ANNUAL REPORT 2014
MANAGEMENT REPORT | OPERATIONS UPDATE 75

A substantial portion of our sales is for equipping new or upgraded fabrication plants where device manufacturers are installing complete fabrication equipment. As a result our sales in this segment tend to be uneven across customers and financial periods. Sales to our ten largest customers accounted for 85.6% and 84.1% of net sales in 2013 and 2014, respectively. The composition of our ten largest Front-end customers changes from year to year. The largest customer from these ten accounted for 28.3% and 26.7% of Front-end net sales in 2013 and 2014, respectively.
Building on the strong momentum in the second half of 2013, revenue increased to new record high in the first half of the year for our Front-end business. While still higher year over year, revenue in the second half decreased sequentially, as some of customers were absorbing the investments that they had made in earlier quarters. Nevertheless, underlying demand remained healthy, particularly in the Memory segment, as reflected by our bookings that were even higher in the second half compared to the already strong levels achieved in the first half of the year. For the year in total our new bookings increased by 26% in 2014. We finished the year with an order backlog of €176 million, a 53% increase compared to the end of 2013. The impact of currency changes on net sales compared to prior year was a decrease of 1%.
The following table shows the level of new orders for the full year 2014 and the backlog for the same period of 2013:
FULL YEAR
(EUR million) 2013 2014 % CHANGE
BACKLOG AT THE BEGINNING OF THE YEAR 91.7 114.8 25%
New orders 479.6 602.1 26%
Net sales (452.0) (545.6) 21%
FX-effect (4.4) 4.8
BACKLOG AS PER REPORTING DATE 114.8 176.1 53%
BOOK-TO-BILL RATIO (NEW ORDERS DIVIDED BY NET SALES) 1.1 1.1
The backlog includes orders for which purchase orders or letters of intent have been accepted, typically for up to one year. Historically, orders have been subject to cancellation or rescheduling by customers. In addition, orders have been subject to price negotiations and changes in specifications as a result of changes in customers’ requirements. Due to possible customer changes in delivery schedules and requirements and to cancellation of orders, our backlog at any particular date is not necessarily indicative of actual sales for any subsequent period.
Gross profitTotal gross profit developed as follows:
FULL YEAR
GROSS PROFIT GROSS PROFIT MARGIN INCREASE (DECREASE)
PERCENTAGE POINTS(EUR million) 2013 2014 2013 2014
Front-end (continuing operations) 176.2 235.3 39.0% 43.1% 4.1ppt
The comparable gross profit for the full year 2014 increased with 34%. Gross profit margin increased by 410 basis points in 2014. This follows on a strong increase of 500 basis points in 2013. The improvement in 2013 was driven by the increase in sales and continued high levels of utilization. Next to the solid development in revenue the improvement in 2014 also reflected execution of our gross margin improvement measures. In 2013, we started a number of programs to further increase the efficiency and flexibility of our manufacturing operations and supply chain, from which we saw the benefits in 2014. Measures included new outsourcing initiatives,
ASM INTERNATIONAL | STATUTORY ANNUAL REPORT 2014
MANAGEMENT REPORT | OPERATIONS UPDATE 76

a stronger focus on the sourcing of complete sub-assemblies and the migration of a larger part of our supply base to Asia. On a quarterly basis, differences in gross margins were mainly impacted by changes in the sales mix.
The impact of currency changes on gross profit compared to prior year was a decrease of 2%.
Selling, general and administrative expensesSelling, general and administrative (‘SG&A’) expenses from continuing operations for the year 2014 increased with 15% compared to the previous year. As a percentage of sales SG&A was 14.7%. For the comparable period of 2013 this was 15.3%. The impact of currency changes on SG&A expenses was a decrease of 4% year-over-year.
Total selling, general and administrative expenses developed as follows:
FULL YEAR
(EUR million) 2013 2014 % CHANGE
Front-end (continuing operations) 69.3 80.0 15%
Research and development expensesTotal research and development expenses from continuing operations for the year, 2014 increased with 6% compared to the previous year. As a percentage of sales research and development expenses were 10%. For the comparable period of 2013 this was 12%. The impact of currency changes on research and development expenses was flat year-over-year.
Total research and development expenses developed as follows:
FULL YEAR
(EUR million) 2013 2014 % CHANGE
Front-end (continuing operations):
Research and development expenses 41.4 50.4 22%
Research and development grants and credits (1.0) (0.9) (10%)
Amortization of capitalized development expenses 10.0 10.9 9%
TOTAL 50.3 60.4 20%
Impairment capitalized development expenses 7.8 0.9
Impairment of capitalized development expenses primarily related to development of new hardware for which the customers demand has shifted out in time, and purchased technology which became obsolete.
We continue to invest strongly in research and development. As part of our research and development activities, we are engaged in various development programs with customers and research institutes these allow us to develop products that meet customer requirements and to obtain access to new technology and expertise. The costs relating to prototypes and experimental models, which we may subsequently sell to customers are charged to the cost of sales.
Our research and development operations in the Netherlands and the United States receive research and development grants and credits from various sources.
ASM INTERNATIONAL | STATUTORY ANNUAL REPORT 2014
MANAGEMENT REPORT | OPERATIONS UPDATE 77

Restructuring expensesIn the fourth quarter of 2012 we started a cost reduction program in our Front-end operation. We reduced the manufacturing organization in Singapore and our product management organization in Europe and the US by more than 100 full time equivalent positions. Related to these actions €0.9 million, €2.5 million and €0.1 million restructuring expenses were recorded in 2012, 2013 and 2014 respectively.
Operating resultTotal operating result developed as follows:
FULL YEAR
(EUR million) 2013 2014 CHANGE
Front-end (continuing operations):
BEFORE SPECIAL ITEMS 47.4 93.5 46.1
Restructuring expenses (2.5) (0.1) 2.4
INCLUDING SPECIAL ITEMS 44.9 93.4 48.5
Financing costsFinancing costs mainly reflect translation results. A substantial part of ASMI’s cash position is denominated in US dollar.
Results from investments and associatesResults from investments contributed €39.4 million, primarily reflecting our 40% shareholding in ASMPT. Excluding a net book profit of €1 billion in 2013 on the sale of 12% of the ASMPT shares and the effects of purchase price allocation, results from investment increased from €23.7 million for prior year to €61.2 million for 2014 which includes a provision for a tax settlement of ASMPT in Hong Kong for the period 2001-2010 with an impact of €9 million.
ASMPT showed a strong recovery in results in 2014, with revenue increasing by 31%. Next to an overall recovery in market conditions, ASMPT benefited from new products addressing the advanced packaging segment, share gains in the SMT equipment market and the acquisition of DEK. On the back of the rise in revenue and improving margins, ASMPT increased net profits almost threefold during the year.
The amortization of the recognized intangible assets and the depreciation of the fair value adjustment for property, plant & equipment negatively impacted net earnings for the year 2014 with €22.5 million (2013 for the period March 16 - December 31: €16.9 million). The fair value adjustments for inventories and tax related issues had a non-recurring negative impact on net earnings in 2013 of €39.8 million.
For further information on the divestment of ASMPT see Note 3 and 12 to the Consolidated financial statements.
Income tax expenseIncome tax expenses of €19.4 million (2013: €8.9 million) reflect a effective tax rate of 16.4% excluding the net results on investments. For further information on tax see Note 23 on the Consolidated financial statements.
ASM INTERNATIONAL | STATUTORY ANNUAL REPORT 2014
MANAGEMENT REPORT | OPERATIONS UPDATE 78

Net earningsNet earnings developed as follows:
FULL YEAR
(EUR million) 2013 2014 CHANGE
Front-end:
BEFORE SPECIAL ITEMS 28.3 98.6 70.2
Restructuring expenses (2.5) (0.1) 2.4
TOTAL 25.8 98.5 72.6
Back-end:
As from March 16, 2013 approximately 40% investment in ASMPT 24.1 62.2 38.1
Amortization other intangible assets and fair value changes from purchase price allocation (56.7) (22.5) 34.2
Impairment loss (335.8) - 335.8
TOTAL (368.4) 39.7 408.1
NET RESULT FROM CONTINUING OPERATIONS (342.5) 138.2 480.7
Net result ASMPT prior to March 15, 2013 (52%) (2.8) - 2.8
Realized gain on the sale of 11.88% of the ASMPT shares 252.4 - (252.4)
Unrealized remeasurement gain including amortization and impairment on the remaining 40% of the ASMPT shares 1,155.6 3.2 (1,152.4)
NET RESULT FROM DISCONTINUED OPERATIONS 1,405.2 3.2 (1,402.0)
NET RESULT FROM OPERATIONS 1,062.7 141.3 (921.4)
ASM INTERNATIONAL | STATUTORY ANNUAL REPORT 2014
MANAGEMENT REPORT | OPERATIONS UPDATE 79

Cash flowThe following table shows the cash flow statement on a comparable basis. The ASMPT numbers have been deconsolidated:
CONTINUING OPERATIONS
(EUR million) 2013 2014
NET EARNINGS FROM CONTINUING OPERATIONS (342.5) 138.2
Adjustments to cash from operating activities:
Depreciation, amortization and impairments 38.4 33.0
Income tax 6.1 7.6
Result from investments 368.3 (39.4)
Other adjustments 4.0 (14.8)
Changes in other assets and liabilities:
Accounts receivable (26.5) 6.8
Inventories 7.7 (20.0)
Accounts payable and accrued expenses 12.7 21.0
Other assets and liabilities (2.6) (7.5)
NET CASH PROVIDED (USED) BY OPERATING ACTIVITIES FROM CONTINUING OPERATIONS 65.6 124.7
NET CASH PROVIDED (USED) BY OPERATING ACTIVITIES FROM DISCONTINUED OPERATIONS 0.9 -
NET CASH PROVIDED (USED) BY OPERATING ACTIVITIES FROM OPERATIONS 66.5 124.7
Capital expenditures (10.8) (45.0)
Net purchase of intangible assets (18.2) (1.5)
Other 3.8 0.4
NET CASH PROVIDED (USED) IN INVESTING ACTIVITIES FROM CONTINUING OPERATIONS (25.2) (46.1)
NET CASH PROVIDED (USED) IN INVESTING ACTIVITIES FROM DISCONTINUED OPERATIONS 291.9 -
NET CASH PROVIDED (USED) IN INVESTING ACTIVITIES FROM OPERATIONS 266.7 (46.1)
Purchase treasury shares - (29.3)
Debt issuance fees paid - (1.4)
Proceeds from shares issued 5.8 4.8
Dividend paid and capital repaid to shareholders ASMI (301.2) (31.8)
Dividend received from investments 10.2 20.0
NET CASH PROVIDED (USED) IN FINANCING ACTIVITIES FROM CONTINUING OPERATIONS (285.2) (37.9)
NET CASH PROVIDED (USED) IN FINANCING ACTIVITIES FROM DISCONTINUED OPERATIONS (21.9) -
NET CASH PROVIDED (USED) IN FINANCING ACTIVITIES FROM OPERATIONS (307.1) (37.9)
Balance sheetNet working capital, consisting of accounts receivable, inventories, other current assets, accounts payable, accrued expenses, advance payments from customers and deferred revenue was €108 million the same level as per December 31, 2013. The number of outstanding days of working capital, measured against quarterly sales, increased from 77 days at December 31, 2013 to 78 days on December 31, 2014. Inventories include approximately €30 million of finished goods, already shipped to customers which will be recognized as revenue in future quarters. At the end of the third quarter this amount was €8 million.
ASM INTERNATIONAL | STATUTORY ANNUAL REPORT 2014
MANAGEMENT REPORT | OPERATIONS UPDATE 80

EmployeesAs of December 31, 2014, we had 1,635 employees, including 365 employees primarily involved in research and development activities, 286 in manufacturing 303 in marketing and sales, 517 in customer service and 163 in finance and administration.
The following table lists the total number of our employees and the number of our employees in our Front-end abusiness at the dates indicated, exclusive of temporary workers:
DECEMBER 31,
GEOGRAPHIC LOCATION 2013 2014
Europe
- The Netherlands 139 140
- EMEA 163 171
United States 533 600
Japan 174 186
Asia, other 494 538
TOTAL 1,503 1,635
The Back-end segment, ASMPT, employed 14,400 persons as of December 31, 2013 and 15,946 persons as of December 31, 2014.
Our Dutch operations, which employed 144 persons as of March 13, 2015, is subject to standardized industry bargaining under Dutch law, and is required to pay wages and meet conditions established as a result of negotiations between all Dutch employers in their industry and unions representing employees of those employers. Additionally, management personnel in the Dutch facilities meet as required by Dutch law with a works council consisting of elected representatives of the employees to discuss working conditions and personnel policies as well as to explain major corporate decisions and to solicit their advice on major issues.
Many of our employees are highly skilled, and our continued success will depend in part upon our ability to continue to attract and retain these employees, who are in great demand. We believe that our employee relations are good.
Subsequent events Subsequent events were evaluated up to April 9, 2015, which is the issuance date of this Annual report 2014. There are no subsequent events to report.
ASM INTERNATIONAL | STATUTORY ANNUAL REPORT 2014
MANAGEMENT REPORT | OPERATIONS UPDATE 81

LIQUIDITY AND CAPITAL RESOURCES
LIQUIDITYOur liquidity is affected by many factors, some of which are related to our ongoing operations while others are related to the semiconductor and semiconductor equipment industries, and to the economies of the countries in which we operate. Although our cash requirements fluctuate based on the timing and extent of these factors, we believe that cash generated by operations, together with the liquidity provided by our existing cash resources and our financing arrangements, will be sufficient to fund working capital, capital expenditures and other ongoing business requirements for at least the next 12 months.
On December 31, 2014, the Company’s principal sources of liquidity consisted of €386 million in cash and cash equivalents and €150 million in undrawn bank lines.
For the most part, our cash and cash equivalents are not guaranteed by any governmental agency. We place our cash and cash equivalents with high quality financial institutions to limit our credit risk exposure.
CASH FLOW FRONT-END SEGMENTIn our continuing operations we generated cash from operating activities of €124.7 million (2013: €65.6 million). In our continuing operations we used €46.1 million (2013: €25.2 million) for investing activities. In our continuing operations we used cash for financing activities of €37.9 million in 2014 and €285.2 million for 2013 (including a capital repayment of €269.5).
DEBTAs per December 31, 2014 the Company was free of debt. In December 2013 we finalized the extension of ASMI’s existing standby revolving credit facility. The maturity date of the credit commitment of €150 million was extended to December 31, 2018. As per December 31, 2013 this facility was undrawn.
See Notes 4, 13, 16, 17 and 22 to our Consolidated financial statements for discussion of our funding, treasury policies and our long-term debt.
CREDIT FACILITYAs per December 31, 2014 ASMI remains debt free. ASMI may borrow under separate short-term lines of credit with banks. The lines contain general provisions concerning renewal and continuance at the option of the banks. Total short-term lines of credit amounted to €150 million at December 31, 2014. The amount outstanding at December 31, 2014 was nil so the undrawn portion totaled €150 million. The undrawn portion represents the Company’s Standby Revolving Credit Facility of €150 million with a consortium of banks. In December 2013 the maturity date of the credit commitment of €150 million was extended from July 31, 2014 until December 31, 2018. Once the facility is used, this usage is secured by a portion of the Company’s shareholding in ASMPT or accounts receivable.
The credit facility of €150 million includes two financial covenants: › minimum consolidated tangible net worth; and › consolidated total net debt/total shareholders’ equity ratio.
These financial covenants are measured twice each year, at June 30 and December 31. The Company is in compliance with these financial covenants as of June 30, 2014 and as of December 31, 2014.
See Notes 4, 13, 17 and 20 to our Consolidated financial statements for discussion of our funding, treasury policies and our long-term debt.
ASM INTERNATIONAL | STATUTORY ANNUAL REPORT 2014
MANAGEMENT REPORT | LIQUIDITY AND CAPITAL RESOURCES 82
ASMPTOur Back-end segment, which is conducted through ASMPT, our 39.75%-owned associate on December 31, 2014 had net cash to an amount of €275 million. The cash resources and borrowing capacity of ASMPT are not available to our Front-end segment.
Although certain directors of ASMPT are directors of ASM International, ASMPT is under no obligation to declare dividends to shareholders or enter into transactions that are beneficial to us. As a substantial shareholder, we can participate in the shareholders approval of the payment of dividends, but cannot compel their payment or size. Cash dividends received from ASMPT during 2012, 2013 and 2014 were €29.6 million, €10.3 million and €20.0 million, respectively.
At the end of 2014 the market value of our 39.75% investment in ASMPT was approximately €1,257 million (carrying value €1,092 million).
OUTLOOKWe have developed forecasts and projections of cash flows and liquidity needs for the upcoming year. This takes into account the current market conditions, reasonably possible changes in trading performance based on such conditions, and our ability to modify our cost structure as a result of changing economic conditions and sales levels. We have also considered in the forecasts the total cash balances amounting to €386 million as of December 31, 2014; the ability to renew debt arrangements and to access additional indebtedness; and whether or not we will maintain compliance with our financial covenants. Based on this, we believe that our cash on hand at the end of 2014 is adequate to fund our operations, our investments in capital expenditures and to fulfill our existing contractual obligations for the next 12 months.
ASM INTERNATIONAL | STATUTORY ANNUAL REPORT 2014
83MANAGEMENT REPORT | LIQUIDITY AND CAPITAL RESOURCES | OUTLOOK

CONTRACTUAL OBLIGATIONS, CONTINGENT LIABILITIES AND COMMITMENTSWe have contractual obligations, some of which are required to be recorded as liabilities in our Consolidated financial statements, including long- and short-term debt. Other contractual arrangements, such as operating lease commitments and purchase obligations, are not generally required to be recognized as liabilities on our consolidated balance sheet, but are required to be disclosed.
The following table summarizes our contractual obligations as of December 31, 2014 aggregated by type of contractual obligation:
TOTALLESS THAN
1 YEAR 1-3 YEARS 3-5 YEARSMORE THAN
5 YEARS
Operating leases 21,964 5,821 8,169 5,321 2,653
Pension liabilities 5,153 318 714 1,261 2,860
Purchase obligations:
Purchase commitments to suppliers 69,720 69,720 - - -
Capital expenditure commitments 3,198 3,198 - - -
Unrecognized tax benefits 1,875 1,875 - - -
TOTAL CONTRACTUAL OBLIGATIONS 101,910 80,932 8,883 6,582 5,513
For a further discussion of our contractual obligations see Notes 13, 17, 18 and 20 to our Consolidated financial statements, which are incorporated herein by reference.
We outsource a substantial portion of the manufacturing of our Front-end operations to certain suppliers. As our products are technologically complex, the lead times for purchases from our suppliers can vary and can be as long as nine months. Generally contractual commitments are made for multiple modules or systems in order to reduce our purchase prices per module or system. For the majority of our purchase commitments, we have flexible delivery schedules depending on the market conditions, which allow us, to a certain extent, to delay delivery beyond originally planned delivery schedules.
ASM INTERNATIONAL | STATUTORY ANNUAL REPORT 2014
MANAGEMENT REPORT | CONTRACTUAL OBLIGATIONS, CONTINGENT LIABILITIES AND COMMITMENTS 84

MARKET RISK DISCLOSUREWe are exposed to market risks (including foreign exchange rate risk and interest rate risk), credit risk and liquidity risk. We may use forward exchange contracts to hedge foreign exchange risk. We do not enter into financial instrument transactions for trading or speculative purposes.
FOREIGN EXCHANGE RATE RISKWe conduct business in a number of foreign countries, with certain transactions denominated in currencies other than the functional currency of ASM International (‘euro’) or one of our subsidiaries conducting the business. The purpose of the Company’s foreign currency management is to manage the effect of exchange rate fluctuations on revenues, costs and cash flows and assets and liabilities denominated in selected foreign currencies, in particular denominated in US dollars.
The majority of revenues and costs of our Front-end segment are denominated in Singapore dollars and US dollars. Since foreign currency exposure is not significant, no forward exchange contracts are used. The effect of exchange rate fluctuations on revenues, costs and cash flows and assets and liabilities denominated in foreign currencies is periodically reviewed.
We may use forward exchange contracts to hedge foreign exchange risk of anticipated sales or purchase transactions in the normal course of business, which occur within the next 12 months, for which it has a firm commitment from a customer or to a supplier. The terms of these contracts are consistent with the timing of the transactions being hedged. The hedges related to forecasted transactions are designated and documented at the inception of the hedge as cash flow hedges, and are evaluated for effectiveness quarterly. The effective portion of the gain or loss on these hedges is reported as a component of accumulated other comprehensive income in Shareholders’ equity, and is reclassified into earnings when the hedged transaction affects earnings.
The majority of revenues and costs of our Back-end segment are denominated in Hong Kong dollars, Korean won, Chinese yuan and US dollars. The functional currency of our Back-end segment (Hong Kong dollar) is linked to the US dollar. In March 2013, we sold a 12% stake, we now own approximately 40% of ASMPT. Accordingly from March 15, 2013, we do no longer consolidate ASMPT’s results of operations in ours. Instead, our proportionate share of ASMPT’s earnings is reflected as a separate line-item called ‘results from investments’ in our Consolidated statements of operations. Also we are no longer able to consolidate the assets and liabilities of ASMPT and reflect the net investment in ASMPT in the line-item investments in our Consolidated balance sheet. The effect of exchange rate fluctuations on results from investments and investments denominated in foreign currencies is periodically reviewed.
Changes in the fair value of derivatives that do not qualify for hedge treatment, as well as the ineffective portion of any hedges, are recognized in earnings. We record all derivatives, if any, including forward exchange contracts, on the balance sheet at fair value in other current assets or accrued expenses.
As we did not use forward exchange contracts no unrealized gains were included in accumulated other comprehensive income as of December 31, 2014.
Furthermore, we might manage the currency exposure of certain receivables and payables using derivative instruments, such as forward exchange contracts (fair value hedges) and currency swaps, and non-derivative instruments, such as debt borrowings in foreign currencies. The gains or losses on these instruments provide an offset to the gains or losses recorded on receivables and payables denominated in foreign currencies. The derivative instruments are recorded at fair value and changes in fair value are recorded in earnings under foreign currency exchange gains/losses in the Consolidated statement of profit and loss. Receivables and payables denominated in foreign currencies are recorded at the exchange rate at the balance sheet date and gains and losses as a result of changes in exchange rates are recorded in earnings under foreign currency exchange gains/losses in the Consolidated statement of profit and loss.
ASM INTERNATIONAL | STATUTORY ANNUAL REPORT 2014
MANAGEMENT REPORT | MARKET RISK DISCLOSURE 85

We do not use forward exchange contracts for trading or speculative purposes.
To the extent that foreign currency fluctuations affect the value of our investments in our foreign affiliates, they are not hedged. The cumulative effect of these fluctuations is separately reported in Consolidated shareholders’ equity. For the year ended December 31, 2013, we recorded an unfavorable movement of €89.0 million. For the year ended December 31, 2014, we recorded a favorable movement of €146.7 million. See Note 16 to our Consolidated financial statements, which is incorporated herein by reference.
As per December 31, 2014 the Company is debt free and has no foreign exchange contracts in place.
The following tables analyze our sensitivity to a hypothetical 10% strengthening and 10% weakening of the US dollar, Singapore dollar, Hong Kong dollar, Korean won or Japanese yen against the euro as of December 31, 2013 and December 31, 2014. This analysis includes foreign currency denominated monetary items and adjusts their translation at year end for a 10% increase and 10% decrease of the US dollar, Singapore dollar, Hong Kong dollar, Korean won or Japanese yen against the euro.
A positive amount indicates an increase in equity. Recognized in equity is the revaluation effect of subsidiaries denominated in US dollars, Singapore dollars, Hong Kong dollars, Korean won and Japanese yen.
IMPACT ON EQUITY
(EUR thousand) 2013 2014
10% increase of US dollar versus euro 7,741 9,381
10% decrease of US dollar versus euro (7,741) (9,381)
10% increase of Singapore dollar versus euro 6,155 7,967
10% decrease of Singapore dollar versus euro (6,155) (7,967)
10% increase of Hong Kong dollar versus euro 94,369 109,211
10% decrease of Hong Kong dollar versus euro (94,369) (109,211)
10% increase of Korean won versus euro 5,855 8,163
10% decrease of Korean won versus euro (5,855) (8,163)
10% increase of Japanese yen versus euro 5,870 6,925
10% decrease of Japanese yen versus euro (5,870) (6,925)
A hypothetical 10% strengthening or 10% weakening of any other currency against the euro as of December 31, 2013 and December 31, 2014 would not result in a material impact on equity.
The following table analyzes our sensitivity to a hypothetical 10% strengthening and 10% weakening of the US dollar, Hong Kong dollar, Korean won and Japanese yen against the euro at average exchange rates for the years 2013 and 2014. A positive amount indicates an increase in net earnings.
IMPACT ON NET EARNINGS
(EUR thousand) 2013 2014
10% increase of US dollar versus euro 534 520
10% decrease of US dollar versus euro (534) (520)
10% increase of Singapore dollar versus euro 671 1,233
10% decrease of Singapore dollar versus euro (671) (1,233)
10% increase of Hong Kong dollar versus euro 101,025 3,969
10% decrease of Hong Kong dollar versus euro (101,025) (3,969)
10% increase of Korean won versus euro 2,071 1,552
10% decrease of Korean won versus euro (2,071) (1,552)
10% increase of Japanese yen versus euro 553 1,125
10% decrease of Japanese yen versus euro (553) (1,125)
ASM INTERNATIONAL | STATUTORY ANNUAL REPORT 2014
MANAGEMENT REPORT | MARKET RISK DISCLOSURE 86

The significant possible impact on net earnings for the year 2013, results from the realized and unrealized gain following the sale of the 12% stake in ASMPT. A hypothetical 10% strengthening or 10% weakening of any other currency against the euro at average exchange rates for the years 2013 and 2014 would not result in a material impact on net earnings.
INTEREST RISKThe Company is debt free as per December 31, 2014 and is not exposed to interest rate risk through borrowing activities. The Company does not enter into financial instrument transactions for trading or speculative purposes or to manage interest rate exposure.
CREDIT RISKFinancial instruments that potentially subject us to concentrations of credit risk consist primarily of cash and cash equivalents and accounts receivable. These instruments contain a risk of counterparties failing to discharge their obligations. We monitor credit risk and manage credit risk exposure by type of financial instrument by assessing the creditworthiness of counterparties.
Our customers are semiconductor device manufacturers located throughout the world. We generally do not require collateral or other security to support financial instruments with credit risk.
Concentrations of credit risk (whether on or off-balance sheet) that arise from financial instruments exist for groups of customers or counterparties when they have similar economic characteristics that would cause their ability to meet contractual obligations to be similarly affected by changes in economic or other conditions.
The Company derives a significant percentage of its revenue from a small number of large customers. The largest customer accounted for approximately 26.7% of net sales in 2014 (2013: 28.3%) and the ten largest customers accounted for approximately 84.1% of net sales in 2014 (2013: 85.6%). Sales to these large customers also may fluctuate significantly from time to time depending on the timing and level of purchases by these customers. Significant orders from such customers may expose the Company to a concentration of credit risk and difficulties in collecting amounts due, which could harm the Company’s financial results. Per December 31, 2014 one customer accounted for 20.1% of the outstanding balance in accounts receivable (2013: 28.1%).
We place our cash and cash equivalent and derivative instruments with high quality financial institutions to limit the amount of credit risk exposure.
The maximum credit exposure is equal to the carrying values of cash and cash equivalent and accounts receivable.
ASM INTERNATIONAL | STATUTORY ANNUAL REPORT 2014
MANAGEMENT REPORT | MARKET RISK DISCLOSURE 87

BUSINESS OVERVIEW
INTRODUCTION
Our businessASM International is a global supplier of wafer processing equipment, primarily for semiconductor manufacturing. ASM’s innovative technologies are being used by the most advanced semiconductor manufacturers, primarily for the deposition of thin films. We design, manufacture and sell equipment and services to our customers for the production of semiconductor devices, or integrated circuits (‘IC’s’). Semiconductor IC’s, often called chips, are a key technology enabling the advanced electronic products used by consumers and businesses everywhere.
Global demand for semiconductors is exploding as chips enable technological advances for an expanding number of applications. The cloud, smart vehicles, the desire to be fully connected at all times for email, phone and the internet. All these factors and more are driving the demand for smaller, faster, cheaper chips. The semiconductor industry is committed to reducing the size of transistors so that more of them fit in the same physical space. For over 30 years now, following the trend called Moore’s Law, the average number of components per integrated semiconductor device, at the optimum cost-per-component, has been increased by a factor of two every 18 to 24 months. Currently, the most advanced microprocessor chips include over 2 billion transistors. ASM’s technology is an enabler of the deposition of the extremely thin semiconductor material layers that create these advanced chips. A driver of innovation, ASM has established a leading position in the fast growing markets for ALD and PEALD equipment, and also provides equipment for PECVD, epitaxy, and vertical furnace applications.
Semiconductor manufacturing backgroundThe process of making semiconductor IC’s is highly complex and very costly. Semiconductor fabrication plants, called fabs, house a large set of wafer processing equipment which performs a series of process steps on round silicon wafers, which are typically 300mm in diameter. The equipment is operated in cleanrooms that filter the air to avoid small particles that could negatively affect the circuitry on the chips. There are many chips on each wafer. Most of ASM’s systems are designed for deposition processes when thin films, or layers, of various materials are grown or deposited onto the wafer. These films are electrically conductive metals, insulating dielectrics, or semiconducting to allow precision control of electrical signals. By depositing multiple layers of films, multi-level, integrated electrical circuits are created on each chip. After testing the individual circuits for correct performance, the chips on the wafer are separated and then packaged in protective coatings before ultimately becoming part of a set of IC chips on circuit boards within an electronic product.
Industry scale and major trendsSemiconductor devices are the key enablers of the electronic age. Each semiconductor device can hold many components, most of which are transistors and means to store a charge in the case of memory chips. Logic chips are used for making calculations or more generally for executing the instructions of the software that controls an electronic product. Memory chips are used to store the digital 1’s and 0’s that make up the programs and data. Various ASM equipment is used in the fabrication of both logic and memory chips, as well as other general integrated devices. A recent trend is the combination of logic and memory on the same chip to create a system on a chip (‘SOC’), which can increase the speed of the electronics, and reduce the total size and cost of the packaged product.
The semiconductor industry was driven in 2014 by a US$2.02 trillion global electronics industry (VLSI Research Chip Insider January 19, 2015), that required approximately US$289 billion in semiconductors. The semiconductor industry in turn, supported the approximately US$50.2 billion semiconductor capital equipment industry, which supplies the needed production systems and services. Within the capital equipment segment, ASM serves the wafer processing equipment segment which is approximately US$32 billion. Demand for
ASM INTERNATIONAL | STATUTORY ANNUAL REPORT 2014
MANAGEMENT REPORT | BUSINESS OVERVIEW 88

semiconductor capital equipment is driven both by growth in the market for semiconductor devices and also by new technology needed to realize the next generation of devices. The semiconductor industry rose about 10% in 2014, driving the equipment business up by about 17%. Equipment growth in 2014 was driven mostly by capacity expansion in memory fabs and new technology generation investments in logic and foundry fabs.
New technology generations are driven from the industry’s relentless push to follow Moore’s Law, which ultimately enables devices with more performance at a lower cost. One result of this advanced technology drive is higher complexity in transistors and memory devices. Historically, new technology nodes have been achieved by shrinking the transistor size, however certain physical limits have recently been reached. To solve this problem the trend is to build 3D transistors because more functions can be stacked vertically than in two dimensions. So-called ‘FinFET’s’ and several 3D memory architectures are now in volume production.
Another 3D trend in semiconductor manufacturing is the stacking of several chips in one package. These chips can come from different supply chains, each optimized for its own performance and cost, enabling the manufacture of heterogeneous devices with integration in the package or as chips stacked on a wafer. In this way ‘more than Moore’ chips can be efficiently integrated with conventional ‘Moore’ scaled devices in one package.
The trends outlined above are the main drivers of the broad semiconductor roadmap which semiconductor equipment companies track in developing new production systems and process technologies. These new systems and technologies must be developed well ahead of volume demand for the semiconductor devices they make. As a result, there is a large lead time between the investment in a new technology, and its commercial success. With the combination of a long lead time and the short product life-cycles comes the inherent difficulty of matching supply and demand, which results in the high volatility associated with the semiconductor equipment industry.
StrategyOur strategic objective is to realize profitable, sustainable growth by capitalizing on our innovative strength, operational excellence and our leadership in ALD and other business segments we are active in. The key elements of our strategy include:
Innovative strength, ASM has always been recognized for its technology leadership. Today, we provide leading technologies that support our customers in staying on the curve of Moore’s Law. Our innovative strength is what differentiates us in the marketplace and continues to be the cornerstone of our strategy. Apart from our internal R&D efforts we are continuously expanding and deepening our strategic cooperation with key customers, suppliers, chemicals manufacturers and research institutes such as imec. We also expand our patent portfolio where it is necessary and beneficial.
Leadership in ALD, ALD and PEALD technologies have been established as mainstream technologies in high volume manufacturing supporting virtually all of the leading customers in the semiconductor industry. As a leader in this space, ALD and PEALD have turned into a key growth driver for our business. We expect that the trends of continued scaling and evolution towards 3D device structures will further expand the number of applications for ALD. We aim to maintain our leading position in ALD, by leveraging on our strong expertise and established customer relationships, and by developing new applications to support our customers with increasingly complex device node transitions.
Operational excellence, While technology leadership remains crucial we continue to focus on further improving the effectiveness of our organization and the efficiency of processes. We aim to provide our customers with dependable leading-edge products and services at a consistent quality and the best cost of ownership. To this end, we continue to optimize our manufacturing and global sourcing processes, including the migration to common product platforms.
ASM INTERNATIONAL | STATUTORY ANNUAL REPORT 2014
MANAGEMENT REPORT | BUSINESS OVERVIEW 89

ASM business structureASMI is generally organized with a set of business units that develop and market our products, and globalized operation and administration groups that support the business units and our customers. ASMI’s operations are conducted through wholly-owned subsidiaries, the most significant being ASM Front-end Manufacturing Singapore Pte Ltd (‘FEMS’), located in Singapore, ASM Europe BV (‘ASM Europe’), located in the Netherlands, ASM America, Inc (‘ASM America’), located in the United States, ASM Japan KK (‘ASM Japan’), located in Japan, and ASM Genitech Korea Ltd (‘ASM Genitech’) located in South Korea. The location of our facilities allows us to interact closely with customers in the world’s major geographic market segments: Europe, North America, and Asia.
Semiconductor device manufacturing processesThe manufacturing process of semiconductor devices on a wafer can be divided in three distinct parts: wafer manufacturing, transistor formation (known as Front-end of the line (‘FEOL’) processing), and interconnect formation (known as Back-end of the line (‘BEOL’) processing). We develop, manufacture and sell equipment, and provide services used by semiconductor device manufacturers in each of these sections of semiconductor device manufacturing.
In the wafer manufacturing process, a large single crystal of very pure silicon is grown from molten silicon. The crystal is then sliced into a large number of thin slices, or wafers, of single crystalline silicon. These slices are polished to an atomic level flatness before the next steps are executed. For advanced applications, some layers are deposited on the wafer for later use, by either epitaxy or diffusion/oxidation. Epitaxial wafers are even flatter and contain fewer defects at the surface than polished wafers.
During FEOL and BEOL wafer processing, multiple thin films of either electrically insulating material, also called dielectrics, or conductive material are modified, grown, or deposited on a silicon wafer. First, several material processing cycles are used in the FEOL to build the basic transistor and other components such as capacitors and resistors. Second, several processing cycles are used in the BEOL to electrically connect the large amount of transistors and components, and to build additional passive components such as capacitors, inductors and resistors. Patterning of deposited layers with lithography and etching creates the transistors, passive components and connecting wires, which together make up the integrated circuit. Each integrated circuit is a single ‘chip’ or a ‘die’ on the wafer. A finished wafer may contain several dozen to several thousand individual dies. Wafer processing is performed either one wafer at a time in single wafer processing systems or many wafers at a time in batch processing systems. Multiple deposition, and patterning processes are performed on the same wafer to complete a device.
The number and precise order of the process steps varies depending upon the complexity and design of the integrated circuit. The performance of the circuit is determined in part by the various electrical characteristics of the materials used in the layers of the circuit and the wafer. Simple circuits may have as few as ten layers, while complex circuits may have more than one hundred layers. The device manufacturing process is capital intensive, requiring multiple units of several different production systems. Many different but complementary methods are used to modify, grow, or deposit materials on the wafers. The device manufacturing process on the wafer is complete when all of the layers have been deposited and patterned on the wafer.
The introduction of even trace levels of foreign particles or material can make a circuit, or even an entire wafer, unusable. To reduce the level of foreign particles or material, wafer processing is performed in clean rooms with ultra-low particle and contamination levels. The correct electrical functioning of the integrated circuits on each die is confirmed by probing. Non-functioning circuits are marked so they can later be discarded before money is spent on packaging the chip. The yield, or the percentage of known good die for a mature process is usually well above 95%. For a process in development the yield can be substantially smaller, and it is important to improve this as quickly as possible as it determines the profitability of our customers to a large extent.
ASM INTERNATIONAL | STATUTORY ANNUAL REPORT 2014
MANAGEMENT REPORT | BUSINESS OVERVIEW 90

Important technology trends for our businessThe continuous demand for smaller, faster and cheaper semiconductor components drives the technology advances in the semiconductor manufacturing process. As the transistors in an integrated circuit become smaller, the cost-per-component decreases. Fortuitously, at the same time the operating speed of the transistor increases. Thus the minimum size of a single transistor in an integrated circuit is an extremely important parameter. Today, our customers manufacture semiconductor devices as small as 14 nanometers (‘nm’) (one nanometer is one billionth of a meter), sometimes in a vertical 3D transistor or FinFET architecture. Our customers are qualifying and testing new critical processes to generate devices with line widths at or below 10nm. Simultaneously, in our customers’ laboratories and several collaborative research environments advanced 7nm to 5nm design rule devices and related materials are being developed.
In developing faster and smaller devices, our customers’ major technology requirements are: › introduction of new thin film materials and device designs needed for continued scaling; › reliable manufacturing of taller and smaller three-dimensional structures in devices; › lithography of ever smaller feature sizes, now much smaller than the wavelength of visible light; and › new manufacturing processes that reduce device variability and increase yield.
ASM advanced technologyIn order to meet our customers’ needs, we have developed, and are still developing many new materials. Atomic layer deposition (‘ALD’) is an advanced technology that deposits atomic layers one at a time on wafers. This process is used to create ultra-thin films of exceptional quality and flatness. For example, in the FEOL, ALD of high-k dielectrics and novel metal gate electrodes can improve the performance and reduce the power consumption of a device, thereby enhancing battery life. This same class of materials can also lead to larger charge storage in a smaller capacitor, critical for memories and RF circuits. Whereas in the recent past much focus has been on the development of the high-k dielectric, today as much focus is on new technologies and materials for the metal gate electrode, the gate sidewall passivation and many other applications. Plasma enhanced ALD (‘PEALD’) is expected to be an important technology going forward for isolating features in 3D devices. We expect that the creation of 3D vertical transistors will further increase the demand for processes with better coverage of 3D structures, such as ALD.
Another example of new materials in the FEOL are our silicon-germanium (‘SiGe’) and silicon-carbon-phosphorous (‘SiCP’) epitaxial materials that can increase the switching speed of the transistors and the circuit in which they are embedded by so-called strain engineering. This can be done without negatively affecting the power these transistors consume.
In the BEOL or interconnect process, a continued demand to improve the speed at which signals travel through thin copper wires has led to the development of a full suite of low-k materials. These low-k materials can decrease the amount of delay in signal propagation, resulting in, for example, faster microprocessors. Simultaneously these low-k materials can reduce the amount of power loss in the interconnections. We have been one of the leaders in successfully introducing these low-k materials in the market. We are continuing to develop improvements to this low-k technology to enable faster interconnect circuits.
We have also developed and sold new ALD processes and wafer processing equipment to enable the creation of narrow lines having dimensions beyond the resolution of common lithography, and with low line width variability; a process called spacer-defined double patterning. For that purpose we have developed low temperature Plasma enhanced ALD processes that are compatible with and assist the common lithography process.
In addition to addressing the technology needs of our customers, the relentless drive of the industry to reduce cost corresponds to significant spending on development programs that further increase throughput, equipment reliability, and yield in our customer’s line, and further lower the cost per wafer of the wafer processing systems. In order to enable further efficiencies in our manufacturing process, we have improved, and will continue to improve the level of standardization in our equipment portfolio by migrating to common platforms, sub-assemblies and components. This requires a significant engineering effort, although can provide efficiencies in the long term.
ASM INTERNATIONAL | STATUTORY ANNUAL REPORT 2014
MANAGEMENT REPORT | BUSINESS OVERVIEW 91

ALD and PEALD at ASMAtomic layer deposition (‘ALD’) is one of the newest technologies to deposit ultra-thin films of exceptional flatness and uniformity. This technology was brought into ASMI in 1999 with the acquisition of ASM Microchemistry, who first developed the thermal ALD technology. Plasma enhanced ALD (‘PEALD’) is an extension of this original ALD technology that uses plasma, which was brought into ASMI in 2001 through a partnership with Genitech and a subsequent acquisition in 2004 and formation of ASM Genitech Korea. The use of plasma enables us to deposit high quality films at very low temperatures. ALD is a very versatile technology that can be used to deposit high-k insulating materials, conductors, silicon oxide and silicon nitride. We expect that the trends of continued scaling, and evolution towards three dimensional device structures play into the strength of our ALD position. We offer ALD/PEALD processes on several of our product platforms, including single wafer and batch systems, and for multiple wafer sizes.
ProductsMarket coverageThe semiconductor capital equipment market is composed of three major market segments: wafer processing equipment, assembly and packaging equipment, and test equipment. ASMI is active in the wafer processing segment. Within wafer processing equipment the major segments are lithography, CMP, ion implant, deposition, etch & clean and process diagnostics. The principal market segment in which we participate is deposition and related tools. According to VLSI, the deposition segment is approximately US$7.8 billion in 2014.
ASMI productsASMI’s products come from a number of product platforms, with each platform designed to host and enable specified process technologies. The products in each product platform are linked through common technology elements of the platform, for example a common in-system software framework, common critical components, similar logistics (batch or single wafer processing), or a similar wafer processing environment (wet or dry). The following table lists our principal product platforms, the main process technology that they enable, and the semiconductor device manufacturing solution for which the products from that platform are used.
TECHNOLOGY - PRODUCT MATRIX
DEPOSITION APPLICATION
ASMI PRODUCT PLATFORM
ASMI PRODUCTS
ALD
PEALD
PECVD
Diffusion Oxidation LPCVDALD Epitaxy
XP 1)
Polygon® 2)
XP8 1)
XP8 1)
Advance® Series
XP 1)
Epsilon®
Pulsar® XP ALD systemEmerALD® XP ALD system
Pulsar 2) single wafer ALD systemEmerALD 2) single wafer ALD system
Eagle® XP8 PEALD system
Dragon® XP8 PECVD system
A400 Batch vertical furnace systemA412 Batch vertical furnace system
Intrepid® XP epitaxy
Epsilon 2000 single wafer epitaxy systemEpsilon 3200 single wafer epitaxy system
1 The XP is our standard single wafer processing platform designed to accommodate multiple process application modules with common platform standards. In 2012 ASMI launched the XP8 high productivity platform for PECVD and PEALD, based on our common XP platform standard with an expanded configuration that enables integration of up to eight chambers on one wafer handling platform.
2 The functionality of the Polygon, Pulsar and EmerALD has merged with the XP platform starting in 2009.
ASM INTERNATIONAL | STATUTORY ANNUAL REPORT 2014
MANAGEMENT REPORT | BUSINESS OVERVIEW 92

Product descriptionsAdvance platformThe Advance is our vertical furnace, batch processing platform. Products built on this product platform are used for diffusion, oxidation, LPCVD and ALD. The product platform is used in many manufacturing steps, from the production of silicon wafers to the final anneal in interconnect.
A412 batch vertical furnaceThe A412 is a 300mm vertical furnace system featuring two reactors above a rotating carousel, with a dual-boat configuration for high productivity. The tool supports a wide range of process applications with variable load sizes from 25 wafers for shortest cycle time requirements, up to 150 wafers for lowest cost requirements in a single run.
A400 batch vertical furnaceThe A400 system is for 150 and 200mm wafers. It is available with two batch tube reactors and supports applications similar to the A412 tool.
XP platformThe XP is our high productivity common 300mm single wafer platform that can be configured with up to four process modules. The XP platform enables high volume multi-chamber parallel processing or integration of sequential process steps on one platform.
The XP common platform benefits our customers through reduced operating costs since multiple ASM products use many of the same parts and consumables and a common control architecture improves ease of use.
Pulsar XP ALD systemPulsar XP is a 300mm ALD tool designed for depositing extremely thin high-k dielectric materials required for advanced transistor gates and other applications. Pulsar is the benchmark ALD high-k gates tool for the industry.
EmerALD XP ALD systemEmerALD XP is a 300mm ALD tool designed for depositing metal gate layers for advanced high-k metal gate transistors and other applications.
Intrepid XP epitaxy systemIntrepid XP is a 300mm epitaxy tool designed for critical transistor strain and channel layers. Processes include silicon (‘Si’), silicon-germanium (‘SiGe’), and other silicon-based compounds.
XP8 platformThe XP8 platform follows the basic architectural standards of the XP, but provides even higher productivity with up to eight chambers integrated on a single wafer platform with a small footprint.
Eagle XP8 PEALD systemEagle XP8 is a high productivity 300mm tool for PEALD applications. The system can be configured with up to four dual chamber modules (‘DCM’), enabling eight chambers in high volume production within a very compact footprint. The system is capable of a broad range of dielectric PEALD processes including low temperature spacers for multiple patterning applications.
ASM INTERNATIONAL | STATUTORY ANNUAL REPORT 2014
MANAGEMENT REPORT | BUSINESS OVERVIEW 93

Dragon XP8 PECVD SystemDragon XP8 is a high-productivity 300mm tool for PECVD applications. The system can be configured with up to four dual chamber modules (‘DCM’), enabling eight chambers in high volume production within a very compact footprint. Processes include a broad range of dielectric PECVD films for applications such as interconnect dielectrics layers, passivation layers and etch stop layers.
EpsilonThe Epsilon is our platform for single wafer epitaxy. The Epsilon product platform offers a wide range of epitaxy products and materials for many applications, ranging from high temperature silicon used in silicon starting material manufacturing, to low temperature, selective or non-selective silicon, silicon germanium (‘SiGe’), silicon-carbon (‘SiC’) used in CMOS devices and silicon germanium carbon (‘SiGeC’) used in bipolar devices. The Epsilon 2000 is a single wafer, single reactor system for 150mm and 200mm wafers. The Epsilon 3200 is a single wafer, single reactor system for 300mm wafers.
PolygonThe Polygon is a single wafer atomic layer deposition platform. It features a six-sided central vacuum handler, capable of hosting up to four reactors. The Polygon 8200 is used for 150 and 200mm wafers, and for magnetic head substrates. The Polygon 8300 is used for 300mm wafers. One or more Pulsar modules with ALD technology can be integrated onto the platform. Products built on this product platform are currently being used in, among others, ALD high-k gate dielectrics for high performance logic, metal-insulator-metal capacitors for system on a chip applications, and magnetic head gap fill.
Intellectual property and trademarksIntellectual propertyBecause of the rapid technological advances in the microelectronics field, our products must continually change and improve. Accordingly, we believe that our success will depend upon the technical competence and creative ability of our personnel as well as the ownership of and the ability to enforce our intellectual property rights.
We own and license patents that cover some of the key technologies, features and operations of our products and are registered in the principal countries where semiconductor devices or equipment are manufactured or sold. For instance, we have hundreds of issued patents that relate to our ALCVD process technology platform. As another example, we have a significant number of issued patents related to Silcore and other specialized LPCVD and PECVD process chemistries.
The following table shows the number of patents for which we made an initial filing during the indicated year and the number of patents in force at the end of the indicated year. Increased R&D activity in 2012, 2013 and 2014 resulted in a higher filing rate.
2010 2011 2012 2013 2014
Initial patent filings 33 51 64 61 66
Patents in force at year end 931 1,043 1,127 1,159 1,266
We have entered into worldwide, non-exclusive, non-transferable and non-assignable licenses with Applied Materials for patents related to certain chemicals used to deposit insulating layers for PECVD. A number of the licensed patents have already expired and there are no remaining royalty bearing patents that we use. Upon expiration of the patents, the technology may be used royalty-free by the public, including us.
We have licensed our intellectual property in parts of our ALCVD process technology platform through non-exclusive, restricted field of use license agreements to a limited number of companies. In addition to generating revenue, we seek to accelerate market acceptance of our ALCVD technology through our licensing efforts.
We have licensed our RTP portfolio of 61 issued patents and four pending patents to Levitech BV.
ASM INTERNATIONAL | STATUTORY ANNUAL REPORT 2014
MANAGEMENT REPORT | BUSINESS OVERVIEW 94

TrademarksASM, the ASM International logo, Advance, Aurora, Dragon, Eagle, EmerALD, Epsilon, Intrepid, Polygon, Pulsar and Silcore are our registered trademarks. A400, A412, ALCVD, Atomic Layer CVD, Horizon, Loadstar, Medallion, NCP, PEALD and Previum are our trademarks. ‘The Switch Is On’ and ‘Drive Innovation. Deliver Excellence.’ are our service marks.
LitigationThere has been substantial litigation regarding patent and other intellectual property rights in semiconductor-related industries. Although we have been involved in significant litigation in the past, we are at present not involved in any litigation which we believe is likely to have a material adverse effect on our financial position. In the future, additional litigation may be necessary to enforce patents issued to us, to protect trade secrets or know-how owned by us or to defend ASMI against claimed infringement of the rights of others and to determine the scope and validity of the proprietary rights of others. Any such litigation could result in substantial cost and diversion of effort by us, which could have a material adverse effect on our business, financial condition, and earnings from operations. Adverse determinations in such litigation could result in our loss of proprietary rights, subject us to significant liabilities to third parties, require us to seek licenses from third parties or prevent us from manufacturing or selling our products, any of which could have a material adverse effect on our business, financial condition and earnings from operations.
Research and developmentWe believe that our future success depends to a large extent upon our ability to develop new products and add improved features to existing products. Accordingly, our global product development policies and local activities are for the most part directed towards expanding and improving present product lines to incorporate technology advances and reduce product cost, while simultaneously developing new products that can penetrate new markets. These activities require the application of physics, chemistry, materials science, chemical engineering, electrical engineering, precision mechanical engineering, software engineering, and system engineering.
We expect to continue investing significant resources in research and development in order to enhance our product offerings. Our research and development activities are chiefly conducted in the principal semiconductor markets of the world, which enables us to draw on innovative and technical capabilities on an international basis. Each geographic center provides expertise for specific products and/or technologies. This approach, combined with the interactions between the individual centers, permits efficient allocation of technical resources and customer interaction during development. In 2010, we formed a global Platform Engineering group that addresses the needs for common platforms for the various products in our wafer processing product portfolio. Selected resources in Leuven, Almere and Helsinki have been grouped under Corporate R&D, addressing the common needs for advanced materials research and process integration work for the 10nm to 5nm nodes.
LOCATION
NUMBER OF R&D EMPLOYEES AS OF DECEMBER 31, 2014, EXCLUSIVE OF
TEMPORARY WORKERS
Almere, the Netherlands 36
Leuven, Belgium 26
Helsinki, Finland 17
Phoenix, Arizona, United States 161
Cheonan, South Korea 46
Singapore 4
Tama, Japan 75
TOTAL 365
ASM INTERNATIONAL | STATUTORY ANNUAL REPORT 2014
MANAGEMENT REPORT | BUSINESS OVERVIEW 95

As part of our research and development activities, we are engaged in various formal and informal arrangements with customers and institutes. At December 31, 2014, we are engaged in several formal joint development programs with customers for 300mm applications of our products. As part of these efforts, we may sell new products to customers at a significantly reduced margin, and invest significant resources in the joint development and subsequent product qualification. We sometimes also cooperate with other semiconductor capital equipment suppliers in complementary fields, in order to gain knowledge on the performance of our own deposition processes, in cooperation with other processes, either in bilateral or in publicly funded projects. In addition to cooperating with customers and other capital equipment suppliers, we also enter into research projects with technical universities and institutes (for example imec in Belgium).
We participate mainly in Europe in publicly funded programs to research and develop the production technology for semiconductor devices with line widths of 10nm and 7nm and below, and in More-than-Moore technologies. Among our current cooperative efforts are projects awarded under the Information Society Technologies (‘IST’) seventh framework program and the sequel framework Horizon 2020, and under the Joint Technology Initiative (‘JTI’) on nano-electronics of the ENIAC Joined Undertaking (European Nano-electronics Initiative Advisory Council JU) and the follow-up program JTI ECSEL (Electronic Components and Systems for European Leadership). Several of these ENIAC and ECSEL projects are Key Enabling Technology (‘KET’) Pilot Line projects aiming at developing a European pilot line for emerging technologies. We are also involved in several cluster development programs in the Eureka initiative by CATRENE (Cluster for Application and Technology Research in Europe on Nano-Electronics), the successor of MEDEA+ (Micro Electronics Development for European Applications). In the Netherlands we are participating in projects focused on nanotechnology developments (‘NanoNextNL’) and efficiency improvements for Photovoltaic cells within the TKI Solar Energy Program.
In 2011 we renewed our strategic R&D partnership with the Interuniversity MicroElectronics Center (‘imec’) in Leuven, Belgium. Our Epsilon, A412, Pulsar, EmerALD, Dragon and Eagle based products are involved in this partnership. In 2012, 2013 and 2014 we significantly expanded our partnership with additional ALD and epitaxy capability. This gives us the opportunity to investigate, both jointly and independently, the integration of individual process steps in process modules and electrically active devices. We have been partnering with imec since 1990.
In December 2003, we commenced a five-year partnership with University of Helsinki that aims at further development of atomic layer deposition processes and chemistries. This partnership was extended for a second and now a third quinquennial, reaching into December 2018.
Per year-end 365 employees were employed in research and development representing 22% of our total staff.
Manufacturing and suppliersOur manufacturing operations consist of the fabrication and assembly of various critical components, product assembly, quality control and testing.
In 2004, in order to reduce manufacturing costs in our wafer processing equipment operations we established FEMS, a manufacturing facility in Singapore, to manufacture certain generic subsystems and sub-assemblies for our vertical furnaces that we previously outsourced. In 2009 we started the transition of manufacturing of ASMI products to be final assembled in Singapore, i.e. including final assembly, test and shipment of the system to the customer from the FEMS facility. We closed down our manufacturing operations in Almere, the Netherlands, at the end of 2009, and we closed our manufacturing facilities in Phoenix (US) and in Nagaoka (Japan) in 2010.
With this transition we have also implemented a global organization for our procurement activities.
ASM INTERNATIONAL | STATUTORY ANNUAL REPORT 2014
MANAGEMENT REPORT | BUSINESS OVERVIEW 96

In 2012 we strengthened our organization with a global supply chain function, that includes, in addition to procurement, responsibility for supply chain quality and inventories.
Marketing and salesWe market and sell our products with the objective of developing and maintaining an ongoing, highly interactive service and support relationship with our customers. We provide prospective customers with extensive process and product data, provide opportunities for tests on demonstration equipment and, if required, install evaluation equipment at the customer’s site. Once equipment has been installed, we support our customers with, among other things, extensive training, on-site service, spare parts and process support. All of this is further supported by in house development to enhance the productive life of existing equipment. We make hardware improvements available in the form of retrofit kits as well as joint development of new applications with our customers.
Because of the significant investment required to purchase our systems and their highly technical nature, the sales process is complex, requiring interaction with several levels of a customer’s organization and extensive technical exchanges, product demonstrations and commercial negotiations. As a result, the full sales cycle can be as long as 12 to 18 months. Purchase decisions are generally made at a high level within a customer’s organization, and the sales process involves broad participation across our organization, from senior executive management to the engineers who designed the product.
To market our products, we operate demonstration and training centers where customers can examine our equipment in operation and can, if desired, process their wafers for further in-house evaluation. Customers are also trained to properly use purchased equipment.
To execute the sales and service functions, we have established a global sales force, in which all regional units report directly into the global sales organization. We have sales offices located in Europe (in the Netherlands, France, Ireland, Germany and Italy), Israel, Taiwan, South Korea, the People’s Republic of China, Singapore, the United States and Japan. At the end of 2014, 303 employees were employed in sales and marketing, representing 19% of our total staff.
CustomersWe sell our products predominantly to manufacturers of semiconductor devices and manufacturers of silicon wafers. Our customers include most of the leading semiconductor and wafer manufacturers. Our customers vary from independent semiconductor manufacturers that design, manufacture, and sell their products on the open market, to large electronic systems companies that design and manufacture semiconductor devices for their own use, to semiconductor manufacturers, known as foundries that manufacture devices on assignment of other companies, including ‘fabless’ companies that design chips but do not have wafer processing factories.
For our wafer processing segment our largest customer accounted for approximately 33.6%, 28.3% and 26.7% of our net sales in 2012, 2013 and 2014, respectively. Our ten largest customers accounted for approximately 75.3%, 85.6% and 84.1% of our net sales 2012, 2013 and 2014, respectively. Historically, a significant percentage of our net sales in each year has been attributable to a limited number of customers; however, the largest customers for our products may vary from year to year depending upon, among other things, a customer’s budget for capital expenditures, timing of new fabrication facilities and new product introductions.
ASM INTERNATIONAL | STATUTORY ANNUAL REPORT 2014
MANAGEMENT REPORT | BUSINESS OVERVIEW 97

Customer serviceWe provide responsive customer technical assistance to support our marketing and sales. Technical assistance is becoming an increasingly important factor in our business as most of our equipment is used in critical phases of semiconductor manufacturing. Field engineers install the systems, perform preventive maintenance and repair services, and are available for assistance in solving customer problems. Our global presence permits us to provide these functions in proximity to our customers. We also maintain local spare part supply centers to facilitate quick support.
We provide maintenance during the product warranty period, usually one to two years, and thereafter perform maintenance pursuant to individual orders issued by the customer. In addition to providing ongoing service, our customer service operations are responsible for customer training programs, spare parts sales and technical publications. In appropriate circumstances, we will send technical personnel to customer locations to support the customer for extended periods of time in order to optimize the use of the equipment for the customer’s specific processes. The availability of field support is particularly important for a sale. 517 employees were employed in customer service at the end of 2014 representing 32% of our total staff.
CompetitionThe semiconductor equipment industry is intensely competitive, and is fragmented among companies of varying size, each with a limited number of products serving particular segments of the semiconductor process. Technical specifications of the individual products are an important competitive factor, especially concerning capabilities for manufacturing of new generations of semiconductor devices. As each product category encompasses a specific blend of different technologies, our competitive position from a technology standpoint may vary within each category. Customers evaluate manufacturing equipment based on technical performance and cost of ownership over the life of the product. Main competitive factors include overall product performance, yield, reliability, maintainability, service, support and price. We believe that we are competitive with respect to each of these factors, and that our products are cost effective.
As the variety and complexity of available machinery increases, some semiconductor manufacturers are attempting to limit their suppliers. In addition, semiconductor manufacturers are located throughout the world, and expect their equipment suppliers to have offices worldwide to meet their supply and service needs. Semiconductor equipment manufacturers with a more limited local presence are finding it increasingly difficult to compete in an increasingly global industry.
Our primary competitors are from the United States, Japan and South Korea. In each of our product lines, we compete primarily with two or three companies which vary from small to large firms in terms of the size of their net sales and range of products. Our primary competitors include Applied Materials, LAM Research Corporation, Tokyo Electron, Hitachi Kokusai, Wonik IPS, Eugene Tech and Jusung.
ASM INTERNATIONAL | STATUTORY ANNUAL REPORT 2014
MANAGEMENT REPORT | BUSINESS OVERVIEW 98

ASMI has a dual listing on Nasdaq (North America) and EURONEXT (the Netherlands). Our Statutory annual report 2014 is prepared in accordance with International Financial Reporting Standards (IFRS), as endorsed by the European Union. We also file Form 20-F with the US Securities and Exchange Commission, which is available as a PDF in the Download center. Additionally, we also publish a Reconciliation US GAAP-IFRS 2014, intended to further inform investors. This documents is available in the Download center.
ANNUAL ACCOUNTS
CONSOLIDATED ANNUAL ACCOUNTS
CONSOLIDATED STATEMENT OF PROFIT OR LOSS 102
CONSOLIDATED STATEMENT OF COMPREHENSIVE INCOME 103
CONSOLIDATED STATEMENT OF FINANCIAL POSITION 104
CONSOLIDATED STATEMENT OF TOTAL EQUITY 105
CONSOLIDATED STATEMENT OF CASH FLOWS 106
NOTES TO CONSOLIDATED FINANCIAL STATEMENTS 107
ANNUAL ACCOUNTS
BALANCE SHEETS ASM INTERNATIONAL NV 162
ABBREVIATED COMPANY STATEMENT OF PROFIT OR LOSS 163
NOTES TO FINANCIAL STATEMENTS ASM INTERNATIONAL NV 164
SIGNING 169
OTHER INFORMATION 170
INDEPENDENT AUDITOR’S REPORT ON FINANCIAL STATEMENTS 172
99

TABLE OF CONTENTSCONSOLIDATED ANNUAL ACCOUNTS
CONSOLIDATED STATEMENT OF PROFIT OR LOSS 102
CONSOLIDATED STATEMENT OF COMPREHENSIVE INCOME 103
CONSOLIDATED STATEMENT OF FINANCIAL POSITION 104
CONSOLIDATED STATEMENT OF TOTAL EQUITY 105
CONSOLIDATED STATEMENT OF CASH FLOWS 106
NOTES TO CONSOLIDATED FINANCIAL STATEMENTS 107NOTE 1. GENERAL INFORMATION/SUMMARY OF SIGNIFICANT ACCOUNTING POLICIES 107NOTE 2. LIST OF SIGNIFICANT SUBSIDIARIES 120NOTE 3. DIVESTMENT 121NOTE 4. CASH AND CASH EQUIVALENTS 122NOTE 5. ACCOUNTS RECEIVABLE 122NOTE 6. INVENTORIES 123NOTE 7. GOODWILL 124NOTE 8. OTHER INTANGIBLE ASSETS 125NOTE 9. PROPERTY, PLANT AND EQUIPMENT 127NOTE 10. ASSETS CLASSIFIED AS HELD FOR SALE 128NOTE 11. EVALUATION TOOLS AT CUSTOMERS 128NOTE 12. INVESTMENTS AND ASSOCIATES 129NOTE 13. NOTES PAYABLE TO BANKS 131NOTE 14. PROVISION FOR WARRANTY 132NOTE 15. ACCRUED EXPENSES AND OTHER PAYABLES 133NOTE 16. SHAREHOLDERS’ EQUITY 133NOTE 17. EMPLOYEE BENEFITS 135NOTE 18. COMMITMENTS AND CONTINGENCIES 142NOTE 19. LITIGATION AND ENVIRONMENTAL MATTERS 143NOTE 20. FINANCIAL INSTRUMENTS AND RISK MANAGEMENT 143NOTE 21. RESEARCH AND DEVELOPMENT 147NOTE 22. RESTRUCTURING EXPENSES 148NOTE 23. INCOME TAXES 148NOTE 24. DISCLOSURES ABOUT SEGMENTS AND RELATED INFORMATION 152NOTE 25. SELECTED OPERATING EXPENSES AND ADDITIONAL INFORMATION 155NOTE 26. EARNINGS PER SHARE 155NOTE 27. BOARD REMUNERATION 156NOTE 28. SHARE OWNERSHIP AND RELATED PARTY TRANSACTIONS 158NOTE 29. PRINCIPAL ACCOUNTANT FEES AND SERVICES 158NOTE 30. SUBSEQUENT EVENTS 159NOTE 31. RECONCILIATION OF IFRS TO US GAAP 160
SIGNING 161
100
ANNUAL ACCOUNTS
BALANCE SHEETS ASM INTERNATIONAL NV 162
ABBREVIATED COMPANY STATEMENT OF PROFIT OR LOSS 163
NOTES TO FINANCIAL STATEMENTS ASM INTERNATIONAL NV 164NOTE 1. SUMMARY OF SIGNIFICANT ACCOUNTING POLICIES 164NOTE 2. INVESTMENTS AND LOAN ADVANCES DUE FROM INVESTMENTS 164NOTE 3. OTHER INTANGIBLE ASSETS 165NOTE 4. GOODWILL 165NOTE 5. PROPERTY, PLANT AND EQUIPMENT 166NOTE 6. SHAREHOLDERS’ EQUITY 167NOTE 7. SHARE OWNERSHIP OF THE MANAGEMENT BOARD AND SUPERVISORY BOARD 168NOTE 8. PERSONNEL 168NOTE 9. COMMITMENTS AND CONTINGENCIES 169
SIGNING 169
OTHER INFORMATION 170
INDEPENDENT AUDITOR’S REPORT ON FINANCIAL STATEMENTS 172
TABLE OF CONTENTS
101

CONSOLIDATED ANNUAL ACCOUNTSCONSOLIDATED STATEMENT OF PROFIT OR LOSS
YEAR ENDED DECEMBER 31,
(EUR thousand, except per share data) NOTES 2013 2014
Net sales 24 451,991 545,604
Cost of sales (275,839) (310,326)
GROSS PROFIT 24 176,152 235,278
Operating expenses
Selling, general and administrative (69,343) (79,982)
Research and development, net 21 (50,314) (60,405)
Amortization of other intangible assets 8 (544) (544)
Impairment charges 8, 10 (8,557) (893)
Restructuring expenses 22 (2,473) (80)
TOTAL OPERATING EXPENSES (131,231) (141,904)
RESULT FROM OPERATIONS 24 44,921 93,374
Finance income 904 1,583
Finance expense (2,094) (3,272)
Foreign currency exchange gain (loss), net (9,004) 26,439
Share in income of investments and associates 12 (368,331) 39,413
INCOME (LOSS) BEFORE INCOME TAXES (333,604) 157,537
Income taxes 23 (8,910) (19,377)
NET INCOME (LOSS) FROM CONTINUING OPERATIONS (342,514) 138,160
Net income from discontinued operations 3 1,402,596 3,157
NET INCOME FROM OPERATIONS 1,060,082 141,317
Net income (loss) for allocation between shareholders of the parent and non-controlling interest
Allocation of net income
Shareholders of the parent 1,062,675 141,317
Non-controlling interest (2,593) –
Per share data 26
Basic net earnings (loss) per share (EUR)
From continuing operations (5.42) 2.18
From discontinued operations 22.23 0.05
From operations 16.81 2.23
Diluted net earnings (loss) per share (EUR)
From continuing operations (5.34) 2.15
From discontinued operations 21.89 0.05
From operations 16.55 2.20
Weighted average number of shares (thousand)
Basic 63,202 63,510
Diluted 64,195 64,209
The accompanying notes are an integral part of these Consolidated financial statements.
Consolidated Annual Accounts
ASM INTERNATIONAL | STATUTORY ANNUAL REPORT 2014
CONSOLIDATED ANNUAL ACCOUNTS 102
CONTENTS

CONSOLIDATED STATEMENT OF COMPREHENSIVE INCOME
YEAR ENDED DECEMBER 31,
(EUR thousand) NOTES 2013 2014
NET INCOME FROM OPERATIONS 1,060,082 141,317Other comprehensive income (loss), items that may be subsequently reclassified to profit or loss, net of tax
Foreign currency translation effect (88,955) 146,707
Proportionate part in other comprehensive income (loss) investments and associates 480 (2,179)
Reclassification of deferred accumulative translation result to income following the sale of the 12% share of ASMPT 23,053 (3,157)
TOTAL COMPREHENSIVE INCOME 16 994,660 282,689
Allocation of comprehensive income (loss)
Shareholders of the parent 997,253 282,689
Non-controlling interest (2,593) –
The accompanying notes are an integral part of these Consolidated financial statements.
ASM INTERNATIONAL | STATUTORY ANNUAL REPORT 2014
CONSOLIDATED ANNUAL ACCOUNTS 103
CONTENTS

CONSOLIDATED STATEMENT OF FINANCIAL POSITION
DECEMBER 31,
(EUR thousand except share data) NOTES 2013 2014
Assets
Property, plant and equipment 9 56,531 79,236
Goodwill 7 10,472 11,155
Other intangible assets 8 61,229 65,214
Investments and Associates 3, 12 943,953 1,092,948
Deferred tax assets 23 4,875 3,217
Assets classified as held for sale 10 738 724
Evaluation tools at customers 11 13,332 17,767
TOTAL NON-CURRENT ASSETS 1,091,130 1,270,261
Inventories 6 106,398 125,930
Accounts receivable 5 83,016 81,971
Income taxes receivable 23 1,226 2,868
Other current assets 13,156 22,363
Cash and cash equivalents 4 312,437 385,777
TOTAL CURRENT ASSETS 516,233 618,909
TOTAL ASSETS 1,607,363 1,889,170
Liabilities and shareholders’ equity
SHAREHOLDERS’ EQUITY 16 1,495,641 1,742,906
Pension liabilities 17 2,477 1,825
Deferred tax liabilities 23 8,187 9,952
TOTAL NON-CURRENT LIABILITIES 10,664 11,777
Accounts payable 44,837 61,053
Provision for warranty 14 7,966 9,910
Income taxes payable 23 10,087 15,952
Accrued expenses and other payables 15 38,168 47,572
TOTAL CURRENT LIABILITIES 101,058 134,487
TOTAL LIABILITIES 111,722 146,264
TOTAL LIABILITIES AND SHAREHOLDERS’ EQUITY 1,607,363 1,889,170
The accompanying notes are an integral part of these Consolidated financial statements.
ASM INTERNATIONAL | STATUTORY ANNUAL REPORT 2014
CONSOLIDATED ANNUAL ACCOUNTS 104
CONTENTS
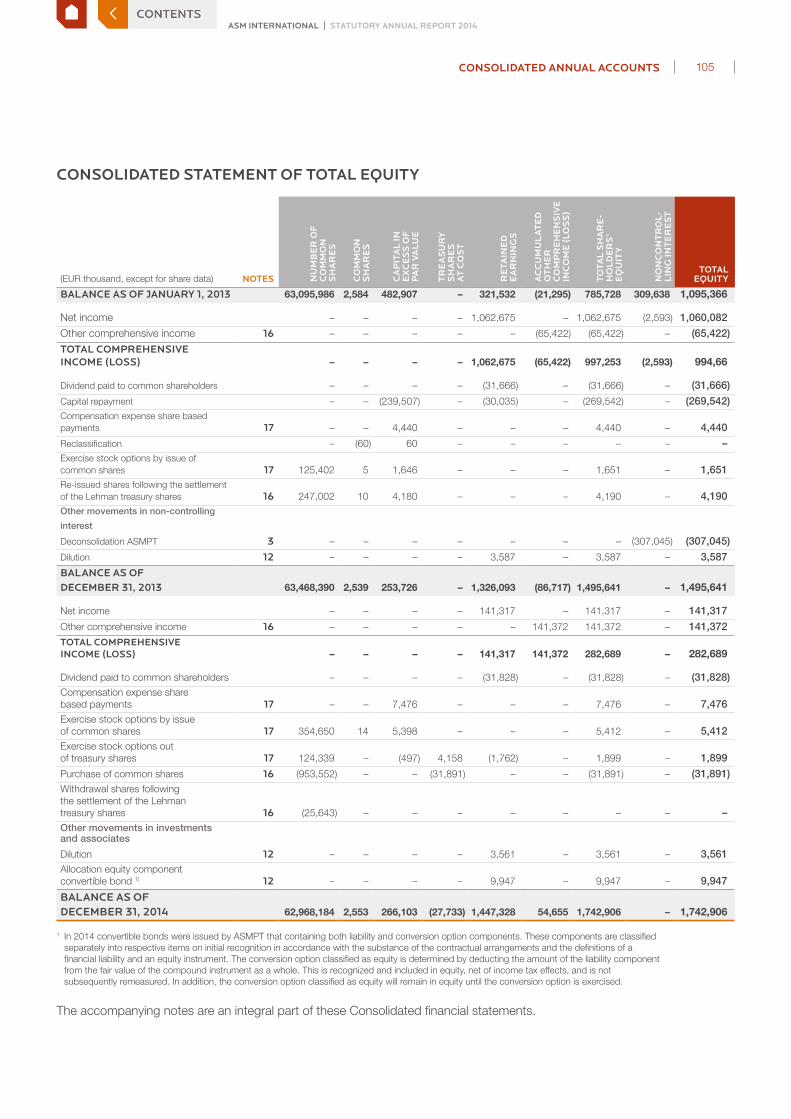
CONSOLIDATED STATEMENT OF TOTAL EQUITY
(EUR thousand, except for share data) NOTES NU
MB
ER
OF
C
OM
MO
N
SH
AR
ES
CO
MM
ON
S
HA
RE
S
CA
PIT
AL
IN
EX
CE
SS
OF
P
AR
VA
LUE
TR
EA
SU
RY
S
HA
RE
S
AT
CO
ST
RE
TAIN
ED
E
AR
NIN
GS
AC
CU
MU
LA
TE
D
OT
HE
R
CO
MP
RE
HE
NS
IVE
IN
CO
ME
(LO
SS
)
TOTA
L S
HA
RE
-H
OL
DE
RS
’ E
QU
ITY
NO
NC
ON
TR
OL-
LIN
G IN
TE
RE
ST
TOTAL EQUITY
BALANCE AS OF JANUARY 1, 2013 63,095,986 2,584 482,907 – 321,532 (21,295) 785,728 309,638 1,095,366
Net income – – – – 1,062,675 – 1,062,675 (2,593) 1,060,082
Other comprehensive income 16 – – – – – (65,422) (65,422) – (65,422)
TOTAL COMPREHENSIVE INCOME (LOSS) – – – – 1,062,675 (65,422) 997,253 (2,593) 994,66
Dividend paid to common shareholders – – – – (31,666) – (31,666) – (31,666)
Capital repayment – – (239,507) – (30,035) – (269,542) – (269,542)Compensation expense share based payments 17 – – 4,440 – – – 4,440 – 4,440
Reclassification – (60) 60 – – – – – –Exercise stock options by issue of common shares 17 125,402 5 1,646 – – – 1,651 – 1,651Re-issued shares following the settlement of the Lehman treasury shares 16 247,002 10 4,180 – – – 4,190 – 4,190Other movements in non-controlling
interest
Deconsolidation ASMPT 3 – – – – – – – (307,045) (307,045)
Dilution 12 – – – – 3,587 – 3,587 – 3,587
BALANCE AS OF DECEMBER 31, 2013 63,468,390 2,539 253,726 – 1,326,093 (86,717) 1,495,641 – 1,495,641
Net income – – – – 141,317 – 141,317 – 141,317
Other comprehensive income 16 – – – – – 141,372 141,372 – 141,372TOTAL COMPREHENSIVE INCOME (LOSS) – – – – 141,317 141,372 282,689 – 282,689
Dividend paid to common shareholders – – – – (31,828) – (31,828) – (31,828)Compensation expense share based payments 17 – – 7,476 – – – 7,476 – 7,476Exercise stock options by issue of common shares 17 354,650 14 5,398 – – – 5,412 – 5,412Exercise stock options out of treasury shares 17 124,339 – (497) 4,158 (1,762) – 1,899 – 1,899
Purchase of common shares 16 (953,552) – – (31,891) – – (31,891) – (31,891)Withdrawal shares following the settlement of the Lehman treasury shares 16 (25,643) – – – – – – – –Other movements in investments and associates
Dilution 12 – – – – 3,561 – 3,561 – 3,561Allocation equity component convertible bond 1) 12 – – – – 9,947 – 9,947 – 9,947
BALANCE AS OF DECEMBER 31, 2014 62,968,184 2,553 266,103 (27,733) 1,447,328 54,655 1,742,906 – 1,742,906
1 In 2014 convertible bonds were issued by ASMPT that containing both liability and conversion option components. These components are classified separately into respective items on initial recognition in accordance with the substance of the contractual arrangements and the definitions of a financial liability and an equity instrument. The conversion option classified as equity is determined by deducting the amount of the liability component from the fair value of the compound instrument as a whole. This is recognized and included in equity, net of income tax effects, and is not subsequently remeasured. In addition, the conversion option classified as equity will remain in equity until the conversion option is exercised.
The accompanying notes are an integral part of these Consolidated financial statements.
ASM INTERNATIONAL | STATUTORY ANNUAL REPORT 2014
CONSOLIDATED ANNUAL ACCOUNTS 105
CONTENTS

CONSOLIDATED STATEMENT OF CASH FLOWS YEAR ENDED DECEMBER 31,
(EUR thousand) NOTES 2013 2014
Cash flows from operating activities
Net income (loss) from continuing operations (342,514) 138,160
Adjustments to reconcile net income to net cash from operating activities
Depreciation, amortization and impairments 8, 9 38,388 33,008
Share-based compensation 17 4,439 7,476
Non cash financing costs (414) (22,265)
Share in income of investments and associates 3, 12 368,331 (39,413)
Deferred income taxes 7,416 4,850
Changes in assets and liabilities
Accounts receivable (26,487) 6,756
Inventories 7,733 (20,022)
Other current assets (2,578) (7,531)
Accounts payable and accrued expenses 12,671 20,979
Current income taxes (1,347) 2,738
CASH FLOWS FROM OPERATING ACTIVITIES FROM CONTINUING OPERATIONS 65,638 124,736
Cash flows from operating activities from discontinued operations 850 –
NET CASH PROVIDED BY OPERATING ACTIVITIES 66,488 124,736
Cash flows from investing activities
Capital expenditures 9 (10,776) (44,993)
Purchase of intangible assets 8 (18,239) (1,496)
Proceeds from sale of property, plant and equipment 9 3,832 359
CASH FLOWS FROM INVESTING ACTIVITIES FROM DISCONTINUED OPERATIONS (25,183) (46,130)
Cash flows from investing activities from discontinued operations 3 291,930 –
NET CASH (USED IN) PROVIDED BY INVESTING ACTIVITIES 266,747 (46,130)
Cash flows from financing activities
Debt issuance fees paid – (1,416)
Purchase of treasury shares ASMI – (29,338)
Proceeds from issuance of shares and exercise of stock options 5,841 4,758
Dividends to common shareholders of ASMI (31,666) (31,828)
Capital repayment (269,542) –
Dividend received from ASMPT 12 10,171 19,974
CASH FLOW FROM FINANCING ACTIVITIES FROM CONTINUING OPERATIONS (285,196) (37,850)
Cash flow from financing activities from discontinued operations (21,909) –
NET CASH USED IN FINANCING ACTIVITIES (307,105) (37,850)
FOREIGN CURRENCY TRANSLATION EFFECT ON CASH AND CASH EQUIVALENTS (4,168) 32,584
NET INCREASE IN CASH AND CASH EQUIVALENTS 21,962 73,340
Cash and cash equivalents at beginning of year 4 290,475 312,437
CASH AND CASH EQUIVALENTS AT END OF YEAR 4 312,437 385,777
Supplemental disclosures of cash flow information
Cash paid during the year for
Interest 2,933 –
Income taxes 6,493 11,789
The accompanying notes are an integral part of these Consolidated financial statements.
ASM INTERNATIONAL | STATUTORY ANNUAL REPORT 2014
CONSOLIDATED ANNUAL ACCOUNTS 106
CONTENTS

NOTES TO CONSOLIDATED FINANCIAL STATEMENTSNOTE 1. GENERAL INFORMATION/SUMMARY OF SIGNIFICANT ACCOUNTING POLICIES
GENERAL INFORMATIONASM International NV (‘ASMI’ or ‘the Company’) is a Dutch public liability company domiciled in the Netherlands with its principal operations in Europe, the United States and Asia. The Company dedicates its resources to the research, development, manufacturing, marketing and servicing of equipment and materials used to produce mainly semiconductor devices.
The Company’s shares are listed for trading on the Nasdaq (symbol ASMI) and the Euronext Amsterdam Stock Exchange (symbol ASM).
The accompanying consolidated financial statements include the financial statements of ASM International NV, headquartered in Almere, the Netherlands, and its consolidated subsidiaries (together referred to as ‘ASMI’ or the ‘Company’). ASMI’s significant subsidiaries and associates are listed in Note 2.
The financial information relating to ASM International NV is presented in the consolidated statements. Accordingly, in accordance with Article 402, Part 9 of Book 2 of the Netherlands Civil Code, the Company financial statements only contain an abridged statement of operations.
BASIS OF PREPARATIONThe consolidated financial statements for the year ended December 2014 have been prepared in accordance with International Financial Reporting Standards (‘IFRS’) as adopted by the European Union and also comply with the financial reporting requirements included in Part 9 of Book 2 of the Dutch Civil Code. As the financial data of ASM International NV (the parent company) are included in the consolidated financial statements, the income statement in the parent company financial statements is presented in condensed form (in accordance with section 402, Book 2 of the Dutch Civil Code).
The financial statements have been prepared by the Management Board of the Company and authorized for issue on April 9, 2015 and will be submitted for adoption to the Annual General Meeting of Shareholders on May 21, 2015.
The consolidated financial statements have been prepared under the historical cost convention, unless otherwise indicated. The Company applies the going concern basis in preparing its financial statements,
The accompanying consolidated financial statements are presented in of euro (‘EUR’), which is the Company’s functional currency. All financial information is presented in euro unless stated otherwise and has been rounded to the nearest thousand; therefore amounts may not equal (sub)totals due to rounding.
USE OF ESTIMATES AND JUDGMENTSThe preparation of the Company’s consolidated financial statements in conformity with IFRS requires management to make judgments, estimates and assumptions that affect the amounts reported in the financial statements and accompanying notes. Actual results could differ fmaterially from those estimates. On an ongoing basis, ASMI evaluates its estimates and underlying assumptions. ASMI bases its estimates on historical experience and on various other assumptions that are believed to be reasonable, the results of which form the basis for making judgments about the carrying values of assets and liabilities. Revisions to accounting estimates are recognized in the period in which the estimates are revised and in any future periods affected.
NOTE 1 | CONSOLIDATED ANNUAL ACCOUNTS 107
ASM INTERNATIONAL | STATUTORY ANNUAL REPORT 2014CONTENTS

SUMMARY OF SIGNIFICANT ACCOUNTING POLICIES
ConsolidationThe consolidated financial statements include the accounts of ASM International NV (‘ASMI’) and all of its subsidiaries where ASMI holds a controlling interest. The non-controlling interest is disclosed separately, as appropriate, in the consolidated financial statements. All intercompany profits, transactions and balances have been eliminated in consolidation.
Control exists when ASMI has, › the power over an investee; › exposure, or rights, to variable returns from its involvement with the investee; and › the ability to use its power over the investee to affect the amount of the investor’s returns.
As from the date that these criteria are met, the financial data of the relevant company are included in the consolidation. The financial data are deconsolidated from the date on which ASMI’s control ceases.
Loss of controlUpon the loss of control, ASMI derecognizes the assets and liabilities of the subsidiary, any non-controlling interests and the other components of equity related to the subsidiary. Any surplus or deficit arising on the loss of control is recognized in profit or loss. If ASMI retains any interest in the previous subsidiary, then such interest is measured at fair value at the date that control is lost. Subsequently it is accounted for as an equity-accounted investee or as an available-for-sale financial asset depending on the level of influence retained.
Discontinued operationsAn operation is classified as discontinued at the date on which the operation meets the criteria to be classified as held for sale or when the entity has disposed of the operation. Although balance sheet information is neither restated nor remeasured for discontinued operations, the statement of (comprehensive) income information is restated for the comparative period. Discontinued operations are presented separately in the income statement and the cash flow statement. The date of disposal of a subsidiary or disposal group is the date on which control passes. The consolidated income statement includes the results of a subsidiary or disposal group up to the date of disposal; the gain or loss on disposal is the difference between (a) the carrying amount of the net assets plus any attributable goodwill and amounts accumulated in other comprehensive income (for example, foreign translation adjustments and available-for-sale reserves); and (b) the proceeds of sale.
Business combinationsASMI records business combinations under the acquisition method of accounting. Accordingly, the purchase price is allocated to the tangible assets and liabilities and intangible assets acquired, based on their estimated fair values. The excess purchase price over the fair value is recorded as goodwill. Purchased intangibles with definite lives are amortized over their respective useful lives. When a bargain purchase incurs, which is the case when the fair value of the acquired business exceeds the purchase price, this surplus in fair value is recognized as a gain from bargain purchase.
Before recognizing a gain on a bargain purchase, the Company reassesses whether it has correctly identified all of the assets acquired and all of the liabilities assumed and recognizes any additional assets or liabilities that are identified in that review. The Company then reviews the procedures used to measure the amounts IFRS requires to be recognized at the acquisition date for all of the following: the identifiable assets acquired and liabilities assumed; the non-controlling interest in the acquiree, if any; and the consideration transferred.
NOTE 1 | CONSOLIDATED ANNUAL ACCOUNTS 108
ASM INTERNATIONAL | STATUTORY ANNUAL REPORT 2014CONTENTS

Segment reportingThe Company organizes its activities in two operating segments, Front-end and Back-end. Operating segments are reported in a manner consistent with the internal reporting provided to the Chief Executive Officer (‘CEO’), which is the chief operating decision maker.
The Back-end segment is still reported as a separate segment after the Company ceased control on March 15, 2013, since the full results of the Bach-end segment are continued to be reviewed by our CODM.
Accordingly, the asset and profit/loss information regarding the operations that comprise the segment are disclosed. The full financial results are reviewed by the CODM, the external reporting of the segment are on an equity method investment basis. The total of all segments’ financial amounts are reconciled to the corresponding amounts reported in the consolidated financial statements, eliminations are reflected in the reconciling column for amounts reported in excess of those amounts reflected in the consolidated financial statements.
The Front-end segment manufactures and sells equipment used in wafer processing, encompassing the fabrication steps in which silicon wafers are layered with semiconductor devices. The segment is a product driven organizational unit comprised of manufacturing, service, and sales operations in Europe, the United States, Japan and Southeast Asia.
The Back-end segment manufactures and sells equipment and materials used in assembly and packaging, encompassing the processes in which silicon wafers are separated into individual circuits and subsequently assembled, packaged and tested. The segment is organized in ASM Pacific Technology Ltd, in which the Company holds a 39.75% interest, whilst the remaining shares are listed on the Stock Exchange of Hong Kong.
Foreign currency translationItems included in the financial statements of each ASMI’s entities are measured using the currency of the primary economic environment in which the entity operates (the functional currency). The consolidated financial information is presented in euro (‘EUR’), which is the functional currency of the Company and the group’s presentation currency.
In the preparation of ASMI’s consolidated financial statements assets and liabilities of foreign subsidiaries, of which the functional currency is not the euro, are translated into euros at the exchange rate in effect on the respective balance sheet dates. Income and expenses are translated into euros based on the weighted average exchange rates for the corresponding period. Resulting translation adjustments are directly recorded in shareholders’ equity. Currency differences on intercompany loans that have the nature of a long-term investment are also accounted for directly in shareholders’ equity.
Derivative financial InstrumentsASMI and its subsidiaries conduct business in a number of foreign countries, with certain transactions denominated in currencies other than the functional currency of the Company (‘euro’) or one of its subsidiaries conducting the business. The purpose of the Company’s foreign currency management is to manage the effect of exchange rate fluctuations on income, expenses, cash flows and assets and liabilities denominated in selected foreign currencies, in particular denominated in US dollar.
The Company may use forward exchange contracts to hedge its foreign exchange risk of anticipated sales or purchase transactions in the normal course of business, which occur within the next twelve months, for which the Company has a firm commitment from a customer or to a supplier. The terms of these contracts are consistent with the timing of the transactions being hedged. The hedges related to forecasted transactions are designated and documented at the inception of the hedge as cash flow hedges, and are evaluated for effectiveness quarterly. The effective portion of the gain or loss on these hedges is reported as a component of accumulated other comprehensive income/loss net of taxes in shareholders’ equity, and is reclassified into earnings when the hedged transaction affects earnings.
NOTE 1 | CONSOLIDATED ANNUAL ACCOUNTS 109
ASM INTERNATIONAL | STATUTORY ANNUAL REPORT 2014CONTENTS
Changes in the fair value of derivatives that do not qualify for hedge treatment, as well as the ineffective portion of any hedges, are recognized in earnings. The Company records all derivatives, including forward exchange contracts, on the balance sheet at fair value in other current assets or accrued expenses and other.
Substantially all amounts, which are net of taxes, included in accumulated other comprehensive loss at December 31 will be reclassified to net earnings within the next twelve months, upon completion of the underlying transactions. If the underlying transaction being hedged fails to occur, or if a portion of any derivative is ineffective, the gain or loss is immediately recognized in earnings under foreign currency exchange gains (losses) in the consolidated statement of operations.
Furthermore, the Company might manage the currency exposure of certain receivables and payables using derivative instruments, such as forward exchange contracts (fair value hedges) and currency swaps, and non-derivative instruments, such as debt borrowings in foreign currencies. The gains or losses on these instruments provide an offset to the gains or losses recorded on receivables and payables denominated in foreign currencies. The derivative instruments are recorded at fair value and changes in fair value are recorded in earnings under foreign currency exchange gains (losses) in the consolidated statement of operations. Receivables and payables denominated in foreign currencies are recorded at the exchange rate at the balance sheet date and gains and losses as a result of changes in exchange rates are recorded in earnings under foreign currency exchange gains (losses) in the consolidated statement of operations.
The Company does not use forward exchange contracts for trading or speculative purposes. Financial assets and financial liabilities are recognized on the Company’s Consolidated balance sheet when the Company becomes a party to the contractual provisions of the instrument.
Cash and cash equivalentsCash and cash equivalents comprise deposits held at call with banks and other short-term highly liquid investments with original maturity of three months or less. Bank overdrafts are included in notes payable to banks in current liabilities.
Accounts receivableAccounts receivable are measured at initial recognition at fair value, and are subsequently measured at amortized cost using the effective interest rate method.
A significant percentage of our accounts receivable is derived from sales to a limited number of large multinational semiconductor device manufacturers located throughout the world. In order to monitor potential credit losses, we perform ongoing credit evaluations of our customers’ financial condition. An allowance for doubtful accounts is maintained for potential credit losses based upon management’s assessment of the expected collectability of all accounts receivable. The allowance for doubtful accounts is reviewed periodically to assess the adequacy of the allowance. In making this assessment, management takes into consideration any circumstances of which we are aware regarding a customer’s inability to meet its financial obligations; and our judgments as to potential prevailing economic conditions in the industry and their potential impact on the Company’s customers.
The allowance is based on historical experience, credit evaluations, specific customer collection history and any customer-specific issues ASMI has identified. Changes in circumstances, such as an unexpected adverse material change in a major customer’s ability to meet its financial obligation to ASMI or its payment trends, may require us to further adjust our estimates of the recoverability of amounts due to ASMI, which could have an adverse material effect on ASMI’s financial condition and results of operations. On December 31, 2014 the allowance for doubtful accounts amounted to €19 compared to total accounts receivable of €81,971.
NOTE 1 | CONSOLIDATED ANNUAL ACCOUNTS 110
ASM INTERNATIONAL | STATUTORY ANNUAL REPORT 2014CONTENTS

InventoriesInventories are stated at the lower of cost (first-in, first-out method) or net realisable value. Costs include net prices paid for materials purchased, charges for freight and custom duties, production labor cost and factory overhead. Allowances are made for slow moving, obsolete or unsellable inventory.
Allowances for obsolescence of inventory are determined based on the expected demand as well as the expected market value of the inventory. We regularly evaluate the value of our inventory of components and raw materials, work in progress and finished goods, based on a combination of factors including the following: forecasted sales, historical usage, product end of life cycle, estimated current and future market values, service inventory requirements and new product introductions, as well as other factors. Purchasing requirements and alternative uses for the inventory are explored within these processes to mitigate inventory exposure. We record write downs for inventory based on the above factors and take into account worldwide quantities and demand into our analysis.
On December 31, 2014 our allowance for inventory obsolescence amounted to €18,883, which is 13.0% of total inventory. If circumstances related to our inventories change, our estimate of the values of inventories could materially change. On December 31, 2014, an increase of our overall estimate for obsolescence and lower market value by 10% of our total inventory balance would result in an additional charge to cost of sales of €14.5 million.
Evaluation tools at customersEvaluation tools at customers (‘evaluation tools’) are systems generally delivered to customers under evaluation or a conditional purchase order and include substantial customization by our engineers and Research and Development (‘R&D’) staff in the field. Evaluation tools are recorded at cost and depreciated over their useful life (five years). The depreciation period may be shorter, depending on circumstances. The depreciation expenses are reported as cost of sales.
On final acceptance of the system the purchase consideration is recognized as revenue. The carrying value of the evaluation system at that point in time is recognized as cost of sales. In the circumstance that the system is returned, at the end of the evaluation period, a detailed impairment review takes place, and future sales opportunities and additional costs are identified. Only when the fair value is below the carrying value of the evaluation tool an additional depreciation is recognized. The remaining carrying value is recognized as finished goods (inventory).
Accounts payableAccounts payable are measured at initial recognition at fair value, and are subsequently measured at amortized cost using the effective interest rate method.
Bank debtNotes payable to banks and long-term debt are initially measured at fair value, and are subsequently measured at amortized cost, using the effective interest rate method. Any difference between the proceeds and the settlement or redemption of borrowings is recognized over the term of the debt.
Equity instrumentsEquity instruments issued by the Company are recorded at the proceeds received, net of direct issuance costs.
Non-current assetsNon-current assets include goodwill, other intangible assets and property, plant and equipment. Property, plant and equipment are carried at cost, less accumulated depreciation and any impairment losses. Capital leased assets are recorded at the present value of future lease obligations. Depreciation is calculated using the straight-line method over the estimated useful lives. Leasehold improvements are depreciated over the lesser of the estimated useful life of the leasehold improvement or the term of the underlying lease.
NOTE 1 | CONSOLIDATED ANNUAL ACCOUNTS 111
ASM INTERNATIONAL | STATUTORY ANNUAL REPORT 2014CONTENTS

Business combinations are accounted for under the purchase acquisition method. The Company tests its recorded goodwill and other intangible assets with indefinite lives for impairment each year on December 31 and whenever events or changes in circumstances indicate that the carrying amount of an asset may not be recoverable.
Business combinations are accounted for under the purchase method. As from January 1, 2004, goodwill and other intangibles assets with indefinite lives are no longer amortized. Instead, the Company tests its recorded goodwill and other intangible assets with indefinite lives for impairment each year on December 31 or if events or changes in circumstances indicate that the carrying amount exceeds the fair value of the goodwill and other intangible assets with indefinite lives.
Development expenses are capitalized when all of the following criteria are demonstrated: › the technical feasibility of completing the intangible asset so that it will be available for use or sale; › its intention to complete the intangible asset and use or sell it; › its ability to use or sell the intangible asset; › how the intangible asset will generate probable future economic benefits; › the availability of adequate technical, financial and other resources to complete the development and to use or sell the intangible asset; and › its ability to measure the expenditure attributable to the intangible asset during its development reliably.
As from 2005 onwards the Company capitalizes development expenses that meet the above-mentioned criteria in its Consolidated financial statements.
Amortization of capitalized development expenses is calculated using the straight-line method over the estimated useful lives of the developed product. Amortization starts when the developed product is transferred to high volume manufacturing. Other intangible assets with finite lives are amortized over the estimated useful lives using the straight-line method.
Recoverability of non-current assetsNon-current assets (except those not being amortized) to be held and used by the Company are reviewed by the Company for impairment whenever events or changes in circumstances indicate that the carrying amount of an asset may not be recoverable. In performing the review for recoverability, the Company estimates the future discounted cash flows expected to result from the use of the asset. If the recoverable amount is less than the carrying amount of the asset, the asset is deemed impaired. The amount of the impairment is measured as the difference between the carrying value and the fair value of the asset. Long-lived assets and other intangibles (except those not being amortized) to be disposed of are reported at the lower of carrying amount or fair value less cost to sell.
The calculation of fair value involves certain management judgments and was based on our best estimates and projections at the time of our review. The value may be different if other assumptions are used. In future periods we may be required to record an impairment loss based on the impairment test performed, which may significantly affect our results of operations at that time. On December 31, 2014, we determined that a decrease in estimated cash flows of 10% and an increase of 10% of the discount rate used in calculating the fair value would not result in an impairment of the carrying value of goodwill.
Other intangible assets with finite lives are amortized over the estimated useful lives using the straight-line method. Other intangible assets and property, plant and equipment are reviewed by us for impairment whenever events or changes in circumstances indicate that the carrying amount of an asset may not be recoverable. In performing the review for recoverability, we estimate the future undiscounted cash flows expected to result from the use of the asset and its eventual disposition. The cash flow estimates that we use include certain management judgments and are based on our best estimates and projections at the time of our review, and these may be different if other assumptions are used. In future periods, however, we may be required to record
NOTE 1 | CONSOLIDATED ANNUAL ACCOUNTS 112
ASM INTERNATIONAL | STATUTORY ANNUAL REPORT 2014CONTENTS

impairment losses, which may significantly affect our results of operations at that time. On December 31, 2014, we determined that a decrease in estimated cash flows of 10% would not result in an impairment of the carrying value of long-lived assets.
Assets classified as held for saleA long-lived asset to be sold is classified as held for sale in the period in which all of the following criteria are met: › management, having the authority to approve the action, commits to a plan to sell the asset; › the asset is available for immediate sale in its present condition subject only to terms that are usual and customary for sales of such assets; › an active program to locate a buyer and other actions required to complete the plan to sell the asset have been initiated; › the sale of the asset is probable, and transfer of the asset is expected to qualify for recognition as a completed sale, within one year; and › the asset is being actively marketed for sale at a price that is reasonable in relation to its current fair value.
If at any time these criteria are no longer met a long-lived asset classified as held for sale will be reclassified as held and used.
If during the initial one-year period, circumstances arise that previously were considered unlikely and, as a result, a long-lived asset previously classified as held for sale is not sold by the end of that period and all of the following conditions are met: › during the initial one-year period the entity initiated actions necessary to respond to the change in circumstances; and › the asset is being actively marketed at a price that is reasonable given the change in circumstances.
The period required to complete the sale of a long-lived asset may be extended beyond one year.
If at any time the criteria for classification as held for sale are no longer met, the entity shall cease to classify the asset as held for sale. The entity shall measure a non-current asset that ceases to be classified as held for sale at the lower of: › its carrying amount before the asset was classified as held for sale, adjusted for any depreciation that would have been recognized had the asset not been classified as held for sale; and › its recoverable amount at the date of the subsequent decision not to sell.
A non-current asset classified as held for sale shall be presented separately in the statement of financial position.
Investments and associated companiesInvestments in associated companies are accounted for under the equity method on a go forward basis. Dividend income from the Company’s subsidiaries and associated companies is recognized when the right to receive payment is established.
Impairment of investments and associated companiesASMI does not separately test investment’s underlying assets for impairment. However, ASMI recognizes its share of any impairment charge recorded by an investee and considers the effect, if any, of the impairment on the basis difference in the assets giving rise to the investee’s impairment charge. A loss in value of an investment which is other than a temporary decline will be recognized.
The ASMPT investment is accounted for under the equity method on a go forward basis. Equity method investments are tested for prolonged decline in value. An investment is considered impaired if the fair value of the investment is less than its carrying value. If after a prior recognized impairment the fair value is more than its
NOTE 1 | CONSOLIDATED ANNUAL ACCOUNTS 113
ASM INTERNATIONAL | STATUTORY ANNUAL REPORT 2014CONTENTS

carrying value this impairment is reversed. The determination of whether an investment is impaired is made at the individual security level in each reporting period.
If the fair value of an investment is less than its carrying value at the balance sheet date, the Company determines whether the decline in value is temporary or prolonged. The Company considers the following facts and guidelines when determining whether a prolonged decline in value exists: › positive factors as the reasons that a prolonged decline in value does not exist must be more objectively verifiable; and › with respect to measuring a prolonged decline in value, an investment’s fair value as of the balance sheet date should be used to determine the new carrying value.
A prolonged decline in value is measured as of a balance sheet reporting date. Summarized below is a discussion of various factors (positive, negative, and otherwise) the Company considers when assessing the potential impairment of ASMPT.
If an investment’s fair value declines below cost the Company determines whether there is adequate evidence to overcome the presumption that the decline is prolonged. The positive factors are weighed against any negative evidence that is gathered about the security.
Revenue recognitionThe Company recognizes revenue when all four revenue recognition criteria have been met: persuasive evidence of an arrangement exists; delivery has occurred or services have been rendered; seller’s price to buyer is fixed or determinable; and collectability is reasonably assured. The Company’s revenue includes revenue from contractual arrangements consisting of multiple deliverables, such as equipment and installation. The revenue from the undelivered element of the arrangement is deferred at fair value until delivery of the element.
A major portion of our revenue is derived from contractual arrangements with customers that have multiple deliverables, such as installation. The revenue relating to the undelivered elements of the arrangements, the installation, is deferred until delivery of these elements.
In general, the Company recognizes revenue from sales of equipment upon shipment of equipment, only if testing at the factory has proved that the equipment has met substantially all of the customer’s criteria and specifications.
The Company recognizes revenue from installation of equipment upon completion of installation at the customer’s site. At the time of shipment, the Company defers that portion of the sales price related to the installation. The relative selling price of the installation process is measured based upon the per-hour amounts charged by third parties for similar installation services. Installation is completed when testing at the customer’s site has proved that the equipment has met all of the customer’s criteria and specifications. The completion of installation is signed-off by the customer (‘final acceptance’). The revenue relating to the undelivered elements of the arrangements is deferred at their relative selling prices until delivery of these elements. At December 31, 2014 we have deferred revenues from installations in the amount of €7.8 million (2013: €3.9 million).
We provide training and technical support service to customers. Revenue related to such services is recognized when the service is rendered. Revenue from the sale of spare parts and materials is recognized when the goods are shipped.
The Company’s sales frequently involve complex equipment, which may include customer-specific criteria, sales to new customers or equipment with new technology. For each sale, the decision whether to recognize revenue is, in addition to shipment and factory acceptance, based on the contractual agreement with a customer, the experience with a particular customer, the technology and the number of similarly configured equipment previously delivered. Instead of recognizing revenue, the Company could decide to defer revenue recognition until completion of installation at the customer’s site and obtaining final acceptance from the customer.
NOTE 1 | CONSOLIDATED ANNUAL ACCOUNTS 114
ASM INTERNATIONAL | STATUTORY ANNUAL REPORT 2014CONTENTS

Freight charges billed to customers are recognized as revenue, the related costs are recognized as cost of sales. Revenues are recognized excluding the taxes levied on revenues.
Cost of salesCost of sales comprise direct costs such as labor, materials, cost of warranty, depreciation, shipping and handling costs and related overhead costs. Cost of sales also includes third party commission, depreciation expenses of evaluation tools at customers, royalty payments and costs relating to prototype and experimental products, which the Company may subsequently sell to customers. Costs of warranty include the cost of labor, material and related overhead necessary to repair a product during the warranty period.
WarrantyWe provide maintenance on our systems during the warranty period, usually one to two years. Costs of warranty include the cost of labor, material and related overhead necessary to repair a product during the warranty period. We accrue for the estimated cost of the warranty on products shipped in a provision for warranty, upon recognition of the sale of the product. The costs are estimated based on actual historical expenses incurred and on estimated future expenses related to current sales, and are updated periodically. Actual warranty costs are charged against the provision for warranty. The actual warranty costs may differ from estimated warranty costs, and we adjust our provision for warranty accordingly. Future warranty costs may exceed our estimates, which could result in an increase of our cost of sales.
Restructuring costsRestructuring expenses are recognized for exit or disposal activities when the liability arising from restructuring plans is incurred. Distinction is made in one-time employee termination expenses, contract termination expenses and other associated expenses. For the accounting on the distinguished elements of restructuring expenses we apply to the policy as mentioned below. The expenses have been charged to ‘restructuring expenses’.
One-time termination expenses represent the payments provided to employees that have become redundant and are terminated under the terms and conditions of a restructuring plan. A restructuring plan exists at the date the plan meets all of the following criteria and has been communicated to employees: › management commits to the plan; › the plan identifies the number of employees that become redundant and the expected completion date; › the plan sets out the terms and conditions of the arrangement in sufficient detail to enable employees to determine the type and amount of benefits they will receive; and › actions required to complete the plan indicate that it is unlikely that significant changes to the plan will be made or that the plan will be withdrawn.
The timing of the recognition and measurement of a liability for one-time termination expenses depends on whether employees will be retained to render service beyond a minimum retention period.
Contract termination expenses are related to the termination of an operating lease or another contract. These expenses are distinguished in: › Expenses related to the termination of the contract before the end of its term. These expenses are recognized when the contract is terminated. The liability is measured at its fair value in accordance with the contract terms. › Expenses related to contracts that will last for its remaining term without economic benefit to the entity. This is the case when a lease contract for premises is not terminated while the premises are not (completely) in use anymore. The liability is accrued for at the cease-use date, the date the company determined that it would no longer occupy the premises, which is conveyed to it under the contractual operating lease. The liability is measured at its fair value in accordance with the contract terms.
NOTE 1 | CONSOLIDATED ANNUAL ACCOUNTS 115
ASM INTERNATIONAL | STATUTORY ANNUAL REPORT 2014CONTENTS

Other costs related to restructuring include costs to consolidate or close facilities and relocate employees. A liability for other expenses related to a restructuring such as transition costs is recognized and measured in the period in which the liability is incurred. The costs incurred are directly related to the restructuring activity. The definition of exit costs excludes expected future operating losses.
Income taxesThe Company recognizes deferred tax assets and liabilities for the estimated future tax consequences of events attributable to differences between the financial statement carrying amounts of existing assets and liabilities and their respective tax bases and operating loss and tax credit carry forwards. Deferred tax assets and liabilities are measured using currently enacted tax rates. The effect on deferred tax assets and liabilities of changes in tax rates is recognized in the Consolidated statement of operations during the period in which the enacted rate changes. Deferred tax assets are reduced through a valuation allowance, based on available evidence at such time, it is more likely than not that the deferred tax assets will not be realized.
In case of expected interest and penalties related to income tax liabilities these will be accrued for and included in the provision for income taxes.
We currently have significant deferred tax assets, which resulted primarily from operating losses incurred in prior years as well as other temporary differences. We have established a valuation allowance to reflect the likelihood of the realization of deferred tax assets. Based on available evidence, we regularly evaluate whether it is more likely than not that the deferred tax assets will not be realized. This evaluation includes our judgment on the future profitability and our ability to generate taxable income, changes in market conditions and other factors. On December 31, 2014, we believe that there is insufficient evidence to substantiate recognition of substantially all net deferred tax assets with respect to net operating loss carry forwards, and we have established a valuation allowance in the amount of €55.4 million. Future changes in facts and circumstances, if any, may result in a change of the valuation allowance to these deferred tax asset balances which may significantly influence our results of operations at that time. If our evaluation of the realization of deferred tax assets would indicate that an additional 10% of the net deferred tax assets as of December 31, 2014 is not realizable, this would result in an additional valuation allowance and an income tax expense of €0.3 million.
Unrecognized tax benefits mainly relate to transfer pricing positions, operational activities in countries where we are not tax registered and tax deductible costs. We estimate that no interest and penalties are related to these unrecognized tax benefits. Unrecognized tax benefits would, if recognized, impact the Company’s effective tax rate.
The calculation of our tax positions involves dealing with uncertainties in the application of complex tax laws. Our estimate for the potential outcome of any uncertain tax position is highly judgmental. Settlement of uncertain tax positions in a manner inconsistent with our estimates could have a material impact on our earnings, financial position and cash flows.
Pension plans and similar commitmentsThe Company has retirement plans covering substantially all employees. The principal plans are defined contribution plans, except for the plans of the Company’s operations in the Netherlands and Japan. The Company’s employees in the Netherlands participate in a multi-employer defined benefit plan. Payments to defined contribution plans and the multi-employer plan are recognized as an expense in the Consolidated statement of operations as they fall due. The Company accounts for the multi-employer plan as if it were a defined contribution plan since the manager of the plan is not able to provide the Company with the required Company-specific information to enable the Company to account for the plan as a defined benefit plan.
NOTE 1 | CONSOLIDATED ANNUAL ACCOUNTS 116
ASM INTERNATIONAL | STATUTORY ANNUAL REPORT 2014CONTENTS

The Company’s employees in Japan participate in defined benefit plans. Pension costs in respect to this defined benefit plan are determined using the projected unit credit method. These costs primarily represent the increase in the actuarial present value of the obligation for pension benefits based on employee service during the year and the interest on this obligation in respect to employee service in previous years, net of the expected return on plan assets.
For the defined benefit plan of Japan the Company recognizes in its Consolidated balance sheet an asset or a liability for the plan’s over-funded status or underfunded status respectively. Actuarial gains and losses are recognized in income when incurred. Reference is made to Note 17.
Share-based paymentsThe costs relating to employee stock options and shares (compensation expense) are recognized based upon the grant date fair value of the stock options or the shares. The fair value at grant date of employee stock options is estimated using a Black-Scholes option valuation model. This model requires the use of assumptions including expected stock price volatility, the estimated life of each award and the estimated dividend yield. The risk-free interest rate used in the model is determined, based on a euro government bond with a life equal to the expected life of the options. The estimated fair value at grant date of shares is based on the share price of the ASMI share at grant date minus the discounted value of expected dividends during the vesting period.
The grant date fair value of the stock options and shares is expensed on a straight-line basis over the vesting period, based on the Company’s estimate of stock options and shares that will eventually vest. The impact of the true up of the estimates is recognized in the consolidated statement of operations in the period in which the revision is determined. The total estimated share-based compensation expense, determined under the fair value based method, net of related tax effect, is amortized ratebly over the option vesting periods. Reference is made to Note 17.
Issuance of shares by an associateAs further described in the Notes to Consolidated financial statements herein, from time to time, the associate ASMPT will issue common shares pursuant to their Employee share incentive scheme. The effect of these issuances is a dilution of the Company’s ownership in ASMPT. The Company recognizes the impact of these issuances directly into equity.
Commitments and contingenciesThe Company has various contractual obligations, some of which are required to be recorded as liabilities in the Company’s consolidated financial statements, including long- and short-term debt. Others, namely operating lease commitments, purchase commitments and commitments for capital expenditure, are generally not required to be recognized as liabilities on the Company’s balance sheet but are required to be disclosed. Reference is made to Note 18.
Comprehensive incomeComprehensive income consists of net earnings (loss) and other comprehensive income. Other comprehensive income includes gains and losses that are not included in net earnings, but are recorded directly in Shareholders’ equity.
Capitalization of development expensesIn determining the capitalization of development expenses the Company makes estimates and assumptions based on expected future economic benefits generated by products that are the result of these development expenses. Other important estimates and assumptions are the required internal rate of return, the distinction between research, development and high-volume manufacturing and the estimated useful life.
NOTE 1 | CONSOLIDATED ANNUAL ACCOUNTS 117
ASM INTERNATIONAL | STATUTORY ANNUAL REPORT 2014CONTENTS

Cash flow statementDividends received from ASMPT are classified under cash flow from financing activities as these dividends have been used to pay dividends to common shareholders of ASMI.
RECENT ACCOUNTING PRONOUNCEMENTSThe following IFRS standards are effective as of 1 January 2014 (endorsed) and have been applied in these Financial Statements: › IAS 36 Impairment of assets has been amended regarding disclosure requirements for the recoverable amount of non-financial assets. Certain disclosure requirements of the recoverable amount of the cash-generating units have been removed from IAS 36 since these are now covered by IFRS 13. The impact is limited to disclosures in ASMI’s Financial Statements. › IAS 39 Financial instruments: recognition and measurement has been amended to ensure that novation of derivatives, designated as hedge instruments, from one counterparty to a central counterparty as a consequence of law or regulation would not result in discontinuance of the hedge relationship. The amendment has no impact on ASMI’s financial position. › IFRS 10 Consolidated financial statements establishes a single control model that applies to all entities including special purpose entities. The introduction of this new standard has not changed ASMI’s financial position. › IFRS 11 Joint arrangements classifies joint arrangements either as joint operation or joint venture by focusing on the rights and obligations of the parties to the arrangement rather than its legal form. The introduction of this new standard has not changed ASMI’s financial position. › IFRS 12 Disclosures of interests in other entities includes the disclosure requirements for all forms of interests in other entities, including joint arrangements, associates, special purpose vehicles and other off balance sheet vehicles. It is the complement of IFRS 10 and IFRS 11 and the impact is limited to the disclosures in ASMI’s Financial Statements. › The amendments to IFRS 10, IFRS 12 and IAS 27 as issued in October 2012 and endorsed in November 2013 provide an exception to the consolidation requirement for entities that meet the definition of an investment entity under IFRS 10 Consolidated financial statements. The exception to consolidation requires investment entities to account for subsidiaries at fair value through profit or loss. These amendments have no impact on ASMI since the Company has not qualified any entities as investment entities under IFRS 10.
The following standards have an effective date of January 1, 2014 (or July 1, 2014) and will be implemented as of January 1, 2015 (retrospectively) due to the timing of their endorsement by the European Union: › IFRIC 21 Levies provides guidance in addition to IAS 37 Provisions, contingent liabilities and contingent assets on how to account for levies imposed by governments other than income taxes, specifically on when to account for the liability. This IFRIC is effective as of January 1, 2014 and has been endorsed in June 2014. ASMI will apply this standard as of January 1, 2015. No material impact is expected. › IAS 19 Employee benefits has been amended regarding treatment of employee contributions in defined benefit plans. The amendment aims to simplify the calculation of employee contributions and will not affect ASMI’s financial position. This amendment is effective as of July 1, 2014 and will be applied after endorsement.
NOTE 1 | CONSOLIDATED ANNUAL ACCOUNTS 118
ASM INTERNATIONAL | STATUTORY ANNUAL REPORT 2014CONTENTS

The following new standards, interpretations and amendments to existing standards will become effective on or after January 1, 2015. These standards have not been applied in preparing these 2014 Financial statements: › IFRS 15 Revenue from contracts with customers. This standard has been issued in May 2014 and is effective as of January 1, 2017, endorsement is pending. The standard introduces new guidance on the recognition and measurement requirements of revenues. The standard applies to revenue from contracts with customers and also provides a model for the sale of some non-financial assets that are not an output of a company’s ordinary business activities (such as the sale of property, plant and equipment or intangibles). IFRS 15 provides more detailed requirements than the current standards. ASMI is currently reviewing the extent of the impact of this new standard in anticipation of endorsement. No material impact is expected. › IAS 16 Property, plant and equipment and IAS 36 Impairment of assets have been amended to clarify the acceptable methods of depreciation and amortization. The principle for the basis of depreciation and amortization is the expected pattern of consumption of the future economic benefits of an asset. These amendments have been issued in May 2014 and are effective as of January 1, 2016, endorsement is pending. ASMI does not expect an impact on its financial performance. › IFRS 11 Joint arrangements has been amended to include new guidance on how to account for the acquisition of an interest in a joint operation that constitutes a business. The amendment has been issued in May 2014 and is effective as of January 1, 2016, endorsement is pending. Based on current practice ASMI does not expect a material impact. › IFRS 9 Financial instruments. This standard is the first step in the process taken by the IASB to replace IAS 39 Financial instruments: recognition and measurement. Since the standard has not yet been endorsed by the European Commission, it is uncertain when it needs to be applied by the Company.
There are no other IFRS standards or IFRIC interpretations taking effect for the first time for the financial year beginning January 1, 2014 that would be expected to have a material impact on the 2014 accounts of the Company.
NOTE 1 | CONSOLIDATED ANNUAL ACCOUNTS 119
ASM INTERNATIONAL | STATUTORY ANNUAL REPORT 2014CONTENTS

NOTE 2. LIST OF SIGNIFICANT SUBSIDIARIESUnless otherwise indicated, these are, directly or indirectly, wholly-owned subsidiaries. Subsidiaries not important to providing an insight into the ASMI group as required under Dutch law are omitted from this list. With respect to the separate financial statements of the Dutch legal entities included in the consolidation, the Company availed itself of the exemption laid down in section 403, subsection 1 of Book 2 of the Dutch Civil Code.
% OWNERSHIP DECEMBER 31,
NAME LOCATION 2013 2014
Subsidiaries (consolidated)
ASM Europe BV 1) Almere, the Netherlands 100% 100%
ASM United Kingdom Sales BV 1) Almere, the Netherlands 100% 100%
ASM Germany Sales BV 1) Almere, the Netherlands 100% 100%
ASM Pacific Holding BV 1) 3) Almere, the Netherlands 100% 100%
ASM France SARL Crolles, France 100% 100%
ASM Belgium NV Leuven, Belgium 100% 100%
ASM Italia Srl Agrate, Italy 100% 100%
ASM Microchemistry Oy Helsinki, Finland 100% 100%
ASM Services and Support Ireland Ltd Dublin, Ireland 100% 100%
ASM Services and Support Israel Ltd Tel Aviv, Israel 100% 100%
ASM America, Inc Phoenix, Arizona, United States of America 100% 100%
ASM Japan KK Tokyo, Japan 100% 100%
ASM Wafer Process Equipment Ltd Quarry Bay, Hong Kong, People’s Republic of China 100% 100%
ASM China Ltd Shanghai, People’s Republic of China 100% 100%
ASM Wafer Process Equipment Singapore Pte Ltd Singapore 100% 100%
ASM Front-End Sales & Services Taiwan Co, Ltd Hsin-Chu, Taiwan 100% 100%
ASM Services & Support Malaysia SDN BDH Kuala Lumpur, Malaysia 100% 100%
ASM Front-End Manufacturing Singapore Pte Ltd Singapore 100% 100%
ASM Genitech Korea Ltd Cheonan, South Korea 100% 100%
ASM IP Holding BV 1) Almere, the Netherlands 100% 100%
Associates (non-consolidated)
ASM Pacific Technology Ltd 2) Kwai Chung, Hong Kong, People’s Republic of China 39.94% 39.75%1 For these subsidiaries ASM International NV has filed statements at the Dutch Chamber of Commerce assuming joint and several liability in
accordance with Article 403 of Book 2, Part 9 of the Netherlands Civil Code.2 The accounts of ASM Pacific Technology Ltd were consolidated till March 15, 2013. On that date ASM International sold a 11.88% share in
ASM Pacific Technology Ltd resulting in a cease of its control and a subsequent deconsolidation of its 40.08% associate. This shareholding diluted in December 2013 as a result of the issuance of shares to 39.94%. and in 2014 to 39.75%
3 Established in 2008, ASM Pacific Holding BV holds 39.75% of the shares in ASM Pacific Technology Ltd.
NOTE 2 | CONSOLIDATED ANNUAL ACCOUNTS 120
ASM INTERNATIONAL | STATUTORY ANNUAL REPORT 2014CONTENTS

NOTE 3. DIVESTMENTOn March 13, 2013, the Company announced that it divested a controlling stake in its subsidiary ASM Pacific Technology Ltd (‘ASMPT’). The sale of the shares officially closed on March 15, 2013. The Company sold 47,424,500 ordinary shares of ASMPT at a price of HK$90 per share to institutional or other professional investors through a partial secondary share placement, representing an 11.88% stake in ASMPT. The placement generated cash proceeds for the Company of HK$4,192 million (approximately €413 million).
The table below reconciles the cash proceeds from the divested stake in ASMPT.
Gross proceeds 420,409
Paid fees, stamp duty and other expenses (7,213)
NET PROCEEDS 413,196
FX differences 1,232
Cash balance ASMPT upon sale (116,174)
NET CASH ON DISPOSAL ASMPT 298,254
The sale of the 11.88% stake caused ASMI to cease control of ASMPT. According to IFRS the accounting of this sale consists of two separate transactions: › a sale of a 51.96% subsidiary; and › a purchase of a 40.08% associate.
These transactions resulted in a substantial gain and the deconsolidation of ASMPT. This gain consisted of two elements, the realized gain on the sale of the 11.88% stake amounting to €252 million and an unrealized re-measurement gain on the remaining 40.08% of the retained interest in ASMPT approximating €1,156 million. The purchase of the associate resulted in the recognition of the associate at fair value.
After the initial accounting of the sale transaction and related gains, subsequent accounting under IAS 28R, Investments in associates and joint ventures, requires that future income from ASMPT will need to be adjusted for the fair value adjustments arising the basis differences as if a business combination had occurred under IFRS 3R, Business combinations, i.e. a purchase price allocation (‘PPA’).
The purchase of the associate has been recognized at fair value, being the value of the ASMPT shares on the day of closing of the purchase transaction. IFRS requires that the composition of such a fair value needs to be determined through a PPA. This process took place in the remaining period of 2013. The PPA resulted in the recognition of intangible assets for customer relationship, technology, trade name and product names. For inventories and property, plant & equipment a fair value adjustment was recognized.
Prior to accounting for the ASMPT investment under the equity method it was concluded that the Company lost control of ASMPT upon the sale of the 11.88% stake in ASMPT. The Company has concluded that its 40.08% retained interested in ASMPT does not constitute control under IFRS.
Under IFRS, the disposal of the ASMPT business classifies as discontinued operations. Therefore, the gain on disposal is included in the profit or loss on discontinued operations. The discontinued operations presentation also requires the comparative periods in all 2013 financial statements to be adjusted.
NOTE 3 | CONSOLIDATED ANNUAL ACCOUNTS 121
ASM INTERNATIONAL | STATUTORY ANNUAL REPORT 2014CONTENTS

Reporting ASMI share in net earnings of ASMPT in the consolidated statement of operations of 2013:
YEAR ENDED DECEMBER 31, 2013
Result investments and associates
ASMI share net earnings March 16 - December 31, 2013 24,093
Amortization other intangible assets and fair value changes from PPA (56,654)
Impairment loss (335,770)
REPORTED ON LINE RESULT INVESTMENTS AND ASSOCIATES (368,331)
Discontinued operations
ASMI share net earnings January 1 - March 15, 2013 (5,398)
Realized gain on sale 11.88% ASMPT shares 252,370
Unrealized remeasurement gain on retained 40.08% ASMPT shares 1,155,624
REPORTED ON LINE RESULT DISCONTINUED OPERATIONS 1,402,596
NOTE 4. CASH AND CASH EQUIVALENTSCash and cash equivalents include deposits with high-rated financial institutions of €385,777. Our cash and cash equivalents are predominantly denominated in US$ and partly in euro and Korean won.
Cash and cash equivalents have insignificant interest rate risk and deposits have a remaining maturity of three months or less at the date of acquisition. The carrying amount approximates their fair value.
NOTE 5. ACCOUNTS RECEIVABLE A significant percentage of our accounts receivable is derived from sales to a limited number of large multinational semiconductor device manufacturers located throughout the world. In order to monitor potential credit losses, we perform ongoing credit evaluations of our customers’ financial condition.
The carrying amount of accounts receivable is as follows:
2013 2014
Current 54,614 65,985
Overdue <30 days 18,787 5,949
Overdue 31-60 days 783 2,142
Overdue 61-120 days 2,527 1,785
Overdue >120 days 6,305 6,110
TOTAL 83,016 81,971
An allowance for doubtful accounts receivable is maintained for potential credit losses based upon management’s assessment of the expected collectability of all accounts receivable. The allowance for doubtful accounts is reviewed periodically to assess the adequacy of the allowance. In making this assessment, management takes into consideration any circumstances of which we are aware regarding a customer’s inability to meet its financial obligations; and our judgments as to potential prevailing economic conditions in the industry and their potential impact on the Company’s customers.
NOTE 4 | CONSOLIDATED ANNUAL ACCOUNTS 122
ASM INTERNATIONAL | STATUTORY ANNUAL REPORT 2014CONTENTS

The changes in the allowance for doubtful accounts receivable are as follows:
DECEMBER 31,
2013 2014
BALANCE AT BEGINNING OF YEAR (8,551) (73)
Deconsolidation ASMPT 6,191 –
Charged to selling, general and administrative expenses 756 57
Utilization of the provision 1,469 –
Foreign currency translation effect 62 (3)
BALANCE AT END OF YEAR (73) (19)
Accounts receivable are impaired and provided for on an individual basis. As of December 31, 2014, accounts receivable of €16.0 million were past due but not impaired. These balances are still considered to be recoverable because they relate to customers for whom there is no recent history of default.
NOTE 6. INVENTORIESInventories consist of the following:
DECEMBER 31,
2013 2014
Components and raw materials 78,579 69,709
Work in process 31,442 30,040
Finished goods 20,073 45,064
TOTAL INVENTORIES, GROSS 130,094 144,813
Allowance for obsolescence (23,696) (18,883)
TOTAL INVENTORIES, NET 106,398 125,930
The changes in the allowance for obsolescence are as follows:
2013 2014
BALANCE AT BEGINNING OF YEAR (63,181) (23,696)
Deconsolidation ASMPT 39,146 –
Charged to cost of sales (8,648) (2,282)
Reversals (8) 279
Utilization of the provision 6,464 8,514
Foreign currency translation effect 2,531 (1,698)
BALANCE AT END OF YEAR (23,696) (18,883)
The addition for the years 2013 and 2014 mainly relate to inventory items which were ceased to be used due to technological developments and design changes which resulted in in obsolescence of certain parts.
On December 31, 2014, an increase of our overall estimate for obsolescence and lower market value by 10% of our total inventory balance would result in an additional charge to cost of sales of €15 million.
The cost of inventories recognized as costs and included in cost of sales amounted to €246.0 million (2013: €207.9 million).
NOTE 6 | CONSOLIDATED ANNUAL ACCOUNTS 123
ASM INTERNATIONAL | STATUTORY ANNUAL REPORT 2014CONTENTS

NOTE 7. GOODWILLThe changes in the carrying amount of goodwill are summarized as follows:
FRONT-END BACK-END TOTAL
BALANCE JANUARY 1, 2013 10,701 30,706 41,407
Deconsolidation ASMPT – (29,366) (29,366)
Foreign currency translation effect (229) (1,340) (1,569)
BALANCE DECEMBER 31, 2013 10,472 – 10,472
Foreign currency translation effect 683 – 683
BALANCE DECEMBER 31, 2014 11,155 – 11,155
The carrying amount of the goodwill is related to the acquisition of the following entities:
DECEMBER 31,
2013 2014
ASM Microchemistry Oy (Thermal products business unit) 2,611 2,611
ASM Genitech Korea Ltd (Plasma products business unit) 7,861 8,544
TOTAL 10,472 11,155
We perform an annual impairment test at December 31 of each year or if events or changes in circumstances indicate that the carrying amount of goodwill exceeds its recoverable amount. For the Front-end impairment test and the determination of the recoverable amount, the value in use method is used, based on a discounted future cash flow approach that uses our estimates of future revenues, driven by assumed market growth and estimated costs as well as appropriate discount rates.
For Back-end, goodwill is included in the investment value of ASMPT. For the impairment test reference is made to Note 3.
The material assumptions used for the fair value calculation of the reporting units are: › an average discount rate of 13.0% (2013: 16.0%) representing the pre-tax weighted average cost of capital; › external market segment data, historical data and strategic plans to estimate cash flow growth per product line have been used; and › cash flow calculations are limited to five years of cash flow; after these five years perpetuity growth rates are set based on market maturity of the products. For maturing product the perpetuity growth rates used are 1% or less and for enabling technology products the rate used is 3% or less.
These estimates are consistent with the plans and estimated costs we use to manage the underlying business. Based on this analysis management concluded that as per December 31, 2014 the recoverable amount of the reporting units exceeded the carrying value. The excess was over 100% for each of the reporting units. Sensitivity analysis demonstrated that no reasonable possible change in estimated cash flows or the discount rate used in calculating the fair value would cause the carrying value of goodwill to exceed the fair value.
NOTE 7 | CONSOLIDATED ANNUAL ACCOUNTS 124
ASM INTERNATIONAL | STATUTORY ANNUAL REPORT 2014CONTENTS

NOTE 8. OTHER INTANGIBLE ASSETSOther intangible assets include capitalized development expenditure, purchased technology from third parties and software developed or purchased (including licenses) for internal use. The changes in the amount of other intangible assets are as follows:
CAPITALIZED DEVELOPMENT EXPENDITURE SOFTWARE
PURCHASED TECHNOLOGY
AND OTHER INTANGIBLE
ASSETS TOTAL
At cost
BALANCE JANUARY 1, 2013 83,520 20,346 14,393 118,259
Additions 17,943 437 33 18,413
Impairments (7,761) – – (7,761)
Deconsolidation ASMPT – (4,931) (7,215) (12,146)
Disposals – (1) – (1)
Foreign currency translation effect (9,410) (248) (169) (9,827)
BALANCE DECEMBER 31, 2013 84,292 15,603 7,042 106,937
Additions 14,346 1,496 – 15,842
Impairments (1,267) – – (1,267)
Reclassification from evaluation tools – – 2,269 2,269
Disposals – (414) (1,202) (1,616)
Foreign currency translation effect 5,008 216 680 5,904
BALANCE DECEMBER 31, 2014 102,379 16,901 8,789 128,069
Accumulated amortization
BALANCE JANUARY 1, 2013 21,284 13,446 7,378 42,108
Amortization for the year 9,957 2,118 2,071 14,146
Deconsolidation ASMPT – (3,744) (3,895) (7,639)
Disposals – (1) – (1)
Foreign currency translation effect (2,541) (211) (154) (2,906)
BALANCE DECEMBER 31, 2013 28,700 11,608 5,400 45,708
Amortization for the year 10,893 3,695 1,033 15,621
Impairments (374) – – (374)
Reclassification from evaluation tools – – 878 878
Disposals – (414) (1,202) (1,616)
Foreign currency translation effect 1,906 193 539 2,638
BALANCE DECEMBER 31, 2014 41,125 15,082 6,648 62,855
Other intangible assets, net
DECEMBER 31, 2013 55,592 3,995 1,642 61,229
DECEMBER 31, 2014 61,254 1,819 2,141 65,214
Impairment charges on capitalized development costs are included in operating expenses under research and development. Impairment of capitalized development expenses primarily related to development of new hardware for which the customers demand has shifted out in time, and purchased technology which became obsolete.
NOTE 8 | CONSOLIDATED ANNUAL ACCOUNTS 125
ASM INTERNATIONAL | STATUTORY ANNUAL REPORT 2014CONTENTS

Other intangible assets are amortized over useful lives of three to seven years. Estimated amortization expenses relating to other intangible assets are as follows:
2015 11,244
2016 13,108
2017 14,264
2018 11,437
2019 8,160
2020 7,001
65,214
NOTE 8 | CONSOLIDATED ANNUAL ACCOUNTS 126
ASM INTERNATIONAL | STATUTORY ANNUAL REPORT 2014CONTENTS

NOTE 9. PROPERTY, PLANT AND EQUIPMENTThe changes in the amount of property, plant and equipment are as follows:
LAND, BUILDINGS AND LEASEHOLD IMPROVEMENTS
MACHINERY, EQUIPMENT,
FURNITURE AND FIXTURES TOTAL
At cost
BALANCE JANUARY 1, 2013 182,499 479,435 661,934
Capital expenditures 1,580 15,483 17,063
Deconsolidation ASMPT (139,909) (326,204) (466,113)
Retirements and sales (13,792) (10,966) (24,758)
Reclassification from held for sale 3,393 – 3,393
Reclassification – (66) (66)
Foreign currency translation effect (4,824) (15,823) (20,647)
BALANCE DECEMBER 31, 2013 28,947 141,859 170,806
Capital expenditures 619 30,028 30,647
Retirements and sales (813) (17,092) (17,905)
Reclassification 402 (402) –
Foreign currency translation effect 1,757 11,033 12,790
BALANCE DECEMBER 31, 2014 30,912 165,426 196,338
Accumulated depreciation
BALANCE JANUARY 1, 2013 88,793 307,318 396,111
Depreciation for the year 4,502 15,545 20,047
Deconsolidation ASMPT (66,115) (199,203) (265,318)
Retirements and sales (13,700) (7,089) (20,789)
Reclassification – (66) (66)
Foreign currency translation effect (2,751) (12,959) (15,710)
BALANCE DECEMBER 31, 2013 10,729 103,546 114,275
Depreciation for the year 2,001 10,576 12,577
Retirements and sales (732) (16,814) (17,546)
Reclassification 9 (9) –
Foreign currency translation effect 1,031 6,765 7,796
BALANCE DECEMBER 31, 2014 13,038 104,064 117,102
Property, plant and equipment, net
DECEMBER 31, 2013 18,218 38,313 56,531
DECEMBER 31, 2014 17,874 61,362 79,236
USEFUL LIVES IN YEARS
Buildings and leasehold improvements 10-25
Machinery and equipment 2-10
Furniture and fixtures 2-10
As per December 31, 2014, the carrying amount includes assets under construction for machinery, equipment, furnitures and fixtures of €18,042 (2013: €11,483).
NOTE 9 | CONSOLIDATED ANNUAL ACCOUNTS 127
ASM INTERNATIONAL | STATUTORY ANNUAL REPORT 2014CONTENTS

NOTE 10. ASSETS CLASSIFIED AS HELD FOR SALEThe changes in the carrying value of assets held for sale are as follows:
JAPAN THE NETHERLANDS TOTAL
BALANCE JANUARY 1, 2013 5,721 277 5,998
Impairment (796) – (796)
Reclassification to assets held in use (3,393) – (3,393)
Foreign currency translation effect (1,071) – (1,071)
BALANCE DECEMBER 31, 2013 461 277 738
Impairment (12) – (12)
Reclassification to assets held in use – – –
Foreign currency translation effect (2) – (2)
BALANCE DECEMBER 31, 2014 447 277 724
In 2009 the decision was made to dispose certain items of property, plant and equipment. These assets represent a carrying value as per December 31, 2014 of €724. The assets held for sale are located in Japan and the Netherlands.
In Japan (Tama) a building that was used for research and development activities was ceased to be used in December 2009. Due to the economic circumstances and the effects of the earthquake of 2011 in Japan we think it is not reasonable to expect this building to be sold within a reasonable period of time. Therefor we ceased to classify this building as held for sale and measured it at the lower of its carrying amount before it was classified as held for sale, adjusted for any depreciation that would have been recognized had the asset not been classified as held for sale, and its recoverable amount at the date of the subsequent decision not to sell. This resulted in an impairment charge of €796 in 2013.
Also in Japan, a piece of land purchased to build a research and development center is regarded as held for sale. The carrying value of €447 approximates the fair value less cost to sell. The expected selling prices were determined, based on various inputs and considerations.
In the Netherlands the former ASMI head office located in Bilthoven has been regarded as held for sale. The carrying value of €277 is lower than the fair value less cost to sell. The expected selling prices were determined, based on various inputs and considerations.
NOTE 11. EVALUATION TOOLS AT CUSTOMERSThe changes in the amount of evaluation tools are as follows:
2013 2014
BALANCE AT BEGINNING OF YEAR 16,922 13,332
Evaluation tools shipped 8,329 12,845
Depreciation (3,771) (3,448)
Evaluation tools sold (6,221) (4,814)
Reclassification – (1,391)
Foreign currency translation effect (1,927) 1,243
BALANCE AT END OF YEAR 13,332 17,767
Useful lives in years 5
NOTE 10 | CONSOLIDATED ANNUAL ACCOUNTS 128
ASM INTERNATIONAL | STATUTORY ANNUAL REPORT 2014CONTENTS

The gross carrying amount of the evaluation tools at customers per December 31, 2014 was €23,133 (2013: €18,082), accumulated depreciation per December 31, 2014 was €5,366 (2013: €4,750).
Evaluation tools are systems delivered to customers under evaluation agreements. Evaluation tools are recorded at cost and depreciated over their useful life (five years). The depreciation period may be shorter, depending on circumstances. The depreciation expenses are reported as cost of sales.
NOTE 12. INVESTMENTS AND ASSOCIATESThe changes in the investment and associates are as follows:
ASSOCIATES
INVESTMENTS 2)NET EQUITY
SHARE
OTHER(IN)TANGIBLE
ASSETS AND FAIR VALUE
CHANGES GOODWILLTOTAL
ASSOCIATES TOTAL
BALANCE JANUARY 1, 2013 278 – – – – 278
40.08% investment in ASMPT March 15, 2013 – 255,701 227,010 898,599 1,381,310 1,381,310
Share in income of investments and associates – 24,093 – – 24,093 24,093
Other comprehensive income of investments and associates – 480 – – 480 480
Amortization recognized (in)tangible assets – – (16,848) – (16,848) (16,848)
Fair value changes – – (39,807) – (39,807) (39,807)
Impairment – – – (335,772) (335,772) (335,772)
Dividends – (10,171) – – (10,171) (10,171)
Dilution ASMPT share to 39.94% – 3,587 – – 3,587 3,587
Foreign currency translation effect – (8,940) (8,824) (45,433) (63,197) (63,197)BALANCE DECEMBER 31, 2013 278 264,750 161,531 517,394 943,675 943,953
Share in income of investments and associates (278) 62,209 – – 62,209 61,931
Other comprehensive income of investments and associates – (2,109) – – (2,109) (2,109)
Amortization recognized (in)tangible assets – – (22,517) – (22,517) (22,517)
Dividends – (19,974) – – (19,974) (19,974)
Dilution ASMPT share to 39.75% – 3,561 – – 3,561 3,561
Allocation equity component convertible bond 1) – 9,947 – – 9,947 9,947
Foreign currency translation effect – 28,179 19,830 70,147 118,156 118,156
BALANCE DECEMBER 31, 2014 – 346,563 158,844 587,541 1,092,948 1,092,948
1 In 2014 convertible bonds were issued by ASMPT that containing both liability and conversion option components. These components are classified separately into respective items on initial recognition in accordance with the substance of the contractual arrangements and the definitions of a financial liability and an equity instrument. The conversion option classified as equity is determined by deducting the amount of the liability component from the fair value of the compound instrument as a whole. This is recognized and included in equity, net of income tax effects, and is not subsequently remeasured. In addition, the conversion option classified as equity will remain in equity until the conversion option is exercised.
2 Investments reflects the net equity value of the interest in Levitech BV resulting from the management buy-out in 2009 of the RTP business. ASM International NV obtained a 20% interest in Levitech BV. This value has been reduced in 2014 due to (start-up) losses of Levitech caused by the introduction of their advanced products in the market.
NOTE 12 | CONSOLIDATED ANNUAL ACCOUNTS 129
ASM INTERNATIONAL | STATUTORY ANNUAL REPORT 2014CONTENTS

On March 13, 2013, the Company announced that it divested a controlling stake in its subsidiary ASM Pacific Technology Ltd (‘ASMPT’). The sale of the shares officially closed on March 15, 2013. The Company sold 47,424,500 ordinary shares of ASMPT at a price of HK$90 per share to institutional or other professional investors through a partial secondary share placement, representing an 11.88% stake in ASMPT. The placement generated cash proceeds for the Company of HK$4,191,980 million (approximately €413 million).
The sale of the 11.88% stake caused ASMI to cease control of ASMPT. According to US GAAP the accounting of this sale consists of two separate transactions: › a sale of a 51.96% subsidiary; and › a purchase of a 40.08% associate.
These transactions resulted in a substantial gain and the deconsolidation of ASMPT. This gain consisted of two elements, the realized gain on the sale of the 11.88% stake amounting to €252 million and an unrealized re-measurement gain on the remaining 40.08% of the retained interest in ASMPT approximating €1,156 million. The purchase of the associate resulted in the recognition of the associate at fair value.
After the initial accounting of the sale transaction and related gains, subsequent accounting under IAS 28R, Investments in associates and joint ventures, requires that future income from ASMPT will need to be adjusted for the fair value adjustments arising the basis differences as if a business combination had occurred under IFRS 3R, Business combinations, i.e. a purchase price allocation (‘PPA’).
The purchase of the associate has been recognized at fair value, being the value of the ASMPT shares on the day of closing of the purchase transaction. US GAAP requires that the composition of such a fair value needs to be determined through a PPA. This process took place in the remaining period of 2013. The PPA resulted in the recognition of intangible assets for customer relationship, technology, trade name and product names. For inventories and property, plant & equipment a fair value adjustment was recognized.
The ASMPT investment is accounted for under the equity method on a go forward basis. Equity method investments are tested for prolonged impairment. An investment is considered impaired if the fair value of the investment is less than its amortized cost. The determination of whether an investment is impaired is made at the individual security level in each reporting period.
If the fair value of an investment is less than its cost or amortized cost at the balance sheet date, the Company determines whether the impairment is temporary or other prolonged. During the period after March 15, 2013 the ASMPT share traded for a longer period below the price at the close of sale. Based on this other than temporary share price decrease, the book value of our equity method investment in ASMPT was adjusted reflecting the share price on December 31, 2013 of HK$64.90 resulting in an impairment charge of €336 million.
In December 2014, 1,885,000 common shares of ASMPT were issued, for cash at par value of HK$0.10 per share, pursuant to the Employee Share Incentive Scheme of ASMPT. The shares issued under the plan in 2014 have diluted ASMI’s ownership in ASMPT to 39.75% as of December 31, 2014.
At December 31, 2014, the book value of our equity method investment after the aforementioned impairment in ASMPT was €1,093 million. The historical cost basis of our 39.75% share of net assets on the books of ASMPT under IFRS was €347 million as of December 31, 2014, resulting in a basis difference of €746 million. €159 million of this basis difference has been allocated property, plant and equipment and intangibles assets. The remaining amount was allocated to equity method goodwill. Each individual, identifiable asset will periodically be reviewed for any indicators of potential impairment which, if required, would result in acceleration of basis difference amortization. We amortize the basis differences allocated to the assets on a straight-line basis, and include the impact within the results of our equity method investments. Amortization and depreciation are adjusted for related deferred tax impacts. Included in net income attributable to ASMI for 2014 was after-tax expense of €23 million, representing the depreciation and amortization of the basis differences.
NOTE 12 | CONSOLIDATED ANNUAL ACCOUNTS 130
ASM INTERNATIONAL | STATUTORY ANNUAL REPORT 2014CONTENTS

The market value of our 39.75% investment ASMPT at December 31, 2014 approximates €1,257 million.
Summarized 100% earnings information for ASMPT equity method investment excluding basis adjustments:
(HK$ million) 2013 2014
Net sales 10,841 14,229
Income before income tax 673 2,028
Net earnings 559 1,600
Other comprehensive income 106 (353)
Summarized 100% balance sheet information for ASMPT equity method investment excluding basis adjustments:
DECEMBER 31,
(HK$ million) 2013 2014
Current assets 8,019 10,840
Non-current assets 2,722 3,654
Current liabilities 3,304 3,759
Non-current liabilities 356 2,532
Equity 7,081 8,203
The ASMPT Board is responsible for ongoing monitoring of the performance of the Back-end activities. The actual results of the Back-end operating unit are discussed with the ASMPT Audit Committee, which includes the representative of ASMI. The ASMI representative reports to the ASMI Management Board and the Audit Committee of ASMI on a quarterly basis.
Our share of income taxes incurred directly by the equity companies is reported in result from investments and associates and as such is not included in income taxes in our consolidated financial statements.
NOTE 13. NOTES PAYABLE TO BANKSAs per December 31, 2014 ASMI is debt free. ASMI may borrow under separate short-term lines of credit with banks. The lines contain general provisions concerning renewal and continuance at the option of the banks.
Total short-term lines of credit amounted to €150 million at December 31, 2014. The amount outstanding at December 31, 2014 was nil so the undrawn portion totaled €150 million. The undrawn portion represents the Company’s standby revolving credit facility of €150 milion with a consortium of banks. The facility was extended in 2013 and will be available through December 31, 2018. Once the facility is used, this usage is secured by a portion of the Company’s shareholding in ASMPT or accounts receivable.
The credit facility of €150 million includes two financial covenants which are based on US GAAP: › minimum consolidated tangible net worth; and › consolidated total net debt/total shareholders’ equity ratio.
These financial covenants are measured twice each year, at June 30 and December 31.
The minimum level of consolidated tangible net worth for the year ended December 31, 2014 required was €320 million, the consolidated tangible net worth as per that date was €937 million.
Consolidated tangible net worth is defined as the net assets, deducting any amount shown in respect of goodwill or other intangible assets (including any value arising from any valuation of ASMPT).
NOTE 13 | CONSOLIDATED ANNUAL ACCOUNTS 131
ASM INTERNATIONAL | STATUTORY ANNUAL REPORT 2014CONTENTS
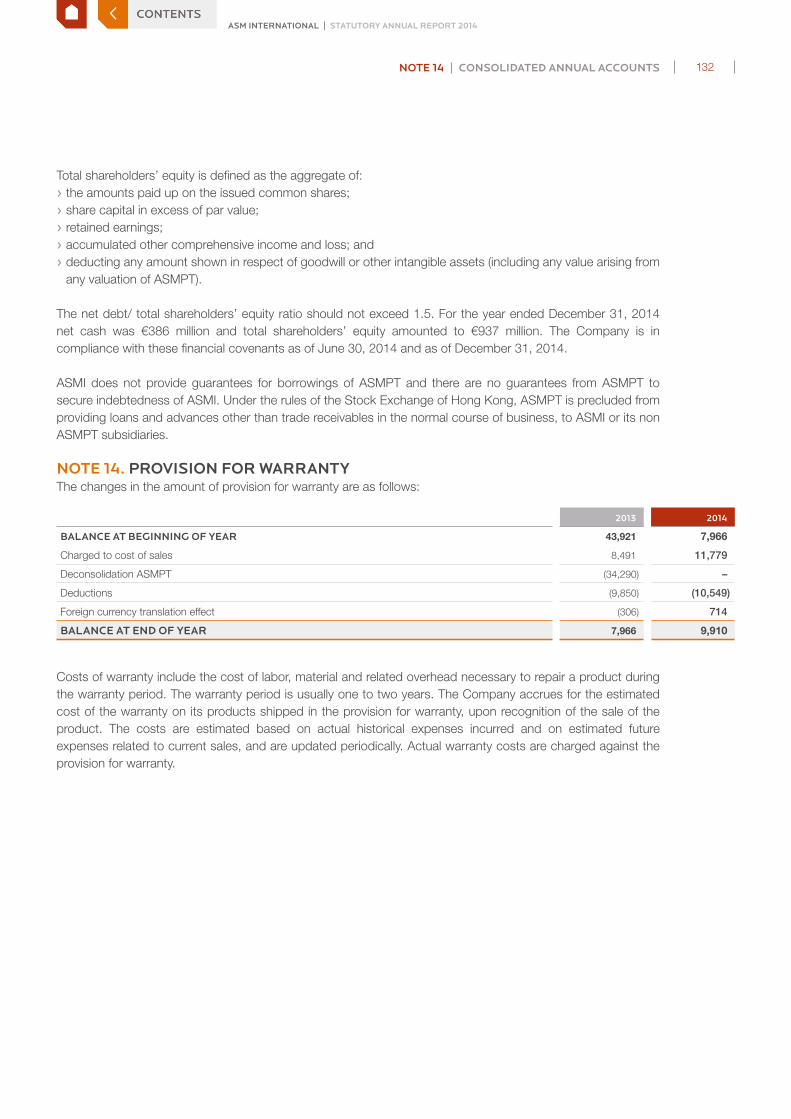
Total shareholders’ equity is defined as the aggregate of: › the amounts paid up on the issued common shares; › share capital in excess of par value; › retained earnings; › accumulated other comprehensive income and loss; and › deducting any amount shown in respect of goodwill or other intangible assets (including any value arising from any valuation of ASMPT).
The net debt/ total shareholders’ equity ratio should not exceed 1.5. For the year ended December 31, 2014 net cash was €386 million and total shareholders’ equity amounted to €937 million. The Company is in compliance with these financial covenants as of June 30, 2014 and as of December 31, 2014.
ASMI does not provide guarantees for borrowings of ASMPT and there are no guarantees from ASMPT to secure indebtedness of ASMI. Under the rules of the Stock Exchange of Hong Kong, ASMPT is precluded from providing loans and advances other than trade receivables in the normal course of business, to ASMI or its non ASMPT subsidiaries.
NOTE 14. PROVISION FOR WARRANTYThe changes in the amount of provision for warranty are as follows:
2013 2014
BALANCE AT BEGINNING OF YEAR 43,921 7,966
Charged to cost of sales 8,491 11,779
Deconsolidation ASMPT (34,290) –
Deductions (9,850) (10,549)
Foreign currency translation effect (306) 714
BALANCE AT END OF YEAR 7,966 9,910
Costs of warranty include the cost of labor, material and related overhead necessary to repair a product during the warranty period. The warranty period is usually one to two years. The Company accrues for the estimated cost of the warranty on its products shipped in the provision for warranty, upon recognition of the sale of the product. The costs are estimated based on actual historical expenses incurred and on estimated future expenses related to current sales, and are updated periodically. Actual warranty costs are charged against the provision for warranty.
NOTE 14 | CONSOLIDATED ANNUAL ACCOUNTS 132
ASM INTERNATIONAL | STATUTORY ANNUAL REPORT 2014CONTENTS
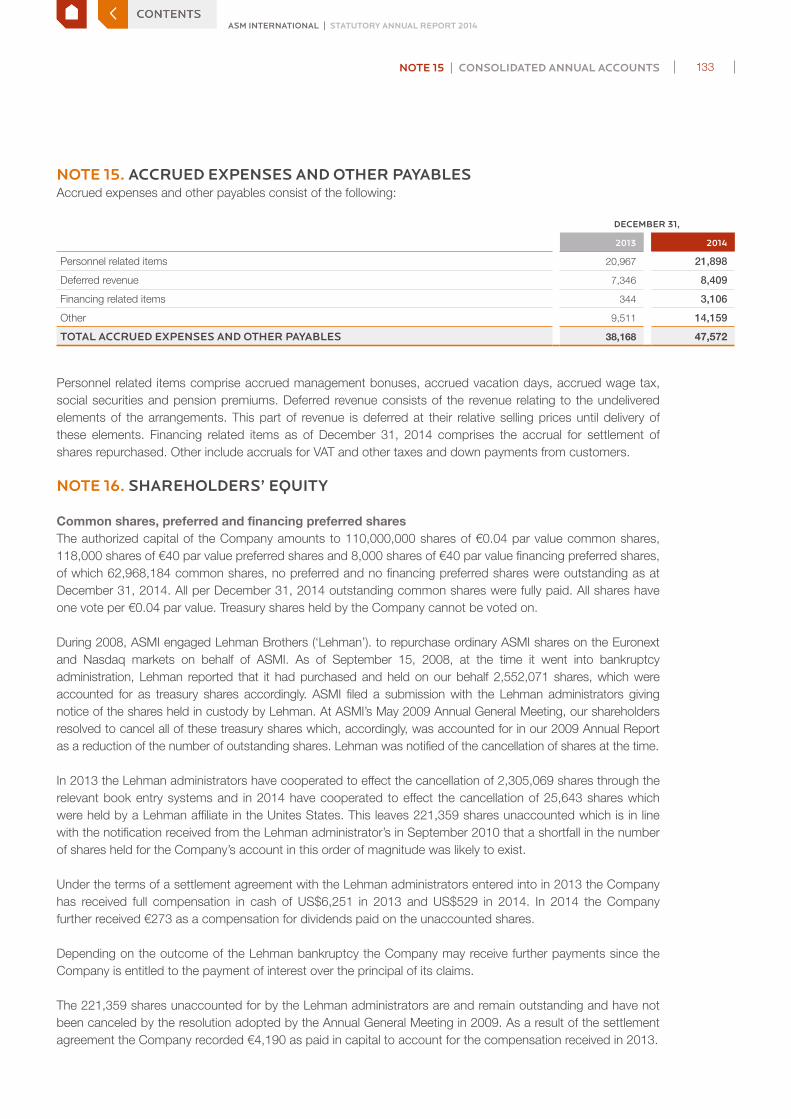
NOTE 15. ACCRUED EXPENSES AND OTHER PAYABLESAccrued expenses and other payables consist of the following:
DECEMBER 31,
2013 2014
Personnel related items 20,967 21,898
Deferred revenue 7,346 8,409
Financing related items 344 3,106
Other 9,511 14,159
TOTAL ACCRUED EXPENSES AND OTHER PAYABLES 38,168 47,572
Personnel related items comprise accrued management bonuses, accrued vacation days, accrued wage tax, social securities and pension premiums. Deferred revenue consists of the revenue relating to the undelivered elements of the arrangements. This part of revenue is deferred at their relative selling prices until delivery of these elements. Financing related items as of December 31, 2014 comprises the accrual for settlement of shares repurchased. Other include accruals for VAT and other taxes and down payments from customers.
NOTE 16. SHAREHOLDERS’ EQUITY
Common shares, preferred and financing preferred sharesThe authorized capital of the Company amounts to 110,000,000 shares of €0.04 par value common shares, 118,000 shares of €40 par value preferred shares and 8,000 shares of €40 par value financing preferred shares, of which 62,968,184 common shares, no preferred and no financing preferred shares were outstanding as at December 31, 2014. All per December 31, 2014 outstanding common shares were fully paid. All shares have one vote per €0.04 par value. Treasury shares held by the Company cannot be voted on.
During 2008, ASMI engaged Lehman Brothers (‘Lehman’). to repurchase ordinary ASMI shares on the Euronext and Nasdaq markets on behalf of ASMI. As of September 15, 2008, at the time it went into bankruptcy administration, Lehman reported that it had purchased and held on our behalf 2,552,071 shares, which were accounted for as treasury shares accordingly. ASMI filed a submission with the Lehman administrators giving notice of the shares held in custody by Lehman. At ASMI’s May 2009 Annual General Meeting, our shareholders resolved to cancel all of these treasury shares which, accordingly, was accounted for in our 2009 Annual Report as a reduction of the number of outstanding shares. Lehman was notified of the cancellation of shares at the time.
In 2013 the Lehman administrators have cooperated to effect the cancellation of 2,305,069 shares through the relevant book entry systems and in 2014 have cooperated to effect the cancellation of 25,643 shares which were held by a Lehman affiliate in the Unites States. This leaves 221,359 shares unaccounted which is in line with the notification received from the Lehman administrator’s in September 2010 that a shortfall in the number of shares held for the Company’s account in this order of magnitude was likely to exist.
Under the terms of a settlement agreement with the Lehman administrators entered into in 2013 the Company has received full compensation in cash of US$6,251 in 2013 and US$529 in 2014. In 2014 the Company further received €273 as a compensation for dividends paid on the unaccounted shares.
Depending on the outcome of the Lehman bankruptcy the Company may receive further payments since the Company is entitled to the payment of interest over the principal of its claims.
The 221,359 shares unaccounted for by the Lehman administrators are and remain outstanding and have not been canceled by the resolution adopted by the Annual General Meeting in 2009. As a result of the settlement agreement the Company recorded €4,190 as paid in capital to account for the compensation received in 2013.
NOTE 15 | CONSOLIDATED ANNUAL ACCOUNTS 133
ASM INTERNATIONAL | STATUTORY ANNUAL REPORT 2014CONTENTS

Financing preferred shares are designed to allow ASMI to finance equity with an instrument paying a preferred dividend, linked to EURIBOR loans and government loans, without the dilutive effects of issuing additional common shares.
Preferred and financing preferred shares are issued in registered form only and are subject to transfer restrictions. Essentially, a preferred or financing preferred shareholder must obtain the approval of the Company’s Supervisory Board to transfer shares. If the approval is denied, the Supervisory Board will provide a list of acceptable prospective buyers who are willing to purchase the shares at a cash price to be fixed by consent of the Supervisory Board and seller within two months after the approval is denied. If the transfer is approved, the shareholder must complete the transfer within three months, at which time the approval expires.
Preferred shares are entitled to a cumulative preferred dividend based on the amount paid-up on such shares. Financing preferred shares are entitled to a cumulative dividend based on the par value and share premium paid on such shares.
Under IFRS, Common shares are recorded as equity attributable to shareholders of the Company. Preferred shares and financing preferred shares are recorded as liabilities. No preferred shares and financing preferred shares were issued as per 31 December 2014.
Retained earningsDistributions to common shareholders are limited to the extent the total amount of shareholders’ equity exceeds the amounts of nominal paid-in share capital (exclusive any share premium) and any reserves to be formed pursuant to law or the Company’s Articles of Association. The amounts are derived from the Statutory financial statements of ASM International NV.
Results on dilution of investments in associates are accounted for directly in equity. For 2014 and 2013 these dilution results were €3,561 and €3,587 respectively.
Accumulated other comprehensive lossThe changes in the amount of accumulated other comprehensive reflect the foreign currency translation effects.
PROPORTIONATE SHARE IN OTHER
COMPREHENSIVE INCOME
INVESTMENTS AND ASSOCIATES 1)
FOREIGN CURRENCY
TRANSLATION EFFECTS 1)
TOTAL OTHER COMPREHENSIVE
INCOME
BALANCE JANUARY 1, 2013 – (21,295) (21,295)
Reclassification of deferred accumulative translation result to income following the sale of the 12% share of ASMPT – 23,053 23,053
Proportionate share in other comprehensive income investments and associates 480 – 480
Foreign currency translation effect on translation of foreign operations – (88,955) (88,955)
BALANCE DECEMBER 31, 2013 480 (87,197) (86,717)
Proportionate share other comprehensive income investments and associates (2,179) – (2,179)
Foreign currency translation effect on translation of foreign operations – 146,707 146,707
Reclassification of deferred accumulative translation result to income following the sale of the 12% share of ASMPT – (3,157) (3,157)
BALANCE DECEMBER 31, 2014 (1,699) 56,354 54,6551 Other comprehensive income (loss), items may be subsequently reclassified to profit or loss.
NOTE 16 | CONSOLIDATED ANNUAL ACCOUNTS 134
ASM INTERNATIONAL | STATUTORY ANNUAL REPORT 2014CONTENTS

Purchases of equity securities by the issuer and affiliated purchasersOn May 21, 2014, the General Meeting of Shareholders authorized the Company, for an 18-month period, to be calculated from the date of the General Meeting, to repurchase its own shares up to the statutory maximum, at a price at least equal to the shares’ nominal value and at most a price equal to 110% of the share’s average closing price according to the listing on the Euronext Amsterdam stock exchange during the five trading days preceding the purchase date.
The maximum of shares that may yet be purchased under the program takes into account the treasury shares held by the Company (at December 31, 2014 there were 829,213 treasury shares held) and the maximum number of common shares which the Company can hold according to its Articles of Association. This maximum is 10% of the number of common shares issued.
On October 29, 2014, ASMI announced a share buyback program, to purchase up to an amount of €100 million of its own shares within the 2014-2015 time frame. The repurchase program is part of ASMI’s commitment to use excess cash for the benefit of its shareholders.
ASMI intends to use part of the shares for commitments under employee share-based compensation schemes.
The buyback program is executed by intermediaries through on-exchange purchases or through off-exchange trades. The program started on November 24, 2014, and will end on completion of the program but ultimately on November 20, 2015.
The maximum number of shares to be repurchased on any given day will not exceed 25% of the average daily trading volume on the regulated market on which purchases are made, calculated over the last 20 trading days before the date of repurchase. In the year 2014 we repurchased 953,552 shares at an average price of €33.45. On December 31, 2014 of the total program, 31.9% has been repurchased.
NOTE 17. EMPLOYEE BENEFITS
PENSION PLANSThe Company has retirement plans covering substantially all employees. The principal plans are defined contribution plans, except for the plans of the Company’s operations in the Netherlands and Japan.
Multi-employer planThe Company’s employees in the Netherlands, approximately 143 employees, participate in a multi-employer union plan, ‘Pensioenfonds van de Metalektro’, (‘PME’) determined in accordance with the collective bargaining agreements effective for the industry in which ASMI operates. This collective bargaining agreement has no expiration date. This multi-employer union plan covers approximately 1,260 companies and 145,000 contributing members. ASMI’s contribution to the multi-employer union plan is less than 5% of the total contribution to the plan as per the annual report for the year ended December 31, 2013. The plan monitors its risks on a global basis, not by company or employee, and is subject to regulation by Dutch governmental authorities. By law (the Dutch Pension Act), a multi-employer union plan must be monitored against specific criteria, including the coverage ratio of the plan assets to its obligations. This coverage ratio must exceed 104.3% for the total plan. Every company participating in a Dutch multi-employer union plan contributes a premium calculated as a percentage of its total pensionable salaries, with each company subject to the same percentage contribution rate. The premium can fluctuate yearly based on the coverage ratio of the multi-employer union plan. The pension rights of each employee are based upon the employee’s average salary during employment.
NOTE 17 | CONSOLIDATED ANNUAL ACCOUNTS 135
ASM INTERNATIONAL | STATUTORY ANNUAL REPORT 2014CONTENTS

ASMI’s net periodic pension cost for this multi-employer union plan for any period is the amount of the required contribution for that period. A contingent liability may arise from, for example, possible actuarial losses relating to other participating entities because each entity that participates in a multi-employer union plan shares in the actuarial risks of every other participating entity or any responsibility under the terms of a plan to finance any shortfall in the plan if other entities cease to participate.
The coverage ratio of the multi-employer union plan decreased to 102.0% as of December 31, 2014 (December 31, 2013: 103.4%). Because of the low coverage ratio PME prepared and executed a so-called ‘Recovery plan’ which was approved by De Nederlandsche Bank, the Dutch central bank, which is the supervisor of all pension companies in the Netherlands. Due to the low coverage ratio and according the obligation of the ‘Recovery plan’ the pension premium percentage is 23.6% in 2014 (2013: 24.1%). The coverage ratio is calculated by dividing the plan assets by the total sum of pension liabilities and is based on actual market interest.
The Company accounts for the multi-employer plan as if it were a defined contribution plan as the manager of the plan, PME, stated that its internal administrative systems do not enable PME to provide the Company with the required Company-specific information in order to account for the plan as a defined benefit plan. The Company’s net periodic pension cost for the multi-employer plan for a fiscal period is equal to the required contribution for that period.
A contingent liability may arise from, for example, possible actuarial losses relating to other participating companies because each company that participates in a multi-employer plan shares in the actuarial risks of other participating companies or any responsibility under the terms of a plan to finance any shortfall in the plan if other companies cease to participate. The plan thus exposes the participating companies to actuarial risks associated with current and former employees of other companies with the result that no consistent and reliable basis for allocating the pension obligation, plan assets and cost to individual companies participating in the plan exists.
Defined benefit planThe Company’s employees in Japan participate in a defined benefit plan. The Company makes contributions to defined benefit plans in Japan that provide pension benefits for employees upon retirement. These are average-pay plans, based on the employees’ years of service and compensation near retirement.
The most recent actuarial valuations of plan assets and the present value of the defined benefit obligation were carried out at December 31, 2014. The present value of the defined benefit obligation and the related current service cost and passed service cost were measured using the Projected Unit Credit Method. Significant actuarial assumptions for the determination of the defined obligation are discount rate, future general salary increases and future pension increases.
The net liability of the plan developed as follows:
DECEMBER 31,
2013 2014
Defined benefit obligations (7,604) (8,079)
Fair value of plan assets 5,127 6,297
NET LIABILITY FOR DEFINED BENEFIT PLANS (2,477) (1,782)
NOTE 17 | CONSOLIDATED ANNUAL ACCOUNTS 136
ASM INTERNATIONAL | STATUTORY ANNUAL REPORT 2014CONTENTS

The changes in defined benefit obligations and fair value of plan assets are as follows:
DECEMBER 31,
2013 2014
Defined benefit obligations
BALANCE JANUARY 1 8,357 7,604
Current service cost 529 515
Interest on obligation 113 69
Remeasurement losses 660 98
Benefits paid (128) (164)
Foreign currency translation effect (1,927) (43)
BALANCE DECEMBER 31 7,604 8,079
Fair value of plan assets
BALANCE JANUARY 1 4,794 5,127
Interest income 74 52
Remeasurement gains 358 113
Company contribution 1,233 1,162
Benefits paid (128) (164)
Foreign currency translation effect (1,204) 7
BALANCE DECEMBER 31 5,127 6,297
The remeasurement results on the defined benefit obligations consist solely of experience assumptions of €98. The remeasurement gains on the plan assets relates to changes in financial assumptions.
The history of the experience adjustments is as follows:
2010 2011 2012 2013 2014
Present value of defined benefit obligation 8,808 9,485 8,357 7,604 8,079
Fair value of plan assets 3,189 4,090 4,794 5,127 6,297
DEFICIT 5,619 5,395 3,563 2,477 1,782
The defined benefit cost consists of the following:
DECEMBER 31,
2013 2014
Current service cost 529 516
Net interest costs 39 17
Other (112) (69)
NET DEFINED BENEFIT COST 456 464
The actual return on plan assets was €112 for the year ended December 31, 2013 (2013: €382).
NOTE 17 | CONSOLIDATED ANNUAL ACCOUNTS 137
ASM INTERNATIONAL | STATUTORY ANNUAL REPORT 2014CONTENTS

The assumptions in calculating the actuarial present value of benefit obligations and net periodic benefit cost are as follows:
2013 2014
Discount rate for obligations 0.90% 0.90%
Expected rate of compensation increase 2.93% 2.93%
The main risk on the pension plan relates to the discount rate. The defined benefit obligation is sensitive to a change in discount rates, a relative change of the discount rate with 25 basis points would have resulted in a change of the defined benefit obligation with 2.6%.
The allocation of plan assets is as follows:
DECEMBER 31,
2013 2014
Equity 1,351 26% 1,655 26%
Bonds 3,019 59% 3,639 58%
Loans 453 9% 674 11%
Real estate 89 2% 78 1%
Other 215 4% 251 4%
5,127 100% 6,297 100%
The investment strategy is determined based on an asset-liability study in consultation with investment advisers and within the boundaries given by regulatory bodies for pension funds. Equity securities consist primarily of publicly traded Japanese companies and common collective funds. Publicly traded equities are valued at the closing prices reported in the active market in which the individual securities are traded (level 1). Common collective funds are valued at the published price (level 1) per share multiplied by the number of shares held as of the measurement date.
Fixed income (bonds and loans) consists of corporate bonds, government securities and common collective funds. Corporate and government securities are valued by third-party pricing sources (level 2). Common collective funds are valued at the net asset value per share (level 2) multiplied by the number of shares held as of the measurement date.
Real estate fund and other values are primarily reported by the fund manager and are based on valuation of the underlying investments (level 3) which include inputs such as cost, discounted cash flows, independent appraisals and market based comparable data.
The plan assets do not include any of the Company’s shares.
NOTE 17 | CONSOLIDATED ANNUAL ACCOUNTS 138
ASM INTERNATIONAL | STATUTORY ANNUAL REPORT 2014CONTENTS

Retirement plan costsASMI contributed €1,162 to the defined benefit plan in 2014. The Company expects to pay benefits for years subsequent to December 31, 2014 as follows:
EXPECTED CONTRIBUTION
DEFINED BENEFIT PLAN
2015 318
2016 208
2017 506
2018 653
2019 608
Aggregate for the years 2020-2024 2,860
TOTAL 5,153
Retirement plan costs consist of the following:
DECEMBER 31,
2013 2014
Defined contribution plans 2,043 2,478
Multi-employer plans 1,274 1,220
Defined benefit plans 527 464
TOTAL RETIREMENT PLAN COSTS 3,844 4,162
The Company does not provide for any significant post-retirement benefits other than pensions.
EMPLOYEE AND EXECUTIVE LONG-TERM INCENTIVE PLANThe Company has adopted various stock option plans and has entered into stock option agreements with various employees. Under these plans, employees may purchase a specific number of shares of the Company’s common stock. Options are priced at market value in euro or US dollars on the date of grant.
2011 Long-term incentive planIn 2011 a Stock option plan was adopted. In this plan to limit potential dilution, the amount of outstanding (vested and non-vested) options granted to the Management Board and to other employees will not exceed 7.5% of the issued ordinary share capital of ASMI. The Stock option plan 2011 consists of two sub-plans: the ASMI Stock option plan for employees (ESOP) and the ASMI Stock option for members of the Management Board (MSOP).
For employees and existing Management Board members the grant date for all options granted is December 31 of the relevant year. In each of these situations the three year vesting period starts at the grant date. The exercise price in euro of all options issued under the SOPS is determined on the basis of the market value of the ASMI shares at (i.e. immediately prior to) the grant date.
The exercise period is four years starting at the third anniversary of the vesting date.
NOTE 17 | CONSOLIDATED ANNUAL ACCOUNTS 139
ASM INTERNATIONAL | STATUTORY ANNUAL REPORT 2014CONTENTS

2014 Long-term incentive planIn 2014 a new Long-term incentive plan was adopted. In the new plan to limit potential dilution, the amount of outstanding (vested and non-vested) options and shares granted to the Management Board and to other employees will not exceed 5% of the issued ordinary share capital of ASMI. The new Long-term incentive plan 2014 consists of two sub-plans: the ASM International NV 2014 Long-term incentive plan for employees (ELTI) and the ASM International NV 2014 Long-term incentive plan for members of the Management Board (MLTI).
Options and performance shares are issued to Management Board members and restricted shares are issued to employees once per annum on the date following the publication of the first quarter results of the relevant year. Possible grant to newly hired employees can be issued once a quarter, on the date following the publication of the financial results of the relevant quarter. The number of options and shares outstanding under the Long-Term Incentive plans or under any other plan or arrangement in aggregate may never exceed 5% of ASMI’s share capital. In accordance with the ASMI Remuneration Policy an exception is made for a transition period of four years, during which the dilution may exceed 5% but will not exceed 7.5%
Authority to issue options and sharesBy resolution of the Annual General Meeting of May 21, 2014 the formal authority to issue options and shares was allocated to the Management Board subject to the approval of the Supervisory Board. This authority is valid for 18 months and needs to be refreshed annually by the AGM to allow the continued application of the LTI plans beyond November 20, 2015. The ELTI is principally administered by the Management Board and the MLTI is principally administered by the Supervisory Board. This complies with applicable corporate governance standards. However, the Supervisory Board has no power to represent the Company. For external purposes the Management Board remains the competent body under both LTI plans. The LTI plans envisage that the Supervisory Board, or - in the case of the ELTI - the Management Board with the approval of the Supervisory Board, will determine the number of options and shares to be granted to the Management Board members and to employees.
Outstanding options and sharesAt December 31, 2014, options to purchase 2,172,455 shares have been issued under the 2011 Stock option plan representing 4.4% of the shares outstanding per December 31, 2014. Under previous plans no more options to purchase shares can be issued. Under the various stock option plans a total of 2,789,561 options to purchase common stock were outstanding at December 31, 2014, expiring at various dates through 2020. The number of options outstanding at December 31, 2013 and 2014 were 3,308,502 and 2,789,561 respectively. The number of restricted shares outstanding at December 31, 2014 was 10,215.
Capital distributionFollowing the sale of a 12% share of ASMPT on March 15, 2013, a capital distribution of €4.25 per common share was effectuated on July 25, 2013. As a result of this capital distribution the underlying value of ASMI option holders was diluted. The Management Board of ASMI and the Supervisory Board of ASMI decided to apply a theoretical adjustment ratio of 0.84794 to the outstanding options granted to employees including members of the Management Board as determined based on the specific rules issued and applied by NYSE Liffe. These specific rules issued by NYSE Liffe are similar to the adjustment ratio as applied to traded securities that are also not entitled to receive the capital distribution. Under these rules a theoretical adjustment ratio was determined based on the value and the effective date of the capital distribution and this ratio was applied to adjust the original number of the options and the original exercise price of the outstanding options.
NOTE 17 | CONSOLIDATED ANNUAL ACCOUNTS 140
ASM INTERNATIONAL | STATUTORY ANNUAL REPORT 2014CONTENTS

Options outstandingThe following is a summary of changes in options outstanding:
EURO-PLANS US DOLLAR-PLANS
NUMBER OF OPTIONS
WEIGHTED AVERAGE
EXERCISE PRICE IN €
NUMBER OF OPTIONS
WEIGHTED AVERAGE
EXERCISE PRICE IN US$
BALANCE JANUARY 1, 2013 1,924,688 22.22 400,400 20.94
Options forfeited (25,050) 24.72 (1,220) 13.65
Options exercised (23,550) 15.91 (52,670) 15.97
BALANCE JULY 25, 2013 1,876,088 22.26 346,510 21.72
Adjustment following capital distribution 336,446 18.88 62,145 18.42
Options granted 776,450 23.73 – –
Options forfeited (39,271) 20.93 (2,830) 9.06
Options exercised (29,361) 10.70 (17,675) 12.66
BALANCE DECEMBER 31, 2013 2,920,352 20.22 388,150 18.75
Options forfeited (41,366) 22.00 (1,416) 18.08
Options exercised (175,650) 15.68 (300,509) 12.53
BALANCE DECEMBER 31, 2014 2,703,336 20.49 86,225 21.18
The weighted average fair values of employee stock option granted in euro were €10.22 in 2013.
As a result of the newly adopted 2014 Long-term incentive plan under which restricted shares, performance shares and employee stock options may be granted in the period following the publication of the first quarterly results no stock options were granted in 2014.
The total intrinsic value of options exercised was €7,311 for the year ended December 31, 2014 (2013: €1,651). In 2013 and 2014 new shares have been issued for the exercise of 125,402 options and 354,650 options respectively.
On December 31, 2014 options outstanding and options exercisable classified by range of exercise prices are:
OPTIONS OUTSTANDING OPTIONS EXERCISABLE
RANGE OF EXERCISE PRICESNUMBER
OUTSTANDING
WEIGHTED AVERAGE
REMAINING CONTRACTUAL
LIFE
WEIGHTED AVERAGE
EXERCISE PRICENUMBER
EXERCISABLE
WEIGHTED AVERAGE
EXERCISE PRICE
In US$ In years In US$ In US$
1.00-10.00 10,098 4.0 7.60 10,098 7.60
10.00-20.00 42,565 1.7 17.82 42,565 17.82
20.00-30.00 33,562 2.0 29.52 23,658 29.45
US$1.00-30.00 86,225 2.1 21.18 76,321 20.07
In EUR In years In EUR In EUR
10.00-15.00 349,415 1.8 12.03 349,415 12.03
15.00-20.00 780,827 3.5 18.59 780,826 18.59
20.00-25.00 1,573,094 5.5 23.31 10,380 22.47
€1.00-25.00 2,703,336 4.4 20.49 1,140,621 16.61
NOTE 17 | CONSOLIDATED ANNUAL ACCOUNTS 141
ASM INTERNATIONAL | STATUTORY ANNUAL REPORT 2014CONTENTS
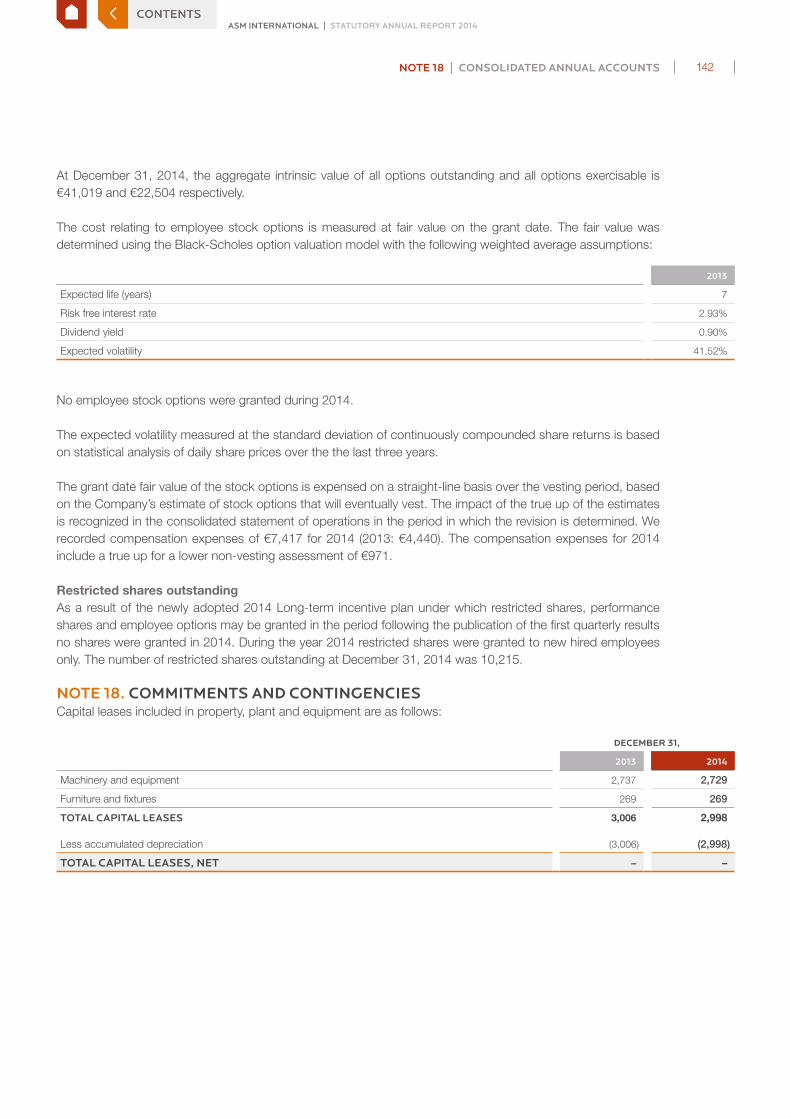
At December 31, 2014, the aggregate intrinsic value of all options outstanding and all options exercisable is €41,019 and €22,504 respectively.
The cost relating to employee stock options is measured at fair value on the grant date. The fair value was determined using the Black-Scholes option valuation model with the following weighted average assumptions:
2013
Expected life (years) 7
Risk free interest rate 2.93%
Dividend yield 0.90%
Expected volatility 41.52%
No employee stock options were granted during 2014.
The expected volatility measured at the standard deviation of continuously compounded share returns is based on statistical analysis of daily share prices over the the last three years.
The grant date fair value of the stock options is expensed on a straight-line basis over the vesting period, based on the Company’s estimate of stock options that will eventually vest. The impact of the true up of the estimates is recognized in the consolidated statement of operations in the period in which the revision is determined. We recorded compensation expenses of €7,417 for 2014 (2013: €4,440). The compensation expenses for 2014 include a true up for a lower non-vesting assessment of €971.
Restricted shares outstandingAs a result of the newly adopted 2014 Long-term incentive plan under which restricted shares, performance shares and employee options may be granted in the period following the publication of the first quarterly results no shares were granted in 2014. During the year 2014 restricted shares were granted to new hired employees only. The number of restricted shares outstanding at December 31, 2014 was 10,215.
NOTE 18. COMMITMENTS AND CONTINGENCIESCapital leases included in property, plant and equipment are as follows:
DECEMBER 31,
2013 2014
Machinery and equipment 2,737 2,729
Furniture and fixtures 269 269
TOTAL CAPITAL LEASES 3,006 2,998
Less accumulated depreciation (3,006) (2,998)
TOTAL CAPITAL LEASES, NET – –
NOTE 18 | CONSOLIDATED ANNUAL ACCOUNTS 142
ASM INTERNATIONAL | STATUTORY ANNUAL REPORT 2014CONTENTS

At December 31, 2014 operating leases having initial or remaining non-cancelable terms in excess of one year are as follows:
2015 5,821
2016 4,398
2017 3,771
2018 2,951
2019 2,370
Years thereafter 2,653
TOTAL 21,964
Aggregate rental expense for operating leases was €5,964 in 2014 (2013: €5,641). Per December 31, 2014 the Company had entered into purchase commitments with suppliers in the amount of €69,720 for purchases within the next 12 months. Commitments for capital expenditures and other commitments per December 31, 2014 were €3,198.
Change of Control TransactionPursuant to our 1997 settlement agreement with Applied Materials, as amended and restated in 1998, if we desire to effect a change of control transaction, as defined in the settlement agreement which generally involves our operations and not our investment in ASMPT, with a competitor of Applied Materials, we must first offer the change of control transaction to Applied Materials on the same terms as we would be willing to accept from that competitor pursuant to a bona fide arm’s-length offer made by that competitor.
NOTE 19. LITIGATION AND ENVIRONMENTAL MATTERSThe Company is a party to various legal proceedings incidental to its business and is subject to a variety of environmental and pollution control laws and regulations. As is the case with other companies in similar industries, the Company faces exposure from actual or potential claims and legal proceedings. Although the ultimate disposition of legal proceedings cannot be predicted with certainty, it is the opinion of the Company’s management that the outcome of any claim which is pending or threatened, either individually or on a combined basis, will not have a material effect on the financial position of the Company, its cash flows and result of operations.
NOTE 20. FINANCIAL INSTRUMENTS AND RISK MANAGEMENT
FINANCIAL INSTRUMENTSFinancial instruments include:
DECEMBER 31,
2013 2014
Financial assets
Cash and cash equivalents 312,437 385,777
Accounts receivable 83,016 81,971
Financial liabilities
Accounts payable 44,837 61,053
The carrying amounts of cash and cash equivalents, accounts receivable and accounts payable equal their fair values because of the short-term nature of these instruments. The fair value of these financial instruments has been determined by the Company using available market information and appropriate valuation methods (level 2 only).
NOTE 19 | CONSOLIDATED ANNUAL ACCOUNTS 143
ASM INTERNATIONAL | STATUTORY ANNUAL REPORT 2014CONTENTS

Gains or losses related to financial instruments are as follows:
2013 2014
Interest income 904 1,583
Interest expense (2,094) (3,272)
Result from foreign currency exchange, net (9,004) 26,439
Addition to allowance for doubtful accounts receivable (377) –
Fair value is the price that would be received to sell an asset pr paid to transfer a liability in an orderly transaction between market participants at the measurement date. ASMI uses the following fair value hierarchy, which prioritizes the inputs to valuation techniques used to measure fair value into three levels and bases the categorization within the hierarchy upon the lowest level of input that is available and significant to the fair value measurement:
> Level 1Quoted prices in active markets that are accessible at the measurement date for identical assets and liabilities.
> Level 2Inputs other than Level 1 that are observable, either directly or indirectly, such as quoted prices for similar assets or liabilities, quoted prices in markets that are not active, or other inputs that are observable or can be corroborated by observable market data for substantially the full term of the assets or liabilities.
> Level 3Unobservable inputs that are supported by little or no market activity and that are significant to the fair value of the assets or liabilities.
There were no transfers between levels during the years ended December 31, 2014 and December 31, 2013.
FINANCIAL RISK FACTORSASMI is exposed to a number of risk factors: market risks (including foreign exchange risk and interest rate risk), credit risk and liquidity risk. The Company may use forward exchange contracts to hedge its foreign exchange risk. The Company does not enter into financial instrument transactions for trading or speculative purposes.
Foreign exchange risk ASMI and its subsidiaries conduct business in a number of foreign countries, with certain transactions denominated in currencies other than the functional currency of the Company (euro) or one of its subsidiaries conducting the business. The purpose of the Company’s foreign currency management is to manage the effect of exchange rate fluctuations on revenues, costs and cash flows and assets and liabilities denominated in selected foreign currencies, in particular denominated in US dollar.
We may use forward exchange contracts to hedge its foreign exchange risk of anticipated sales or purchase transactions in the normal course of business, which occur within the next twelve months, for which the Company has a firm commitment from a customer or to a supplier. The terms of these contracts are consistent with the timing of the transactions being hedged. The hedges related to forecasted transactions are designated and documented at the inception of the hedge as cash flow hedges, and are evaluated for effectiveness quarterly. The effective portion of the gain or loss on these hedges is reported as a component of accumulated other comprehensive loss in Shareholders’ equity, and is reclassified into earnings when the hedged transaction affects earnings.
NOTE 20 | CONSOLIDATED ANNUAL ACCOUNTS 144
ASM INTERNATIONAL | STATUTORY ANNUAL REPORT 2014CONTENTS

Changes in the fair value of derivatives that do not qualify for hedge treatment, as well as the ineffective portion of any hedges, are recognized in earnings. The Company records all derivatives, including forward exchange contracts, on the balance sheet at fair value in other current assets or accrued expenses. If the underlying transaction being hedged fails to occur, or if a portion of any derivative is ineffective, the gain or loss is immediately recognized in earnings under foreign currency exchange gains (losses) in the Consolidated statement of operations. Hedge ineffectiveness was insignificant for the years ended December 31, 2013 and December 31, 2014.
Furthermore, the Company might manage the currency exposure of certain receivables and payables using derivative instruments, such as forward exchange contracts (fair value hedges) and currency swaps, and non-derivative instruments, such as debt borrowings in foreign currencies. The gains or losses on these instruments provide an offset to the gains or losses recorded on receivables and payables denominated in foreign currencies. The derivative instruments are recorded at fair value and changes in fair value are recorded in earnings under foreign currency exchange gains (losses) in the Consolidated statement of operations. Receivables and payables denominated in foreign currencies are recorded at the exchange rate at the balance sheet date and gains and losses as a result of changes in exchange rates are recorded in earnings under foreign currency exchange gains (losses) in the Consolidated statement of operations.
To the extent that exchange rate fluctuations impact the value of the Company’s investments in its foreign subsidiaries, they are not hedged. The cumulative effect of these fluctuations is separately reported in Consolidated shareholders’ equity. Reference is made to Note 16.
Per December 31, 2013 and December 31, 2014 there were no forward exchange contracts outstanding.
For forward exchange contracts, market values based on external quotes from banks have been used to determine the fair value.
The following table analyzes the Company’s sensitivity to a hypothetical 10% strengthening and 10% weakening of the US dollar, Singapore dollar, Hong Kong dollar, Korean won and Japanese yen against the euro as of December 31, 2013 and December 31, 2014. This analysis includes foreign currency denominated monetary items and adjusts their translation at year end for a 10% increase and 10% decrease against the euro. A positive amount indicates an increase in equity. Recognized in equity is the revaluation effect of subsidiaries denominated in US dollar, Singapore dollar, Hong Kong dollar, Korean won and Japanese yen.
IMPACT ON EQUITY
2013 2014
10% increase of US dollar versus euro 7,741 9,381
10% decrease of US dollar versus euro (7,741) (9,381)
10% increase of Singapore dollar versus euro 6,155 7,967
10% decrease of Singapore dollar versus euro (6,155) (7,967)
10% increase of Hong Kong dollar versus euro 94,369 109,211
10% decrease of Hong Kong dollar versus euro (94,369) (109,211)
10% increase of Korean won versus euro 5,855 8,163
10% decrease of Korean won versus euro (5,855) (8,163)
10% increase of Japanese yen versus euro 5,870 6,925
10% decrease of Japanese yen versus euro (5,870) (6,925)
A hypothetical 10% strengthening or 10% weakening of any other currency against the euro as of December 31, 2013 and December 31, 2014 would not result in a material impact on equity. The revaluation effect of subsidiaries denominated in other currencies than euro are recognized in equity.
NOTE 20 | CONSOLIDATED ANNUAL ACCOUNTS 145
ASM INTERNATIONAL | STATUTORY ANNUAL REPORT 2014CONTENTS

The following table analyzes the Company’s sensitivity to a hypothetical 10% strengthening and 10% weakening of the US dollar, Singapore dollar, Hong Kong dollar, Korean won and Japanese yen against the euro at average exchange rates for the years 2013 and 2014. A positive amount indicates an increase in net earnings.
IMPACT ON NET EARNINGS
2013 2014
10% increase of US dollar versus euro 534 520
10% decrease of US dollar versus euro (534) (520)
10% increase of Singapore dollar versus euro 671 1,233
10% decrease of Singapore dollar versus euro (671) (1,233)
10% increase of Hong Kong dollar versus euro 101,025 3,969
10% decrease of Hong Kong dollar versus euro (101,025) (3,969)
10% increase of Korean won versus euro 2,071 1,552
10% decrease of Korean won versus euro (2,071) (1,552)
10% increase of Japanese yen versus euro 553 1,125
10% decrease of Japanese yen versus euro (553) (1,125)
The significant possible impact on net earnings for 2013 denominated in Hong Kong dollar results from the realized and unrealized gain following the sale of the 12% stake in ASMPT. A hypothetical 10% strengthening or 10% weakening of any other currency against the euro as of December 31, 2013 and December 31, 2014 would not result in a material impact on net earnings.
Interest riskWe are not exposed to interest rate risk through our borrowing activities. The Company does not enter into financial instrument transactions for trading or speculative purposes or to manage interest rate exposure. As per December 31, 2014 the Company had no debt.
Credit riskFinancial instruments that potentially subject the Company to concentrations of credit risk consist primarily of cash and cash equivalents, accounts receivable and derivative instruments. These instruments contain a risk of counterparties failing to discharge their obligations. We monitor credit risk and manages credit risk exposure by type of financial instrument by assessing the creditworthiness of counterparties. We do not anticipate nonperformance by counterparties given their high creditworthiness.
The Company’s customers are semiconductor device manufacturers located throughout the world. We perform ongoing credit evaluations of our customers’ financial condition. We take additional measures to mitigate credit risk when considered appropriate by means of down payments, letters of credit. We generally do not require collateral or other security to support financial instruments with credit risk.
Concentrations of credit risk (whether on- or off-balance sheet) that arise from financial instruments exist for groups of customers or counterparties when they have similar economic characteristics that would cause their ability to meet contractual obligations to be similarly affected by changes in economic or other conditions.
The Company derives a significant percentage of its revenue from a small number of large customers. The largest customer accounted for approximately 26.7% of net sales in 2014 (2013: 28.3%) and the ten largest customers accounted for approximately 84.1% of net sales in 2014 (2013: 85.6%). Sales to these large customers also may fluctuate significantly from time to time depending on the timing and level of purchases by these customers. Significant orders from such customers may expose the Company to a concentration of credit risk and difficulties in collecting amounts due, which could harm the Company’s financial results.
NOTE 20 | CONSOLIDATED ANNUAL ACCOUNTS 146
ASM INTERNATIONAL | STATUTORY ANNUAL REPORT 2014CONTENTS

At December 31, 2014 one customer accounted for 20.1% of the outstanding balance in accounts receivable (2012: 28.1%).
We invest our cash and cash equivalents in short-term deposits and derivative instruments with high-rated financial institutions. We only enter into transactions with a limited number of major financial institutions that have high credit ratings and we closely monitor the creditworthiness of our counterparties. Concentration risk is mitigated by limiting the exposure to a single counter party.
The maximum credit exposure is equal to the carrying values of cash and cash equivalent and accounts receivable.
Liquidity riskThe following table summarizes the Company’s contractual obligations as at December 31, 2014 aggregated by type of contractual obligation.
TOTALLESS THAN
1 YEAR 1-3 YEARS 3-5 YEARSMORE THAN
5 YEARS
Operating leases 21,964 5,821 8,169 5,321 2,653
Pension liabilities 5,153 318 714 1,261 2,860
Purchase obligations
Purchase commitments to suppliers 69,720 69,720 – – –
Capital expenditure commitments 3,198 3,198 – – –
Unrecognized tax benefits 1,875 1,875 – – –
TOTAL CONTRACTUAL OBLIGATIONS 101,910 80,932 8,883 6,582 5,513
Total short-term lines of credit amounted to €150,000 at December 31, 2014. The amount outstanding at December 31, 2014 was nil and the undrawn portion totaled €150,000. The standby revolving credit facility of €150,000 with a consortium of banks will be available through December 20, 2018 is secured by a portion of the Company’s shareholding in ASMPT and certain and certain accounts receivable.
For the majority of purchase commitments, the Company has flexible delivery schedules depending on the market conditions, which allows the Company, to a certain extent, to delay delivery beyond originally planned delivery schedules.
NOTE 21. RESEARCH AND DEVELOPMENTResearch and Development consists of the following:
YEAR ENDED DECEMBER 31,
2013 2014
Research and development expenses, net of capitalized development expenses 41,392 50,417
Amortization of capitalized development expenses 9,957 10,893
Research and development grants and credits (1,035) (905)
TOTAL RESEARCH AND DEVELOPMENT EXPENSES 50,314 60,405
Impairment of capitalized development expenses 7,761 893
The impairment of capitalized development expenses are primarily related to development of new hardware for which the customers demand has shifted out in time, and purchased technology which became obsolete.
The Company’s operations in the Netherlands, Germany and the United States receive research and development grants and credits from various sources.
NOTE 21 | CONSOLIDATED ANNUAL ACCOUNTS 147
ASM INTERNATIONAL | STATUTORY ANNUAL REPORT 2014CONTENTS

NOTE 22. RESTRUCTURING EXPENSESIn the fourth quarter of 2012 we started a cost reduction program in our Front-end operation. We have reduced headcount in our manufacturing organization in Singapore and our product management organization in Europe and the US with approximately 100 full time equivalent positions. Related to these actions, an amount of €0.1 million (2013: €2.5 million, 2012: €0.9 million) employee related expenses was recorded.
NOTE 23. INCOME TAXESThe components of earnings (loss) before income taxes and non-controlling interest consist of:
YEAR ENDED DECEMBER 31,
2013 2014
The Netherlands (386,518) 91,466
Other countries 52,914 66,071
EARNINGS (LOSS) BEFORE INCOME TAXES AND NON-CONTROLLING INTEREST (333,604) 157,537
The income tax expense consists of:
YEAR ENDED DECEMBER 31,
2013 2014
Current
The Netherlands (1,938) (4,539)
Other countries (6,773) (9,988)
(8,711) (14,527)
Deferred
Other countries (199) (4,850)
INCOME TAX EXPENSE (8,910) (19,377)
The provisions for income taxes as shown in the Consolidated statements of operations differ from the amounts computed by applying the Dutch statutory income tax rate to earnings before taxes. A reconciliation of the provisions for income taxes and the amounts that would be computed using the Dutch statutory income tax rate is set forth as follows:
YEAR ENDED DECEMBER 31,
2013 2014
Earnings (loss) before income taxes from continuing operations (333,604) 157,537
Dutch statutory income tax rate 25.0% 25.0%
Income tax provision at statutory rate 83,401 (39,384)
Non-deductible expenses (1,957) (4,727)
Foreign taxes at a rate other than the Netherlands statutory rate (422) (1,454)
Valuation allowance (3,347) 15,322
Non-taxable income 1) (88,492) 11,888
Other 2) 1,907 (1,022)
INCOME TAX EXPENSE (8,910) (19,377)1 Non-taxable income for 2014 mainly consist of revenues deriving from the share in income of investments and associates which are exempt under
the Dutch participation exemption. For 2013 non-taxable income mainly consist of revenues deriving from the disposal of the 12% shareholding in ASMPT in March 2013 which are exempt under the Dutch participation exemption.
2 Other in 2014 mainly consists of tax credits, adjustments to prior years, changes in (enacted) tax laws and revaluation of certain assets.
NOTE 22 | CONSOLIDATED ANNUAL ACCOUNTS 148
ASM INTERNATIONAL | STATUTORY ANNUAL REPORT 2014CONTENTS

Included in other for 2014 is €1,944 regarding the Company’s manufacturing operations in Singapore and other countries where income covering certain products is non-taxable or subject to concessional tax rates under tax incentive schemes granted by the local tax authority. The majority of these tax incentive schemes have terms ending by July 1, 2018.
On June 8, 2009 the Singapore Economic Development Board (‘EDB’) granted a Pioneer Certificate to ASM Front-end Manufacturing Singapore Pte Ltd (‘FEMS’), a principal subsidiary of the Group, to the effect that profits arising from certain manufacturing activities by FEMS of Front-end equipment will in principle be exempted from tax for a period of 10 years effective from July 1, 2008, subject to fulfillment of certain criteria during the period.
In Korea a High Technology Tax Exemption has been granted to the effect that profits arising from certain equipment sales will in principle be partly exempted from tax in the period ending by 2016, subject to fulfillment of certain criteria during the period.
Since 2011 the Dutch statutory tax rate amounted to 25.0%. Taxation for other jurisdictions is calculated at the rates prevailing in the relevant jurisdictions. The Company’s deferred tax assets and liabilities have been determined in accordance with these statutory income tax rates.
Deferred income taxes consist of the following:
JANUARY 1,
2013
DECON-SOLIDATION
ASMPTRECLASSI-FICATIONS
CHANGES IN TAX RATES
CONSOLIDATED STATEMENT OF
OPERATIONS EQUITY
EXCHANGE DIFFER-
ENCESDECEMBER 31,
2013
Deferred tax assets
Reserves and allowances 18,384 (13,276) (341) (258) (473) 71 (1,137) 2,970
Net operating losses 83,478 (11,905) (1,664) – – – 50 69,959
Depreciation 2,260 (2,121) 1,336 (88) 266 – (319) 1,334
Other 769 150 – (37) (146) – (164) 572
GROSS DEFERRED TAX ASSETS 104,891 (27,152) (669) (383) (353) 71 (1,570) 74,835
Less: valuation allowance (83,250) 11,675 1,664 – – – (49) (69,960)
NET DEFERRED TAX ASSETS 21,641 (15,477) 995 (383) (353) 71 (1,619) 4,875
Deferred tax liabilities
Capitalized development expenses (10,850) – – 792 (218) – 2,221 (8,055)
Other (1,085) 921 74 – (37) – (6) (133)
DEFERRED TAX LIABILITIES (11,935) 921 74 792 (255) – 2,215 (8,188)
NET DEFERRED INCOME TAXES 9,706 (14,556) 1,069 409 (608) 71 596 (3,313)
NOTE 23 | CONSOLIDATED ANNUAL ACCOUNTS 149
ASM INTERNATIONAL | STATUTORY ANNUAL REPORT 2014CONTENTS

JANUARY 1,
2014REALIZA-
TION
CHANGE IN TAX
RATE
CONSOLIDATED STATEMENT OF
OPERATIONS EQUITY
EXCHANGE DIFFER-
ENCESDECEMBER 31,
2014
Deferred tax assets
Reserves and allowances 2,970 – (134) (849) 45 77 2,109
Net operating losses 69,959 – – (15,322) – 769 55,406
Depreciation 1,334 – (87) (657) – 37 627
Other 572 1,102 (15) (1,338) – 161 482
GROSS DEFERRED TAX ASSETS 74,835 1,102 (236) (18,166) 45 1,044 58,624
Less: valuation allowance (69,960) – – 15,322 – (769) (55,407)
NET DEFERRED TAX ASSETS 4,875 1,102 (236) (2,844) 45 275 3,217
Deferred tax liabilities
Capitalized development expenses (8,055) – 206 (1,968) – 8 (9,809)
Other (133) – – (8) – (2) (143)
DEFERRED TAX LIABILITIES (8,188) – 206 (1,976) – 6 (9,952)
NET DEFERRED INCOME TAXES (3,313) 1,102 (30) (4,820) 45 281 (6,735)
Deferred tax assets and liabilities are classified in the consolidated balance sheet as follows:
DECEMBER 31,
2013 2014
Deferred tax assets - non-current 4,875 3,217
Deferred tax liabilities - non-current (8,187) (9,952)
(3,313) (6,735)
Based on tax filings, ASMI and its individual subsidiaries have net operating losses available at December 31, 2014 of €210,461 for tax return purposes to reduce future income taxes, mainly in Europe. The Company believes that realization of its net deferred tax assets is dependent on the ability of the Company to generate taxable income in the future. Given the volatile nature of the semiconductor equipment industry, past experience, and the tax jurisdictions where the Company has net operating losses, the Company believes that there is currently insufficient evidence to substantiate recognition of substantially all net deferred tax assets with respect to net operating losses. Accordingly, a valuation allowance of €69,960 in 2013 and €55,407 in 2014 has been recorded.
NOTE 23 | CONSOLIDATED ANNUAL ACCOUNTS 150
ASM INTERNATIONAL | STATUTORY ANNUAL REPORT 2014CONTENTS

The amounts and expiration dates of net operating losses for tax purposes are as follows:
EXPIRATION YEARTOTAL OF NET OPERATING
LOSSES FOR TAX PURPOSES 1)
2017 29,270
2018 44,664
2019 35,905
2020 266
2021 60,198
2022 28,556
2023 16
2029 7,178
2030 4,293
Unlimited 115
TOTAL 210,461
1 No deferred tax assets were recognized for these operating losses.
The Company has not provided for deferred foreign withholding taxes, if any, on undistributed earnings of its foreign subsidiaries. At December 31, 2014 the undistributed earnings of subsidiaries, subject to withholding taxes, were approximately €39,961. These earnings could become subject to foreign (withholding) taxes if they were remitted as dividends and / or if the Company should sell its interest in the subsidiaries.
The calculation of the Company’s tax liabilities involves dealing with uncertainties in the application of complex tax laws. The Company’s estimate for the potential outcome of any uncertain tax issue is highly judgmental. Tax contingencies mainly relate to transfer pricing positions, operational activities in countries where the Company is not tax registered and tax deductible costs. The Company provides for these tax contingencies for the duration of the statute of limitation period, which differs per tax jurisdiction. Per December 31, 2014 tax contingencies amounted to €1,875 (2013: nil) and are included in income taxes payable in the Consolidated Statement of Financial Position. Settlement of tax uncertainties in a manner inconsistent with the Company’s expectations could have a material impact on the Company’s financial position, net earnings and cash flows.
A summary of open tax years by major jurisdiction is as follows:
JURISDICTION
Japan 2009-2014
The Netherlands 2010-2014
Singapore 2010-2014
United States 1997-2014
South Korea 2009-2014
The calculation of the Company’s tax liabilities involves dealing with uncertainties in the application of complex tax laws. The Company’s estimate for the potential outcome of any unrecognized tax benefits is highly judgmental. Settlement of unrecognized tax benefits in a manner inconsistent with the Company’s expectations could have a material impact on the Company’s financial position, net earnings and cash flows. The Company is subject to tax audits in its major tax jurisdictions, local tax authorities may challenge the positions taken by the Company.
NOTE 23 | CONSOLIDATED ANNUAL ACCOUNTS 151
ASM INTERNATIONAL | STATUTORY ANNUAL REPORT 2014CONTENTS

NOTE 24. DISCLOSURES ABOUT SEGMENTS AND RELATED INFORMATIONThe Company organizes its activities in two operating segments, Front-end and Back-end. Operating segments are reported in a manner consistent with the internal reporting provided to the Chief Executive Officer (‘CEO’), which is the chief operating decision maker.
The Front-end segment manufactures and sells equipment used in wafer processing, encompassing the fabrication steps in which silicon wafers are layered with semiconductor devices. The segment is a product driven organizational unit comprised of manufacturing, service, and sales operations in Europe, the United States, Japan, South Korea and Southeast Asia.
The Back-end segment manufactures and sells equipment and materials used in assembly and packaging, encompassing the processes in which silicon wafers are separated into individual circuits and subsequently assembled, packaged and tested. The segment is organized in ASM Pacific Technology Ltd, in which the Company holds a substantial share of 39.75% interest, whilst the remaining shares are listed on the Stock Exchange of Hong Kong. The segment’s main operations are located in Hong Kong, the People’s Republic of China, Singapore, Malaysia and Germany.
The Back-end segment remains reported as a separate segment since the cease of control per March 15, 2013. Since that date the segment is reported as an equity method investment as the CEO reviews this information as part of his CODM package.
Accordingly, the asset and profit/loss information regarding the operations that comprise the segment are disclosed. The full financial results are reviewed by the CODM, the external reporting of the segment are on an equity method investment basis. The total of all segments’ financial amounts are reconciled to the corresponding amounts reported in the consolidated financial statements, eliminations are reflected in the reconciling column for amounts reported in excess of those amounts reflected in the consolidated financial statements.
Segment performance is evaluated by the Company’s management based on US GAAP net earnings or loss which in certain respect is measured differently from net income or loss reported by the Company in its consolidated financial statements, which are based on IFRS, as adopted by the EU. For a reconciliation between IFRS and US GAAP see Note 31.
NOTE 24 | CONSOLIDATED ANNUAL ACCOUNTS 152
ASM INTERNATIONAL | STATUTORY ANNUAL REPORT 2014CONTENTS

YEAR ENDED DECEMBER 31, 2013
FRONT-ENDBACK-END
100%DECONSOLIDATED
AND DISCONTINUED
RECONCILIATION FROM US GAAP
TO IFRS TOTAL
Net sales to unaffiliated customers 451,991 1,051,376 (1,051,376) 451,991
Gross profit 176,160 307,618 (307,618) (8) 176,152
Result from operations 44,704 66,352 (66,352) 217 44,921
Interest income 904 272 (272) – 904
Interest expense (2,553) (2,082) 2,082 459 (2,094)
Foreign currency exchange gains (losses), net (9,004) 847 (847) – (9,004)
Result from investments – – (377,863) 9,532 (368,331)
Income tax expense (9,484) (11,308) 11,308 574 (8,910)
Net earnings discontinued operations – – 1,402,596 1,402,596
Net earnings (loss) 24,565 54,081 970,654 10,782 1,060,082
Allocation of net earnings (loss)
Shareholders of the parent 1,062,675
Non-controlling interest (2,593)
Capital expenditures and purchase of intangible assets 11,072 34,003 (34,003) (21,848) (10,776)
Depreciation and amortization 19,415 41,066 (41,066) 10,416 29,831
Cash and cash equivalents 312,437 149,313 (149,313) – 312,437
Capitalized goodwill 11,421 – – (949) 10,472
Other intangible assets 5,637 902 (902) 55,592 61,229
Investments and associates 278 – 943,675 – 943,953
Other identifiable assets 277,800 599,709 (599,709) 1,201 279,001
Total assets 607,573 749,924 193,752 56,114 1,607,363
Total debt – 65,105 (65,105) – –
Headcount in full-time equivalents 1) 1,503 14,400 (14,400) – 1,503
1 Headcount includes those employees with a fixed contract, and is exclusive of temporary workers.
NOTE 24 | CONSOLIDATED ANNUAL ACCOUNTS 153
ASM INTERNATIONAL | STATUTORY ANNUAL REPORT 2014CONTENTS

YEAR ENDED DECEMBER 31, 2014
FRONT-ENDBACK-END
100% DISCONTINUED
RECONCILIATION FROM US GAAP
TO IFRS TOTAL
Net sales to unaffiliated customers 545,604 1,386,776 (1,386,776) – 545,604
Gross profit 234,999 492,137 (492,137) 279 235,278
Result from operations 90,535 209,439 (209,439) 2,839 93,374
Interest income 1,583 – – – 1,583
Interest expense (2,312) (11,745) 11,745 (960) (3,272)
Foreign currency exchange gains (losses), net 26,439 – – – 26,439
Result on investments and associates (278) – 38,910 781 39,413
Income tax expense (17,569) (43,728) 43,728 (1,808) (19,377)
Net earnings discontinued operations – – – 3,157 3,157
Net earnings (loss) 98,398 153,966 (115,056) 4,009 141,317
Capital expenditures and purchase of intangible assets 39,678 30,992 (30,992) 14,346 54,024
Depreciation and amortization 21,222 40,416 (40,416) 11,786 33,008
Cash and cash equivalents 385,777 275,431 (275,431) – 385,777
Capitalized goodwill 12,104 43,076 (43,076) (949) 11,155
Other intangible assets 3,960 66,617 (66,617) 61,254 65,214
Investments and associates – – 1,092,097 851 1,092,948
Other identifiable assets 332,995 755,106 (755,106) 1,081 334,076
Total assets 734,836 1,140,230 (48,133) 62,237 1,889,170
Total debt – 247,608 (247,608) – –
Headcount in full-time equivalents 1) 1,635 15,946 (15,946) – 1,635
1 Headcount includes those employees with a fixed contract, and is exclusive of temporary workers.
There are no inter-segment transactions, other than charges for management services, which are based on actual cost. The accounting policies used to measure the net earnings and total assets in each segment are consistent to those used in the Consolidated financial statements. The measurement methods used to determine reported segment earnings are consistently applied for all periods presented. There were no asymmetrical allocations to segments.
Geographical information is summarized as follows:
EUROPE
UNITED STATES OF
AMERICA JAPANSOUTH KOREA TAIWAN
OTHER ASIA CORPORATE CONSOLIDATED
Year ended December 31, 2013
Net sales 73,110 131,209 33,772 110,559 78,204 25,137 – 451,991
Long-lived assets 2,871 24,429 15,112 3,868 63 10,144 44 56,531
Year ended December 31, 2014
Net sales 94,518 177,006 62,482 93,595 81,143 36,860 – 545,604
Long-lived assets 6,762 33,881 15,598 11,667 51 11,253 24 79,236
Long-lived assets for the years ended December 31, 2012, 2013 and 2014 consist of the Company’s property, plant and equipment.
For geographical reporting, net sales are attributed to the geographic location in which the customer’s facilities are located.
NOTE 24 | CONSOLIDATED ANNUAL ACCOUNTS 154
ASM INTERNATIONAL | STATUTORY ANNUAL REPORT 2014CONTENTS

NOTE 25. SELECTED OPERATING EXPENSES AND ADDITIONAL INFORMATIONPersonnel expenses for employees were as follows:
DECEMBER 31,
2013 2014
Wages and salaries 88,711 96,468
Social security 8,847 11,342
Pension expenses 3,844 4,162
101,402 111,972
The average number of employees, exclusive of temporary workers, by geographic area during the year was as follows:
YEAR AVERAGE
2013 2014
The Netherlands 155 138
Other European countries 166 167
United States 527 569
Southeast Asia 537 504
Japan 175 180
1,560 1,558
NOTE 26. EARNINGS PER SHAREBasic net earnings per common share is calculated by dividing net income attributable to common shareholders by the weighted average number of common shares outstanding for that period. The dilutive effect is calculated using the treasury stock method. The calculation of diluted net income per share assumes the exercise of options issued under our stock option plans (and the issuance of shares under our share plans) for periods in which exercised (or issuances) would have a dilutive effect. The calculation of diluted net income per share does not assume exercise of options (or issuance of shares) when such exercises (or issuances) would be anti-dilutive.
The calculation of basic and diluted net income per share attributable to common shareholders is based on the following data:
DECEMBER 31,
2013 2014
Net income used for purposes of calculating net income per common share
Net income (loss) from continuing operations (342,514) 138,160
Net income from discontinued operations (see note 3) 1,405,189 3,157
NET INCOME FROM OPERATIONS 1,062,675 141,317
Basic weighted average number of shares outstanding during the year (thousands) 63,202 63,510
Effect of dilutive potential common shares from stock options 994 699
DILUTIVE WEIGHTED AVERAGE NUMBER OF SHARES OUTSTANDING 64,196 64,209
Basic net income (loss) per share
from continuing operations (5.42) 2.18
from discontinued operations 22.23 0.05
from operations 16.81 2.23
Diluted net income (loss) per share
from continuing operations (5.34) 2.15
from discontinued operations 21.89 0.05
from operations 16.55 2.20
NOTE 25 | CONSOLIDATED ANNUAL ACCOUNTS 155
ASM INTERNATIONAL | STATUTORY ANNUAL REPORT 2014CONTENTS

NOTE 27. BOARD REMUNERATIONThe remuneration of members of the Management Board has been determined by the Supervisory Board.
During 2014, the Company considered the members of the Management Board and the Supervisory Board to be the key management personnel. Total remuneration for key management personnel in 2014 amounts to €3,524 (2013: €3,013).
In 2014, the Annual General Meeting of shareholders approved the revision of the Remuneration Policy for the Management Board proposed by the Supervisory Board.
The following table sets forth as to all current members of the Management Board of the Company, information concerning all remuneration from the Company (including its subsidiaries) for services in all capacities:
BASE COMPENSATION 1) BONUSES PENSIONS
SHARE BASED PAYMENT
EXPENSES 2)FRINGE
BENEFITS TOTAL
Management Board
C.D. del Prado
2014 520 663 78 762 60 2,083
2013 520 527 92 506 60 1,705
2012 510 177 76 398 59 1,220
P.A.M. van Bommel
2014 386 412 69 528 46 1,441
2013 375 391 79 418 45 1,308
2012 367 144 88 325 59 983
1 An incidental crisis levy of 16% as imposed by the Dutch government amounted to €145 for 2013 and €175 for 2012. This crisis tax levy is payable by the employer and is charged over income of employees exceeding a €150 threshold for both years. These expenses do not form part of the remuneration costs mentioned.
2 These amounts represent the vesting expenses related to the financial year.
Short-term incentive (cash bonus)Each year, a short-term incentive can be earned, based on achievement of specific challenging targets. These targets are for 75% based on company financial targets and for 25% based on non-financial targets. The on-target bonus percentage for the CEO is 100% of base salary, with a maximum pay-out of 150% of base salary. The on-target bonus percentage for the other members of the Management Board is 75% of base salary, with a maximum pay-out of 125% of base salary.
Long-term incentive (stock options/performance shares)The members of the Management Board are eligible to receive stock options and performance shares under the ASM International NV 2014 Long-term incentive plan for members of the Management Board (‘plan’) in order to focus on the long term interest of the company. Stock options vest after three years subject to continued employment and expire after seven years. Performance shares vest after 3 years subject to meeting certain conditions. The members of the Management Board are required to hold the vested performance shares for an additional two years, however, they are allowed to sell a part of the unconditional shares after three years for tax purposes. The next grant of stock options and restricted shares will take place in April 2015.
Pension arrangementThe members of the Management Board are offered participation of the pension plan of the industry wide pension fund (‘Pensioenfonds van de Metalektro’) for the base salary up to the predetermined ceiling. For the base salary above the ceiling, the members of the Management Board are offered participation of a defined
NOTE 27 | CONSOLIDATED ANNUAL ACCOUNTS 156
ASM INTERNATIONAL | STATUTORY ANNUAL REPORT 2014CONTENTS

contribution plan, insured by Nationale Nederlanden. Due to the changes in Dutch pension legislation, the pension arrangement for members of the Management Board will change in 2015.
Fringe benefitsFringe benefits are covering compensation relative to use of a (company) car, a representation and expense allowance, social security premium and premium for health and disability insurance.
Outstanding optionsThe following table shows the outstanding options to purchase ASM International NV common shares held by current members of the Management Board, and changes in such holdings during 2014:
YEAR OF
GRANTOUTSTANDING
JANUARY 1, 2014GRANTED
IN 2014EXERCISED
IN 2014OUTSTANDING
DECEMBER 31, 2014EXERCISE
PRICE END DATE
C.D. del Prado 1) 2007 23,168 – – 23,168 € 16.51 May 23, 2015
C.D. del Prado 1) 2008 147,416 – – 147,416 € 10.78 Mar 1, 2016
C.D. del Prado 2) 2009 58,967 – – 58,967 € 12.79 Nov 30, 2017
C.D. del Prado 3) 2011 88,450 – – 88,450 € 18.93 Dec 31, 2018
C.D. del Prado 3) 2012 70,760 – – 70,760 € 22.93 Dec 31, 2019
C.D. del Prado 3) 2013 75,000 – – 75,000 € 23.73 Dec 31, 2020
P.A.M. van Bommel 2) 2010 29,483 – – 29,483 € 13.80 July 1, 2017
P.A.M. van Bommel 3) 2011 62,504 – – 62,504 € 18.93 Dec 31, 2018
P.A.M. van Bommel 3) 2012 47,173 – – 47,173 € 22.93 Dec 31, 2019
P.A.M. van Bommel 3) 2013 53,000 – – 53,000 € 23.73 Dec 31, 2020
655,921 – – 655,9211 The vesting of these options was conditional. A percentage, not exceeding 150%, of the options which have been granted conditionally will become
unconditional after three years, based on the total return of the Company’s shares for the three years after the options are granted compared to the average total return of the shares of a relevant number of companies which are similar to the Company during the same three-year period. The options are granted for a term of eight years.
2 These options are granted for a term of eight years, and become exercisable after a three years vesting period.3 These options are granted for a term of seven years and become exercisable after a three years vesting period.
The fair value per option of options granted to current members of the Management Board was €10.22 in 2013.
In 2013, no options to purchase ASM International NV common shares were exercised and as no new shares were issued for the exercise of these options.
The following table sets forth as to all current and former members of the Supervisory Board of the Company information concerning all remuneration (base compensation, no bonuses or pensions were paid) from the Company (including its subsidiaries) for services in all capacities:
YEAR ENDED DECEMBER 31,
2013 2014
Supervisory Board
J.C. Lobbezoo 61 70
J.M.R. Danneels 50 50
H.W. Kreutzer 51 53
M.C.J. van Pernis 51 53
U.H.R. Schumacher 50 50
G.J. Kramer 1) 25 –
288 2761 For the period January 1 through May 16, 2013.
NOTE 27 | CONSOLIDATED ANNUAL ACCOUNTS 157
ASM INTERNATIONAL | STATUTORY ANNUAL REPORT 2014CONTENTS
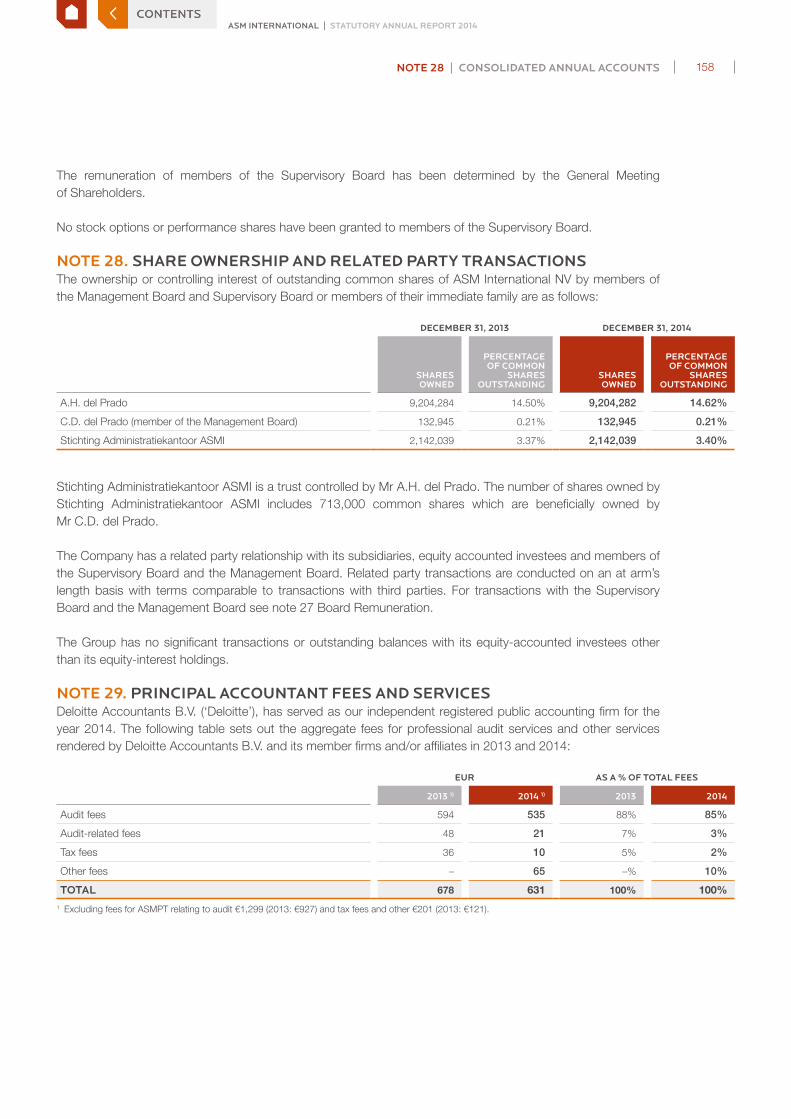
The remuneration of members of the Supervisory Board has been determined by the General Meeting of Shareholders.
No stock options or performance shares have been granted to members of the Supervisory Board.
NOTE 28. SHARE OWNERSHIP AND RELATED PARTY TRANSACTIONSThe ownership or controlling interest of outstanding common shares of ASM International NV by members of the Management Board and Supervisory Board or members of their immediate family are as follows:
DECEMBER 31, 2013 DECEMBER 31, 2014
SHARES OWNED
PERCENTAGEOF COMMON
SHARES OUTSTANDING
SHARES OWNED
PERCENTAGEOF COMMON
SHARES OUTSTANDING
A.H. del Prado 9,204,284 14.50% 9,204,282 14.62%
C.D. del Prado (member of the Management Board) 132,945 0.21% 132,945 0.21%
Stichting Administratiekantoor ASMI 2,142,039 3.37% 2,142,039 3.40%
Stichting Administratiekantoor ASMI is a trust controlled by Mr A.H. del Prado. The number of shares owned by Stichting Administratiekantoor ASMI includes 713,000 common shares which are beneficially owned by Mr C.D. del Prado.
The Company has a related party relationship with its subsidiaries, equity accounted investees and members of the Supervisory Board and the Management Board. Related party transactions are conducted on an at arm’s length basis with terms comparable to transactions with third parties. For transactions with the Supervisory Board and the Management Board see note 27 Board Remuneration.
The Group has no significant transactions or outstanding balances with its equity-accounted investees other than its equity-interest holdings.
NOTE 29. PRINCIPAL ACCOUNTANT FEES AND SERVICESDeloitte Accountants B.V. (‘Deloitte’), has served as our independent registered public accounting firm for the year 2014. The following table sets out the aggregate fees for professional audit services and other services rendered by Deloitte Accountants B.V. and its member firms and/or affiliates in 2013 and 2014:
EUR AS A % OF TOTAL FEES
2013 1) 2014 1) 2013 2014
Audit fees 594 535 88% 85%
Audit-related fees 48 21 7% 3%
Tax fees 36 10 5% 2%
Other fees – 65 –% 10%
TOTAL 678 631 100% 100%1 Excluding fees for ASMPT relating to audit €1,299 (2013: €927) and tax fees and other €201 (2013: €121).
NOTE 28 | CONSOLIDATED ANNUAL ACCOUNTS 158
ASM INTERNATIONAL | STATUTORY ANNUAL REPORT 2014CONTENTS

AUDIT COMMITTEE PRE-APPROVAL POLICIESThe Audit Committee has determined that the provision of services by Deloitte described in the preceding paragraphs is compatible with maintaining Deloitte’s independence. All audit and permitted non-audit services provided by Deloitte during 2014 were pre-approved by the Audit Committee.
The Audit Committee has adopted the following policies and procedures for pre-approval of all audit and permitted non-audit services provided by our independent registered public accounting firm:
Audit servicesManagement submits to the Audit Committee for pre-approval the scope and estimated fees for specific services directly related to performing the independent audit of our Consolidated financial statements for the current year.
Audit-related servicesThe Audit Committee may pre-approve expenditures up to a specified amount for services included in identified service categories that are related extensions of audit services and are logically performed by the auditors. Additional services exceeding the specified pre-approved limits require specific Audit Committee approval.
Tax servicesThe Audit Committee may pre-approve expenditures up to a specified amount per engagement and in total for identified services related to tax matters. Additional services exceeding the specified pre-approved limits, or involving service types not included in the pre-approved list, require specific Audit Committee approval.
Other servicesIn the case of specified services for which utilizing our independent registered public accounting firm creates efficiencies, minimizes disruption, or preserves confidentiality, or for which management has determined that our independent registered public accounting firm possesses unique or superior qualifications to provide such services, the Audit Committee may pre-approve expenditures up to a specified amount per engagement and in total. Additional services exceeding the specified pre-approved limits, or involving service types not included in the pre-approved list, require specific Audit Committee approval.
NOTE 30. SUBSEQUENT EVENTSSubsequent events were evaluated up to April 9, 2015, which is the issuance date of this Annual Report 2014. There are no subsequent events to report.
NOTE 30 | CONSOLIDATED ANNUAL ACCOUNTS 159
ASM INTERNATIONAL | STATUTORY ANNUAL REPORT 2014CONTENTS

NOTE 31. RECONCILIATION OF IFRS TO US GAAPSince ASMI’s initial listing on Nasdaq, ASMI has followed accounting principles generally accepted in the United States of America (‘US GAAP’), both for internal as well as external purposes.
ASMI’s annual report on Form 20-F, which is based on US GAAP, may contain additional information next to its Statutory annual report. The Annual report on Form 20-F, the US GAAP quarterly press releases, the Statutory interim report and the Statutory annual report are available on the Company’s website (www.asm.com). For the periods presented in this Statutory annual report, the main differences between IFRS and US GAAP for ASMI relate to the following:
YEAR ENDED DECEMBER 31,
2013 2014
Net earnings allocated to the parent of the Company in accordance with IFRS 1,062,675 141,317
Goodwill (9,532) (3,157)
Inventory obsolescence 8 (233)
GAAP differences investments – (781)
Debt issuance fees (459) 960
Development expenditures (799) (798)
NET EARNINGS ALLOCATED TO THE PARENT OF THE COMPANY IN ACCORDANCE WITH US GAAP 1,051,893 137,308
DECEMBER 31,
2013 2014
Shareholders' equity in accordance with IFRS 1,495,641 1,742,906
Goodwill 949 949
Inventory obsolescence (1,834) (2,324)
GAAP differences investments – (851)
Pension plans (246) (271)
Debt issuance fees 276 1,236
Development expenditures (47,537) (51,445)
SHAREHOLDERS' EQUITY BIN ACCORDANCE WITH US GAAP 1,447,249 1,690,200
GoodwillIFRS 1 First time adoption of IFRS includes a transition option to apply IFRS 3 prospectively from the transition date (January 1, 2004). ASMI has elected to apply this option and accordingly, all accounting under Dutch GAAP for business combinations prior to January 1, 2004 is fixed at the transition date and the corresponding value of goodwill is fixed as well. As a result of amortization of goodwill under Dutch GAAP prior to January 1, 2004, the value of goodwill under IFRS as of January 1, 2004 is lower when compared to the value of goodwill under US GAAP as of January 1, 2004. Since the difference relates to non-euro denominated acquisitions, this difference will fluctuate over time with currency rate fluctuations. In addition, IFRS requires the inclusion of contingent consideration in the cost of acquisition if it is probable and can be estimated reliably, while under US GAAP, contingent consideration is generally excluded from the cost of acquisition until the contingency is resolved. As a result of the sale of the 12% share in ASMPT the difference in goodwill between US GAAP and IFRS was released.
Inventory obsolescenceUnder US GAAP a write-down of inventory to market is not reversed for subsequent recoveries in value. IAS 2 requires a reversal of the write-down if the net realizable value of an item subsequently increases.
NOTE 31 | CONSOLIDATED ANNUAL ACCOUNTS 160
ASM INTERNATIONAL | STATUTORY ANNUAL REPORT 2014CONTENTS

GAAP differences investmentsUnder US GAAP, the elimination of unrealized net income from intercompany transactions that are eliminated from the carrying amount of assets in consolidation give rise to a temporary difference for which prepaid taxes must be recognized in consolidation. Under US GAAP the prepaid taxes are calculated based on the tax rate applicable in the sellers’ jurisdiction. Contrary to US GAAP, the deferred taxes under IFRS are calculated based on the tax rate applicable in the purchaser’s tax jurisdiction.
Debt issuance feesUnder US GAAP debt issuance fees related to a credit facility are capitalized and amortized during the economic life of the facility. Under IFRS such debt issuance fees are recognized as expenses when incurred.
Development expendituresIAS 38 Intangible assets requires capitalization of development expenses if, and only if, an entity can demonstrate all of the following: › the technical feasibility of completing the intangible asset so that it will be available for use or sale; › its intention to complete the intangible asset and use or sell it; › its ability to use or sell the intangible asset; › how the intangible asset will generate probable future economic benefits; › the availability of adequate technical, financial and other resources to complete the development and to use or sell the intangible asset; and › its ability to measure the expenditure attributable to the intangible asset during its development reliably.
From 2005 onwards ASMI capitalizes development expenses that meet the above-mentioned criteria in its Consolidated financial statements prepared in accordance with IFRS. US GAAP prohibits capitalization of research and development costs.
Pension plansUnder US GAAP, ASMI applies ASC 715, Employers’ accounting for defined benefit pension and other post retirement plans – an amendment of SFAS No. 87, 88, 106, and 132(R). Accordingly, the Company recognizes in its Consolidated balance sheet an asset or a liability for the plan’s overfunded status or underfunded status respectively. IAS 19 Employee benefits does not require recognition of a plan’s overfunded status or underfunded status. In accordance with IAS 19R, the Company recognizes a plan’s net assets or liabilities, taking into account unrecognized actuarial losses and transition amounts.
SIGNINGAlmereApril 9, 2015
Supervisory BoardJ.C. LobbezooJ.M.R. DanneelsH.W. KreutzerM.C.J. van PernisU.H.R. Schumacher
Management BoardC.D. del PradoP.A.M. van Bommel
NOTE 31 | CONSOLIDATED ANNUAL ACCOUNTS 161
ASM INTERNATIONAL | STATUTORY ANNUAL REPORT 2014CONTENTS

ANNUAL ACCOUNTS ASM INTERNATIONAL NVBALANCE SHEETS ASM INTERNATIONAL NV(after proposed appropriation of net earnings for the year)
DECEMBER 31,
(EUR thousand except per share data) NOTES 2013 2014
Assets
Cash and cash equivalents 201,792 180,655
Accounts receivable, net – 16
Amounts due from subsidiaries 84,682 91,577
Other current assets 2,949 5,689
TOTAL CURRENT ASSETS 289,423 277,937
Property, plant and equipment, net 5 43 23
Goodwill, net 4 2,612 2,612
Other intangible assets, net 3 5,296 2,602
Investments in subsidiaries 2 1,214,110 1,476,465
Other investments 278 –
Loan advances due from investments 2 1,640 2,033
Assets classified as held for sale 277 277
TOTAL NON-CURRENT ASSETS 1,224,256 1,484,012
TOTAL ASSETS 1,513,679 1,761,949
Liabilities and shareholders’ equity
Amounts due to subsidiaries 720 423
Accrued expenses and other 17,180 18,474
Taxes and social securities 138 146
TOTAL CURRENT LIABILITIES 18,038 19,043
Common shares
Common shares: Authorized 110,000,000 shares, par value €0.04, issued and outstanding 63,468,390 and 62,968,184 shares 2,539 2,553
Capital in excess of par value 203,945 216,322
Treasury shares – (27,733)
Accumulated net earnings 375,469 388,109
Legal reserves 6 973,804 1,109,000
Accumulated other comprehensive income/(loss) (60,116) 54,655
TOTAL SHAREHOLDERS' EQUITY 6 1,495,641 1,742,906
TOTAL LIABILITIES AND SHAREHOLDERS’ EQUITY 1,513,679 1,761,949
See Notes to Financial statements ASM international NV.
Annual Accounts
ANNUAL ACCOUNTS 162
ASM INTERNATIONAL | STATUTORY ANNUAL REPORT 2014CONTENTS

ABBREVIATED COMPANY STATEMENT OF PROFIT OR LOSS
YEAR ENDED DECEMBER 31,
(EUR thousand) 2013 2014
Net earnings of subsidiaries 1,085,648 132,843
Net earnings from holding activities (22,973) 8,474
TOTAL NET EARNINGS 1,062,675 141,317
See Notes to Financial statements ASM international NV.
ANNUAL ACCOUNTS 163
ASM INTERNATIONAL | STATUTORY ANNUAL REPORT 2014CONTENTS

NOTES TO FINANCIAL STATEMENTS ASM INTERNATIONAL NVAmounts in euro thousand, unless otherwise stated.
NOTE 1. SUMMARY OF SIGNIFICANT ACCOUNTING POLICIESSignificant Accounting Policies - For establishing the principles for the recognition and measurement of assets and liabilities and determination of the result for its Company annual accounts, ASMI makes use of the option provided in Section 362, Part 9, of Book 2 of the Dutch Civil Code. This means that the principles for the recognition and measurement of assets and liabilities and determination of the result (hereinafter referred to as principles for recognition and measurement) of the Company Financial statements of are the same as those applied for the Consolidated annual accounts (see Note 1 of the Consolidated annual accounts). The Consolidated annual accounts are prepared in accordance with International Financial Reporting Standards as adopted by the European Union.
Investments in subsidiaries are stated at net asset value as we effectively exercise significant influence over the operational and financial activities of these investments. The net asset value is determined on the basis of the IFRS accounting principles applied by ASMI.
NOTE 2. INVESTMENTS AND LOAN ADVANCES DUE FROM INVESTMENTS
INVESTMENTS
LOAN ADVANCES DUE FROM
INVESTMENTS TOTAL
BALANCE JANUARY 1, 2013 471,815 168,289 640,104
Capital investments 140,325 (140,201) 124
Net result of subsidiaries 1,085,649 – 1,085,649
Dividend received (424,431) – (424,431)
Issuance of loans – (20,274) (20,274)
Foreign currency translation effect (59,248) (6,174) (65,422)
BALANCE DECEMBER 31, 2013 1,214,110 1,640 1,215,750
Net result of subsidiaries 132,843 – 132,843
Other comprehensive income investments (2,179) – (2,179)
Dividend received (19,974) – (19,974)
Issuance of loans – 241 241
Foreign currency translation effect 151,665 152 151,817
BALANCE DECEMBER 31, 2014 1,476,465 2,033 1,478,498
NOTE 1 | ANNUAL ACCOUNTS 164
ASM INTERNATIONAL | STATUTORY ANNUAL REPORT 2014CONTENTS
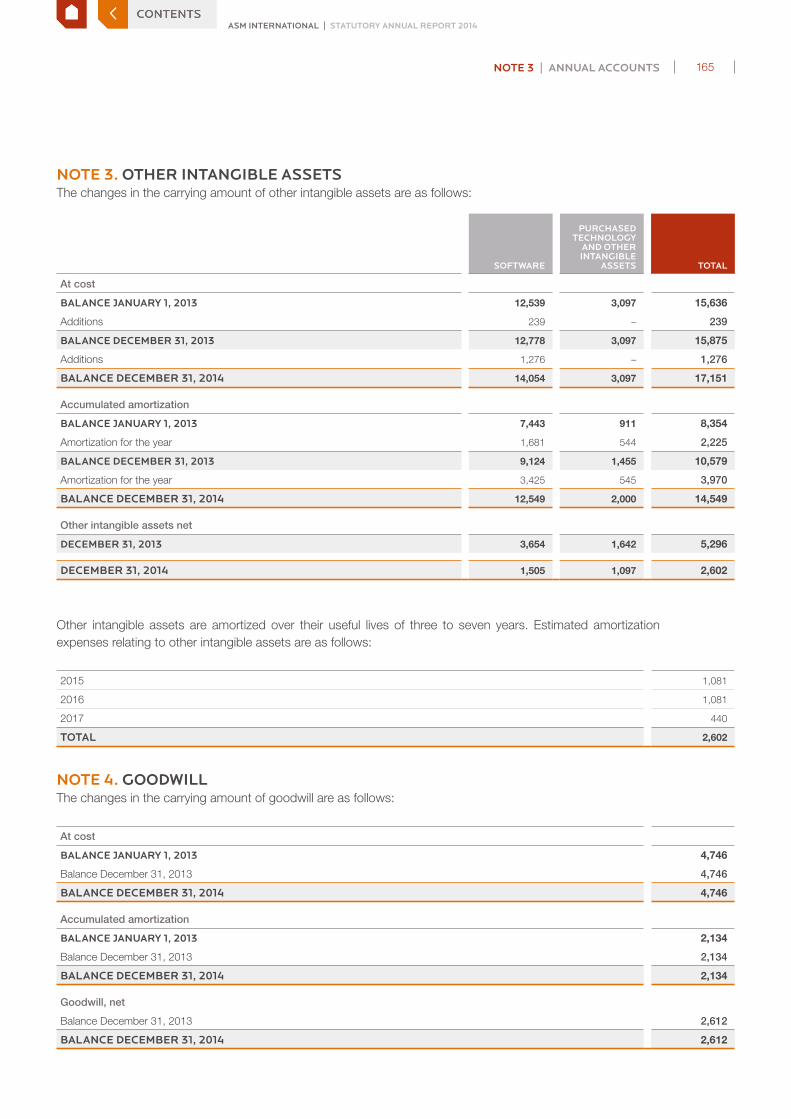
NOTE 3. OTHER INTANGIBLE ASSETSThe changes in the carrying amount of other intangible assets are as follows:
SOFTWARE
PURCHASED TECHNOLOGY
AND OTHER INTANGIBLE
ASSETS TOTAL
At cost
BALANCE JANUARY 1, 2013 12,539 3,097 15,636
Additions 239 – 239
BALANCE DECEMBER 31, 2013 12,778 3,097 15,875
Additions 1,276 – 1,276
BALANCE DECEMBER 31, 2014 14,054 3,097 17,151
Accumulated amortization
BALANCE JANUARY 1, 2013 7,443 911 8,354
Amortization for the year 1,681 544 2,225
BALANCE DECEMBER 31, 2013 9,124 1,455 10,579
Amortization for the year 3,425 545 3,970
BALANCE DECEMBER 31, 2014 12,549 2,000 14,549
Other intangible assets net
DECEMBER 31, 2013 3,654 1,642 5,296
DECEMBER 31, 2014 1,505 1,097 2,602
Other intangible assets are amortized over their useful lives of three to seven years. Estimated amortization expenses relating to other intangible assets are as follows:
2015 1,081
2016 1,081
2017 440
TOTAL 2,602
NOTE 4. GOODWILLThe changes in the carrying amount of goodwill are as follows:
At cost
BALANCE JANUARY 1, 2013 4,746
Balance December 31, 2013 4,746
BALANCE DECEMBER 31, 2014 4,746
Accumulated amortization
BALANCE JANUARY 1, 2013 2,134
Balance December 31, 2013 2,134
BALANCE DECEMBER 31, 2014 2,134
Goodwill, net
Balance December 31, 2013 2,612
BALANCE DECEMBER 31, 2014 2,612
NOTE 3 | ANNUAL ACCOUNTS 165
ASM INTERNATIONAL | STATUTORY ANNUAL REPORT 2014CONTENTS

NOTE 5. PROPERTY, PLANT AND EQUIPMENTThe changes in the amount of property, plant and equipment are as follows:
LAND, BUILDINGS AND LEASEHOLD IMPROVEMENTS
MACHINERY, EQUIPMENT, FURNITURE
AND FIXTURES TOTAL
At cost
BALANCE JANUARY 1, 2013 47 276 323
Disposal – (24) (24)
BALANCE DECEMBER 31, 2013 47 252 299
Disposal – (7) (7)
Additions – 1 1
BALANCE DECEMBER 31, 2014 47 246 293
Accumulated depreciation
BALANCE JANUARY 1, 2013 38 166 204
Depreciation for the year 9 43 52
BALANCE DECEMBER 31, 2013 47 209 256
Disposal – (7) (7)
Depreciation for the year – 21 21
BALANCE DECEMBER 31, 2014 47 223 270
Property, plant and equipment, net
DECEMBER 31, 2013 – 43 43
DECEMBER 31, 2014 – 23 23
USEFUL LIVES IN YEARS
Buildings and leasehold improvements 10-25
Machinery and equipment 2-10
Furniture and fixtures 2-10
NOTE 5 | ANNUAL ACCOUNTS 166
ASM INTERNATIONAL | STATUTORY ANNUAL REPORT 2014CONTENTS

NOTE 6. SHAREHOLDERS’ EQUITYThe changes in shareholders’ equity are as follows:
(EUR thousand except for share data)COMMON
SHARES
CAPITAL IN EXCESS OF PAR VALUE
TREASURY SHARES AT
COST
ACCUMU-LATED
(DEFICIT/ EARNINGS
LEGAL RESERVES
ACCUMULATED OTHER
COMPREHENSIVE INCOME (LOSS)
TOTAL SHARE-
HOLDERS’ EQUITY
BALANCE AS OF JANUARY 1, 2013 2,584 433,126 – 26,730 344,583 (21,295) 785,728
Net earnings – – – 1,062,675 – – 1,062,675
Other comprehensive income – – – – – (65,422) (65,422)
TOTAL COMPREHENSIVE INCOME (LOSS) – – – 1,062,675 – (65,422) 997,253
Compensation expense stock options – 4,440 – – – – 4,440
Re-issued shares following the settlement of the Lehman treasury shares 10 4,180 – – – – 4,190
Exercise stock options by issue of common shares 5 1,646 – – – – 1,651
Dividend paid to common shareholders – – – (31,666) – – (31,666)
Capital repayment – (239,507) – (30,035) – – (269,542)
Decreased retained earnings subsidiaries – – – 63,660 (63,660) – –
Fair value accounting investments – – (699,525) 699,525 – –
Capitalized development expenses – – – 6,644 (6,644) – –
Reclassification (60) 60 – – – – –Other movements in investments and associates:
Dilution – – – 3,587 – – 3,587
BALANCE AS OF DECEMBER 31, 2013 2,539 203,945 – 402,070 973,804 (86,717) 1,495,641
Net earnings – – – 141,317 – – 141,317
Other comprehensive income – – – – – 141,372 141,372
TOTAL COMPREHENSIVE INCOME (LOSS) – – – 141,317 – 141,372 282,689
Compensation expense stock options – 7,476 – – – – 7,476
Exercise stock options by issue of common shares 14 5,398 – – – – 5,412
Exercise stock options out of treasury shares (497) 4,158 (1,762) 1,899
Repurchase shares – – (31,891) – – – (31,891)
Dividend paid to common shareholders – – – (31,828) – – (31,828)
Increased retained earnings subsidiaries – – – (59,643) 59,643 – –
Fair value accounting investments – – (69,891) 69,891 – –
Capitalized development expenses – – – (5,662) 5,662 – –Other movements in investments and associates:
Dilution – – – 3,561 – – 3,561
Allocation equity component convertible bond – – – 9,947 – – 9,947
BALANCE AS OF DECEMBER 31, 2014 2,553 216,322 (27,733) 388,109 1,109,000 54,655 1,742,906
NOTE 6 | ANNUAL ACCOUNTS 167
ASM INTERNATIONAL | STATUTORY ANNUAL REPORT 2014CONTENTS

Legal reservesLegal reserves include reserves regarding retained earnings of subsidiaries, capitalized development expenses and the cumulative foreign currency translation effect on translation of foreign operations and is included in the accumulated other comprehensive income (loss).
Changes in legal reserves in 2013 and 2014 were as follows:
RETAINED EARNINGS OF SUBSIDIARIES
RESERVE FOR CAPITALIZED
DEVELOPMENT EXPENSES TOTAL
BALANCE AS OF JANUARY 1, 2013 282,347 62,236 344,583
Retained earnings subsidiaries and investments (63,660) – (63,660)
Fair value accounting investments 699,525 – 699,525
Development expenditures – (6,644) (6,644)
BALANCE AS OF DECEMBER 31, 2013 918,212 55,592 973,804
Retained earnings subsidiaries and investments 59,643 – 59,643
Fair value accounting investments 69,891 – 69,891
Development expenditures – 5,662 5,662
BALANCE AS OF DECEMBER 31, 2014 1,047,746 61,254 1,109,000
The cumulative foreign currency translation effect on translation of foreign operations was negative for the reported periods.
For more detailed information, reference is made to Note 16 to the Consolidated financial statements.
Employee stock option plan and employee restricted shares planThe Company has adopted various stock option plans and restricted share plans and has entered into related agreements with various employees. For detailed information, reference is made to Note 17 to the Consolidated financial statements.
NOTE 7. SHARE OWNERSHIP OF THE MANAGEMENT BOARD AND SUPERVISORY BOARDWith respect to share ownership of the Management Board and Supervisory Board, reference is made to Note 27 and 29 to the Consolidated financial statements.
NOTE 8. PERSONNELThe average number of employees of ASM International NV in full-time equivalents during 2014 was 20.5 (2013: 21.2). Salaries, social security charges and pension expenses amounted to €4,942, €85 and €340, respectively, for 2014 (2013: expenses of €3,981, €147 and €361, respectively).
For information on the parent company’s defined benefit pension plan, the remuneration of the Corporate Executive Board and the Supervisory Board and the parent company’s share-based compensation plans, see Notes 17 and 27, to the Consolidated annual accounts.
For information regarding auditor’s fees we refer to Note 29 of the Consolidated annual accounts.
NOTE 7 | ANNUAL ACCOUNTS 168
ASM INTERNATIONAL | STATUTORY ANNUAL REPORT 2014CONTENTS

NOTE 9. COMMITMENTS AND CONTINGENCIESWith respect to certain Dutch subsidiaries ASM International NV has assumed joint and several liability in accordance with Article 403, Part 9 of Book 2 of the Netherlands Civil Code.
ASM International NV forms a tax unity together with its Dutch subsidiaries for purposes of Netherlands tax laws and is as such jointly and severally liable for the tax debts of the unity. The tax unity consists of ASM International NV and the following subsidiaries: › ASM Europe BV (operational company) › ASM UK Sales BV (operational company) › ASM Germany Sales BV (operational company) › ASM Pacific Holding BV (holding company) › CVTR Development BV (dormant) › Beheer- en Beleggingsmaatschappij Ingebel BV (dormant) › Hamilcar Investments BV (dormant) › Rembrandt Lease and Finance BV (dormant) › ASM IP Holding BV (operational company) › ASM Netherlands Holding BV (holding company) › ASM Europe Holding BV (dormant)
SIGNINGAlmereApril 9, 2015
Supervisory BoardJ.C. LobbezooJ.M.R. DanneelsH.W. KreutzerM.C.J. van PernisU.H.R. Schumacher
Management BoardC.D. del PradoP.A.M. van Bommel
NOTE 9 | ANNUAL ACCOUNTS 169
ASM INTERNATIONAL | STATUTORY ANNUAL REPORT 2014CONTENTS

OTHER INFORMATION
Independent auditor’s reportThe independent auditor’s report is included on page 172 of the Annual accounts 2014.
Appropriation and determination of profitsArticle 32 of the Articles of Association of ASM International NV (‘the Company’) provides the following with regard to distribution of profit and can be summarized as follows:
Para 1-3:From the profits, distributions shall in the first place, if possible, be made on the preferred shares equal to the EURIBOR-rate for six months’ loans, increased by one and a half, on the paid up amount which had to be paid on the preferred shares, weighted to the number of days to which this was applicable. If profits are insufficient, the dividend will be paid from the reserves with priority over any dividends. If the reserves are insufficient, the dividend deficit has to be made up in future years;
Para 4-6:Second, a dividend, if possible, is distributed on financing preferred shares. The dividend is a percentage of the par value, plus share premium paid, on the financing preferred shares. The percentage is determined by the Management Board, subject to approval of the Supervisory Board. The percentage is related to the average effective yield on government loans with a weighted average remaining term of no more than ten years, if necessary increased or decreased by no more than three percent, subject to the then prevailing market conditions. If profits are insufficient, the dividend shall be paid from the reserves. If the reserves are insufficient, the dividend deficit has to be made up in future years;
Para 7:With the approval of the Supervisory Board, the Management Board will determine which part of the profit remaining after adoption of the provisions of the previous paragraphs will be reserved. The profit after reserving will be at the disposal of the General Meeting;
Para 9:The Company may only make distributions to the shareholders and other persons entitled to profit eligible for distribution insofar as its equity exceeds the amount of the paid-up and called amount of the share capital increased with the reserves that must be kept by virtue of law;
Article 33, para 3 of the Articles of Association provides that dividend claims expire after the lapse of five years. In 2014 the Management Board will propose to the forthcoming Annual General Meeting of Shareholders to declare a dividend of €0.60 per share to be paid from the available reserves. The net earnings for the year 2014 have been added to the accumulated deficit/net earnings.
Special statutory control rightsArticle 27 of the Articles of Association provides that each common share gives the right to cast one vote, each preferred financing share to cast one thousand votes and each preferred share to cast one thousand votes.
Article 29 of the Articles of Association provides that meetings of holders of preferred shares or of financing preferred shares shall be convened as often and insofar as a decision of the meeting of holders of preferred shares or financing shares desires this, and furthermore as often as the Management Board and or the Supervisory Board shall decide to hold such a meeting. At the meeting resolutions will be passed with an absolute majority of the votes. In the event that there is a tie of votes, no resolution will take effect.
OTHER INFORMATION 170
ASM INTERNATIONAL | STATUTORY ANNUAL REPORT 2014CONTENTS

The following resolutions and actions can only be taken on a proposal by the Management Board and the Supervisory Board: › the amendment of the Articles of the Company; and › the dissolution of the Company.
Stichting Continuïteit ASM InternationalThe objective of Stichting Continuïteit ASM International (‘Stichting’) is to serve the interests of the Company. To that objective Stichting may, amongst others, acquire, own and vote our preferred shares in order to maintain our independence and/or continuity and/or identity.
The members of the board of Stichting are: › Jan Klaassen (Chairman), Emiritus Professor, Vrije Universiteit Amsterdam › Dick Bouma, Retired Chairman Board Pels Rijcken & Droogleever Fortuijn › Rinze Veenenga Kingma, President Archeus Consulting B.V.
On May 14, 2008, Stichting exercised its right to acquire preferred shares in the Company and acquired 21,985 preferred shares representing 21,985,000 votes, which constituted 29.9% of the total voting power of our outstanding capital stock as of May 14, 2008. Stichting paid €219,850, which constituted one-fourth of the nominal value of the preferred shares acquired, in accordance with the option agreement. This amount was paid by Stichting using an existing credit line. On May 14, 2009 the Annual Meeting of Shareholders resolved to cancel the outstanding preferred shares and to reissue an option to Stichting Continuïteit to acquire preferred shares.
During 2008, two ASMI shareholders requested the Dutch Enterprise Court to investigate certain matters in relation to the issuance of preferred shares to Stichting. In August 2009, the Enterprise Court ordered an inquiry in respect of the affairs of the Company. In July 2010, the Dutch Supreme Court annulled the order of the Enterprise Court and remanded the decision to the Enterprise Court to consider certain observations of the Supreme Court. The Enterprise Court dismissed the inquiry in June 2011, and the plaintiffs appealed the dismissal ruling to the Dutch Supreme Court. The Dutch Supreme Court has not yet rendered a new decision.
On March 30, 2012 the Dutch Supreme Court confirmed the decision of the Enterprise Court dated April 14, 2011 that there are no grounds to order an enquiry (enquête) into the affairs of the Company.
List of subsidiaries and officesThe subsidiaries and offices of the Company are listed on page 29 of the Statutory Annual report.
Subsequent eventsSubsequent events were evaluated up to April 9, 2015, which is the issuance date of this Annual report 2014. There are no subsequent events to report.
OTHER INFORMATION 171
ASM INTERNATIONAL | STATUTORY ANNUAL REPORT 2014CONTENTS

INDEPENDENT AUDITOR’S REPORT ON FINANCIAL STATEMENTSTo: The Shareholders and Supervisory Board of ASM International NV
REPORT ON THE AUDIT OF THE FINANCIAL STATEMENTS 2014
OpinionWe have audited the accompanying financial statements 2014 of ASM International NV (‘the Company’), based in Almere. The financial statements include the consolidated financial statements and the Company financial statements.
In our opinion: › The consolidated financial statements give a true and fair view of the financial position of ASM International NV as at December 31, 2014, and of its result and its cash flows in the year 2014 in accordance with International Financial Reporting Standards as adopted by the European Union (IFRS-EU) and with Part 9 of Book 2 of the Dutch Civil Code. › The Company financial statements give a true and fair view of the financial position of ASM International NV as at December 31, 2014 and of its result for the year 2014 in accordance with Part 9 of Book 2 of the Dutch Civil Code.
The consolidated financial statements comprise: › the consolidated statement of financial position as at December 31, 2014; › the following statements for 2014: consolidated statements of income, consolidated statements of comprehensive income, consolidated statements of total equity and consolidated statements of cash flows for the year then ended; and › the notes comprising a summary of the significant accounting policies and other explanatory information.
The Company financial statements comprise: › the Company balance sheet as at December 31, 2014; › the statements of operations for the year 2014; and › the notes comprising a summary of the accounting policies and other explanatory information.
Basis for Our OpinionWe conducted our audit in accordance with Dutch law, including the Dutch Standards on Auditing. Our responsibilities under those standards are further described in the ‘Our responsibilities for the audit of the financial statements’ section as included in the appendix to our report.
We are independent of ASM International NV in accordance with the Verordening inzake de onafhankelijkheid van accountants bij assurance-opdrachten (ViO) and other relevant independence regulations in the Netherlands. Furthermore we have complied with the Verordening gedrags- en beroepsregels accountants (VGBA).
We believe that the audit evidence we have obtained is sufficient and appropriate to provide a basis for our opinion.
MaterialityMisstatements can arise from fraud or error and will be considered material if, individually or in the aggregate, they could reasonably be expected to influence the economic decisions of users taken on the basis of these financial statements. The materiality affects the nature, timing and extent of our audit procedures and the evaluation of the effect of identified misstatements on our opinion.
INDEPENDENT AUDITOR’S REPORT ON FINANCIAL STATEMENTS 172
ASM INTERNATIONAL | STATUTORY ANNUAL REPORT 2014CONTENTS

Based on our professional judgement we determined the materiality for the financial statements as a whole at EUR 5 million. The materiality is based on 7.5% of the average of normalized profit before tax for the years 2011-2014. We have also taken into account misstatements and/or possible misstatements that in our opinion are material for the users of the financial statements for qualitative reasons. We established a lower materiality for certain account balances and disclosures based on qualitative reasons.
We agreed with the Supervisory Board that misstatements in excess of EUR 250,000, which are identified during the audit, would be reported to them, as well as smaller misstatements that in our view must be reported on qualitative grounds.
Scope of the Group AuditASM International NV is at the head of a group of entities. The financial information of this group is included in the consolidated financial statements of ASM International NV.
Because we are ultimately responsible for the opinion, we are also responsible for directing, supervising and performing the group audit. In this respect we have determined the nature and extent of the audit procedures to be carried out for group entities. Decisive were the size and/or risk profile of the group entities or operations. On this basis, we selected group entities for which an audit or review had to be carried out on the complete set of financial statements or specific items.
The group audit mainly focused on significant group entities in the Netherlands, United States, Singapore, Japan, and Korea, as well as on the associate ASM Pacific Technology. For the group entities that are consolidated, we have performed most of the audit procedures ourselves. We used component auditors in Japan, Korea, and Singapore to support us with specified audit procedures. The audit of ASMPT was performed by a group audit team from Deloitte Hong Kong. At the other (less significant) group entities we have performed review procedures or specific audit procedures.
By implementing the procedures mentioned above at group entities, together with additional procedures at group level, we have been able to obtain sufficient and appropriate audit evidence about the group’s financial information to provide an opinion about the consolidated financial statements.
Our Key Audit MattersKey audit matters are those matters that, in our professional judgment, were of most significance in our audit of the financial statements. We have communicated the key audit matters to the Supervisory Board. The key audit matters are not a comprehensive reflection of all matters discussed.
These matters were addressed in the context of our audit on the financial statements as a whole and in forming our opinion thereon and we do not provide a separate opinion on these matters.
Revenue recognitionTotal revenue for the year 2014 amounts to EUR 546 million. ASM International’s revenue often consists of multiple elements. For revenue recognition purposes, the consideration received from customers is allocated to the various products and services contracted based on the relative selling price of these elements (multiple element arrangement accounting). This revenue allocation requires significant judgment and determines the timing and amount of revenue recognized in each reporting period. Focus areas mainly relate to multiple element arrangements, cut-off and delivery conditions, and installation services and the relation with final acceptances.
Our audit procedures included, amongst others, the review of significant contracts to assess the identification of all relevant products and services sold. We also focused on the allocation of revenue to the various elements in the contracts, as well as, the timing of the revenue recognized.
INDEPENDENT AUDITOR’S REPORT ON FINANCIAL STATEMENTS 173
ASM INTERNATIONAL | STATUTORY ANNUAL REPORT 2014CONTENTS

Inventory excess & obsolete inventoryThe total inventory and related excess and obsolete provision as of December 31, 2014 amounts to EUR 126 million and EUR 19 million, respectively. The excess and obsolete provision mainly relates to raw materials and spare parts because finished products (and related work in process) are usually manufactured only when a client order is received.
We focused on this area because the gross inventory and related provision are material to the financial statements, involve a high level of judgment and are subject to uncertainty due to rapid technological changes. We evaluated, amongst others, the analyses and assessments made by management with respect to slow moving and obsolete stock and the expected demand and market value related to raw materials and spare parts.
Valuation of associate ASMPTThe associate book value of ASM Pacific Technology Limited (‘ASMPT’) as per December 31, 2014 amounts to EUR 1,093 million, including goodwill and other intangibles for an amount of EUR 747 million.
Under IFRS-EU, the Company is required to annually test goodwill for impairment and intangible fixed assets not yet available for use. For other intangible fixed assets with finite useful lives, the Company is required to assess whether impairment indicators exists.
We focused on this area because of the materiality of the investment, the valuation of which involves complex and subjective judgements made by management about near and long term prospects of the business of ASMPT. The impairment test uses the fair value of the listed shares of ASMPT as a starting point to assess whether any severe and other than temporary decline in value exists. Our audit procedures included assessing the reasonableness of the analysis’ made by management as well as evaluating any qualitative factors that might be of influence on the business of the investment.
Responsibilities of Management and the Supervisory Board for the Financial StatementsManagement is responsible for the preparation and fair presentation of the financial statements in accordance with IFRS-EU and Part 9 of Book 2 of the Dutch Civil Code, and for the preparation of the management board report in accordance with Part 9 of Book 2 of the Dutch Civil Code. Furthermore, management is responsible for such internal control as management determines is necessary to enable the preparation of financial statements that are free from material misstatement, whether due to fraud or error.
As part of the preparation of the financial statements, management is responsible for assessing the Company’s ability to continue as a going concern. Based on the financial reporting frameworks mentioned, management should prepare the financial statements using the going concern basis of accounting unless management either intends to liquidate the Company or to cease operations, or has no realistic alternative but to do so. Management should disclose events and circumstances that may cast significant doubt on the Company’s ability to continue as a going concern in the financial statements.
The Supervisory Board is responsible for overseeing the Company’s financial reporting process.
Our Responsibilities for the Audit of the Financial StatementsOur objective is to plan and perform the audit assignment in a manner that allows us to obtain sufficient and appropriate audit evidence for our opinion.
Our audit has been performed with a high, but not absolute, level of assurance, which means we may not have detected all errors and fraud.
For our responsibilities we refer to the appendix.
INDEPENDENT AUDITOR’S REPORT ON FINANCIAL STATEMENTS 174
ASM INTERNATIONAL | STATUTORY ANNUAL REPORT 2014CONTENTS

Report on Other Legal and Regulatory RequirementsReport on the management board report and the other informationPursuant to legal requirements of Part 9 of Book 2 of the Dutch Civil Code (concerning our obligation to report about the management board report and other information): › we have no deficiencies to report as a result of our examination whether the management board report, to the extent we can assess, has been prepared in accordance with Part 9 of Book 2 of the Dutch Civil Code, and whether the information as required by Part 9 of Book 2 of the Dutch Civil Code has been annexed; › we report that the management board report, to the extent we can assess, is consistent with the financial statements.
Engagement
We were appointed as auditor of ASM International NV by the shareholders meeting as of the audit for year 1969 and have operated as statutory auditor ever since that date.
Amsterdam, April 9, 2015
Deloitte Accountants B.V.
P.J.M.A. van de Goor
Enclosure: Appendix to the independent auditors report: Our responsibilities for the audit of the financial statements
INDEPENDENT AUDITOR’S REPORT ON FINANCIAL STATEMENTS 175
ASM INTERNATIONAL | STATUTORY ANNUAL REPORT 2014CONTENTS

APPENDIX TO THE INDEPENDENT AUDITOR’S REPORT: OUR RESPONSIBILITIES FOR THE AUDIT OF THE FINANCIAL STATEMENTSWe have exercised professional judgment and have maintained professional skepticism throughout the audit, in accordance with Dutch Standards on Auditing, ethical requirements and independence requirements. Our audit included e.g.: › Identifying and assessing the risks of material misstatement of the financial statements, whether due to fraud or error, designing and performing audit procedures responsive to those risks, and obtaining audit evidence that is sufficient and appropriate to provide a basis for our opinion. The risk of not detecting a material misstatement resulting from fraud is higher than for one resulting from error, as fraud may involve collusion, forgery, intentional omissions, misrepresentations, or the override of internal control; › Obtaining an understanding of internal control relevant to the audit in order to design audit procedures that are appropriate in the circumstances, but not for the purpose of expressing an opinion on the effectiveness of the Company’s internal control; › Evaluating the appropriateness of accounting policies used and the reasonableness of accounting estimates and related disclosures made by management; › Concluding on the appropriateness of management’s use of the going concern basis of accounting, and based on the audit evidence obtained, whether a material uncertainty exists related to events or conditions that may cast significant doubt on the Company’s ability to continue as a going concern. If we conclude that a material uncertainty exists, we are required to draw attention in our auditor’s report to the related disclosures in the financial statements or, if such disclosures are inadequate, to modify our opinion. Our conclusions are based on the audit evidence obtained up to the date of our auditor’s report. However, future events or conditions may cause the Company ceasing to continue as a going concern; › Evaluating the overall presentation, structure and content of the financial statements, including the disclosures; › Evaluating whether the financial statements represent the underlying transactions and events in a manner that achieves fair presentation.
We communicate with the Supervisory Board regarding, among other matters, the planned scope and timing of the audit and significant audit findings, including any significant findings in internal control that we identify during our audit.
We provide the Supervisory Board with a statement that we have complied with relevant ethical requirements regarding independence, and to communicate with them all relationships and other matters that may reasonably be thought to bear on our independence, and where applicable, related safeguards.
From the matters communicated with the Supervisory Board, we determine those matters that were of most significance in the audit of the financial statements of the current period and are therefore the key audit matters. We describe these matters in our auditor’s report unless law or regulation precludes public disclosure about the matter or, in extremely rare circumstances, when non-mentioning is in the public interest.
INDEPENDENT AUDITOR’S REPORT ON FINANCIAL STATEMENTS 176
ASM INTERNATIONAL | STATUTORY ANNUAL REPORT 2014CONTENTS

ASM InternationalVersterkerstraat 81322 AP AlmereThe Netherlands