Connecting Markets East & West - Home - NOMURA · Connecting Markets East & West ... 3.0 3.5 4.0...
16
STRICTLY PRIVATE AND CONFIDENTIAL © Nomura Connecting Markets East & West February 2017 A product of Sales and Trading and not investment research Latin America – searching for value Emerging Market Credit Trading
Transcript of Connecting Markets East & West - Home - NOMURA · Connecting Markets East & West ... 3.0 3.5 4.0...

STRICTLY PRIVATE AND CONFIDENTIAL
© Nomura
Connecting Markets East & West
February 2017
A product of Sales and Trading and not investment research
Latin America – searching for value
Emerging Market Credit Trading

Source: Bloomberg
Mexico | Trump risk
There are not the same parallels between Trump risk and Brexit with Latin America more sensitive to the US policy risk that could impact the region even against the support of resilient commodity prices. The most vulnerable countries are the small open economies that are dependent upon external trade (Mexico) or countries that are dependent upon external capital (Argentina).
Mexico remains most at risk if the latent US policy risk weighs on FDI or worse case scenario trade protectionism shocks the external accounts with subsequent threat of de-leveraging on the stock of foreign holdings and extreme fallout on MXN.
The financial market stress motivated pre-emptive rate hikes from the central bank and less favorable growth/inflation tradeoff. Mexico also increased their Flexible Credit Line to counter concerns about low relative level of FX reserves, corporate demand for USD and high dependence upon corporate remittances with now a more active FX intervention program.
There is not much policy flexibility for counter cyclical fiscal stimulus while the central bank reaction function continues to prioritize upside risks to inflation (as the government moves to liberalize the price of gasoline) as opposed to downside risks to growth. The downside risks to growth may improve the external accounts but could also increase political risk ahead (leftist backlash) of the next election cycle.
The prolonged uncertainty could compromise FDI inflows and motivate capital outflows for a prolonged period of financial contagion until there is clarity about US/Mexico trade relations.
The FX rate allows adjustment buffer but Mexico external accounts a concern
1
-20000
-10000
0
10000
20000
30000
40000
Peru Chile Colombia
Jan-Sep 2015 Jan-Sep 2016
-10
0
10
20
30
40
50
60
70
80
90
Brazil Mexico Chile Colombia Peru
Exports to US (% of total exports)
Trade Balance with US (% of GDP)
5.8
3.6
2.9
2.0
1.3
3.0 3.4
2.2
2.8
3.7 3.5
-0.4
1.7
0.9
-0.8
-2.0
-1.0
0.0
1.0
2.0
3.0
4.0
5.0
6.0
7.0
Colombia Peru Mexico Chile Brazil
CAD Deficit (inverted) FDI Portfolio Flows
%
-1.5
-1.0
-0.5
0.0
0.5
1.0
1.5
2.0
2.5
3.0
3.5
4.0
Mexico Chile Brazil
CAD Deficit (inverted) FDI Portfolio Flows

Source: Bloomberg
Mexico | again separates from the pack
Mexico external credit is typically anchored for its credit rating; however the weaker investment grade credits like Uruguay traded through Mexico (UYU’27/MEX’26 differential) with even speculative rated credits like Brazil reaching 56bp on the front end (BRZ’23/MEX’23 differential). Is there any reprieve on the US policy risk? How cheap do we have to go to offer a buffer?
We recommended an opportunistic long position on favorable technicals from oversold positions and cheap valuations as Mexico traded at premium to the lowest rated investment grade credits.
The recent relief on FX strength implies less financial contagion and hence less fallout on the real economy.
The question shifts from whether Mexico is cheap enough to how much will Mexico tighten on this technical bounce? The outperformance was most notable on the lowest beta sovereign credit with higher beta Mexico outperforming Peru and spread differentials compressing from near 100bp to near 50bps. Mexico credit has been resilient across other lower quality credits like Brazil and Colombia; however not the same momentum of relative outperformance. We suspect that recent gains begin to fade until there is clarity on policy risk on what has been a general agenda and a lengthy 3 month consultation period.
From a fundamental perspective, there are enough checks/balances to prevent against worst case scenarios including US legislators (Republican establishment) and US businesses with Mexico also prepared to adopt a rational and pragmatic approach.
There is a lengthy 90 day consultation period with Mexico Economy Minister suggesting that talks could commence in May. We await confirmation of Commerce Secretary Wilbur Ross to set the initial guidelines from the US.
Mexico no longer the safe haven
2
0
25
50
75
100
125
150
175
200
225
250
275
300
325
350
Nov-15 Feb-16 May-16 Aug-16 Nov-16
BRZ'23-MEX'23 BRZ'45-MEX'45
-100
-50
0
50
100
150
200
Nov-14 Aug-15 May-16
COL'23-UMS'23 COL'41-UMS'40
-25
0
25
50
75
100
Aug-16 Oct-16 Dec-16 Feb-17
URU'50-MEX'46 UYU'27-MEX'26
-100
-80
-60
-40
-20
0
20
40
May-15 Nov-15 May-16 Nov-16
PER'27-MEX'26 PER'50-MEX'46

Source: Bloomberg, BCV, GlobalSource
There are not many financing options after having exhausted extraordinary resources and China not a lender of last resort. If officials could convert illiquid
assets like PetroCaribe loans, offshore refineries, etc. then these assets would have been liquidated already while the resale of USD bonds would only
translate into diminishing USD for lower secondary prices on weak demand offshore.
The financing gap post oil shock has been achieved via import compression with an average 50%y/y decline in imports. This suggests an unstable
equilibrium as there is no outcome that would allow for a stable growth/inflation tradeoff.
There is some marginal relief this year with the recent spike in oil prices more than compensating for the decline in oil production. We assume
consistent rollover relief from China and still a cushion of FX reserves that allows Venezuela/PdVSA to muddle through this year.
The recent debt issuance (5bn new sovereign issuance @ 6% coupon 2036 sinker ) should not provide any near term liquidity relief with diminishing USD
hard currency for lower secondary prices on weak demand offshore. The questionable legal status of this issuance (declared illegal by the
opposition) will likely discourage a resale of these bonds into the secondary market and hence would not provide any USD liquidity relief for
near term bond payments.
Petrodollars cannot finance USD liabilities without severe economic shock
Venezuela | cashflow constraints
3
Table 1: The 2016 sources and uses against oil price shock
USD millions
Imports ($16,776) Oil exports @ $35 $24,273
oil imports ($2,354) Non-oil exports $2,259
Non oil imports ($14,422) China re-profiling $3,343
Service deficit (tourism,
suppliers) ($6,426)
PetroCaribe cutoff (lower oil
price/lower volume) $1,155
Income deficit (coupon
payments) ($5,360) Net Gold $5,239
Amortizations ($11,320) Non-gold reserves $2,000
E&O/Other investment
(capital flight) ($2,473) Debt liability management $3,033
USD liabilities ($42,355) USD assets $41,302
Table 2: The 2017 sources and uses against oil price shock
USD millions
Imports ($16,776) Oil exports @ $46 $29,131
oil imports ($2,090) Non-oil exports $0
Non oil imports ($14,776) China re-profiling $5,000
Service deficit (tourism,
suppliers) ($6,426)
PetroCaribe cutoff (lower
oil price/lower volume) $0
Income deficit (coupon
payments) ($4,946) Net Gold $7,200
Amortizations ($8,921) Non-gold reserves $0
E&O/Other investment
(capital flight) ($2,913) Debt liability management $847
USD liabilities ($39,982) USD assets $42,178

Could Venezuela/PDVSA continue to defy expectations and postpone default? The potential medium term strategy would rely primarily on
cashflow management under extreme scenarios of near zero FX reserves and low non-oil imports. It then becomes a more simplified tradeoff of
whether annual oil export can finance the FIXED USD liabilities including capital flight, oil imports and external debt service. The ratio is still 2.5:1.0 oil
exports versus external debt service that declines to 1.7:1.0 if we include capital flight and oil imports and remains above the 1:1 threshold over the next
few years. (Our assumptions include capital flight as a fixed 10% ratio of oil exports, oil imports as an increasing 16% ratio of oil exports and a fixed 9%
per annum decline in oil production). The oil production may decline at a faster pace on the systemic destruction of production capacity and zero non-oil
imports. We also cannot rule out more ad hoc debt liability management on rolling over the sinking payments of the PdVSA’20. There is also the fat tail
risk that Chavismo reassesses the “willingness to pay” under the more stressful “ability to pay.” The equally important risk is that the fiscal
skeletons finally explode with a threshold whereby Venezuela can no longer rollover and restructure its liabilities with China, oil suppliers and
ICSID claims. The cashflow analysis above shows that Venezuela would (theoretically) be able to finance fixed liabilities over the next 2-3 years
dependent upon oil prices and dependent upon fiscal skeletons. The cashflow remains precarious; however officials could continue to prioritize oil exports
to finance external debt service to avoid a near term credit event.
Venezuela/PdVSA could remain solvent for years. But this requires an efficient (!) prioritization of USD liabilities.
Venezuela | ability to pay in extreme scenario
4
0
2000
4000
6000
8000
10000
12000
14000
2016 2017 2018 2019 2020 2021 2022
Net exports - USD liabilities (static oil price @ $42)
Net exports - USD liabilities (higher oil future prices)
0.00
0.20
0.40
0.60
0.80
1.00
1.20
1.40
1.60
1.80
2.00
2016 2017 2018 2019 2020 2021 2022
ratio @ $42 fixed oil price ratio @ higher oil future prices
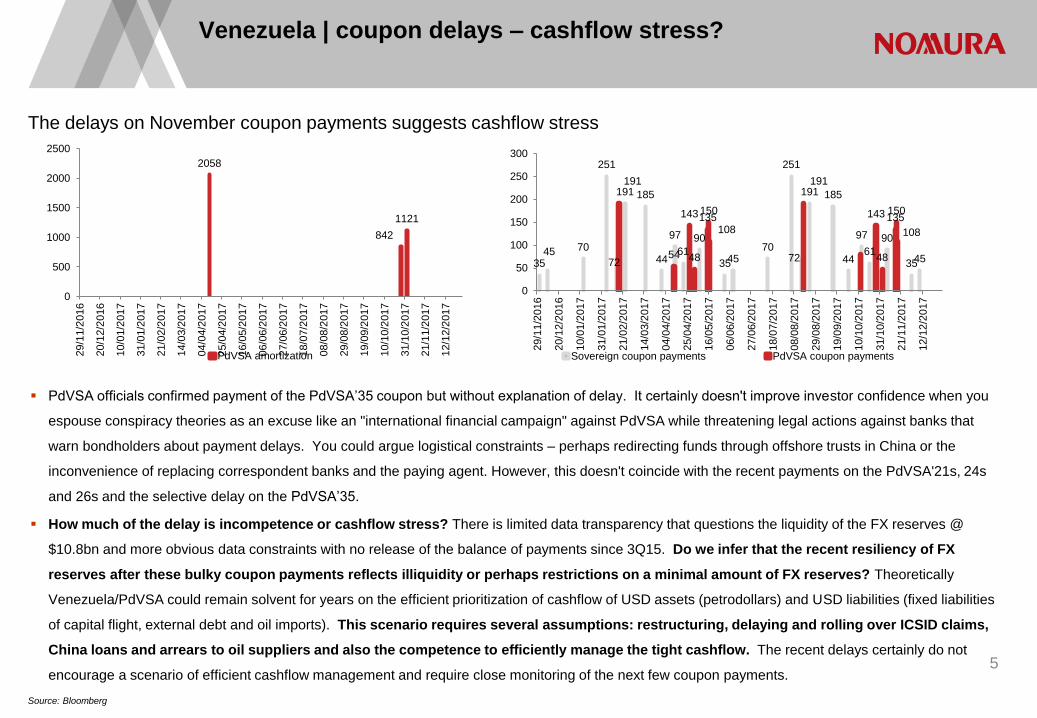
PdVSA officials confirmed payment of the PdVSA’35 coupon but without explanation of delay. It certainly doesn't improve investor confidence when you
espouse conspiracy theories as an excuse like an "international financial campaign" against PdVSA while threatening legal actions against banks that
warn bondholders about payment delays. You could argue logistical constraints – perhaps redirecting funds through offshore trusts in China or the
inconvenience of replacing correspondent banks and the paying agent. However, this doesn't coincide with the recent payments on the PdVSA'21s, 24s
and 26s and the selective delay on the PdVSA’35.
How much of the delay is incompetence or cashflow stress? There is limited data transparency that questions the liquidity of the FX reserves @
$10.8bn and more obvious data constraints with no release of the balance of payments since 3Q15. Do we infer that the recent resiliency of FX
reserves after these bulky coupon payments reflects illiquidity or perhaps restrictions on a minimal amount of FX reserves? Theoretically
Venezuela/PdVSA could remain solvent for years on the efficient prioritization of cashflow of USD assets (petrodollars) and USD liabilities (fixed liabilities
of capital flight, external debt and oil imports). This scenario requires several assumptions: restructuring, delaying and rolling over ICSID claims,
China loans and arrears to oil suppliers and also the competence to efficiently manage the tight cashflow. The recent delays certainly do not
encourage a scenario of efficient cashflow management and require close monitoring of the next few coupon payments.
The delays on November coupon payments suggests cashflow stress
Venezuela | coupon delays – cashflow stress?
5
Source: Bloomberg
2058
842
1121
0
500
1000
1500
2000
2500
29/1
1/2
016
20/1
2/2
016
10/0
1/2
017
31/0
1/2
017
21/0
2/2
017
14/0
3/2
017
04/0
4/2
017
25/0
4/2
017
16/0
5/2
017
06/0
6/2
017
27/0
6/2
017
18/0
7/2
017
08/0
8/2
017
29/0
8/2
017
19/0
9/2
017
10/1
0/2
017
31/1
0/2
017
21/1
1/2
017
12/1
2/2
017
PdVSA amortization
35 45 70
251
191 185
44
97
61
90
35 45 70
251
191 185
44
97
61
90
35 45
191
54
143
48
135 150
191
143
48
135 150
0
50
100
150
200
250
300
29/1
1/2
016
20/1
2/2
016
10/0
1/2
017
31/0
1/2
017
21/0
2/2
017
14/0
3/2
017
04/0
4/2
017
25/0
4/2
017
16/0
5/2
017
06/0
6/2
017
27/0
6/2
017
18/0
7/2
017
08/0
8/2
017
29/0
8/2
017
19/0
9/2
017
10/1
0/2
017
31/1
0/2
017
21/1
1/2
017
12/1
2/2
017
Sovereign coupon payments PdVSA coupon payments
108 108
72 72

Source: Bloomberg
The carry returns versus declining recovery value.
Venezuela | positioning on muddling through
The binary event risk has forced many investors into a neutral positioning for
Venezuela/PdVSA. Will the “willingness to pay” continue through cashflow stress?.
It’s not the same investment strategy with no liquidity in the 2018 tenors and high cash prices for
the shorter maturities that would not replicate the 90% total returns on the 2017 tenors. There
are no obvious “pull to par” annualized returns with the 5.25% PdVSA’2017 trading close to par
and potential total returns of near 23% for the 8.5% PdVSA’2017 that matures in November. We
continue to recommend the PdVSA’20 that offers both defensive characteristics of
increasing collateral coverage and also upside potential for the aggressive sinking
payment structure that lowers the average duration to less than 2 years. For more defensive
bondholders, we assume a weighted recovery value of 62.4 on the 56% of 90 for the Citgo equity
and a 44% recovery value of 30 for the unsecured bond exposure that increases to 66.4 (on
more conservative 80 recovery value of Citgo equity) after the first amortization payment. If we
compare the downside risk against the lowest cash price bond, we project -15% returns
for the PdVSA’20 versus - 23% returns for the PdVSA’27 on conservative 30 recovery
value of unsecured curve. We recognize that the collateral should trade at a discount to par;
however the current prices underestimate the value of the collateral on both the upside and
downside risks. We would not view the PdVSA’20 as only passive current yield of 11% but
rather the upside potential gains on the amortization payment and the lower discount rate as
bondholders de-risk to the credit curve after the October payment. The PdVSA’20 has lagged
to the latest gains on the VENZ’18 and the CITHOL’20 with fair valuation closer to 85
versus current prices of 78.7. We project total returns of 40% for the highest potential
return across the curve versus the current yield of 18%-20% on the high coupon bonds. 6
0%
10%
20%
30%
40%
50%
60%
70%
80%
90%
100%
PdVSA 2016 returns
0%
5%
10%
15%
20%
25%
sovereign current yield
0%
5%
10%
15%
20%
25%
30%
35%
40%
45%
VENZ'18 8.5% PDVSA'17 PdVSA'20Projected total returns thru 10/27/2017

The external DSA requires reduction in import dependence back to 2002-2004
Venezuela | preview on external DSA approach
It is premature for recovery value estimates on highly subjective assumptions through still a
fluid political and economic transition. We assume a dynamic model based upon economic
reform that would encourage capital inflows (official and private sector) and higher oil
production.
We reference an external DSA approach. We cannot adopt a budget constraint approach or
fiscal DSA approach since even debt repudiation would not solve the funding gap.
The debt restructuring has to coincide with aggressive economic reform and remains a
dependent variable to the reduction of the higher USD liabilities of imports/capital flight.
The reference for a external sustainability analysis is 2000-2004 when oil prices were near
today’s levels, imports were $10-$15bn and prior to the era of expropriation and intervention.
If Venezuela reforms the economy (deregulate, reprivatize, adjust prices) then you could
revert back to pre-expropriation era when imports were around $15bn and capital flight was
lower and oil prices were around 30-40.
The capital flows are a huge unknown that could also distort any calculations. If you think
about the near $180bn in capital flight over the past 18 years with any repatriation skewing
the balance of payments cashflow estimates.
We are also concerned about increasing USD liabilities and the huge USD supply
deficit that requires cashflow relief through the economic transition.
7
Source: BCV
0
5,000
10,000
15,000
20,000
25,000
30,000
35,000
40,000
45,000
50,000
Non-oil imports

Source: INDEC, BCRA
Only shallow recession and pent-up USD demand reinforces structural current account deficit
Argentina | the Macri era of normalization
Argentina continues its strategy of debt accumulation to finance the structural external cashflow deficit and reduce the burden on the FX rate with real
appreciation necessary to achieve their ambitious inflation target. There is only a slow improvement on the current account deficit (INDEC shows -
$10.7bn through 3Q16 versus -$11.9bn through 3Q15) with a still high service deficit (increasing tourism outflows) and still high income deficit (higher
debt service). The nominal FX devaluations across Latin America have not compensated against weak global demand with only those countries with
even weaker domestic demand shifting their trade accounts to surplus with imports decelerating faster than exports. The estimated economic
recession this past year (estimated GDP decline of -2.2%) has compressed imports but with only a -7%y/y decline January-November with the
majority of the deceleration in intermediate goods with still pent up demand for consumer imports. The real FX appreciation remains a constraint with
still high inflation eroding the competitiveness gains in the second half of the year.
The breakdown of the financing of the balance of payments still shows a high dependence on bond issuance ($34bn in 2016) and still a low
dependence on FDI against the low stock of liquid FX reserves. Despite the $60bn of investment commitments, the net FDI has been $4.1bn through
3Q16 versus $9.0bn through 3Q15. The inflows from the tax moratorium in December should provide an important source of one-off financing
that could reduce the dependence upon external capital and slowly reduce structural capital flight (via tax sharing across borders).
8
0
500
1,000
1,500
2,000
2,500
3,000
3,500
4,000
4,500
Dec-0
3
Se
p-0
4
Jun
-05
Ma
r-06
Dec-0
6
Se
p-0
7
Jun
-08
Ma
r-09
Dec-0
9
Se
p-1
0
Jun
-11
Ma
r-12
Dec-1
2
Se
p-1
3
Jun
-14
Ma
r-15
Dec-1
5
Se
p-1
6
FDI USD millions 12MMA
-6,000
-4,000
-2,000
0
2,000
4,000
6,000
8,000
10,000
12,000
14,000
Dec-0
3
Au
g-0
4
Ap
r-05
Dec-0
5
Au
g-0
6
Ap
r-07
Dec-0
7
Au
g-0
8
Ap
r-09
Dec-0
9
Au
g-1
0
Ap
r-11
Dec-1
1
Au
g-1
2
Ap
r-13
Dec-1
3
Au
g-1
4
Ap
r-15
Dec-1
5
Au
g-1
6
Private sector debt issuance USD millions 12MMA
-3.5%
-3.0%
-2.5%
-2.0%
-1.5%
-1.0%
-0.5%
0.0%
2010 2011 2012 2013 2014 2015 2016
Current Acct % GDP
Argentina dependence upon external demand
Argentina | the Macri era of normalization
Argentina raised $22bn from the external capital markets and near $20bn
locally with the majority financed via non resident investors. There had been
a total of $34bn in new issuance YTD including the sovereign. corporates
and quasi-sovereigns.
The backdrop of favorable external risk last year allowed for an influx of
capital inflows but not yet a virtuous circle of lower inflation and higher
growth potential (that would then allow for more fiscal revenues).
The virtuous circle requires stable external risk and strong
governability/political commitment thru a difficult multi-year adjustment
process.
The high dependence on bond issuance, low dependence on FDI and low
stock of liquid FX reserves exposed a clear vulnerability to external risk and
the delays on foreign direct investment. commitments a constraint against
secular higher GDP growth.
The flexibility on managing the tax moratorium flows provides some
financing (directly and indirectly) on the fiscal accounts as well as
front loading the external funding in January 2017; however the gradual
adjustment strategy remains the primary constraint for overall credit risk and
low FDI flows that postpones the more favorable inflation/growth tradeoff.
9
Source: MECON
The sources and uses 2016 2017
billions USD ARS % GDP USD ARS % GDP
Fiscal uses 55.8 840 10.4% 56.5 1006 10.1%
Interest payments (minus FGS
and BCRA profits) 1.3 19 0.2% 3.6 64 0.6%
Primary fiscal deficit 26.4 390 4.8% 23.0 409 4.1%
Debt amortizations 16.1 238 2.9% 29.9 532 5.3%
Debt markets 12.3 182 2.2% 17.4 310 3.1%
USD amortizations 1.3 19 0.2% 8.0 142 1.4%
ARS amortizations 11.0 163 2.0% 9.4 167 1.7%
IFIs 1.8 27 0.3% 2.8 50 0.5%
Paris Club 2.0 30 0.4% 2.0 36 0.4%
USD bills 7.7 137 1.4%
Holdout creditos 9.3 137 1.7%
GDP warrant buyback 2.8 41 0.5%
Fiscal sources 55.9 826 10.2% 56.2 1000 10.0%
Central Bank 10.8 160 2.0% 5.1 91 0.9%
ANSES 1.5 22 0.3% 2.0 36 0.4%
IFIs 2.0 30 0.4% 3.8 68 0.7%
Tax moratorium 3.1 55 0.6%
Repo line 6.0 107 1.1%
Debt Markets 43.1 636 7.8% 36.2 644 6.4%
USD gross issuance 22.0 325 4.0% 10.0 178 1.8%
ARS gross issuance 13.4 198 2.4% 14.0 249 2.5%
USD bills gross issuance 7.7 113 1.4% 12.2 217 2.2%

Argentina lower financing risk
Argentina | the Macri era of normalization
There is near term financing flexibility with the $3.1bn estimates of one-off revenues from the tax moratorium, a $6bn repo facility with international
banks and front loaded $7bn of USD issuance to finance the rollover of the bulky $7.2bn BONAR’17 payment in April, 2017 (33% held locally).
The USD curve should definitely benefit from supply relief with the upsized deal to $7bn now completing the USD financing program with another
$3bn remaining from external non USD sources.
Minister Caputo emphasized that external issuance would be significantly lower for 2017 at $10bn for the sovereign, $3.5bn for quasi-sovereigns
and $5bn for corporates for total issuance of $18.5bn in 2017 versus $34bn in 2016. We still have to be cautious about residual supply risk;
however we assume a much easier absorption capacity especially with demand for the higher yielding quasi-sovereign and corporate bonds.
The remaining financing program shifts to the local markets with $14b in gross issuance ($7.5bn net issuance) as well as a net increase of $4.5bn
in USD treasury bills. This appears manageable considering the index demand from GBI-EM entry (minimal $2bn) and retail demand for
treasury bills on the reintegration of the tax moratorium funds into the banking sector. We also do not discount some potential demand from
offshore funds to reinvest into the tax exempt status of sovereign bonds to offset the tax moratorium penalty.
Although Argentina depended upon the majority of local financing from offshore investors last year, we assume a much lower dependence for the
indirect and direct funding from the tax moratorium. The 2017 financing program assumes that total participation near $100bn will continue
through the late deadline of March 31, 2017.
The central bank is perhaps less concerned about the subsequent impact of real FX appreciation on prioritizing the aggressive 17% inflation target
next year and the need for attracting inflows to finance the fiscal deficit.
10
Source: MECON

Argentina credit risk remains dependent upon fiscal adjustment
Argentina | the Macri era of normalization
There were notable delays on clarifying the 2017 financial program and clarifying the breakdown of the tax moratorium on the 2016 and 2017
budgets. The bulk of the $7bn in one-off tax revenues allowed Argentina to beat their fiscal target of 4.8% of GDP (4.6% of GDP) with the local
headlines suggesting a cancellation of 1.1% of GDP in debt arrears last year.
These one-off inflows do not reverse the notable worsening in 2Q16 fiscal performance with a sharp deceleration in revenues that outpaced a slowdown
in spending with a resurgence of transfers to the private sector and still a contraction in capital spending. The primary deficit showed a real 28%y/y
increase from January through October.
The economic team also revised the fiscal deficit target from 3.3% of GDP to 4.2% of GDP on the premise that fiscal convergence coincides with political
stability and a stop/go fiscal adjustment through the election cycles.
Despite the fallout from the “tarifazo” last year, the recent tariff hikes reinforces commitment to a gradual adjustment process. The cyclical
recovery and one off inflows from the tax moratorium should provide flexibility on meeting the fiscal target this year.
11
Source: MECON
0
10,000
20,000
30,000
40,000
50,000
60,000
70,000
80,000
90,000
100,000
Other taxes mns pesos
0%
20%
40%
60%
80%
100%
120%
spending %y/y revenues %y/y
-5%
-4%
-3%
-2%
-1%
0%
1%
2010 2011 2012 2013 2014 2015 2016 2017
Official primary fiscal data and targets

Argentina cyclical fiscal adjustment remains dependent upon growth.
Argentina | the Macri era of normalization
There have been some false starts over the past few months and a deeper economic recession of 2.5% of GDP in 2016; however the latest data
have now confirmed the beginning of an economic recovery with potential for GDP growth above 3% this year. We were less concerned about
the potential for an economic recovery than the timing and strength of the economic recovery. The main driver is the pro-growth stimulus
from the Economy Ministry with an upward revision to the primary fiscal deficit target this year and a real increase in spending. The larger
participation in the tax amnesty program provides potential for either private and/or public consumption with a bias for public infrastructure
spending and a real increase in spending within the 2017 budget. The leading indicators finally coincide with the actual data with the monthly
EMAE economic activity index showing a recovery of growth of 1.4%m/m in November and upward revision to 0.5%m/m in October. The private
sector data from IGA reaffirms the trend with quarterly annualized growth of 4.6%y/y in 4Q16 following average growth of 0.8%q/q.
If we forecast GDP growth on the inertia of the latest data and a bias of trend reversion then this suggests GDP growth of 2.9% in 2017.
However, this would require a deceleration of the month-over-month to 0.2%-0.3% versus the 0.8% average monthly increase in 4Q16 (with
focus on the January release of IGA data in the next few weeks). The latest data challenge the conservative GDP growth forecasts and
risks to the upside of the ARIMA regression of GDP growth of 2.9% based on the IGA monthly series. 12
Source: UTDT, OJF
0%
10%
20%
30%
40%
50%
60%
70%
80%
90%
Jul-16 Aug-16 Sep-16 Oct-16 Nov-16 Dec-16
Indice Lider - Diffusion index Indice Lider - Probability of expansion
-9.0-7.5-6.0-4.5-3.0-1.50.01.53.04.56.07.59.0
10.512.0
IGA SA

Source: Bloomberg
The arbitrage of misalignments and high current yield
Argentina | the Macri era of normalization
We had preferred the ARGENT’19 with potential rollover sponsorship from the BONAR’17
and Global’17 (@ $8.4bn redemptions compared to the $2.75bn outstanding with no
ANSES holdings and 70% held by non-residents). We also preferred the more defensive
Pars versus the 30Y benchmark through the risk aversion of last December.
We have since adopted a less cautious strategy on the view of a lower market beta
that prioritizes higher carry returns. We don’t expect capital gains for still a high
structural fiscal deficit; however the lower financing risk should lower market beta with
spreads resilient to the latest UST weakness, especially on the 5Y tenor.
The BUENOS curve 2Y5Y is quite steep @ 175bp (9.95% BUENOS’21/BUENOS’19) with
100bp premium over sovereign (5Y-10Y) that should compensate for the $1.5bn of
BUENOS supply risk. BUENOS should outperform the sovereign under the context of
demand for higher yielding carry returns (current yield of 8%-9%). The 5Y sector of the
curve is less vulnerable to supply risk or UST risk with a steep rolldown from the 420bp of
the 9.95% BUENOS’21 to the 338bp z-spread of the 10.875% BUENOS’21 for the 0.61
years difference in duration and still high current yield of 8.8%.
On the sovereign curve we highlight the inverted z-spread of the ARGENT’36 versus the
ARGENT’46 at -3bps that favors the shorter duration and the lower cash price of the
ARGENT’36. This resiliency in external debt should encourage an arbitrage of
misalignments with the EUR discounts and EUR ARGENT’2027 particularly cheap
with 127bp pickup in versus the PETBRA’2025 for 1 year increase in average
duration and estimated fair value closer to 4.89% YTM versus the current 6.16% YTM.
13
0
1
2
3
4
5
6
7
8
0 1 2 3 4 5 6 7 8 9 10 11 12Petrobras EUR curve ARGENT EUR bonds ARGENT USD curve
0
100
200
300
400
500
600
700
0 1 2 3 4 5 6 7 8 9 10 11 12 13
Argentina BUENOS and sovereign USD curve
0
20
40
60
80
100
120
140
160
180
200
Apr-16 Jun-16 Aug-16 Oct-16 Dec-16
BUENOS'21-ARGENT'21 BUENOS'27-ARGENT'27

Source: Bloomberg
The convergence or divergence trade with Brazil?
Argentina | the Macri era of normalization
There has been no recent debate about the Argentina/Brazil “convergence trade.” Argentina credit euphoria stalled on concerns about the slow
phase of fiscal adjustment. The debt ratios are low compared to GDP but are quite high compared to FX reserves. Argentina needs to rebuild
their FX reserve cushion to reduce its reliance on external capital. The slow economic adjustment suggests convergence to BB peers only
towards the end of the Macri administration in 2019. If we assume that Brazil is a stable BB credit with positive credit momentum and
Argentina is only slowly transitioning towards BB category, then it remains an opportunity to trade the range when reaching extremes.
This is not the same investment strategy of trading this cross credit differential when it reaches the wide end of the range on the passive view of a
stable BB/B credit premium.
We had recommended a long Brazil’45 against a short position in Argentina’46 (11/14) on the rationale of the relative vulnerability of Argentina to
trade and financial flows post elections as well as the weak technicals on the popular overweight in Argentina, de-leveraging trend across EM
and the aggressive debt issuance budgeted for next year. We recommend taking profits on reaching the extreme of the z-spread differential from
98bp on 11/14 to 155bp 12/1.
14
0
50
100
150
200
250
Jun-16 Jul-16 Aug-16 Sep-16 Oct-16 Nov-16 Dec-16 Jan-17
Argentina/Brazil 10Y z-spread Argentina/Brazil 30Y z-spread
300
350
400
450
500
550
600
Aug-16 Sep-16 Oct-16 Nov-16 Dec-16 Jan-17
Brazil 30Y z-spread Argentina 30Y z-spread

* THIS IS A PRODUCT OF THE SALES AND TRADING DESK AND NOT RESEARCH MATERIAL *
For Institutional Investors Only
DISCLAIMER: This material has been prepared by a sales and trading desk of Nomura Securities International, Inc. (“NSI”), and if applicable, with the contribution of one or more of its affiliates. It is made
available to you on a confidential basis by NSI for your sole use only. This is not a research report and commentary contained herein should not be considered research.
The information contained herein is based on sources that we believe to be reliable, but we do not represent that it is accurate or complete. It is not to be considered an offer to sell or solicitation of an offer
to buy the securities or other products discussed herein. All material herein is provided for informational purposes only, and is intended solely for your use and may not be quoted, circulated or otherwise
referred to without our express consent.
Any market commentary contained herein was prepared by sales and trading desk personnel. All projections, valuations and statistical analyses are provided to assist the recipient in the evaluation of the
matters described herein. They may be based on subjective assessments and assumptions and may use one among many methodologies that produce different results and, to the extent that they are based
on historical information, they should not be relied upon as an accurate prediction of future performance. All prices, yields and opinions expressed are indicative only and are subject to change without
notice. The trading desk generally make a market or generally deals as principal in the financial instruments mentioned herein or in related securities, options or other derivative instruments. The trading desk
may have accumulated a long or short position in the financial instruments or related derivatives products that are the subject of this material. Nomura also may have acted as an underwriter of such
securities or other products, and may currently be providing investment banking services to the issuers of such securities or products.
Opinions expressed are current opinions as of the date appearing on this material only and the information, including the opinions contained herein, are subject to change without notice, and may differ from,
or be inconsistent with the views of Nomura research analysts who publish research reports. The desk analysts from the sales and trading desks within NSI responsible for preparing this material have
received compensation based on various factors including NSI’s total revenues, a portion of which is generated by its sales and trading desks.
No part of this material may be (i) copied, photocopied, or duplicated in any form, by any means, or (ii) redistributed without our prior express consent. Further information on any of the securities mentioned
herein may be obtained upon request. If this publication has been distributed by electronic transmission, such as e-mail, then such transmission cannot be guaranteed to be secure or error-free as
information could be intercepted, corrupted, lost, destroyed, arrive late or incomplete, or contain viruses. The sender does not accept liability for any errors or omissions in the contents of this material or any
other damage that which may arise as a result of electronic transmission. If verification is required, please request a hard-copy version of this material.
Disclaimers