Connecticut Competitiveness: Creating a State Economic ... Files...• Competitiveness is the...
45
1 Copyright 2011 © Professor Michael E. Porter 2011 State Competitiveness – Rich Bryden Connecticut Competitiveness: Creating a State Economic Strategy For further material on regional competitiveness and clusters: www.isc.hbs.edu/econ-clusters.htm For state economic profiles: www.isc.hbs.edu/econ-statesregions.htm Professor Michael E. Porter Harvard Business School September 2011
Transcript of Connecticut Competitiveness: Creating a State Economic ... Files...• Competitiveness is the...

1 Copyright 2011 © Professor Michael E. Porter
2011 State Competitiveness – Rich Bryden
Connecticut Competitiveness:
Creating a State Economic Strategy
For further material on regional competitiveness and clusters: www.isc.hbs.edu/econ-clusters.htm
For state economic profiles: www.isc.hbs.edu/econ-statesregions.htm
Professor Michael E. Porter Harvard Business School
September 2011

2 Copyright 2011 © Professor Michael E. Porter
2011 State Competitiveness – Rich Bryden
The Economic Challenge for Governors in 2011
Enhancing State
Competitiveness
Achieving Fiscal Stability

3 Copyright 2011 © Professor Michael E. Porter 2011 State Competitiveness – Rich Bryden
What is Competitiveness?
• Competitiveness is the productivity with which a state utilizes its human, capital, and natural endowments to create value
• Productivity determines wages, jobs, and the standard of living
• It is not what fields a state competes in that determines its prosperity, but how productively it competes
4 Copyright 2011 © Professor Michael E. Porter 2011 State Competitiveness – Rich Bryden
Where Does Productivity Come From?
Businesses and government play different but interrelated roles in creating a productive economy
• Only businesses can create jobs and wealth
• States compete to offer the most productive environment for business

5 Copyright 2011 © Professor Michael E. Porter 2011 State Competitiveness – Rich Bryden
Agenda
1. How is your state doing?
2. Why?
3. Where to go from here?
State Performance Scorecard
Explaining your state’s performance, strengths, and weaknesses Action Steps

6 2011 – State Competitiveness – Rich Bryden Copyright © 2011 Professor Michael E. Porter
Connecticut Performance Scorecard
• Financial Services (9)
• Education and Knowledge Creation (14)
• Aerospace Vehicles and Defense (6)
• Analytical Instruments (16)
• Aerospace Engines (2)
Prosperity GDP per Capita, 1999-2009
Innovation Patents per Employee, 1999-2009
Cluster Strength Employment in Strong Clusters, 1998-2009
Leading Clusters by employment size, 2009
(national rank)
Position in 1998-1999
Trend
28
20
1-10
21-30
31-40
11-20 41-50
State Rank
Current Position
8
16
4
15
18
34
4
2 2
3
Wages Average Private Wage, 1998-2009
-1
+0
-4
-1
New Business Formation Traded Cluster Establishment Growth,
1998-2000 and 2007-2009
23 41 43 +2
Labor Mobilization Proportion of Working Age Population
in the Workforce, 1999-2010
3 14 29 +15
Job Creation Private Employment Growth,
1998-2000 and 2007-2009
10 21 43 +22
Labor Productivity GDP per Worker, 1999-2009 33 4 3 -1

7 Copyright 2011 © Professor Michael E. Porter 2011 State Competitiveness – Rich Bryden
$30,000
$35,000
$40,000
$45,000
$50,000
$55,000
$60,000
$65,000
$70,000
-1.0% -0.5% 0.0% 0.5% 1.0% 1.5% 2.0% 2.5% 3.0% 3.5% 4.0%
U.S. GDP per
Capita: $46,093
High and rising
prosperity
versus U.S.
Comparative State Prosperity Performance 1999 - 2009
Source: Bureau of Economic Analysis. Note: Growth rate is calculated as compound annual growth rate.
U.S. GDP per Capita
Real Growth Rate: 0.86%
Real Growth in Gross Domestic Product per Capita, 1999 to 2009
Gro
ss
Do
mes
tic P
rod
uct
pe
r C
ap
ita,
20
09
Low and declining
versus U.S.
Low but rising
versus U.S.
Illinois
Wyoming
North Dakota
South Dakota
Delaware
Alaska
Connecticut
Wisconsin
Nevada
Arizona
New York New Jersey Massachusetts
California
West Virginia
Mississippi
Vermont Oklahoma
Iowa Nebraska
North Carolina
Georgia Florida
Michigan
Idaho South Carolina
Texas
Oregon
Rhode Island
Louisiana
Pennsylvania Kansas
New Hampshire
Arkansas
Maine
Colorado
Washington
Virginia
Minnesota
Hawaii
Maryland
Alabama Montana Kentucky
New Mexico
Missouri Ohio
Indiana Utah
Tennessee
High but declining
versus U.S.

8 2011 State Competitiveness – Rich Bryden Copyright © 2011 Professor Michael E. Porter
Comparative State Labor Mobilization Performance 1999-2010
Change in Labor Force
Participation Rate: -2.4%
U.S. Labor Force
Participation Rate: 64.7%
Change in Proportion of Working Age Population in the Workforce, 1999-2010
Pro
po
rtio
n o
f W
ork
ing
Ag
e P
op
ula
tio
n i
n t
he W
ork
forc
e,
2010
High Labor Force Participation and
Participation rising versus U.S.
High but declining
versus U.S.
Low and declining
versus U.S. Low but rising
versus U.S.
Notes: Source BLS.
Alabama
Alaska
Arizona
Arkansas
California
Colorado Connecticut
Delaware
Florida Georgia Hawaii
Idaho
Illinois
Indiana
Iowa
Kansas
Kentucky
Louisiana
Maine
Maryland
Massachusetts
Michigan
Minnesota
Mississippi
Missouri
Montana
Nebraska
Nevada
New Hampshire
New Jersey
New Mexico New York
North Carolina
North Dakota
Ohio
Oklahoma
Oregon
Pennsylvania
Rhode Island
South Carolina
South Dakota
Tennessee
Texas
Utah
Vermont
Virginia
Washington
West Virginia
Wisconsin Wyoming
50%
55%
60%
65%
70%
75%
-7% -6% -5% -4% -3% -2% -1% 0% 1% 2%
9 2011 State Competitiveness – Rich Bryden Copyright © 2011 Professor Michael E. Porter
$60,000
$70,000
$80,000
$90,000
$100,000
$110,000
$120,000
$130,000
$140,000
$150,000
-0.5% 0.0% 0.5% 1.0% 1.5% 2.0% 2.5% 3.0% 3.5%
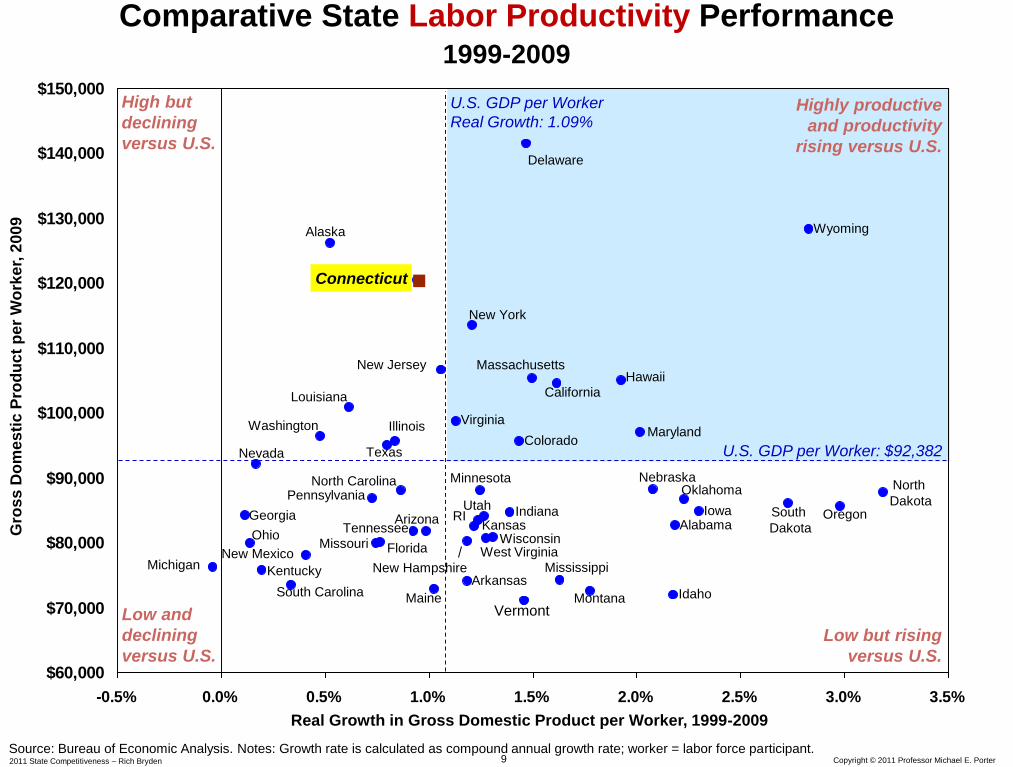
Comparative State Labor Productivity Performance 1999-2009
Real Growth in Gross Domestic Product per Worker, 1999-2009
Gro
ss
Do
mes
tic P
rod
uct
pe
r W
ork
er,
20
09
Highly productive
and productivity
rising versus U.S.
High but
declining
versus U.S.
Low and
declining
versus U.S.
Low but rising
versus U.S.
U.S. GDP per Worker
Real Growth: 1.09%
U.S. GDP per Worker: $92,382
Illinois
Wyoming
North
Dakota South
Dakota
Delaware
Alaska
Connecticut
Wisconsin
Nevada
Arizona
New York
New Jersey Massachusetts
California
West Virginia Mississippi
Vermont
Oklahoma
Iowa
Nebraska North Carolina
Georgia
Florida
Michigan
Idaho South Carolina
Texas
Oregon RI
Louisiana
Pennsylvania
Kansas
New Hampshire Arkansas
Maine
Colorado Washington Virginia
Minnesota
Hawaii
Maryland
Alabama
Montana
Kentucky
New Mexico Missouri
Ohio
Indiana Utah
Tennessee
Source: Bureau of Economic Analysis. Notes: Growth rate is calculated as compound annual growth rate; worker = labor force participant.

10 2011 State Competitiveness – Rich Bryden Copyright © 2011 Professor Michael E. Porter
0
2
4
6
8
10
12
14
-5% -4% -3% -2% -1% 0% 1% 2% 3%
Comparative State Innovation Performance 1999 - 2009
Growth Rate of Patents per 10,000 Workers, 1999 to 2009
Pate
nts
per
10,0
00 W
ork
ers
, 2009
Source: USPTO utility patents, Bureau of Labor Statistics. Note: Growth rate calculated as compound annual growth rate (CAGR).
U.S. average Growth Rate
of Patenting: -0.30%
Arkansas (-6.9%, 0.76) Louisiana (-6.0%, 1.34)
Montana (-5.7%, 1.58)
South Dakota
West Virginia
Alaska
Idaho
Pennsylvania
Mississippi
Washington (+8.0%, 13.53)
Oregon (+4.9%, 10.31)
New Jersey
Ohio
Delaware
Vermont
California
Massachusetts
North Carolina
North Dakota Wyoming
Georgia
Nebraska Maine
Utah
Michigan
Minnesota
Colorado
New Hampshire
Connecticut
Wisconsin
Rhode Island
Kansas
Nevada Virginia
Iowa
Texas Arizona
New York
Illinois
Maryland
Indiana
New Mexico
Florida
Tennessee
Missouri
South Carolina Kentucky
Alabama
Hawaii
Oklahoma
U.S. average Patents per
10,000 Employees: 5.96
High and improving
innovation rate versus U.S.
High and declining
innovation
Low and declining innovation
Low and improving
innovation
= 1000 patents in 2009
= 500 patents in 2009

11 Copyright 2011 © Professor Michael E. Porter 2011 – State Competitiveness – Rich Bryden
Why?
What Drives State Productivity?
3. Policy
Coordination
among Multiple
Levels of
Geography/
Government
1. Quality of the
Overall Business
Environment
2. Cluster
Development

12 Copyright 2011 © Professor Michael E. Porter 2011 – State Competitiveness – Rich Bryden
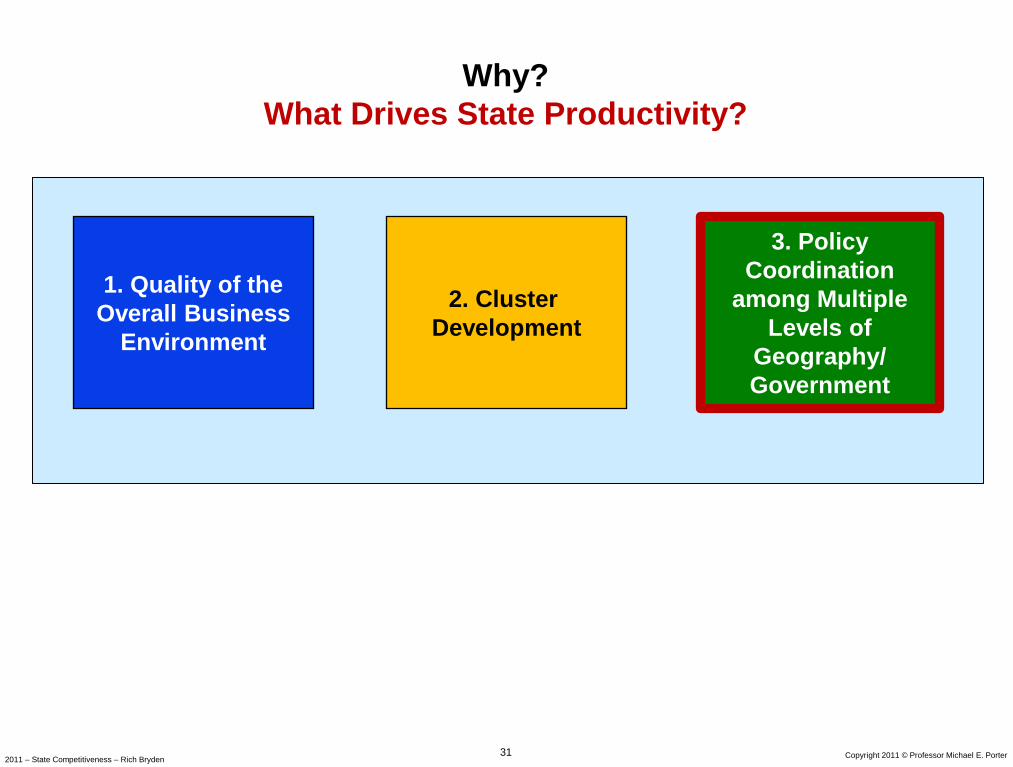
Why?
What Drives State Productivity?
3. Policy
Coordination
among Multiple
Levels of
Geography/
Government
1. Quality of the
Overall Business
Environment
2. Cluster
Development

13 Copyright 2011 © Professor Michael E. Porter 2011 – State Competitiveness – Rich Bryden
Quality of the Overall Business Environment
Context for Firm
Strategy and Rivalry
Related and Supporting Industries
Factor (Input)
Conditions
Demand Conditions
Sophisticated and demanding local
needs and customers – e.g., Strict quality, safety, and
environmental standards
– Consumer protection laws
– Government procurement of
advanced technology
– Early demand for products and
services
Rules and incentives that encourage
local competition, investment and
productivity – e.g., tax policy that encourages
investment and R&D
– Flexible labor policies
– Intellectual property protection
– Antitrust enforcement
Access to high quality business
inputs – Human resources
– Capital access
– Physical infrastructure
– Administrative processes (e.g.,
permitting, regulatory efficiency)
– Scientific and technological
infrastructure
Local availability of suppliers and
supporting industries
• Many things matter for competitiveness
• Economic development is the process of improving the business environment to enable companies to compete in increasingly sophisticated ways

14 Copyright 2011 © Professor Michael E. Porter 2011 – State Competitiveness – Rich Bryden
Improving the Business Environment
Common Action Items
1. Simplify and speed up regulation and permitting
2. Reduce unnecessary costs of doing business
3. Establish training programs that are aligned with the needs of the
state’s businesses
4. Focus infrastructure investments on the most leveraged areas for
productivity and economic growth
5. Design all policies to support emerging growth companies
6. Protect and enhance the state’s higher education and research
institutions
7. Relentlessly improve the public education system, the essential
foundation for productivity in the long run

15 Copyright 2011 © Professor Michael E. Porter 2011 – State Competitiveness – Rich Bryden
Why?
What Drives State Productivity?
3. Policy
Coordination
among Multiple
Levels of
Geography/
Government
1. Quality of the
Overall Business
Environment
2. Cluster
Development
16 Copyright 2011 © Professor Michael E. Porter 2011 – State Competitiveness – Rich Bryden
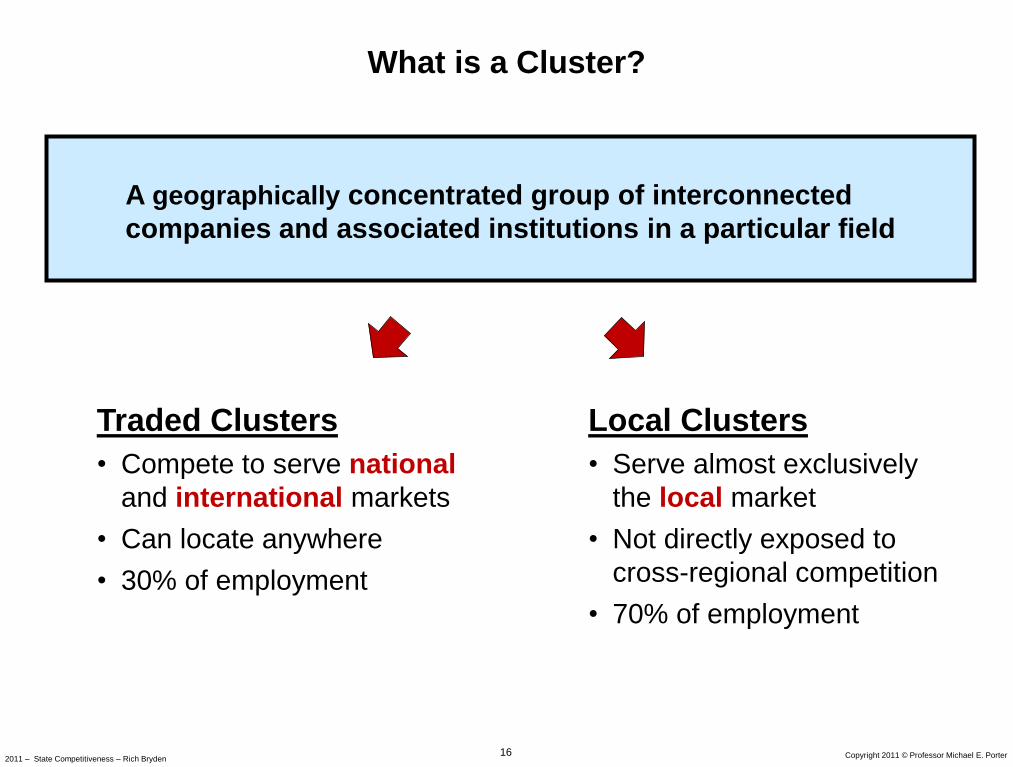
What is a Cluster?
A geographically concentrated group of interconnected
companies and associated institutions in a particular field
Traded Clusters
• Compete to serve national
and international markets
• Can locate anywhere
• 30% of employment
Local Clusters
• Serve almost exclusively
the local market
• Not directly exposed to
cross-regional competition
• 70% of employment
17 Copyright 2011 © Professor Michael E. Porter
2011 State Competitiveness – Rich Bryden
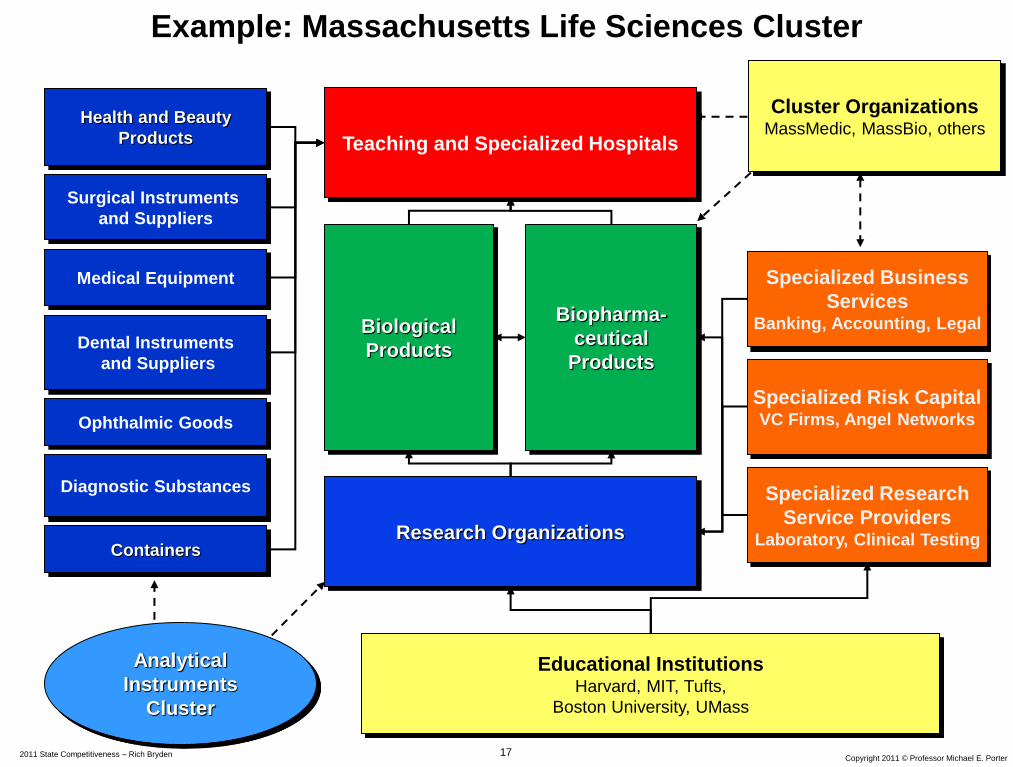
Research Organizations
Biological
Products
Specialized Risk Capital VC Firms, Angel Networks
Biopharma-
ceutical
Products
Specialized Business
Services Banking, Accounting, Legal
Specialized Research
Service Providers Laboratory, Clinical Testing
Dental Instruments
and Suppliers
Surgical Instruments
and Suppliers
Diagnostic Substances
Containers
Medical Equipment
Ophthalmic Goods
Health and Beauty
Products Teaching and Specialized Hospitals
Educational Institutions Harvard, MIT, Tufts,
Boston University, UMass
Cluster Organizations MassMedic, MassBio, others
Example: Massachusetts Life Sciences Cluster
Analytical
Instruments
Cluster
18 Copyright 2011 © Professor Michael E. Porter
2011 State Competitiveness – Rich Bryden
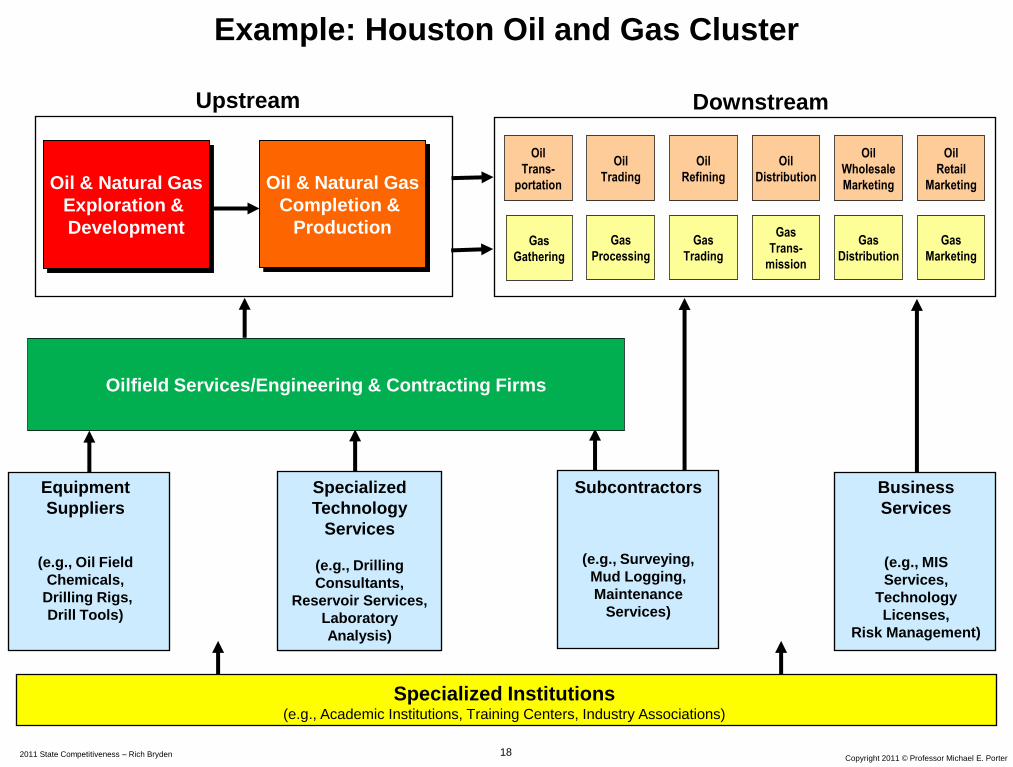
Equipment
Suppliers
(e.g., Oil Field
Chemicals,
Drilling Rigs,
Drill Tools)
Specialized
Technology
Services
(e.g., Drilling
Consultants,
Reservoir Services,
Laboratory
Analysis)
Subcontractors
(e.g., Surveying,
Mud Logging,
Maintenance
Services)
Business
Services
(e.g., MIS
Services,
Technology
Licenses,
Risk Management)
Specialized Institutions (e.g., Academic Institutions, Training Centers, Industry Associations)
Oil
Trans-
portation
Oil
Trading
Oil
Refining
Oil
Distribution
Oil
Wholesale
Marketing
Oil
Retail
Marketing
Gas
Gathering
Gas
Processing
Gas
Trading
Gas
Trans-
mission
Gas
Distribution
Gas
Marketing
Example: Houston Oil and Gas Cluster
Oil & Natural Gas
Completion &
Production
Oil & Natural Gas
Exploration &
Development
Upstream Downstream
Oilfield Services/Engineering & Contracting Firms

19 Copyright 2011 © Professor Michael E. Porter
2011 State Competitiveness – Rich Bryden
Strong Clusters Drive Regional Performace
Source: Porter/Stern/Delgado (2010), Porter (2003)
• Specialization in strong clusters
• Breadth of industries within each
cluster
• Strength in related clusters
• Presence of a region’s clusters in
neighboring regions
• Job growth
• Higher wages
• Higher patenting rates
• Greater new business
formation, growth and survival
On average, cluster strength is much more important (78.1%) than cluster mix
(21.9%) in driving regional performance in the U.S.
20 Copyright 2011 © Professor Michael E. Porter 2011 – State Competitiveness – Rich Bryden
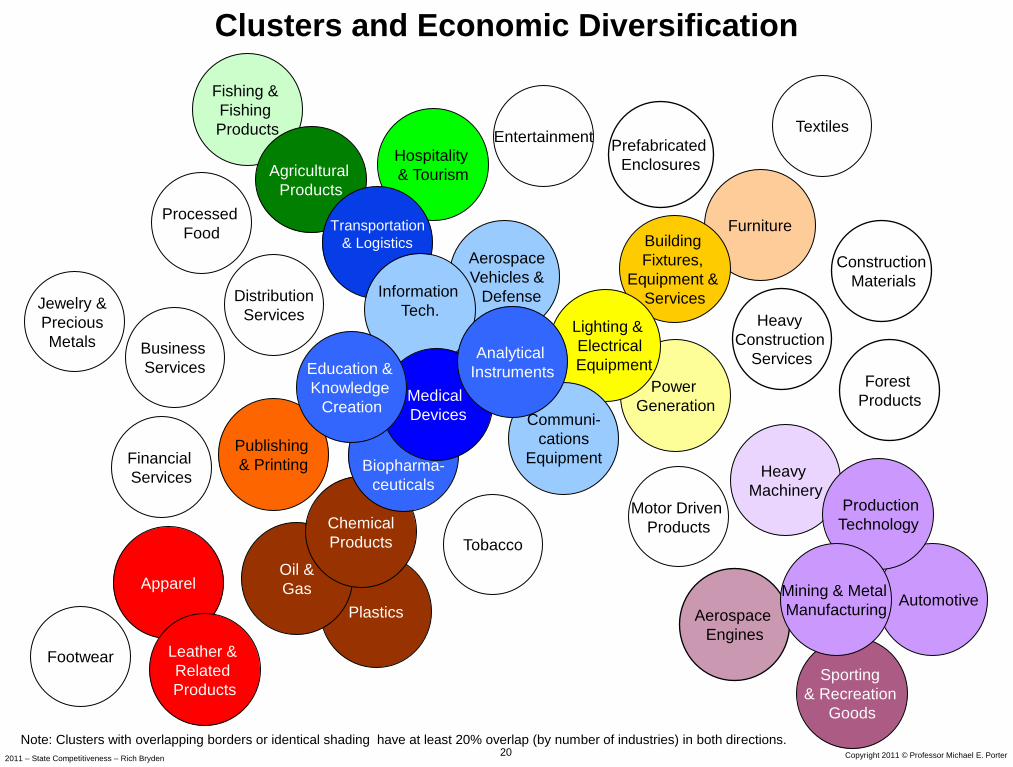
Clusters and Economic Diversification
Note: Clusters with overlapping borders or identical shading have at least 20% overlap (by number of industries) in both directions.
Furniture Building
Fixtures,
Equipment &
Services
Fishing &
Fishing
Products
Hospitality
& Tourism Agricultural
Products
Transportation
& Logistics
Plastics
Oil &
Gas
Chemical
Products
Biopharma-
ceuticals
Power
Generation
Aerospace
Vehicles &
Defense
Lighting &
Electrical
Equipment
Financial
Services
Publishing
& Printing
Entertainment
Information
Tech.
Communi-
cations
Equipment
Aerospace
Engines
Business
Services
Distribution
Services
Forest
Products
Heavy
Construction
Services
Construction
Materials
Prefabricated
Enclosures
Heavy
Machinery
Sporting
& Recreation
Goods
Automotive
Production
Technology Motor Driven
Products
Mining & Metal
Manufacturing
Jewelry &
Precious
Metals
Textiles
Footwear
Processed
Food
Tobacco
Medical
Devices
Analytical
Instruments Education &
Knowledge
Creation
Apparel
Leather &
Related
Products

21 Copyright 2011 © Professor Michael E. Porter 2011 – State Competitiveness – Rich Bryden
The Evolution of Regional Economies San Diego
U.S.
Military
Communications
Equipment
Sporting
Equipment
Analytical Instruments
Power Generation
Aerospace Vehicles
and Defense
Transportation
and Logistics
Information Technology
1910 1930 1950 1990 1970
Bioscience
Research
Centers
Climate
and
Geography
Hospitality and Tourism
Medical Devices
Biotech / Pharmaceuticals
Education and
Knowledge Creation

22 2011 – State Competitiveness – Rich Bryden Copyright © 2011 Professor Michael E. Porter
0.0%
2.0%
4.0%
6.0%
8.0%
10.0%
12.0%
-8.0% -6.0% -4.0% -2.0% 0.0% 2.0%
Change in Connecticut share of National Employment, 1998 to 2009
Co
nn
ec
tic
ut
na
tio
na
l em
plo
ym
en
t sh
are
, 2009
Employees 10,800 =
Traded Cluster Composition of the Connecticut Economy
Overall change in the Connecticut Share of
US Traded Employment: -0.14%
Source: Prof. Michael E. Porter, Cluster Mapping Project, Institute for Strategy and Competitiveness, Harvard Business School; Richard Bryden, Project Director.
Connecticut Overall Share of US
Traded Employment: 1.43%
Added Jobs
Lost Jobs
Employment
1998-2008
Biopharmaceuticals
Aerospace Engines
Entertainment
Aerospace Vehicles
and Defense
Financial Services
Lighting and
Electrical Equipment
23 2011 – State Competitiveness – Rich Bryden Copyright © 2011 Professor Michael E. Porter
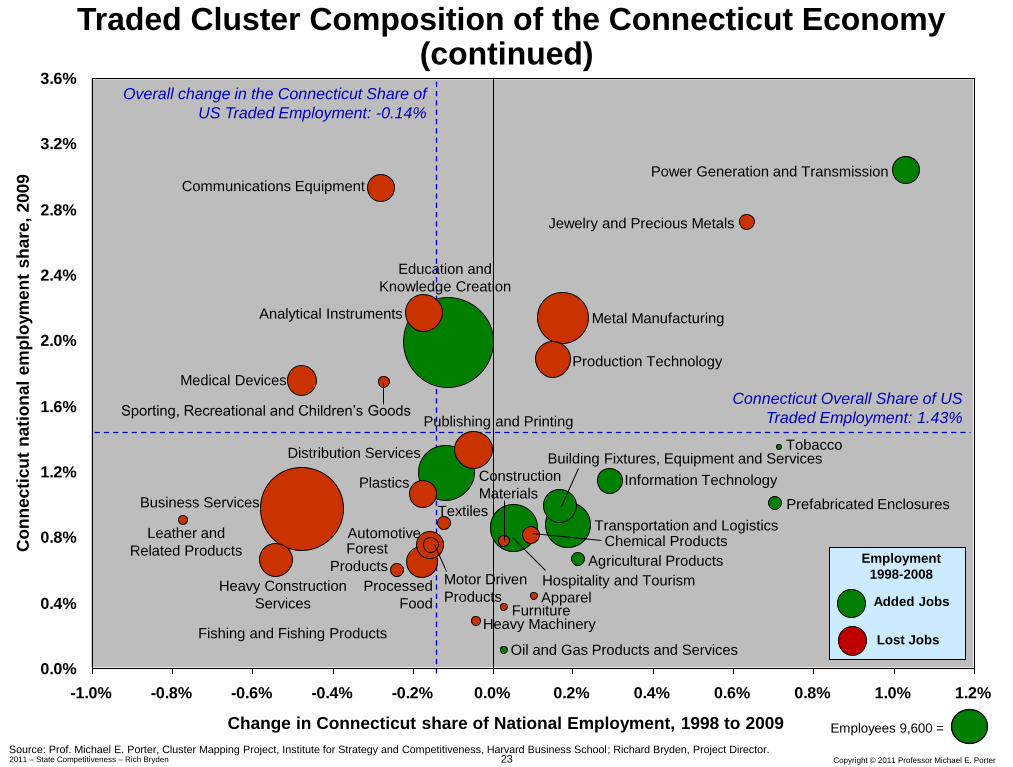
0.0%
0.4%
0.8%
1.2%
1.6%
2.0%
2.4%
2.8%
3.2%
3.6%
-1.0% -0.8% -0.6% -0.4% -0.2% 0.0% 0.2% 0.4% 0.6% 0.8% 1.0% 1.2%
Change in Connecticut share of National Employment, 1998 to 2009
Co
nn
ec
tic
ut
na
tio
na
l em
plo
ym
en
t sh
are
, 2009
Employees 9,600 =
Traded Cluster Composition of the Connecticut Economy (continued)
Overall change in the Connecticut Share of
US Traded Employment: -0.14%
Source: Prof. Michael E. Porter, Cluster Mapping Project, Institute for Strategy and Competitiveness, Harvard Business School; Richard Bryden, Project Director.
Connecticut Overall Share of US
Traded Employment: 1.43%
Added Jobs
Lost Jobs
Employment
1998-2008
Fishing and Fishing Products
Heavy Construction
Services
Leather and
Related Products
Medical Devices
Business Services
Communications Equipment
Sporting, Recreational and Children’s Goods
Forest
Products
Plastics
Processed
Food
Automotive
Analytical Instruments
Textiles
Motor Driven
Products
Distribution Services
Education and
Knowledge Creation
Heavy Machinery
Publishing and Printing
Furniture
Construction
Materials
Oil and Gas Products and Services
Hospitality and Tourism Apparel
Chemical Products
Production Technology
Information Technology
Metal Manufacturing
Transportation and Logistics
Agricultural Products
Building Fixtures, Equipment and Services
Jewelry and Precious Metals
Tobacco
Prefabricated Enclosures
Power Generation and Transmission

24 2011 State Competitiveness – Rich Bryden Copyright © 2011 Professor Michael E. Porter
Connecticut Job Creation in Traded Clusters 1998 to 2009
Jo
b C
reati
on
, 1998 t
o 2
009
-20,000
-15,000
-10,000
-5,000
0
5,000
10,000
15,000
20,000
25,000E
du
ca
tio
n a
nd
Kn
ow
led
ge
Cre
atio
n
Fin
an
cia
l S
erv
ice
s
Tra
nsp
ort
atio
n a
nd
Lo
gis
tics
Dis
trib
utio
n S
erv
ice
s
Ho
sp
ita
lity
an
d T
ou
rism
Info
rma
tio
n T
ech
no
log
y
Po
we
r G
en
era
tio
n a
nd
Tra
nsm
issio
n
Pre
fab
rica
ted
En
clo
su
res
Ag
ricu
ltu
ral P
rod
ucts
Oil a
nd
Ga
s P
rod
ucts
an
d S
erv
ice
s
To
ba
cco
Bu
ild
ing
Fix
ture
s, E
qu
ipm
en
t a
nd
Se
rvic
es
Fis
hin
g a
nd
Fis
hin
g P
rod
ucts
He
avy M
ach
ine
ry
Co
nstr
uctio
n M
ate
ria
ls
Je
we
lry a
nd
Pre
cio
us M
eta
ls
Ch
em
ica
l P
rod
ucts
Ae
rosp
ace
Ve
hic
les a
nd
De
fen
se
Fu
rnitu
re
Me
dic
al D
evic
es
Sp
ort
ing
, R
ecre
atio
na
l a
nd
Ch
ild
ren
's G
oo
ds
Le
ath
er
an
d R
ela
ted
Pro
du
cts
Mo
tor
Dri
ve
n P
rod
ucts
Ap
pa
rel
Fo
rest P
rod
ucts
Pu
blish
ing
an
d P
rin
tin
g
Pro
du
ctio
n T
ech
no
log
y
Lig
htin
g a
nd
Ele
ctr
ica
l E
qu
ipm
en
t
Pro
ce
sse
d F
oo
d
Te
xtile
s
Pla
stics
Bu
sin
ess S
erv
ice
s
An
aly
tica
l In
str
um
en
ts
Au
tom
otive
Co
mm
un
ica
tio
ns E
qu
ipm
en
t
Me
tal M
an
ufa
ctu
rin
g
Bio
ph
arm
ace
utica
ls
He
avy C
on
str
uctio
n S
erv
ice
s
Ae
rosp
ace
En
gin
es
En
tert
ain
me
nt
Fo
otw
ea
r
Net traded job creation,
1998 to 2009:
-59,287
Source: Prof. Michael E. Porter, Cluster Mapping Project, Institute for Strategy and Competitiveness, Harvard Business School; Richard Bryden, Project Director. * Percent change in national benchmark times starting regional employment. Overall traded job creation in the state, if it matched national benchmarks, would be -7,727
Indicates expected job creation
given national cluster growth.*

25 2011 – State Competitiveness – Rich Bryden Copyright © 2011 Professor Michael E. Porter
$0 $25,000 $50,000 $75,000 $100,000 $125,000 $150,000 $175,000 $200,000
ApparelFootwear
Fishing and Fishing ProductsPrefabricated Enclosures
TobaccoAerospace Vehicles and Defense
Power Generation and TransmissionHospitality and Tourism
Sporting, Recreational and Children's GoodsEntertainment
Jewelry and Precious MetalsFurnitureTextiles
Processed FoodConstruction Materials
PlasticsLeather and Related Products
Building Fixtures, Equipment and ServicesLighting and Electrical Equipment
Metal ManufacturingHeavy Machinery
Production TechnologyAutomotive
Transportation and LogisticsMotor Driven Products
BiopharmaceuticalsCommunications EquipmentHeavy Construction Services
Medical DevicesPublishing and Printing
Agricultural ProductsEducation and Knowledge Creation
Analytical InstrumentsAerospace Engines
Forest ProductsChemical ProductsBusiness Services
Distribution ServicesInformation Technology
Oil and Gas Products and ServicesFinancial Services
Connecticut Wages in Traded Clusters vs. National Benchmarks
Wages, 2009
Connecticut average
traded wage: $74,918
Source: Prof. Michael E. Porter, Cluster Mapping Project, Institute for Strategy and Competitiveness, Harvard Business School; Richard Bryden, Project Director.
U.S. average
traded wage: $56,906
l Indicates average
national wage in
the traded cluster
26 2011 - State Competitiveness – Rich Bryden Copyright © 2011 Professor Michael E. Porter
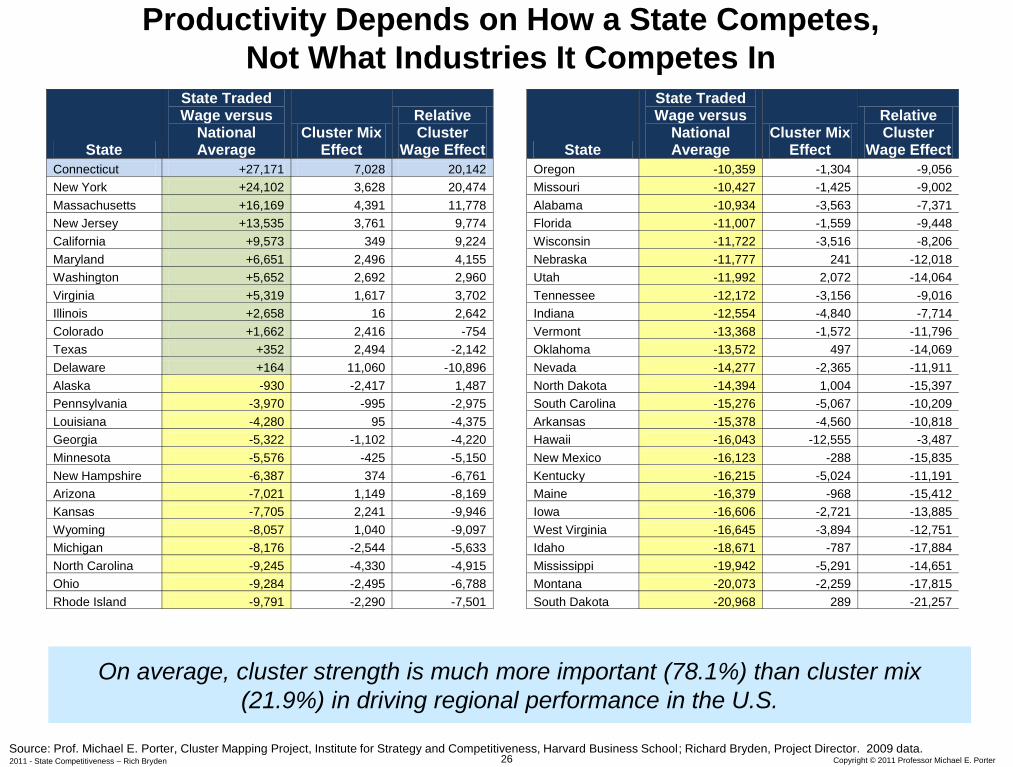
State
State Traded Wage versus
National Average
Cluster Mix Effect
Relative Cluster
Wage Effect State
State Traded Wage versus
National Average
Cluster Mix Effect
Relative Cluster
Wage Effect
Connecticut +27,171 7,028 20,142 Oregon -10,359 -1,304 -9,056
New York +24,102 3,628 20,474 Missouri -10,427 -1,425 -9,002
Massachusetts +16,169 4,391 11,778 Alabama -10,934 -3,563 -7,371
New Jersey +13,535 3,761 9,774 Florida -11,007 -1,559 -9,448
California +9,573 349 9,224 Wisconsin -11,722 -3,516 -8,206
Maryland +6,651 2,496 4,155 Nebraska -11,777 241 -12,018
Washington +5,652 2,692 2,960 Utah -11,992 2,072 -14,064
Virginia +5,319 1,617 3,702 Tennessee -12,172 -3,156 -9,016
Illinois +2,658 16 2,642 Indiana -12,554 -4,840 -7,714
Colorado +1,662 2,416 -754 Vermont -13,368 -1,572 -11,796
Texas +352 2,494 -2,142 Oklahoma -13,572 497 -14,069
Delaware +164 11,060 -10,896 Nevada -14,277 -2,365 -11,911
Alaska -930 -2,417 1,487 North Dakota -14,394 1,004 -15,397
Pennsylvania -3,970 -995 -2,975 South Carolina -15,276 -5,067 -10,209
Louisiana -4,280 95 -4,375 Arkansas -15,378 -4,560 -10,818
Georgia -5,322 -1,102 -4,220 Hawaii -16,043 -12,555 -3,487
Minnesota -5,576 -425 -5,150 New Mexico -16,123 -288 -15,835
New Hampshire -6,387 374 -6,761 Kentucky -16,215 -5,024 -11,191
Arizona -7,021 1,149 -8,169 Maine -16,379 -968 -15,412
Kansas -7,705 2,241 -9,946 Iowa -16,606 -2,721 -13,885
Wyoming -8,057 1,040 -9,097 West Virginia -16,645 -3,894 -12,751
Michigan -8,176 -2,544 -5,633 Idaho -18,671 -787 -17,884
North Carolina -9,245 -4,330 -4,915 Mississippi -19,942 -5,291 -14,651
Ohio -9,284 -2,495 -6,788 Montana -20,073 -2,259 -17,815
Rhode Island -9,791 -2,290 -7,501 South Dakota -20,968 289 -21,257
Productivity Depends on How a State Competes,
Not What Industries It Competes In
On average, cluster strength is much more important (78.1%) than cluster mix
(21.9%) in driving regional performance in the U.S.
Source: Prof. Michael E. Porter, Cluster Mapping Project, Institute for Strategy and Competitiveness, Harvard Business School; Richard Bryden, Project Director. 2009 data.

27 2011 – State Competitiveness – Rich Bryden Copyright © 2011 Professor Michael E. Porter
Furniture Building
Fixtures,
Equipment &
Services
Fishing &
Fishing
Products
Hospitality
& Tourism Agricultural
Products
Transportation
& Logistics
Connecticut Cluster Portfolio, 2009
Plastics
Oil &
Gas
Chemical
Products
Biopharma-
ceuticals
Power
Generation &
Transmission
Aerospace
Vehicles &
Defense
Lighting &
Electrical
Equipment
Financial
Services
Publishing
& Printing
Entertainment
Information
Tech.
Communi
cations
Equipment
Aerospace
Engines
Business
Services
Distribution
Services
Forest
Products
Heavy
Construction
Services
Construction
Materials
Prefabricated
Enclosures
Heavy
Machinery
Sporting
& Recreation
Goods
Automotive
Production
Technology Motor Driven
Products
Metal
Manufacturing
Apparel
Leather &
Related
Products
Jewelry &
Precious
Metals
Textiles
Footwear
Processed
Food
Tobacco
Medical
Devices
Analytical
Instruments Education &
Knowledge
Creation
LQ > 4
LQ > 2
LQ > 1.
LQ, or Location Quotient, measures the state’s share in cluster employment relative to its overall share of U.S. employment.
An LQ > 1 indicates an above average employment share in a cluster.

28 2011 – State Competitiveness – Rich Bryden Copyright © 2011 Professor Michael E. Porter
Connecticut Performance Scorecard
• Financial Services (9)
• Education and Knowledge Creation (14)
• Aerospace Vehicles and Defense (6)
• Analytical Instruments (16)
• Aerospace Engines (2)
Prosperity GDP per Capita, 1999-2009
Innovation Patents per Employee, 1999-2009
Cluster Strength Employment in Strong Clusters, 1998-2009
Leading Clusters by employment size, 2009
(national rank)
Position in 1998-1999
Trend
28
20
1-10
21-30
31-40
11-20 41-50
State Rank
Current Position
8
16
4
15
18
34
4
2 2
3
Wages Average Private Wage, 1998-2009
-1
+0
-4
-1
New Business Formation Traded Cluster Establishment Growth,
1998-2000 and 2007-2009
23 41 43 +2
Labor Mobilization Proportion of Working Age Population
in the Workforce, 1999-2010
3 14 29 +15
Job Creation Private Employment Growth,
1998-2000 and 2007-2009
10 21 43 +22
Labor Productivity GDP per Worker, 1999-2009 33 4 3 -1
29 Copyright 2011 © Professor Michael E. Porter 2011 – State Competitiveness – Rich Bryden
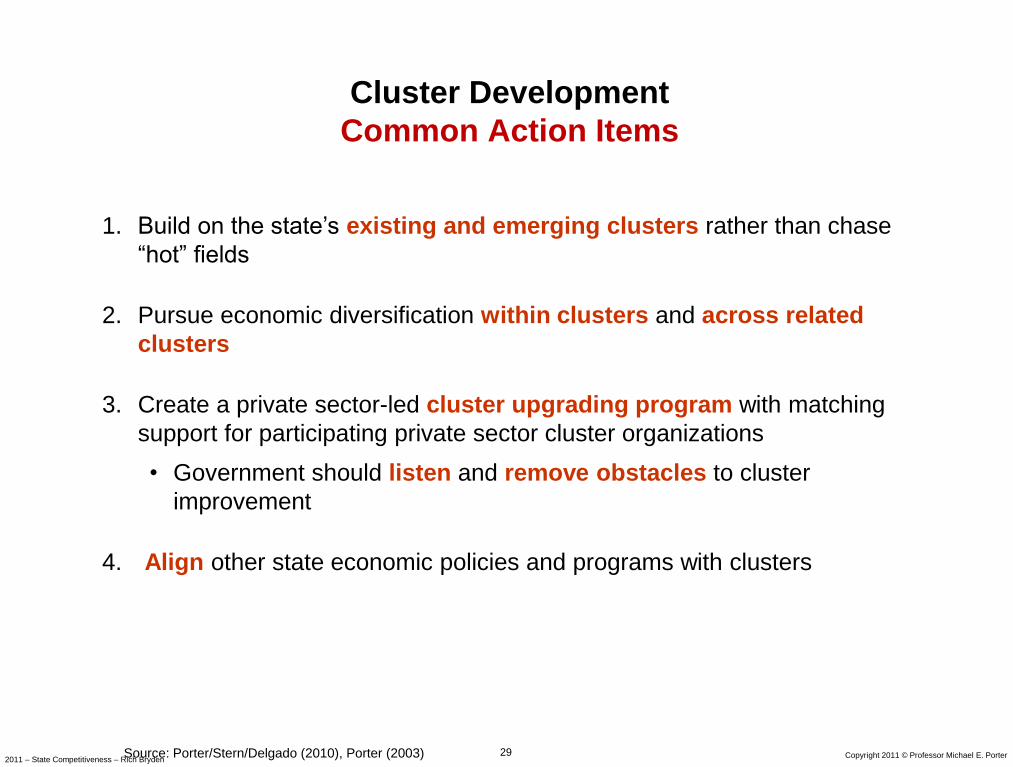
Cluster Development
Common Action Items
Source: Porter/Stern/Delgado (2010), Porter (2003)
1. Build on the state’s existing and emerging clusters rather than chase
“hot” fields
2. Pursue economic diversification within clusters and across related
clusters
3. Create a private sector-led cluster upgrading program with matching
support for participating private sector cluster organizations
• Government should listen and remove obstacles to cluster
improvement
4. Align other state economic policies and programs with clusters

30 Copyright 2011 © Professor Michael E. Porter 2011 – State Competitiveness – Rich Bryden
Aligning Economic Policy and Clusters
Specialized Physical
Infrastructure
Natural Resource
Protection
Environmental Improvement
Science and Technology
Investments
(e.g., centers, university
departments)
Education and Workforce Training Business Attraction
Export Promotion
• Clusters provide a framework for organizing the implementation of many
public policies and public investments to achieve greater effectiveness
Standard Setting / Certification
Organizations
Clusters
31 Copyright 2011 © Professor Michael E. Porter 2011 – State Competitiveness – Rich Bryden
Why?
What Drives State Productivity?
3. Policy
Coordination
among Multiple
Levels of
Geography/
Government
1. Quality of the
Overall Business
Environment
2. Cluster
Development
32 Copyright 2011 © Professor Michael E. Porter
2011 State Competitiveness – Rich Bryden
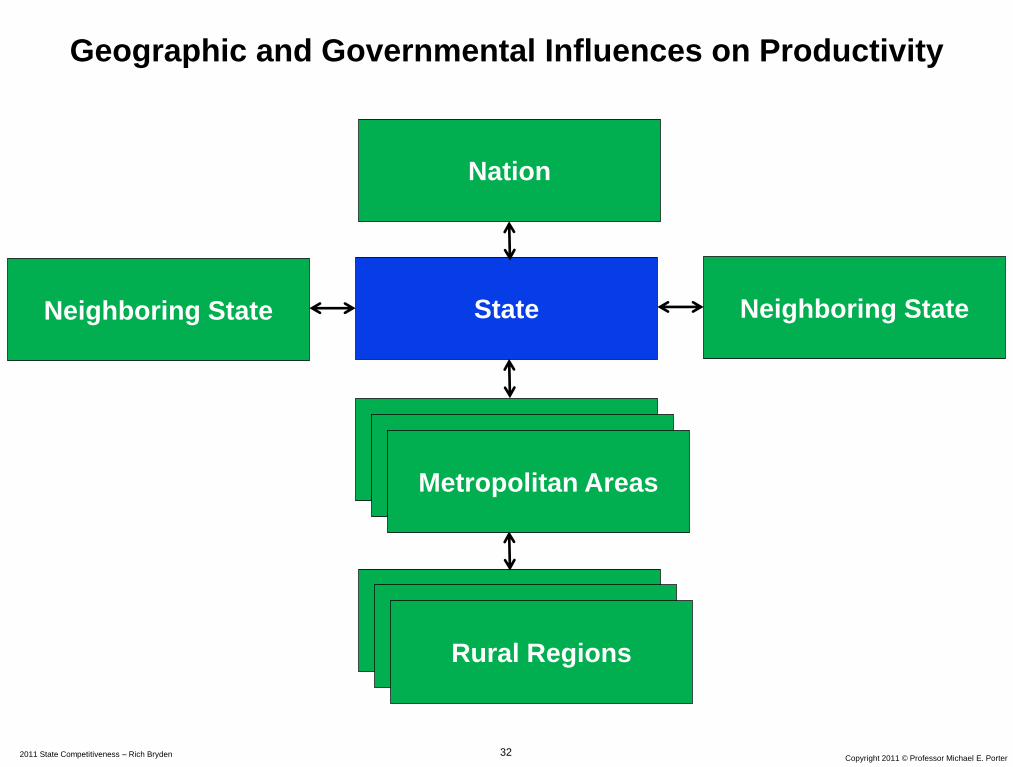
Geographic and Governmental Influences on Productivity
State
Metropolitan Areas
Neighboring State
Nation
Rural Regions
Neighboring State
Metropolitan Areas Metropolitan Areas
Rural Regions Rural Regions
33 Copyright © 2011 Professor Michael E. Porter 2011 State and City Competitiveness – Rich Bryden
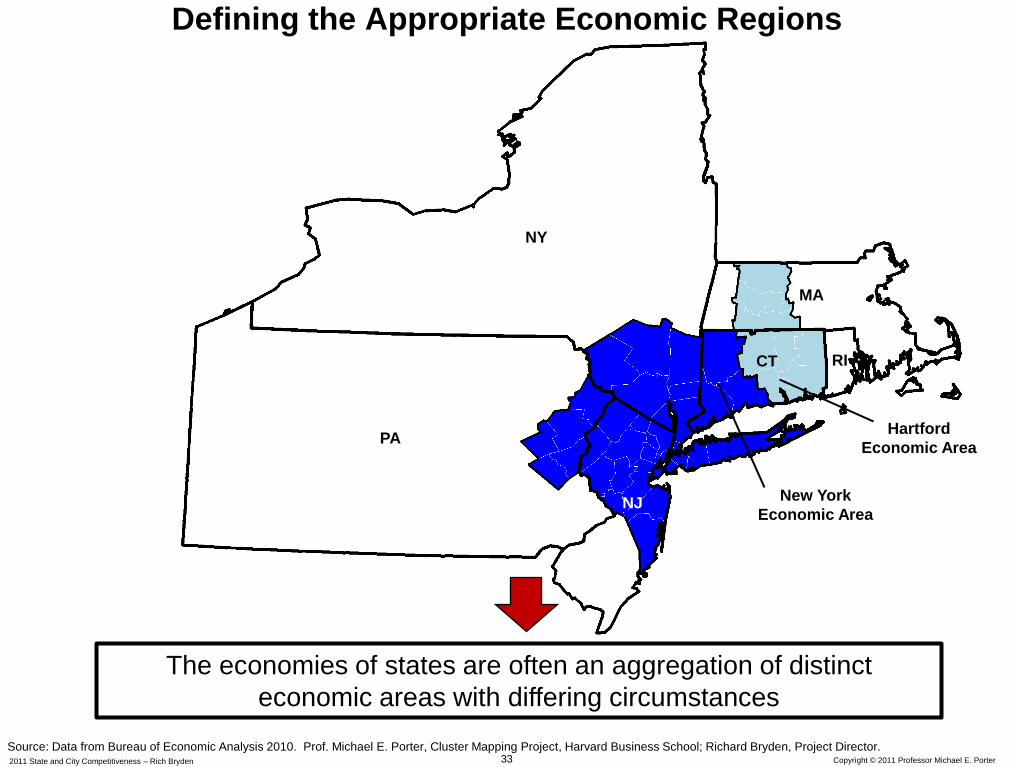
Defining the Appropriate Economic Regions
Source: Data from Bureau of Economic Analysis 2010. Prof. Michael E. Porter, Cluster Mapping Project, Harvard Business School; Richard Bryden, Project Director.
The economies of states are often an aggregation of distinct
economic areas with differing circumstances
Hartford
Economic Area
New York
Economic Area
PA
NY
NJ
MA
CT RI
34 Copyright © 2011 Professor Michael E. Porter 2011 State and City Competitiveness – Rich Bryden
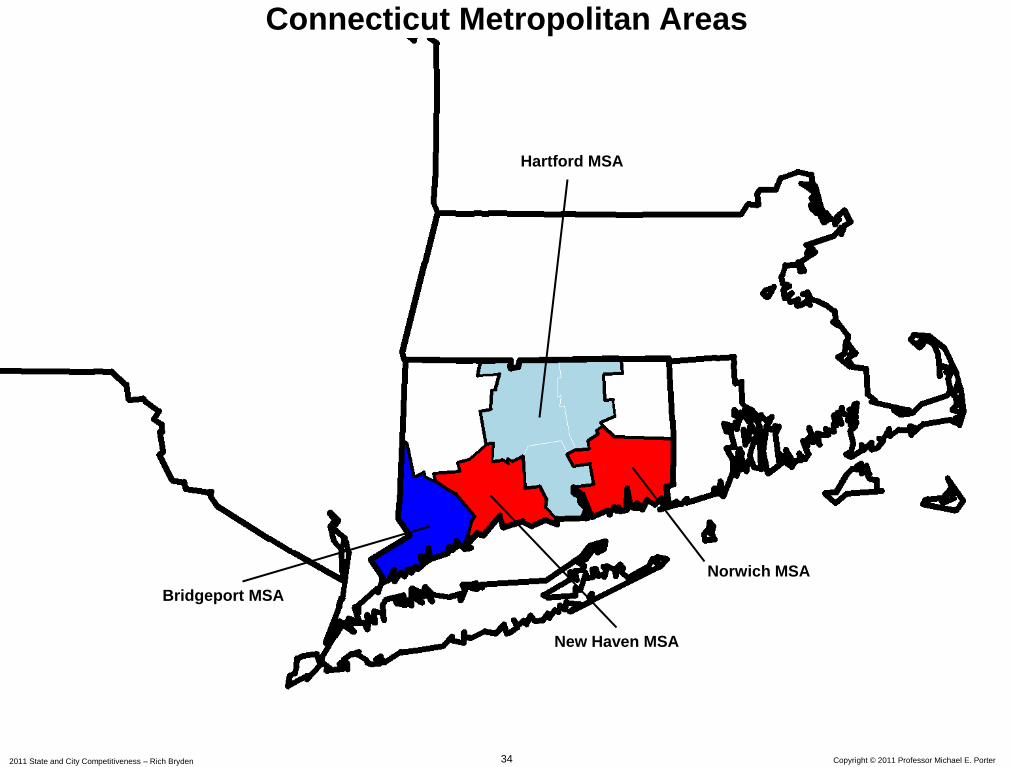
Connecticut Metropolitan Areas
Hartford MSA
Bridgeport MSA
New Haven MSA
Norwich MSA

35 Copyright 2011 © Professor Michael E. Porter
2011 State Competitiveness – Rich Bryden
$35,000
$40,000
$45,000
$50,000
$55,000
$60,000
$65,000
$70,000
$75,000
2.4% 2.5% 2.6% 2.7% 2.8% 2.9% 3.0% 3.1% 3.2%
Wage Performance in Connecticut Metropolitan Areas
Growth Rate of Private Wages, 1998-2009
Ave
rag
e P
riva
te W
ag
e,
20
09
Source: Census CBP, authors’ analysis. Note: “Bubble” size in chart is proportional to employment in 2009.
U.S. Average
Private Wage: $42,403
U.S. Growth Rate
of Wages: 2.86%
Connecticut Growth Rate
of Wages: 3.44%
Connecticut Average
Private Wage: $53,141
Bridgeport MSA
Hartford MSA
Rest of State
Norwich MSA
New Haven MSA
36 Copyright 2011 © Professor Michael E. Porter
2011 State Competitiveness – Rich Bryden
$35,000
$40,000
$45,000
$50,000
$55,000
$60,000
$65,000
$70,000
$75,000
-0.6% -0.4% -0.2% 0.0% 0.2% 0.4% 0.6%
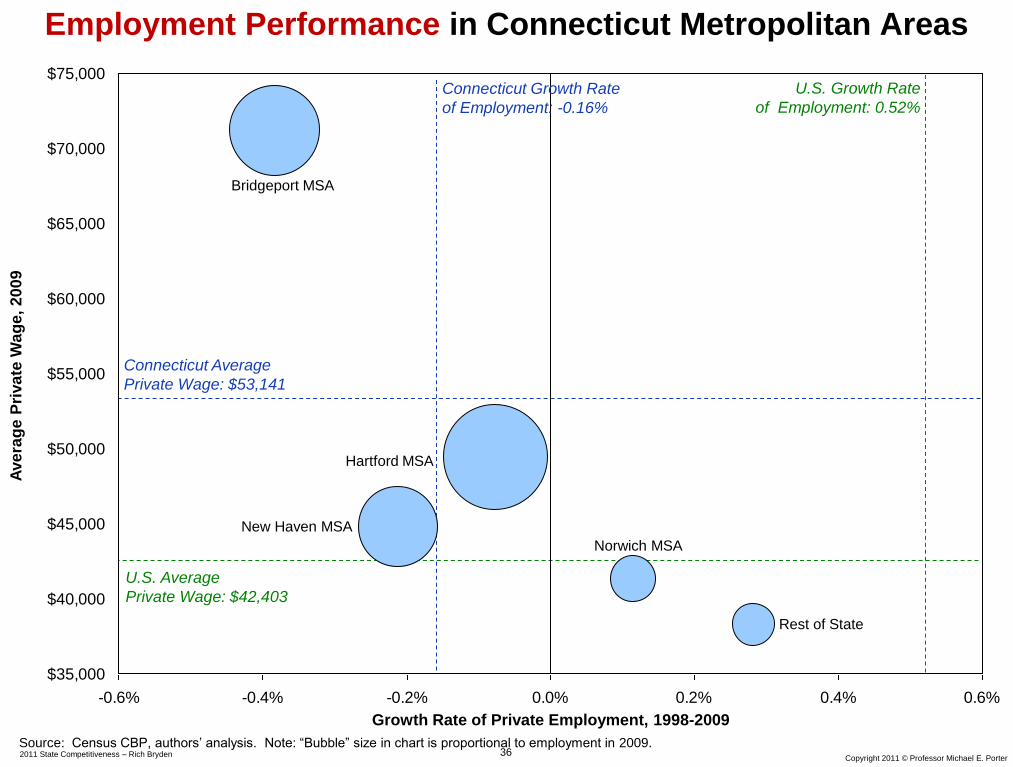
Employment Performance in Connecticut Metropolitan Areas
Growth Rate of Private Employment, 1998-2009
Ave
rag
e P
riva
te W
ag
e,
20
09
Source: Census CBP, authors’ analysis. Note: “Bubble” size in chart is proportional to employment in 2009.
U.S. Average
Private Wage: $42,403
U.S. Growth Rate
of Employment: 0.52%
Connecticut Growth Rate
of Employment: -0.16%
Connecticut Average
Private Wage: $53,141
Bridgeport MSA
Hartford MSA
Rest of State
New Haven MSA
Norwich MSA
37 Copyright 2011 © Professor Michael E. Porter
2011 State Competitiveness – Rich Bryden
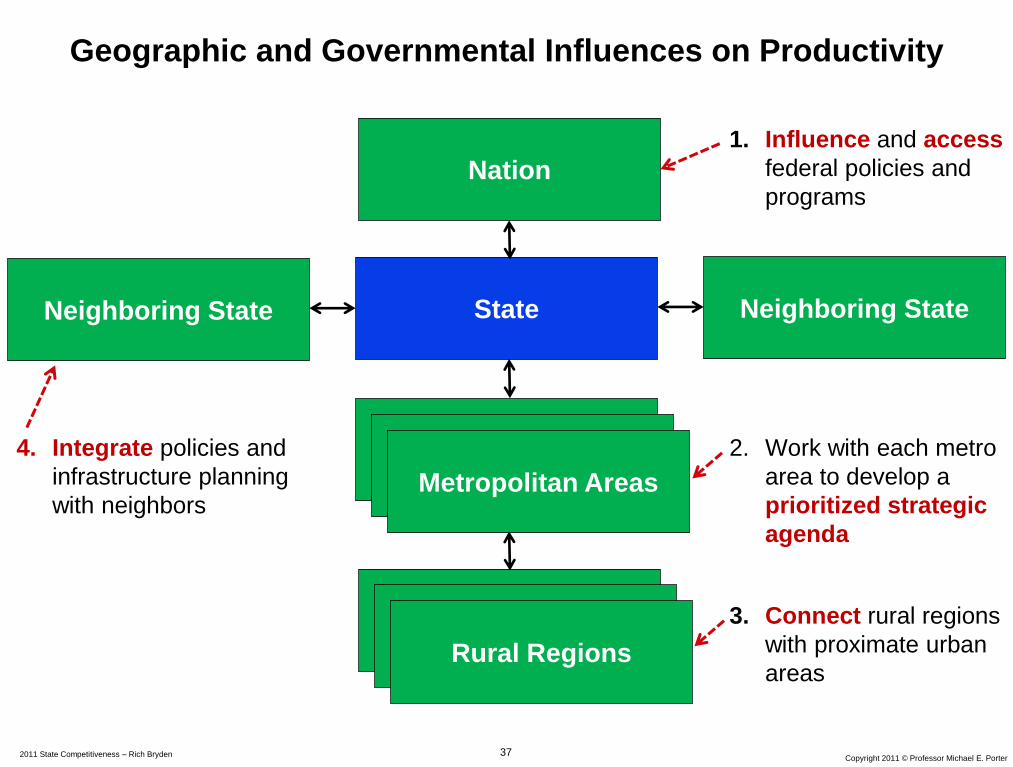
Geographic and Governmental Influences on Productivity
State
Metropolitan Areas
Neighboring State
Nation
Rural Regions
Neighboring State
Metropolitan Areas Metropolitan Areas
Rural Regions Rural Regions
1. Influence and access
federal policies and
programs
4. Integrate policies and
infrastructure planning
with neighbors
2. Work with each metro
area to develop a
prioritized strategic
agenda
3. Connect rural regions
with proximate urban
areas
38 Copyright 2011 © Professor Michael E. Porter
2011 State Competitiveness – Rich Bryden
Agenda
1. How is your state doing?
2. Why?
3. Where to go from here?
State Performance Scorecard
Explaining your state’s performance, strengths, and weaknesses Action Steps

39 Copyright 2011 © Professor Michael E. Porter
2011 State Competitiveness – Rich Bryden
Agenda
1. How is your state doing?
2. Why?
3. Where to go from here?
State Performance Scorecard
Explaining your state’s performance, strengths, and weaknesses Action Steps
Biggest Action Item of All

40 Copyright 2011 © Professor Michael E. Porter 2011 – State Competitiveness – Rich Bryden
Define the Value Proposition
Create an Economic Strategy
Develop Unique Strengths Achieve and Maintain
Parity with Peers
• What elements of the business
environment can be unique strengths
relative to peers/neighbors?
• What existing and emerging clusters
represent local strengths?
• What weaknesses must be addressed to
remove key constraints and achieve
parity with peer locations?
• What is the distinctive competitive position of the state or
region given its location, legacy, existing strengths, and
potential strengths? – What unique value as a business location?
– For what types of activities and clusters?
• Economic strategy requires setting priorities and moving beyond long lists of
separate recommendations.

41 Copyright 2011 © Professor Michael E. Porter 2011 State Competitiveness – Rich Bryden
How Should States Compete for Investment?
Tactical
(Zero Sum
Competition)
Strategic
(Positive Sum
Competition)
• Focus on attracting new investments
• Compete for every plant
• Offer generalized tax breaks
• Provide subsidies to lower / offset
business costs
• Every city and sub-region for itself
• Government drives investment
attraction
• Also support greater local investment
by existing companies
• Reinforce areas of specialization
and emerging cluster strength
• Provide state support for training,
infrastructure, and institutions with
enduring benefits
• Improve the efficiency of doing
business
• Harness efficiencies and
coordination across jurisdictions,
especially with neighbors
• Government and the private sector
collaborate to build cluster strength

42 Copyright 2011 © Professor Michael E. Porter
2011 State Competitiveness – Rich Bryden
Harnessing the New Process of Economic Development
Old Model
• Government drives economic
development through policy
decisions and incentives
New Model
• Economic development is a
collaborative process involving
government at multiple levels,
companies, teaching and research
institutions, and private sector
organizations
Competitiveness is the result of both top-down and bottom-up processes
in which many companies and institutions take responsibility

43 Copyright 2011 © Professor Michael E. Porter
2011 State Competitiveness – Rich Bryden
Example: Organizing for Economic Development
South Carolina Council
on Competitiveness
Research /
Investment
Executive
Committee
Measuring
Progress
Chaired by a business leader and reporting
to the governor
Convenes working groups, provides
direction and strength, holds working groups
accountable
Task Forces
Education /
Workforce
Coordinating
Staff
Cluster Committees
Start-ups /
Local Firms
Cluster
Activation
Distressed /
Disadvan.
Areas
Hydrogen /
Fuel Cells
Travel and
Tourism
Apparel
Agriculture
Automotive
Textiles
Effective economic policy also requires coordination within government

44 Copyright 2011 © Professor Michael E. Porter
2011 State Competitiveness – Rich Bryden
Summary
• The goal of economic strategy is to enhance productivity. This is the only
way to create jobs, high income, and wealth in the long run
• Improving productivity and innovation must be the guiding principles for
every state policy choice
• Improving productivity does not require new public resources, but using
existing resources better
• Improving productivity demands that governors mobilize the private
sector, not rely on government alone
• Economic strategy is non-partisan and about getting results

45 Copyright 2011 © Professor Michael E. Porter
2011 State Competitiveness – Rich Bryden
Next Steps
1. Reach out to your team
2. Reach out to the business community
3. Take advantage of Harvard Business School data and tools to support
this effort. Go to www.isc.hbs.edu.
The prosperity of the U.S. economy will depend more on the success of
states in improving competitiveness than what happens in Washington