Connecticut Avenue Securities Investor Presentation · 2016 (our “2016 Form 10-K”), and Form...
79
© 2017 Fannie Mae. Trademarks of Fannie Mae. 1 December 2017 Connecticut Avenue Securities Program TM
Transcript of Connecticut Avenue Securities Investor Presentation · 2016 (our “2016 Form 10-K”), and Form...

© 2017 Fannie Mae. Trademarks of Fannie Mae. 1
December 2017
Connecticut Avenue Securities Program
TM

© 2017 Fannie Mae. Trademarks of Fannie Mae. 2
This presentation contains a number of estimates, forecasts, expectations,
beliefs, and other forward-looking statements, including statements regarding
economic and housing market conditions, Fannie Mae’s future dividend
payments to Treasury, and future issuances and the projected performance of
Connecticut Avenue SecuritiesTM. These estimates, forecasts, expectations,
beliefs and other forward-looking statements are based on the company’s
current assumptions regarding numerous factors and are subject to change.
Actual outcomes may differ materially from those reflected in these forward-
looking statements due to a variety of factors, including, but not limited to, those
described in “Executive Summary,” “Forward-Looking Statements” and “Risk
Factors” in our annual report on Form 10-K for the year ended December 31,
2016 (our “2016 Form 10-K”), and Form 10-Q for the quarter ended November
30, 2017.
Any forward-looking statements made by Fannie Mae speak only as of the date
on which they were made. Fannie Mae is under no obligation to, and expressly
disclaims any obligation to, update or alter its forward-looking statements,
whether as a result of new information, subsequent events, or otherwise.
Disclaimer

© 2017 Fannie Mae. Trademarks of Fannie Mae. 31/31/2018Connecticut Avenue Securities Investor Presentation
Fannie Mae’s business model 4
Credit risk management 10
CAS key features and deal highlights 16
Connecticut Avenue Securities deal structure overview 20
Historical loan performance 33
Investor distribution and security performance 48
Investor resources 54
Appendix 60
A. How mortgage insurance works-High LTV deals
B. CAS deal summaries and comparisons
C. Credit risk management
D. Additional resources 78
Contents

© 2017 Fannie Mae. Trademarks of Fannie Mae. 4
Fannie Mae’s business model

© 2017 Fannie Mae. Trademarks of Fannie Mae. 51/31/2018
$-
$2,000
$4,000
$6,000
$8,000
$10,000
$12,000
Fir
st L
ien
Mo
rtg
ag
es
Ou
tsta
nd
ing
(B
illi
on
s)
Our size and scale
As of June 2017, U.S. 1st Lien mortgage debt outstanding totaled $9.8 trillion. Fannie Mae’s share stood at over $2.8 trillion, approximately 30% of the market.
The U.S. mortgage market is dominated by the 30-year Fixed-Rate Mortgage (FRM).
*Based on Fannie Mae, Freddie Mac and Ginnie Mae securitization data through Q3 2017. Data includes ARM and FRM.
Fannie Mae was the largest issuer of single-family mortgage securities year to date.*
Fannie Mae’s book of business is geographically dispersed across the United States
*Source: Federal Reserve’s Flow of Funds
Fannie Mae Total MDO
*Source: Fannie Mae Q3 2017 Credit Supplement
20%
64%
Other
California
Texas
6%
Florida
6%
New York
5%Third Quarter 2017 Issuance* by Institution
0
200
400
600
800
3Q2017 2016 2015 2014 2013
In B
illio
ns
Fannie Mae Issuance by Product Type
30-year FRM 15-year FRM 20-year FRM 10-year FRM Other Fixed ARM

© 2017 Fannie Mae. Trademarks of Fannie Mae. 6
LenderOriginates loans
Fannie MaeGuarantees MBS backed by loans
Interest RateInvestor
Purchases MBSMBS
Delivers loansServices loans
Pays guaranty fee
Securitizes loansGuarantees principal
& interest on MBS
Sold to investor
Proceeds from sale of MBS flow back to lender
Credit-Linked Debt
Credit InvestorAssumes portion of credit risk
Funding loans through issuance of Fannie Mae MBS
When Fannie Mae issues fully guaranteed single-family MBS, we retain all of the credit (mortgage default) risk associated with losses on the underlying mortgage loans. In return for taking on that risk, we receive a guaranty fee paid from a portion of the loans’ interest payments, which is passed through to us by the lender that delivered the loan to us. When we issue credit risk transfer securities, we transfer some of the retained credit risk to private market investors. However, thepurchasers of the credit-linked debt do not own the underlying loans. Such ownership interest belongs to the MBS investor.
Fannie Mae’s credit guaranty business model
Fannie Mae’s business model and industry-leading credit risk management capabilities facilitate the transfer of both interest rate risk and credit risk to the private markets.

© 2017 Fannie Mae. Trademarks of Fannie Mae. 7
Investors have shown an appetite for credit risk, and Fannie Mae’s credit risk in particular, given the
strong collateral characteristics and Fannie Mae’s role as a standard setter in the market
Investors in Fannie Mae’s CRT vehicles benefit from
Broad exposure to national U.S. housing market
Consistent high-quality underwriting standards
Fannie Mae’s comprehensive credit risk management process
Ongoing, programmatic issuance
Loan-level data disclosures and extensive historical datasets
Fannie Mae retains a portion of all risk transferred
To ensure the success of our Credit Risk Transfer (CRT) programs, Fannie Mae sets standards, provides credit risk management oversight, and maintains stability through all business cycles.
LENDER FANNIE MAE
Lenders leverage Fannie Mae’s proprietary suite of credit risk management tools to manufacture loans
Desktop Underwriter™ the most broadly used automated underwriting system in the industry
Collateral Underwriter® Fannie Mae’s proprietary appraisal valuation tool
Early Check™ assists lenders in identifying and correcting potential eligibility and/or data issues
Fannie Mae’s industry expertise ensures loan delivery quality and offers multiple avenues for credit risk sharing
Industry leading credit risk management technology and expertise
An established operational infrastructure and large scale aggregation capabilities
Robust strategy and development of a market for credit risk
Innovative credit risk sharing vehicles including Connecticut Avenue SecuritiesTM (CAS), and Credit Insurance Risk SharingTM (CIRTTM)
Credit Risk Transfer
As the largest guarantor in the U.S. housing market, Fannie Mae leads the industry in setting standards on managing and transferring credit risk.
INVESTOR

© 2017 Fannie Mae. Trademarks of Fannie Mae. 81/31/2018
About Fannie Mae
■ Government-Sponsored Enterprise (GSE) chartered by the United States Congress in 1938■ Our charter permits us to purchase and securitize mortgage loans secured by either a single-family or
multifamily property, but does not permit us to originate loans or lend money directly to consumers in the primary mortgage market
Background
■ Fannie Mae has a Single-Family guaranty business and a Multifamily guaranty business, both of which collect guarantee fees for assuming and managing the credit risk on our book of business, and a Capital Markets group that is responsible for managing the Company’s mortgage portfolio
Business
Conservatorship and United States (U.S.) Treasury agreement
■ Since September of 2008, Fannie Mae has been under Conservatorship with the Federal Housing Finance Agency (FHFA) acting as Conservator
■ Upon entering conservatorship, FHFA and the U.S. Treasury entered into a Senior Preferred Stock Purchase Agreement (SPSPA) on our behalf so that we could continue to fulfill our mission of providing liquidity and support to the housing market
1) Source: https://www.treasury.gov/press-center/press-releases/Pages/hp1131.aspx
Our public mission is to support liquidity and stability in the secondary mortgage market, where existing mortgage-related assets are purchased and sold, and to increase the supply of affordable housing.
■ Upon entering into the agreement, the U.S. Treasury stated that the holders of senior debt, subordinated debt, and mortgage backed securities issued or guaranteed by these GSEs are protected by the SPSPA without regard to when those securities were issued or guaranteed1

© 2017 Fannie Mae. Trademarks of Fannie Mae. 9
Payments under the Treasury agreement
■ Upon entering conservatorship Fannie Mae, through FHFA and the U.S. Treasury, entered into the SPSPA that permitted Fannie Mae to continue to fulfill our mission of providing liquidity and support to the housing finance market
■ Through this agreement, the U.S. Treasury stated that the holders of senior debt, subordinated debt, and mortgage backed securities issued or guaranteed by these GSEs are protected by the SPSPA without regard to when those securities were issued or guaranteed1
■ We received a total of $116.1B of funding from Treasury to support our operations and have $117.6B of funding remaining under the agreement. Fannie Mae has not received funds from Treasury under the SPSPA since the first quarter of 2012
■ The Director of FHFA has directed Fannie Mae to make dividend payments to Treasury on the senior preferred stock on a quarterly basis
Dividend payments do not offset funds drawn under the SPSPA Quarterly dividend payments equal any net worth as of the prior quarter end minus a capital
reserve amount, currently $600 million The capital reserve amount will be reduced to $0 in 2018
■ Through the third quarter of 2017, we have paid a total of $165.8 billion in dividends to Treasury, $49.7 billion more than the $116.1 billion we have received from Treasury to date
■ We paid Treasury $3.1 billion dividend in September 2017 due to FHFA declaring a dividend in this amount
1) Source: https://www.treasury.gov/press-center/press-releases/Pages/hp1131.aspx

© 2017 Fannie Mae. Trademarks of Fannie Mae. 10
Credit risk management

© 2017 Fannie Mae. Trademarks of Fannie Mae. 11
Fannie Mae’s comprehensive and proactive risk management approach aims to strengthen loan performance and reduce losses. This approach focuses on ensuring lender, loan, and servicing quality throughout the loan lifecycle.
Loans included in the CAS Reference Pools have all been securitized into Fannie Mae’s guaranteed MBS, and are therefore subject to the same origination, underwriting, quality control, and servicing standards as other loans guaranteed by Fannie Mae.
Loan Quality
Servicing Quality
Property Management
and Disposition
Lender Quality
Single-family credit risk management
In contrast to legacy Non-Agency RMBS transactions, investors in CAS deals benefit from Fannie Mae’s ongoing credit risk management.

© 2017 Fannie Mae. Trademarks of Fannie Mae. 12
Credit risk management overview
■ As the largest credit risk manager in the industry, we have built a comprehensive approach to credit risk management aided by cutting-edge analytical tools and grounded in cohesive end-to-end processes
■ Beginning in 2008, we took action to significantly strengthen our underwriting and eligibility standards to improve the quality of loans delivered to us
■ The changes we’ve made and continue to make help to make mortgage lending safer by providing more complete and accurate information about the key factors in underwriting a loan – from the value of the home being purchased to the borrower’s income and credit history
■ We have pioneered the industry-preferred automated underwriting system, a cutting-edge appraisal analytics tool, and built the largest loss mitigation platform in the industry
■ We leverage in-depth market data, research, and analysis to manage our book of business – and provide that information to our lenders in order to improve the end-to-end loan manufacturing process
We stand side-by-side with our credit risk investorsand strive to provide the greatest possible transparency into the tools and processes that make us the market leader in single-family residential mortgage credit risk management.

© 2017 Fannie Mae. Trademarks of Fannie Mae. 13
Our credit risk management approach■ Lenders undergo a rigorous approval process prior to doing business with Fannie Mae and
must meet ongoing net worth and business operational requirements
■ Lenders are subject to ongoing oversight through comprehensive operational reviews to assessthe effectiveness of their quality control procedures
■ Loans must be underwritten in accordance with Fannie Mae guidelines. Over 90%(1) of loansthat we acquire are evaluated through Desktop Underwriter®, DU®, the industry’s mostwidely used automated underwriting system
■ 100% of Fannie Mae’s single-family and condo appraisals are assessed through CollateralUnderwriter®, our proprietary appraisal risk assessment tool, to identify potential appraisalquality issues
■ Fannie Mae sets loan servicing standards, acts as Master Servicer, and provides oversight ofloan servicers
■ We set standards for loss mitigation and borrower workout options. Our proprietary servicingtool, Servicing Management Default UnderwriterTM (SMDUTM) automates our servicingpolicies
■ We conduct all property management and disposition in house, managing the industry’slargest real-estate owned portfolio – disposing of over 1.5 million homes since 2009
■ Our strategy is to sell non-distressed homes to owner-occupants, helping to maximize salesproceeds, stabilize neighborhoods, and preserve the value of our guaranty book
(1) Estimate of 2016 new acquisitions, excluding loans acquired under Fannie Mae’s Refi Plus and HARP initiatives
Our full range of credit risk management capabilities is driven by innovation and analytics and informed by continuous feedback across the loan lifecycle
Lender quality
Loan quality
Servicing quality
Propertymanagement
and disposition

© 2017 Fannie Mae. Trademarks of Fannie Mae. 14
Key credit risk management highlights
Loan Deliveries in
2016 thru DU®(1)
Desktop Underwriter®
approx. 1,861
Lenders/agents
USERS
Collateral Underwriter®
20,000+ Users
2,300+ Lenders/
agents
USERS since Jan.
2015
Over half of our lenders actively use CU™ during
origination process
100% of single-family and condominium loans
go through CU™ as part of our QC process
27 Million Appraisals collected to Date
Single Family Real Estate Servicing Management Default Underwriter™
100% of REO sales are managed
in-house: resulting in lower costs;
higher sales prices, and reduced severities
Beginning in Q4 2016, we offer Direct 3rd PartyData Validation of borrower income, assets,
and employment information
85% of ALLdelinquencies
covered
Allowed over 131,000 borrowers to start trial modifications in 2016
Created an interface that will give > 1,000 mid-size and smaller servicers system access
1-2 hoursper loan
New automated loss mitigation functionality
saves
>90%
(1) 2016 new acquisitions, excluding loans acquired under Fannie Mae’s Refi Plus and HARP initiatives
Best execution approach to sell real estate
based on an NPV comparison to a move-in
ready home sold to an owner occupant
>2 million Appraisals have been viewed by lenders since launch
Industry’s largest distressed portfolio disposed
of >1.5 million homes since 2009
11.8 Millionvisits in YTD 2017
Connecticut Avenue Securities Investor Presentation
Key credit risk management highlights

© 2017 Fannie Mae. Trademarks of Fannie Mae. 15
■ Changed guidelines to eliminate certain higher risk products such as interest-only loans and 40-year loans and to eliminate newly originated “Alt-A” and low documentation loans
■ Revised eligibility guidelines to reduce amount of risk layering (i.e., combining multiple higher risk elements on a single loan such as a low credit score with a high debt ratio)
■ Require homebuyer education and counseling for certain products
■ Revised servicing protocols to establish quality contact with delinquent borrowers more quickly
■ Introduced more effective modification programs for qualified distressed borrowers
■ Enhanced servicer training and oversight and implemented new servicer metrics, incentives and compensatory fees
■ Created industry’s largest platform for management and sale of Real Estate Owned properties, creating significant efficiencies in marketing and selling properties
■ Created cutting-edge data driven tools to support underwriting, property valuation, quality control, servicing and real estate owned management
■ Innovative analytics leverage Fannie Mae’s vast trove of data to improve loan manufacturing quality and identify defects earlier in the process
Underwriting andEligibility
Credit Loss Management
Innovation
Summary of single-family business changes since the global financial crisis
As the largest guarantor of U.S. mortgages, we play a major role in setting the standards for the housing finance market.

© 2017 Fannie Mae. Trademarks of Fannie Mae. 16
CAS key features and deal highlights

© 2017 Fannie Mae. Trademarks of Fannie Mae. 17
Fannie Mae’s Connecticut Avenue SecuritiesTM (CAS) program
Since 2013, our award-winning CAS program has grown to be the premier mortgage credit
risk transfer program in the industry, established through:
Industry-leading, innovative credit-risk management methodologies
Thoughtful issuance approach
Transparent and unique investor resources
Maturing and liquid market
The Benchmark for U.S. mortgage credit
Proprietary credit risk management tools and processes manage credit risk on the largest mortgage credit book in the industry
Innovative tools that improve the loan manufacturing process
A benchmark issuer with a transparent issuance calendar
$28.4 billion issued since 2013
Transferring a significant portion of risk on $942B in unpaid principal balance of mortgage loans
Historical research dataset of over 36 million loans
Transparent webpagesdetailing our comprehensive credit risk management process
Loan-level disclosures
Unique Data DynamicsTM
tool enabling analysis of loan-level data and deal performance
© 2017 Fannie Mae. Trademarks of Fannie Mae. 171/31/2018Connecticut Avenue Securities Investor Presentation

© 2017 Fannie Mae. Trademarks of Fannie Mae. 18
Program benefits and issuance volumes
• Large, geographically diversified loan pools provide broad exposure to U.S. housing market
• Fannie Mae acts as credit risk manager throughout the program – acting as an intermediary between the lender and investor to set standards, manage quality, mitigate losses, and maximize value
• Ongoing, programmatic issuance and consistent structures
• Broad Wall Street coverage, making daily markets and publishing research and analytics
• Pricing and trading volume available on TRACE and Bloomberg
• Active deal management – including seeking and receiving ratings on previously unrated CAS bonds
• Transparent investor resources – including our investor analytical tool – Data Dynamics® Fannie Mae has issued $28.4 BN under the CAS
program to date, and $22.4 BN in bonds remain outstanding as of November 21, 2017.
0
2000
4000
6000
8000
10000
2013 2014 2015 2016 2017 YTD
Dea
l Iss
uan
ce M
illio
ns
($)
CAS Issuance
M-1 M-2 B B-1

© 2017 Fannie Mae. Trademarks of Fannie Mae. 19
2018 issuance calendar
■ The calendar below highlights periods in 2018 during which Fannie Mae may issue Connecticut Avenue Securities
■ Fannie Mae may choose not to issue in some periods, or in certain limited issuance windows, may choose to issue up to two deals.
■ Issuance volumes and utilization of available issuance windows continue to be dependent on market conditions
*Issuance windows in which Fannie Mae may issue up to two CAS deals, subject to market conditions
Connecticut Avenue Securities Investor Presentation
Month Issuance Window
February/March* Early February to early March
April/May* Late April to late May
June Mid- to late June
July/August* Late July to late August
September/October* Late September to late October
December Early December

© 2017 Fannie Mae. Trademarks of Fannie Mae. 20
Connecticut Avenue Securities deal structure overview

© 2017 Fannie Mae. Trademarks of Fannie Mae. 21
Class
Loan
Group
Offered Notes
($MM)
Expected
Credit
Support (%)
Tranche
Thickness (%)
Expected Ratings
(Fitch/KBRA)
Expected WAL @
10 CPR (yrs)
Expected Principal
Window @ 10 CPR
2M-1 2 $107.666 3.40% 0.85% BBB-sf/BBB(sf) 1.42 1-28
2M-2 2 $303.996 1.00% 2.40% Bsf/B(sf) 6.10 28-120
2B-1 2 $63.333 0.50% 0.50% NR/NR 10.01 120-120
2B-2 2 $0.000 0.00% 0.50% NR/NR N/A N/A
Sample transaction overview
Loan Group 1: Loans with 60.01% - 80.00% original loan-to-value ratios
Loan Group 2: Loans with 80.01% - 97.00% original loan-to-value ratios
CAS 2017-C07 Group 2 collateral (April 2017-June 2017)
Class
Loan
Group
Offered Notes
($MM)
Expected
Credit
Support (%)
Tranche
Thickness (%)
Expected Ratings
(Fitch/KBRA)
Expected WAL
@ 10 CPR (yrs)
Expected Principal
Window @ 10 CPR
1M-1 1 $186.170 3.05% 0.95% BBB-sf/BBB+(sf) 2.06 1-39
1M-2 1 $401.734 1.00% 2.05% Bsf/BB-(sf) 6.66 39-120
1B-1 1 $97.984 0.50% 0.50% NR/NR 10.01 120-120
1B-2 1 $0.000 0.00% 0.50% NR/NR N/A N/A
CAS 2017-C07 Group 1 (February 2017-April 2017)$ 1.161 billion in offered notes(1)
(1)The Maturity Date for all classes will be February 2030.Note: WALs at 10 CPR to Optional Redemption

© 2017 Fannie Mae. Trademarks of Fannie Mae. 22
CAS 2017-C07 structural overview■ The Reference Pool is subdivided
into two loan groups by original LTV
■ Each loan group serves as a reference for a separate set of securities
■ Notes are par-priced uncapped LIBOR floaters
■ 12.5-year legal final maturity; Fannie Mae optional 10% clean up call and call starting in year 10
■ The minimum credit enhancement to unlock unscheduled principal is 4.50% for Group 1 and Group 2
■ Credit events are based on actual losses
■ 1M-2 and 2M-2 classes will offer exchange features with rated exchangeable notes
■ Fannie Mae will retain 100% of each first loss tranche and at least 5% of all offered tranches.
Reference Pool
February 2017* – April 2017 Acquisition for Loan Group 1
April 2017 – June 2017 Acquisition for Loan Group 2
Group 1 Loans
Original LTV 60.01 – 80.00%
Class 1A-H
96.00% thick
4.00% credit support
Class 1M-1
0.95% thick
3.05% credit support
Class 1M-2
2.05% thick
1.00% credit support
Class
1M-2H
(5% vertical
slice)
Class
1M-1H
(5% vertical
slice)
All H tranches are reference tranches only and will not be issued
Class 1B-1
0.50% thick
0.50% credit support
Class
1B-1H
(5% vertical
slice)
Class
1B-2H
0.50% thick; 0% credit support
Connecticut Avenue Securities Investor Presentation
Class 2A-H
95.75% thick
4.25% credit support
Class 2M-1
0.85% thick
3.40% credit support
Class 2M-2
2.40% thick
1.00% credit support
Class
2M-2H
(5% vertical
slice)
Class
2M-1H
(5% vertical
slice)
Class 2B-1
0.50% thick
0.50% credit support
Class
2B-1H
(5% vertical
slice)
Class
2B-2H
0.50% thick; 0% credit support
Group 2 Loans
Original LTV 80.01 – 97.00%
*February 2017 acquisitions targeted for CAS were randomly divided, with 50% allocated to CAS
2017-C06 and the remaining 50% allocated to CAS 2017-C07

© 2017 Fannie Mae. Trademarks of Fannie Mae. 23
CAS 2017-C07 exchangeable notes
1M-2A, 1M-2B and 1M-2C are LIBOR floaters with a margin that is equal to the 1-M2, and the 2M-2A, 2M-2B and 2M-2C are LIBOR floaters with a margin that is equal to the 2M-2
To reduce the coupon, each exchangeable class can be stripped down to exchange into four P&I tranches, each with a different margin and corresponding fixed IO
Multiple options to combine the floating rate and IO classes are available to meet various investor needs
Class 1M-2$401.734
Bsf / BB- (sf)
Credit Enhancement: 1.00%
1M-2A/1M-2B/1M-2C OptionClass 1M-2A
$133.258
BBsf / BBB(sf)
Credit Enhancement: 2.37%
Class 1M-2B
$133.258
BB-sf / BB+(sf)
Credit Enhancement: 1.69%
Class 1M-2C
$135.218
Bsf / BB-(sf)
Credit Enhancement: 1.00%
Prin
cip
al
Losses
Tranching and coupon stripping
to provide optionality to meet
investor needs
Exchangeable notes-upgrade to investment grade
Deal Exchangeable Class Rating agency At issuance Current rating
CAS 2016-C011M-2A Moody's/Kroll Ba1/BBB- Baa2 (upgrade)/BBB-
2M-2A Moody's/Kroll Ba1/BB+ Baa3 (upgrade)/BB+
CAS 2016-C02 1M-2A Moody's/Kroll Ba1/BBB Baa2 (upgrade)/BBB
Connecticut Avenue Securities Investor Presentation
Class 2M-2$303.996
Bsf / B (sf)
Credit Enhancement: 1.00%
2M-2A/2M-2B/2M-2C OptionClass 2M-2A
$101.332
BBsf / BBB-(sf)
Credit Enhancement: 2.60%
Class 2M-2B
$101.332
BB-sf / BB(sf)
Credit Enhancement: 1.80%
Class 2M-2C
$101.332
Bsf / B(sf)
Credit Enhancement: 1.00%
Prin
cip
al
Losses
Tranching and coupon stripping
to provide optionality to meet
investor needs

© 2017 Fannie Mae. Trademarks of Fannie Mae. 24
■ CAS cash flow structure is designed to be similar to typical RMBS transaction cash flows
■ Principal payments and losses applied to the notes mirror the principal payments and losses experienced on the loans in the underlying Reference Pool
■ Principal Payments are first allocated pro rata between the senior notes and the subordinate notes, then are applied sequentially to the subordinate notes starting with M-1
The deal must meet specified credit enhancement and delinquency tests in order for the subordinate notes to receive unscheduled principal payments (i.e., prepayments)
■ Losses are applied in reverse sequential order starting with class B-2
■ Principal payments and losses are allocated pro rata between the sold notes and the retained vertical slice
Loan Group 1 (60.01 – 80.00 LTV)
Senior Notes: A class | Subordinate Notes: M classes, B classes | Retained Vertical Slice: 1M-1H, 1M-2H, 1B-1H, 1B-2H, 2M-1H, 2M-2H, 2B-1H, 2B-2H
Cash flow waterfall
Prin
cip
al
Lo
sses
Class 1A-H
Class 1B-1H
Class 1M-1
Class 1M-2 Class 1M-2H
Class 1M-1H
Class 1B-1
Class 1B-2H
Connecticut Avenue Securities Investor Presentation
Loan Group 2 (80.01 – 97.00 LTV)
Prin
cip
al
Lo
sses
Class 2A-H
Class 2B-1H
Class 2M-1
Class 2M-2 Class 2M-2H
Class 2M-1H
Class 2B-1
Class 2B-2H

© 2017 Fannie Mae. Trademarks of Fannie Mae. 25
Credit events and allocation of losses
Allocation of principal loss amounts Allocation of modification loss amounts
Class B2 - Principal1 Class B2 - Interest1
Class B2 - Principal2
Class M2 - Interest5
Class M2 - Principal6
Class M1- Interest7
Class M1 - Principal8
Class M2 - Principal3
Class M1 - Principal4
Class B1 - Interest3
Class B1 - Principal4
Class B1 - Principal2
Connecticut Avenue Securities Investor Presentation

© 2017 Fannie Mae. Trademarks of Fannie Mae. 26
Actual loss calculation – principal losses
Losses at Disposition
(+) Loan Balance UPB at time of removal from reference pool (including any prior principal forgiveness
amount)
(+) Total Liquidation Costs Foreclosure Expense
Property Preservation Expense
Asset Recovery Expense
Miscellaneous Holding Expenses/Credits
Associated Taxes
(+) Accrued Interest Unpaid interest from Last Paid Installment date through Disposition Date on interest-
bearing UPB, based on net Note rate (Note Rate net of servicing fee or 35 bps,
whichever is greater)
(-) Total Proceeds Net Sales Proceeds
Credit Enhancement Proceeds (Mortgage Insurance Proceeds)
Repurchase/ Make Whole Proceeds
Other Proceeds
Expenses and proceeds associated with a credit event are passed through to noteholders 90 days after the disclosedDisposition Date (e.g., property sale date). Any remaining trailing expenses and proceeds are passed through on a monthlybasis thereafter as received.
Connecticut Avenue Securities Investor Presentation

© 2017 Fannie Mae. Trademarks of Fannie Mae. 27
Modification lossesModification Borrower Impact Loss to Investor
Interest Rate Reduction Reduces monthly interest rate borrower pays
on loan obligation
Losses passed through based on the
difference between the modified and
original note rate paid on the outstanding
loan balance
Principal Forbearance Mortgage payments are temporarily
suspended to reduce monthly mortgage
payments for a specific period of time; the
portion of suspended principal does not bear
interest and is due at termination of the loan
Loss reflects foregone interest on non
interest bearing portion of UPB
Term Extension The loan term is extended to reduce borrower
monthly payments
No loss impact to investor
Principal Forgiveness* The outstanding principal loan balance is
subject to a one time principal reduction based
on established eligibility criteria
At time of principal forgiveness, no
modification losses will be passed
through to noteholders
The forgiven UPB amount will be
treated as unscheduled principal at
the time of the modification
If the modified loan subsequently
becomes subject to a credit event, the
amount of the principal forgiveness
will be included in the credit event net
loss (realized loss calculation)
*Fannie Mae does not anticipate that any loans referenced in CAS deals will be eligible for Principal Forgiveness*Principal Forgiveness Eligibility Criteria: http://www.fhfa.gov/Media/PublicAffairs/Pages/FHFA-Announces-PRM-Program-and-Further-Enhancements-to-NPL-Sales-Reqts.aspx
Modification losses are passed through to noteholders on a monthly basis once a permanent modification takes effect. No losses are incurred during a modification trial period (typically 3 months).
Connecticut Avenue Securities Investor Presentation

© 2017 Fannie Mae. Trademarks of Fannie Mae. 28
Acquisition profile
Source: Fannie Mae Data, as of November 2017 activity date
Connecticut Avenue Securities Investor Presentation

© 2017 Fannie Mae. Trademarks of Fannie Mae. 29
Fully amortizing, generally 25-year and 30-year fixed rate**, 1-4 unit, first lien, conventional
Not subject to a repurchase request as of Cut-Off Date
In an MBS as of the cut-off date
Not Refi Plus™ / Not HARP
February 2017* – April 2017 Total Acquisitions of $109.0BN Original UPB
0 x 30 payment history since acquisition
Random Division
60% < Loan-to-Value < 80%
Reserved for
Reinsurance
*February 2017 acquisitions targeted for CAS were randomly divided, with 50% allocated to CAS 2017-C07**All loans will have terms greater than 240 months and less than or equal to 360 months. Other minimal exclusion criteria apply.*** Current UPB Reflects CAS 2017-C07 Sept 2017 Book Profile. Numbers may not foot due to rounding.
Fannie Mae acquires HARP loans under its Refi Plus™ initiative, which provides expanded refinance opportunities for eligible Fannie Mae borrowers.
CAS 2017-C07 G1 reference pool selection process
Connecticut Avenue Securities Investor Presentation
Connecticut Avenue Securities: $20.63BN Current UPB ***
Not subject to any form of risk sharing with the loan seller and/or servicer
Approximately 50% of February 2017 acquisitions + 100% of March 2017 – April 2017 (random division)
Not a hurricane-related exclusion loan

© 2017 Fannie Mae. Trademarks of Fannie Mae. 30
Fully amortizing, generally 25-year and 30-year fixed rate**, 1-4 unit, first lien, conventional
Not subject to a repurchase request as of Cut-Off Date
In an MBS as of the cut-off date
Not Refi Plus™ / Not HARP
April 2017 – June* 2017 Total Acquisitions of $121.34BN Original UPB
0 x 30 payment history since acquisition
Random Division
80% < Loan-to-Value < 97%
Reserved for
Reinsurance
*June 2017 acquisitions targeted for CAS were randomly divided, with 50% allocated to CAS 2017-C07**All loans will have terms greater than 240 months and less than or equal to 360 months. Other minimal exclusion criteria apply.*** Current UPB Reflects CAS 2017-C07 Sept 2017 Book Profile. Numbers may not foot due to rounding.
Fannie Mae acquires HARP loans under its Refi Plus™ initiative, which provides expanded refinance opportunities for eligible Fannie Mae borrowers.
CAS 2017-C07 G2 reference pool selection process
Connecticut Avenue Securities Investor Presentation
Connecticut Avenue Securities: $13.33BN Current UPB ***
Not subject to any form of risk sharing with the loan seller and/or servicer
100% of April 2017 - May 2017 + approximately 50% of June 2017 acquisitions
Not a hurricane-related exclusion loan

© 2017 Fannie Mae. Trademarks of Fannie Mae. 31
Private Mortgage Insurance on high LTV loans■ All loans in CAS deals with original loan-to-value ratios greater than 80% are required to have mortgage insurance
(MI) in place provided by one of 8 approved and active Mortgage Insurance Companies
Borrower-paid MI: the borrower makes a monthly payment as part of his/her mortgage payment
• Approximately 85%(1) of MI is borrower-paid. Monthly MI payment is typically 7% - 7.5%(2) of the borrower’s total mortgage payment at loan inception. MI can be canceled by borrower once loan reaches a certain LTV
Lender-paid MI: the lender pays for the MI upfront and charges the borrower a higher interest rate
• Approximately 15%(1) of MI is lender-paid. Lender-paid MI cannot be cancelled because the payment is built into the mortgage rate.
■ If a loan goes to disposition, the MI company is obligated to pay Fannie Mae a claim based on the MI coverage percentage. This payment is passed through to the CAS investor as additional disposition proceeds and reduces the loss
LTV Range Standard MI Coverage %
95.01 – 97.00 35.0%
90.01 – 95.00 30.0%
85.01 – 90.00 25.0%
80.01 – 85.00 12.0%
Note: most loans have “standard” coverage; however, levels may differ on some loans – this is disclosed on the loan-level deal file
■ If the MI company fails to pay a claim per their contractual obligation, Fannie Mae will step in and cover the MI contractual benefit amount on that loan. Investors are not exposed to MI Company counterparty risk
(1) Figures represent breakdown of MI payments from CAS 2017-C04 deal
(2) Given the following key assumptions: 90% LTV, 740 FICO, MGIC Mortgage Insurance rates (44 bps for a 740 FICO loan) No Curtailment

© 2017 Fannie Mae. Trademarks of Fannie Mae. 32
Guidelines for loans with LTV greater than 95%
Standard Guidelines:
■ Fannie Mae’s standard guidelines allow for LTV/CLTV up to 97% under the following circumstances:
Must be underwritten through DU; Loan purpose is for a purchase or a limited cash-out refinance (i.e., rate/term refinance) of an existing Fannie Mae loan; Property is a 1-unit primary residence
At least one borrower on the loan is a first-time homebuyer
HomeReady®:
■ Designed for creditworthy low- to moderate-income borrowers
■ Replaced Fannie Mae’s existing community lending program, My Community Mortgage, in late 2015
■ Allows for LTV up to 97% under the following circumstances:
Must be underwritten through DU; Loan purpose is for a purchase or a limited cash-out refinance (i.e., rate/term refinance) of an existing Fannie Mae loan; Property is a 1-unit primary residence
Borrower income is not more than 100% of area median income, or subject property is located in a low-income census tract
■ LTV>90% allows for lower MI coverage than standard loans to reduce borrowers’ monthly payments
■ Typically requires 25% MI for loans 90.01-97% LTV versus 30-35% MI coverage for standard loans
■ Fannie Mae charges lower loan-level price adjustments for HomeReady loans to help reduce cost to borrower
■ DU applies the same risk assessment to HomeReady as all other loans underwritten through DU
■ Some product flexibilities allowed with prudent underwriting (See Appendix)
Example: Documented income from non-borrower householder members may be considered as a compensating factor in DU to allow for DTI up to 50%
Note: non-borrower income is not included in the DTI ratio
Connecticut Avenue Securities Investor Presentation

© 2017 Fannie Mae. Trademarks of Fannie Mae. 33
Historical loan performance

© 2017 Fannie Mae. Trademarks of Fannie Mae. 34
Group 1 (60.01-80.00 OLTV) - historical acquisition profile
Source: Fannie Mae October 2017 Data ReleaseConnecticut Avenue Securities Investor Presentation
60-80 LTV Historical Loan Acquisition Profile
Orig year Loan Count Original UPB
WA Note
Rate WA Fico WA DTI WA OLTV WA OCLTV % 2nd Lien1 % Investor % Refi2 % TPO3 % CA
WA Risk
Layers4
1999 64,038 $8.4B 7.77% 705 32.9 75.9 76.0 0.7% 4.0% 35.2% 52.1% 15.0% 0.71
2000 549,663 $76.0B 8.09% 707 33.7 76.2 76.5 2.7% 4.3% 29.6% 57.1% 16.2% 0.69
2001 1,358,192 $211.3B 6.96% 709 32.4 75.1 75.6 3.8% 4.6% 67.7% 56.0% 20.1% 0.84
2002 1,401,199 $229.1B 6.48% 715 32.9 74.7 75.3 5.0% 5.0% 70.2% 57.5% 20.0% 0.84
2003 1,798,899 $309.1B 5.74% 717 32.6 74.2 75.0 7.0% 4.8% 75.5% 58.9% 20.6% 0.83
2004 726,741 $128.2B 5.83% 713 34.3 74.9 76.8 15.0% 4.1% 57.5% 60.6% 16.5% 0.93
2005 711,414 $137.2B 5.83% 717 36.9 75.0 77.5 20.3% 4.0% 56.8% 63.1% 11.5% 0.99
2006 566,515 $115.0B 6.41% 718 38.1 75.3 78.0 21.6% 5.3% 53.7% 64.7% 9.5% 1.03
2007 647,552 $138.3B 6.33% 720 37.9 75.3 77.9 20.6% 6.8% 58.7% 67.7% 10.4% 1.05
2008 697,327 $158.2B 6.03% 741 37.2 75.1 76.6 12.3% 8.5% 57.8% 62.7% 18.6% 0.82
2009 1,089,924 $260.4B 4.99% 760 34.5 74.5 75.6 9.0% 3.9% 70.8% 51.0% 20.5% 0.55
2010 779,816 $193.3B 4.74% 763 33.0 75.0 76.0 9.4% 6.3% 59.5% 56.3% 28.0% 0.36
2011 631,262 $148.0B 4.58% 761 33.3 75.1 76.2 8.7% 9.2% 55.8% 58.6% 29.4% 0.37
2012 1,019,597 $250.8B 3.85% 764 31.9 74.6 75.6 8.8% 8.8% 65.1% 56.3% 29.6% 0.32
2013 857,168 $204.5B 4.05% 757 33.2 75.1 76.2 8.9% 10.5% 53.2% 49.5% 29.7% 0.39
2014 581,444 $135.0B 4.47% 746 34.6 75.9 77.0 8.7% 11.5% 41.4% 46.4% 27.8% 0.48
2015 738,034 $179.6B 4.13% 748 34.1 75.3 76.3 8.0% 10.6% 51.5% 41.9% 27.3% 0.48
2016 535,256 $134.2B 3.95% 750 34.0 75.1 75.9 5.8% 8.7% 52.0% 40.9% 26.0% 0.46
Only loans with LTV between 60-80 are included. Excludes loans with CLTV >97
Statistics weighted by origination UPB
1Loans with CLTV more than 3 % greater than LTV are assumed to have second liens.
2Includes both Rate/Term and Cashout Refinances.
3Includes Broker and Correspondent originations.
4Risk Layers defined as: Investor Property, DTI>45, FICO<680, & Cash-out Refinance

© 2017 Fannie Mae. Trademarks of Fannie Mae. 35
Group 1: historical loss performance re-weighted to CAS 2017-C07 profile
Connecticut Avenue Securities Investor Presentation
Realized Loss Performance Default Pipeline ImplicationsCAS 2017-C07 G1 Equivalent Perf. (Not Including Default Pipeline)5
Orig YearRemaining
UPB Pool Factor12.5 Year Net Loss Mod Loss1 Total Loss
Rem. CAS Window
(Months)2
Rem. CAS Window %2
Unsold REO %3
Active D180 %4 Net Loss6 Mod Loss7
Total Comped
Loss
2000 0.4B 0.50% 0.13% 0.02% 0.15% 0.0 0.0% 0.01% 0.02% 0.08% 0.01% 0.09%
2001 1.9B 0.90% 0.19% 0.03% 0.22% 0.0 0.0% 0.01% 0.02% 0.12% 0.02% 0.13%
2002 4.4B 1.90% 0.28% 0.05% 0.33% 0.0 0.0% 0.02% 0.05% 0.20% 0.03% 0.23%
2003 15.3B 5.00% 0.49% 0.11% 0.60% 0.0 0.0% 0.03% 0.11% 0.38% 0.08% 0.46%
2004 8.7B 6.80% 1.18% 0.27% 1.45% 0.2 0.1% 0.06% 0.20% 0.79% 0.18% 0.97%
2005 12.3B 9.00% 3.01% 0.65% 3.66% 8.6 5.8% 0.12% 0.32% 2.12% 0.43% 2.55%
2006 9.7B 8.40% 4.52% 1.17% 5.69% 20.6 13.8% 0.15% 0.40% 2.99% 0.76% 3.76%
2007 12.9B 9.30% 4.04% 1.33% 5.37% 32.8 21.9% 0.18% 0.45% 2.50% 0.81% 3.30%
2008 11.1B 7.00% 1.61% 0.68% 2.29% 44.2 29.5% 0.12% 0.29% 1.17% 0.53% 1.70%
2009 35.2B 13.50% 0.23% 0.02% 0.25% 55.5 37.0% 0.04% 0.12% 0.31% 0.04% 0.35%
2010 40.3B 20.80% 0.07% 0.00% 0.07% 69.4 46.3% 0.03% 0.08% 0.13% 0.01% 0.14%
2011 40.9B 27.60% 0.03% 0.00% 0.03% 81.2 54.1% 0.02% 0.08% 0.06% 0.00% 0.06%
2012 137.2B 54.70% 0.01% 0.00% 0.01% 92.9 61.9% 0.01% 0.05% 0.03% 0.00% 0.03%
2013 117.2B 57.30% 0.01% 0.00% 0.01% 103.9 69.2% 0.01% 0.06% 0.01% 0.00% 0.01%
2014 72.3B 53.50% 0.00% 0.00% 0.00% 117.1 78.0% 0.01% 0.10% 0.00% 0.00% 0.00%
2015 135.6B 75.50% 0.00% 0.00% 0.00% 128.4 85.6% 0.00% 0.06% 0.00% 0.00% 0.00%
2016 120.9B 90.00% 0.00% 0.00% 0.00% 138.9 92.6% 0.00% 0.02% 0.00% 0.00% 0.00%
1. Reflects interest income forgone due to loan modifications (includes both interest rate and principal forbearance modifications)
2. Calculated as average loan age subtracted from 150 months (CAS maturity)
3. Calculated as default UPB for foreclosed loans that have yet to be disposed divided by total vintage origination UPB
4. Calculated as last UPB for loans that were in D180+ delinquency as of the last activity period in the public dataset divided by total vintage origination UPB
5. Reflects historical loss rates re-weighted to reflect the FICO, CLTV, & Risk Layer Count distribution of CAS 2017-C07 G1
6. In addition to the re-weighting, historical loss rates used in the comp process have been revised to reflect the ~4.38% WAC of the CAS pool
7. Reflects historical mod loss re-weighted to reflect the FICO, CLTV, & Risk Layer Count distribution of CAS 2017-C07 G1

© 2017 Fannie Mae. Trademarks of Fannie Mae. 36
0%
1%
2%
3%
4%
5%
2000 2001 2002 2003 2004 2005 2006 2007 2008 2009 2010 2011 2012 2013 2014
2017-C07 Group 1 Comped Loss Performance with Pipeline Consideration (60.01-80 LTV Loans)
Net Loss Mod Loss Comped Pipeline M2 Attach
M1 Attach M1 Detach B1 Attach Minimum CE
1. Bars reflect historical cum loss performance re-weighted to the CAS 2017-C07 G1 profile across FICO/CLTV/Risk Layer distribution
2. Mod Loss re-weighted to the CAS 2017-C07 G1 profile across FICO/CLTV/Risk Layer distribution (risk layers defined as: cashout refinance, investor property,
DTI>45 and single borrower)
3. Comped Pipeline equal to 25% of the previously defined loss pipeline re-weighted across the FICO/CLTV/Risk Layer distribution
Historical loss performance re-weighted to CAS 2017-C07 profile
Source: Fannie Mae Data Dynamics. http://www.fanniemae.com/DataDynamics
Connecticut Avenue Securities Investor Presentation
M1 Detach
M1 Attach
M2 Attach
B2 Attach
B1 Attach
3.05%
4.00%
0.50%
Minimum
Credit
Enhancement4.50%

© 2017 Fannie Mae. Trademarks of Fannie Mae. 37
0.00%
0.50%
1.00%
1.50%
2.00%
2.50%
3.00%
3.50%
4.00%
4.50%
5.00%
0 12 24 36 48 60 72 84 96 108 120 132 144
% o
f O
rig
inati
on
UP
B
Months From First Payment
Group 1 (60.01-80.00 OLTV) Comped Historical Loss
y2000 y2001 y2002 y2003 y2004 y2005 y2006
y2007 y2008 y2009 y2010 y2011 y2012 y2013
M2 Attach M1 Attach M1 Detach B1 Attach Min CE
Group 1: historical loss performance re-weighted to CAS 2017-C07 profile
1. Curves reflect historical cum loss performance re-weighted to the CAS 2017-C07 Group 1 profile across FICO/CLTV/Risk Layer distribution2. Comped loan modification concession (mod loss) for a given vintage has been distributed evenly across each point on the respective curve3. A projected terminal loss has been calculated for all vintages with fewer than 150 months of activity. Projected terminal loss calculated by adding 25% of the
default pipeline to the cumulative loss (default pipeline defined as foreclosed loans without a property disposition and loans that were in D180 delinquency as of the most recent available activity record)
Source: Fannie Mae October 2017 Data ReleaseConnecticut Avenue Securities Investor Presentation
M1 Detach
M1 Attach
M2 Attach
B1 Attach
B2 Attach
Minimum
Credit
Enhancement

© 2017 Fannie Mae. Trademarks of Fannie Mae. 38
Historical loss performance re-weighted to Group 1 CAS profiles
1. Dots reflect historical total loss performance re-weighted to all of Group 1 CAS profiles across FICO/CLTV/Risk Layer distribution2. For deals up to and including CAS 2015 C03, total loss is calculated in accordance with the fixed severity schedule; for the others, total loss is
calculated from actual net, modification and pipeline losses
Source: Fannie Mae Data Dynamics. http://www.fanniemae.com/DataDynamics
Connecticut Avenue Securities Investor Presentation
Fixed severity Actual loss

© 2017 Fannie Mae. Trademarks of Fannie Mae. 39
Loss/Severity statistical summary (Group 1)
Source: Fannie Mae October 2017 Data ReleaseConnecticut Avenue Securities Investor Presentation
Loss/Severity Summary Characteristics by Origination Year (Group 1)(Reflects loan status in performance dataset for activity through June 2017)
Loan Population: loans with zero balance code of '02', '03', '09', '15' with non-null Disposition dates
1999 -
20012002 2003 2004 2005 2006 2007 2008 2009 2010 2011 2012 2013 2014 2015 Total
Default UPB ($M)1 $1,812 $1,804 $4,312 $3,569 $8,712 $10,075 $11,459 $6,053 $1,795 $434 $163 $107 $53 $20 $7 $50,375
Default Rate (%) 0.6% 0.8% 1.4% 2.8% 6.3% 8.8% 8.3% 3.8% 0.7% 0.2% 0.1% 0.0% 0.0% 0.0% 0.0% 1.7%
EXPENSES:
Delinquent Interest 12% 12% 11% 11% 10% 11% 11% 11% 9% 8% 8% 6% 6% 6% 4% 11%
Total Liquidition Exp. 12% 13% 13% 12% 9% 8% 8% 9% 9% 11% 11% 10% 10% 9% 5% 10%
Foreclosure 5% 5% 4% 4% 3% 2% 2% 3% 2% 3% 3% 3% 3% 3% 3% 3%
Property
Preservation 4% 4% 4% 3% 3% 2% 2% 2% 3% 3% 4% 4% 4% 3% 1% 3%
Asset Recovery 0% 1% 1% 1% 1% 1% 1% 1% 1% 1% 1% 0% 1% 0% 0% 1%
Misc. Holding
Expenses/Credits1% 1% 1% 1% 1% 1% 1% 1% 1% 1% 1% 1% 0% 0% 0% 1%
Associated Taxes 3% 4% 4% 3% 3% 2% 2% 3% 3% 3% 3% 2% 2% 2% 1% 3%
Total Costs 124% 125% 124% 123% 119% 120% 120% 120% 118% 119% 119% 116% 116% 114% 109% 120%
PROCEEDS:
Net Sales Proceeds 76% 76% 82% 77% 69% 63% 63% 67% 77% 83% 84% 86% 90% 92% 91% 69%
Credit Enhancement 0% 0% 0% 0% 0% 0% 0% 0% 0% 0% 0% 0% 0% 0% 0% 0%
Repurchase/Make
Whole8% 5% 1% 1% 2% 4% 7% 10% 7% 4% 3% 1% 1% 0% 0% 5%
Other 6% 4% 3% 2% 1% 1% 1% 1% 1% 2% 1% 3% 2% 3% 7% 2%
Total Proceeds 91% 85% 86% 80% 72% 68% 71% 78% 85% 88% 88% 89% 93% 96% 99% 75%
Severity 33.4% 40.1% 37.7% 42.7% 47.4% 51.5% 48.7% 42.1% 32.6% 30.8% 31.3% 27.2% 23.0% 18.9% 10.2% 45.2%
Total Net Loss ($M) $605 $724 $1,626 $1,525 $4,132 $5,188 $5,584 $2,548 $586 $133 $51 $29 $12 $4 $1 $22,749
Origination Year
1 Default UPB, expenses and proceeds in this view are for completed foreclosures only. These are defined as loans with a zero balance code of '09', '03', '02', or '15' and non-null disposition dates. Default
rate is calculated as the sum of default UPB divided by the origination UPB. Expense and proceed line items are a percentage of default UPB.

© 2017 Fannie Mae. Trademarks of Fannie Mae. 40
Group 2 (80.01-97.00 OLTV) - historical acquisition profile
Source: Fannie Mae October 2017 Data ReleaseConnecticut Avenue Securities Investor Presentation
80-97 LTV Historical Loan Acquisition Profile
Orig year Loan Count Original UPB
WA Note
Rate WA Fico WA DTI WA OLTV WA OCLTV % 2nd Lien1 % Investor % Refi2 % TPO3 % CA
WA Risk
Layers4
1999 48,172 $6.0B 7.87% 690 34.6 92.1 92.1 0.0% 1.4% 12.2% 51.3% 11.2% 0.59
2000 393,070 $50.8B 8.21% 693 35.8 92.2 92.2 0.0% 1.9% 10.7% 54.7% 10.8% 0.62
2001 638,520 $89.0B 7.08% 694 34.6 91.2 91.2 0.1% 2.5% 38.4% 54.8% 10.9% 0.69
2002 521,034 $74.2B 6.65% 696 35.5 91.1 91.1 0.1% 3.5% 37.0% 56.9% 9.6% 0.75
2003 510,404 $75.5B 5.85% 698 35.1 90.9 90.9 0.3% 3.3% 42.3% 58.3% 7.7% 0.76
2004 213,038 $31.9B 5.97% 695 36.2 91.3 91.3 0.3% 3.9% 28.8% 57.7% 4.5% 0.89
2005 167,094 $26.8B 5.97% 701 38.6 90.8 90.8 0.3% 4.4% 34.2% 59.1% 2.3% 0.95
2006 131,247 $22.5B 6.55% 702 40.0 90.6 90.6 0.3% 4.9% 35.5% 61.0% 2.0% 1.00
2007 213,877 $41.1B 6.50% 702 40.5 90.6 90.6 0.4% 5.8% 43.4% 67.6% 4.6% 1.05
2008 261,651 $55.6B 6.19% 731 39.9 90.9 90.9 0.3% 3.4% 29.4% 62.9% 13.3% 0.64
2009 158,604 $34.5B 5.02% 755 33.6 89.9 89.9 0.5% 0.0% 41.1% 45.7% 8.9% 0.11
2010 120,206 $27.3B 4.72% 760 32.8 90.3 90.4 0.5% 0.0% 31.6% 54.8% 10.4% 0.03
2011 160,352 $35.8B 4.59% 758 33.5 91.3 91.3 0.3% 0.0% 26.4% 59.6% 12.4% 0.04
2012 319,013 $73.2B 3.87% 757 33.0 91.4 91.4 0.4% 0.0% 32.8% 55.1% 13.6% 0.05
2013 413,398 $93.5B 4.16% 751 34.2 92.1 92.1 0.4% 0.1% 21.9% 50.0% 13.2% 0.07
2014 376,434 $84.7B 4.49% 743 35.1 92.0 92.0 0.3% 0.2% 14.8% 45.1% 12.5% 0.12
2015 457,192 $107.1B 4.17% 744 34.7 92.0 92.0 0.3% 0.2% 17.1% 42.5% 11.8% 0.08
2016 326,788 $78.4B 3.95% 745 34.8 92.1 92.1 0.2% 0.2% 15.3% 40.3% 12.0% 0.09
Only loans with LTV between 80-97 are included. Excludes loans with CLTV >97
Statistics weighted by origination UPB
1Loans with CLTV more than 3 % greater than LTV are assumed to have second liens.
2Includes both Rate/Term and Cashout Refinances.
3Includes Broker and Correspondent originations.
4Risk Layers defined as: Investor Property, DTI>45, FICO<680, & Cash-out Refinance

© 2017 Fannie Mae. Trademarks of Fannie Mae. 41
Group 2: historical loss performance re-weighted to CAS 2017-C07 profile
Connecticut Avenue Securities Investor Presentation
Realized Loss Performance Default Pipeline ImplicationsCAS 2017-C07 G2 Equivalent Perf.(Not Including Default Pipeline)5
Orig YearRemaining
UPB Pool Factor12.5 Year Net Loss Mod Loss1 Total Loss
Rem. CAS Window
(Months)2
Rem. CAS Window %2
Unsold REO %3
Active D180 %4 Net Loss6 Mod Loss7
Total Comped
Loss
2000 0.3B 0.70% 0.14% 0.04% 0.18% 0.0 0.0% 0.02% 0.02% 0.04% 0.02% 0.06%
2001 1.2B 1.30% 0.27% 0.06% 0.33% 0.0 0.0% 0.02% 0.04% 0.11% 0.03% 0.14%
2002 2.1B 2.80% 0.48% 0.12% 0.60% 0.0 0.0% 0.04% 0.08% 0.24% 0.06% 0.29%
2003 4.9B 6.50% 0.89% 0.22% 1.11% 0.0 0.0% 0.09% 0.18% 0.52% 0.13% 0.65%
2004 2.7B 8.50% 1.75% 0.43% 2.18% 0.2 0.1% 0.18% 0.33% 0.94% 0.23% 1.17%
2005 2.9B 10.80% 3.55% 0.80% 4.35% 8.5 5.7% 0.26% 0.51% 1.95% 0.42% 2.37%
2006 2.3B 10.20% 4.72% 1.39% 6.11% 20.6 13.7% 0.37% 0.63% 2.44% 0.67% 3.11%
2007 4.9B 11.90% 4.85% 2.00% 6.85% 33.5 22.3% 0.46% 0.80% 2.30% 0.97% 3.27%
2008 5.0B 9.10% 1.97% 1.25% 3.22% 44.0 29.3% 0.27% 0.48% 0.98% 0.79% 1.77%
2009 4.8B 13.90% 0.28% 0.04% 0.32% 55.2 36.8% 0.07% 0.12% 0.30% 0.07% 0.37%
2010 6.2B 22.80% 0.06% 0.01% 0.07% 69.4 46.3% 0.05% 0.09% 0.08% 0.01% 0.09%
2011 10.4B 29.00% 0.02% 0.00% 0.02% 81.5 54.3% 0.05% 0.10% 0.02% 0.01% 0.03%
2012 38.6B 52.60% 0.01% 0.00% 0.01% 93.1 62.0% 0.04% 0.09% 0.01% 0.00% 0.01%
2013 50.0B 53.20% 0.01% 0.00% 0.01% 104.5 69.7% 0.04% 0.14% 0.01% 0.00% 0.01%
2014 47.8B 56.00% 0.00% 0.00% 0.00% 117.1 78.1% 0.04% 0.18% 0.00% 0.00% 0.00%
2015 86.0B 78.70% 0.00% 0.00% 0.00% 128.6 85.7% 0.02% 0.13% 0.00% 0.00% 0.00%
2016 74.1B 92.50% 0.00% 0.00% 0.00% 138.9 92.6% 0.00% 0.04% 0.00% 0.00% 0.00%
1. Reflects interest income forgone due to loan modifications (includes both interest rate and principal forbearance modifications)
2. Calculated as average loan age subtracted from 150 months (CAS maturity)
3. Calculated as default UPB for foreclosed loans that have yet to be disposed divided by total vintage origination UPB
4. Calculated as last UPB for loans that were in D180+ delinquency as of the last activity period in the public dataset divided by total vintage origination UPB
5. Reflects historical loss rates re-weighted to reflect the FICO, CLTV, & Risk Layer Count distribution of CAS 2017-C07 G2
6. In addition to the re-weighting, historical loss rates used in the comp process have been revised to reflect the ~4.39% WAC of the CAS pool
7. Reflects historical mod loss re-weighted to reflect the FICO, CLTV, & Risk Layer Count distribution of CAS 2017-C07 G2

© 2017 Fannie Mae. Trademarks of Fannie Mae. 421/31/2018
-1%
0%
1%
2%
3%
4%
5%
2000 2001 2002 2003 2004 2005 2006 2007 2008 2009 2010 2011 2012 2013 2014
2017-C07 Group 2 Comped Loss Performance with Pipeline Consideration (80.01-97 LTV Loans)
Net Loss Mod Loss Comped Pipeline M2 Attach
M1 Attach M1 Detach B1 Attach Minimum CE
1. Bars reflect historical cum loss performance re-weighted to the CAS 2017-C07 G2 profile across FICO/CLTV/Risk Layer distribution
2. Mod Loss re-weighted to the CAS 2017-C07 G2 profile across FICO/CLTV/Risk Layer distribution (risk layers defined as: cashout refinance, investor property,
DTI>45 and single borrower)
3. Comped Pipeline equal to 25% of the previously defined loss pipeline re-weighted across the FICO/CLTV/Risk Layer distribution
Historical loss performance re-weighted to CAS 2017-C07 profile
Source: Fannie Mae Data Dynamics. http://www.fanniemae.com/DataDynamics
Connecticut Avenue Securities Investor Presentation
M1 Detach
M1 Attach
M2 Attach
B2 Attach
B1 Attach
Minimum
Credit
Enhancement

© 2017 Fannie Mae. Trademarks of Fannie Mae. 43
-0.50%
0.00%
0.50%
1.00%
1.50%
2.00%
2.50%
3.00%
3.50%
4.00%
4.50%
0 12 24 36 48 60 72 84 96 108 120 132 144
% o
f O
rigin
ation U
PB
Months From First Payment
Group 2 (80.01-97.00 OLTV) Comped Historical Loss
y2000 y2001 y2002 y2003 y2004 y2005 y2006
y2007 y2008 y2009 y2010 y2011 y2012 y2013
M2 Attach M1 Attach M1 Detach B1 Attach Min CE
Group 2: historical loss performance re-weighted to CAS 2017-C07 profile
1. Curves reflect historical cum loss performance re-weighted to the CAS 2017-C07 Group 2 profile across FICO/CLTV/Risk Layer distribution2. Comped loan modification concession (mod loss) for a given vintage has been distributed evenly across each point on the respective curve3. A projected terminal loss has been calculated for all vintages with fewer than 150 months of activity. Projected terminal loss calculated by adding 25% of the
default pipeline to the cumulative loss (default pipeline defined as foreclosed loans without a property disposition and loans that were in D180 delinquency as of the most recent available activity record)
Source: Fannie Mae October 2017 Data ReleaseConnecticut Avenue Securities Investor Presentation
M1 Detach
M1 Attach
M2 Attach
B1 Attach
B2 Attach
Minimum Credit
Enhancement

© 2017 Fannie Mae. Trademarks of Fannie Mae. 44
Historical loss performance re-weighted to Group 2 CAS profiles
1. Dots reflect historical total loss performance re-weighted to all of Group 2 CAS profiles across FICO/CLTV/Risk Layer distribution2. For deals up to and including CAS 2015 C03, total loss is calculated in accordance with the fixed severity schedule; for the others, total loss is
calculated from actual net, modification and pipeline losses
Source: Fannie Mae Data Dynamics. http://www.fanniemae.com/DataDynamics
Connecticut Avenue Securities Investor Presentation
Fixed severity Actual loss

© 2017 Fannie Mae. Trademarks of Fannie Mae. 45
Loss/Severity statistical summary (Group 2)
Source: Fannie Mae October 2017 Data ReleaseConnecticut Avenue Securities Investor Presentation
Loss/Severity Summary Characteristics by Origination Year (Group 2)
(Reflects loan status in performance dataset for activity through June 2017)
Loan Population: loans with zero balance code of '02', '03', '09', '15' with non-null Disposition dates
1999 -
20012002 2003 2004 2005 2006 2007 2008 2009 2010 2011 2012 2013 2014 2015 Total
Default UPB ($M)1 $2,596 $1,805 $2,729 $1,852 $2,846 $3,082 $6,474 $4,824 $571 $153 $96 $89 $99 $52 $14 $27,282
Default Rate (%) 1.8% 2.4% 3.6% 5.8% 10.6% 13.7% 15.8% 8.7% 1.7% 0.6% 0.3% 0.1% 0.1% 0.1% 0.0% 2.7%
EXPENSES:
Delinquent Interest 11% 11% 10% 11% 11% 12% 11% 10% 7% 6% 7% 5% 5% 5% 3% 11%
Total Liquidition Exp. 11% 12% 13% 13% 11% 10% 9% 8% 8% 9% 10% 10% 9% 8% 5% 10%
Foreclosure 4% 4% 4% 4% 3% 3% 3% 2% 2% 2% 3% 3% 3% 2% 2% 3%
Property
Preservation 3% 4% 4% 3% 3% 2% 2% 2% 2% 3% 4% 4% 3% 3% 1% 3%
Asset Recovery 0% 0% 1% 1% 1% 0% 0% 1% 1% 1% 1% 1% 0% 0% 0% 0%
Misc. Holding
Expenses/Credits1% 1% 1% 2% 2% 1% 1% 1% 1% 1% 1% 1% 1% 1% 0% 1%
Associated Taxes 2% 3% 3% 3% 3% 2% 2% 2% 2% 2% 2% 2% 2% 2% 1% 2%
Total Costs 122% 123% 123% 124% 122% 121% 120% 118% 115% 115% 116% 116% 115% 113% 108% 121%
PROCEEDS:
Net Sales Proceeds 75% 71% 71% 66% 60% 56% 56% 61% 73% 80% 82% 83% 80% 80% 85% 63%
Credit Enhancement 24% 23% 22% 23% 23% 24% 24% 22% 20% 21% 24% 24% 25% 24% 17% 23%
Repurchase/Make
Whole5% 4% 2% 2% 3% 5% 8% 10% 4% 2% 1% 1% 0% 0% 0% 6%
Other 3% 3% 2% 2% 2% 2% 2% 1% 1% 1% 1% 1% 2% 2% 2% 2%
Total Proceeds 107% 101% 97% 93% 88% 87% 90% 96% 98% 104% 107% 108% 108% 106% 104% 94%
Severity 15.1% 22.4% 26.2% 30.4% 33.5% 34.5% 30.8% 22.7% 16.9% 10.9% 9.0% 7.6% 6.8% 6.3% 4.2% 26.8%
Total Net Loss ($M) $391 $404 $716 $563 $952 $1,063 $1,993 $1,097 $96 $17 $9 $7 $7 $3 $1 $7,319
Origination Year
1 Default UPB, expenses and proceeds in this view are for completed foreclosures only. These are defined as loans with a zero balance code of '02', '03', '09', or '15' and non-null disposition dates.
Default rate is calculated as the sum of default UPB divided by the origination UPB. Expense and proceed line items are a percentage of default UPB.

© 2017 Fannie Mae. Trademarks of Fannie Mae. 46
Group 1/Group 2 loss comparison
*RMW = Repurchase Make Whole proceeds**Other = Amounts other than sales proceeds including redemption proceeds received from the mortgagor
Connecticut Avenue Securities Investor Presentation
0%
20%
40%
60%
80%
100%
120%
Group 1 Proceeds as % of Defaulted UPB
CE Proceeds Sales Proceeds Other** RMW*
0%
20%
40%
60%
80%
100%
120%
Group 2 Proceeds as % of Defaulted UPB
CE Proceeds Sales Proceeds Other** RMW*
0%
2%
4%
6%
8%
10%
12%
14%
16%
18%
Default Rate
Group 1 Group 2
0%
10%
20%
30%
40%
50%
60%
Severity
Group 1 Group 2

© 2017 Fannie Mae. Trademarks of Fannie Mae. 47
Group 1/Group 2 loss comparison
Connecticut Avenue Securities Investor Presentation
2017-C07 Group 1 Comped loss performance with
pipeline consideration (60.01-80.00 LTV loans)
2017-C07 Group 2 Comped loss performance with
pipeline consideration (80.01-97.00 LTV loans)
0%
1%
2%
3%
4%
5%
0%
1%
2%
3%
4%
5%
3.05%
4.00%
0.50%
4.50%
3.40%
4.25%
0.50%
4.50%
1. Bars reflect historical cum loss performance re-weighted to the CAS 2017-C07 G1/G2 profile across FICO/CLTV/Risk Layer distribution2. Mod Loss re-weighted to the CAS 2017-C07 G1/G2 profile across FICO/CLTV/Risk Layer distribution (risk layers defined as: cashout refinance, investor property,
DTI>45 and single borrower)3. Comped Pipeline equal to 25% of the previously defined loss pipeline re-weighted across the FICO/CLTV/Risk Layer distribution

© 2017 Fannie Mae. Trademarks of Fannie Mae. 48
Investor distribution and security performance

© 2017 Fannie Mae. Trademarks of Fannie Mae. 49
83%
5% 11%
1%
81%
2%4% 12%
61%11%
18%
10%
35%
1%
63%
<1%<1%
Program to date investor distribution
*Includes pensions, mutual funds, sovereign wealth funds, state/local government**Data through CAS 2017-C07Source: Fannie Mae and dealers, primary issuance only
2013 2014 2015 2016
M-1
M-2
64%
5%
19%
12%
50%
6%
42%
<1%2%
37%
<1%
55%
<1%
7%
42%
48%
1%
8%
2013 2014 2015 2016 2017
Investor Type M1 M2 M1 M2 M1 M2 M1 M2 M1 M2
Asset Manager* 64% 35% 61% 50% 81% 37% 83% 42% 82% 41%
Depository Institution/Bank 5% 1% 11% 6% 2% <1% 0% 0% <1% 0%
Hedge Fund/Private Equity 19% 63% 18% 42% 4% 55% 5% 48% 7% 46%
Insurance Company 12% <1% 10% 0% 12% <1% 11% 1% 10% 3%
REIT 0% <1% 0% 2% 0% 7% 1% 8% 0% 10%
Connecticut Avenue Securities Investor Presentation
2017**
82%
<1% 7%
10%
41%
46%
3%10%

© 2017 Fannie Mae. Trademarks of Fannie Mae. 50
CRT monthly average trading volume
Connecticut Avenue Securities Investor Presentation
$22.6B of secondary trading in CAS bonds in the last 12 months, over one times float of approximately $21.3B.
Source: Fannie Mae Survey
0%
2%
4%
6%
8%
10%
12%
-
500
1,000
1,500
2,000
2,500
3,000
3,500
4,000
4,500
5,000
Q1 2016 Q2 2016 Q3 2016 Q4 2016 Q1 2017 Q2 2017 Q3 2017
$ M
illio
ns
Investment Grade Non-Investment Grade Total Volume/Outstanding UPB (RHS)

© 2017 Fannie Mae. Trademarks of Fannie Mae. 51
Connecticut Avenue Securities spreads
Source: JP Morgan Markets, Fannie Mae
*As of November 2017
Connecticut Avenue Securities Investor Presentation
0
50
100
150
200
250
300
350
400
450
500
Spre
ad O
ver
Index/B
enchm
ark
(bps)
1M1 (1mL) 1M2 (1mL) 2M1 (1mL)
2M2 (1mL) CMBS BBB (vs swaps) CDX 5Y HY (vs swaps)
BBB Corporates (vs swaps)

© 2017 Fannie Mae. Trademarks of Fannie Mae. 52
CAS Ratings Overview
M1 ratings distribution
M2 ratings distribution
Connecticut Avenue Securities Investor Presentation
All previously non-rated CAS M2 bonds are now rated.
0%
10%
20%
30%
40%
50%
60%
BBBB+BBB-BBBBBB+A-AA+AA-AAAA+AAA
Initial Ratings Distribution Current Ratings Distribution
0%
10%
20%
30%
40%
50%
Not RatedB-BB+BB-BBBB+BBB-BBBInitial Ratings Distribution Upgrade Ratings Distribution

© 2017 Fannie Mae. Trademarks of Fannie Mae. 53
NAIC Designations
Designation Class
NAIC 2 CAS 2015-C04 1M2
NAIC 2 CAS 2015-C04 2M2
NAIC 1 CAS 2016-C01 1M2
NAIC 2 CAS 2016-C01 2M2
NAIC 1 CAS 2016-C02 1M2
NAIC 2 CAS 2016-C03 1M2
NAIC 2 CAS 2016-C03 2M2
NAIC 2 CAS 2016-C04 1M2
NAIC 3 CAS 2016-C05 2M2
NAIC 2 CAS 2016-C06 1M2
NAIC 3 CAS 2016-C07 2M2
Designation Class
NAIC 1 CAS 2015-C04 1M1
NAIC 1 CAS 2015-C04 2M1
NAIC 1 CAS 2016-C01 1M1
NAIC 1 CAS 2016-C01 2M1
NAIC 1 CAS 2016-C02 1M1
NAIC 1 CAS 2016-C03 1M1
NAIC 1 CAS 2016-C03 2M1
NAIC 1 CAS 2016-C04 1M1
NAIC 1 CAS 2016-C05 2M1
NAIC 1 CAS 2016-C06 1M1
NAIC 1 CAS 2016-C07 2M1
M1 Classes M2 Classes
CAS transactions received favorable NAIC designations for the 2016 filing year.
Connecticut Avenue Securities Investor Presentation

© 2017 Fannie Mae. Trademarks of Fannie Mae. 54
New investor resources

© 2017 Fannie Mae. Trademarks of Fannie Mae. 55
Collateral UnderwriterTM
Desktop Underwriter®
Servicing Management
Default UnderwriterTM
Property Valuation and
Analytics
Web-based credit-risk sharing resources bolster transparency
Gain a comprehensive overview of our industry-leading credit risk management processes
Demo our industry-leading, cutting-edge tools
Sign-up to receive Fannie Mae’s Credit Risk Transfer Commentary and News – delivered directly to your inbox
Gain confidence in our approach – view consolidated third-party due diligence results
Interact with and analyze Fannie Mae’s historical loan performance data, deal issuance data, and ongoing disclosure data with Data DynamicsTM
Drillable analysis of:
Credit Risk Sharing Webpage: http://fanniemae.com/portal/funding-the-market/credit-risk/index.html

© 2017 Fannie Mae. Trademarks of Fannie Mae. 56
Data Dynamics illustrative analysis
HistoricalPerformance
Data
CAS geographical analysis Historical comparative analysis
Access Data Dynamics: www.fanniemae.com/datadynamics
Cohort Default UPB Foreclosure Property
Preservation Asset
Recovery Misc. Taxes
Forgone Interest
Net Sales Credit
Enhancement Repurchase / Make Whole
Other Proceeds
Net Loss
2006 $1,117M $41.7M $38.0M $2.9M $4.0M $22.0M $105.6M $869.8M $173.2M $54.8M $62.5M $170.3M
2007 $1,329M $48.4M $36.5M $3.6M $4.1M $28.1M $117.1M $1,015.7M $184.7M $46.1M $60.8M $259.7M
2008 $2,124M $58.9M $43.6M $5.9M $3.9M $40.3M $169.2M $1,516.6M $229.5M $92.3M $40.1M $566.9M
2009 $5,327M $107.0M $79.8M $16.5M $11.2M $82.7M $393.9M $3,356.9M $480.6M $418.4M $42.4M $1,719.7M
2010 $10,996M $238.6M $171.4M $44.1M $31.4M $178.0M $888.2M $6,818.7M $829.4M $957.5M $92.7M $3,849.9M
2011 $15,686M $348.6M $315.0M $79.8M $75.5M $286.9M $1,438.1M $9,224.1M $1,076.5M $1,241.6M $202.5M $6,485.4M
2012 $13,417M $333.6M $302.2M $85.6M $101.4M $294.8M $1,287.7M $8,546.4M $943.8M $652.8M $188.5M $5,490.9M
2013 $9,402M $290.7M $279.4M $65.8M $120.0M $278.8M $1,109.3M $6,699.6M $647.6M $248.1M $153.5M $3,797.0M
2014 $6,890M $280.0M $286.2M $47.4M $139.7M $276.9M $1,028.4M $5,141.6M $490.2M $61.4M $138.3M $3,117.3M
2015 $5,682M $273.0M $317.3M $38.3M $144.4M $275.9M $986.2M $4,458.1M $375.2M $24.8M $123.6M $2,735.4M
2016 $2,914M $129.2M $129.6M $16.3M $56.2M $125.2M $553.8M $2,295.5M $150.6M $11.5M $59.2M $1,407.1M
Fannie Mae Credit Insurance Risk Transfer (CIRT) Overview
© 2017 Fannie Mae. Trademarks of Fannie Mae. 57
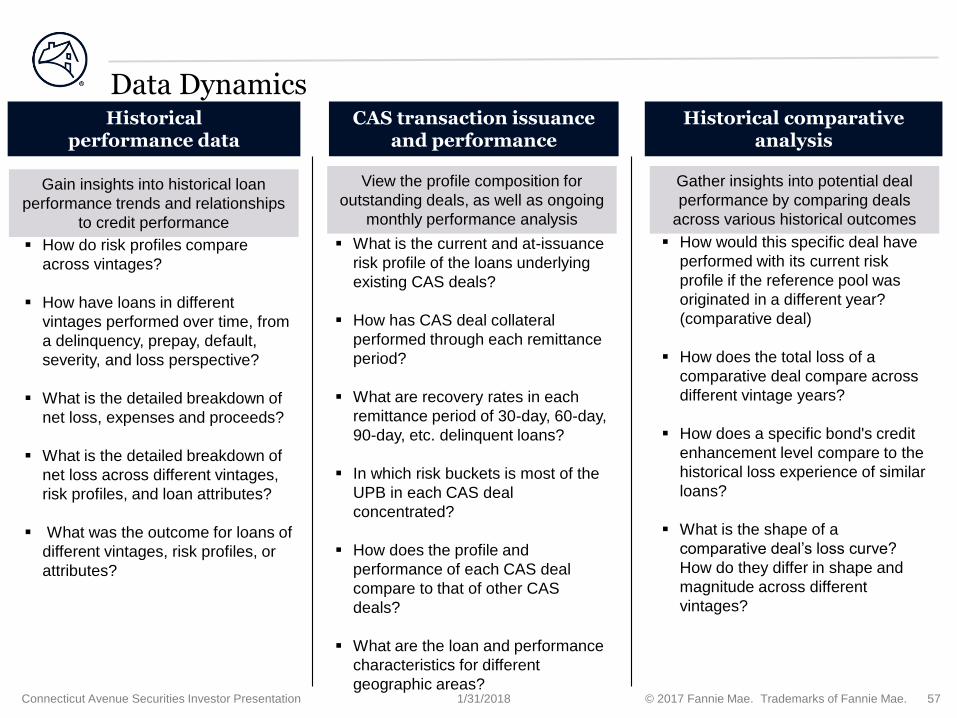
Data DynamicsHistorical
performance dataCAS transaction issuance
and performanceHistorical comparative
analysis
How do risk profiles compare
across vintages?
How have loans in different
vintages performed over time, from
a delinquency, prepay, default,
severity, and loss perspective?
What is the detailed breakdown of
net loss, expenses and proceeds?
What is the detailed breakdown of
net loss across different vintages,
risk profiles, and loan attributes?
What was the outcome for loans of
different vintages, risk profiles, or
attributes?
What is the current and at-issuance
risk profile of the loans underlying
existing CAS deals?
How has CAS deal collateral
performed through each remittance
period?
What are recovery rates in each
remittance period of 30-day, 60-day,
90-day, etc. delinquent loans?
In which risk buckets is most of the
UPB in each CAS deal
concentrated?
How does the profile and
performance of each CAS deal
compare to that of other CAS
deals?
What are the loan and performance
characteristics for different
geographic areas?
How would this specific deal have
performed with its current risk
profile if the reference pool was
originated in a different year?
(comparative deal)
How does the total loss of a
comparative deal compare across
different vintage years?
How does a specific bond's credit
enhancement level compare to the
historical loss experience of similar
loans?
What is the shape of a
comparative deal’s loss curve?
How do they differ in shape and
magnitude across different
vintages?
Gain insights into historical loan
performance trends and relationships
to credit performance
View the profile composition for
outstanding deals, as well as ongoing
monthly performance analysis
Gather insights into potential deal
performance by comparing deals
across various historical outcomes
1/31/2018Connecticut Avenue Securities Investor Presentation

© 2017 Fannie Mae. Trademarks of Fannie Mae. 58
■ Fannie Mae’s Single-Family Loan Performance Dataset provides historical monthly loan performance data on a portion of our single-family book of business to promote better understanding of the credit performance of Fannie Mae mortgage loans.
■ Includes a subset of our fully amortizing, full documentation, single-family, conventional fixed-rate mortgage acquisitions since January 2000, and is updated on a quarterly basis to include a new quarter of acquisitions (currently through Q3 2016) and performance (currently through Q2 2017)
■ Over 50 data elements per loan, including key loan risk factors, loan term characteristics, collateral characteristics, servicing data, and disposition data
■ Investor resources including file layout, glossary, FAQs, web tutorials, and statistical summaries support download of the dataset
Historical loan-level performance data
Appendix D: Loan level disclosure
Connecticut Avenue Securities Investor Presentation
■ One-click download feature to ease file-download experience
■ Inclusion of one million loans that were modified through HARP®, supporting market analysis of high loan-to-value refinance assistance programs
■ Inclusion of fixed-rate loans with 5 year to 25 year terms
■ Aggregate analysis of the loan-level historical data
■ Filter dataset across several dimensions to compare risk profiles and performance
■ View the HARP enhanced analysis at an aggregate level
Recent Enhancements Data Dynamics Features
www.fanniemae.com/loanperformance www.fanniemae.com/datadynamics

© 2017 Fannie Mae. Trademarks of Fannie Mae. 59
CAS loan-level data disclosure
Insert Presentation Title Here
■ Fannie Mae makes available nearly 90 loan-level disclosure fields to support analysis of its CAS deals and program
■ A one-click download feature in Data Dynamics enables users to download all available loan-level files at one time
■ Fields include key loan risk factors, loan term characteristics, collateral characteristics, servicing data, and disposition data, such as (not limited to):
Loan and Borrower
Characteristics
Property TypeHomeReady Program Indicator First Time Home Buyer Indicator
Number of Borrowers Original Debt to Income Ratio
Borrower FICO and Co-Borrower
FICO scores (at origination, deal
issuance, and ongoing)
Collateral
CharacteristicsNumber of Units
Original Loan to Value Ratio (LTV)
and Combined LTV Ratio (CLTV)Three digit zip code
Occupancy Type Metropolitan Statistical AreaProperty Inspection Waiver
Flag(1)
Servicing Data Servicer Name Loan Payment HistoryReason and Date as to why a loan
balance went to zero
Mortgage Insurance Cancellation
IndicatorModification Flag Current Loan Delinquency Status
Loan Term
CharacteristicsOriginal and Current Interest Rate Original Loan Term Loan Age
Original and Current UPB Origination Date Maturity Date
Disposition Data Last Paid Installment Date Foreclosure Date Detailed Proceed Fields
Original and Current List Price and
DateDisposition Date Detailed Expense Fields
Connecticut Avenue Securities Investor Presentation
(1) Available beginning with 2017-C07 forward
Appendix D: Loan level disclosure

© 2017 Fannie Mae. Trademarks of Fannie Mae. 60
A. How mortgage insurance works-High LTV loans 61
B. CAS deal summaries and comparisons 63
C. Credit risk management 67
D. Additional resources 78
Appendix
Connecticut Avenue Securities Investor Presentation

© 2017 Fannie Mae. Trademarks of Fannie Mae. 61
How Mortgage Insurance (MI) Works I: Possible Claim Outcomes
Appendix A: How does mortgage insurance work- Group 2 deals
Connecticut Avenue Securities Investor Presentation
© 2017 Fannie Mae. Trademarks of Fannie Mae. 62
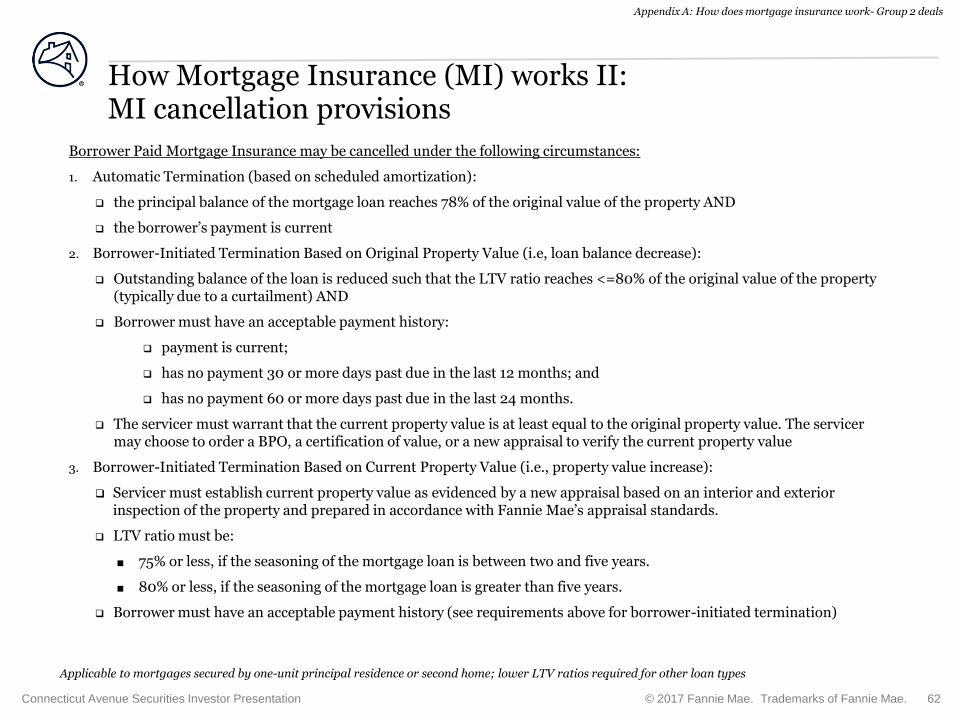
How Mortgage Insurance (MI) works II: MI cancellation provisions
Borrower Paid Mortgage Insurance may be cancelled under the following circumstances:
1. Automatic Termination (based on scheduled amortization):
the principal balance of the mortgage loan reaches 78% of the original value of the property AND
the borrower’s payment is current
2. Borrower-Initiated Termination Based on Original Property Value (i.e, loan balance decrease):
Outstanding balance of the loan is reduced such that the LTV ratio reaches <=80% of the original value of the property (typically due to a curtailment) AND
Borrower must have an acceptable payment history:
payment is current;
has no payment 30 or more days past due in the last 12 months; and
has no payment 60 or more days past due in the last 24 months.
The servicer must warrant that the current property value is at least equal to the original property value. The servicer may choose to order a BPO, a certification of value, or a new appraisal to verify the current property value
3. Borrower-Initiated Termination Based on Current Property Value (i.e., property value increase):
Servicer must establish current property value as evidenced by a new appraisal based on an interior and exterior inspection of the property and prepared in accordance with Fannie Mae’s appraisal standards.
LTV ratio must be:
■ 75% or less, if the seasoning of the mortgage loan is between two and five years.
■ 80% or less, if the seasoning of the mortgage loan is greater than five years.
Borrower must have an acceptable payment history (see requirements above for borrower-initiated termination)
Applicable to mortgages secured by one-unit principal residence or second home; lower LTV ratios required for other loan types
Appendix A: How does mortgage insurance work- Group 2 deals
Connecticut Avenue Securities Investor Presentation

© 2017 Fannie Mae. Trademarks of Fannie Mae. 63
Deal summaries & comparison – Group 1
Appendix B: CAS Deal Summaries and comparisons
Connecticut Avenue Securities Investor Presentation
2016-C01 2016-C02 2016-C03 2016-C04 2016-C06 2017-C01 2017-C03 2017-C05 2017-C06 2017-C07
Pricing Date 2/9/2016 3/22/2016 4/12/2016 7/19/2016 11/1/2016 1/18/2017 5/2/2017 7/18/2017 8/15/2017 11/14/2017
Pricing (1 Month
LIBOR +)
M1: 195 bps
M2: 675 bps
B: 1175 bps
M1: 215 bps
M2: 600 bps
B: 1225 bps
M1: 200 bps
M2: 530 bps
B: 1175 bps
M1: 145 bps
M2:425 bps
B: 1025 bps
M1: 130 bps
M2:425 bps
B: 925 bps
M1:130 bps
M2: 355 bps
1B-1: 575 bps
M1:95 bps
M2: 300 bps
1B-1: 485 bps
M1:55 bps
M2:220 bps
1B-1:360 bps
M1: 75 bps
M2: 265 bps
1B-1 415 bps
M1: 65 bps
M2: 240 bps
1B-1: 400 bps
SizeM1: $207.6 mm
M2: $333.9 mm
B: $94.9 mm
M1: $342.3 mm
M2: $599.1 mm
B: $90.1 mm
M1: $157.8
mm
M2: $180.3mm
B: $59.0 mm
M1: $500.9 mm
M2: $701.2 mm
B: $120.0 mm
M1: $393.3 mm
M2: $550.6 mm
B: $80.0 mm
M1: $457.3 mm
M2: $685.9 mm
1B-1: $207.8
mm
M1: $568.2 mm
M2: $607.4 mm
1B-1: $195.9 mm
M1: $353.3 mm
M2: $789.7 mm
1B-1: $207.8 mm
M1: $156.6 mm
M2: $281.9 mm
1B-1: $78.3 mm
M1: $186.2 mm
M2: $401.7 mm
1B-1: $97.9 mm
Credit
Enhancement
M-1: 2.85%
M-2: 1.00%
B: 0%
M-1: 2.75%
M-2: 1.00%
B: 0%
M-1: 2.60%
M-2: 1.00%
B: 0%
M-1: 2.75%
M-2: 1.00%
B: 0%
M-1: 2.75%
M-2: 1.00%
B: 0%
M-1: 2.65%
M-2: 1.00%
1B-1: 0.50%
M-1: 2.55%
M-2: 1.00%
1B-1: 0.50%
M-1: 2.90%
M-2: 1.00%
1B-1: 0.50%
M-1 2.80%
M-2: 1.00%
1B-1: 0.50%
M-1: 3.05%
M-2: 1.00%
1B-1: 0.50%
Minimum Credit
Enhancement Test
Credit
enhancement
greater than
4.75%
Credit
enhancement
greater than
4.75%
Credit
enhancement
greater than
4.50%
Credit
enhancement
greater than
4.75%
Credit
enhancement
greater than
4.75%
Credit
enhancement
greater than
4.00%
Credit
enhancement
greater than
4.00%
Credit
enhancement
greater than
3.75%
Credit enhancement
greater than 3.80%
Credit enhancement
greater than 4.50%
Vertical Slice
Retained
M-1:5.00%
M-2: 5.00%
B: 50%
M-1:5.00%
M-2: 5.00%
B: 75%
M-1:5.00%
M-2: 5.00%
B: 50%
M-1:5.00%
M-2: 5.00%
B: 72%
M-1:5.00%
M-2: 5.00%
B: 76%
M-1: 5%
M-2: 5%
1B-1: 5%
M-1: 5%
M-2: 5%
1B-1: 5%
M-1: 5%
M-2: 5%
1B-1: 5%
M-1: 5%
M-2: 5%
1B-1: 5%
M-1: 5%
M-2: 5%
1B-1: 5%
Ratings
Moody's/KBRA
M-1:
Baa3(sf)/BBB(sf)
M-2: Ba3(sf)/BB-
(sf)
B: Unrated
Moody's/KBRA
M-1:
Baa3(sf)/BBB+(sf)
M-2: B1(sf)/BB(sf)
B: Unrated
Fitch/KBRA
M-1: BBB-(sf) /
BBB(sf)
M-2: B+(sf) /
BB(sf)
B: Unrated
Moody’s/KBRA
M-1:
Baa3(sf)/BBB+(sf)
M-2: B1(sf)/BB-
(sf)
B: Unrated
Fitch/KBRA
M-1: BBB-
sf/BBB(sf)
M-2: B+sf/BB-(sf)
B: Unrated
Fitch/KBRA
M-1: BBB-
sf/BBB+(sf)
M-2: Bsf/BB(sf)
1B-1: Unrated
Fitch/KBRA
M-1: Baa3
(sf)/BBB(sf)
M-2: B2(sf)/
B(high)(sf)
1B-1: Unrated
Moody’s/DBRS
M-1: Baa3
(sf)/BBB (sf)
M-2: B3 (sf)/B
(high)(sf)
1B-1: Unrated
Fitch/Kroll
M-1: BBB –
sf/BBB+(sf)
M-2: Bsf/BB(sf)
1B-1: Unrated
Fitch/Kroll
M-1: BBB-sf/BBB+ (sf)
M-2: Bsf/BB- (sf)
1B-1: Unrated
Lead/Co Lead JPM/Citi BAML/WF BAR/CS BAML/BAR BAML/JPM BAML/WF BAR/BAML BAML/Citi BAR/MS BAML/NOM
Acquisition PeriodJan 2015/Feb
2015
Mar 2015/May
2015Jun-15 Jul 2015/Oct 2015
Nov 2015/Feb
2016
Mar 2016/Jun
2016
July
2016/October
2016
October
2016/December
2016
January
2017/February 2017February 2017/April 2017
Loan Count 80,606 146,193 49,687 183,335 143,561 180,187 167,115 174,672 69,367 88,483
UPB $19.0 BN $36.0 BN $11.9 BN $42.1 BN $33.1 BN $43.7 BN $41.8 BN $44.4 BN $16.5 BN $20.6 BN

© 2017 Fannie Mae. Trademarks of Fannie Mae. 64
Deal summaries & comparison – Group 1
Connecticut Avenue Securities Investor Presentation
Appendix B: CAS Deal Summaries and comparisons
2016-C01 2016-C02 2016-C03 2016-C04 2016-C06 2017-C01 2017-C03 2017-C05 2017-C06 2017-C07
Avg Principal Balance $240,992 $251,235 $238,725 $230,063 $230,729 $242,848 $250,317 $254,100 $240,576 $236,462
Avg Gross Mortgage Rate 4.18% 4.00% 4.03% 4.22% 4.20% 4.02% 3.82% 3.76% 4.08 4.38%
Avg Remaining Term to
Stated Maturity 349 months 351 months 352 months 351 months 352 months 353 months 353 months 353 months 354 months 353 months
Weighted Avg Original
Term360 Months 360 Months 360 months 360 months 360 months 360 months 359 months 359 months 359 months 359 months
Weighted Avg Loan Age 11 Months 9 Months 8 months 9 months 8 months 7 months 6 months 6 months 5 months 6 months
Avg Original LTV Ratio 75.25% 74.92% 75.40% 75.67% 75.40% 75.20% 75.02% 74.67% 74.91% 75.31%
Avg Original CLTV Ratio 76.23% 76.00% 76.50% 76.70% 76.30% 76.0% 75.73% 75.34% 75.64% 76.01%
Avg Debt-to-Income Ratio 34.23% 33.77% 33.80% 34.12% 34.30% 34.10% 33.54% 33.60% 34.59% 35.07%
Credit Score 749 752 751 748 746 749 752 752 746 744
Loan Purpose (% UPB)
No cash-out refinance:
Purchase:
Cash-out refinance:
34.49%
42.98%
22.52%
40.262%
37.39%
22.34%
28.57%
49.67%
21.75%
20.69%
56.98%
22.43%
23.81%
51.27%
24.92%
28.54%
47.01%
24.45%
29.31%
48.34%
22.34%
32.54%
41.16%
26.30%
25.99%
44.98%
29.03%
28.35%
52.76%
18.18%
Percent Owner Occupied 84.54% 85.88% 85.20% 84.33% 85.10% 86.50% 88.15% 87.71% 84.87% 83.59%
Top Three Geographic
Concentration (% UPB)
California:
29.71%
Texas: 6.84%
Florida:
4.78%
California:
31.15%
Texas:
6.50%
Colorado:
4.53%
California: 27.40%
Texas:7.30%
Florida: 5.10%
California: 22.80%
Texas: 7.60%
Florida: 5.37%
California: 22.50%
Texas: 7.20%
Florida: 5.9%
California: 25.75%
Texas:7.26%
Florida: 5.56%
California: 24.33%
Texas:6.90%
Florida: 4.81%
California: 24.23%
Texas: 6.44%
Colorado: 5.02%
California: 21.78%
Texas:
7.32%
Florida:
5.79%
California: 21.76%
Texas: 7.75%
Washington: 4.82%
Top Three Sellers (%
UPB)
Wells Fargo:
14.45%
Quicken
Loans: 6.33%
JPM
Chase:3.95%
Wells Fargo:
12.23%
Quicken
Loans:
6.21%
JPM
Chase:2.90
%
Wells Fargo:
12.85%
Quicken Loans:
5.07%
Flagstar:3.45%
Wells Fargo:
12.10%
Quicken Loans:
5.24%
Flagstar: 2.82%
Wells Fargo:
13.51%
Quicken Loans:
6.68%
JPM Chase: 2.80%
Wells Fargo:
13.83%
Quicken Loans:
6.55%
Flagstar: 3.44%
Wells Fargo:
13.78%
Quicken Loans:
5.98%
JPM Chase: 3.36%
Wells Fargo:
16.57%
Quicken Loans:
7.24%
JPM: 3.56%
Wells Fargo:
20.81%
Quicken Loans:
6.86%
SunTrust: 4.41%
Wells Fargo:
15.11%
Quicken Loans:
6.78%
JPM Chase: 5.59%

© 2017 Fannie Mae. Trademarks of Fannie Mae. 65
Deal summaries & comparison – Group 2
Connecticut Avenue Securities Investor Presentation
Appendix B: CAS Deal Summaries and comparisons
2016-C01 2016-C03 2016-C05 2016-C07 2017-C02 2017-C04 2017-C06 2017-C07
Pricing Date 2/9/2016 2/12/2016 8/2/2016 12/1/2016 3/15/2017 5/23/2017 8/15/2017 11/14/2017
Pricing (1 Month
LIBOR +)M1: 210 bps
M2: 695 bps
M1: 220 bps
M2: 590 bps
B: 1275 bps
M1: 135 bps
M2: 445 bps
B: 1075 bps
M1: 130 bps
M2: 435 bps
B: 950 bps
M1: 115 bps
M2: 365 bps
2B-1: 550 bps
M1: 85 bps
M2: 285 bps
2B-1: 505 bps
M1: 75 bps
M2: 280 bps
2B-1: 445 bps
M1: 65 bps
M2: 250 bps
1B-1: 445 bps
SizeM1: $113.2 mm
M2: $195.4 mm
M1: $241.2 mm
M2: $482.4 mm
B: $45 mm
M1: $385.7 mm
M2: $716.3 mm
B: $100 mm
M1: $192.5 mm
M2: $449.2 mm
B: $60 mm
M1: $379.9
M2: $759.8
2B-1: $189.9
M1: $257.8
M2: $601.5
2B-1: $143.2
M1: $117.9
M2: $360.9
2B-1: $73.6
M1: $107.7 mm
M2: $303.9 mm
1B-1: $63.3 mm
Credit EnhancementM-1: 2.90%
M-2: 1.00%
M-1: 3.00%
M-2: 1.00%
B: 0%
M-1: 3.00%
M-2: 1.00%
B: 0%
M-1: 3.10%
M-2: 1.00%
B: 0%
M-1: 3.00%
M-2: 1.00%
2B-1: 0.50%
M-1: 3.10%
M-2: 1.00%
2B-1: 0.50%
M-1: 3.45%
M-2: 1.00%
2B-1: 0.50%
M-1: 3.40%
M-2: 1.00%
1B-1: 0.50%
Minimum Credit
Enhancement TestCredit enhancement
greater than 4.75%
Credit enhancement
greater than 4.50%
Credit enhancement
greater than 4.50%
Credit enhancement
greater than 4.25%
Credit enhancement
greater than 4.25%
Credit enhancement
greater than 4.25%
Credit enhancement
greater than 4.50%
Credit enhancement
greater than 4.50%
Vertical Slice
RetainedM-1:5.00%
M-2: 5.00%
M-1:5.00%
M-2: 5.00%
B: 82%
M-1:5.00%
M-2: 5.00%
B: 82%
M-1: 5%
M-2: 5%
B: 75%
M-1: 5%
M-2: 5%
2B-1: 5%
M-1: 5%
M-2: 5%
2B-1: 5%
M-1: 5%
M-2: 5%
2B-1: 5%
M-1: 5%
M-2: 5%
1B-1: 5%
Ratings
Moody's/KBRA
M-1: Baa3(sf)/BBB(sf)
M-2: Ba3(sf)/BB-(sf)
B: Unrated
Fitch/Kroll
M-1: BBB-(sf) /
BBB(sf)
M-2: B(sf) / B+(sf)
B: Unrated
Fitch/KBRA
M-1: BBB-(sf) / BBB(sf)
M-2: B(sf) / B+(sf)
B: Unrated
Fitch/KBRA
M-1: BBB -sf/BBB(sf)
M-2: Bsf/B+(sf)
B: Unrated
Fitch/KBRA M-1: BBB-
sf/BBB(sf)
M-2: Bsf/B+(sf)
2B-1: Unrated
Fitch/KBRA M-1: BBB-
sf/BBB(sf)
M-2: Bsf/B+(sf)
2B-1: Unrated
Fitch/Kroll
M-1: BBB – sf/B+ (sf)
M-2: Bsf/B+ (sf)
2B-1” Unrated
Fitch/Kroll
M-1: BBB-sf/BBB (sf)
M-2: Bsf/B (sf)
1B-1: Unrated
Lead/Co Lead JPM/Citi BAR/CS JPM/WF BAR/Citi JPM/BNP JPM/Citi BAR/MS BAML/NOM
Acquisition Period Jan 2015/Feb 2015 Mar 2015/June 2015July 2015/December
2015Jan 2016/Apr 2016 May 2016/Sep 2016 Oct 2016/Dec 2016
January 2017/March
2017April 2017/June 2017
Loan Count 80,606 110,204 169,516 96,747 170,672 125,573 66,489 56,296
UPB $19.0 BN $25.3 BN $38.7 BN $22.5 BN $39.9 BN $30.1 BN $15.5 BN $13.3 BN

© 2017 Fannie Mae. Trademarks of Fannie Mae. 66
Deal summaries & comparison – Group 2
Connecticut Avenue Securities Investor Presentation
Appendix B: CAS Deal Summaries and comparisons
2016-C01 2016-C03 2016-C05 2016-C07 2017-C02 2017-C04 2017-C06 2017-C07
Avg Principal Balance $230,712 $234,814 $228,102 $232,722 $234,300 $240,129 $233,259 $236,843
Avg Gross Mortgage Rate 4.44% 4.06% 4.21% 4.13% 3.87% 3.73% 4.26% 4.39%
Avg Remaining Term to
Stated Maturity 349 Months 350 months 352 months 353 months 354 months 355 months 356 months 356 months
Weighted Avg Original
Term360 Months 360 months 360 months 360 months 360 months 360 months 360 months 360 months
Weighted Avg Loan Age 11 Months 10 months 8 months 7 months 6 months 4 months 4 months 4 months
Avg Original LTV Ratio 91.63% 91.80% 92.15% 92.05% 92.13% 91.83% 92.21% 92.54%
Avg Original CLTV Ratio 91.67% 91.90% 92.17% 92.07% 92.15% 91.85% 92.24% 92.57%
Avg Debt-to-Income Ratio 34.91% 34.40% 34.72% 34.86% 34.59% 34.69% 35.62% 35.55%
Credit Score 744 746 745 744 746 746 743 744
Loan Purpose (% UPB)
No cash-out refinance:
Purchase:
Cash-out refinance:
21.66%
75.23%
3.11%
23.65%
76.05%
0.30%
12.40%
87.58%
0.02%
16.17%
83.83%
14.75%
85.25%
19.91%
80.09%
14.04%
85.96%
7.54%
92.46%
Percent Owner Occupied 96.88% 96.70% 96.14% 96.40% 96.60% 96.59% 96.09% 96.65%
Top Three Geographic
Concentration (% UPB)
California: 12.79%
Texas: 8.52%
Florida: 5.61%
California: 12.00%
Texas: 8.20%
Florida: 5.50%
California: 10.51%
Texas: 8.22%
Florida: 5.73%
California: 11.82%
Texas: 8.63%
Florida: 6.55%
California: 11.22%
Texas: 7.59%
Florida: 5.65%
California: 11.88%
Texas: 6.91%
Florida: 5.51%
California:
11.16%
Texas: 8.36%
Florida: 6.56%
California:
11.26%
Texas: 7.58%
Florida: 4.89%
Top Three Sellers (%
UPB)
Wells Fargo: 17.52%
Quicken Loans:
7.29%
JPM Chase:3.39%
Wells Fargo: 14.16%
Quicken Loans:
5.81%
JPM Chase:2.04%
Wells Fargo: 15.21%
Quicken Loans: 5.32%
Franklin
American:2.61%
Wells Fargo: 15.31%
Quick Loans: 5.78%
Franklin American:
3.22%
Wells Fargo: 17.77%
Quicken Loans: 5.25%
Franklin American:
2.24%
Wells Fargo: 20.44%
Quicken Loans: 5.49%
JPM: 2.58%
Wells Fargo: 18.09%
JP Morgan: 4.98%
Quicken Loans: 4.26%
Wells Fargo: 18.67%
JP Morgan: 4.57%
Quicken Loans: 3.82%

© 2017 Fannie Mae. Trademarks of Fannie Mae. 67
Fannie Mae conducts a comprehensive review of a prospective lender’s financial condition and operational platform
Lender must meet minimum net worth and capital requirements, along with having a comprehensive Quality Control (QC) program compliant with Fannie Mae guidelines
Lender approval process
Lender quality
Fannie Mae employs a dedicated team of Risk Managers across the country who provide hands-on engagement and conduct regular onsite visits.
Risk Managers monitor lender performance and provide training and expertise to ensure compliance with Fannie Mae’s corporate risk expectations
Ongoing and rigorous lender review process:
Lender oversight team conducts ongoing comprehensive operational reviews to assess the effectiveness of a lender’s QC procedures
Annual on-site operational reviews conducted for all top lenders (covering approximately 60-70% of volume) and targeted reviews for higher risk lenders
Counterparty Risk Management team monitors lender’s ongoing financial strength
Lender risk management
Ongoing lender review
process
Appendix C: Credit Risk Management
Lenders undergo a rigorous approval process and continuous monitoring, designed to result in high loan quality and performance as well as reduced reliance on lender representations and warranties

© 2017 Fannie Mae. Trademarks of Fannie Mae. 68
Fannie Mae’s Desktop Underwriter® (DU®) is the industry’s most widely used automated underwriting system
DU automates Fannie Mae’s underwriting eligibility guidelines and credit policies, including the steps necessary to complete the processing of the loan file
DU performs a comprehensive evaluation of each borrower’s credit profile and other mortgage risk factors to arrive at an underwriting recommendation
Collateral Underwriter is a proprietary appraisal review application developed by Fannie Mae that performs an automated analysis of appraisals
Used to identify appraisals with higher risk of property eligibility violations, overvaluation, and quality issues, along with driving QC review selection
Leverages an extensive database of property records, sales transactions, market data, third-party data sources, and proprietary analytics models
Provides risk messages related to property eligibility and policy compliance, data integrity, comparable selection, adjustments, and reconciliation
Advanced data-driven analytics help to uncover poor practices, inconsistencies, and potential fraud across an appraiser’s body of work, allowing for management of collateral risk issues at the appraiser level
Collateral Underwriter
Fannie Mae establishes underwriting and eligibility guidelines for loans sold to us and all lenders must comply with the requirements of Fannie Mae’s Selling Guide
Credit policy
Loan quality
Desktop Underwriter®
Appendix C: Credit Risk Management

© 2017 Fannie Mae. Trademarks of Fannie Mae. 69
Desktop Underwriter (DU)
Fannie Mae’s proprietary automated underwriting system that assists lenders in the underwriting of mortgage loans
DU helps lenders make informed credit decisions; specifically:
Evaluates mortgage delinquency risk and arrives at a risk assessment recommendation by relying on a comprehensive examination of the primary and contributory risk factors in a mortgage application
Automates Fannie Mae’s underwriting eligibility guidelines and credit policies for the mortgage industry, including listing the steps necessary for the lender to complete the processing of the loan file and providing objective analysis of mortgage loan applications
Improves efficiency of the loan origination process and enables the efficient deployment of new policies and products to lenders
(1) 2016 new acquisitions, excluding loans acquired under Fannie Mae’s Refi Plus and HARP initiatives6/1/2017
In 2016, approximately 1,800 lenders used DU, and over 90%(1) of loans we acquired were evaluated through DU.
Appendix C: Credit Risk Management

© 2017 Fannie Mae. Trademarks of Fannie Mae. 70
Collateral Underwriter
Fannie Mae’s proprietary appraisal risk assessment tool, developed to support proactive management of appraisal quality
Inclusive of over 24 million electronic appraisal records, receiving nearly 20,000 new appraisals per day
100% of the single-family and condo appraisals delivered to Fannie Mae are evaluated through CU
Collateral Underwriter (CU™) Risk Score rates risk on a scale of 1-5 where 5 is highest risk. Appraisal quality flag notes potential issues with the appraiser’s methodology. Overvaluation flag notes potentially unsupported appraised values. Messages provide specific feedback to lenders so that potential issues can be addressed prior to loan delivery to Fannie Mae
Appraisal analysis
Helps to identify when an appraiser has reported potentially incorrect property or transaction characteristics. Compares specific data fields on the appraisal against previously reported data to identify discrepancies. Identifies inconsistencies within an appraiser’s body of work and relative to peers.
Data integrity
CU shows pertinent property and transaction characteristics for the subject and comparable properties. Appraiser-provided comparables are analyzed by CU and ranked against a pool of available sales based on physical characteristics,
location, and sale date. Statistically-derived, market-specific adjustments for differences in physical features, time, and location are estimated by the model.
Comparable selection
Provides analytics like median sales price or price per square foot at a Census Block Group level. Overlays prior and current transactions of the subject property on a plot of market trends at the zip code level from the Fannie Mae
Home Price Index.
Local Market Analytics
6/1/2017
Advanced data-driven analytics help to uncover poor practices, inconsistencies, and potential fraud to drive a more targeted post-purchase QC process and better industry practices.
Appendix C: Credit Risk Management

© 2017 Fannie Mae. Trademarks of Fannie Mae. 71
Loan qualityCollateral Underwriter
CU identifies appraisals with potential quality issues, overvaluation, and data discrepancies.
Appendix C: Credit Risk Management

© 2017 Fannie Mae. Trademarks of Fannie Mae. 72
Fannie Mae holds lenders accountable for loan quality and actively enforces its contractual rights when a significant loan defect is uncovered
Post-purchase loan file reviews are conducted to measure the quality of new acquisitions and target potential problem loans. Review selection includes:
Random Sample: Statistically valid sample reviews ensure loans comply with our standards and establish a baseline defect rate
Discretionary Reviews: 100% of acquisitions undergo automated data analysis tools, including Collateral Underwriter and an underwriting risk assessment tool, which drive discretionary reviews on loans with higher likelihood of a defect
Non-performing loans: 100% of non-performing loans undergo a predictive model-driven analysis to select loans for in-depth review based on likelihood of defect and loss
Analytical results are used to inform credit policy decisions, compare lender performance, and improve front-end QC models
Loan quality reviews
Loan qualityQuality reviews
Fannie Mae’s goal is to increase transparency to enable all parties to see and evaluate risk early in the loan origination process.
Appendix C: Credit Risk Management

© 2017 Fannie Mae. Trademarks of Fannie Mae. 73
Fannie Mae sets servicing compliance standards through its Servicing Guide, and acts as Master Servicer to provide guidance to, and oversight of loan servicers
Servicers undergo a rigorous approval process and must demonstrate significant experience in both performing and delinquent loan servicing
Performance Management: Servicing managers monitor servicer performance, working directly with them to manage Fannie Mae’s portfolio of loans to minimize credit losses
Performance Monitoring: Fannie Mae’s Servicer Total Achievement and Rewards™ (STAR™) Program supports the industry by establishing a transparent framework to measure our servicing partners’ performance, consult on best practices, and create motivational incentives to improve performance
Compliance Oversight: Servicer Quality and Risk reviews are designed to test a servicer’s quality control processes and compliance with Fannie Mae guidelines through a combination of loan level and procedural compliance testing
Servicing policy
Servicer monitoring and
performance management
Loss mitigation
Fannie Mae sets standards for borrower outreach and timelines for delinquent loans and provides tools and assistance to help servicers meet these requirements
Fannie Mae’s loss mitigation hierarchy is designed to provide the most appropriate workout option to a borrower while minimizing credit losses to Fannie Mae
Servicing Management Default Underwriter™ (SMDU™) is Fannie Mae’s proprietary loss mitigation platform used by servicers for real-time evaluation and decisioning of Fannie Mae loss mitigation programs
Loan servicing quality
Fannie Mae provides transparent guidelines and employs direct servicer oversight to monitor and manage performance and uphold high servicing standards.
Appendix C: Credit Risk Management

© 2017 Fannie Mae. Trademarks of Fannie Mae. 74
1-30 31-60 61-90 91-120 121-150 151-180 181-210 211-240 241-270 270-360 361-390 391-420
Efforts to
Contact
Borrower by
Phone
Efforts to Solicit
Loss Mitgation
by Mail
Foreclosure
Related
Activities
Day 210: Servicer must continue outbound contact attempts every 30 days for owner occupied primary residences per applicable
law. For all other borrowers, servicer is authorized to continue outbound contact attempts until Quality Right Party Contact,
Borrower Response Package received, or delinquency status is resolved
Borrower Outreach
Modification Related Activities When a Complete Borrower Response Package (BRP) Received
Servicer has 30 days to evaluate borrower for a workout option and provide an Evaluation Notice to borrower within 5 days of decision
Borrower may appeal a denial for modification within 14 days of receiving evaluation; the servicer then has an additional 30 days to review the appeal
If granted modification, borrower enters in to Trial Period Plan which has a duration of 3-4 months depending on delinquency at start of trial
Day 36: No later than day 36, collection calls every five days until Quality Right Party Contact , Borrower Response Package received, or delinquency status
resolved
Days 17: Payment reminder notice
Day 45: Borrower Solicitation Package
Day 90: Streamlined Modification Offer, if eligible
Day 121: Streamlined Modification Offer, if eligible
Days 45-60: 1st inspection
Day 60: Breach letter
Days 106-120: Pre-referral account review
Days 121+: Referral to foreclosure if complete Borrower Response Package is not received
Day 60: Streamlined Modification Offer, borrowers who’ve defaulted following a rate reset.
6/1/2017
Appendix C: Credit Risk Management

© 2017 Fannie Mae. Trademarks of Fannie Mae. 75
Property management and disposition
Fannie Mae manages all property dispositions in-house, leveraging our expertise and scale to maximize sales proceeds, control expenses, and reduce overall severity
Full range of distressed real estate capabilities utilized for management of the industry’s largest portfolio (Disposed of over 1.5 million homes since 2009)
Employ a best execution disposition strategy comparing Net Present Value to our target execution: a non-distressed sale of a move-in ready home sold to an owner-occupant
We leverage our extensive internal and external data to employ sophisticated decisioningtools at every step of the process
Property values are determined by an in-house team of Fannie Mae employees, including representatives in top markets throughout the country who provide market intelligence and re-inspect properties that have been already valued
Fannie Mae leverages over 2,000 third party appraisers and seven national Broker Price Opinion (BPO) vendors to provide condition and value information
Extensively trained in-house valuation reviewers leverage a suite of tools including appraisals, BPOs, automated valuation models (AVM) and Collateral Underwriter to determine values that drive the REO sales strategy
Our 100% in-house REO sales teams oversee a 3,000 member nationwide real estate agent network strategically geographically dispersed based on volumes
We employ a rigorous real estate agent selection and training process and ongoing monitoring against performance metrics
We leverage our Homepath.com website, which provides comprehensive listing information and interior/exterior photos on our REO properties (average website traffic is 2.1 million visits from 1 million+ individuals monthly)
Our non-distressed owner-occupant sales strategy helps to maximize sales proceeds, stabilize neighborhoods, and preserve value of our guaranty book
Property valuation
REO sales
Capabilities
Appendix C: Credit Risk Management

© 2017 Fannie Mae. Trademarks of Fannie Mae. 76
REOfulfillment
Fannie Mae conducts and oversees property repairs on its REO inventory to maximize sales proceeds, increase financing options for buyers, and increase the likelihood of a sale to an owner occupant
Relocation assistance through the “Cash for Keys” program allows for reduced property management costs and shorter time-to-market on REO properties
A sophisticated proprietary repair decision tool compares the expected financial benefits incurred by performing repairs to determine the best economic outcome for each property
We leverage economies of scale through competitive bid contracts with national flooring vendors, appliance manufacturers, HVAC system providers and other suppliers
Fannie Mae employs robust quality control through the entire disposition process, leveraging economies of scale via a network of 200+ contractors to maximize cost savings and efficiency in property maintenance and repairs
Property management and disposition (continued)
Alternative disposition
options
Fannie Mae utilizes short sales and third party sales when beneficial on an NPV basis against our target REO sales execution
In 2012, Fannie Mae brought short sales management in-house. Negotiating directly with the buyer’s agent has resulted in annual severity cost savings and dramatically reduced timelines
Investor/pool sales may be used for difficult to sell, lower value properties
The property management and disposition process is focused on minimizing loss severities by maximizing sales prices and supporting neighborhood stabilization.
Appendix C: Credit Risk Management

© 2017 Fannie Mae. Trademarks of Fannie Mae. 77
HomePath® and FirstLook™
HomePath is the branding used for all Fannie Mae properties and their sales transactions
HomePath.com allows buyers and agents to search Fannie Mae’s inventory of move-in ready foreclosed properties, access tools and resources, and get help with the buying process
A convenient system allows users to search for properties based on specified criteria and submit an offer online
Fannie Mae's innovative First Look marketing period was created to promote homeownership and contribute to neighborhood stabilization — gives preference to owner-occupant buyers.
6/1/2017
Owner occupants generally pay more for properties and are positive contributors to neighborhood stabilization.
Appendix C: Credit Risk Management

© 2017 Fannie Mae. Trademarks of Fannie Mae. 78
Additional resources
Appendix D: Supplemental Fannie Mae business information
Contact information
Online content:
Credit risk sharing webpage:
http://fanniemae.com/portal/funding-the-market/credit-risk/index.html
Fannie Mae’s loan performance analytics tool, Data Dynamics:
www.fanniemae.com/datadynamics
Fannie Mae’s detailed approach to single family credit risk management:
http://fanniemae.com/resources/file/credit-risk/pdf/0915-credit-risk-mgt-deck.pdf
Fannie Mae single-family loan performance data:
http://fanniemae.com/portal/funding-the-market/data/loan-performance-data.html
Contact Information:
Credit Securities:
1-800-2Fannie
Laurel DavisVice President for Credit Risk [email protected]
Bob IvesVice President and Head of Retained
Nick SapirieDirector, Single-Family [email protected]
Dennis CrossonDirector, Credit Risk [email protected]
Kathleen PagliaroDirector, Credit Risk [email protected]
Thomas JonesSenior Transaction Manager, Credit
Risk [email protected]
Manish BorkarFinancial Engineer Manager, Single-
Family [email protected]
Doug VotroubekInvestor [email protected]
Sonja BeaubienDirector, Fixed Income [email protected]
Eri FurukawaMarketing Strategist, Fixed Income [email protected]
Mike McCarthyAnalyst, Fixed Income [email protected]

© 2017 Fannie Mae. Trademarks of Fannie Mae. 79
The materials contained in this presentation have been prepared by Fannie Mae for informational purposes only. For the avoidance of doubt, this document shall not constitute an offer to sell securities or a solicitation of an offer to buy securities or to obligate Fannie Mae to issue any securities. This presentation may include "forward-looking statements" within the meaning of the safe harbor provisions of the United States Private Securities Litigation Reform Act of 1995. Actual results may differ from expectations, estimates and projections and, consequently, readers should not rely on these forward-looking statements as predictions of future events. Words such as "expect," "target," "assume," "estimate," "project," "budget," "forecast," "anticipate," "intend," "plan," "may," "will," "could," "should," "believe," "predicts," "potential," "continue," and similar expressions are intended to identify such forward-looking statements. These forward-looking statements involve significant risks and uncertainties that could cause actual results to differ materially from expected results. Factors that could cause actual results to differ include, but are not limited to, higher than expected operating costs, rates of default on the referenced mortgages, changes in interest rates or the availability of financing, the impact of new legislation or regulatory changes on our operations, the impact of any deficiencies in the servicing practices of third parties and anticipated changes in overall market and economic conditions. Readers are cautioned not to place undue reliance upon any forward-looking statements, which speak only as of the date made. Fannie Mae does not undertake or accept any obligation to release publicly any updates or revisions to any forward-looking statement to reflect any change in its expectations or any change in events, conditions or circumstances on which any such statement is based. Additional information concerning these and other risk factors is contained in our most recent Form 10-k and Form 10-Q filings with the Securities and Exchange Commission, copies of which are available on our website at www.fanniemae.com. All subsequent written and oral forward looking statements concerning Fannie Mae or the matters discussed in these materials are expressly qualified in their entirety by the cautionary statements above.
THIS DOCUMENT DOES NOT DISCLOSE ALL THE RISKS AND OTHER SIGNIFICANT ISSUES RELATED TO AN INVESTMENT IN THE SECURITIES. PRIOR TO INVESTING IN THE SECURITIES, POTENTIAL INVESTORS SHOULD READ THE FINAL PROSPECUTS ISSUED BY FANNIE MAE RELATING TO THE SECURITIES AND ENSURE THAT THEY FULLY UNDERSTAND THE TERMS OF THE SECURITIES AND ANY APPLICABLE RISKS.