![Current Opinion in ScienceDirect Electrochemistry · 2020. 2. 13. · without any pyrolysis treatment, Peng et al. [23,24] prepared a p-conjugated COF to capture Fe ions in situ forming](https://static.fdocuments.net/doc/165x107/60b3d714d5a9aa15b038399a/current-opinion-in-sciencedirect-electrochemistry-2020-2-13-without-any-pyrolysis.jpg)
CONJUGATED POLYMER ELECTROCHEMICAL DEVICES FOR ENERGY...
150
1 CONJUGATED POLYMER ELECTROCHEMICAL DEVICES FOR ENERGY STORAGE AND ELECTROCHROMIC WINDOWS By DAVID Y. LIU A DISSERTATION PRESENTED TO THE GRADUATE SCHOOL OF THE UNIVERSITY OF FLORIDA IN PARTIAL FULFILLMENT OF THE REQUIREMENTS FOR THE DEGREE OF DOCTOR OF PHILOSOPHY UNIVERSITY OF FLORIDA 2011
Transcript of CONJUGATED POLYMER ELECTROCHEMICAL DEVICES FOR ENERGY...
1
CONJUGATED POLYMER ELECTROCHEMICAL DEVICES FOR ENERGY STORAGE AND ELECTROCHROMIC WINDOWS
By
DAVID Y. LIU
A DISSERTATION PRESENTED TO THE GRADUATE SCHOOL OF THE UNIVERSITY OF FLORIDA IN PARTIAL FULFILLMENT
OF THE REQUIREMENTS FOR THE DEGREE OF DOCTOR OF PHILOSOPHY
UNIVERSITY OF FLORIDA
2011

2
© 2011 David Y. Liu

3
To Mom, Dad, and soon-to-be wife, Lizzy

4
ACKNOWLEDGMENTS
I would like to start by thanking my family and friends for all their love, support, and
encouragement. Most importantly, I want to thank my parents Raymond and Julie for
their dedication and sacrifice over the years, and moving the family to the United States
so that my brother and I would have better education and more opportunities. I want to
thank my older brother Patrick for being a great role model and friend. I have always
looked up to you, and thank you for always being there for me. I thank my best friend
and soon-to-be wife, Lizzy, for her unconditional love, support, patience, and
understanding over the five years we have been apart. Thank you! I also thank her
parents, Mr. and Mrs. Fitzgerald, for welcoming me into their family. I am very grateful
for all the wonderful people I have met over the years, especially my roommates: Ken
Graham, Jared Lynch, Michael Hyman, and Jeff Carter. I have very enjoyed living with
you all and you will all be missed.
I thank my research advisor, Professor John Reynolds, for his guidance, support,
mentorship, and optimism over the years. By working and learning from Dr. Reynolds, I
have become a more optimistic and balanced scientist. I am very grateful to have been
able to conduct research in the Reynolds group and have had the freedom to pursue
research projects that interested me.
I am grateful for all the research colleagues I have met over the years. You all
have made my graduate studies much enjoyable. I thank Ken Graham, Romain Stalder,
Frank Arroyave, Eric Shen, Jianguo Mei, Paula Delgado and Pam Cohn. I am especially
grateful for the research scientists and post doc: Aubrey Dyer, Chad Amb, Ryan
Walzack, James Leonard, Mike Craig, Leandro Estrada, and Svetlana Vasilyeva. I also

5
have to thank all the undergraduates from the Faraday Cage, especially Andy Chilton
for our collaboration and friendship.
During my PhD studies, I was fortunate to collaborate on several projects. I want
to acknowledge Pat Kinlen and Eve Fabrizo from Crosslink, and Vince Ballarotto from
the University of Maryland. I also thank Steve Miles from the electronic shop for
designing and constructing the triggering circuit.
I thank my committee members Professors Ken Wagener, Ron Castellano, David
Wei, and Heather Ray for our discussions on career goals. I would also like to thank
everyone from the Polymer Floor who has helped with all of the various parts of
graduate school, including Sara Klossner, Gena Borrero, Cheryl Googins, and Annyetta
Douglas. I also thank Lori Clark and Dr. Ben Smith from the graduate office.

6
TABLE OF CONTENTS
page
ACKNOWLEDGMENTS .................................................................................................. 4
LIST OF TABLES ............................................................................................................ 9
LIST OF FIGURES ........................................................................................................ 10
LIST OF ABBREVIATIONS ........................................................................................... 13
ABSTRACT ................................................................................................................... 15
CHAPTER
1 ELECTROCHEMISTRY OF CONJUGATED POLYMERS: INTRODUCTION, PRINCIPLES, AND APPLICATIONS ...................................................................... 17
Introductory Remarks.............................................................................................. 17
Electronic Properties of -Conjugated Polymers .................................................... 18 Charge Injection ...................................................................................................... 22 From Monomers to Polymer Films .......................................................................... 24
Electrochemical versus Chemical Polymerization ............................................ 24
Electrochemical Polymerization ........................................................................ 25 Chemical Polymerization .................................................................................. 28
Processing Methods ......................................................................................... 29
Electrochemical Processes in Conjugated Polymer Electrodes .............................. 31 Application of Electrochemical Devices .................................................................. 35
Energy Storage ................................................................................................ 36
Electrochromism ............................................................................................... 39 Overview of Dissertation ......................................................................................... 41
2 EXPERIMENTAL METHODS AND CHARACTERIZATION TECHNIQUES ........... 44
Introduction ............................................................................................................. 44 Materials ................................................................................................................. 44
General Chemicals ........................................................................................... 44
Electrochemical Supercapacitor (ESC) Materials ............................................. 45
Electrochromic Device (ECD) Materials ........................................................... 45
Electrochemistry ..................................................................................................... 46 General Setup .................................................................................................. 46 Investigation of Contact Resistance ................................................................. 46 Cell Setup and Film Handling ........................................................................... 48
Device Fabrication .................................................................................................. 49 Electrochemical Supercapacitors ..................................................................... 49 Supercapacitor Module .................................................................................... 50

7
Absorptive/Transmissive Window-type Electrochromic Devices ...................... 52
Optical Spectroscopy .............................................................................................. 53 Synchronization of Electrochemical and Optical Data ...................................... 53
Trigger Circuit ................................................................................................... 55 Colorimetry ............................................................................................................. 56 Photography ........................................................................................................... 57 Solution Conductivity .............................................................................................. 58
3 DEVELOPING CONJUGATED POLYMERS FOR ELECTROCHEMICAL SUPERCAPACITORS ............................................................................................ 59
Introduction ............................................................................................................. 59 Electrochemical Polymerization and Characterization of CP Electrodes ................ 68
Poly(ProDOT-Me2) ........................................................................................... 68
Poly(BEDOT-Isoindigo-butyl2) .......................................................................... 70 Electrochemical Supercapacitors ............................................................................ 75
PProDOT-Me2-based Type I ESCs .................................................................. 75 Poly(BEDOT-Isoindigo)-based Type I ESCs .................................................... 77
Poly(BEDOT-Isoindigo)-based Type III ESC .................................................... 79 Supercapacitor Modules ................................................................................... 82
Chapter Summary ................................................................................................... 89
4 DEVELOPING ABSORPTIVE/TRANSMISSIVE BLACK WINDOW-TYPE ELECTROCHROMIC DEVICES ............................................................................. 91
Introduction ............................................................................................................. 91
Black-to-Transmissive Electrochromes ................................................................... 95
Optimization of Transmittance and Switching Speed ............................................ 105 Transparent Counter Material ............................................................................... 108 Charge Balance .................................................................................................... 111
Black-to-Transmissive Electrochromic Devices .................................................... 112 Chapter Summary ................................................................................................. 116
5 IN SITU SPECTROSCOPIC ANALYSIS OF SUB-SECOND SWITCHING POLYMER ELECTROCHROMES ........................................................................ 118
Introduction ........................................................................................................... 118
Electrochromic Polymers ...................................................................................... 120 ECP-Magenta ................................................................................................. 121
ECP-Green ..................................................................................................... 125 ECP-Black ...................................................................................................... 128
Chapter Summary ................................................................................................. 132
6 CONCLUSIONS AND FUTURE WORK ............................................................... 134
Electrochemical Supercapacitors .......................................................................... 134 Electrochromic Devices ........................................................................................ 136

8
LIST OF REFERENCES ............................................................................................. 139
BIOGRAPHICAL SKETCH .......................................................................................... 150

9
LIST OF TABLES
Table page 2-1 Calculated resistance for silver paste and copper tape contacts ........................ 48
4-1 Relative luminance and CIE L*a*b* Color Coordinates for BASF-Black films ..... 99
4-2 Transmittance and switching speed for BASF-Black films ................................ 101
4-3 Relative luminance and CIE L*a*b* Color Coordinates for Random-Black ....... 102
4-4 Transmittance and switching speed for Random-Black .................................... 104
4-5 Conductivity of supporting electrolyte solutions ................................................ 105
4-6 Switching speed of Random-Black ................................................................... 106
4-7 Relative luminance and CIE L*a*b* Color Coordinates for ECDs. .................... 114
4-8 Transmittance and Switching Speed Summary of ECD ................................... 116
5-1 Summary of ECP transmittance contrast for ECP-Magenta, -Green, and -Black. ................................................................................................................ 131
5-2 Summary of ECP switching time for ECP-Magenta, -Green, and -Black .......... 131

10
LIST OF FIGURES
Figure page 1-1 Electronic properties of conjugated polymers. .................................................... 18
1-2 Doping scheme of conducting polymers ............................................................. 19
1-3 Representative repeat unit structures of conjugated polymers in the neutral state .................................................................................................................... 20
1-4 Allowed electronic transitions for conducting polymers. ..................................... 21
1-5 Doping methods for conjugated polymers .......................................................... 22
1-6 Common solution processing techniques for soluble conjugated polymers. ....... 30
1-7 Electrochemical characterization of conjugated polymers .................................. 32
1-8 Representative chronoabsorptometry data. ........................................................ 34
1-9 Overview schematic of electrochemical devices................................................. 36
1-10 Ragone plot representing specific power and specific energy outputs ............... 37
1-11 Common redox states of methyl viologen ........................................................... 41
2-1 Schematic of electrochemical model .................................................................. 47
2-2 Electrochemical cell designs for the preparation of ESC electrodes ................... 49
2-3 Encapsulation of Supercapacitors ...................................................................... 50
2-4 Supercapacitor Module ....................................................................................... 51
2-5 Supercapacitor Module with bipolar electrodes. ................................................. 52
2-6 Schematic of in-situ electrochemical spectroscopy instrumentation ................... 54
2-7 Schematic of the external circuit ......................................................................... 55
2-8 CIE 1976 L*a*b* ................................................................................................. 57
3-1 p-dopable and n-dopable CPs utilized in electrochemical supercapacitors ........ 60
3-2 Operating principle of electrochemical supercapacitor ....................................... 64
3-3 Supercapacitor modular design .......................................................................... 66

11
3-4 p-dopable and n-dopable CPs utilized in supercapacitors. ................................. 67
3-5 Electrochemistry of PProDOT-Me2 ..................................................................... 69
3-6 Electrochemistry of PBEDOT-iI-butyl2 ................................................................ 71
3-7 Electrochemical polymerization of PEDOT-iI-butyl2 ............................................ 72
3-8 Electrochemical polymerization of PBEDOT-iI-butyl2 from solutions of 2 mM monomer in 0.5 M LiBTI/BZN ............................................................................. 73
3-9 p-doping and n-doping responses of PBEDOT-iI-butyl2 ..................................... 74
3-10 Oxidative and reductive switching of PBEDOT-iI-butyl2 ...................................... 75
3-11 Type I PProDOT-Me2 Supercapacitor ................................................................ 76
3-12 Type I PBEDOT-iI-butyl2 Supercapacitor ............................................................ 78
3-13 Operative voltage range of PBEDOT-iI-butyl2-based Type I supercapacitor ...... 79
3-14 Voltage limits of Type III PEDOT-iI-butyl2-based ESC ........................................ 80
3-15 Type III PBEDOT-iI-butyl2 Supercapacitor .......................................................... 81
3-16 Supercapacitor charging/discharging CV ........................................................... 83
3-17 Supercapacitor galvanic charging/discharging ................................................... 85
3-18 Supercapacitor assembly ................................................................................... 86
3-19 Tandem supercapacitor. ..................................................................................... 87
3-20 Supercapacitor CV ............................................................................................. 88
4-1 Structures of ECP-Black polymers ..................................................................... 93
4-2 Schematic design of absorptive/transmissive window-type electrochromic device ................................................................................................................. 95
4-3 Cyclic voltammogram of ECP-Black ................................................................... 95
4-4 Spectroelectrochemical series for ECP-Black .................................................... 97
4-5 Absorbance and relative luminance of BASF-Black ........................................... 98
4-6 Potential square-wave step chronoabsorpometry for BASF-Black ................... 100
4-7 Absorbance and relative luminance of Random-Black ..................................... 101

12
4-8 Potential square-wave step chronoabsorpometry for Random-Black.. ............. 103
4-9 Comparative absorption spectra for BASF-Black and Random-Black .............. 104
4-10 Chronoabsorptometry of Random-Black films with potential square-wave steps ................................................................................................................. 107
4-11 Chronoabsorptometry of Random-Black .......................................................... 108
4-12 Electrochemistry of MCCP................................................................................ 109
4-13 Transmittance and relative luminance of MCCP............................................... 110
4-14 Calibration plots of absorbance and charge density ......................................... 112
4-15 Spectroelectrochemical series of window ECD ................................................ 113
4-16 Photographs of window ECDs .......................................................................... 115
4-17 Chronoabsorptometry of ECDs ......................................................................... 116
5-1 Structures of ECP-Magenta, ECP-Green, and ECP-Black ............................... 120
5-2 Spectral evolution of ECP-Magenta .................................................................. 122
5-3 Chronoabsorptogram of ECP-Magenta ............................................................ 124
5-4 Spectral evolution of ECP-Green ...................................................................... 126
5-5 Chronoabsorptogram of ECP-Green ................................................................ 127
5-6 Spectral Evolution of ECP-Black ...................................................................... 129
5-7 Chronoabsorptogram of ECP-Black ................................................................ 130
6-1 Proposed Poly(ProDOT) ................................................................................... 135
6-2 Visual representation of voltage profile waveform ............................................ 137

13
LIST OF ABBREVIATIONS
ACN acetonitrile
BZN benzonitrile
CB conduction band
CP conjugated polymer
CV cyclic voltammetry
D-A-D donor-acceptor-donor
DCM dichloromethane
DPV differential purlse voltammetry
ECD electrochromic device
ECP electrochromic polymer
E1/2 half-wave potential
Eg band gap
FET field-effect transistor
ESC electrochemical supercapacitor
HOMO highest orbital molecular orbital
ITO indium tin oxide
LED light emitting diode
LCAO linear combination of atomic orbitals
LUMO lowest unoccupied molecular orbital
MCCP minimally-color changing polymer
MO molecular orbital
OLED organic light emitting diode
OPV organic photovoltaic

14
PEDOT:PSS poly(3,4-ethylenedioxythiophene):poly(styrene sulfonate)
PET poly(ethylene terephthalate)
PC propylene carbonate
PMMA poly(methyl methacrylate)
SWNT single-walled carbon nanotubes
TDAT total data acquisition time
VB valence band

15
Abstract of Dissertation Presented to the Graduate School of the University of Florida in Partial Fulfillment of the Requirements for the Degree of Doctor of Philosophy
CONJUGATED POLYMER ELECTROCHEMICAL DEVICES FOR ENERGY STORAGE
AND ELECTROCHROMIC WINDOWS
By
David Y. Liu
December 2011
Chair: John R. Reynolds Major: Chemistry
This dissertation details the development of conjugated polymer (CP)-based
electrochemical devices for energy storage and electrochromic windows. Since
operating principles, such as redox processes, electron transfer at the
electrode/electrolyte interface, and the interactions among current, charge, and voltage,
are common in CP-based electrochemical devices, the interplay of these functions as
they relate to structure and device performance is crucial. In this work, a variety of
electrochemical and optical techniques are utilized to characterize electrochemical
devices and CPs contained therein.
The first portion of this dissertation focuses on CP-based electrochemical
supercapacitors (ESCs) for energy storage, with an emphasis on improving the voltage
window through structure modification and modular device assembly. Specifically, CP-
based electrodes are developed through electrochemical polymerizations of electron-
rich 3,4-propylenedioxythiophene (ProDOT) and donor-acceptor-donor (D-A-D) units.
These electron-rich poly(ProDOT)-based ESCs are observed to operate with high
electrochemical stability across a 1.0 volt range. Extension of the voltage window to 1.8
V is realized in D-A-D based ESCs due to the ability of this class of CPs to undergo

16
both oxidation and reduction. Further, a novel methodology to increase the voltage
window is presented utilizing a modular device assembly method.
The second portion of this dissertation focuses on the optimization of rapidly
switching window-type electrochromic devices (ECDs). In this work, the components of
black ECDs are developed and investigated, utilizing solution-processable black
electrochromes as active layers and minimally-color changing polymer (MCCP) as the
counter material. The optimized system was achieved by incorporation of these
polymers into a dual-electrochromic polymer device configuration with the appropriate
charge balance, along with exploration of highly conductive electrolytes.
A novel electronic spectroscopy method was developed by using an external
trigger to communicate between a potentiostat and a fiber optic spectrophotometer with
a CCD-array detector. The detector is capable of rapid data acquisition to track the
electrochromic change, with one spectrum collected every 2 ms, in order to elucidate
properties of solution processed electrochromic films. A set of ECPs demonstrated sub-
second response times on the order of 400 – 700 ms with high transmittance contrasts
over 40% T.
17
CHAPTER 1 ELECTROCHEMISTRY OF CONJUGATED POLYMERS: INTRODUCTION,
PRINCIPLES, AND APPLICATIONS
Introductory Remarks
Organic polymers have traditionally been considered to be thermally and
electrically insulating materials. This picture began to change with reports of conducting
behavior in polymers first reported in iodine-doped poly(pyrrole) (PPy) in 1963 by
Weiss,1 and perhaps most famously in iodine-doped poly(acetylene) (PA) by Heeger,
MacDiarmid, and Shirakawa in 1977.2,3 This Nobel Prize winning work initiated the field
of conducting (and conjugated) polymers. Since their discovery, the inherent
combination of mechanical properties of plastics (flexibility, processability, and
robustness) with electrical properties has been a major focus. Conjugated polymers
(CPs) can exhibit high electrical conductivity when doped, as in the case of trans-
poly(acetylene) where Heeger et al. demonstrated a change of seven orders in
magnitude upon iodine doping.2,3 Moreover, the organic nature of CPs allows for fine-
tuning of intrinsic properties through synthetic modifications. These features, in addition
to the ability to solution process, have contributed conducting polymers towards the
interest on development of potential low-cost, large area, flexible, and lightweight
electronic devices such as field effect transistors,4-6 light-emitting diodes,7-9 chemical
sensors,10,11 memories,12 photovoltaic cells,13-17 energy storage and electrochromic
devices.18-22
A common element shared among organic electronic devices is a change in their
properties upon application of an electric field. As such, electrochemistry becomes an
important tool for the characterization of fundamental materials or device properties.
This dissertation focuses on the characterization of new conjugated polymers
18
specifically for energy storage and electrochromic devices, along with the application of
novel electrochemical device concepts. Before delving into electrochemical device
concepts and applications, an introductory background on the fundamental properties of
conjugated polymers is provided.
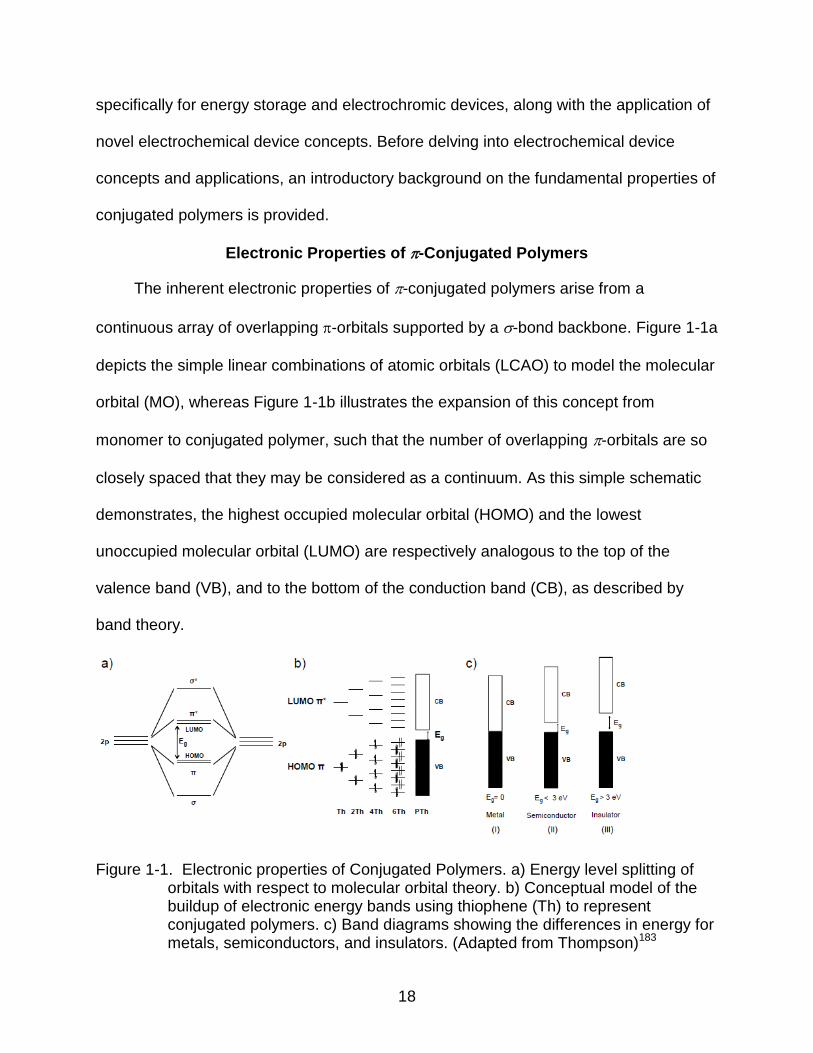
Electronic Properties of -Conjugated Polymers
The inherent electronic properties of -conjugated polymers arise from a
continuous array of overlapping -orbitals supported by a -bond backbone. Figure 1-1a
depicts the simple linear combinations of atomic orbitals (LCAO) to model the molecular
orbital (MO), whereas Figure 1-1b illustrates the expansion of this concept from
monomer to conjugated polymer, such that the number of overlapping -orbitals are so
closely spaced that they may be considered as a continuum. As this simple schematic
demonstrates, the highest occupied molecular orbital (HOMO) and the lowest
unoccupied molecular orbital (LUMO) are respectively analogous to the top of the
valence band (VB), and to the bottom of the conduction band (CB), as described by
band theory.
Figure 1-1. Electronic properties of Conjugated Polymers. a) Energy level splitting of orbitals with respect to molecular orbital theory. b) Conceptual model of the buildup of electronic energy bands using thiophene (Th) to represent conjugated polymers. c) Band diagrams showing the differences in energy for metals, semiconductors, and insulators. (Adapted from Thompson)183

19
The band theory classifies materials into three categories (metal, semiconductor,
and insulator) depending on the energy gap (band gap, Eg) between the VB and CB as
depicted in Figure 1-1c. Case (i) depicts a zero band gap and therefore electrons can
access a multitude of energy states within the conduction band. This access allows
electrons to move freely throughout the material and therefore the material is
conducting and metallic. Case (ii) depicts a low band gap (< 3.0 eV) such that thermal
excitation of electrons from the filled VB to the empty CB is sufficient to promote
conductivity. Case (iii) depicts a large band gap (> 3 eV) such that thermal excitation of
electrons cannot overcome the large energy gap, and these electrons remain localized
in the VB and the material is therefore insulating (non-conducting).
Semiconducting polymers can be rendered conductive via charge injection either
by the addition of electrons (reduction, n-doping) or removal of electrons (oxidation, p-
doping). The removal of one electron from the VB creates a radical-cation (or polaron)
and further removal of another electron creates a dication, which is referred to as a
bipolaron (Figure 1-2a). The polaron and bipolaron states exist at mid gap as illustrated
by the band model shown in Figure 1-2b.
Figure 1-2. Doping scheme of conducting polymers represented by a) poly(thiophene) chain and b) band models as a neutral chain, polaron, and bipolaron.

20
At high doping levels, the polyheterocycle becomes a bipolaron-“rich” material and
eventually leads to the formation of bipolaron bands.23 The presence of these charge
carriers (polarons and bipolarons) ultimately gives rise to electrical conductivity in
conjugated polymers.
In a real world example, the conductivity of iodine-doped PA approaches that of
metals such as copper and iron. As Figure 1-3 demonstrates, the field of conducting
polymers has expanded to other relatively high conducting polymers such as
poly(thiophene), poly(pyrrole), and commercial available poly(3,4-
ethylenedioxythiophene): poly(styrenesulfonate) (PEDOT:PSS) with conductivity as high
as 103 S/cm.184
Figure 1-3. Representative repeat unit structures of conjugated polymers in the neutral state. a) polyacetylene (PA, 1-1), polypyrrole (PPy, 1-2), polythiophene (PTh, 1-3), and poly(3,4-ethylenedioxythiophene) (PEDOT, 1-4), b) Conductivity scale comparing metals, semiconductors,and insulators to tunable CPs (Adapted from Skotheim)24

21
Since the process of doping results in introduction of new electronic transitions
and is accompanied by a structural reorganization, a change in the absorption of
electromagnetic radiation is induced. Electrochromic materials are those that can
undergo a reversible change in absorption (or transmittance) under an electrical bias.
Generally, the visible region of spectrum is the most highly investigated, as
electrochromic properties in this area have potential utility in electronic displays and
smart windows. Optical absorptions in CPs arise from the allowed electronic transitions
from the VB to polaron and bipolaron states created upon doping. In the neutral,
undoped state, the minimum energy transition, as illustrated in Figure 1-4, is the energy
difference between the VB and CB (band gap) and is referred to as the π-π* transition.
The creation of polaron and bipolaron states at mid gap expands the number of possible
electronic transitions, and therefore depletes the π-π* transition. Figure 1-4b depicts the
smaller energy separation of these states, leading to broad absorptions at longer
wavelengths.
Figure 1-4. Allowed electronic transitions for conducting polymers in the neutral, polaron, and bipolaron states.

22
Charge Injection
Charge injection, in general, can lead to significant changes in the conductivity and
optical properties of conjugated polymers. Four different types of charge injection
processes are illustrated in Figure 1-5.
Figure 1-5. Doping methods for conjugated polymers, and the redox reactions associated with each type. (Adapted from Heeger)25
Depending on the applied potential, oxidation or reduction of CPs leads to the
removal or addition of electrons such that the polymer is then positively or negatively
charged. This oxidation or reduction change in turn has an immediate consequence, in
that electro-neutrality within the polymer film must be maintained. Redox process is thus
accompanied by charge-balancing counter-ions being inserted into, or extracted from,
the supporting electrolyte. Conversely, ions moving in and out of conjugated polymers
induce concomitant changes in the electrical and optical properties. In the redox

23
representation shown below, the anion (tetrafluoroborate, BF4-) and cation
(tetrabutylammonium, TBA+) stabilize the oxidized and reduced species respectively.
(1-1)
(1-2)
Conjugated polymers can also be doped by chemically induced charge transfer.
This process requires an oxidizing or reducing agent to react with CPs. Common
oxidizing agents include iodine and nitrosium hexafluorophosphate, while common
reducing agents include sodium naphthalide and hydrazine. Positively and negatively
charged CPs retain charge neutralization by the presence of counter-ions derived from
the oxidant or reductant. Through chemical doping of CPs, high conductivity can be
achieved, leading to applications such as anti-static coatings26 and transparent
electrode materials.27
Metal-polymer interfacial doping is similar to electrochemical doping, but in the
absence of counter-ions.28 This type of charge injection is often found in field-effect
transistors (FETs),29 and light emitting diodes (LEDs).30 Lastly, photo-induced doping
can convert light into electricity. As light is absorbed by CPs, an electron is promoted
from the valence band to the conduction band. Fluorescence and/or phosphorescence
are observed if the excited states recombine and return to the ground state via a
radiative decay mechanism. However, if there is electron transfer from the CP excited
state to an acceptor, such as fullerene-C60, then charge separation of the two charge
carriers (the electron and resulting hole) will occur. This concept is the operating
principle of photovoltaic devices used to convert sunlight into electricity.31

24
With a high degree of control, electrochemistry is one of the most useful charge
injection techniques. Moreover, the transfer of charge is easily monitored by controlled
variation in the potential.
From Monomers to Polymer Films
For practical electrochemical and optical studies, conducting polymers must be
intimately adhered onto conductive substrates allowing the redox states of the polymer-
modified electrodes to be controlled by a potentiostat connected to the sample. To
prepare polymer-coated electrodes, there are two approaches to consider: (1)
electrochemical polymerization of monomer to form conjugated polymers directly onto
the conductive substrate and (2) solution processing of chemically-prepared CPs by
casting techniques such as spray-casting,32-34 spin-casting,13,35,36 drop-casting,37-39
inkjet40-42 and flexo-printing.43-46 The following sections detail and compare the
principles, advantages, and drawbacks of electrochemical and chemical polymerization
methods as well as the ability to form thin polymer films.
Electrochemical versus Chemical Polymerization
Electrochemical polymerization offers several advantages from the viewpoint of
materials preparation and structural control. From the perspective of a synthetic
chemist, monomers are typically more straightforward to prepare and isolate than their
polymeric analogues, and only small amounts (10-50 mg) are needed for
electrochemical polymerizations. In addition, electrochemical polymerization methods
and various electrochemical conditions have been shown to allow control over polymer
film thickness and morphology. In particular, electrochemical polymerizations afford
porous films of high capacitance and are especially suitable for charge storage
applications. For example, electrochemically prepared poly(pyrrole) (PPy), poly(3,4-

25
ethylenedioxythiophene) (PEDOT), and poly(3,4-propylenedioxythiophene) (PProDOT),
have all demonstrated high capacitive properties ideal for electrochemical
supercapacitors.21,47-51 A discussion on these materials and other conjugated polymers
suitable for electrochemical supercapacitors are elaborated in Chapter 3. Additionally,
electrochemical polymerizations can be carried out directly on conducting substrates to
ensure that intimate contact is made at the interface. In scenarios where high surface
area electrodes are used, for example single-walled carbon nanotubes (SWNTs) for
charge storage applications,52-55 electrochemical polymerization is the preferred
approach to deposit a film into these interpenetrating porous electrodes, whereas
solution processing may only coat the exposed surface.
Although chemically prepared polymers may be more laborious to synthesize,
there are significant advantages presented by this method. Chemically prepared
polymers allow for more complete characterization, including elucidating the molecular
weight distribution, exploring the thermal characteristics (such as Tg, crystallization, and
thermal stability), and analysis of the polymer end-groups. Furthermore, solution
processability of chemically-prepared polymers facilitates practical large-scale printing.
Electrochemical Polymerization
Various possible mechanisms have been reported for electrochemical
polymerization of polyheterocycles.56-59 The most widely accepted electropolymerization
mechanism proceeds via oxidation of the monomer unit to generate radical-cation
species in solution, which are able to couple with another surrounding radical-cation or
monomer unit to form a dimer. This reaction involves an electrochemical oxidation and
chemical coupling followed by the elimination of protons. Further oxidation of the dimer
and radical-cation couplings produces oligomers that are soluble. Elongation of the

26
oligomer, either through a linear chain or a cross-linked structure, deposits the insoluble
electroactive polymer onto the working electrode surface.60
Electrochemical polymerization begins with the formation of oligomers in solution,
followed by the deposition of conjugated polymers, which consists of nucleation and
growth steps. The nucleation and growth model for conjugated polymers is borrowed
from the model used to describe the electrodeposition of metals.184 The nucleation
mechanism can be described as (1) instantaneous in which there is a set number of
nucleation sites are formed without additional nucleation sites, and (2) progressive
where the nucleation sites are generated continuously throughout the process. In
addition, conjugated polymers can grow in two different orientations; that is, growth can
occur perpendicular to the electrode surface (1D), and parallel to the surface (2D).
When the deposition occurs in both directions simultaneously, the growth is 3D.
The polymer deposition can be carried out and monitored by a number of
electrochemical processes, most commonly by (1) cyclic voltammetry (also referred to
as potentiodynamic cycles), (2) potentiostatic (constant potential), and (3) galvanostatic
(constant current) methods. Potentiodynamic polymerization involves a concurrent
potential and current change during the deposition. As the potential continuously
changes during the potentiodynamic scan, the growing polymer is switching between
the insulating and conducting states. As such, there is a constant exchange of
electrolyte and solvent through the deposited polymer matrix that leads to a disordered
yet advantageously porous film.61 The extent of electrochemical polymerization by
potentiodynamic technique is heavily dependent on the potential range, scan rate and
number of cycles.

27
The electrosynthesis of CPs, by potentiostatic and galvanostatic polymerizations,
makes possible a correlation between the charge transferred during the electrochemical
polymerization and the amount deposited on the electrode. Faraday’s Law describes
this relationship:
Q = nFN = it (1-3)
where Q (C) is the charge passed, F is Faraday’s Constant (96,485.3 C/mol), n is the
number of electrons in the redox reaction, N (mol) is the amount of reactant, i is current
(A) and t is time (s).
The extent of polymerization is related to the total amount of electrolysis time and
the charge passed, and the thickness of the resulting film is therefore controlled by the
deposition time. It has been shown that potentiostatic and galvanostatic polymerizations
of poly(pyrrole) lead to non-adhesive dendritic-type polymer films of low-uniformity.
Conversely, potentiodynamic polymerizations of PPy result in highly adhesive,
homogeneous, and smooth films.62 This experimental observation was accounted for by
the large number of nucleation sites during the potentiodynamic polymerization.63
The electrochemical conditions can also influence the electropolymerization
process and polymer film morphology. For example, it has been demonstrated that
relatively high oxidation potentials can lead to cross-linked defects.64 On the other hand,
low potentials can lead to weakly charged intermediates and only form oligomers.65,66
Furthermore, the selection of solvent and electrolyte can significantly influence the
electropolymerization of conjugated polymers.67-70 Recent, Bendikov systematically
studied the concurrent influence of both solvent and electrolyte during the

28
electropolymerization of PEDOT and found the solvent, not the electrolyte, more heavily
impacted the morphological structure and electrochromic properties of PEDOT films.71
Chemical Polymerization
Oxidative polycondensation and metal-mediated cross-couplings are generally
used for chemical polymerizations of polyheterocycles. Examples of metal-mediated
cross-coupling reactions include Grignard metathesis, Stille, and Suzuki-Miyaura
reactions. Oxidative polymerization of heterocycles is analogous to electrochemical
polymerization in that the methodology involves the oxidation of the monomer, for
example with FeCl3 as the oxidant. Oxidative polymerizations are utilized for the
synthesis of soluble homopolymers, and this route is less cost intensive than metal-
mediated polymerizations. However, because the oxidized polymer is less soluble than
the neutral counterpart, high molecular weight polymers are often difficult to achieve.
Another drawback of oxidative polymerization is the possibility of side reactions
occurring at available -positions. Furthermore, ferric ions from the oxidant can be
trapped in the polymer backbone, affecting the overall device performance.72
Grignard metathesis polymerization,73 as developed by the McCullough group, has
yielded poly(thiophenes) with high molecular weights and high degree of
regioregularity.73 This synthetic route utilizes 2,5-dibromothiophene derivatives,
Grignard reagents such as methyl magnesium bromide (MeMgBr), and catalytic
amounts of Ni catalyst (Ni(dppp)Cl2). With the said components, the reaction is highly
oxygen- and moisture-sensitive and requires careful chemical handling. The
polymerization proceeds through a quasi-living chain-growth mechanism such that the
molecular weight is controllable with narrow molecular weight distributions.74,75

29
Stille polycondensation has been demonstrated as a versatile polymerization
methodology yielding functional materials.76 The Stille coupling reaction takes place
between aryl or vinyl stannanes and aryl halides with catalytic amounts of palladium to
form new carbon-carbon bonds. In addition to high molecular weight polymers and high
yields, the Stille polymerization also affords stereospecific and regioselective
conjugated polymers. Furthermore, the coupling reactions are less oxygen- and
moisture-sensitive than other organometallic components, such as Grignard reagents,
although the organotin compounds are toxic and expensive.
Another viable polymerization route is Suzuki-Miyaura reaction, employing
organoboronic acids, aryl halides, and catalytic amounts of palladium. Through this
polymerization route, CPs with high molecular weight and narrow molecular weight
distributions have been prepared. This coupling reaction traditionally requires basic
reagents to activate the boronic acid/ester to form the new carbon-carbon bonds.77 As
such, there are some limitations with this polymerization route. However, base-free
Suzuki polymerization conditions have recently been developed.78 For instance,
Brookins et al. demonstrated the optimization of a base-free Suzuki polymerization for
poly(fluorine) functionalized with carboxylic acid groups.79
Processing Methods
A number of solution processing techniques for conducting polymers have been
developed for both fundamental studies and large-scale printing. While the spray-
casting technique was predominantly used in this work, other solution processing
techniques are introduced to illustrate other viable processing opportunities in this field.
Material processing techniques that are commonly implemented for small-scale
research include spray-casting and spin-coating, shown in Figure 1-6, in which

30
fundamental structure-property relationship studies and small-scale device fabrications
are carried out. In these techniques, conjugated polymers are dissolved in organic
solvents such as toluene, dichloromethane, or chloroform at a concentration ranging
from 1-5 mg/mL. Aqueous solutions can even be used.80 Spray-casting utilizes a
pressurized airbrush sprayer to process the polymer onto an electrode surface. Spray-
cast films are relatively smooth to the naked eye, and the polymer thickness ranges
from 0.2 – 1.0 µm.33 Spin-coating is another commonly used processing technique,
especially for organic semiconducting materials for use in photovoltaic devices.
Typically, polymer films are relatively thin, ranging from (50 – 150 nm) with a 1-2 nm
RMS surface roughness.81
Figure 1-6. Common solution processing techniques for soluble conjugated polymers.

31
Large-scale device prototypes require advanced processing techniques such as
inkjet and flexo-printing. Inkjet printing has previously been utilized for processing active
layers in organic photovoltaics (OPVs) and organic light emitting diodes (OLEDs). This
technique is especially useful for printing materials with precise control. For example,
Foulger have demonstrated printing resolution on the micrometer scale.84 In addition,
flexo-printing offers a different method of processing soluble electroactive materials.
This technique uses flexible printing and inked plates in a roll-to-roll method as shown in
Figure 1-6. The ink roller transfers the active material from the ink reservoir to an
adjacent roller that controls the uniformity and thickness. The plate cylinder controls the
pattern, while the impression cylinder applies pressure to the substrate.
Electrochemical Processes in Conjugated Polymer Electrodes
The second major area of conjugated polymer electrochemical research concerns
the electrochemical processes occurring at the electrodes made from, or coated with,
CPs. Fundamental and applied electrochemical processed as related to CPs are
discussed in this section.
Cyclic voltammetry (CV) remains one of the most useful electrochemical
processes to study conjugated polymers and CP-based electrochemical devices by
providing both quantitative and qualitative information. CV (also referred to as
potentiodynamic cycling) measures the cell current while sweeping the applied potential
between the working and reference electrodes. The obtained voltammogram reveals
several important properties, such as the polymer's redox switching range, the relative
response rate of redox processes, the electrochemical stability, and the degree of
reversibility.

32
The cyclic voltammogram of PProDOT-Me2 shown in Figure 1-7a elucidates
several electrochemical properties such as half-wave potential (E1/2), scan rate
dependence, and film capacitance. The half-wave potential, measured by taking the
average of the peak anodic and cathodic current potentials, is the potential at which the
concentrations of the oxidized and reduced species are equal.
Figure 1-7. Electrochemical characterization of conjugated polymers. a) Cyclic voltammogram for PProDOT-Me2 switching in 0.1 M LiBTI/ACN at 50 mV/s. b) Scan rate dependence of polymer film. c) Peak currents as a function of scan rate
In an ideal case, the cyclic voltammogram of a reversible system would show
symmetrical and mirror-image anodic and cathodic peaks, identical potentials and
current levels, and a peak to peak difference (Epeak) of 59 mV.
By varying the scan rate of cyclic voltammetry experiments, the polymer's scan
rate dependence can be revealed. This is accomplished by monitoring the peak anodic
(ip,a) and cathodic (ip,c) current responses as a function of scan rate, as illustrated in
Figure 1-7b. In the case of electrode-bound species such as electroactive conjugated
polymers, the current response is linearly proportional to the scan rate and can be
described by Equation 1-4:
ip = n2F2AΓ / 4RT (1-4)

33
where n is the number of electrons, F is Faraday’s constant (96,485 C/mol), A is the
surface area of the working electrode (cm2), Γ is the concentration of surface bound
electroactive centers (mol/cm3) and is the scan rate (V/s).
A linear relationship between current and scan rate indicates that the polymer is
well-adhered to the electrode surface. Generally, Equation 1-4 holds true for thin
polymer films. With thick films however, the anodic and cathodic peak currents vary with
the square root of scan rate, indicating that the redox process is limited by the diffusion
of counter-ions transporting in and out of the film. In another word, the polymer is
characteristic of an insulator (resistor), and the shape of the cyclic voltammogram is
usually oblong.
In addition to the peak anodic and cathodic currents that are characteristics of
redox (faradaic) reactions, the cyclic voltammogram shown in Figure 1-7 also exhibits a
broad current plateau that arises from capacitive currents through double-layer charging
at the polymer-electrolyte interface.89,90 High levels of capacitive currents are desirable
for charge storage applications. Chapter 3 will elaborate the use of cyclic
voltammograms and scan rate dependence experiments to evaluate the capacitance of
polymer films and electrochemical supercapacitors as well as the charging and
discharging rates of ESCs.
Another electrochemical process applied to conjugated polymers is square-wave
potential cycles as represented in Figure 1-8a. The working electrode is switched
instantaneously between two potentials while the current-time (chronoamperometry) or
the charge-time (chronocoulometry) profile is monitored.

34
Figure 1-8. Representative chronoabsorptometry data. a) Representation of potential square-wave cycles between -0.4 to +0.8 V vs. Ag/Ag+ at 0.5-second periods for an electrochromic polymer (Random-Black). b) Chronoabsorptometry
experiment of a film of Random-Black (monitored at = 550 nm) on an ITO-coated substrate in 0.1 M LiBTI / ACN where the potential is stepped between the neutral state (-0.4 V) and the oxidized state (+0.8 V vs. Ag/Ag+).
The quantitative analysis of chronoamperometry is described by the Cottrell
equation:
i = nFACD1⁄2
-1⁄2t -1⁄2 (1-5)
where, n is the number of electrons transferred per molecule, F is Faraday's constant
(96,485 C/mol), A is the surface area of the working electrode (cm2), D is the diffusion
coefficient of the redox active sites (cm2/s), C is the bulk concentration (mol/cm3), and t
is the time in seconds.
The analysis of charge in chronocoulometry is carried out by integrating the
Cottrell equation to obtain the following equation for linear diffusion controlled systems:
Q = 2nFACD1⁄2
-1⁄2t1/2 (1-6)

35
where n is the number of electrons, A is the electrode area (cm2), D is the diffusion
constant (cm2/s), C is the concentration (mol/cm3) of the analyte, and t is the time in
seconds.
As it will be elaborated in Chapters 4 and 5, the switching of electrochromic
polymers between their colored and bleached states can be accomplished by potential
square-wave cycles between their neutral and oxidized states, respectively. This
electrochemical process mimics the instantaneous switching “on” and “off” of
electrochromic devices. By coupling potential square-wave cycles with in situ UV-vis-
NIR experiments (chronoabsorptometry), the optical contrast and switching speed of
electrochromic polymers and devices are evaluated. Figure 1-8b exhibits an example of
a chronoabsorptogram for a black-to-transmissive polymer switching between the
neutral (-0.4 V) and oxidized states (+0.8 V). A transmittance contrast of 50% T was
demonstrated by applying a 0.5-second potential square-wave switching period.
Application of Electrochemical Devices
The overall architecture of electrochemical devices consists of two electrodes,
where oxidation of electroactive materials occurs at the anode and reduction (or re-
neutralization) takes place at the cathode. A layer of electrolyte is placed between
electrodes to electrically balance the oxidized and reduced species during
electrochemical switches. This general assembly is applied to all electrochemical
devices presented in this dissertation, though slight modifications are necessary, as
illustrated by the schematic for energy storage (supercapacitor) and electrochromic
devices in Figure 1-9.

36
Figure 1-9. Overview schematic of electrochemical devices and specific components for energy storage and electrochromic devices.
Fundamental differences in energy storage and electrochromic device architecture
are indicated. Foremost, energy storage devices utilize a separator, a porous
membrane placed between electrodes which not only prevents an electrical short, but
also allows rapid transport of ionic charge carriers needed to complete the circuit or
charge neutrality during the passage of current in an electrochemical cell.
On the other hand, separators are not desirable in window-type electrochromic
devices since the membrane affects the overall device color purity. As such, spacer
membranes are utilized around the outer edges of the device electrode to prevent an
electrical short. At the same time in order to retain color purity in electrochromic window
devices, the conducting substrates and electrolyte must both be highly transparent and
near colorless. Indium tin oxide (ITO)-coated glass substrates and transparent SWNTs91
as well as polyethylene terephthalate (PET)92 substrates have been incorporated in
smart window electrochromic devices.
Energy Storage
Electrochemically dopable materials for charge storage materials include carbon,
inorganic metal oxides, and organic conjugated polymers. Depending on materials and
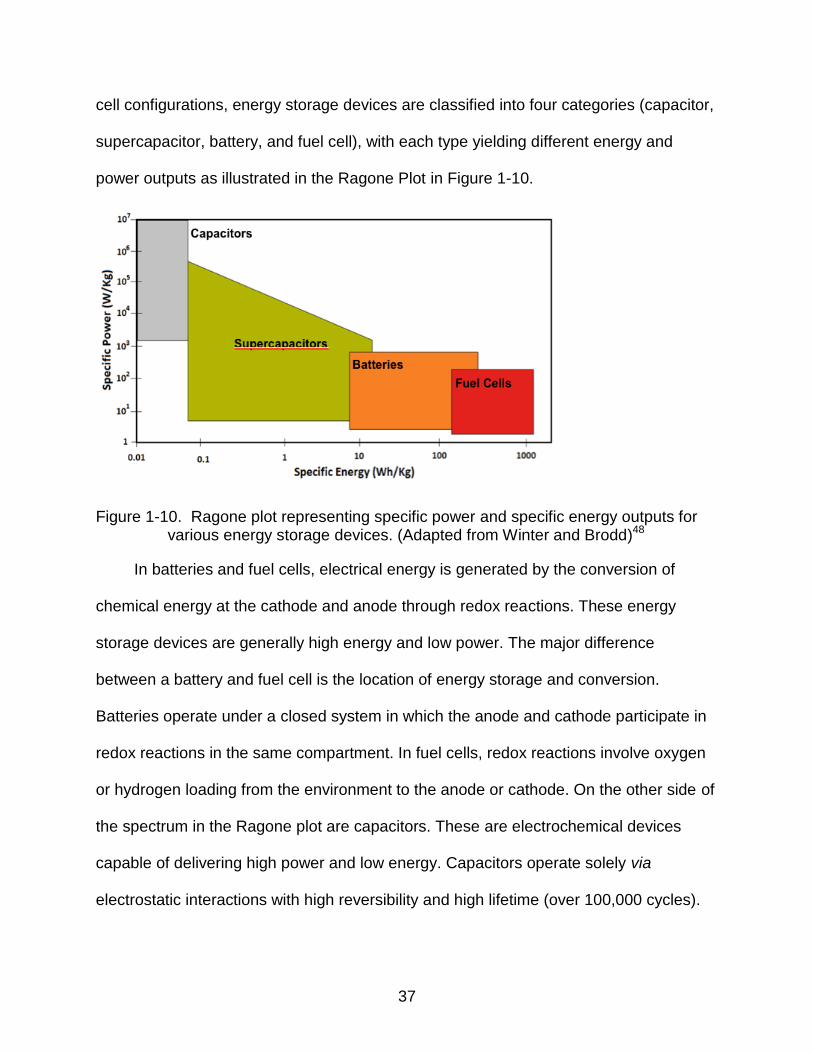
37
cell configurations, energy storage devices are classified into four categories (capacitor,
supercapacitor, battery, and fuel cell), with each type yielding different energy and
power outputs as illustrated in the Ragone Plot in Figure 1-10.
Figure 1-10. Ragone plot representing specific power and specific energy outputs for various energy storage devices. (Adapted from Winter and Brodd)48
In batteries and fuel cells, electrical energy is generated by the conversion of
chemical energy at the cathode and anode through redox reactions. These energy
storage devices are generally high energy and low power. The major difference
between a battery and fuel cell is the location of energy storage and conversion.
Batteries operate under a closed system in which the anode and cathode participate in
redox reactions in the same compartment. In fuel cells, redox reactions involve oxygen
or hydrogen loading from the environment to the anode or cathode. On the other side of
the spectrum in the Ragone plot are capacitors. These are electrochemical devices
capable of delivering high power and low energy. Capacitors operate solely via
electrostatic interactions with high reversibility and high lifetime (over 100,000 cycles).

38
Supercapacitors, taking advantage of both the electrochemical double-layer and
redox-active charging abilities, bridge the gap between capacitors and batteries on the
Ragone Plot with intermediate energy and power densities.50 Electrochemical double-
layer supercapacitors store charge electrostatically using reversible adsorption of
electrolyte ions. The charge separation occurs upon polarization at the electrode-
electrolyte interface, and the subsequent double-layer capacitance is directly
proportional to the electrolyte dielectric constant and surface area, and inversely
proportional to the effective thickness.51 Furthermore, reversible surface adsorption
allows fast energy uptake and output. The absence of faradic process can improve the
overall cycling lifetime by avoiding swelling and expansion of charge storing materials.
Active materials with fast, reversible redox reactions utilize faradic processes to
store charge and represent a class of capacitive materials called “pseudo-capacitive
materials”. Inorganic metal oxides such as RuO2 and MnO2 as well as organic
conducting polymers have been employed as pseudo-capacitive materials in
supercapacitors. Ruthenium oxide has been widely investigated for its conductivity and
multiple oxidation states, and specific capacitances of more than 600 F/g have been
reported.93 However, a low voltage window (1.2V) and the high cost of ruthenium limits
the practical utilization of ruthenium oxide in electrochemical energy storage devices.
Electrically conducting polymers offer alternative redox-active materials in
supercapacitors. Poly(aniline), poly(pyrrole), poly(thiophene) and their derivatives have
shown promise as p-dopable materials in supercapacitor applications. Furthermore,
donor-acceptor-donor polymers as n-dopable materials have the potential to improve

39
the overall power and energy densities.94 The performance of these materials in
electrochemical supercapacitors is detailed in Chapter 3.
Electrochromism
Electrochromic materials are those that exhibit a reversible change in absorption
(or transmittance) upon oxidation or reduction. As optical changes may occur in the
ultra-violet (UV), visible (Vis), near-infrared (NIR), mid-infrared (MIR) as well as in the
microwave region of the spectrum, these various electrochromic changes are exploited
in different application-driven electrochemical devices.95-97 Electrochromic materials with
large absorption contrast in the NIR have shown promise in electrochromic variable
optical attenuators (EC-VOA) and for modulating fiber-optic signals for optical
telecommunications.98 Optical attenuators are key components in fiber-optic
communication networks, enabling the control of optical signal intensity and the
regulation of signal powers in amplified wavelength-division-multiplexed networks.99,100
A more active area of electrochromic research has been directed towards optical
changes in the visible spectrum, giving rise to applications such smart windows,
electrochromic displays, and reflectance mirrors. Electrochromic materials with high
degrees of optical modulation in the visible spectrum include both inorganic (Prussian
blue, transition metal oxides), and organic (viologens, conjugated polymers) systems.
Prussian blue (ferric ferrocyanide) is one of the earliest studied electrochromic materials
and was first prepared on a solid electrode by Neff in the electrochemical reduction of
solutions containing iron (III) and hexacyanoferrate (II) ions.101 Thin films of Prussian
blue exhibit multichromic properties such that upon reduction in aqueous medium
containing potassium ions, become colorless (Everitt salt, ES). Oxidation with a chloride

40
medium affords a yellow compound (Prussian yellow, PY). The described
electrochromic properties were studied by Itaya102 using the following redox reactions:
(1-7)
(1-8)
Transition metal oxides have been one of the most widely studied classes of
electrochromic materials. Depending on the metal oxide, either anodic or cathodic
coloration is observed; Cr, Mn, Fe, Co, Ni, Rh, and Ir are anodically coloring, whereas
Ti, Nb, Mo, Ta, and W are cathodically coloring. Of these transition metal oxides,
tungsten trioxide has been the most widely studied and has been used in commercial
electrochromic applications.103 Tungsten trioxide and other transition metal oxide
electrochromic materials, are deposited via thermal evaporation, sputtering, and
chemical vapor deposition.104 While as-deposited tungsten trioxide films are highly
transmissive, electrochemical reduction, represented in the equation below, induces a
color change from colorless to dark blue:
(1-9)
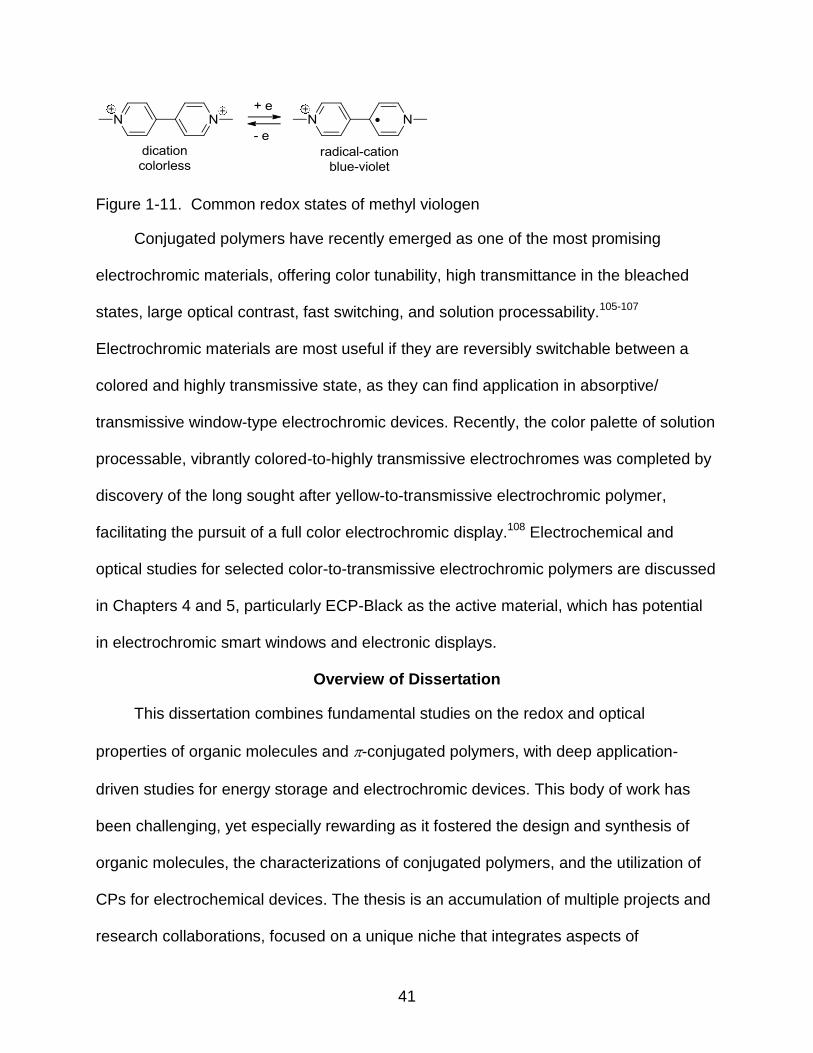
Viologens represent a class of small molecule organic electrochromes formed by
the diquaternization of 4,4’-bipyridyl to yield 1,1’-disubstituted-4,4’-bipyridinium salts.
The most common class of viologens is 1,1’-dimethyl-4,4’-bipyridinium (methyl viologen,
MV) which is colorless in the dication form illustrated in Figure 1-11. Reduction of the
dication forms the highly delocalized and stable radical-cation, which exhibits a blue
color.
41
Figure 1-11. Common redox states of methyl viologen
Conjugated polymers have recently emerged as one of the most promising
electrochromic materials, offering color tunability, high transmittance in the bleached
states, large optical contrast, fast switching, and solution processability.105-107
Electrochromic materials are most useful if they are reversibly switchable between a
colored and highly transmissive state, as they can find application in absorptive/
transmissive window-type electrochromic devices. Recently, the color palette of solution
processable, vibrantly colored-to-highly transmissive electrochromes was completed by
discovery of the long sought after yellow-to-transmissive electrochromic polymer,
facilitating the pursuit of a full color electrochromic display.108 Electrochemical and
optical studies for selected color-to-transmissive electrochromic polymers are discussed
in Chapters 4 and 5, particularly ECP-Black as the active material, which has potential
in electrochromic smart windows and electronic displays.
Overview of Dissertation
This dissertation combines fundamental studies on the redox and optical
properties of organic molecules and -conjugated polymers, with deep application-
driven studies for energy storage and electrochromic devices. This body of work has
been challenging, yet especially rewarding as it fostered the design and synthesis of
organic molecules, the characterizations of conjugated polymers, and the utilization of
CPs for electrochemical devices. The thesis is an accumulation of multiple projects and
research collaborations, focused on a unique niche that integrates aspects of

42
conjugated polymers and electrochemistry. Experimental methods and characterization
techniques employed to acquire data presented in this dissertation are summarized in
Chapter 2.
One of the emerging fields of conjugated polymer research is in the development
of electrode materials in charge storage applications. The possibility of manufacturing
low-cost, lightweight, and flexible power storage devices for applications such as
portable consumer electronics, military applications, and electronic vehicles has
motivated the advancement of this field. Chapter 3 details the design and synthesis of
electron-rich dioxythiophene molecules for electrochemically polymerized electrodes in
symmetric (Type I) electrochemical supercapacitors. A novel acceptor – isoindigo – is
introduced as a donor-acceptor-donor electropolymerizable monomer for asymmetric
(Type III) supercapacitors. Cyclic voltammetry and galvanic charging-discharging cycles
are utilized to gain insight into their capacitive behaviors. A novel lamination technique
for device encapsulation is described, as well as the ability to tune capacitance and
voltage by the construction of device modules.
Electronic devices, specifically electrochromic windows that can switch from an
absorptive colored state to a highly transmissive state, are gaining interest for
applications in military camouflage and privacy window tinting. Chapter 4 focuses on the
optical and colorimetric properties of a novel solution-processable black-to-transmissive
electrochromic polymer in the development of absorptive/transmissive window-type
devices with an emphasis on switching speed. The correlation between current and
voltage in the context of polymer thickness and electrolyte composition is investigated.

43
In addition, a new spectroscopic characterization method to rapidly acquire full
spectral transitions of sub-second electrochromic films is described for the first time in
Chapter 5. This analytical technique introduces a novel method to measure switching
speeds of electrochromic materials: ECP-Magenta, ECP-Green, and ECP-Black.
Finally, experimental outlooks of an automated spray-cast setup and an inkjet printer
suitable for solution processable polymers are described. Conclusions, perspectives,
and path forward for the presented work are described in Chapter 6.

44
CHAPTER 2 EXPERIMENTAL METHODS AND CHARACTERIZATION TECHNIQUES
Introduction
In Chapter 1, the fundamental properties of conjugated polymers were described
and related to energy storage and electrochromic applications. In order to gain a deeper
understanding of our materials for these applications, several electrochemical and
spectroscopic techniques were used. This chapter presents an overview of the
experimental techniques and methodologies used in the preparation of this dissertation.
As previous dissertations from the Reynolds group have given extensive background
overviews on electrochemical and optical spectroscopy techniques, only key
experimental methods and characterization techniques are described.
Materials
General Chemicals
Electrochemical grade electrolytes were purchased when available, and were
purified as needed according to the literature.109 1-Ethyl- 3-methyl-1-H-imidazolium
bis(trifluoromethylsulfonyl) imide (EMI-BTI) was purchased from Covalent Associates,
Inc. Lithium bis-(trifluoromethylsulfonyl)imide (Li-BTI), tetrabutylammonium
tetrafluoroborate (TBABF4, 99%) and tetrabutylammonium hexaflurophosphate
(TBAPF6, 99%) were purchased from Sigma Aldrich and recrystallized prior to use.
Lithium tetrafluoroborate (LiBF4, 99%) was purchased from Acros. Poly(methyl
methacrylate) (PMMA, Mw = 996,000 g/mol) was purchased from Aldrich and used as
received.
Acetonitrile (ACN, HPLC grade), dichloromethane (DCM, HPLC grade), and
toluene (certified ACS grade) were purchased from Fischer Scientific. Acetonitrile was

45
distilled over calcium hydride prior to use. Propylene carbonate (PC, anhydrous 99.7%)
was purchased from Sigma Aldrich with a Sure Seal ®. Benzonitrile (BZN, 99% extra
pure) was purchased from Acros. Acetonitrile, propylene carbonate, and benzonitrile
were degassed via four freeze-pump-thaw cycles prior to use inside the glove box. Gel
electrolytes used in electrochemical devices were prepared by dissolving 1.0 M
electrolyte of choice with 13% m/v PMMA in PC.
Electrochemical Supercapacitor (ESC) Materials
2,2-Dimethyl-3,4-propylenedioxythiophene (ProDOT-Me2) was synthesized via the
transetherification between 3,4-dimethoxythiophene and 2,2-dimethyl-1,3-propanediol
according to the methodologies previously reported.110 5,5’-Bis(3,4-ethylenedioxythien-
2-yl)-N,N’-dibutylisoindigo (Bis-EDOT-isoindigo-butyl2) was prepared by Dr. Leandro
Estrada via Stille coupling between 5,5’-dibromo-N,N’-dibutylisoindigo and 2-
trimethylstannyl-3,4-ethylenedioxythiophene (EDOT-SnMe3).
Gold-coated Kapton ® substrates (Gold 1000 Å; 1 mil Kapton/ 3M 966 adhesive)
were purchased from Astral Technology Unlimited. Contacts for the electrodes were
made from conductive adhesive copper tape (1131, 3M). Separator materials consist of
coffee filter papers and polypropylene prefilters (Millipore, 5 μm pore size, 110 μM
thickness). Thermal encapsulation of electrochemical devices (Wilson Jones laminator,
LP35HS) was carried out with heat seal laminating pouch (GBC, 3 mil).
Electrochromic Device (ECD) Materials
Indium-tin oxide (ITO) coated glass substrates in cuvette size (CG-51IN-CUV, 7 x
50 x 0.7 mm, Rs = 5 – 15 ) and device-size (CG-40IN-S115, 25 x 75 x 1.1 mm, Rs = 4
– 8 ) were purchased from Delta Technologies, Ltd. Contacts for the electrodes were
46
made from conductive adhesive copper tape (3M). The spacer materials applied
between the ECD electrodes were double-sided tape (scotch tape and 3M VHM™).
Two different epoxies were used to encapsulate our ECDs: hardman epoxy and Loctite
E-OONS Hysol epoxy adhesive.
Electrochemistry
General Setup
Electrochemistry was carried out using a three-electrode cell with a platinum (Pt)
wire or a Pt flag as the counter electrode, a Ag/Ag+ reference electrode prepared with
10 mM silver nitrate (Bioanalytical Systems, Inc.) solution in 0.1M TBABF4/ACN
supporting electrolyte, and a platinum (or gold) button (0.02 cm2) or ITO coated glass
slides described previously as the working electrode. Electrochemical polymerizations
were carried out in solutions composed of either 10 mM or 2 mM monomer in 0.1 M
electrolyte solution unless otherwise noted. All supporting electrolyte solutions were
purged with argon prior to electrochemical and optical measurements, and a constant
flow of argon was supplied over the electrochemical cell to maintain an inert
atmosphere. An EG&G Princeton Applied Research Model 273 potentiostat was used to
generate all electrochemical processes under the control of the Coreware software from
Scribner and Associates.
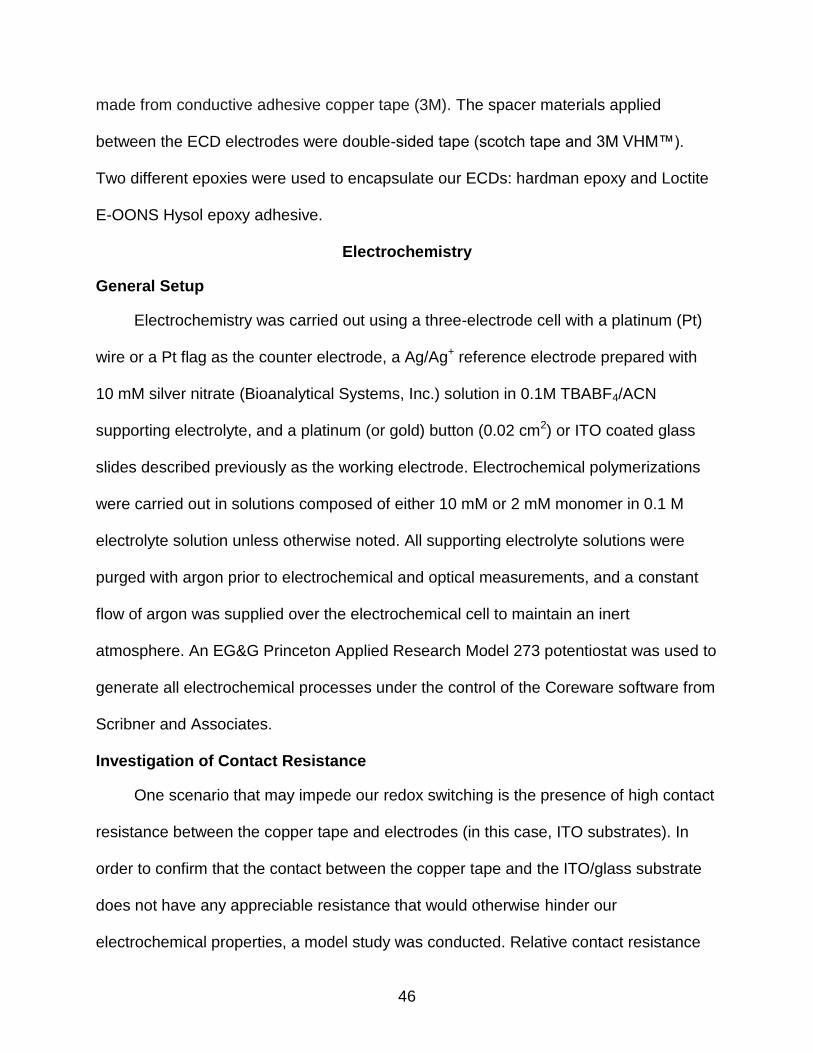
Investigation of Contact Resistance
One scenario that may impede our redox switching is the presence of high contact
resistance between the copper tape and electrodes (in this case, ITO substrates). In
order to confirm that the contact between the copper tape and the ITO/glass substrate
does not have any appreciable resistance that would otherwise hinder our
electrochemical properties, a model study was conducted. Relative contact resistance

47
between the copper tape adhesive and copper wire/silver paste was measured
according the diagram shown in Figure 2-1. A multimeter (designated as “Measure
Current”) was coupled to the potentiostat and to either the “Cu Tape” or the “Ag Paste”
via the working electrode. The counter and reference electrodes were then shorted and
coupled to the ITO/glass substrate.
Figure 2-1. Schematic of electrochemical model used to investigate the relative contact resistance between a) silver paste and b) copper tape.
The measured current with an applied voltage of 1.0V was relatively constant
across the copper tape adhesive and the copper wire/silver paste. As such, the relative
resistance across the two leads is also similar on the basis of Ohm’s Law. The most
significant difference in the measured current and calculated resistance was observed
by changing the distance between the two contact leads. Based on the results shown in
Table 2-1, we can conclude that the resistance of the adhesive from the copper tape
and the silver paste is negligible, although higher resistance was observed along the
ITO substrate by varying the distance between the two contacts on the ITO/glass
substrate surface.

48
Table 2-1. Calculated resistance for silver paste and copper tape contacts as a function of distance.
Distance between Contacts on ITO
(cm)
Applied Voltage
(V)
Measured Current (mA) Calc’d Resistance (Ω)
Cu Tape Ag Paste Cu Tape Ag Paste
2.0
1.0
25 27 40 37
1.0 34 40 29 25
0.0 75 84 13 12
Cell Setup and Film Handling
Electrochemical polymerizations were accomplished by repeated potentiodynamic
scanning of the working electrode between low potential where no redox reactions
occur and near the monomer’s oxidation peak. The electrodeposited polymer films were
rinsed with monomer-free supporting electrolyte solution before electrochemical
characterizations were carried out.
Two electrochemical cell designs were used in the preparation of ESC electrodes.
As illustrated in Figure 2-2a, the gold/Kapton is stabilized vertically between two Teflon
substrates. Electrochemical polymerization in this cell design generates CP electrodes
of reproducible surface areas (0.79 cm2). In the second cell design displayed in Figure
2-2b, the gold/Kapton substrate is placed horizontally between two glass cells. Here,
gold/Kapton is adhered to both sides of the substrate to construct a bipolar electrode.
The use of two o-rings and a clamp (not shown in the diagram) to stabilize the
components together ensures that both the top and bottom halves could be used as an
electrochemical cell. After electrochemical polymerization on one half, the procedure is
carried out on the reverse side to yield a bipolar CP-electrode. The surface area of the
electrochemical cell is 2.82 cm2.

49
Figure 2-2. Electrochemical cell designs for the preparation of ESC electrodes. a) Gold/Kapton electrodes are placed vertically between two Teflon substrates, with shadow mask area = 0.79 cm2. b) Gold/Kapton bipolar electrode is placed horizontally between two glass electrochemical cells with areal surface area of 2.83 cm2.
Device Fabrication
Electrochemical Supercapacitors
A schematic diagram for electrochemical supercapacitors utilizing CP-electrodes is
shown in Figure 2-3a. The assembly method for these devices employs a sandwich-
type configuration of two conductive electrodes, coated with electroactive polymers,
which face each other and are separated by a porous membrane containing ionically
conductive gel electrolyte. The use of another CP as the counter electrode ensures
charge balance of the redox reactions which take place on the cathode and the anode
during charging and discharging.

50
Figure 2-3. Encapsulation of Supercapacitors. a) General electrochemical supercapacitor assembly and encapsulation b) thermal encapsulation method with laminator, and c) photograph of typical ESC. Adapted with permission from Liu, D. Y.; Reynolds, J. R. ACS Appl. Mater. Interfaces 2010, 2, 3586. Copyright 2010 American Chemical Society.
Prior to ESC encapsulation, CP films are neutralized and oxidized
potentiostatically to prepare the anode and cathode, respectively. In the case of
PProDOT-Me2, the films were held at -0.6V and +0.9 V vs. Ag/Ag+ for 30 seconds. In
the case of PEDOT-iI-butyl2, films were neutralized and oxidized potentiostatically at 0.0
and +0.7 V vs. Ag/Ag+ for Type I ECSs, and at -0.35 V for electrodes in Type III ESCs.
The pre-packaged supercapacitor assembly is placed between thermally sealable
laminate sheets and passed through a laminator as illustrated in Figure 2-3b. Auxiliary
laminate materials are trimmed around the edges to yield the final device as shown in
the photograph (Figure 2-3c).
Supercapacitor Module
The supercapacitor modules described in Chapter 3 are assembled by two
different methods, via external or internal connections. In the external configuration,
individual ESCs are connected using alligator clips, from the cathode of one device to
the anode of another device, and so on for modules in series. Conversely, ESCs in
parallel are coupled cathode to cathode, and anode to anode respectively. Figure 2-4

51
depicts the assembly of six total ESCs, with two individual devices coupled in series
with three sets connected in parallel.
Figure 2-4. Supercapacitor Module. a) Schematic of ESC module with two devices in series and three sets in parallel and b) Photograph of externally connected ESC module.
A schematic diagram for an internal ESC module is shown in Figure 2-5a. The
assembly of these modules employs a sandwich- type configuration in which a CP-
coated bipolar electrode is positioned internally between two monopolar electrodes to
ensure charge balance of the redox species. The electrodes are coupled in series to the
exterior electrodes to complete a charged ESC module. Thermal encapsulation method
of the thin flexible layers nicely compliments the fabrication of these modules as a single
stack, as shown in Figure 2-5b.
-+ -+
-+ -+
-+ -+
a) b)
-+ -+
-+ -+
-+ -+
a) b)

52
Figure 2-5. Supercapacitor Module with bipolar electrodes. a) Schematic of internal ESC module employing bipolar electrodes. b) Photograph of an internal ESC module. Adapted with permission from Liu, D. Y.; Reynolds, J. R. ACS Appl. Mater. Interfaces 2010, 2, 3586. Copyright 2010 American Chemical Society.
Absorptive/Transmissive Window-type Electrochromic Devices
Two transparent conductive electrode substrates were spray-coated with
electrochromic polymers of controlled absorbance. The working electrode (with
cathodically coloring ECP) was oxidatively doped while counter electrode with MCCP
was neutralized prior to device assembly to ensure the balance of charge. Highly
transparent gel electrolyte for electrochromic devices was composed of 1.0 M LiBTI, 13
wt % PMMA, PC. Devices were encapsulated using commercially fast (3-5 minutes)
curable epoxy. Blank devices, consisting of two facing ITO/glass slides with the gel
electrolyte between them with no electroactive polymer layers, were prepared for all
background optical measurements.

53
Optical Spectroscopy
Optical experiments were carried out on a Varian Cary 500 UV-vis-NIR
spectrophotometer. Spectroelectrochemical measurements were taken to study the
electrochromic behaviors of CPs. The polymer films were prepared by spray-casting
from 2 mg/mL DCM or toluene solutions. An airbrush (Iwata-eclipse HP-BS) was utilized
at 25-30 psi argon pressure. All polymer solutions were filtered through 0.45 m
Whatman Teflon (PTFE) syringe filters prior to spraying. The thickness of the
electrochromic films was controlled by monitoring the absorbance at max during
spraying. The electrochromic behavior was observed by recording the spectral changes
upon oxidation of the polymer film. The optical band gap was determined from the low-
energy absorption edge (onset of the π-π* transition) of the neutral absorption spectrum
of the polymer film.
Synchronization of Electrochemical and Optical Data
The Ocean Optics spectrophotometer comes with a deuterium light source that
radiates in the 215 – 400 nm and a tungsten halogen light source that radiates between
400 – 2000 nm ranges. Both light sources require at least thirty minutes to warm-up.
Spectrometer components consisting of the fiber optics, sample holders, and detectors
(190 – 900 nm) were placed inside a home-built enclosure to eliminate extraneous light.
The overall in-situ electrochemical–optical spectroscopy instrument is illustrated in
Figure 2-6. The trigger circuit, described in the next section, is connected to the working
electrode of the cell for input via BNC (Bayonet Neill-Concelman) cable, to the reference
electrode via an identical BNC cable, and also attached to the spectrophotometer via
BNC/D-Sub connector.

54
Figure 2-6. Schematic of in-situ electrochemical spectroscopy instrumentation. PC1 controls the potentiostat to signal in a square-wave to the triggering circuit that is also coupled to the electrochemical cell. The triggering circuit sends an output to the spectrometer detector to start collecting spectra data, which are displayed on PC2. Representative potential square-wave and
transmittance results are shown for ECP-Black (Abs = 0.7 a.u. at = 550 nm).
To prepare for measurements, the reference cell is placed in the enclosure, and
the reference and background intensity spectra (both by photon count) are collected.
The time between spectra can be set between 2 – 6 ms by an adjustable knob located
on the trigger circuit. A potential equal to the lower edge of the square-wave is then
held for 10 s to prime the triggering circuit and the sample of interest prior to the
experiment, which gave a potential for the trigger to contrast with the first rising edge of
the square-wave. The potentiostat and the spectrophotometer are activated in parallel,
and spectra are collected upon a triggering event. The collected measurements are
combined with the background and reference photon counts to calculate percent
transmittance by Equation 2-1 where f is the film spectrum, b is the background
spectrum and r is the reference spectrum.

55
(2-1)
Trigger Circuit
The design of the circuit board as illustrated in Figure 2-7 and subsequent
construction the trigger system was completed by Steve Miles from the UF electronics
shop.
Figure 2-7. Schematic of the external circuit used to electrically trigger the spectrometer detector during electrochemical switchings of electrochromic polymers.
The purpose of this trigger circuit is to instruct the spectrophotometer to collect
spectral data as soon as a rising or falling edge of a potential square-wave (greater than
0.4V) is output from the potentiostat. Technically, this is accomplished by means of a
series of monostable multivibrators, three of which generate the actual output signal
100)(
)(%
br
bfT

56
(designated A, B, and C) and two of which (designated D and E) retrigger the output
generators, as illustrated in Figure 2-6. The monostables control the overall time during
which the spectrophotometer will be collecting data or total data acquisition time
(TDAT). The parameters involved in the calculation of this TDAT are adjustable by
means of several internal and external potentiometers. Using these potentiometers, the
RC time-constant associated with each monostable can be adjusted, and thus the
TDAT can be varied from 2 ms to 10 s. Furthermore, the TDAT corresponds to the total
number of spectra the spectrophotometer will collect after a triggering event. By
calculating the upper limit, precise data acquisition in terms of both amount and
synchronization is ensured. The number to be entered is tabulated with Equation 2-2.
The number of periods over which data is to be collected (N), the frequency of the
waveform (f0), and the time in between spectral acquisitions (ts), are all incorporated into
the following formula:
Number of Spectra (2-2)
where ts is adjustable by a potentiometer on the triggering circuit, from 2 ms to 6 ms.
Since the triggering circuit activates as soon as an input in the rising/falling-edge format
described above is given, it is possible to synchronize electrochemical and spectral data
acquisition right at the point where oxidation or neutralization (reduction) begins, and
thus correlate both data types without the element of human error.
Colorimetry
In 2000, the Reynolds group introduced colorimetry as a method for quantitatively
measuring the color of electrochromic films.111 Colorimetric measurements are
performed with a Minolta CS-100 Chroma Meter. The samples are illuminated from
sotf
N

57
behind with a Graphiclite D5000 GLX Transparency Viewer (GTI Graphic Technology,
Inc.) in a light booth designed to exclude external light for both colorimetric and
photographic measurements. The Minolta CS-100 records color coordinates in the CIE
1931 Yxy format, in which Y stands for photometric luminance in units of cd/m2. x and y
are chromaticity coordinates designed to represent the hue and saturation. The relative
luminance of the sample, normalized to the standard, is determined by (Y / Yn x 100) in
which Y is the luminance of the sample and Yn is the luminance of the reference
background. The CIE 1931 Yxy color coordinates are converted into the CIE 1976
L*a*b* format as an improved representation of the color space established by the
Commission Internationale de l'Eclairage.112 Illustrated in Figure 2-8, the L*a*b* color
coordinates represent lightness on a scale of 0 to 100 (L*) and different levels of hue
and saturation (a* and b*).
Figure 2-8. CIE 1976 L*a*b* representation of lightness (L*) color coordinates (a* b*)113
Photography
The use of photography to represent the color of electrochromic films has recently
become an important aspect of our research. Photographs are vital supplementary data
used to compliment optical spectroscopy and colorimetry results. Because photographs

58
can provide an immediate visual representation of our electrochromic films or devices, it
is important to be as accurate as possible. A Nikon D90 DSLR, which is a digital single
lens reflex camera, can save photographs in JPEG and RAW formats. While JPEG files,
which can be resized and cropped, are used in this dissertation, the RAW files remained
unedited as our actual data. The following manual camera settings were used:
ISO Sensitivity: L 0.3
White Balance: 5000K, 0,0
Aperature: f/5.6
Shutter Speed: 1/80 s
Since the Nikon D90 was recently implemented, photographs in Chapters 3 and 4
were taken with an automatic point-and-shoot camera (FinePix S7000, Fuji Photo Film).
All photographs are presented as received without altering the color brightness or
saturation parameters.
Solution Conductivity
Conductivity of electrolyte solutions was measured using Fisher Accumet four
probe conductivity meter (cell constant = 1.0) calibrated in traceable solutions with exact
conductivity values at room temperature.
59
CHAPTER 3 DEVELOPING CONJUGATED POLYMERS FOR ELECTROCHEMICAL
SUPERCAPACITORS
Introduction
Electrochemical supercapacitors (ESCs) utilizing conjugated polymers (CPs) are
envisioned to bridge the gap between capacitors and batteries with intermediate power
and energy densities. Conjugated polymers are pseudocapacitive materials, where the
bulk of the active material undergoes fast redox reactions to provide capacitive
responses. Pseudocapacitance delivers charge storage capabilities predominantly via
faradic processes in the bulk with a small percentage coming from non-faradic double-
layer capacitance at the polymer and electrolyte interface.51,114
Conjugated polymer ESCs can be designed to ensure that the entire volume of the
material is involved in the charge storage process. The energy stored in CP-based
supercapacitors can be superior to carbon-based supercapacitors since charge storage
occurs in the bulk volume, whereas carbon-based materials only store charge at the
surface through double-layer ion adsorption/desorption. However, carbon-based
materials have fast kinetics since only the surface of the material is being accessed.
Additionally, there is great potential in utilizing CPs for charge storage devices as these
redox materials exhibit reduced cost, weight, and environmental impact relative to other
redox materials such as inorganic metal oxides.51,94
While highly regarded as the first conducting polymer discovered by Heeger et al.,
poly(acetylene) also functioned as the prototype material in polymeric charge storage
applications.115-117 Poly(acetylene) electrodes have the ability to be used as both the
cathode and the anode with p-doping and n-doping capabilities; however, the
advancement of poly(acetylene)-based batteries was hindered because of inherent
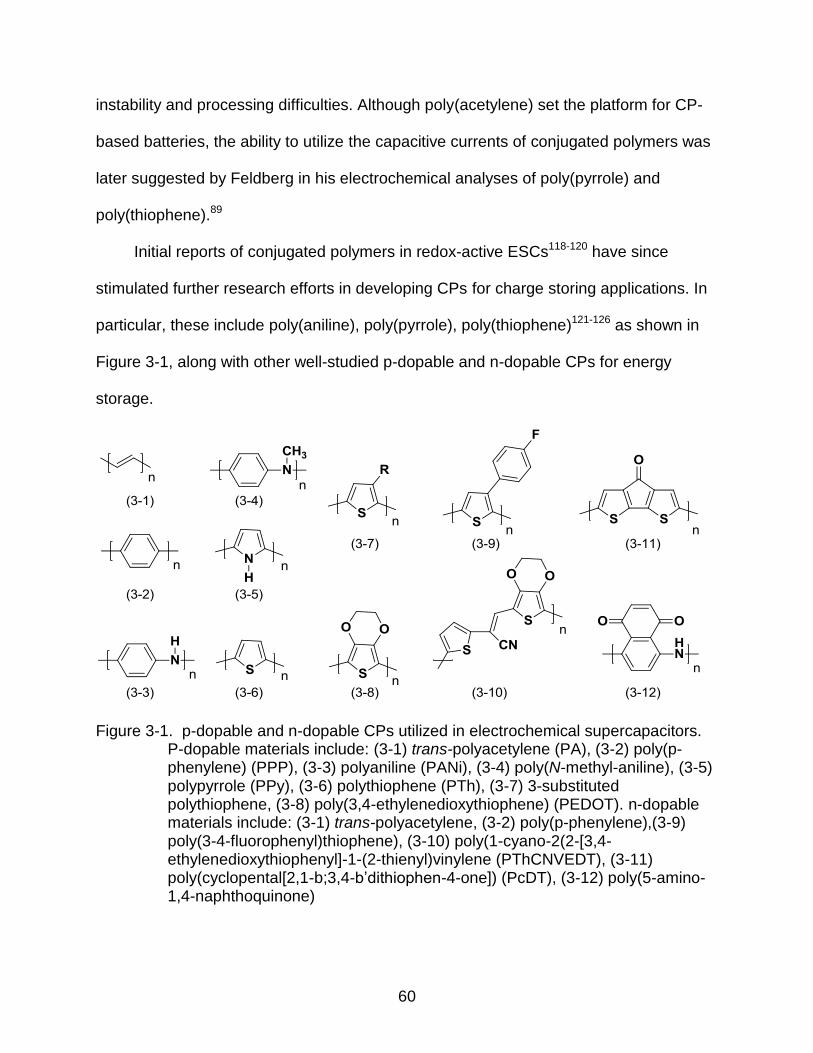
60
instability and processing difficulties. Although poly(acetylene) set the platform for CP-
based batteries, the ability to utilize the capacitive currents of conjugated polymers was
later suggested by Feldberg in his electrochemical analyses of poly(pyrrole) and
poly(thiophene).89
Initial reports of conjugated polymers in redox-active ESCs118-120 have since
stimulated further research efforts in developing CPs for charge storing applications. In
particular, these include poly(aniline), poly(pyrrole), poly(thiophene)121-126 as shown in
Figure 3-1, along with other well-studied p-dopable and n-dopable CPs for energy
storage.
Figure 3-1. p-dopable and n-dopable CPs utilized in electrochemical supercapacitors. P-dopable materials include: (3-1) trans-polyacetylene (PA), (3-2) poly(p-phenylene) (PPP), (3-3) polyaniline (PANi), (3-4) poly(N-methyl-aniline), (3-5) polypyrrole (PPy), (3-6) polythiophene (PTh), (3-7) 3-substituted polythiophene, (3-8) poly(3,4-ethylenedioxythiophene) (PEDOT). n-dopable materials include: (3-1) trans-polyacetylene, (3-2) poly(p-phenylene),(3-9) poly(3-4-fluorophenyl)thiophene), (3-10) poly(1-cyano-2(2-[3,4-ethylenedioxythiophenyl]-1-(2-thienyl)vinylene (PThCNVEDT), (3-11) poly(cyclopental[2,1-b;3,4-b’dithiophen-4-one]) (PcDT), (3-12) poly(5-amino-1,4-naphthoquinone)

61
Poly(aniline) has demonstrated charge storing capabilities in both non-aqueous
and aqueous electrolytes with specific capacitances over 200 F/g.127 The cycle-life of
polyaniline is limited for Li-doped PANi electrodes where the specific capacitance
dropped from 100 F/g to 70 F/g over 5000 cycles.128 The stability of PANi can be
improved by modifying the parent compound to poly(N-methyl aniline). By blocking the
site proton exchange, the polymer is stabilized against chemical degradation.129
Poly(pyrrole) has also shown promise in both battery and supercapacitor research with
a specific capacitance of 40-85 F/g.119,130,131 Similar to PANi, PPy switches well in both
aqueous and non-aqueous solutions. Poly(thiophene), albeit with reports of high
capacitance values of 250 F/g, has shown limited progress in energy storage because
of its electrochemical instability.132 However, electron-rich derivatives of polythiophene,
such as poly(3,4-ethylenedioxythiophene) (PEDOT), have been extensively studied as a
supercapacitor electrode because of their excellent electrochemical stability, fast redox
switching speeds and high specific capacitances.133-135
Subsequently, derivatives of poly(3,4-alkylenedioxythiophene)s that are
structurally similar to PEDOT have been developed for electrochemical devices.
Chemically synthesized poly(3,4-propylenedioxythiophene) (PProDOT) and similar
derivatives have been well-characterized as electrochromic polymers due to their high
optical contrast, rapid switching times, electrochemical lifetimes, and high coloration
efficiency.34,136,137 Although PProDOTs exhibit excellent electrochromic properties, their
capacitive behavior has not received as much attention. Previously, Stenger-Smith
prepared Type II supercapacitors based on two different p-dopable electron-rich
conjugated polymers, PEDOT and PProDOT, in which capacitive properties were

62
investigated as a function of supporting electrolytes.138 Their results showed improved
electrochemical stability in ionic liquid electrolytes, specifically, 1-ethyl-3-methyl-1H-
imidazolium bis(trifluoromethanesulfonyl)imide (EMI-BTI). Most recently, Irvin
investigated PProDOT- based supercapacitors utilizing ionic liquid electrolyte blends at
low temperatures from -30°C up to 60°C, with 10% capacity loss after 10,000 cycles at
70% depth of discharge.139 In this chapter, the electrochemical properties PProDOT-
Me2 films were investigated and incorporated into ESCs after excellent film properties
were observed.
In addition to electron-rich CPs, donor-acceptor-donor (D-A-D) systems have the
potential to increase the voltage range of ESCs since both oxidation and reduction
processes are utilized. To date, only a few selected acceptors have been studied as
ESC electrodes, including poly-3-(phenylthiophene) derivatives,119,120,140
poly(diheteroaryl-cyanovinylene),141,142 poly(cyclopentadithiopheneone),123 and
poly(amino-naphthoquinone).143
Recently, Mei introduced a novel acceptor – isoindigo – in D-A-D oligomers for
molecular bulk heterojunction solar cells where power conversion efficiencies of ca.
1.8% were achieved.81 Due to the ease of synthesis and derivatization, isoindigo was
further incorporated into D-A-D conjugated polymers with varying electron-donating
strengths, with LUMO on the range of -3.8 to -3.9 eV and band gaps between 1.6 and
2.0 eV.144 Inspired by the photovoltaic results, we naturally extended isoindigo into our
supercapacitor work.
In order to probe isoindigo as an acceptor unit for electrochemical
supercapacitors, a donor-acceptor-donor unit that is prone to electrochemical

63
polymerization was designed. 3,4-ethylenedioxythiophene (EDOT) is an excellent
candidate as the electron-rich unit owing to the low oxidation potential, lack of
undesirable electropolymerization sites, and polymer stability.145,146 As such, bis(3,4-
ethylenedioxythien-2-yl)-isoindigo (BEDOT-iI-butyl2) was synthesized by Dr. Leandro
Estrada and investigated as electrodes for electrochemical supercapacitors.
Due to the ability of electron-rich polymers to oxidize and D-A-D polymer to both
oxidize and reduce, they may find use in a variety of ESC configurations termed Type I,
II, III and IV by Rudge.119 Type I and Type III ESCs consist of symmetric electrode
materials where only p-dopable CPs are used in Type I and n-dopable CPs are used in
Type III configurations. Type II ESCs use two different p-dopable CPs, and Type IV
consists of two different n-dopable materials.
The operating principle of Type I and Type III supercapacitors is illustrated in
Figure 3-2. In the charged state for Type I ESCs, one of the CP electrodes is fully
oxidized (denoted by PProDOT+) while the other electrode is fully neutral (PProDOT0).
In the discharged state, both the cathode (the fully oxidized CP electrode) and the
anode (the neutral CP electrode) become 50% oxidized. As such, at most 50% of the p-
doping charging capacity is available for Type I supercapacitors. The utilization of p-
doping and n-doping redox processes can improve the voltage window in
supercapacitors, as depicted in Figure 3-2b. In the charged state for Type III ESCs, the
CP on the cathode is fully oxidized and the CP on the anode is fully reduced. In the
discharged state, both electrodes are neutralized, meaning 100% of the cathode’s n-
doping and 100% of the anode’s p-doping capacity are accessible.

64
Figure 3-2. Operating principle of a) Type I and b) Type III electrochemical supercapacitor
Since the voltage of an electrochemical device is defined as the potential
difference across the cathode and the anode, Type I ESCs attain a voltage window
between 0.5 to 1.2 V. Type III ESCs are more attractive as higher voltage windows are
attainable, generally between 1.5 to 3.0 V. However, there is a trade-off between
electrochemical stability and lower voltages with Type III devices.
The energy of supercapacitors charged to a voltage difference of V can be
calculated with the following equation:
(3-1)
(3-2)
where E is energy in joules, C is capacitance in F/g, V is the operating voltage
difference in V, ED is energy density in Whr/kg, and m is mass in kg.
Energy density is evaluated by accounting for the mass of either the active
materials (polymer and electrolyte) or the entire ESC device. Power density is the

65
average amount of energy delivered per unit time, which is essentially the discharge
time of ESCs. Power can be determined from the following equations:
(3-3)
(3-4)
where P is power in W, i is the average current in A, V is the operation voltage
difference in V, m is the mass in kg, J is the average current density in A/cm2, and A is
the area in cm2.
Both the average current and voltage are determined from the cyclic
voltammogram. Because the cyclic voltammograms presented in this chapter are highly
rectangular, the current was selected at the average voltage range. Additionally, cyclic
voltammograms were used to evaluate the capacitance of our films and devices using
the following equations:
(3-5)
(3-6)
where Ca is the aerial capacitance in mF/cm2, Q is charge in C, V is voltage in V, i is
current density in mA/cm2, and is the scan rate in V/s. Specific capacitance, Cs, is
determine by measuring the polymer mass of both electrodes. Through this chapter,
cyclic voltammograms are often graphed with current density (mA/cm2) and capacitance
(mF/cm2) as a function of voltage.

66
Based on the power and energy calculations shown above, the operating voltage
window range is an important metric to improve. One strategy to increase the voltage is
realized by connecting multiple supercapacitors in series. The coupling of individual
supercapacitors in series has a cumulative effect in the overall voltage; that is, the total
voltage is the summation of the voltage across each individual device. Alternatively,
increased current density is achievable by way of coupling supercapacitors in parallel
since the total current in a parallel orientation is the summation of the current from each
supercapacitor. Schematics of three individual devices, connected in series (a), and in
parallel (b) are illustrated in Figure 3-3 with representative calculations.
Figure 3-3. Supercapacitor modular design and representative calculations.
This chapter describes the electrochemical polymerization and capacitive
properties for a set of p-dopable and n-dopable CPs, as shown in Figure 3-4. The first
part describes the electrochemical polymerization and capacitive properties of
PProDOT-Me2 as p-doping CP electrodes for Type I electrochemical supercapacitors.

67
Figure 3-4. p-dopable and n-dopable CPs utilized in supercapacitors.
Exhibiting excellent capacitive behavior, rapid redox switching, and stable
electrochemical responses, films of PProDOT-Me2 are attractive charge-storing
materials for ECP- based supercapacitors. As such, Type I electrochemical
supercapacitors consisting of PProDOT-Me2 as the active layer displayed robust
capacitive currents within a 1.0 V window, rapid redox switching up to 500 mV/s, and a
stable electrochemical switching lifetime of over 32,000 cycles at 100 mV/s. These
results are comparable to the Type II supercapacitors based on the parent PEDOT and
PProDOT mentioned above138 and position us for further development of these ESCs.
A novel electroactive polymer, poly(Bis-EDOT-Isoindigo), was also applied to
electrochemical suercapacitors. Due to the ability of the D-A polymers to be fully
68
oxidized (p-doped) and reduced (n-doped), they may find applicability in Type III and IV
ESCs where n-dopable materials are necessary. Poly(Bis-EDOT-Isoindigo) was first
used as an electroactive material for Type I supercapacitors, and also probed for Type
III capabilities. PBEDOT-iI-butyl2 performed well in Type I supercapacitors with 0.49
Wh/kg energy, while retaining about 90% of electroactivity over 10,000 cycles. As high
as 1.8 V was achieved in Type III supercapacitors, although the undesirable
electrochemical instability limits ultimate use.
Additionally, we describe the extension of voltage and capacitive currents by
coupling multiple supercapacitors in tandem. To date, there has been little reported
effort in developing electroactive polymer-based supercapacitor modules and, to the
best of our knowledge, no previous report of compact laminated devices.147 In this
chapter, a stable 4.0 V tandem device was assembled with four Type I supercapacitors
in series. Additionally, a four-fold increase in capacitive currents was obtained with
parallel constructs. The potential of a tandem supercapacitor is realized by combining
both serial and parallel assemblies to achieve high cell voltage and capacity
simultaneously. These studies demonstrate the ability to couple supercapacitors, which,
with the use of bipolar electrodes, are ultimately encapsulated as a single
supercapacitor module.
Electrochemical Polymerization and Characterization of CP Electrodes
Poly(ProDOT-Me2)
The electrochemical polymerization of PProDOT-Me2 by repeated
potentiodynamic scans on gold/Kapton substrates is shown in Figure 3-5a. The
gold/Kapton electrodes provide high conductivity and excellent mechanical flexibility
suitable for electrochemical supercapacitors.

69
Figure 3-5. Electrochemistry of PProDOT-Me2. a) Electrodeposition of PProDOT-Me2 on Au/Kapton substrates via 5 repetitive potentiodynanmic cycles from -1.0 to +1.31 V vs. Ag/Ag+ at 50 mV/s using 10 mM ProDOT-Me2 in 0.1 M LiBTI/ACN supporting electrolyte b) PProDOT-Me2 redox switching in 0.1 M LiBTI/ACN supporting electrolyte at 50 mV/s from -0.7 V to 0.8 V vs Ag/Ag+ for 20 cycles. c) Electrochemical redox switching of PProDOT-Me2 as a function of increasing scan rates from 10 to 1000 mV/s. d) Anodic and cathodic peak current as a function of scan rate showing linear dependence. Adapted with permission from Liu, D. Y.; Reynolds, J. R. ACS Appl. Mater. Interfaces 2010, 2, 3586. Copyright 2010 American Chemical Society.
The initial anodic sweep displayed a monomer oxidation peak potential (Ep,m) of
1.21 V vs. Ag/Ag+. Subsequent scans exhibit increases in current density between -0.5V
to 1.0V vs. Ag/Ag+, which is indicative of CP electrodepostion on the working electrode.
The resulting polymer was then electrochemically cycled in monomer-free supporting
electrolyte, demonstrating a highly reproducible redox (doping/dedoping) process
centered at -0.31 V (E1/2) vs. Ag/Ag+, which is calculated from the average of the peak
anodic potential (-0.23V vs. Ag/Ag+) and the peak cathodic potential (-0.39V vs. Ag/Ag+)
as illustrated in Figure 3.5b. Redox switching of PProDOT-Me2 films demonstrated
broad capacitive current responses that are ideal for supercapacitors. Since it is

70
necessary to have the same amount of polymer on each electrode to maintain charge
balance upon charging and discharging in supercapacitor devices, the amount of
electrodeposited polymer on the electrode was controlled by the number of
potentiodynamic cycles during electropolymerization.
The polymer electrochemistry was monitored as a function of increasing scan
rates (10 to 1000 mV/s) as shown in Figure 3-5c. The peak currents were also probed
as a function of scan rate, as illustrated in Figure 3-5d. The linear dependence indicated
that the redox process is electrode-confined and well-behaved to relatively rapid
switching rates.
Poly(BEDOT-Isoindigo-butyl2)
BEDOT-iI-butyl2 was electrochemically polymerized via potentiodynamic cycling,
as illustrated in Figure 3-6a. BEDOT-iI-butyl2 monomer presented an anodic peak at
0.68 V vs. Ag/Ag+, relatively close to that reported for BiEDOT against the same
reference (Ep,a = 0.56V).148 Electropolymerization by potentiodynamic cycles is an
effective method, as evidenced by the evolution of current upon sweeps between 0.2 to
0.6V vs. Ag/Ag+ after 10 repeated scans. Subsequent redox switching between 0.0 and
0.6 V in 0.1M LiBTI/ACN illustrates that PEDOT-iI-butyl2 films maintain a reproducible
current response after the first ten cycles. In another set of experiments, similar current
responses were observed when redox switched in 0.1 M LiBTI / PC supporting
electrolyte; however, redox switching in benzonitrile resulted in over 50% loss of
electroactivity after 10 cycles. Nevertheless, the capacitive nature of PEDOT-iI-butyl2
films, in spite of a small voltage window (< 1.0), enabled well-behaved and reversible
CV responses in propylene carbonate solutions that are comparable in shape to those
of PEDOT148 and PProDOT.149

71
Figure 3-6. Electrochemistry of PBEDOT-iI-butyl2. a) Electrodeposition of PBEDOT-iI-butyl2 on Au/button electrode via 10 repetitive potentiodynanmic cycles from -0.4 to +0.95 V vs. Ag/Ag+ at 50 mV/s using 2 mM PBEDOT-iI-butyl2 in 0.1 M LiBTI/BZN supporting electrolyte b) PBEDOT-iI-butyl2 redox switching in 0.1 M LiBTI/ACN supporting electrolyte at 50 mV/s from 0.1V to 0.6 V vs Ag/Ag+ for 20 cycles c) Electrochemical redox switching of PBEDOT-iI-butyl2 as a function of increasing scan rates, from 10 to 3000 mV/s d) Anodic and cathodic peak current as a function of scan rate showing linear dependence.
The films were cycled using scan rate ranging from 10-3000 mV/s, as illustrated in
Figure 3-6c, and demonstrated that the film retains capacitive behavior even at large
scan rates. The rise of an anodic peak centered at 0.52 V and a corresponding cathodic
peak at 0.49 V vs. Ag/Ag+, along with slightly resistive behavior with increasing scan
rates, suggests the redox behavior is not ideal – yet the capacitive behavior is still
pronounced at fast scan rates. The linear dependence of peak currents as a function of
scan rates shown in Figure 3-6d indicates that the polymer is well-behaved up to
relatively rapid switching rates and is well-adhered to the electrode.

72
Because the bulk of the CP participates in the redox process, the capacitance
response can be improved by increasing the amount of electrodeposited material. To do
so, two approaches were considered: (1) increasing the monomer concentration, and
(2) increasing the number of potentiodynamic scans during electropolymerization. The
influence of increased monomer concentration is illustrated in Figure 3-7, in which
BEDOT-iI-butyl2 was electropolymerized from (a) 1.0 mM BEDOT-iI-butyl2 and (b) 2.0
mM BEDOT-iI-butyl2 in 0.5 M LiBTI/BZN supporting electrolyte solutions.
Figure 3-7. Electrochemical polymerization of PEDOT-iI-butyl2 from a) 1.0 mM BEDOT-iI-butyl2 and b) 2.0 mM BEDOT-iI-butyl2 in 0.5 M LiBTI/BZN supporting electrolyte. Redox switching of subsequent PEDOT-iI-butyl2 films in 1.0M LiBTI/PC for c) film deposited from 1.0 mM monomer solution and d) 2.0 mM monomer solution. (courtesy of Dr. Leandro Estrada)
After 10 repeated cycles in identical electrochemical conditions (excluding the
monomer concentration), it is evident from the difference in current responses, as
highlighted by the dotted lines, that increasing the concentration increases the current
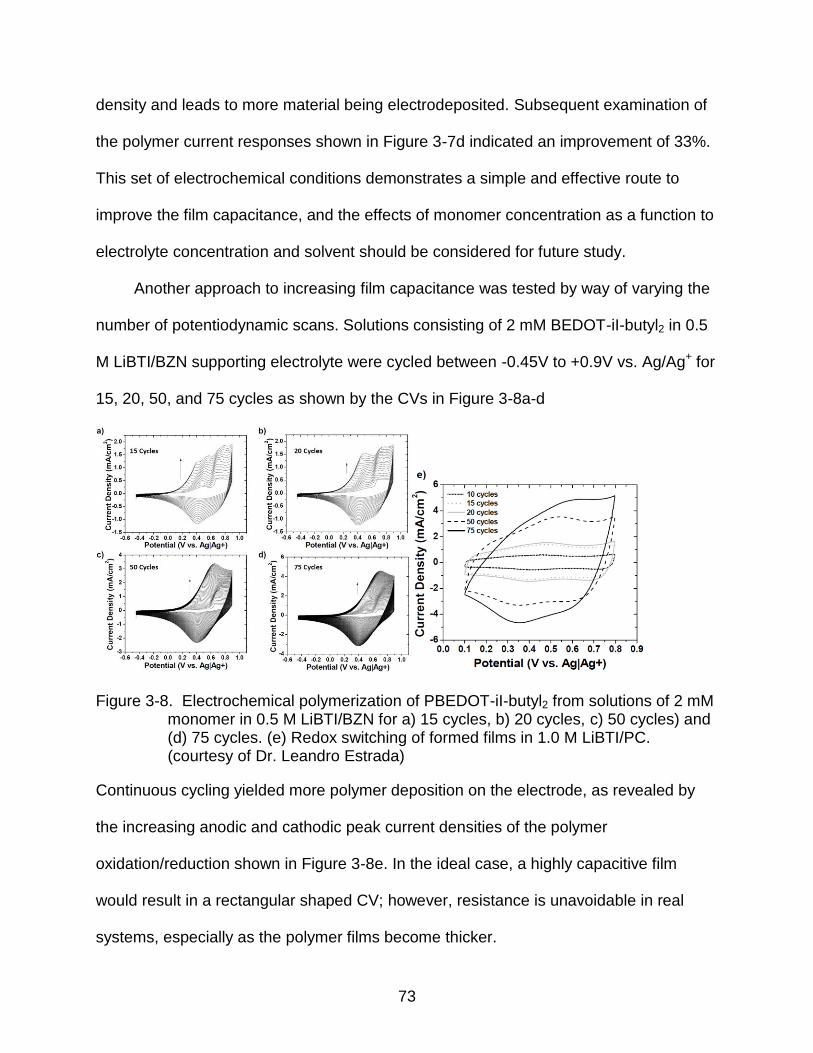
73
density and leads to more material being electrodeposited. Subsequent examination of
the polymer current responses shown in Figure 3-7d indicated an improvement of 33%.
This set of electrochemical conditions demonstrates a simple and effective route to
improve the film capacitance, and the effects of monomer concentration as a function to
electrolyte concentration and solvent should be considered for future study.
Another approach to increasing film capacitance was tested by way of varying the
number of potentiodynamic scans. Solutions consisting of 2 mM BEDOT-iI-butyl2 in 0.5
M LiBTI/BZN supporting electrolyte were cycled between -0.45V to +0.9V vs. Ag/Ag+ for
15, 20, 50, and 75 cycles as shown by the CVs in Figure 3-8a-d
Figure 3-8. Electrochemical polymerization of PBEDOT-iI-butyl2 from solutions of 2 mM monomer in 0.5 M LiBTI/BZN for a) 15 cycles, b) 20 cycles, c) 50 cycles) and (d) 75 cycles. (e) Redox switching of formed films in 1.0 M LiBTI/PC. (courtesy of Dr. Leandro Estrada)
Continuous cycling yielded more polymer deposition on the electrode, as revealed by
the increasing anodic and cathodic peak current densities of the polymer
oxidation/reduction shown in Figure 3-8e. In the ideal case, a highly capacitive film
would result in a rectangular shaped CV; however, resistance is unavoidable in real
systems, especially as the polymer films become thicker.

74
Oxidative and reductive electrochemistry of PEDOT-iI-butyl2 is elucidated by cyclic
voltammetry (CV) and differential pulse voltammetry (DPV) in Figure 3-9. The polymer
exhibits an oxidation peak near 0.4 V vs. Ag/Ag+ and a reduction peak around -1.3 V vs.
Ag/Ag+. The difference between the oxidation and reduction peaks can be used to
predict the attainable voltage window in Type III ESCs. In this case, we expect an
operative voltage window of 1.5 to 2.0 V, since the potential difference between the
oxidation and reduction peaks is ca. 1.7 V.
Figure 3-9. p-doping and n-doping responses of PBEDOT-iI-butyl2 carried out by a) cyclic voltammetry and b) differential pulse voltammetry.
The oxidative and reductive switching of PEDOT-iI-butyl2 can also provide insight
into the device cycle-life. By probing the p-doping and n-doping current responses
independently over 40 CV cycles as shown in Figure 3-10, it can be seen that the
electrochemical stability of these processes differ. After initial oxidative break-in cycles,
the films retained over 90% of their electroactivity. Unfortunately, reductive switching
was met with electrochemical instability, as a majority of the electroactivity was lost after
40 cycles. Proper choice of electrolyte and solvent may improve reductive
electrochemistry, as demonstrated by Stalder in the reductive electrochemistry of n-type
conjugated polyisoindigo.150

75
Figure 3-10. Oxidative and reductive switching of PBEDOT-iI-butyl2 over 40 cycles between -0.4V to 0.9V vs. Ag/Ag+ for p-doping and -0.4V to -1.3V vs. Ag/Ag+ for n-doping in a glove box.
Electrochemical Supercapacitors
PProDOT-Me2-based Type I ESCs
The charging/discharging CV of a Type I PProDOT-Me2 based supercapacitor as
a two-electrode cell is highlighted in Figure 3-11a. The supercapacitor demonstrates a
nearly ideal and highly capacitive response as gleaned from the rectangular-shaped
CV. As seen from theory, in the case of a pure capacitive process, a rapid increase and
plateau of current density upon charging followed by its mirror-image upon discharging
are distinctive signs of capacitive behavior in these electrochemical capacitor
processes. The device maintains stable current (0.3 mA/cm2) throughout the 1.0 V
operating window. The charging/discharging cyclic voltammogram monitored at 50 mV/s
shows minimal current density loss after 50 redox cycles, as the device was broken in. It
is important to note that the sharp increase and decrease in current density at 0.0 V and
1.0 V respectively demonstrate the ability of the supercapcitor to charge and discharge
rapidly.

76
Figure 3-11. Type I PProDOT-Me2 Supercapacitor. a) Two-electrode device with symmetric PProDOT-Me2 electrodes. Type I ESC charging and discharging at 50 mV/s between 0.0 and 1.0 V. b) Device current density and capacitance for a separate device at 0.5 V, with 85% capacity retained over 32,000 charge/discharge cycles at 100 mV/s. The inset displays selected CV to represent 32,000 cycles c) Device charging and discharging at as a function of scan rate from 5 to 500 mV/s. d) Current and capacitance as a function of scan rate for symmetric PProDOT-Me2 Type I supercapacitor. Adapted with permission from Liu, D. Y.; Reynolds, J. R. ACS Appl. Mater. Interfaces 2010, 2, 3586. Copyright 2010 American Chemical Society.
The lifetime of the supercapacitor was monitored by means of repeated cyclic
voltammetric charging and discharging cycles (Figure 3-11b). After more than 32,000
redox cycles at 100 mV/s cycling rate, the supercapacitor retained 85% of its charge
storing capacity. This demonstrates its ability to perform with a high degree of stability.
The inset in Figure 3-11b shows selected CVs to represent the 32,000 cycles. Despite a
steady decline in current density over tens of thousands of cycles, the overall capacitive

77
behavior of PProDOT-Me2 supercapacitor is remarkable throughout the switching
duration.
The ability of PProDOT-Me2-based ESCs to charge and discharge at high scan
rates is illustrated in Figure 3-11c. Scan rate dependence studies between 5 to 500
mV/s over a 1.0 V window demonstrate the ability of the supercapacitor to charge and
discharge effectively at low and high scan rates. Even at fast scan rates, the device is
capable of maintaining the near ideal rectangular CV shape as excellent capacitive
behavior is observed throughout the voltage window at all scan rates, with rapid
charging and discharging responses. In Figure 3-11d, a linear relationship is seen
between the average current density (monitored at 0.5 V) and the scan rate. This trend
indicates that the polymeric materials in the device are not only highly electroactive, but
the electrolyte in the device effectively compensates both the neutral and oxidized
polymer electrodes, especially throughout the entire matrix of the film. More importantly,
the supercapacitor areal capacitance is nearly consistent throughout the scan rate
regime. This observation is consistent with ideal electrochemical supercapacitors, as
the capacitance should be independent of charging/discharging rates.
Poly(BEDOT-Isoindigo)-based Type I ESCs
The charge/discharge CV for a PBEDOT-iI-butyl2-based Type I supercapacitor is
shown in Figure 3-12a. The CV response demonstrates a nearly ideal behavior
operating at a rate of 50 mV/s for 10 cycles. The sharp increase/decrease in current
density at the edges of the voltage window highlights the inherent ability of the device to
rapidly charge/discharge. The operative voltage window is from 0 to 0.5 V, which is
within range of that previously reported for PEDOT/PEDOT (0.8 V, Type I),121 and
PEDOT/PProDOT (0.5 V, Type II)138 ESCs.

78
Figure 3-12. Type I PBEDOT-iI-butyl2 Supercapacitor. a) CV switching of Type I ESC based on PBEDOT-iI-butyl2 at 50 mV/s between 0.0 and 0.5 V. b) Long-term CV switching at 200 mV/s between 0.0 to 0.5V for 30,000 cycles. c) ESC charging and discharging as a function of scan rate from 10 to 500 mV/s. d) Current and capacitance as a function of scan rate for symmetric PBEDOT-iI-butyl2 Type I ESC monitored at V = 0.25V.
The lifetime of the supercapacitor is monitored using repeated charge/discharge
CV as illustrated in Figure 3-13b. After 30,000 cycles at 200 mV/s, the device lost 40%
of its electroactivity. Interestingly, there is an asymmetric redox process which takes
place upon repeated cycles. The discharge process is more susceptible to
electrochemical instability as evident by the rapid current lost. Furthermore, the
asymmetric current response was accentuated in the scan rate dependence
experiments shown in Figure 3-12c. A possible explanation for this observation is the
ohmic polarization that causes a deviation from the ideal rectangular capacitive
behavior. The ohmic barrier was previously observed and explained for Type I ESC
based on PANi electrodes151 and PEDOT electrodes.152 It is due to a drop in

79
conductivity at the cathode caused by its nearly undoped state, and is a limitation for
Type I supercapacitors because it limits the power that can be obtained from the device
when releasing its energy. Nevertheless, by plotting the anodic peak current and the
normalized capacitance (at V = 0.25 V) as a function of scan rate illustrated in Figure 3-
12d, it is clear that the normalized capacitance gradually decreases with increasing
scan rates. Since these results reflect the current and capacitive response at V=0.25 V,
the scan rate dependence may become more non-ideal if the currents are monitored at
V = 0 or 0.5 V.
Poly(BEDOT-Isoindigo)-based Type III ESC
The voltage range for a PBEDOT-iI-butyl2-based Type I supercapacitor was found
to be optimized at 0.5 V as shown in Figure 3-13; although, it is possible to operate at a
maximum voltage of ca. 0.8 V without losing much of the capacitive profile for a Type I
ESC. As such, a desire to increase the voltage window has prompted the use of
PEDOT-iI-butyl2-electrodes in Type III ESCs.
Figure 3-13. Operative voltage range of PBEDOT-iI-butyl2-based Type I supercapacitor between 0.5 to 0.8V.
As illustrated by the reductive electrochemistry of PEDOT-iI-butyl2 in Figures 3-9
and 3-10, the nature of the n- doping process is highly faradic with strong redox

80
responses centered at −1.18V and −1.27V vs. Ag/Ag+. This results in an extended
voltage window for potential Type III supercapacitors, but with possible electrochemical
instability at extreme voltage ranges. While n- doping redox switching of PEDOT-iI-
butyl2 films demonstrates electrochemical instability, incorporation of the isoindigo
acceptor into Type III supercapacitors is certainly worthwhile. The reasons for this are
two-fold: potential enhancement of the operating voltage window of the supercapacitors,
and access to a fundamental understanding of the structure-property relationships of
isoindigo as part of D-A-D electroactive polymers.
Prior to Type-III ESC assembly, PEDOT-iI-butyl2 films were primed to their neutral
state at −0.35 V vs. Ag/Ag+ for 30 seconds. The neutral state of −0.35 V was
determined from the midpoint potential between the oxidation and reduction peaks.
Once encapsulated, the supercapacitor is set to its discharged state. To ensure that the
supercapacitors were indeed in their fully discharged state, the devices were
potentiostatically held at 0.0 V for 2 minutes prior to device testing. The operating
voltage range of a Type III ESC was determined by incrementally increasing the voltage
from 0.0V to 3.25 V as illustrated in Figure 3-14.
Figure 3-14. Voltage limits of Type III PEDOT-iI-butyl2-based ESC cycling at 50 mVs.

81
The cyclic voltammogram indicates that the bulk of the faradaic and non-faradaic
charging capacity is between 1.0 to 2.75 V, corresponding well with earlier predictions
based on p-doping and n-doping film electrochemistry.
This voltage window is comparable to other Type III ESCs reported in literature,
such as poly(diheteroaryl-cyanovinylene),141,142 and poly(cyclopentadithiopheneone)123
operating at a 2 V window, and poly(3-methylthiophene)126 and poly(3-
(phenylthiophene)) derivatives at 2.5-3 V.140 It is important to note both the capacitive
and faradic current responses of Type III ESCs in Figure 3-15a.
Figure 3-15. Type III PBEDOT-iI-butyl2 Supercapacitor. a) CV of PEDOT-iI-butyl2-based Type III ESC switching from 0.5 to 3.0 V at 50 mV/s. b) Type III device switching with 2.5 V window at 200 mV/s for 400 cycles c) Device charging and discharging at as a function of scan rate from 10 to 1000 mV/s. d) Peak current density as a function of scan rate at 1.5V and 2.25V for PBEDOT-iI-butyl2 Type III supercapacitor.

82
That is, the current density is broad across the operating voltage range with strong
faradic currents centered at 1.68 V and 2.24 V for anodic peaks, and 1.68 V and 2.20 V
for cathodic peaks.
Long-term redox switching of a Type III ESC is illustrated in Figure 3-15b. The
instability of PEDOT-iI-butyl2 films on gold button under repeated switching, as shown in
Figure 3-10, indeed translates to Type-III ESCs as close to 50% of the electroactivity
was lost after the first 100 cycles, and the electroactive response is nearly depleted
after 400 scans. While further adjustments are needed in order to improve the stability
of PBEDOT-iI-butyl2 to n-doping, this material may hold promise in modular ESCs, as
discussed in the next section.153
Scan rate dependence studies between 10 to 1000 mV/s over a 2.5 V operating
window is shown in Figure 3-15c. Non-ideal behavior is observed as the redox peaks
begin to shift at high scan rates. This observation is accentuated in the scan rate versus
the current density plot illustrated in Figure 3-15d. It can be seen that the higher redox
process (V = 2.25) causes a non-ideal behavior as the peak current and scan rate are
not perfectly linear.
Supercapacitor Modules
It is well-known that efforts to increase energy density in CP-based
supercapacitors demand both high and stable operating voltages. In this context, n-
dopable polymers capable of spanning the voltage were introduced in previous sections
and have been developed by the community.119,154 While Type III and IV
supercapacitors are able to operate in the 2.0-3.0 voltage range, electrochemical
instability is often an issue.94 As a result, there is a trade-off between high energy
density and stability at lower voltages. To improve the voltage window without

83
employing n-dopable polymers, we have developed a strategy in which solely p-dopable
polymers are utilized and incorporated into tandem supercapacitors. The assembly of
multiple supercapacitors has a cumulative effect in which a widening of device voltage
is expected when coupled in series, and an increase in capacitive currents when
coupled in parallel.
As shown via cyclic voltammetry experiments presented in Figure 3-16, a single
PProDOT-Me2-based ESC (i), serving as the model device, shows robust capacitive
properties up to 1.0 V while passing 0.3 mA/cm2 of current. With approximately 60 μg of
PProDOT-Me2 and residual electrolyte per electrode, as determined post-
electrochemical switching, the specific capacitance relative to total polymer mass is 55
F/g with an average energy density of 6 Wh/kg.
Figure 3-16. Supercapacitor charging/discharging CV at 50 mV/s for single symmetric PProDOT-Me2 supercapacitor, two tandem serial supercapacitors, and two tandem parallel supercapacitors. Polymer electrodes prepared via five potentiodynamic electropolymerization cycles. Adapted with permission from Liu, D. Y.; Reynolds, J. R. ACS Appl. Mater. Interfaces 2010, 2, 3586. Copyright 2010 American Chemical Society.

84
As two supercapacitors were coupled in series (ii), the CV exhibits capacitive
behavior and reversibility throughout the 2.0 V window with 0.18 mA/cm2 of current, or
15 F/g relative to the total polymer mass. The ability to maintain a steady current during
the charging/discharging process highlights the capacitive properties of the PProDOT-
Me2 along with the ability to successfully couple supercapacitors. While the tandem
serial supercapacitor improved the voltage window, it is important to note the concurrent
diminution of current with additional devices. As two supercapacitors are coupled in
series, the current decreased due to added resistance. To address this issue, tandem
supercapacitors are assembled in parallel to increase the current. Relative to a single
supercapacitor (i), the charging/discharging CV of tandem parallel supercapacitors, as
illustrated in (iii), exhibits a two-fold increase in current while maintaining steady
capacitive behavior and reversibility throughout the 1.0 V experiment.
Galvanic charging/discharging steps were used on these supercapacitors to
further characterize the behavior of PProDOT-Me2 for charge storing applications and
the ability to couple supercapacitor devices effectively. By applying a constant current of
0.5 mA/cm2 to the tandem supercapacitors as a function of time shown in Figure 3-17,
the galvanic charging-discharging curves highlight the relative charging/discharging
times and the operating voltage window. The single supercapacitor used as the model
in (Figure 3-17-i) requires 12 s to charge/discharge to 1.0 V. The charging-discharging
curves for the tandem serial supercapacitor (Figure 3-17-ii) exhibit a 2.0 V window,
which is in good agreement with the cyclic voltammogram. In contrast, the tandem
parallel supercapacitor (Figure 3-17-iii) requires 24 s for charging/ discharging to 1.0 V.

85
Figure 3-17. Supercapacitor galvanic charging/discharging at 0.5 mA/cm2 for single symmetric PProDOT-Me2 supercapacitor, two tandem serial supercapacitors, and two tandem parallel supercapacitors. Adapted with permission from Liu, D. Y.; Reynolds, J. R. ACS Appl. Mater. Interfaces 2010, 2, 3586. Copyright 2010 American Chemical Society.
Here, the times are approximately doubled from that of the single supercapacitor since
the applied current passing through the tandem device is shared between two individual
devices. While longer charging/discharging times are expected for the tandem
supercapacitor in parallel, it allows for opportunities in ride-through power applications
where extended charging/discharging times are needed.
The repetitive near-triangular curves emphasize that the PProDOT-Me2 ESCs are
reversibly cycling, though the voltage drop suggests internal resistance as shown in
Figure 3-17. A close examination of the galvanic charging/discharging curves indicates
an ohmic drop, while the cyclic voltammogram (Figure 3-16) shows an asymmetry in the
current response. These observations have been well-addressed by langer who
attributed these behaviors to a drop of conductivity in the negative electrode as a result
of its nearly undoped state.151 In the case of the Type I supercapacitors discussed here,

86
and perhaps more noticeable in the tandem supercapacitors, our observations are in
agreement and consistent with those reported in literature.151,152 While this is a limitation
in electroactive polymer-based supercapacitors, these issues can be circumvented both
by lowering the single-cell voltage,151 and by the addition of proper interfacial contacts
within the cell.155
For the purpose of comparing the effects of multiple tandem supercapacitors, four
identical Type I supercapacitors were assembled in series. As illustrated by the cyclic
voltammetry profiles in Figure 3-18a, the tandem serial supercapacitor assembly has an
overall cell voltage of 4.0 V.
Figure 3-18. Supercapacitor Assembly. a) Four symmetric PProDOT-Me2 supercapacitors in series to enhance voltage window from 1.0 to 4.0 V. b) Four symmetric PProDOT- Me2 supercapacitors in parallel to increase current by four-fold. Adapted with permission from Liu, D. Y.; Reynolds, J. R. ACS Appl. Mater. Interfaces 2010, 2, 3586. Copyright 2010 American Chemical Society.
The charging/discharging CVs exhibit high capacitive behavior and reversibility
throughout the extended voltage regime. Similarly, the ability of tandem parallel
supercapacitors to effectively charge/discharge is demonstrated by the cyclic
voltammetry profiles in Figure 3-18b. The tandem parallel supercapacitor assembly has
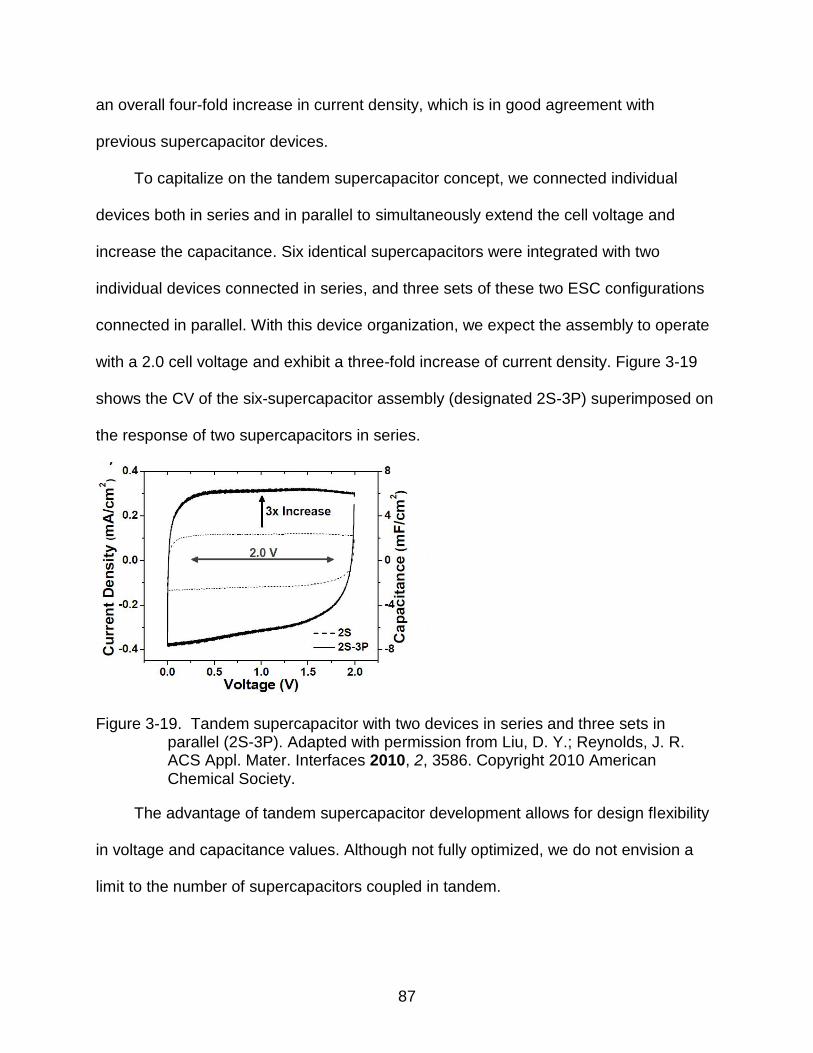
87
an overall four-fold increase in current density, which is in good agreement with
previous supercapacitor devices.
To capitalize on the tandem supercapacitor concept, we connected individual
devices both in series and in parallel to simultaneously extend the cell voltage and
increase the capacitance. Six identical supercapacitors were integrated with two
individual devices connected in series, and three sets of these two ESC configurations
connected in parallel. With this device organization, we expect the assembly to operate
with a 2.0 cell voltage and exhibit a three-fold increase of current density. Figure 3-19
shows the CV of the six-supercapacitor assembly (designated 2S-3P) superimposed on
the response of two supercapacitors in series.
Figure 3-19. Tandem supercapacitor with two devices in series and three sets in parallel (2S-3P). Adapted with permission from Liu, D. Y.; Reynolds, J. R. ACS Appl. Mater. Interfaces 2010, 2, 3586. Copyright 2010 American Chemical Society.
The advantage of tandem supercapacitor development allows for design flexibility
in voltage and capacitance values. Although not fully optimized, we do not envision a
limit to the number of supercapacitors coupled in tandem.

88
In our efforts to develop tandem supercapacitors as an individual module that is
stackable and lightweight, bipolar electrodes were utilized as the central component.
Weight considerations can benefit from the module architecture as inactive materials,
such as inner membranes and packaging materials, are minimized, and active materials
are maximized.
The performance of the supercapacitor module is illustrated via the cyclic
voltammograms in Figure 3-20.
Figure 3-20. Supercapacitor CV for single supercapacitor and supercapacitor module at 50 mV/s. Polymer electrodes prepared via three potentiodynamic electropolymerization cycles. Adapted with permission from Liu, D. Y.; Reynolds, J. R. ACS Appl. Mater. Interfaces 2010, 2, 3586. Copyright 2010 American Chemical Society.
In these experiments, the extent of electrochemical polymerization for PProDOT-Me2
was maintained to three potentiodynamic scans. As such, the CV of the single
supercapacitor device (Figure 3-20i) displays an average current of 0.2 mA/cm2 to 1.0
V. In comparison to the supercapacitor module (Figure 3-20ii), the voltage window was
successfully extended to 2.0 V and the module exhibits 0.1 mA/cm2 of capacitive
current. The development of supercapacitor modules enables us to stack multiple

89
supercapacitors as a single component, although this precludes analyses of individual
devices for the possibility of defects.
Chapter Summary
In this chapter, an electron-rich derivative of dioxythiophene, PProDOT-Me2, was
electrochemically polymerized over gold/Kapton substrates to investigate its capacitive
properties for charge storage applications in supercapacitors. Redox switching of the
PProDOT-Me2 films indicates stable electrochemical response while scan rate
dependence studies from up to 1000 mV/s suggest the electroactive polymer to be
electrode-confined and well-behaved. PProDOT-Me2 was also used to construct
polymeric electrodes on gold/Kapton substrates in Type I electrochemical
supercapacitors. The supercapacitor devices display robust capacitive behavior over a
1.0 V operating window with scan rates between 5 and 500 mV/s. The specific
capacitance of 55 F/g was calculated based on the active material with average energy
density of 6 Wh/kg. Also, the device retains over 85% of its charging/discharging
capacity over 32,000 redox cycles.
A novel acceptor, isoindigo, was employed as an electropolymerizable D-A-D
monomer with EDOT units flanking the acceptor core for Type I and Type III
electrochemical supercapacitors. A PEDOT-iI-butyl2-based Type I ECS demonstrated
an operative voltage window of 0.5 V with 0.49 Wh/kg energy (based on approximately
0.4 mg of polymer), while retaining about 90% of electroactivity over 10,000 cycles. A
voltage window of 1.8 V was achieved in Type III supercapacitors, although the
undesirable electrochemical instability limits ultimate use.
As a strategy to improve the voltage window and capacitance of electrochemical
supercapacitors, tandem supercapacitors coupled both in series and in parallel, and

90
ultimately as a single encapsulated module, were successfully devised and tested.
Using ProDOT-Me2-based Type I supercapacitors, an assembly of four tandem
supercapacitors in series and in parallel resulted in an extension of the voltage window
to 4.0 V and capacitance to 25 mF/cm2. The flexibility of supercapacitor design allows
for voltage improvements, capacitance improvements, or both via serial and parallel
constructs to meet power and energy requirements. Furthermore, development of
tandem supercapacitors encapsulated within a single stackable energy storage device
was successfully fabricated with PProDOT-Me2 on gold/Kapton bipolar electrodes,
extending the supercapacitor voltage to 2.0 V.

91
CHAPTER 4 DEVELOPING ABSORPTIVE/TRANSMISSIVE BLACK WINDOW-TYPE
ELECTROCHROMIC DEVICES
Introduction
Organic electrochromic polymers (ECPs) have been developed over the past
decades to the point of near commercial feasibility. While strong research efforts have
also been focused on inorganic metal oxide electrochromic materials, organic
electrochromic polymers have several advantages.103,104,156 Organic ECPs are available
in a variety of colors that switch to highly transmissive states.157 The ability to access
the range of organic ECPs has been accomplished by tuning the electron-rich nature
and the extent of conjugation of CPs.105,158 The recent yellow-to-transmissive ECP
based on alternating propylenedioxythiophene – phenylene copolymer completed the
full color palette of solution-processable organic electrochromes, facilitating the pursuit
of a full color electrochromic display.107,108
Black-to-transmissive ECPs are one of the most promising electrochromes, giving
rise to possible utility for ECPs in electronic papers, electrochromic smart windows,
privacy goggles, and camouflages. In particular, privacy applications are finding great
interest among government-related programs for military and camouflages purposes.
For these applications, rapidly switching black-to-transmissive electrochromic materials
are necessary, ideally on the order of video rate (30 – 50 ms) with large optical contrast
and high transmittance and luminance (> 80% T and 80% Y) in the bleached state.
Our efforts to address these requirements take a multidisciplinary approach.
Foremost, black-to-transmissive electrochromic polymers that are both highly
electroactive and electrochemically stable are required. Solubility and ease of
processing over large transparent electrodes is also desirable. Finally, incorporation of

92
ECPs into window-type devices requires the use of a dual-electrochromic polymer
device configuration that is neutrally colored and highly transmissive to visible light in
the bleached state.
The first black-to-transmissive electrochromic device was demonstrated by Unur
using a pseudo 3-electrode electrochromic device (P3-ECD).159 The P3-ECD, which
operates under the control of a bipotentiostat, consists of a transparent electroactive
polymer (PProDOP-N-EtCN) as the counter electrode material, and two active
electrochromic materials, specifically cathodically coloring green-to-transmissive ECPs
and magenta-to-transmissive ECPs as the working electrodes. By color mixing of green
and magenta ECPs in the neutral state, a black color was exhibited. Conversely, the
oxidation of both working electrodes caused the device to bleach. While the pseudo 3-
electrode electrochromic device exhibited a black-to-transmissive device via the color
mixing of two polymers, it would be advantageous to only use one electrochromic
polymer.
The first solution processable black-to-transmissive electrochromic polymer was
developed by Beaujuge from the Reynolds group.160 Using a donor-acceptor approach,
easily oxidized ECPs with broad absorption bandwidths extending over the entire visible
spectrum that can be fully bleached were synthesized. A series of donor-acceptor
oligomers differing in the ratio of the electron-rich (3,4-bis(2-ethylhexyloxy)thiophene) to
electron-deficient (2,1,3-benzothiadiazole) substituents were first synthesized, followed
by the polymerizations of the oligomers. The variation of the relative contribution of
electron-rich and electron-deficient moieties controlled the two-band absorption in the
visible spectrum. In the optimized feed ratio of two different monomers, the discrete

93
absorption bands merged into a broad absorption across the entire visible spectrum,
however, reproducible large-scale production was difficult. This was realized in
collaborations with BASF in which the polymer was synthesized and provided to the
Reynolds group in bulk for further electrochemistry and electrochromic studies. Samples
provided by ASF will be referred to “ ASF- lack” in this dissertation. The structure of
BASF-Black is shown in Figures 4-1a.
Figure 4-1. Structures of ECP-Black Polymers. a) BASF-Black and b) Random-Black.
More recently, Shi demonstrated a novel and reproducible synthetic approach to
access black-to-transmissive electrochromic polymers via a random Stille coupling
polymerization.161 The random polymerization of electron-rich (2,5-dibromo- and 2,5-
tributylstannyl-2-ethylhexyloxy-substituted 3,4-propylenedioxythiophene) and electron-
deficient (4,7-dibromo-2,1,3-benzothiadiazole) moieties in different feed ratios lead to
black ECPs that demonstrated high molecular weights (Mn between 10 to 15 kDa) and
low polydispersities (1.3 to 1.6). The structure of this polymer is shown in Figure 4-1b,
and will be referred to as “Random-Black” in this dissertation. A comparative

94
electrochromic and colorimetric analysis of these two ECP-Black polymers are detailed
in the following section in the optimization of black-to-transmissive window-type ECDs.
In addition, ECPs that are electroactive and transparent in both redox states are
needed as counter electrodes in window ECDs. Nishide previously introduced an
organic nitroxide radical polymer, poly(2,2,6,6-tetramethylpiperidinyloxy-4-yl
methacrylate) (PTMA), that is highly transparent and colorless in the visible region, and
exhibits rapid electron transport.162 This non-color changing polymer (NCCP) has
previously found potential uses in ECDs.163,164 Furthermore, the Reynolds group, in
collaboration with BASF, recently introduced N-C18 substituted poly(3,4-
propylenedioxypyrrole) (PProDOP-N-C18) as the minimally-color changing polymer
(MCCP) suitable for counter-electrode materials in ECDs. Detailed analyses of MCCP,
including electrochemical, electrochromic, and colorimetric properties, are presented in
this chapter.
The architecture of window ECDs utilizes a dual-electrochromic polymer device
configuration as shown in Figure 4-2, in which ECP-Black, functioning as the working
electrode, is charge-balanced by the counter material. Two ITO-glass substrates are
coated with the spray-processable ECPs, and a transparent conducting gel electrolyte is
applied between two electrodes. When the device is in the dark neutral state, ECP-
Black is neutral while counter material is oxidized. The application of a voltage across
the device causes ECP-Black to oxidize and the counter material to neutralize. The
concurrent and reversible process of these electrochromic films gives rise to the
switching of ECDs between the dark and bleached states.

95
Figure 4-2. Schematic design of absorptive/transmissive window-type electrochromic device in the a) neutral and b) bleached states.
Black-to-Transmissive Electrochromes
Thin films of BASF-Black and Random-Black were spray-cast onto ITO coated
glass slates from 2 mg / mL toluene solution and electrochemically cycled from -0.3 to
+0.8 V vs. Ag/Ag+ in 0.1 M LiBTI/ACN. Redox switching by potentiodynamic cycling is
illustrated in Figure 4-3, demonstrating a highly reproducible and electrochemically
stable current response upon 50 repeated scans. The relatively low onset of oxidation,
0.19 V vs. Ag/Ag+ for BASF-Black and Random-Black, is ideal for long-term redox
switching as electrochromic films and devices.
Figure 4-3. Cyclic voltammogram of ECP-Black. a) BASF-Black and b) Random-Black at 50 mV/s in 0.1 M LiBTI/ACN for a total of 50 cycles. Only every 10th CV scan is displayed in the figure.
-0.4 -0.2 0.0 0.2 0.4 0.6 0.8-2
-1
0
1
2
3
4
Cu
rren
t D
en
sit
y (
mA
/cm
2)
Potential (V vs. Ag/Ag+)
1st
50th
a)
-0.4 -0.2 0.0 0.2 0.4 0.6 0.8-2
-1
0
1
2
3
Cu
rren
t D
en
sit
y (
mA
/cm
2)
Potential (V vs. Ag/Ag+)
1st
50th
b)

96
Figure 4-4 shows the full spectroelectrochemical behavior of both ECP-Black
polymers. Thin films of polymer were spray-cast onto indium-tin oxide (ITO) coated
glass slides and then electrochemically cycled until a stable and reproducible current
response was observed prior to analysis. As seen in the neutral spectrum of BASF-
Black in Figure 4-4a, a sharp absorption band with max at 575 nm is present, whereas,
the neutral spectrum for Random-Black shown in Figure 4-4b lacks a distinct absorption
peak and is broadly absorbing across the visible spectrum. It is important to note the
differences in these absorption bandwidths. Since a portion of visible light is not
absorbed in 390-550 and 650-750 nm ranges, thin films of BASF-Black films are
purple/inky black, unless an adequate amount of polymer is deposited onto ITO coated
substrates to obtain a dark neutral film.
The spectroelectrochemical series of BASF-Black and Random-Black were carried
out from -0.3 V to +0.0V vs. Ag/Ag+ in 100 mV increments and from 0.05 V to +0.7 V in
50 mV increments. Upon oxidation of the polymer films, the absorption in the visible
region is reduced, while polaronic transitions in the near-IR around 950 nm arise. The
intensity of the polaronic transitions depletes at higher oxidation levels, giving rise to
bipolaronic absorptions beyond 1600 nm. Effective bleaching in the visible region
occurs in both ECP-Black films and high levels of transmissivity are observed. It is
important to note the rise of dual-bands in the visible range as the neutral polymer films
oxidize to the bleached state. The dual-band creates an intermediate green color which
is present for a brief period of time during the electrochromic switch. The duration of this
dual-band is analyzed using a novel electronic spectroscopy setup described in Chapter
5.

97
Figure 4-4. Spectroelectrochemical series for ECP-Black. a) BASF-Black and b) Random-Black between -0.3 V to +0.7 V vs. Ag/Ag+ in 0.1 M LiBTI/ACN supporting electrolyte. Applied potentials between -0.3 to 0.0V are in 100 mV increments and +0.05 to +0.7 V in 50 mV increments.
To construct black window ECDs with high transmittance in the bleached state,
large optical contrast, and fast switching speeds, several device parameters were
optimized. Since these characteristics depend strongly on the thickness of ECP-Black
films, a set of four BASF-Black and four Random-Black films of differing optical density
were spray-cast onto ITO-coated glass substrates. The set of neutral and corresponding
bleached spectra for BASF-Black films (A = 0.14, 0.30, 0.70, 0.97 a.u. measured at
max= 550nm) are shown in Figure 4-5a, indicating that more optically dense films are
less capable of attaining highly transmissive states. Film 4, with the maximum
absorbance of 0.94 a.u., has a corresponding absorbance of 0.18 a.u. in the bleached
state. On the other hand, the thinnest film of 0.14 a.u. in the neutral state is associated
with an absorbance of 0.03 a.u. in the bleached state. Upon further analysis of the
spectra in Figure 4-5a, films that exhibit high contrast correspond to lower transmittance
levels in the bleached state. Because of this interplay, a balance between the optical
contrast and bleached state transmittance is needed.
400 600 800 1000 1200 1400 16000.0
0.2
0.4
0.6
0.8
1.0
1.2
1.4
Ab
so
rba
nc
e (
a.u
.)
Wavelength (nm)
a)
400 600 800 1000 1200 1400 16000.0
0.2
0.4
0.6
0.8
1.0
b)
Ab
so
rba
nc
e (
a.u
.)
Wavelength (nm)

98
Figure 4-5. Absorbance and Relative Luminance of BASF-Black. a) Absorption spectra in the neutral and bleached states and b) relative luminance from neutral to bleached states for BASF-Black films at four different thickness (A = 0.14, 0.3, 0.7, 0.94 a.u.).
To evaluate the color changes of BASF-Black films with respect to the human eye,
the L*a*b* color coordinates (CIE 1976 L*a*b* Color Space) for these polymer films of
differing optical density were measured as a function of applied potential. The relative
luminance change in Figure 4-5b, as determined by colorimetry, varied from 52% Y for
the thickest to 19% Y for the thinnest prepared film, demonstrating the ability to
modulate relative luminance based on film thickness. In their neutral state, BASF-Black
films exhibited L* from 43 for the thickest to 89 for the thinnest film. The neutral
absorption of the thickest film displayed a relatively dark purple/blue color with L* = 43,
a* = 7 and b* = -24. This observation corresponds well with the visible absorption shown
in Figure 4-5a as small amount of red and blue light is transmitted by the polymer. In
comparison to the fully oxidized polymer films, L* varied from 84 for the thickest and 97
for the thinnest film. Correspondingly, a* and b* color coordinates approach zero, which
demonstrate the capacity of films to reach a highly transmissive state. The relative
400 600 800 1000 12000.0
0.2
0.4
0.6
0.8
1.0
Ab
so
rba
nc
e (
a.u
.)
Wavelength (nm)
Film 1 (A = 0.14)
Film 2 (A = 0.3)
Film 3 (A = 0.7)
Film 4 (A = 0.94)
a)
-0.2 0.0 0.2 0.4 0.6 0.80
10
20
30
40
50
60
70
80
90
100
Film 1 (A = 0.14)
Film 2 (A = 0.3)
Film 3 (A = 0.7)
Film 4 (A = 0.94)Re
lati
ve
Lu
min
an
ce
(Y
%)
Potential ( V vs. Ag/Ag+)
b)

99
luminance values and CIE L*a*b* color coordinates for films 2 and 3 are summarized in
below in Table 4-1.
Table 4-1. Relative luminance and CIE L*a*b* Color Coordinates for BASF-Black films in the neutral (-0.2 V vs. Ag/Ag+) and oxidized (+0.7 V vs. Ag/Ag+) states.
Film Absorbance(a.u.) Luminance Color Coordinates - Neutral
Color Coordinates - Oxidized
%Yba
Y L* a* b* L* a* b*
1 0.14 94 19 89 1.5 -6.8 97 -1 -0.5 2 0.3 86 34 77 3 -10 94 -1 -1 3 0.7 73 50 55 5.7 -20 88 -3 -3 4 0.97 65 52 43 7 -24 84 -4 -3.6 a Relative luminance in the bleached state.
In order to study the switching speed of BASF-Black films which will govern their
utility in ECDs, in-situ electrochemical – optical spectroscopy measurements
(chronoabsorptometry) were carried out. The film switching rate was examined by
monitoring the transmittance change at a single wavelength as a function of time
elapsed upon the application of potential square-waves between the fully neutral and
oxidized states. Polymer films were potentially stepped between -0.2 V and +0.65 V vs.
Ag/Ag+ at periods of 60 s, 10 s, 1 s, and 0.5 s, as shown in Figure 4-6. In the case of a
BASF-Black film at A = 0.14 optical density, a transmittance change (monitored at 550
nm) of 22 T was recorded at long switching time (60 s), and decreasing the switching
period to 0.5 s reduced the contrast to only 21 T. This observation indicates that
longer switching times are not necessary to realize the full optical contrast for this thin
film. However, a longer switching period was necessary to obtain the full contrast for the
thicker films represented in Figure 4-6b. An optically dense film of A = 0.7 reached the
full transmittance contrast of 53 T over a 60 s switching period, and was
subsequently reduced to 35 T at a 1 s switch rate.

100
Figure 4-6. Potential square-wave step chronoabsorpometry for BASF-Black. a) BASF-Black film 1 (A = 0.14 a.u.) and b) BASF-Black film 3 (A = 0.7 a.u.) monitored at 550 nm between -0.2 to +0.65 V vs. Ag/Ag+ in 0.1 M LiBTI/ACN electrolyte solution, at 60 s, 10 s, 1s, and 0.5 s switching periods.
An alternative method of representation for ECP switching time is to determine the
time necessary for the full (or a specific percent of full) transmittance contrast to be
reached. A range of transmittance contrast values (95%, 50%, and 25%) were analyzed
to understand the relationship between switching time and transmittance contrast. The
thickest film of A = 0.97 a.u. required over 3 s to reach 95% of the full transmittance
0 50 100 150 200 250 300
70
75
80
85
90
95
Tra
ns
mit
tan
ce
%
Time (s)
60 sec
10 sec
1 sec
0.5 sec
BASF-Black (A=0.14)
a)
0 50 100 150 200 250 300
20
30
40
50
60
70
80
Tra
ns
mit
tan
ce
%
Time (s)
60 sec
10 sec
1 sec
0.5 sec
BASF- Black (A=0.7)
b)

101
contrast (T95%), whereas the 50% and 25% transmittance contrasts (T50% andT25%) were
achieved in approximately 1 s and 600 ms respectively. The thinnest film demonstrated
sub-second switching times, varying from 240 ms (t95%) to 50 ms (t25%). The range of
switching speeds indicates how the response times can be modulated and optimized as
a function of thickness. The full summary of transmittance contrast and switching
speeds is compiled in Table 4-2.
Table 4-2. Transmittance and switching speed for BASF-Black films
Film Absorbance (a.u.)
Transmittance Switching Speed (sec) %Tb
a T Color to Bleached Bleached to Color
t 95% t 50% t 25% t 95% t 50% t 25%
1 0.14 92 22 0.12 0.09 0.05 0.24 0.15 0.12 2 0.3 86 35 1.18 0.3 0.18 1.12 0.57 0.35 3 0.7 73 53 2.57 0.66 0.38 2.6 1.0 0.56 4 0.97 66 54 3.5 0.86 0.5 3.23 1.43 0.71
a Transmittance in the bleached state
Analogously, thin films of Random-Black were spray-cast to differing optical
densities (A = 0.12, 0.34, 0.5, 0.7 measured at max =550nm), with the spectra of neutral
and bleached films shown in Figure 4-7a.
Figure 4-7. Absorbance and Relative Luminance of Random-Black. a) Absorption spectra in the neutral and bleached states and b) relative luminance from neutral to bleached states for Random-Black films at four different thickness (A = 0.12, 0.34, 0.5, 0.7 a.u.)
400 600 800 1000 12000.0
0.1
0.2
0.3
0.4
0.5
0.6
0.7
0.8
Ab
so
rba
nc
e (
a.u
.)
Wavelength (nm)
Film 1 (A = 0.12)
Film 2 (A = 0.34)
Film 3 (A = 0.5)
Film 4 (A = 0.7)
a)
-0.4 -0.2 0.0 0.2 0.4 0.6 0.8 1.020
30
40
50
60
70
80
90
100
Re
lati
ve
Lu
min
an
ce
(Y
%)
Potential (V vs. Ag/Ag+)
Film 1( A = 0.12)
Film 2 (A = 0.34)
Film 3 (A = 0.5)
Film 4 (A = 0.7)
b)

102
This set of Random-Black films further confirms the interplay between optical contrast
and the transmittance of bleached films, and emphasizes the need to optimize film
thickness for specific electrochromic applications.
The percent relative luminance values of the four Random-Black films were
measured colorimetrically as a function of applied potential using the CIE L*a*b* color
space, and the results are summarized in Table 4-3. As discussed previously, relative
luminance is a mathematical representation of the color of visible light as calibrated to
the human eye. The greatest luminance contrast was observed in film 3 (47% Y), while
film 1 had the highest relative luminance in the bleached state (94% Y). The analysis of
Table 4-3 indicates the ability to modulate and optimize relative luminance and
luminance contrast as a function of film thickness.
Table 4-3. Relative luminance and CIE L*a*b* Color Coordinates for Random-Black films in the neutral (-0.2 V vs. Ag/Ag+) and oxidized (+0.7 V vs. Ag/Ag+) states.
Film Absorbance (a.u.)
Luminance Color Coordinates - Neutral
Color Coordinates - Oxidized
%Yba
Y L* a* b* L* a* b*
1 0.12 94 18 90 2 -4 98 -0.9 0.18 2 0.34 86 39 75 7.7 -13 95 -1.4 -0.7 3 0.5 80 47 64 5.4 -12 92 -2.7 -1.9 4 0.7 72 46 58 5 -11 88 -3 -2.6
a Relative luminance in the bleached state.
Furthermore, a significant fact was revealed by examining the CIE L*a*b* color
coordinates, particularly in comparison to BASF-Black films. With similar optical
densities, the L* and a* color coordinates of Random-Black (film 3) are comparable to
those of BASF-Black (film 4); however, the b* coordinate was different, with b* = -11 for
Random-Black and b* = -20 for BASF-Black. Negative b* value signifies blue on the CIE
color coordinates, which in the case of BASF-Black is more prominent and corresponds

103
well with the absorption spectra. The transition of a* and b* color coordinates toward
zero demonstrates that the films reach a highly transmissive state.
Given that active electrochromic components will strongly influence the properties
window ECDs, the switching speed of Random-Black was also investigated by
chronoabsorptometry. Polymer films were potentially stepped between -0.2 V and +0.65
V vs. Ag/Ag+ at periods of 60 s, 10 s, 1 s, and 0.5 s, as shown in Figure 4-8a for film 1.
A transmittance change (monitored at 550 nm) of 22 T was recorded for long switch
periods (60 s), and decreasing the switch time to 0.5 s reduced the contrast to only 20
T. In the case of film 4, the full transmittance contrast of 50 T was reached during
the 60 s period, and decreased by 40% when the switching period 1 s was applied, as
shown by the chronoabsorptogram in Figure 4-8b.
Figure 4-8. Potential square-wave step chronoabsorpometry for Random-Black. a) Random-Black film 1 (A = 0.17 a.u.) and b) Random-Black film 4 (A = 0.7 a.u.) monitored at 550 nm between -0.2 to +0.65 V vs. Ag/Ag+ in 0.1 M LiBTI/ACN electrolyte solution, at 60 s, 10 s, 1s, and 0.5 s switching periods.
The times necessary to reach a specific percent of the full transmittance contrast
for Random-Black are summarized in Table 4-4. In particular, the thickest film (film 4)
required 5.5 s to reach 95% of the full contrast (T95%), whereas 1 s and 500 ms were
0 50 100 150 200 250 30070
75
80
85
90
95
Tra
ns
mit
tan
ce
%
Time (s)
60 sec
10 sec
1 sec
0.5 sec
Random-Black A = 0.17
a)
0 50 100 150 200 250 300
20
30
40
50
60
70
Tra
ns
mit
tan
ce
%
Time (s)
60 sec
10 sec
1 sec
0.5 sec
Random - Black (A=0.7)
b)

104
needed to achieve T50% and T25% respectively. The thinnest film (film 1) demonstrated
sub-second switching times, ranging from 400 ms (t95%) to 50 ms (t25%).
Table 4-4. Transmittance and switching speed for Random-Black
Film Absorbance (a.u.)
Transmittance Switching Speed (sec) %Tb
a T Color to Bleached Bleached to Color
t 95% t 50% t 25% t 95% t 50% t 25%
1 0.17 93 22 0.4 0.1 0.05 0.17 0.08 0.05 2 0.34 83 39 1.11 0.35 0.18 0.8 0.42 0.29 3 0.5 78 47 1.57 0.48 0.24 1.13 0.5 0.33 4 0.7 70 50 5.5 1.0 0.47 2.6 0.9 0.53
a Transmittance in the bleached state
In light of the promising electrochromic and colorimetric properties of spray-
processed ECPs, both BASF-Black and Random-Black position us well for developing
window ECDs. Because the color purity of Random-Black was more neutrally black, as
confirmed by CIE L*a*b* color coordinates and by the comparative neutral absorption
spectra shown in 4-9, it is evident that Random-Black is the superior candidate of the
two polymers for window-type applications.
Figure 4-9. Comparative absorption spectra for BASF-Black and Random-Black with
normalized absorbance at = 550 nm for films in the dark and bleached states.
400 600 800 1000 12000.0
0.2
0.4
0.6
0.8
1.0
Ab
so
rban
ce
(a.u
.)
Wavelength (nm)
R-Black- Neutral
R- Black- Bleached
B-Black- Colored
B-Black- Bleached

105
Optimization of Transmittance and Switching Speed
In order to optimize the switching speed of Random-Black films, a series of
supporting electrolyte compositions were investigated, since highly conductive
electrolyte solutions are expected to improve the ion transport and thus the switching
speed.178,179 The conductivity results compiled in Table 4-5 suggest two general trends,
that is, the increase in conductivity with both high electrolyte concentration and with
acetonitrile as the solvent.
Table 4-5. Conductivity of supporting electrolyte solutions in various combinations electrolyte concentration, electrolyte, and solvent.
Concentration (M)
Electrolyte Solvent Conductivity (mS/cm)
0.1 LiBTI PC 1.6 0.1 TBABF4 PC 2.2 0.1 TBAPF6 PC 2.6 0.1 LiBTI ACN 9.1 0.1 LiBF4 ACN 7.1 0.1 TBABF4 ACN 10.7 0.1 TBAPF6 ACN 9.9 0.1 EMI-BTI ACN 11.4 1.0 TBABF4 ACN 34.9 1.0 LiBF4 ACN 20.8 1.0 EMI-BTI ACN 50.4 1.0 Na2SO4 H2O 88.7
The conductivity of tetrabutylammonium tetrafluoroborate (TBABF4) and lithium
tetrafluoroborate (LiBF4) improved over two-fold with increasing electrolyte
concentration. A remarkable five-fold increase was observed in the case of 1-ethyl-3-
methylimidazolium bis(trifluoromethylsulfonyl)imide (EMI-BTI). Furthermore, improved
conductivities were observed in ACN, owing to higher ion mobility compared to PC.
Aqueous supporting electrolyte demonstrated the highest ionic conductivity, although
our organic ECPs did not respond electrochemically. In light of high conductivity
measurements, electrochromic measurements were focused on TBABF4 and EMI-BTI

106
electrolytes in acetonitrile. Electrolyte concentrations were also varied to elucidate the
differences in switching times.
Subsequently, films of Random Black were analyzed in the selected conditions
outlined in Table 4-6. The transmittance of these films was compared first, ranging
between 39 to 41% T in the neutral state and 78 to 80% T in the oxidized states. With
reproducible transmittance levels, we were then able to compare the switching speed in
different electrolyte solutions. Unfortunately our results did not demonstrate a strong
relationship between the switching speed and electrolyte conductivity. Only slight
improvement in switching speed was observed with 1.0 M EMI-BTI electrolyte
concentration. One important factor not considered at the time of these experiments is
the size of counter-ions. It has been reported that the cation and anion heavily influence
the reduction and oxidation process respectively.60 As such, while EMI-BTI
demonstrated high conductivity, the large anion may impede the ion transport during
electrochemical cycling.
Table 4-6. Switching speed of Random-Black in various electrolyte compositions
Supporting Electrolyte
Transmittance %T Switching Speed (s)
Colored to Bleached
Bleached to Colored
Neutral Oxidized Contrast t 95% t 50% t 95% t 50%
0.1 M TBABF4 /
ACN 41 80 39 0.6 0.19 0.26 0.18
0.1 M EMI-BTI / ACN
40 78 38 0.5 0.17 0.23 0.16
1.0 M TBABF4 /
ACN 39 78 39 0.4 0.15 0.19 0.12
1.0 M EMI-BTI / ACN
39 78 39 0.38 0.14 0.22 0.15
In addition to electrolyte composition, the investigation of applied potentials was
carried out, in particular to probe the effects of potential limits. Because the potential
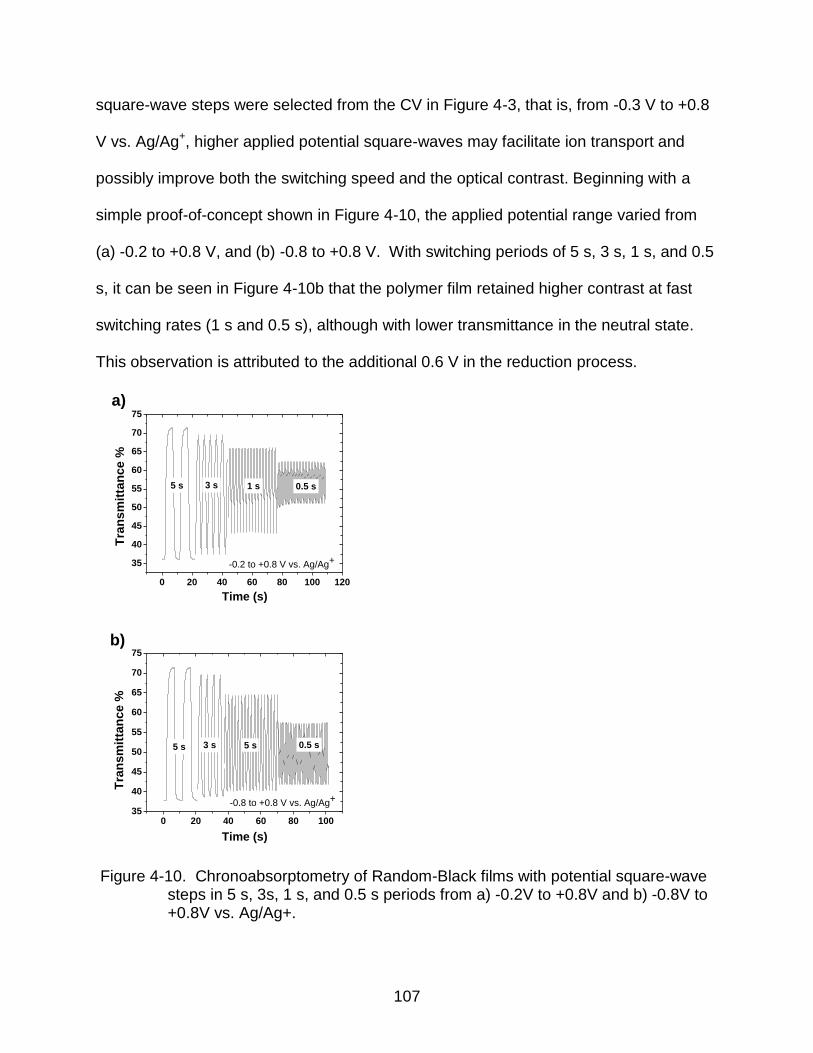
107
square-wave steps were selected from the CV in Figure 4-3, that is, from -0.3 V to +0.8
V vs. Ag/Ag+, higher applied potential square-waves may facilitate ion transport and
possibly improve both the switching speed and the optical contrast. Beginning with a
simple proof-of-concept shown in Figure 4-10, the applied potential range varied from
(a) -0.2 to +0.8 V, and (b) -0.8 to +0.8 V. With switching periods of 5 s, 3 s, 1 s, and 0.5
s, it can be seen in Figure 4-10b that the polymer film retained higher contrast at fast
switching rates (1 s and 0.5 s), although with lower transmittance in the neutral state.
This observation is attributed to the additional 0.6 V in the reduction process.
Figure 4-10. Chronoabsorptometry of Random-Black films with potential square-wave steps in 5 s, 3s, 1 s, and 0.5 s periods from a) -0.2V to +0.8V and b) -0.8V to +0.8V vs. Ag/Ag+.
0 20 40 60 80 100 120
35
40
45
50
55
60
65
70
75
0.5 s1 s3 s
Tra
nsm
itta
nce %
Time (s)
5 s
-0.2 to +0.8 V vs. Ag/Ag+
a)
0 20 40 60 80 10035
40
45
50
55
60
65
70
75
0.5 s5 s3 s
Tra
nsm
itta
nce %
Time (s)
5 s
-0.8 to +0.8 V vs. Ag/Ag+
b)

108
Our observations of increasing contrast with increasing potential ranges led to the
next set of experiments; that is, systematically increase the potential to determine the
limits of Random-Black films, as depicted in Figure 4-11.
Figure 4-11. Chronoabsorptometry of Random-Black (A=0.48) switching at 0.5 s periods between different applied potentials.
Taking the left block (a) in Figure 4-11 as the reference point, an increase in the
oxidation potential to +1.5V (b) significantly improved the transmittance to 67% T (from
56% T) in the bleached state, albeit with a concurrent increase in the transmittance of
the neutral state. However, with the application of a potential window from -1.5 V to +1.5
V (c), we were able to improve the contrast while maintaining a deeply absorbing
neutral film that is also highly transmissive in the oxidized state. Slight improvement was
seen with an applied potential of -2 to +2 V (d) and beyond this range (e) exhibited the
potential limits of Random-Black films.
Transparent Counter Material
With the ability to tune the electron-rich nature and the extent of conjugation of
conjugated polymers, the position the neutral -* and charge carrier transitions can be
0 50 100 150 200
30
40
50
60
70
(e)
(d)(c)
(b)
Tra
nsm
itta
nce %
Time (s)
-0.8 - 0.8V
-0.8 - 1.5V
-1.5 - 1.5V-2 - 2V
-2 - 3V
(a)

109
tuned across the UV-vis-NIR spectrum. Conducting polymers of reduced conjugation
have high-energy band gaps with the majority of the light absorption in the UV region,
as in the case for the family of N-alkylated PProDOP, which have band gaps over 3.0
eV. In addition, as these polymers are highly electroactive at low oxidation potentials
and highly transparent in both the neutral and oxidized states, they may find use as
counter electrodes in window electrochromic devices. Because of its electrochromic
properties, N-alkylated PProDOP will be referred to as minimally-color changing
polymer (MCCP) in this dissertation.
MCCP was synthesized by M. Craig of the Reynolds group in collaboration with
BASF. Redox properties of MCCP are exhibited by CV and DPV in Figure 4-12, with
potentiodynamic cycling between -0.5 V to +0.4 V vs. Ag/Ag+ in 0.1 M LiBTI/ACN for 30
repeated cycles. Both the CV and DPV demonstrated onsets of oxidation ca. -0.05 V vs.
Ag/Ag+, and anodic peaks (Ep,a) centered ca. 0.1 V vs. Ag/Ag+, which are relatively low
oxidation potentials suitable for long term redox switching.
Figure 4-12. Electrochemistry of MCCP. a) CV switching of MCCP between -0.5 V to +0.4 V vs. Ag/Ag+ in 0.1 M LiBTI/ACN for 30 cycles b) DPV of MCCP in the oxidation and neutralization process.
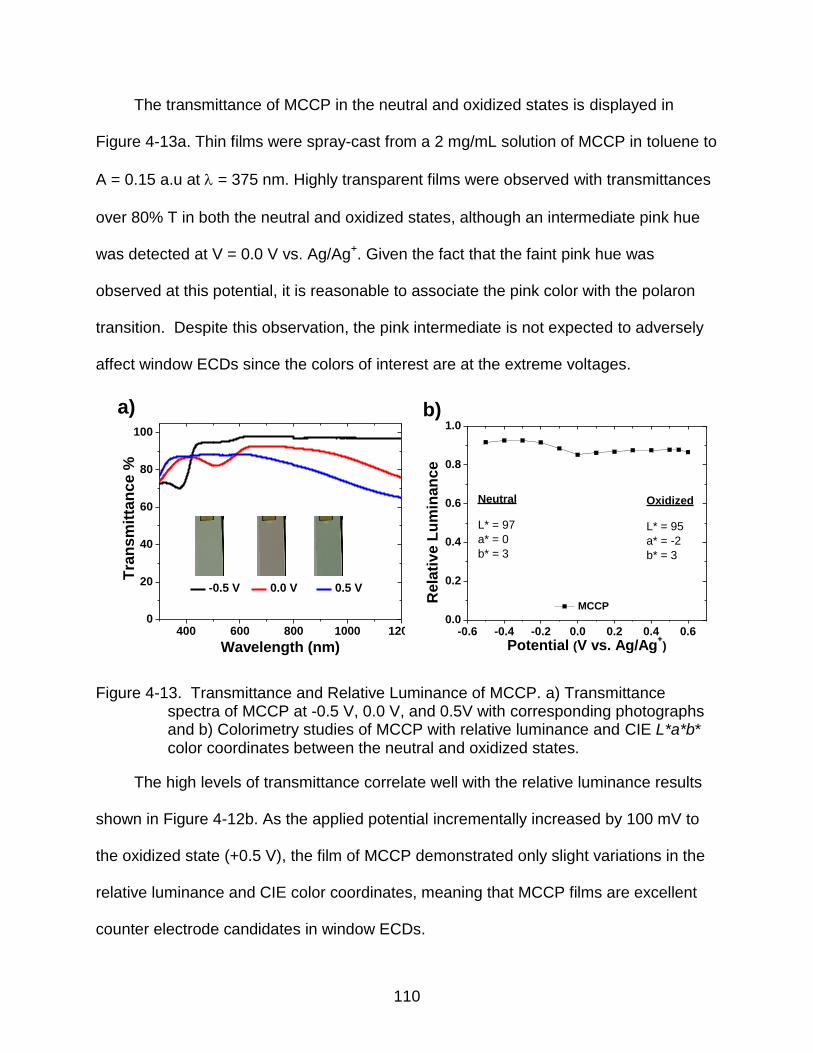
110
The transmittance of MCCP in the neutral and oxidized states is displayed in
Figure 4-13a. Thin films were spray-cast from a 2 mg/mL solution of MCCP in toluene to
A = 0.15 a.u at = 375 nm. Highly transparent films were observed with transmittances
over 80% T in both the neutral and oxidized states, although an intermediate pink hue
was detected at V = 0.0 V vs. Ag/Ag+. Given the fact that the faint pink hue was
observed at this potential, it is reasonable to associate the pink color with the polaron
transition. Despite this observation, the pink intermediate is not expected to adversely
affect window ECDs since the colors of interest are at the extreme voltages.
Figure 4-13. Transmittance and Relative Luminance of MCCP. a) Transmittance spectra of MCCP at -0.5 V, 0.0 V, and 0.5V with corresponding photographs and b) Colorimetry studies of MCCP with relative luminance and CIE L*a*b* color coordinates between the neutral and oxidized states.
The high levels of transmittance correlate well with the relative luminance results
shown in Figure 4-12b. As the applied potential incrementally increased by 100 mV to
the oxidized state (+0.5 V), the film of MCCP demonstrated only slight variations in the
relative luminance and CIE color coordinates, meaning that MCCP films are excellent
counter electrode candidates in window ECDs.
400 600 800 1000 12000
20
40
60
80
100
Tra
nsm
itta
nce %
Wavelength (nm)
-0.5 V 0.0 V 0.5 V
a)
-0.6 -0.4 -0.2 0.0 0.2 0.4 0.60.0
0.2
0.4
0.6
0.8
1.0
Oxidized
L* = 95
a* = -2
b* = 3
Rela
tive L
um
inan
ce
Potential (V vs. Ag/Ag+)
MCCP
Neutral
L* = 97
a* = 0
b* = 3
b)

111
Charge Balance
From a practical perspective, the most useful combinations of Random-Black and
MCCP in a dual- electrochromic polymer device are those in which the redox charge for
both electroactive materials is the same. Observed by Padilla, a balanced system
prevents, or at least minimizes, undesirable reactions that would otherwise decrease
the device switching lifetime. This was reported in dual-electrochromic devices using
complimentary ECPs (poly(3,4-ethylenedioxythiophene and poly[bis(3,4-
ethylenedioxy)thienyl)-N-methylcarbazole]).165 In the case of unbalanced systems,
individual electrochromic polymers did not reach their full switching capacity.
This reasoning was employed on our window ECDs. Calibration plots relating the
charge density as a function of film absorbance were first generated with four films of
Random-Black, spray-casted to A (550 nm) = 0.27, 0.48, 0.69, 1.15 and six films of
MCCP, A (350 nm) = 0.02, 0.07, 0.13, 0.2, 0.35, 0.49. Subsequently, the charge density
of the individual films was determined from potential square-wave cycles between the
polymers’ fully neutral and oxidized states (-0.2 to +0.8 V vs. Ag/Ag+ for ECP-Black and
-0.5 to +0.4 V vs. Ag/Ag+ for MCCP). Taking into consideration the ECD design, that is
Random-Black as the working electrode (anode) and MCCP as the counter electrode
(cathode), charge density of Random-Black was determined from the oxidation process,
whereas MCCP charge density was measured from the neutralization (reduction)
process. Figure 4-14 shows the calibration curves for Random-Black (1a) and MCCP
(1b) with respective linear fit lines. The coefficients of determination (R2) for both plots
are above 0.98. This statistical parameter demonstrates a linear relationship between
the charge density and absorbance, and is utilized to correlate the absorbance and
charge density during film preparation.

112
Figure 4-14. Calibration plots of absorbance as a function of charge density for a) Random-Black and b) MCCP films.
Black-to-Transmissive Electrochromic Devices
With the fundamental electrochromic and colorimetric properties of the active
components characterized, window electrochromic devices were assembled on 1.0 by
1.5 inch ITO substrates consisting of equal amounts of Random-Black and MCCP
based on charge density. Prior to device encapsulation, the films were switched
between their neutral and oxidized states until reproducible current density responses
were observed. In addition, Random-Black films (as the working electrode) were

113
potentiostatically held for 30 s at +0.8 V vs. Ag/Ag+, and MCCP films at -0.5 V vs.
Ag/Ag+ for 30 s (as the counter electrode). This procedure ensured polymer charge
balance during operation of the device. Both polymers were covered with a thin layer of
transparent gel electrolyte comprised of 1.0 M LiBTI/PC/PMMA and assembled into a
sandwich-type device configuration.
The spectroelectrochemical behavior of the window ECD was measured to
examine the spectral changes during redox switching. Using a Cary 500 UV-Vis-NIR
spectrophotometer equipped with a tungsten halogen visible light source, a voltage
sufficient to fully neutralize the active layers was applied across the device (-0.5 V),
followed by the incremental increase of applied voltages until the fully oxidized state
was achieved (1.8 V). At -0.5 V, the device exhibited an absorption bandwidth (bold
line) in the visible region characteristic of Random-Black and has a dark neutral color as
evident in the photograph shown in Figure 4-15.
Figure 4-15. Spectroelectrochemical series of window ECD (D3) based on Random-Black and MCCP films, with applied voltages from -0.3 to 0.0V in 100 mV increments and +0.05 to +0.7 V in 50 mV increments.
400 600 800 1000 1200 1400 16000.0
0.2
0.4
0.6
0.8
1.0
1.2
Ab
so
rba
nc
e (
a.u
.)
Wavelength (nm)

114
With an incremental increase of applied voltage from -0.5 to +1.8 V, the cathodically
coloring polymer becomes oxidized and the absorption in the visible region is reduced.
The rise of a polaronic (ca. 950 nm) peak and bipolaronic (ca. 1500) peaks at high
doping levels led to effective bleaching of the visible absorption (dotted line) and a high
level of ECD transmissivity was subsequently realized.
The relative luminance in the extreme states demonstrates a contrast of 47% Y,
with a luminance value of 20% Y in the neutral state (-0.5V) and 67% Y in the oxidized
state (+1.8 V). The values obtained for the ECD were near those of the individual
Random-Black films at A = 0.7 a.u. As window ECDs were originally designed to
achieve high levels of transmissivity and luminance in the bleached state, the use of
thinner films would allow for this, albeit with a subsequent lowering of the optical
contrast. Two thinner ECDs, D1 and D2 (as summarized in Table 4-7), exhibit relative
luminance ranging from 88 to 77% Y in the bleached state with a luminance contrast of
37 and 42% Y, respectively.
Table 4-7. Relative luminance and CIE L*a*b* Color Coordinates for ECDs in the neutral (-0.5 V) and oxidized (+1.8V) states.
ECD Random-Black Absorbance
Luminance Neutral (-0.5 V) Bleached (1.8 V) %Yb Y L* a* b* L* a* b*
D1 0.3 88 37 7 9 -9 95 1 -2 D2 0.48 77 42 66 9 -12 90 -1 -4 D3 0.7 67 47 52 11 -12 85 -1 -6
The color purity of window ECDs was evaluated with the CIE L*a*b* system. Most
of the color change was found to vary along the lightness scale (L*), since the a* and b*
color coordinates did not significantly differ between the three ECDs. This observation is

115
indicative of an achromatic transition between the neutral and bleached states and can
be seen by the photographs in Figure 4-16.
Figure 4-16. Photographs of window ECDs in the neutral (-0.5 V) and oxidized (+1.8 V) states with corresponding CIE L*a*b* color coordinates.
The switching speed of two window ECDs, based on Random-Black films of A =
0.48 and A = 0.3 optical density, was determined from the chronoabsorptometry shown
in Figure 4-17.
The transmittance change of the device was measured between -0.5 V and +1.8 in
15 s intervals with a corresponding transmittance contrast of 38% T and 31% T for
D2 and D1, respectively. While the t95% in both devices were on the order of seconds,
the t50% and t25%were under 1 s, suggesting that video-rate for display applications may
be achievable with further switching speed optimization, as summarized in Table 4-8.
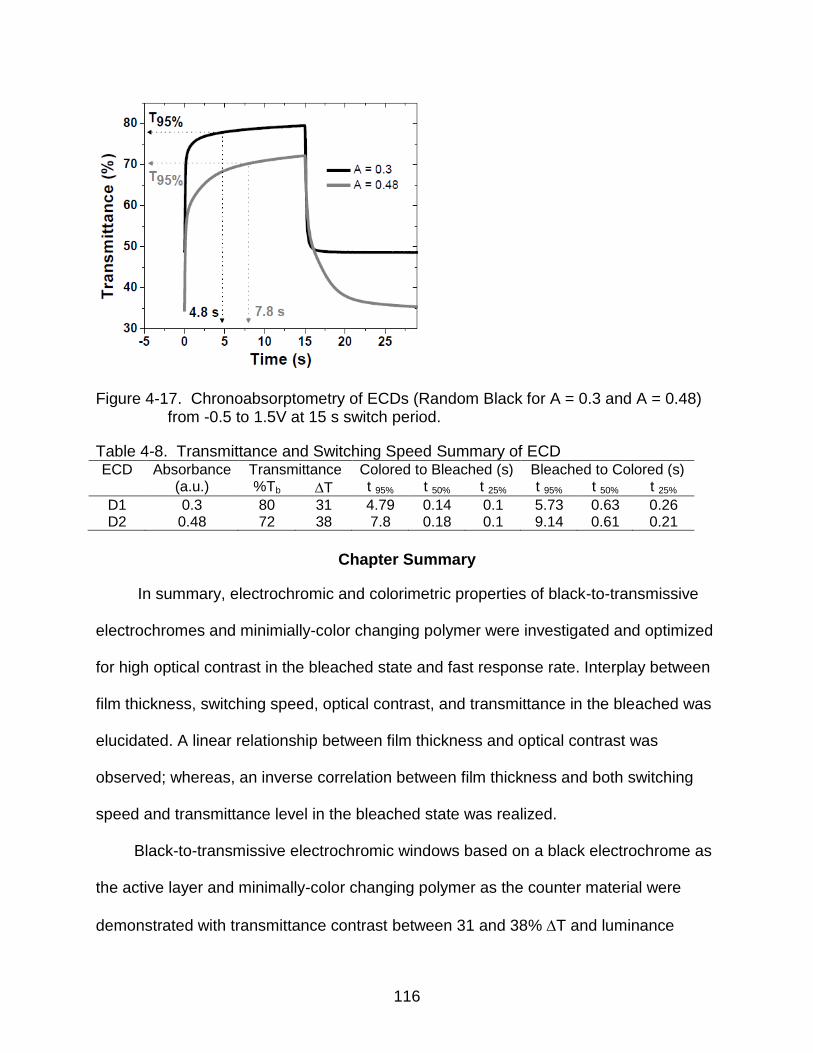
116
Figure 4-17. Chronoabsorptometry of ECDs (Random Black for A = 0.3 and A = 0.48) from -0.5 to 1.5V at 15 s switch period.
Table 4-8. Transmittance and Switching Speed Summary of ECD ECD Absorbance
(a.u.) Transmittance Colored to Bleached (s) Bleached to Colored (s) %Tb T t 95% t 50% t 25% t 95% t 50% t 25%
D1 0.3 80 31 4.79 0.14 0.1 5.73 0.63 0.26 D2 0.48 72 38 7.8 0.18 0.1 9.14 0.61 0.21
Chapter Summary
In summary, electrochromic and colorimetric properties of black-to-transmissive
electrochromes and minimially-color changing polymer were investigated and optimized
for high optical contrast in the bleached state and fast response rate. Interplay between
film thickness, switching speed, optical contrast, and transmittance in the bleached was
elucidated. A linear relationship between film thickness and optical contrast was
observed; whereas, an inverse correlation between film thickness and both switching
speed and transmittance level in the bleached state was realized.
Black-to-transmissive electrochromic windows based on a black electrochrome as
the active layer and minimally-color changing polymer as the counter material were
demonstrated with transmittance contrast between 31 and 38% T and luminance

117
contrast between 37 and 47% Y. In the bleached state, the transmittance and
luminance values were 88% T and 80% Y respectively. The switching speed between
the dark and bleached states ranged from 5 to 9 s at the 95% transmittance contrast,
and sub-second at the 50% transmittance contrast.

118
CHAPTER 5 IN SITU SPECTROSCOPIC ANALYSIS OF SUB-SECOND SWITCHING POLYMER
ELECTROCHROMES
Introduction
Electrochromic materials for applications such as smart windows, visual displays,
and electronic-papers have shown great progress with recent improvements in
structural modifications and metal-mediated polymerizations of electroactive conjugated
polymers as well as in advanced nanostructure templating and processing techniques of
metal oxide materials. As electrochromic materials are finding their niche in various
display applications, the accurate measurement and determination of the response time
is required as the switching speed ultimately governs their usefulness for specific
functions. For instance, residential privacy windows target a response time on the order
of minutes, whereas information displays and electronic-readers require a 100 ms to
500 ms benchmark. For use in video displays, electrochromic materials must attain
switching speeds on the range of 30 ms to 50 ms.
While the full-switch response times of electrochromic materials are approaching
sub-second, there is continued effort to increase the switching speed, specifically by
structure-property optimization, ionic conductivity of supporting electrolyte, and 3D
nanostructure templating.166-169 In parallel, as electrochromic materials are accessing
sub-second switching speeds, new analytical tools to probe rapid electrochromic
transitions are necessary.
Spectroscopic characterization remains one of the most valuable techniques in the
analysis of electrochromic materials. When considering the rate at which an
electrochromic material switches, there are two approaches: the magnitude of contrast
when the film is switched at a specific rate (% ∆T), and the time necessary for an optical

119
contrast to be reached (time). In both scenarios, analysis of the response time requires
in-situ electrochemical experiments coupled to electronic spectroscopy. In the former
case, the spectrometer measures the electrochrome's optical transmittance at controlled
switching rates. In the latter case, the electrochromic material is switched between the
two optical states and saturation is allowed to be reached, while the optical transition is
measured with respect to time. In this situation, synchronization between the
potentiostat that induces the redox reaction, and the spectrometer, that measures the
resulting optical changes is necessary to determine the precise moment of an
electrochromic change, which can be difficult, particularly for rapidly switching
electrochromic materials.
This chapter describes a novel technique developed to synchronize the
electrochemical and optical responses of sub-second switching electrochromic
polymers. The method involves the use of an external circuit directly coupled to the
electrode on which the electrochromic film is supported, which upon the application of
an electrochemical bias from the potentiostat, an output signal is transmitted to the
spectrometer detector to trigger the measurement of optical signals. While the
response time of “slow” electrochromic films can be probed without this method using
commercial spectrophotometers, rapidly switching films require this trigger setup since
the synchronized electrochemical and optical responses give an accurate analysis of
the switching speed. The use of a novel spectroscopic setup to probe the switching
times of three electrochromic polymers (ECP-Magenta,170 ECP-Green,171,172 and ECP-
Black160,161,173) is described, all with response times near the 500 ms benchmark for
applications in electronic information and e-reader displays.

120
Electrochromic Polymers
The synthetic protocols of ECP-Magenta,34 ECP-Green,172 and ECP-Black161 have
been previously reported. The repeat unit of each polymer is shown in Figure 5-1, with
corresponding photographs and L*a*b* values (based on the Commission Internationale
de I’Eclairage 1976 L*a*b* Color Space) in their fully colored and bleached states.
The number average molecular weights of the polymers were measured by GPC
in THF vs. polystyrene standards and found to be 10.5 kDa for ECP-Magenta, 24 kDa
for ECP-Green, and 12.7 kDa for ECP-Black. The applied voltages for ECP-Magenta
were -0.6V and 0.75V vs. Ag/Ag+ for the colored and bleached states respectively, and -
0.6V and 0.95V vs. Ag/Ag+ for ECP-Green, and -0.7 and 0.85V vs. Ag/Ag+ for ECP-
Black.
Figure 5-1. Structures of ECP-Magenta, ECP-Green, and ECP-Black with photographs of the films in the colored and bleached states and their corresponding L*a*b*
values (in the sense of the Commission Internationale de I’Eclairage 1976 L*a*b* Color Space). The applied voltages for ECP-Magenta were -0.6V and 0.75V vs. Ag/Ag+ for the colored and bleached states respectively, and -0.6V and 0.95V vs. Ag/Ag+ for ECP-Green, and -0.7 and 0.85V vs. Ag/Ag+ for ECP-Black.

121
Each film was subjected to optical absorbance measurements to monitor their
relative film thickness, which was optimized at A (max) = 0.7. Absolute film thickness
measurements were obtained with a Veeco Dektek 150 profilometer by Danielle
Salazar. The average thickness of ECP-Magenta was found to be 375 + 60 nm with a
film sprayed to A (545) = 0.7. For ECP-Green, the average thickness is 350 + 130 nm,
and 380 + 80 nm for ECP-Black at A (max) = 0.7.
ECP-Magenta
As the first solution processable electrochromic polymer exhibiting high color purity
in electrochromic devices (ECDs), the electron-rich ECP-Magenta is an ideal candidate
for analysis using the novel triggered-spectrometer setup. A film of ECP-Magenta,
sprayed to an absorbance of 0.7 a.u. at max, is stepped between full neutralized and
fully oxidized states (-0.6 V and +0.75 vs. Ag/Ag+), and the optical spectra captured
every 2 ms during the electrochromic transition. As seen in the spectral profile in Figure
5-2a, the film in the colored neutral state has a transmittance of 20% at max (545 nm)
that increases to near 70% transmissivity when the bleached state is reached. In Figure
5-2b, only selected spectra (a total of 20 spectra) are given to clearly show the
electrochromic transition. Further, by tracing the peaks shown by the circular markers
in Figure 5-2b, it is evident that ECP-Magenta does not switch monochromatically as
the max shifts during the electrochromic switch. The full transition from the neutral to
oxidized states is further confirmed by the near stationary isobestic point centered at
625 nm, which indicates, spectroscopically, a smooth transition from one species to
another with no intermediates.

122
Figure 5-2. Spectral Evolution of ECP-Magenta. a) ECP-Magenta film (abs at max = 0.7) switching from -0.6 V to +0.75 vs. Ag/Ag+ with the full potential step and hold occurring within 0.5-seconds. Spectrum recorded every 2 ms for a total of 250 spectra in 500 ms. b) Same ECP-Magenta film and switching experiment with spectrum shown every 20 ms for clarity, for a total of 25 spectra in 500 ms. Circular markers are placed to emphasize the shifting of λmax during the electrochromic switch.
350 400 450 500 550 600 650 700 750
20
30
40
50
60
70
Colored
Bleached
Tra
ns
mit
tan
ce
%
Wavelength (nm)
(a)
350 400 450 500 550 600 650 700 750
20
30
40
50
60
70
Tra
ns
mit
tan
ce
%
Wavelength (nm)
Colored
Bleached
(b)

123
It is important to note that this transmittance profile is not a typical
spectroelectrochemical experiment where the electrochromic film is monitored at
steady-state (i.e. constant applied potential). Instead the optical responses are
continuously captured by the spectrometer detector at 1 spectrum for every 2 ms during
a switch between the two extreme states. Shown in Figure 5-2 represents only one full
transition (colored to bleached) to avoid spectral overlapping. At the 0.5-second switch,
ECP-Magenta exhibits a 48% transmittance contrast at max and slightly higher
transmittance contrasts observed at 1 and 5-second potential square-waves (48.8 and
50 % ∆T respectively).
Subsequently, the contrast levels and switching times of ECP-Magenta were
analyzed to determine the response time while retaining a high level of transmittance
contrast. Experiments were carried out at the 1-second switch which allowed a near full
contrast as exhibited in Figure 5-3. The 545 nm wavelength (max in the neutral state)
was selected to probe the transmittance contrast as it is expected that this is where the
maximum contrast occurs. ECP-Magenta achieved the full optical contrast (50% ∆T)
during a 5-second switch, and retained 97.6% of the contrast during the 1-second
switch. These results allow us to determine the time necessary for a specific level of
optical contrast to be reached. For example, it is common to determine the times to
reach 98% and 95% of the full transmittance contrast (t98% and t95%) and are typically
reported for display characterizations as the remaining small changes in transmittance
(3% and 5%, respectively) are nearly imperceptible to the human eye.
The first striking observation in Figure 5-3 is the asymmetric response of the ECP-
Magenta in comparing the bleaching (0 to 1000 ms) and the coloring (1000 to 2000 ms)
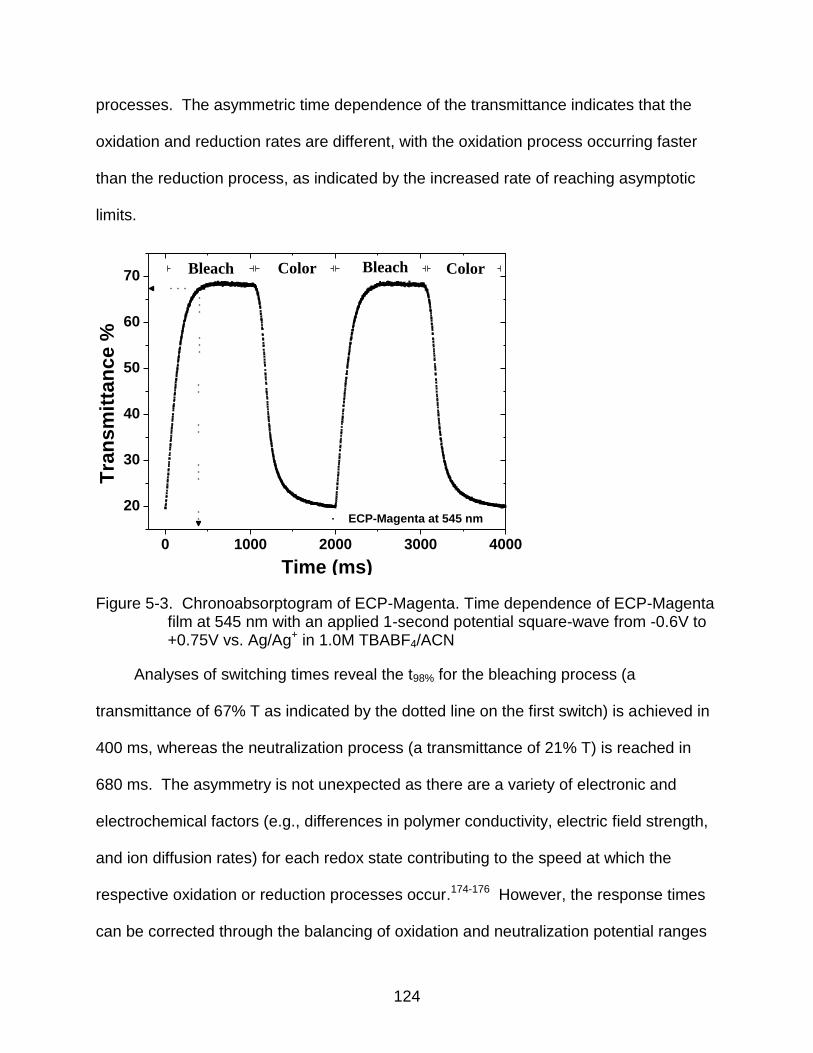
124
processes. The asymmetric time dependence of the transmittance indicates that the
oxidation and reduction rates are different, with the oxidation process occurring faster
than the reduction process, as indicated by the increased rate of reaching asymptotic
limits.
Figure 5-3. Chronoabsorptogram of ECP-Magenta. Time dependence of ECP-Magenta film at 545 nm with an applied 1-second potential square-wave from -0.6V to +0.75V vs. Ag/Ag+ in 1.0M TBABF4/ACN
Analyses of switching times reveal the t98% for the bleaching process (a
transmittance of 67% T as indicated by the dotted line on the first switch) is achieved in
400 ms, whereas the neutralization process (a transmittance of 21% T) is reached in
680 ms. The asymmetry is not unexpected as there are a variety of electronic and
electrochemical factors (e.g., differences in polymer conductivity, electric field strength,
and ion diffusion rates) for each redox state contributing to the speed at which the
respective oxidation or reduction processes occur.174-176 However, the response times
can be corrected through the balancing of oxidation and neutralization potential ranges
0 1000 2000 3000 4000
20
30
40
50
60
70 Bleach Color
ECP-Magenta at 545 nm
Tra
ns
mit
tan
ce %
Time (ms)
Bleach Color

125
as suggested by the work of Padilla et al.177 The authors compared the electrochromic
potential window of PProDOT derivatives relative to current density, charge density, and
percent transmittance, and revealed a specific potential window in which a high level of
electrochromic contrast occurred and regions of inefficient electrochromic change. In
addition, MacFarlane et al. investigated the effects of electrolytes on the redox cycling
of electrochromic materials.178 Electrolyte selection with respect to cation and anion
size can optimize the mobility of the ions within the bulk of the electrochromic polymer,
and the authors determined tosylate anion to be ideal for PEDOT, for example.179
ECP-Green
A second polymer, ECP-Green, was chosen for analysis due to its structural
similarities and differences to ECP-Magenta. By introducing an electron-deficient
heterocycle 2,1,3-benzothiadiazole (BTD) into the ECP-Magenta backbone, the
absorption spectrum is consequently affected by the donor-acceptor interaction, yet the
bis(alkyloxy)-substituted propylenedioxythiophene (PProDOT-(CH2OR)2) donors allow
the low redox potential and high level of organic solvent processability. In the case of
ECP-Green, the donor-acceptor effect contributes a dual-band absorption centered at
443 nm and 682 nm as illustrated in Figure 5-4a. The transmittance response exhibited
in Figure 5-4a consists of 25 total spectra for a 0.5-second switch. A detailed analysis
of the transmittance change at both absorption peaks illustrated in Figure 5-4b reveals
the bleaching process for both absorption peaks are nearly linear, and over 90% the
electrochromic change to occur within the first 250 ms. This is followed by a plateau of
the time dependence of the transmittance in the bleaching stage. By tracing the
electrochromic onset at both wavelengths, as shown by the dotted lines in Figure 5-4b,
it can be seen that both bands bleach nearly simultaneously.

126
Figure 5-4. Spectral Evolution of ECP-Green. a) ECP-Green film (Abs at max = 0.7) switching from -0.6 V to 0.95 vs. Ag/Ag+ with the full potential step and hold occurring within 0.5-seconds. Spectrum shown every 20 ms for a total of 25 spectra in 500 ms. b) Time dependence of ECP-Green transmittance at 443 nm and 682 nm, switching from the colored state to the bleached state.
In the colored, neutral state (A at max = 0.7), ECP-Green has a transmittance of
30% at the high-energy band centered at 443 nm and 18% at the low-energy band
centered at 682 nm. The film was electrochemically switched between -0.6V and 0.95V
vs. Ag/Ag+, yielding transmittances of 70% and 58% at 443 nm and 682 nm respectively
350 400 450 500 550 600 650 700 75010
20
30
40
50
60
70
Tra
nsm
itta
nce %
Wavelength (nm)
Colored
Bleached
(a)
0 100 200 300 400 500
10
20
30
40
50
60
70
80
Tra
nsm
itta
nce %
Time (ms)
443 nm
682 nm
(b)
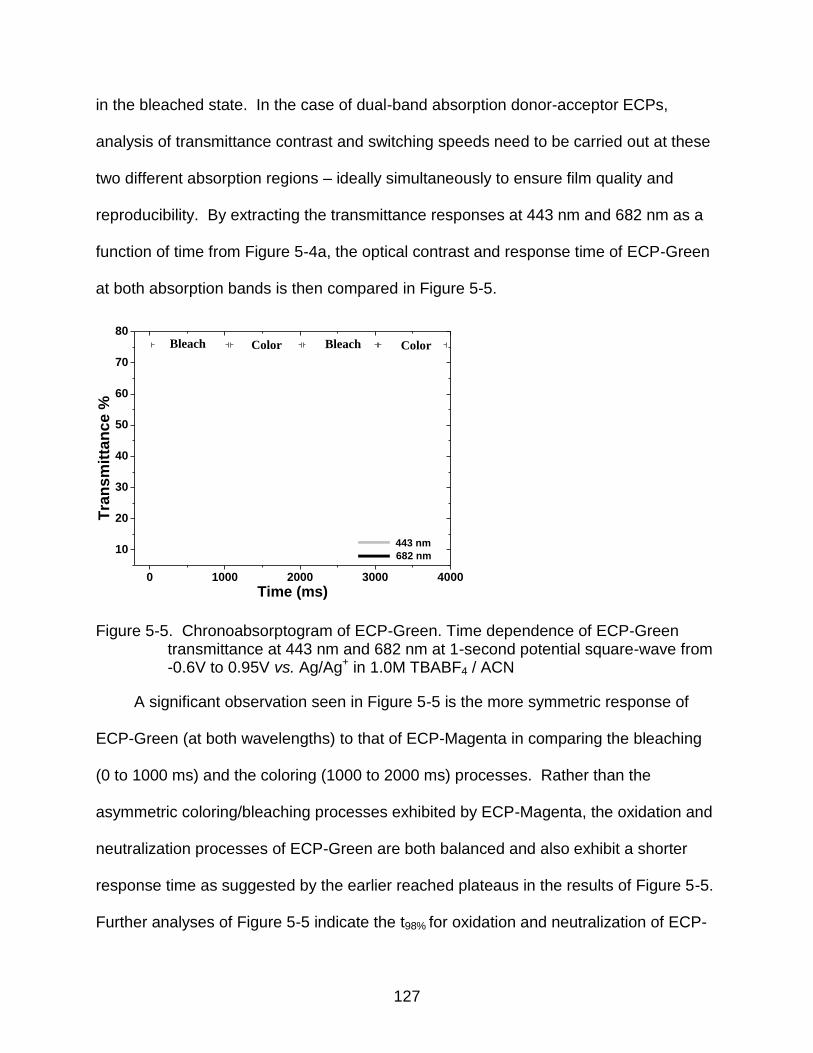
127
in the bleached state. In the case of dual-band absorption donor-acceptor ECPs,
analysis of transmittance contrast and switching speeds need to be carried out at these
two different absorption regions – ideally simultaneously to ensure film quality and
reproducibility. By extracting the transmittance responses at 443 nm and 682 nm as a
function of time from Figure 5-4a, the optical contrast and response time of ECP-Green
at both absorption bands is then compared in Figure 5-5.
Figure 5-5. Chronoabsorptogram of ECP-Green. Time dependence of ECP-Green transmittance at 443 nm and 682 nm at 1-second potential square-wave from -0.6V to 0.95V vs. Ag/Ag+ in 1.0M TBABF4 / ACN
A significant observation seen in Figure 5-5 is the more symmetric response of
ECP-Green (at both wavelengths) to that of ECP-Magenta in comparing the bleaching
(0 to 1000 ms) and the coloring (1000 to 2000 ms) processes. Rather than the
asymmetric coloring/bleaching processes exhibited by ECP-Magenta, the oxidation and
neutralization processes of ECP-Green are both balanced and also exhibit a shorter
response time as suggested by the earlier reached plateaus in the results of Figure 5-5.
Further analyses of Figure 5-5 indicate the t98% for oxidation and neutralization of ECP-
0 1000 2000 3000 4000
10
20
30
40
50
60
70
80
443 nm
682 nm
Tra
nsm
itta
nce %
Time (ms)
Bleach Color Bleach Color

128
Green at 682 nm are 420 ms and 330 ms, respectively. The switching speeds of ECP-
Green at both wavelengths are listed and compared with films of ECP-Magenta, of the
same optical density (at max) and summarized in Tables 5-1 and 5-2.
ECP-Black
As one of the most promising electrochromic polymers for a variety of window and
display applications, the need to understand the optical properties and transitions during
switching is important. We have recently reported a black-to-transmissive polymeric
electrochrome prepared by the random incorporation of monomeric units while
controlling the polymerization feed ratios of donors to acceptors. This results in the
polymeric backbone of ECP-Black being randomly comprised of electron-rich 3,4-
propylenedioxythiophene (ProDOT) groups, as found in ECP-Magenta, and the
electron-deficient 2,1,3-benzothiadiazole (BTD), as found in ECP-Green. This results in
the polymer having a broad absorption of the visible light from 400 to 700 nm in the
neutral state, switching to a high level of transmission in the oxidized state, as shown in
Figure 5-6a. Without a distinct peak wavelength to probe the switching speed, 550 nm
was selected as this is the wavelength at which the human eye is most sensitive to
changes in light intensity.180 As shown by the transmittance profile in Figure 5-6a, ECP-
Black is absorptive (21% T) in the colored, neutral state, spanning a large portion of the
visible spectrum, and highly transmissive (71% T) upon oxidation. It is important to note
that Figure 5-6 shows only selected spectra (1 spectrum for every 24 ms for a total of 27
spectra) in order to clearly illustrate the dual-band absorption at intermediate oxidation
states. The complete transmittance profile is shown in Figure 5-6b.

129
Figure 5-6. Spectral Evolution of ECP-Black. a) Spectra of ECP-Black film switching at a 0.5-second potential step (spectrum shown every 24 ms for a total of 27 spectra), along with the spectrum when the film is held longer at 0.85V vs.
Ag/Ag+ for a total of 5 s (dark solid line).b) ECP-Black film (Abs at 550 = 0.7 a.u.) switching from -0.7 V to 0.85 vs. Ag/Ag+ for 1 cycle at 0.5-second potential steps. Spectrum shown every 6 ms for a total of 83 spectra in 500 ms.
An important aspect of the rapid spectroscopic technique is highlighted with ECP-
Black. As the film is electrochemically switched between the colored neutral and highly
transmissive bleached states (-0.7 V to +0.85V vs. Ag/Ag+), ECP-Black transitions from
black through a “dual-band type” green color state before reaching the transmissive
state. The temporal evolution of the dual-band absorption can be tracked with
350 400 450 500 550 600 650 700 75010
20
30
40
50
60
70
Fully Colored (t=0 ms) Bleached (t=500 ms)
Dual - band (t=70 to 170 ms) Fully Bleached (t=5000 ms)
Tra
nsm
itta
nce %
Wavelength (nm)
(a)
350 400 450 500 550 600 650 700 75020
30
40
50
60
70 Colored
Bleached
Tra
nsm
itta
nce %
Wavelength (nm)
(b)

130
representative dotted lines shown in Figure 5-6. Starting in the colored state with the
broadly absorbing spectrum, this single broad absorption band evolves into a dual-band
after 12 spectra were collected (represented by 4 spectra). The total time to reach the
start of the dual-band transition is approximately 70 ms, and this green intermediate
tone is present for approximately 100 ms before bleaching out into the transmissive
state. It is worth mentioning that the green intermediate tone, with a lifetime of
approximately 100 ms, is in essence imperceptible by the human eye, and is only now
detectable with this spectroscopic technique. In addition, spectra captured in the
bleached states at the 500 ms and 5000 ms mark are plotted in Figure 5-6 to illustrate
the relative transmittance levels. As ECP-Black is capable of rapid switching in the sub-
second time frame, longer switching times (0.5 and 5 s) do not significantly improve the
transmittance contrast as the polymer film is completely oxidized. The switching time of
ECP-Black is determined from the time dependence of the transmittance illustrated in
Figure 5-7. The oxidation and neutralization processes for ECP-Black are near identical
as suggested by the symmetric results, and the t98% response times were determined to
be 480 ms and 570 ms, respectively as summarized in Tables 5-1 and 5-2.
Figure 5-7. Chronoabsorptogram of ECP-Black monitored at 550 nm at 1-second potential square-wave from -0.7V to 0.85V vs. Ag/Ag+ in 1.0M TBABF4 / ACN
0 1000 2000 3000 4000
20
30
40
50
60
70
80
ECP-Black at 550 nm
Tra
ns
mit
tan
ce
%
Time (ms)
Bleach Color Bleach Color

131
Table 5-1. Summary of ECP transmittance contrast for ECP-Magenta, -Green, and -Black. Transmittance contrasts monitored when the potential square-waves between the extreme states were held for 5s, 1s, 0.5s, 0.2s, and 0.1s.
Transmittance Contrast (% ΔT) Polymer [a] 5s 1s 0.5s 0.2s
ECP-Magenta (545 nm) 50 48.8 48.4 39
ECP-Green (443 nm) 44 41 40 30
ECP-Green (682 nm) 44.4 43 41.6 33
ECP-Black (550 nm) 50 49.5 48.5 40
[a] All polymer films were sprayed-cast to an absorbance of 0.7 a.u. at λmax
Table 5-2. Summary of ECP switching time for ECP-Magenta, -Green, and -Black. Switching times tabulated at t98%, t95%, t90%, t75%, t50%, and t25% for colored to bleached and bleached to colored transitions.
Polymer [a] Time (ms)
Colored to Bleached Bleached to Colored
t98% t95% t90% t75% t50% t25% t98% t95% t90% t75% t50% t25%
ECP-Magenta 545 nm
400 330 270 190 110 60
680 500 350 210 150 100
ECP-Green 443 nm
400 330 275 200 125 60
340 320 300 260 200 150
ECP-Green 682 nm
420 330 260 180 110 60
330 320 300 260 210 160
ECP-Black 550 nm
480 400 330 230 160 100
570 500 440 370 290 190
[a] All polymer films were sprayed-cast to an absorbance of 0.7 a.u. at λmax
Table 5-1 features the level of transmittance contrast attained at a specific
switching rate. While the full and complete switch was achieved within 5 s for all ECPs,
a significant trend observed is the high level of transmittance contrast retained when
switching every 0.5 s. Using 5 seconds as the point of reference for a full switch, the
polymers were able to retain over 93% of the optical contrast when switched every
second. At a switching time of 0.5 s (10x faster than the full switch), the polymers
retained over 90% of the transmittance contrast. Again, it is important to remember that
these small percent transmittance differences are rather imperceptible to the human

132
eye. Although, at times shorter than the 0.5 s mark, the optical contrast starts to
steadily decline, while the polymers remaining responsive and demonstrating % ΔT on
the range of 14 – 40 %T. Even at the 0.1 s switch time, ECP-Magenta remarkably
displayed an optical contrast of 24% ΔT.
Furthermore, Table 5-2 highlights the times in which a specific percentage of the
transmittance is reached. The times were calculated at several different contrast levels
to illustrate the interplay of switching speed and transmittance – specifically at 98%,
95%, and 90% of the full optical contrast, to probe a region of perceived full optical
change; 75% and 50% of the full optical contrast, where the bulk of electrochromism
occurs; and finally the lower extreme of 25% of the full optical contrast to realize how
fast the ECPs can respond. The majority of the transmittance contrast was reached
within the 250 ms time frame (i.e. at 90% of the full contrast) for ECP-Magenta, ECP-
Green, and ECP-Black, and the 98% contrast levels were achieved in less than 680 ms
for both the coloring and bleaching processes of all polymers. As the bulk of the
electrochromic change (75% and 50% contrast) occurred between 150 ms – 370 ms,
this is the time frame in which most of the color change is noticeable. Finally, video rate
was nearly accomplished at the 25% contrast level where ECP-Magenta exhibited a 60
ms coloring response time. Certainly parameters such as film morphology and
doping/dedoping processes at the film–electrolyte interface will need optimization to
improve the optical contrast without sacrificing the switching speed.
Chapter Summary
The need of an electronic spectroscopy technique to study electrochromic
polymers in light of their rapid switching speed has prompted the enhanced in-situ
electrochemical and spectroscopy coupled instrumentation reported in Chapter 5. This

133
introduces a new methodology to investigate electrochromic materials by associating a
time parameter with a specific spectrum during the electrochromic transition. As such,
the technique has enabled (i) accurate measurements of fast polymer electrochromes,
(ii) simultaneous analyses of transmittance at multiple wavelengths as a function of
time, and (iii) the ability to detect intermediate color tones during an electrochromic
switch and the times associated with them. Using this method to probe a series of
solution processable electrochromic polymers, ECP-Magenta, ECP-Green, and ECP-
Black, the response times were determined on the range of 400 to 700 ms with high
transmittance contrast. ECP-Green was analyzed at both peak wavelengths
simultaneously to demonstrate similar bleaching properties for both optical transitions.
In addition, spectra of ECP-Black indicated the black polymer film to switch through to
an intermediate green tone before bleaching out in the transmissive state. While the
capabilities of the electronic spectroscopy were demonstrated with electrochromic
polymers, analysis of other rapidly switching electrochromic materials such as organic
small molecules and inorganic metal oxides can be carried out with this instrumentation.
With advancements in structure-property relationship of polymer electrochromes,
nanostructure templating of metal oxides, as well as optimization of doping-dedoping
processes, we envision the 50 ms milestone response time for electrochromic materials
will be realized for video display applications.

134
CHAPTER 6 CONCLUSIONS AND FUTURE WORK
Research and development of conjugated polymer electronic devices represent
many exciting new frontiers. Conjugated polymers offer a broad range of attractive
properties that have stimulated fundamental and applied research for chemists,
physicists, and engineers. The application of conjugated polymers in low-cost, flexible,
and lightweight organic electronic device prototypes is a reality, and continued
discoveries and optimizations will bring them closer to commercialization.
Electrochemical Supercapacitors
In this dissertation, Type I supercapacitors were demonstrated with electron-rich
PProDOT-Me2 and PBEDOT-isoindigo electrodes. Both electroactive materials were
prepared electrochemically on gold/Kapton substrates, after which their voltage
windows and capacitances were analyzed via cyclic voltammetry. Low operating voltage
windows were observed in Type I PBEDOT-isoindigo systems relative to Type I
PProDOT-Me2 and other Type I CP-based ESCs.
To improve the voltage window, PBEDOT-isoindigo electrodes were employed in
Type III cells. In comparison to Type I ESCs, the voltage range increased over two-fold;
however, electrochemical instability limited long-term cycling. The need to further
improve the voltage window with the use of Type III cells led to the modular assembly of
ESCs. The fabrication of module ESCs was accomplished by connecting multiple Type
I ESCs in series and in parallel, which respectively enhanced the voltage range and
device capacitance.
Ultimately, we envision electrochemical supercapacitors, while maintaining their
flexible and lightweight architecture, as rollable and stackable devices that can meet the

135
power and energy needs of space-limited applications. The ability to process highly
capacitive, conjugated polymers will allow roll-to-roll production of modular ESCs. As
such, while numerous conducting polymers can be utilized in supercapacitor modules,
highly conductive, electrochemically and mechanically stable conjugated polymers are
ideal.
Future research in conjugated polymer-based electrochemical supercapacitors
should also focus on improving the film capacitance and power and energy densities. In
my opinion, the following ideas are promising: (1) development of conjugated polymer
with side-chain electroactive groups and (2) incorporation of high surface area
electrodes into CP-based ESCs. Abruna recently introduced a hybrid PEDOT with
pendant thioether functionalities as redox and charge-storing sites.181,182 The proposed
concept is to improve the energy densities while maintaining the high switching rate.
Independent of Abruna’s reports, we also investigated pendant electroactive groups
based on ProDOT for enhanced charge storage. The concept was to electropolymerize
the monomer and the dimer analogues to afford the polymers shown in Figure 6-1, and
to extend the capacitance with various pendant phenyl groups.
Figure 6-1. Proposed Poly(ProDOT) with various redox active pendant groups for enhanced charge storage.

136
Although our electrochemical results were irreproducible and inconclusive, I believe the
proper selection of pendant groups, such as naphthalene or oligothiophenes, will
demonstrate enhanced charge storage.
High surface electrodes, such as carbon foam, nickel foam, and single-walled
carbon nanotubes (SWNT), when combined with the redox capacitance of conjugated
polymers, can improve device performance. Further, if the electrodes are thin, flexible
and mechanically robust, they may have potential for use in modular electrochemical
supercapacitors. At the very least, the supercapacitor volume will increase with high
surface area electrodes. We may eventually move away from our lamination
encapsulation method and use a heat sealing and vacuum sealing pouch for device
construction.
Electrochromic Devices
In this work, black-to-transmissive electrochromic windows based on black
electrochromes as the working electrode and minimally-color changing polymer as the
counter material were demonstrated with transmittance contrasts between 31 and 38 %
T and luminance contrasts between 37 and 47% Y. In the bleached state, the
transmittance and luminance values were 88% T and 80% Y respectively. The switching
speed between the dark and bleached states ranged from 5 to 9 s at the 95%
transmittance contrast, and sub-second at the 50% transmittance contrast.
Since one of the factors that controls switching speed corresponds to the rate at
which counter-ions penetrate through the film, open film morphologies are desirable.
Future work should be focused on creating a porous film to allow fast ion penetration
with the intent of increasing the switching speed. This can be accomplished by

137
incorporating sacrificial additives in the spray-casting solution. By dissolution of
sacrificial additives in the proper solvent, high film porosity may be achieved.
Furthermore, by modifying the potential square-wave technique with a multi-step
voltage profile, we may be able to facilitate rate of ion penetration through the polymer
films. This can be carried out with a short initial voltage step, followed by an
instantaneous drop to the final potential, as illustrated by the voltage profile model in
Figure 6-2.
Figure 6-2. Visual representation of voltage profile waveform. The black line represents the baseline applied potentials, while the red lines represent the voltage spikes.
By employing a large over-potential for a short period, we may be able to rapidly
switch the film and/or device to a high contrast state, and maintain stability by
immediately reducing the potential to one in which the device is fully oxidized or neutral,
yet electrochemically stable.
Chapter 5 introduced a novel electronic spectroscopy method to study rapidly
switching electrochromic polymers. While this technique was applied to conjugated
polymers, other rapidly switching electrochromic materials can also be studied. An
extension of this technique would be to replace the current CCD-array detector with an

138
advanced detector that extends to the NIR so that the kinetics of polaron and bipolaron
formation can be elucidated.

139
LIST OF REFERENCES
(1) Bolto, B. A.; McNeill, R.; Weiss, D. E. Aust. J. Chem. 1963, 16, 1090-1103.
(2) Shirakawa, H.; Louis, E. J.; MacDiarmid, A. G.; Chiang, C. K.; Heeger, A. J. J. Chem. Soc., Chem. Commun. 1977, 578-580.
(3) Chiang, C. K.; Fincher, C. R.; Park, Y. W.; Heeger, A. J.; Shirakawa, H.; Louis, E. J.; Gau, S. C.; MacDiarmid, A. G. Phys. Rev. Lett. 1977, 39, 1098-1101.
(4) Jung, B. J.; Tremblay, N. J.; Yeh, M.-L.; Katz, H. E. Chem. Mater. 2011, 23, 568-582.
(5) Tsao, H. N.; Müllen, K. Chem. Soc 2010, 39, 2372-2386.
(6) Klauk, H. Chem. Soc. Rev. 2010, 39, 2643-2666.
(7) Sasabe, H.; Kido, J. Chem. Mater. 2011, 23, 621-630.
(8) Zuniga, C. a; Barlow, S.; Marder, S. R. Chem. Mater. 2010, 23, 658-681.
(9) Zhong, C.; Duan, C.; Huang, F.; Wu, H.; Cao, Y. Chem. Mater. 2011, 23, 326-340.
(10) McQuade, D. T.; Pullen, A. E.; Swager, T. M. Chem. Rev. 2000, 100, 2537-2574.
(11) Thomas, S. W.; Joly, G. D.; Swager, T. M. Chem. Rev. 2007, 107, 1339-1386.
(12) Heremans, P.; Gelinck, G. H.; M ller, R.; aeg, K.-J.; Kim, D.-Y.; Noh, Y.-Y. Chem. Mater. 2011, 23, 341-358.
(13) Thompson, B. C.; Fréchet, J. M. J. Angew. Chem. Int. Edit. 2008, 47, 58-77.
(14) Walker, B.; Kim, C.; Nguyen, T.-Q. Chem. Mater. 2011, 23, 470-482.
(15) Boudreault, P.-L. T.; Najari, A.; Leclerc, M. Chem. Mater. 2010, 23, 456-469.
(16) Kim, F. S.; Ren, G.; Jenekhe, S. a Chem. Mater. 2010, 23, 682-732.
(17) Facchetti, A. Chem. Mater. 2010, 23, 733-758.
(18) Conzuelo, L. V.; Arias-Pardilla, J.; Cauich-Rodríguez, J. V.; Smit, M. A.; Otero, T. F. Sensors 2010, 10, 2638-2674.
(19) Otero, T. F. J. Mater. Chem. 2009, 19, 681-689.

140
(20) Jager, E. W. H. In Iontronics: Ionic Carriers in Organic Electronic Materials and Devices; Leger, J.; Berggren, M.; Carter, S., Eds.; CRC Press, 2010; 141-159.
(21) Snook, G. a; Kao, P.; Best, A. S. J. Power Sources 2011, 196, 1-12.
(22) Mortimer, R.; Dyer, A; Reynolds, J. Displays 2006, 27, 2-18.
(23) Reddinger, J. L.; Reynolds, J. R. In Advances in Polymer Science; Wegner, G., Ed.; Springer-Verlag: Berlin, 1999; Vol. 145, 57-122.
(24) Skotheim, T. A.; Reynolds, J. R. Handbook of Conducting Polymers; Skotheim, T. A.; Reynolds, J. R., Eds.; 3rd ed.; Taylor and Francis Group, LLC: Boca Raton, FL, 2007.
(25) Heeger, A. J. Synth. Met. 2001, 125, 23-42.
(26) Winter, W. D. In Science and Applications of Conducting Polymers; Salaneck, W. R.; Clark, D. T.; Samuelsen, E. J., Eds.; IOP Publishing Ltd: New York, NY, 1991; 179-186.
(27) Seshadri, V.; Gotzing, G. A. In Organic Photovoltaics: Mechanisms, Materials, and Devices; Sun, S.-S.; Sariciftci, N. S., Eds.; CRC Press / Taylor and Francis: Boca Raton, FL, 2005; pp. 495-527.
(28) Moliton, A.; Hiorns, R. C. Polym. Int. 2004, 53, 1397-1412.
(29) Burroughes, J. H.; Jones, C. A.; Friend, R. H. Nature 1988, 335, 137-142.
(30) Burroughes, J. H.; Bradley, D. D. C.; Brown, A. R.; Marks, R. N.; MacKay, K.; Friend, R. H.; Burns, P. L.; Holmes, A. B. Nature 1990, 347, 539-541.
(31) Mozer, A. J.; Sariciftci, N. S. Handbook of Conducting Polymers; Skotheim, T. A.; Reynolds, J. R., Eds.; Taylor and Francis Group, LLC: Boca Raton, FL, 2007; 10-1.
(32) Beaujuge, P. M.; Ellinger, S.; Reynolds, J. R. Adv. Mater. 2008, 20, 2772-2776.
(33) Mortimer, R. J.; Graham, K. R.; Grenier, C. R. G.; Reynolds, J. R. ACS Appl. Mater. Interfaces 2009, 1, 2269-2276.
(34) Reeves, B. D.; Grenier, C. R. G.; Argun, A. A.; Cirpan, A.; McCarley, T. D.; Reynolds, J. R. Macromolecules 2004, 37, 7559-7569.
(35) Liaw, D.-J.; Wang, K.-L.; Chang, F.-C. Macromolecules 2007, 40, 3568-3574.

141
(36) Wu, C.-G.; Lu, M.-I.; Chang, S.-J.; Wei, C.-S. Adv. Funct. Mater. 2007, 17, 1063-1070.
(37) Charvet, R.; Acharya, S.; Hill, J. P.; Akada, M.; Liao, M.; Seki, S.; Honsho, Y.; Saeki, A.; Ariga, K. J. Am. Chem. Soc. 2009, 131, 18030-18031.
(38) Hsu, J.-C.; Sugiyama, K.; Chiu, Y.-C.; Hirao, A.; Chen, W.-C. Macromolecules 2010, 43, 7151-7158.
(39) Tsai, H.; Xu, Z.; Pai, R. K.; Wang, L.; Dattelbaum, A. M.; Shreve, A. P.; Wang, H.-L.; Cotlet, M. Chem. Mater. 2011, 23 759-761.
(40) Gans, B.-J. de; Duineveld, P. C.; Schubert, U. S. Adv. Mater. 2004, 16, 203-213.
(41) Yoshioka, Y.; Jabbour, G. E. Synth. Met. 2006, 156, 779-783.
(42) Kawase, T. Thin Solid Films 2003, 438-439, 279-287.
(43) irnstock, J.; l ssing, J.; Hunze, A.; Scheffel, M.; St el, M.; Heuser, K.; ittmann, G.; rle, J.; innacker, A. Appl. Phys. Lett. 2001, 78, 3905-3907.
(44) Kopola, P.; Tuomikoski, M.; Suhonen, R.; Maaninen, A. Thin Solid Films 2009, 517, 5757-5762.
(45) Krebs, F. C. Sol. Energy Mater. Sol. Cells 2009, 93, 394-412.
(46) Matyba, P.; Yamaguchi, H.; Eda, G.; Chhowalla, M.; Edman, L.; Robinson, N. D. ACS Nano 2010, 4, 637-642.
(47) Naoi, K.; Morita, M. Electrochem. Soc. Interface 2008, Spring, 44-48.
(48) Winter, M.; Brodd, R. J. Chem. Rev. 2004, 104, 4245-4269.
(49) Novák, P.; Müller, K.; Santhanam, K. S. V.; Haas, O. Chem. Rev. 1997, 97, 207-282.
(50) Simon, P.; Gogotsi, Y. Nat. Mater. 2008, 7, 845-854.
(51) Conway, B. E. Electrochemical Capacitors: Scientific Fundamentals and Technological Applications; Kluwer Academic/Plenum: New York, NY, 1999.
(52) Lota, K.; Khomenko, V.; Frackowiak, E. J. Phys. Chem. Solids 2004, 65, 295-301.
(53) Zhou, C.; Kumar, S.; Doyle, C. D.; Tour, J. M. Chem. Mater. 2005, 17, 1997-2002.

142
(54) Hughes, M.; Chen, G. Z.; Shaffer, M. S. P.; Fray, D. J.; Windle, A. H. Chem. Mater. 2002, 14, 1610-1613.
(55) Peng, C.; Snook, G. A.; Fray, D. J.; Shaffer, M. S. P.; Chen, G. Z. Chem. Comm. 2006, 4629-4631.
(56) Reynolds, J. R.; Wallace, G. G. J. Electroanal. Chem. 1991, 306, 157-159.
(57) Baker, C. K.; Reynolds, J. R. J. Electroanal. Chem. 1988, 251, 307-309.
(58) Genies, E. M.; Bidan, G.; Diaz, A. F. J. Electroanal. Chem. 1983, 149, 101-104.
(59) Diaz, A. F.; Castillo, J. I.; Logan, J. A.; Lee, W. Y. J. Electroanal. Chem. 1981, 129, 115-117.
(60) Heinze, J.; Frontana-Uribe, B. a; Ludwigs, S. Chem. Rev. 2010, 110, 4724-4771.
(61) Otero, T. F.; Boyano, I. J. Phys. Chem. B 2003, 107, 6730-6738.
(62) Otero, T. F.; Delaretta, E. Synth. Met. 1988, 26, 79-82.
(63) Ruiz, V.; Colina, A.; Heras, A.; Lopez-Palacios, J. Electrochim. Acta 2004, 50, 59-61.
(64) Meerholz, K.; Heinze, J. Synth. Met. 1993, 57, 5040-5045.
(65) Bof Bufon, C. C.; Vollmer, J.; Heinzel, T.; Espindola, P.; John, H.; Heinze, J. J. Phys. Chem. B 2005, 109, 19191-19199.
(66) Zhou, M. Electrochim. Acta 1999, 44, 1733-1748.
(67) Xia, J.; Masaki, N.; Lira-Cantu, M.; Kim, Y.; Jiang, K.; Yanagida, S. J. Phys. Chem. C 2008, 112, 11569-11574.
(68) Patra, S.; Barai, K.; Munichandraiah, N. Synth. Met. 2008, 158, 430-435.
(69) Melato, A. L.; Mendonça, M. H.; Abrantes, L. M. J. Solid State Chem. 2008, 13, 417-426.
(70) Bund, A.; Neudeck, S. J. Phys. Chem. B 2004, 108, 17845-17850.
(71) Poverenov, E.; Li, M.; Bitler, A.; Bendikov, M. Chem. Mater. 2010, 22, 4019-4025.
(72) Wu, C.-G.; Lin, Y.-C.; Wu, C.-E.; Huang, P.-H. Polymer 2005, 46, 3748-3757.

143
(73) McCullough, R. D.; Lowe, R. D.; Jayaraman, M.; Anderson, D. L. J. Org. Chem. 1993, 58, 904-912.
(74) Iovu, M. C.; Sheina, E. E.; Gil, R. R.; McCullough, R. D. Macromolecules 2005, 38, 8649-8656.
(75) Sheina, E. E.; Liu, J.; Iovu, M. C.; Laird, D. W.; McCullough, R. D. Macromolecules 2004, 37, 3526-3528.
(76) Carsten, B.; He, F.; Son, H. J.; Xu, T.; Yu, L. Chem. Rev. 2011, 111, 1493-528.
(77) Miyaura, N.; Suzuki, A. Chem.. Rev. 1995, 95, 2457-2483.
(78) Wright, S. W.; Hageman, D. L.; McClure, L. D. J. Org. Chem. 1994, 59, 6095-6097.
(79) Brookins, R. N.; Schanze, K. S.; Reynolds, J. R. Macromolecules 2007, 40, 3524-3526.
(80) Beaujuge, P. M.; Amb, C. M.; Reynolds, J. R. Adv. Mater. 2010, 22, 5383-5387.
(81) Mei, J.; Graham, K. R.; Stalder, R.; Reynolds, J. R. Org. Lett. 2010, 12, 660-3.
(82) FUJIFilm USA | Dimatix, http://www.fujifilmusa.com/, (Accessed August 1, 2011)
(83) XPEDX, http://www.xpedx.com/, (Accessed August 1, 2010)
(84) Shim, G. H.; Han, M. G.; Sharp-Norton, J. C.; Creager, S. E.; Foulger, S. H. J. Chem. Mater. 2008, 18, 594-598.
(85) Zotti, G.; Schiavon, G. Synth. Met. 1989, 31, 347-351.
(86) Marque, P.; Roncali, J. J. Phys. Chem. 1990, 94, 8614-8619.
(87) Tourillon, G.; Garnier, F. J. Electroanal. Chem. 1984, 161, 51-53.
(88) Chao, F.; Costa, M. Synth. Met. 1990, 39, 97-100.
(89) Feldberg, S. W. J. Am. Chem. Soc. 1984, 106, 4671-4674.
(90) Mermilliod, N.; Tanguy, J.; Petiot, F. J. Electroanal. Chem. 1986, 133, 1073-1075.
(91) Vasilyeva, S. V.; Unur, E.; Walczak, R. M.; Donoghue, E. P.; Rinzler, A. G.; Reynolds, J. R. ACS Appl. Mater. Interfaces 2009, 1, 2288-2297.

144
(92) White, C. M.; Gillaspie, D. T.; Whitney, E.; Lee, S.; Dillon, A. C. Thin Solid Films 2009, 517, 3596-3599.
(93) Zheng, J. P.; Jow, T. R. J. Power Sources 1996, 62, 155-159.
(94) Irvin, J. A.; Irvin, D. J.; Stenger-Smith, J. D. In Handbook of Conducting Polymers; Skotheim, T. A.; Reynolds, J. R., Eds.; CRC Press / Taylor and Francis: Boca Raton, FL, 2007.
(95) Franke, E. B.; Trimble, C. L.; Hale, J. S.; Schubert, M.; Woollam, J. A.; Introduction, I. J. Appl. Phys. 2000, 88, 5777-5779.
(96) Topart, P. Thin Solid Films 1999, 352, 243-248.
(97) Rose, T.; Dantonio, S.; Jillson, M.; Kon, A.; Suresh, R.; Wang, F. Synth. Met. 1997, 85, 1439-1440.
(98) Dyer, A. L.; Grenier, C. R. G.; Reynolds, J. R. Adv. Funct. Mater. Materials 2007, 17, 1480-1486.
(99) Ford, J. E.; A.Walker, J.; Greywall, D. S.; Goossen, K. W. J. LightwaveTechnol. 1998, 16, 1663-1665.
(100) Ward, M. D. J. Solid State Electrochem 2005, 9, 778-780.
(101) Neff, V. D. J. Am. Chem. Soc. 1978, 125, 886-889.
(102) Itaya, K.; Ataka, T.; Toshima, S. J. Am. 1982, 104, 4767-4772.
(103) Granqvist, C. G. Handbook of Inorganic Electrochromic Materials; Elsevier: Amsterdam, 1995.
(104) Gillaspie, D. T.; Tenent, R. C.; Dillon, A. C. J. Mater. Chem. 2010, 20, 9585-9597.
(105) Beaujuge, P. M.; Reynolds, J. R. Chem. Rev. 2010, 110, 268-320.
(106) Amb, C. M.; Dyer, A. L.; Reynolds, J. R. Chem. Mater. 2011, 23, 397-415.
(107) Dyer, A. L.; Thompson, E. J.; .Reynolds, J. R. ACS Appl. Mater. Interfaces 2011, 3, 1787-1795.
(108) Amb, C. M.; Kerszulis, J. A.; Thompson, E. J.; Dyer, A. L.; Reynolds, J. R. Polymer Chemistry 2011, 2, 812-814.
(109) Armargeo, W., L., F.; Chai, C., L., L. Purification of Laboratory Chemicals; Elsevier Science: Burlington, Massachusetts, 2003.

145
(110) Welsh, D. M.; Kumar, A.; Meijer, E. W.; Reynolds, J. R. Adv. Mater. 1999, 11, 1379-1382.
(111) Thompson, B. C.; Schottland, P.; Zong, K.; Reynolds, J. R. Chem. Mater. 2000, 12, 1563-1571.
(112) CIE No 15, 2004, Colorimetry, 3rd Edition; Commission Internationale de IʼEclairage: Vienna, Austria, 2004.
(113) Adobe. http://dba.med.sc.edu/price/irf/Adobe_tg/models/cielab.html, (Accessed August 2, 2011)
(114) Conway, B. E.; Birss, V.; Wojtowicz, J. J. Power Sources 1997, 66, 1-14.
(115) Kaner, R. B.; MacDiarmid, A. G. J. Chem. Soc., Faraday Trans. 1984, 80, 2109.
(116) Kaner, R. B.; MacDiarmid, A. G. Synth. Met. 1986, 14, 3-12.
(117) MacDiarmid, A. G.; Kaner, R. B.; Mammone, R. J.; Heeger, A. J. J. Electrochem. Soc. 1981, 128, 1651-1660.
(118) Gottesfeld, S.; Redondo, A.; Feldberg, S. W. J. Electrochem. Soc. 1987, 134, 271-273.
(119) Rudge, A.; Davey, J.; Raistrick, I.; Gottesfeld, S.; Ferraris, J. P. J. Power Sources 1994, 47, 89-107.
(120) Rudge, A.; Raistrick, I.; Gottesfeld, S. Electrochim. Acta 1994, 39, 273-287.
(121) Carlberg, J. C.; Inganas, O. J. Electrochem. Soc. 1997, 144, L61-L64.
(122) Fusalba, F.; Bélanger, D. J. Phys. Chem. B 1999, 103, 9044-9054.
(123) Fusalba, F.; El Mehdi, N.; Breau, L.; Bélanger, D. Chem. Mater. 1999, 11, 2743-2753.
(124) Ghosh, S.; Inganas, O. Adv. Mater. 1999, 11, 1214-1218.
(125) Gurunathan, K.; Murugan, A. V.; Marimuthu, R.; Mulik, U. P.; Amalnerkar, D. P. Mater. Chem. Phys. 1999, 61, 173-191.
(126) Mastragostino, M.; Arbizzani, C.; Paraventi, R.; Zanelli, A. J. Electrochem. Soc. 2000, 147, 407-409.
(127) Talbi, H.; Just, P.; Dao, L. H. J. Appl. Electrochem. 2003, 33, 465-473.

146
(128) Ryu, K. S.; Kim, K. M.; Park, Y. J.; Park, N.-G.; Kang, M. G.; Chang, S. H. Solid State Ionics 2002, 152-153, 861-866.
(129) Sivakkumar, S.; Saraswathi, R. J. Power Sources 2004, 137, 322-328.
(130) Arbizzani, C.; Mastragostino, M.; Meneghello, L. Electrochim. Acta 1996, 41, 21-26.
(131) Moon, D.-K.; B., P. A.; Hall, H. K.; Huntoon, T.; Calvert, P. D. Macromolecules 1995, 28, 6205-6210.
(132) Laforgue, A.; Simin, P.; Sarrazin, C.; Fauvarque, J.-F. J. Power Sources 1999, 80, 142-148.
(133) Frackowiak, E.; Khomenko, V.; Jurewicz, K.; Lota, K.; Béguin, F. J. Phys. Chem. Solids 2006, 153, 413-418.
(134) Patra, S.; Munichandraiah, N. J. Appl. Polym. Sci. 2007, 106, 1160-1171.
(135) Wang, J.; Xu, Y.; Chen, X.; Du, X. J. Power Sources 2007, 163, 1120-1125.
(136) Gaupp, C. L.; Welsh, D. M.; Rauh, R. D.; Reynolds, J. R. Chem. Mater. 2002, 14, 3964-3970.
(137) Gaupp, C. L.; Zong, K.; Schottland, P.; Thompson, B. C.; Thomas, C. A.; Reynolds, J. R. Macromolecules 2000, 33, 1132-1133.
(138) Stenger-Smith, J. D.; Webber, C. K.; Anderson, N.; Chafin, A. P.; Zong, K.; Reynolds, J. R. J. Electrochem. Soc. 2002, 149, A973-A979.
(139) Stenger-Smith, J. D.; Guenthner, A.; Cash, J.; Irvin, J. A.; Irvin, D. J. J. Electrochem. Soc. 2010, 157, A298-A306.
(140) Ferraris, J. P.; Eissa, M. M.; Brotherston, I. D.; Loveday, D. C. Chem. Mater. 1998, 10, 3528-3535.
(141) Fusalba, F.; Ho, H. A.; Breau, L.; Bélanger, D. Chem. Mater. 2000, 12, 2581-2589.
(142) Soudan, P.; Ho, H. A.; Breau, L.; Belanger, D. J. Electrochem. Soc. 2001, 148, A775-A781.
(143) H ringer, .; Novak, P.; Haas, O.; Piro, .; Pham, M.-C. J. Electrochem. Soc. 1999, 146, 2393-2396.
(144) Stalder, R.; Mei, J.; Reynolds, J. R. Macromolecules 2010, 43, 8348-8352.
147
(145) Groenendaal, L.; Zotti, G.; Aubert, P.-H.; Waybright, S. M.; Reynolds, J. R. Adv. Mater. 2003, 15, 855-879.
(146) Groenendaal, L.; Jonas, F.; Freitag, D.; Pielartzik, H.; Reynolds, J. R. Adv. Mater. 2000, 12, 481-494.
(147) Prasad, K. R.; Munichandraiah, N. J. Power Sources 2002, 112, 443-451.
(148) Gaupp, C. L.; Reynolds, J. R. Macromolecules 2003, 36, 6305-6315.
(149) Kumar, A.; Welsh, D. M.; Morvant, M. C.; Piroux, F.; Abboud, K. A.; Reynolds, J. R. Chem. Mater. 1998, 10, 896-902.
(150) Stalder, R.; Mei, J.; Subbiad, J.; Grand, C.; Estrada, L. A.; So, F.; Reynolds, J. R. Macromolecules 2011, ASAP.
(151) Fusalba, F.; Gouerec, P.; Villers, D.; Belanger, D. J. Electrochem. Soc. 2001, 148, A1-A6.
(152) Laforgue, A. J. Power Sources 2011, 196, 559-564.
(153) Liu, D. Y.; Reynolds, J. R. ACS Appl. Mater. Interfaces 2010, 2, 3586-93.
(154) Yata, S.; Hato, Y.; Sakurai, K.; Osaki, T.; Tanaka, K.; Yamabe, T. Synth. Met. 1987, 18, 645-648.
(155) Staiti, P.; Lufrano, F. J. Electrochem. Soc. 2005, 152, A617-A621.
(156) Monk, P. M. S.; Mortimer, R. J.; Rosseinsky, D. R. Electrochromism and Electrochromic Devices; Cambridge University Press: New York, 2007.
(157) Amb, C. M.; Dyer, A. L.; Reynolds, J. R. Chem. Mater. 2011, 23, 397-415.
(158) Beaujuge, P. M.; Amb, C. M.; Reynolds, J. R. Acc. Chem. Res. 2010, 43, 1396-1407.
(159) Unur, E.; Beaujuge, P. M.; Ellinger, S.; Jung, J.; Reynolds, J. R. Chem. Mater. 2009, 21, 5145-5153.
(160) Beaujuge, P. M.; Ellinger, S.; Reynolds, J. R. Nat Mater 2008, 7, 795-799.
(161) Shi, P.; Amb, C. M.; Knott, E. P.; Thompson, E. J.; Liu, D. Y.; Mei, J.; Dyer, A. L.; Reynolds, J. R. Adv. Mater. 2010, 22, 4949-4953.
(162) Takahashi, Y.; Oyaizu, K.; Honda, K.; Nishide, H. J. Photopolym. Sci. Technol. 2007, 20, 29.
148
(163) Vasilyeva, S. V.; Unur, E.; Walczak, R. M.; Donoghue, E. P.; Rinzler, A. G.; Reynolds, J. R. ACS Appl. Mater. Interfaces 2009, 1, 2288-2297.
(164) Vasilyeva, S. V.; Beaujuge, P. M.; Wang, S.; Babiarz, J. E.; Ballarotto, V. W.; Reynolds, J. R. ACS Appl. Mater. Interfaces 2011, 3, 1022.
(165) Padilla, J.; Otero, T. F. Electrochem. Commun. 2008, 10, 1.
(166) Beaujuge, P. M.; Vasilyeva, S. V.; Ellinger, S.; McCarley, T. D.; Reynolds, J. R. Macromolecules 2009, 42, 3694-3706.
(167) Park, S. Y.; Lee, J. M.; Noh, C.; Son, S. U. J. Mater. Chem. 2009, 19, 7959-7964.
(168) Wu, W.; Liao, W.; Chen, J.; Wu, J. ChemPhysChem 2010, 11, 3306-3312.
(169) Brezesinski, T.; Rohlfing, D. F.; Sallard, S.; Antonietti, M.; Smarsly, B. M. Small 2006, 2, 1203.
(170) Cipran, A.; Argun, A. A.; Grenier, C. R. G.; Reeves, B. D.; Reynolds, J. R. J. Mater. Chem. 2003, 13, 2422-2428.
(171) Sonmez, G.; Sonmez, H. B.; Shen, C. F. K.; Jost, R. W.; Rubin, Y.; Wudl, F. Macromolecules 2005, 38, 669-675.
(172) Beaujuge, P. M.; Ellinger, S.; Reynolds, J. R. Adv. Mater. 2008, 20, 2772-2776.
(173) Icli, M.; Pamuk, M.; Algi, F.; Onal, A. M. Org. Elec. 2010, 11, 1255-1260.
(174) Miomandre, F.; Bussac, M. N.; Zuppiroli, L. Chem. Phys. 2000, 255, 291-300.
(175) Huang, J.; Hsu, C.; Hu, C.; Chu, C.; Ho, K. ACS Appl. Mater. Interfaces 2010, 2, 351-359.
(176) Plieth, W.; Bund, A.; Rammelt, U.; Neudeck, S.; Duc, L. Electrochim. Acta 2006, 51, 2366-2372.
(177) Padilla, J.; Seshadri, V.; Otero, T. F.; Sotzing, G. A. J. Electroanal. Chem. 2007, 609, 75-84.
(178) Winther-Jensen, O.; Desai, S.; Shepherd, R. L.; Innis, P. C.; Winther-Jensen, B.; Forsyth, M.; Wallace, G. G.; MacFarlane, D. R. Electrochem. Commun. 2010, 12, 1505-1508.
(179) Winther-Jenson, B.; Forsyth, M.; West, K.; Andreasen, J. W.; Bayley, P.; Pas, S.; MacFarlane, D. R. Polymer 2008, 49, 481-487.

149
(180) Ohta, N.; Robertson, A. Colorimetry: Fundamentals and Applications; John Wiley & Sons, Ltd. West Sussex, 2005.
(181) Lowe, M. A.; Yasuyuki, K.; Henderson, J. C.; Abruna, H. D. Electrochem. Commun. 2011, 13, 462.
(182) Burkhardt, S. E.; Conte, S.; Rodriguez-Calero, G. G.; Lowe, M. A.; Qian, H.; Zhou, W.; Gao, J.; Hennig, R. G.; Abruna, H. D. J. Mater. Chem. 2011, 21, 9553.
(183) Thompson, B. Ph.D. Thesis, University of Florida, 2005.
(184) Clevios, http://www.clevios.com/index.php?page_id=602, (Accessed August 15, 2011)
(185) Kanani, N. Electroplating: Basic Principles, Processes, and Practice; Elsevier: New York, 2004.

150
BIOGRAPHICAL SKETCH
David Y. Liu was born in Taipei, Taiwan in September of 1983. He spent most of
his early childhood in Taiwan, before moving to Orlando, Florida in 1990. After spending
six years in Florida, David and his family moved to Raleigh, North Carolina. Once in NC,
David attended Leesville Middle and High School. In the fall of 2002, David began his
undergraduate education at the University of North Carolina at Chapel Hill (UNC-CH) as
a chemistry major. In the summer of 2004, he began working as a technician in a
biochemistry lab with Professor Andrew Lee. In 2005, he began conducting
undergraduate research with Professor Muhammad Yousaf on self-assembled
monolayers. David graduated with a bachelor of science in chemistry from UNC in the
spring of 2006. In the fall of 2006, David returned back to Florida and joined Professor
John Reynolds' research group. He received his Ph.D. in chemistry from the University
of Florida in December of 2011.