Crescimento em altura para Pinus elliottii Engelm originado por ...
Upload
mervyn-shepherdCategory
view
212download
0
Abstract Targeting between-species effects for
improvement in synthetic hybrid populations derived
from outcrossing parental tree species may be one
way to increase the efficacy and predictability of
hybrid breeding. We present a comparative analysis
of the quantitative trait loci (QTL) which resolved
between from within-species effects for adventitious
rooting in two populations of hybrids between Pinus
elliottii and P. caribaea, an outbred F1 (n=287) and
an inbred-like F2 family (n=357). Most small to
moderate effect QTL (each explaining 2–5% of
phenotypic variation, PV) were congruent (3 out of 4
QTL in each family) and therefore considered within-
species effects as they segregated in both families. A
single large effect QTL (40% PV) was detected
uniquely in the F2 family and assumed to be due to a
between-species effect, resulting from a genetic locus
with contrasting alleles in each parental species.
Oligogenic as opposed to polygenic architecture was
supported in both families (60% and 20% PV
explained by 4 QTL in the F2 and F1 respectively).
The importance of adventitious rooting for adaptation
to survive water-logged environments was thought in
part to explain oligogenic architecture of what is
believed to be a complex trait controlled by many
hundreds of genes.
Keywords Marker-aided selection Æ Rooting
percentage Æ Stem cuttings Æ Synthetic hybrids
Introduction
Species hybrids of Populus, Eucalypt, Salix, Larix
and Pinus dominate plantation forestry programs in a
small number of situations throughout the world
where they outperform parental taxa because of
hybrid complementarily or F1 heterosis. Although
breeding for hybrids often proceeds successfully with
M. Shepherd (&) Æ S. Huang Æ P. Eggler Æ M. Cross ÆR. Henry
Cooperative Research Centre for Sustainable Production
Forestry, Centre for Plant Conservation Genetics,
Southern Cross University, P.O. Box 157, Lismore 2480
NSW, Australia
e-mail: [email protected]
S. Huang
College of Forestry, South China Agricultural University,
Guangzhou 510642, P. R. China
G. Dale
Tree Crop Technologies Pty Ltd, Queensland 4065,
Australia
M. Dieters
Cooperative Research Centre for Sustainable Production
Forestry, Queensland Forestry Research Institute, Locked
Bag No. 16, Fraser Road, Gympie, Queensland 4570,
Australia
M. Dieters
School of Land and Food Science, NRAVS,
University of Queensland, Queensland 4067, Australia
Mol Breeding (2006) 18:11–28
DOI 10.1007/s11032-006-9006-5
123
Congruence in QTL for adventitious rooting in Pinuselliottii · Pinus caribaea hybrids resolves between andwithin-species effects
Mervyn Shepherd Æ Shaowei Huang Æ Peter Eggler ÆMichael Cross Æ Glenn Dale Æ Mark Dieters ÆRobert Henry
Received: 12 September 2005 / Accepted: 26 February 2006 / Published online: 29 June 2006
� Springer Science+Business Media B.V. 2006

little knowledge of the genetic basis of hybrid com-
plementarily or heterosis, a knowledge of genetic
architecture, i.e. the numbers of genes, the relative
magnitudes of effects, gene action and interactions,
nonetheless, would be valuable for predicting genetic
gains and successful hybrid combinations, as well as
optimizing breeding and marker-aided selection
(MAS) strategies (Kerr et al. 2004b; Vaillancourt
et al. 1995; Bradshaw and Grattapaglia 1994).
Population improvement of conifers and other
forest trees generally focuses on quantitative traits
and relies largely on gains from additive components
of genetic variation (Zobel and Talbert 1984; Eld-
ridge et al. 1994). The importance of dominance and
other interaction effects in heterosis indicates that
breeding strategies based on additive genetic variance
alone are unlikely to be optimal for many, if not most,
interspecific hybrids (Bradshaw and Grattapaglia
1994; Dieters et al. 1997; Rieseberg et al. 2000).
Targeting between-species effects for selection
may be one way to improve the efficacy and pre-
dictability of breeding with synthetic hybrid popula-
tions. Synthetic hybrids are new breeding populations
based on two or more species (or breeds) that offer a
heterotic advantage and/or a combination of favour-
able characters from the foundation species. Simu-
lation studies of synthetic hybrid populations of some
trees have found that they offer the highest amounts
of genetic gain per year over a range of genetic
structures (Kerr et al. 2004a). Depending on the
generation, genetic variances of hybrid families
derived from parental populations of outcrossing
species will be affected by the loci that segregate due
to the allelic variation both between and within
individuals in the parental species populations (i.e.
within-species effects), as well as effects that are
fixed for contrasting alleles between the species
(between-species effects). The genetic variance
within an F1 family will be affected by segregation at
genetic loci that are heterozygous in the individual
parents (within-species effects) (Bradshaw and
Grattapaglia 1994). The contribution of within-
species effects to variation amongst F1 hybrids is of
practical importance to breeders in species were
hybrid are selected for clonal deployment (Bradshaw
and Grattapaglia 1994). It is variation due to
between-species effects that should be the basis of
predictable F1 heterosis because it is due to fixed
differences between parental species (Bradshaw and
Stettler 1995; Forbes et al. 2004). In advanced gen-
eration hybrid breeding of trees it may be advanta-
geous to increase the frequency and re-fix alleles
from the favourable species in breeding populations.
Quantitative trait loci (QTL) analysis has the
potential to resolve the sources of variance into their
individual underlying genetic loci, and to paramete-
rise gene action and interaction effects (Stuber 1989).
From a large number of QTL studies of interspecific
F1 hybrids of forest trees, there is emerging consensus
that within-species effects are typically small to
moderate in size (Individual QTL explaining 1–5% of
phenotypic variation (PV) (reviewed in Shepherd and
Jones 2005). Between-species effects detected in
interspecific F2 plant hybrids on the other hand, are
typically much larger (often from 20 to 50% PV but
as much as 88%), because they may result from loci
that are divergent in each species because of adap-
tation, speciation or domestication (Bradshaw and
Stettler 1995; Bradshaw et al. 1995; Paterson et al.
1991; Doebley and Stec 1991). Few studies have
provided a comparative analysis of these different
sources of genetic variance in hybrid plant popula-
tions and little is known about the gene action and
relative importance of these effects in different
hybrid generations. A comparative analysis of QTL
contributing to variance in both an F1 and F2 may be
one way of resolving within and between-species
effects, because QTL that are congruent in F1 and F2
populations should correspond to within-species
effects, whereas loci that are unique to the F2 popu-
lation are potential between-species effects.
We are interested in genetic improvement of
vegetative propagation characters of the hybrid
between Pinus elliottii Engelm var. elliottii Little and
Dorman and P. caribaea Morelet var. hondurensis
Barrett and Golfari. Plantation forestry in subtropical
and tropical Australia is primarily based on exotic
pines, and the hybrid is the most suitable taxon for the
majority of plantation estate on the coastal areas of
central and south-east Queensland (Haines 2000).
The F1 hybrid is difficult and expensive to propagate
by seed hence production of the hybrid is based on a
rooted cutting system (Walker et al. 1996). Since
2002, the annual planting requirements have been
supplied from hybrid stock consisting of tested
clones. Rooting success of cuttings has a major im-
pact on the cost of production. Production is currently
limited by the range of genotypes that can be
12 Mol Breeding (2006) 18:11–28
123

deployed because of low rooting rates, and matura-
tion effects that cause a decline in rooting as stock
plants age (Shepherd et al. 2005).
Here we report on a comparative analysis of QTL
in two unrelated families, an outbred F1 (herein F1)
and inbred-like F2 (herein F2). The F1 family was
typical of those used in the clonal forestry program.
The F2 family was an experimental population, gen-
erated from the selfing of an interspecific F1, and
represented the type of material that may arise from
synthetic hybrid breeding population that will be used
for future breeding (Brawner et al. 2005). We were
interested in resolving between- from within-species
effects and characterizing their relative contributions
to genetic variances. A high level of congruency in
QTL of small-moderate effect size in the two families
validated most QTL detected and was believed to
identify within-species effects, whereas a single large
effect QTL unique to the F2 was believed to be a
between-species effect. QTL parameters for between-
and within-species effects were compared and the
implications of QTL architecture for breeding and
MAS are considered.
Methods
Taxa and populations
This study comprised two hybrid families between
Pinus elliottii var. elliottii Engelm. and P. caribaea
var. hondurensis Morlet (Genus Pinus subgenus
Pinus section Pinus subsection Australes Louden),
(Little and Critchfield 1969) (Table 1). The first
family was an F2 generated by self-pollinating a
select F1 hybrid individual (eh43) from the interspe-
cific cross between a P. elliottii seed parent (1ee1-
015) and a P. caribaea pollen donor (1ch6-029). The
second family, an F1, was generated from a con-
trolled-pollination of a select P. elliottii (2ee1-102)
maternal parent with pollen from a select P. caribaea
(1ch1-063) (Table 1). Although the species’ parents
of each cross were not related, they originated from
the same natural provenance/region. Both P. elliottii
individuals originated from bulked seedlots mainly
collected from north east Florida and south east
Georgia regions (Nikles 1996). The P. caribaea
parents were both selections from the Mountain Pine
Ridge provenance (Belize).
Pinus elliottii (slash pine) occurs in south eastern
USA from South Carolina in the north, south to
central Florida and west to Louisiana (Little 1971). It
habits mainly low lying coastal plains in sandy soils
which can remain water logged for long periods
during the year (Wakeley 1954). Pinus caribaea
variety hondurensis occurs discontinuously in Central
America, from about 18�15 N in parts of the uplands
of Quintana Roo (Mexico) to about 12� N in Nica-
ragua including, Guatemala, Belize, as well as
occurring in Honduras and its coastal islands (Farjon
and Styles 1997; Dvorak et al. 2000). Despite its
discontinuous distribution, varieties of P. caribaea
have similar levels of isozyme variability to contin-
uously distributed species of outcrossing conifers
(Zheng and Ennos 1999). The early Queensland
Department of Primary Industries Forestry (QDPIF)
breeding populations of P. caribaea var. hondurensis
were largely comprised of material from an upland
region of Belize (Mountain Pine Ridge provenance)
(Nikles 1996) where It inhabits ridge sites with
shallower soils (Greaves 1978). Pinus elliottii has
Table 1 Pedigree and rooting percentage parameters for subpopulations in the F1 and F2 families
Family GP1a GP2 P1 P2 Family
(n)
Family
rooting
percentage
range
(Min–Max)
(%)
Family
rooting
percentage
(mean–SD)
(%)
SG
(n)
SG
low
(mean–SD)
(%)
SG
high
(mean–SD)
(%)
QTL est.
popn (n)
F2 1ee1-015 1ch6-029 eh43 eh43 357 0–100 56–46 32 0–0 100–0 196
F1 – – 2ee1-102 1ch1-063 287 0–100 58–31 32 0–0 100–0 224
aGP=grandparent; P=parent, SG=selective genotyping population, low and high phenotypic classes for rooting percentage; QTL
Est.=QTL estimation; Popn=population
Mol Breeding (2006) 18:11–28 13
123

greater wind firmness and responds to flooding by
developing adventitious roots more so than either the
hybrid or P. caribaea (Lewty 1990; Anonymous
1977). The two species do not hybridise naturally
because they are allopatric and have asynchronous
flowering times. They cross readily artificially but F1
viability is variable and often low; however, viability
is restored in outcrossed F2 (Righter and Duffield
1951; Nikles 1966; Nikles et al. 1999).
Vegetative propagation and rooting percentage
assessments
Production of seedlings, cuttings and nursery
management of the genetic material used in this
study has been previously reported (Shepherd et al.
2005). In brief, seeds were sown in February 1998
and the seedlings were over wintered in a heated
glasshouse, then planted out in the hedge production
area of the DPIF nursery at Toolara, Queensland in
May 1999. Germination rates were approximately
80% in each family. The total number of ortets
(seedlings) planted was 288 and 408 in the F1 and
F2 families respectively. Cuttings were collected
from the 287 and 356 (F1 and F2 respectively)
surviving, 31 month old ortets in the week com-
mencing 11th September 2000. Sufficient cuttings
were taken to give three replicates of four cuttings
per clone (i.e. a total of 12 cuttings per clone).
Clones were arranged sequentially in trays and in
contiguous replicate blocks within the nursery beds.
Progress of rooting percentage was monitored by
assessing rooting percentage in excess material
managed using identical conditions to that of the
main trial. Assessment was carried out when
approximately 50% of clones in each family had
rooted (19 weeks post-setting in January 2001).
Rooting percentage was recorded as the proportion
of rooted cuttings in each replicate.
A full analysis of genetic determination of rooting
in the hybrids is reported by Shepherd et al. (2005).
The family mean of the F1 was higher than the F2
(Table 1). This was probably due to the effects of
inbreeding depression but may have also been due to
the different genetic backgrounds of each family.
Phenotypic and genetic variances (broad sense heri-
tability) were consistently higher for the F2 than the
F1 (Shepherd et al. 2005)
Genetic maps for Pinus
Microsatellite markers for this study were selected
from a sex- and species-averaged consensus map of
the individual trees P. elliottii var. elliottii (2ee1-102)
and P. caribaea var. hondurensis (1ch1-063) with
some linkage information inferred from a third map
for P. taeda (Zhou et al. 2003) (haploid chromosome
number=12 for all three taxa). The markers chosen
were selected based on their informativeness in the F1
cross of these trees, marker reproducibility and to
achieve a spread of evenly spaced markers along the
map. The consensus map consisted of 91 microsat-
ellite markers distributed on the 13 homeologous and
three parent specific-linkage groups (Appendix 1).
The map covered a total distance of 727.1 cM Kos-
ambi which represents around 43% of Pinus genome
based on map distance of 1700 cM for Pinus taeda
(Remington et al. 1999).
Microsatellite markers
Microsatellite markers for the genetic map were
transferred from related species. A set of 201 Pinus
spp. microsatellite markers (Hicks et al. 1998; Fisher
et al. 1998; Devey et al. 2001Smith and Devey 1994;
Elsik et al. 2000; Auckland et al. 2001; Zhou et al.
2002; Echt and Burns 1999; Soranzo et al. 1998) were
evaluated for transfer to the taxa of interest, P. elliottii
and P. caribaea. One hundred and 20 markers trans-
ferred, but 21 were excluded either due to complex
banding patterns (9) or did not segregate in parents
(13), leaving a set of 97 informative cross-specific
primer-pairs which provided 99 loci for linkage
analysis. In addition two loci, SCUPEE25 and
SCUPCH48 were developed de novo in the parental
taxa. They were isolated from microsatellite enriched
libraries of the two parents according to the method of
(Edwards et al. 1996). The sequences for these prim-
ers were [SCUPCH48] 5¢CAGGTTGAGGCCACCT-
AGA3¢ and 5¢TTAGGCCAAATAATGACAAGAC3¢;and [SCUPEE25] 5¢GAAAATATTATAAGGGAA-
GTTCT3¢ and 5¢GACCGATTAGTATCCTCATA-
CA3¢. The SCUPEE25 locus contains a (CA)9 and
SCUPCH48 contains a (CA)17 repeat.
Microsatellites were amplified using a PCR buffer
containing a final concentration of 20 mM Tris–HCl
(pH 8.4), 50 m KCl (supplied as 10· PCR buffer
14 Mol Breeding (2006) 18:11–28
123

(Invitrogen Life Technologies), 2.0 mM MgCl2,
0.1 mM dNTP (total for 4 dNTPs), 0.02/U/ ll Plati-
num Taq (Invitrogen Life Technologies) and 20 ng of
DNA template in a total volume of 11 ll. The
cycling parameters were those originally reported
with each locus. Thermocycling was carried out on a
Perkin Elmer 9700 thermocycler (Applied Biosys-
tems). The cycling conditions for SCUPCH48 were;
an initial hold of 2 min at 94�C followed by 35 cycles
of 94�C for 0.1 s, 60�C for 30 s, 75�C for 1 min,
followed by a final hold at 75�C for 5 min. The cy-
cling conditions for SCUPEE25 were the same except
that the annealing temperature was 52�C. Each pri-
mer was synthesised with a 5¢ end fluorescent dye by
either Genset Pacific (Lismore, Aust.) or Applied
Biosystems. PCR products were size and dye multi-
plexed post-PCR, for separation by capillary elec-
trophoresis (AB 310 or AB3700 Genetic Analyser;
Applied Biosystems). Alternatively, PCR products
for some primers-pairs were labelled using R110
dUTP (Applied Biosystems).
Linkage analysis
Mating configurations for each locus were deter-
mined from the genotype of the two parents and the
86 F1 hybrid offspring. Markers were coded for
parental or a backcross (hybrid) population for anal-
ysis using JoinMap 3.0 (Van Ooijen and Voorrips
2001). Map construction was iterative, with a pre-
liminary round of grouping and ordering to identify
possible mis-scored data. The map with lowest chi-
square value was used to order loci at each stage
using a grouping at a minimum LOD of 3 and locus
ordering with a maximum Chi-square ‘‘Jump’’ value
of 5 (decrease in Chi-square goodness-of-fit measure
that may accompany the addition of locus to an or-
der). In a second round of ordering, markers that
could not be phased or had insufficient linkage for
ordering were eliminated and the best order re-
established. Parental maps were compared for
apparent order discrepancies and raw data was re-
examined for improbable genotypes (based on the
large chi-square values from the ‘‘genotype proba-
bilities’’ tab sheet in the ‘‘Map’’ node in Joinmap).
At this stage there were two apparent order discrep-
ancies between the parental maps, each on a separate
linkage group. Eliminating 1 or 2 individuals,
respectively, from the data set for each linkage group
exhibiting improbable genotypes, resolved each of
these apparent discrepancies in paternal map order.
A sex- and taxa-averaged consensus map was gen-
erated for homeologous linkage groups identified in
P. elliottii and P. caribaea using the Combine-groups
function of JoinMap 3.0. Marker grouping and
ordering in the two parental maps (P. elliottii and
P. caribaea) was compared to the sex-averaged
P. taeda map (Map 4) (Zhou et al. 2003). Homeol-
ogous linkage groups from the three maps were
aligned visually then examined for synteny and col-
linearity.
Genotyping for the QTL study
DNA extractions
DNA from frozen pine needles or megagametophyte
tissue of seed was extracted using a DNeasy 96 plant
DNA kit (Qiagen, Valencia, CA) using the frozen
tissue protocol with modified described in Shepherd
et al. (2002).
Microsatellite genotyping
All microsatellite markers were amplified with a PCR
buffer containing a final concentration of 20 mM
Tris–HCl (pH 8.4), 50 mM KCl (supplied as 10·PCR buffer (Invitrogen Life Technologies)), 2.0 mM
MgCl2, 0.1 mM dNTP (total for 4 dNTP’s), 0.2 lM
of each primer, 0.02 U/ul Platinum Taq (Invitrogen
Life Technologies) and 20 ng of DNA in a total
volume of 15 ll. The exceptions to this were: (1)
PtTX4055 which was amplified with a final MgCl2buffer concentration of 3.3 mM; and (2) genotyping
in the F2 population, used reaction conditions of
Devey et al. (2001) for all markers originally iden-
tified in P. radiata. The PCR cycling parameters used
were those reported with the primer-pairs i.e. (Devey
et al. 2001; Auckland et al. 2001; Elsik et al. 2000;
Fisher et al. 1996, 1998; Echt et al. 1996; Echt and
Burns 1999; Smith and Devey 1994). Thermocycling
was carried out on a Perkin Elmer 9700 thermocycler
(Applied Biosystems). One primer in each pair was
synthesised with a 5¢ end fluorescent dye by either
Proligo (Lismore, Australia) or Applied Biosystems
(Foster City, CA, USA). PCR products were size and
dye multiplexed post PCR, for separation by capillary
electrophoresis on an Applied Biosystems 310
Mol Breeding (2006) 18:11–28 15
123
Genetic Analyser. Scoring of markers was semi-
automated using Genotyper software NT v 3.5 (Ap-
plied Biosystems).
Marker-trait associations
A two stage approach was used to detect and cha-
racterise marker-trait associations. In the detection
stage, a selective genotyping approach and single
marker tests (SMT) were used to identify genomic
regions associated with adventitious rooting. Interval
mapping (IM) and multiple-QTL model (MQM)
mapping were used to estimate QTL parameters in
the second characterisation stage.
Selective genotyping
A selective genotyping strategy was used to identify
markers that showed linkage to adventitious rooting.
A selective genotyping population of 32 individuals
(the 16 lowest and 16 highest rooting clones in each
family) was identified in each family using the rooting
percentages for each clone obtained from the nursery
trial. A list of markers genotyped in each family is
given in Appendix 1. Although genome coverage was
similar, the marker sets in both families were not
identical, as some markers were uninformative in both
families and substitutes were necessary.
Single-marker tests
Tests for independence in contingency tables (2·3 for
the F2; 2·4–2 for the F1) were used to detect marker–
trait associations using counts of the clones categor-
ised by genotypic and phenotypic classes. Tests for
independence were implemented using the Crosstabs
module of SPSS (SPSS Inc. Chicago, Illinois) with
Fisher’s exact probabilities reported (Also see
Appendix 2).
Genotyping a large random sample for unbiased
estimates of QTL parameters
Large random samples from both families were
genotyped in addition to their selective genotyping
populations to allow estimation of QTL parameters.
Totals of 224 and 192 individuals were genotyped in
the F1 and F2 family respectively.
Interval mapping
Interval mapping was conducted using MapQTL v4
(Van Ooijen et al. 2002) to estimate QTL position
and magnitude in the large samples from each family.
Additive models were tested in the F1 whereas
dominance was fitted in models to test for QTL in the
F2. Interval mapping was conducted at 5 cM intervals
along maps for the linkage groups identified as
associated with rooting percentage by single-marker
analysis in selective genotyping populations. Permu-
tation tests with 1000 permutations were used to
establish experiment-wise significance thresholds
(Churchill and Doerge 1994).
To test for multiple QTL per linkage group,
Multiple QTL Model (MQM) mapping was con-
ducted using MapQTL. MQM analysis provides
additional resolution for testing for multiple QTL by
regressing out the effect of other QTL using linked
markers as cofactors (Jansen and Stam 1994). Hence,
in addition to the IM model tested for each linkage
group in each family, both an MQM and restricted
MQM (rMQM) analysis were conducted. In MQM,
the effects of all other QTL except the test QTL were
controlled for, whereas in rMQM, only QTL residing
on linkage groups other than the group currently
being tested were controlled. Cofactors were selected
using the automatic cofactor (backwards elimination)
analysis module of MapQTL.
For some loci, in the F1, more than one genetic
model could be fitted, depending on the mating
configuration. Allele substitution effects were tested
by contrasting alternative alleles from one species
pooled across alleles from the second parent. Back-
cross models were possible by contrasting genotypes
with alternative alleles from one parent in a fixed
background for the other parent. Alternative models
were tested by ANOVA using the compare means
module of SPSS.
Results
A genome screen for QTL using selective
genotyping in the F2 family
A scan of the mapped region of the Pinus genome
was carried out to identify regions putatively asso-
ciated with rooting percentage. Fifty-one markers,
16 Mol Breeding (2006) 18:11–28
123
distributed across 15 linkage groups, were screened
on a selective genotyping population (n=32) of 16
high and 16 low rooting clones from the F2 family
(Appendix 1). The average rooting percentages for
low and high rooting classes were 0–0 and 100–0,
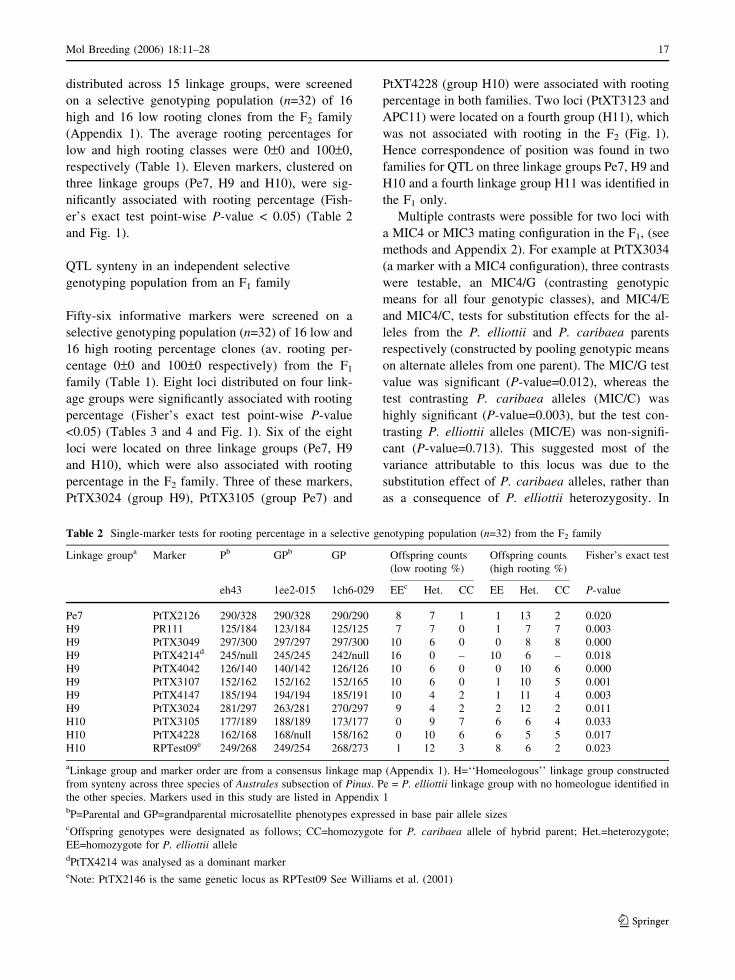
respectively (Table 1). Eleven markers, clustered on
three linkage groups (Pe7, H9 and H10), were sig-
nificantly associated with rooting percentage (Fish-
er’s exact test point-wise P-value < 0.05) (Table 2
and Fig. 1).
QTL synteny in an independent selective
genotyping population from an F1 family
Fifty-six informative markers were screened on a
selective genotyping population (n=32) of 16 low and
16 high rooting percentage clones (av. rooting per-
centage 0–0 and 100–0 respectively) from the F1
family (Table 1). Eight loci distributed on four link-
age groups were significantly associated with rooting
percentage (Fisher’s exact test point-wise P-value
<0.05) (Tables 3 and 4 and Fig. 1). Six of the eight
loci were located on three linkage groups (Pe7, H9
and H10), which were also associated with rooting
percentage in the F2 family. Three of these markers,
PtTX3024 (group H9), PtTX3105 (group Pe7) and
PtXT4228 (group H10) were associated with rooting
percentage in both families. Two loci (PtXT3123 and
APC11) were located on a fourth group (H11), which
was not associated with rooting in the F2 (Fig. 1).
Hence correspondence of position was found in two
families for QTL on three linkage groups Pe7, H9 and
H10 and a fourth linkage group H11 was identified in
the F1 only.
Multiple contrasts were possible for two loci with
a MIC4 or MIC3 mating configuration in the F1, (see
methods and Appendix 2). For example at PtTX3034
(a marker with a MIC4 configuration), three contrasts
were testable, an MIC4/G (contrasting genotypic
means for all four genotypic classes), and MIC4/E
and MIC4/C, tests for substitution effects for the al-
leles from the P. elliottii and P. caribaea parents
respectively (constructed by pooling genotypic means
on alternate alleles from one parent). The MIC/G test
value was significant (P-value=0.012), whereas the
test contrasting P. caribaea alleles (MIC/C) was
highly significant (P-value=0.003), but the test con-
trasting P. elliottii alleles (MIC/E) was non-signifi-
cant (P-value=0.713). This suggested most of the
variance attributable to this locus was due to the
substitution effect of P. caribaea alleles, rather than
as a consequence of P. elliottii heterozygosity. In
Table 2 Single-marker tests for rooting percentage in a selective genotyping population (n=32) from the F2 family
Linkage groupa Marker Pb GPb GP Offspring counts
(low rooting %)
Offspring counts
(high rooting %)
Fisher’s exact test
eh43 1ee2-015 1ch6-029 EEc Het. CC EE Het. CC P-value
Pe7 PtTX2126 290/328 290/328 290/290 8 7 1 1 13 2 0.020
H9 PR111 125/184 123/184 125/125 7 7 0 1 7 7 0.003
H9 PtTX3049 297/300 297/297 297/300 10 6 0 0 8 8 0.000
H9 PtTX4214d 245/null 245/245 242/null 16 0 – 10 6 – 0.018
H9 PtTX4042 126/140 140/142 126/126 10 6 0 0 10 6 0.000
H9 PtTX3107 152/162 152/162 152/165 10 6 0 1 10 5 0.001
H9 PtTX4147 185/194 194/194 185/191 10 4 2 1 11 4 0.003
H9 PtTX3024 281/297 263/281 270/297 9 4 2 2 12 2 0.011
H10 PtTX3105 177/189 188/189 173/177 0 9 7 6 6 4 0.033
H10 PtTX4228 162/168 168/null 158/162 0 10 6 6 5 5 0.017
H10 RPTest09e 249/268 249/254 268/273 1 12 3 8 6 2 0.023
aLinkage group and marker order are from a consensus linkage map (Appendix 1). H=‘‘Homeologous’’ linkage group constructed
from synteny across three species of Australes subsection of Pinus. Pe = P. elliottii linkage group with no homeologue identified in
the other species. Markers used in this study are listed in Appendix 1bP=Parental and GP=grandparental microsatellite phenotypes expressed in base pair allele sizescOffspring genotypes were designated as follows; CC=homozygote for P. caribaea allele of hybrid parent; Het.=heterozygote;
EE=homozygote for P. elliottii alleledPtTX4214 was analysed as a dominant markereNote: PtTX2146 is the same genetic locus as RPTest09 See Williams et al. (2001)
Mol Breeding (2006) 18:11–28 17
123

PtTX30250.0
PtTX405519.2PtTX212621.9PtTX414927.8
1.0 1.2 1.4 1.6 1.8
F2 Pe7
PtTX3025*0.0
PtTX405519.2PtTX212621.9PtTX414927.8
0 1 2 3
F1 Pe7
IM
MQM
rMQM
PR1110.0
PtTX30499.8
PtTX421419.6
PtTX404239.7PtTX310740.3
PtTX414769.0
PtTX302476.5
NZPR2390.3
0.2 0.4 0.6 0.8 1.0 1.2
F1 H9
0 5
2
1
F2 H9
PR1110.0
PtTX30499.8
PtTX4214*19.6
PtTX404239.7PtTX310740.3
PtTX414769.0
PtTX3024*76.5
NZPR2390.3
10 15 20
PtTX31050.0PtTX4228*3.8
PtTX208243.4
PtTX214663.3
PtTX304684.4PtTX309688.6
PtTX3120129.7
RPTest09142.8
2.85
2.90
2.95
3.00
3.05
F2 H10
PtTX31050.0PtTX4228*3.8
PtTX208243.4
PtTX214663.3
PtTX304684.4PtTX309688.6
PtTX3120129.7
RPTest09142.8
2.40
2.42
2.44
2.46
2.48
2.50
F1 H10
APC110.0
PtTX312323.6
0.4 0.6 0.8 1.0 1.2 1.4
F1 H11
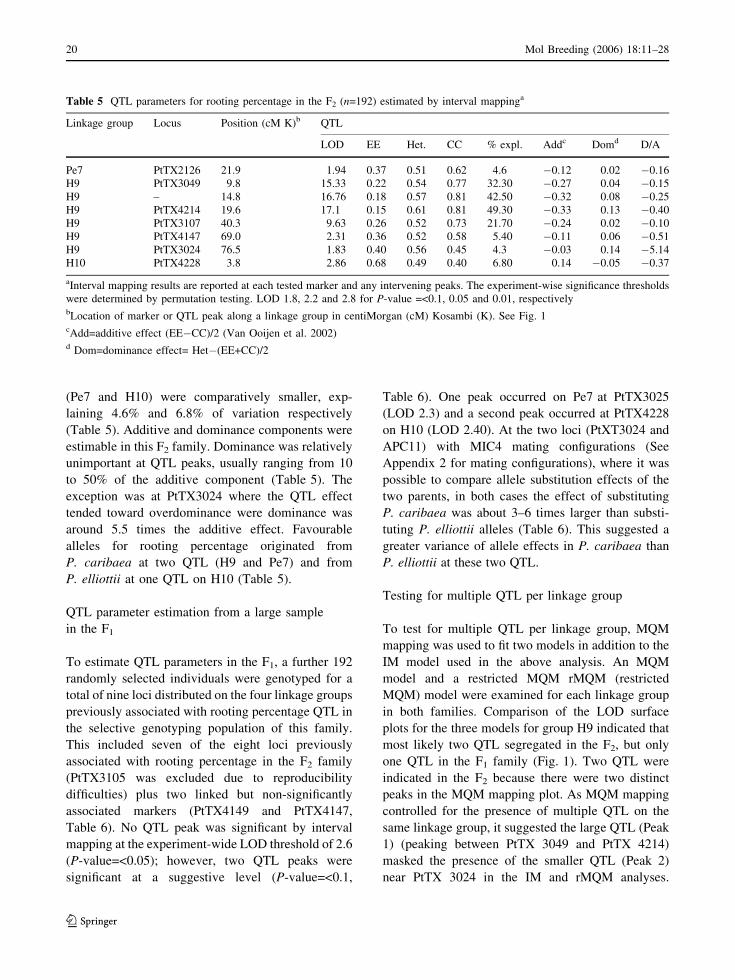
Fig. 1 Congruence of
rooting percentage QTL in a
P. elliottii · P. caribaea F2
and an F1 family detected
by single marker, interval
mapping and MQM
analyses. Four genomic
regions (linkage groups
Pe7, H9, H10 and H11)
from a P. elliottii/P.
caribaea consensus map are
shown (map distance
cM Kosambi). QTL
synteny was declared when
at least one SMT per
linkage group was
significant in both families
(P-value <0.05 per
individual test). SMTs were
carried out on a selective
genotyping population
(n=32) in each family.
Markers which were
significantly (individual test
P-value <0.05) associated
with rooting percentage by
SMTs in the F2 are
underlined. Those
significant in the F1are
italicised and those that
were significant in both
families are both underlined
and italicised. Interval
mapping was conducted on
a larger sample (n=196 and
224; F2 and F1 respectively)
to estimate QTL
parameters. Interval
mapping (IM) LOD curves
are indicated on the right of
each group. A LOD
threshold of 2.2 and 2.6 was
required for experiment-
wide significance of a =<
0.05 in the F2 and F1
respectively. MQM and
rMQM mapping were also
performed to test for
multiple QTL per linkage
group. The two QTL peaks
detected in the F2 family on
group H9 are indicated with
a ‘‘1’’ and ‘‘2’’
respectively. Markers used
as cofactors have an asterisk
appended to their names
18 Mol Breeding (2006) 18:11–28
123

contrast, a similar analysis of locus APC11 (group
H11), also with a MIC4 mating configuration, indi-
cated heterozygosity in P. elliottii parental was the
main source of variation at this QTL.
QTL parameter estimation from a large sample in
the F2
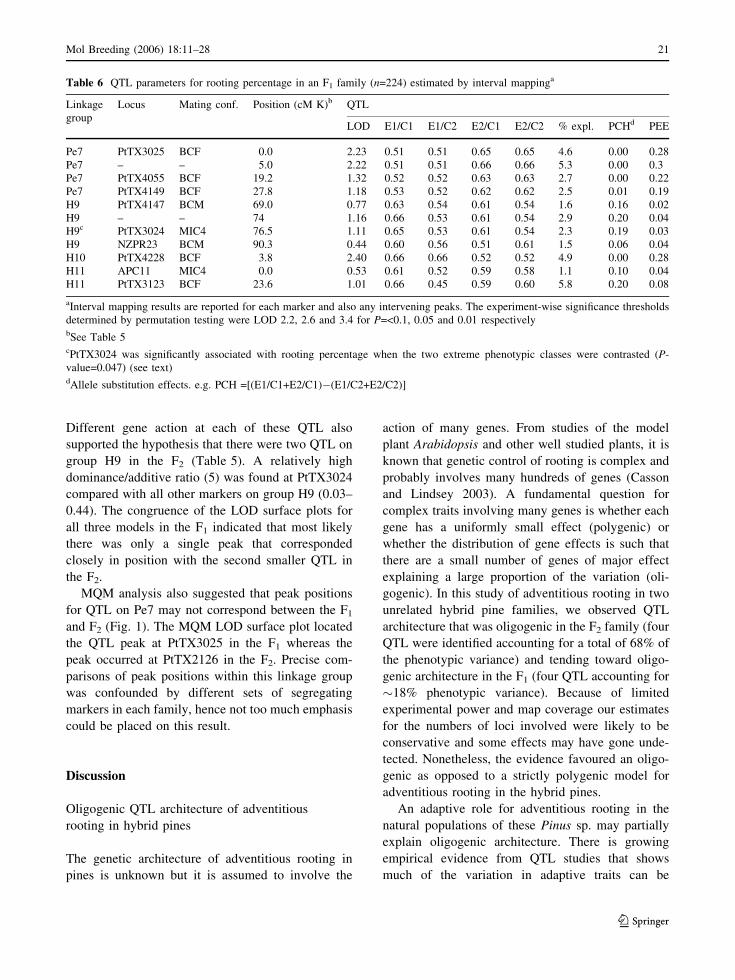
QTL position and magnitude of effect was estimated
using interval mapping. An additional 160 individu-
als (to give a total of 192 including the 32 individuals
from the selective genotyping population) were ran-
domly selected for genotyping with a sub-set of 7 of
11 loci previously associated with rooting percentage
in the selective genotyping population of the F2. All
markers, except PtTX3024 and PtTX2126, were also
significantly associated with rooting percentage in the
larger sample (experiment-wide P-value <0.05=LOD
2.2) (Table 5 and Fig. 1). A large LOD peak (LOD
17.1) occurred on group H9 between PtTX4214 and
PtTX3049 and explained 42.5% of the PV (Fig. 1).
LOD peaks located on the other two linkage groups
Table 3 SMTs for rooting percentage in a selective genotyping population (n=32) from the F1 family
Linkage
groupaMarker P. elliottii
parental
genotype
P.
caribaea
parental
genotype
Low rooting %
offspring class
(counts)
High rooting %
offspring class
(counts)
Fisher’s
exact testc
E1/E2b C1/C2 E1/C1 E1/C2 E2/C1 E2/C2 E1/C1 E1/C2 E2/C1 E2/C2 MIC/G
or BC
Pe7 PtTX3025 263/264 263/263 0 – 15 – 10 – 6 – 0.000
Pe7 PtTX4055 208/209 208/208 2 – 13 – 9 – 7 – 0.023
H9 PtTX3024 248/306 275/296 0 7 0 7 4 2 4 6 0.012
H9 NZPR23 null/null 113/null 12 3 – – 5 11 – – 0.011
H10 PtTX3105 186/null null/null 14 – 1 – 7 – 9 – 0.006
H10 PtTX4228 166/168 152/152 1 – 14 – 9 – 7 – 0.006
H11 PtTX3123 209/null null/null 11 – 3 – 5 – 11 – 0.014
H11 APC11 157/165 181/null 7 3 1 4 3 1 4 8 0.169
Contrasts for mating types with four genotypes or backcross configurations (MIC/G or BC respectively)aSee Table 2bP. elliottii and P. caribaea alleles were designated E1, E2 and C1, C2 respectivelycP-values reported. Several contrasts were possible for some mating configurations. See Appendix 2 for methods
Table 4 SMTs for rooting percentage in a selective genotyping population (n=32) from an F1 family (n=32)
Linkage
groupaMarker P. elliottii
parental
genotype
P. caribaea
parental
genotype
MIC/E MIC/C Fisher’s
exact testc
Low High Low High
E1/E2b C1/C2 E1 E2 E1 E2 C1 C2 C1 C2 MIC/E MIC/C
Pe7 PtTX3025 263/264 263/263 na na
Pe7 PtTX4055 208/209 208/208 na na
H9 PtTX3024 248/306 275/296 7 7 6 10 0 14 8 8 0.713 0.003
H9 NZPR23 null/null 113/null na na
H10 PtTX3105 186/null null/null na na
H10 PtTX4228 166/168 152/152 na na
H11 PtTX3123 209/null null/null na na
H11 APC11 157/165 181/null 10 5 4 12 8 7 7 9 0.032 0.724
Allele substitution contrasts for P. elliottii and P. caribaea parent (MIC/E and MIC/C respectively)aSee Table 2bP. elliottii and P. caribaea alleles were designated E1, E2 and C1, C2 respectivelycP-values reported. Several contrasts were possible for some mating configurations. See Appendix 2 for methods
Mol Breeding (2006) 18:11–28 19
123
(Pe7 and H10) were comparatively smaller, exp-
laining 4.6% and 6.8% of variation respectively
(Table 5). Additive and dominance components were
estimable in this F2 family. Dominance was relatively
unimportant at QTL peaks, usually ranging from 10
to 50% of the additive component (Table 5). The
exception was at PtTX3024 where the QTL effect
tended toward overdominance were dominance was
around 5.5 times the additive effect. Favourable
alleles for rooting percentage originated from
P. caribaea at two QTL (H9 and Pe7) and from
P. elliottii at one QTL on H10 (Table 5).
QTL parameter estimation from a large sample
in the F1
To estimate QTL parameters in the F1, a further 192
randomly selected individuals were genotyped for a
total of nine loci distributed on the four linkage groups
previously associated with rooting percentage QTL in
the selective genotyping population of this family.
This included seven of the eight loci previously
associated with rooting percentage in the F2 family
(PtTX3105 was excluded due to reproducibility
difficulties) plus two linked but non-significantly
associated markers (PtTX4149 and PtTX4147,
Table 6). No QTL peak was significant by interval
mapping at the experiment-wide LOD threshold of 2.6
(P-value=<0.05); however, two QTL peaks were
significant at a suggestive level (P-value=<0.1,
Table 6). One peak occurred on Pe7 at PtTX3025
(LOD 2.3) and a second peak occurred at PtTX4228
on H10 (LOD 2.40). At the two loci (PtXT3024 and
APC11) with MIC4 mating configurations (See
Appendix 2 for mating configurations), where it was
possible to compare allele substitution effects of the
two parents, in both cases the effect of substituting
P. caribaea was about 3–6 times larger than substi-
tuting P. elliottii alleles (Table 6). This suggested a
greater variance of allele effects in P. caribaea than
P. elliottii at these two QTL.
Testing for multiple QTL per linkage group
To test for multiple QTL per linkage group, MQM
mapping was used to fit two models in addition to the
IM model used in the above analysis. An MQM
model and a restricted MQM rMQM (restricted
MQM) model were examined for each linkage group
in both families. Comparison of the LOD surface
plots for the three models for group H9 indicated that
most likely two QTL segregated in the F2, but only
one QTL in the F1 family (Fig. 1). Two QTL were
indicated in the F2 because there were two distinct
peaks in the MQM mapping plot. As MQM mapping
controlled for the presence of multiple QTL on the
same linkage group, it suggested the large QTL (Peak
1) (peaking between PtTX 3049 and PtTX 4214)
masked the presence of the smaller QTL (Peak 2)
near PtTX 3024 in the IM and rMQM analyses.
Table 5 QTL parameters for rooting percentage in the F2 (n=192) estimated by interval mappinga
Linkage group Locus Position (cM K)b QTL
LOD EE Het. CC % expl. Addc Domd D/A
Pe7 PtTX2126 21.9 1.94 0.37 0.51 0.62 4.6 �0.12 0.02 �0.16
H9 PtTX3049 9.8 15.33 0.22 0.54 0.77 32.30 �0.27 0.04 �0.15
H9 – 14.8 16.76 0.18 0.57 0.81 42.50 �0.32 0.08 �0.25
H9 PtTX4214 19.6 17.1 0.15 0.61 0.81 49.30 �0.33 0.13 �0.40
H9 PtTX3107 40.3 9.63 0.26 0.52 0.73 21.70 �0.24 0.02 �0.10
H9 PtTX4147 69.0 2.31 0.36 0.52 0.58 5.40 �0.11 0.06 �0.51
H9 PtTX3024 76.5 1.83 0.40 0.56 0.45 4.3 �0.03 0.14 �5.14
H10 PtTX4228 3.8 2.86 0.68 0.49 0.40 6.80 0.14 �0.05 �0.37
aInterval mapping results are reported at each tested marker and any intervening peaks. The experiment-wise significance thresholds
were determined by permutation testing. LOD 1.8, 2.2 and 2.8 for P-value =<0.1, 0.05 and 0.01, respectivelybLocation of marker or QTL peak along a linkage group in centiMorgan (cM) Kosambi (K). See Fig. 1cAdd=additive effect (EE�CC)/2 (Van Ooijen et al. 2002)d Dom=dominance effect= Het�(EE+CC)/2
20 Mol Breeding (2006) 18:11–28
123
Different gene action at each of these QTL also
supported the hypothesis that there were two QTL on
group H9 in the F2 (Table 5). A relatively high
dominance/additive ratio (5) was found at PtTX3024
compared with all other markers on group H9 (0.03–
0.44). The congruence of the LOD surface plots for
all three models in the F1 indicated that most likely
there was only a single peak that corresponded
closely in position with the second smaller QTL in
the F2.
MQM analysis also suggested that peak positions
for QTL on Pe7 may not correspond between the F1
and F2 (Fig. 1). The MQM LOD surface plot located
the QTL peak at PtTX3025 in the F1 whereas the
peak occurred at PtTX2126 in the F2. Precise com-
parisons of peak positions within this linkage group
was confounded by different sets of segregating
markers in each family, hence not too much emphasis
could be placed on this result.
Discussion
Oligogenic QTL architecture of adventitious
rooting in hybrid pines
The genetic architecture of adventitious rooting in
pines is unknown but it is assumed to involve the
action of many genes. From studies of the model
plant Arabidopsis and other well studied plants, it is
known that genetic control of rooting is complex and
probably involves many hundreds of genes (Casson
and Lindsey 2003). A fundamental question for
complex traits involving many genes is whether each
gene has a uniformly small effect (polygenic) or
whether the distribution of gene effects is such that
there are a small number of genes of major effect
explaining a large proportion of the variation (oli-
gogenic). In this study of adventitious rooting in two
unrelated hybrid pine families, we observed QTL
architecture that was oligogenic in the F2 family (four
QTL were identified accounting for a total of 68% of
the phenotypic variance) and tending toward oligo-
genic architecture in the F1 (four QTL accounting for
�18% phenotypic variance). Because of limited
experimental power and map coverage our estimates
for the numbers of loci involved were likely to be
conservative and some effects may have gone unde-
tected. Nonetheless, the evidence favoured an oligo-
genic as opposed to a strictly polygenic model for
adventitious rooting in the hybrid pines.
An adaptive role for adventitious rooting in the
natural populations of these Pinus sp. may partially
explain oligogenic architecture. There is growing
empirical evidence from QTL studies that shows
much of the variation in adaptive traits can be
Table 6 QTL parameters for rooting percentage in an F1 family (n=224) estimated by interval mappinga
Linkage
group
Locus Mating conf. Position (cM K)b QTL
LOD E1/C1 E1/C2 E2/C1 E2/C2 % expl. PCHd PEE
Pe7 PtTX3025 BCF 0.0 2.23 0.51 0.51 0.65 0.65 4.6 0.00 0.28
Pe7 – – 5.0 2.22 0.51 0.51 0.66 0.66 5.3 0.00 0.3
Pe7 PtTX4055 BCF 19.2 1.32 0.52 0.52 0.63 0.63 2.7 0.00 0.22
Pe7 PtTX4149 BCF 27.8 1.18 0.53 0.52 0.62 0.62 2.5 0.01 0.19
H9 PtTX4147 BCM 69.0 0.77 0.63 0.54 0.61 0.54 1.6 0.16 0.02
H9 – – 74 1.16 0.66 0.53 0.61 0.54 2.9 0.20 0.04
H9c PtTX3024 MIC4 76.5 1.11 0.65 0.53 0.61 0.54 2.3 0.19 0.03
H9 NZPR23 BCM 90.3 0.44 0.60 0.56 0.51 0.61 1.5 0.06 0.04
H10 PtTX4228 BCF 3.8 2.40 0.66 0.66 0.52 0.52 4.9 0.00 0.28
H11 APC11 MIC4 0.0 0.53 0.61 0.52 0.59 0.58 1.1 0.10 0.04
H11 PtTX3123 BCF 23.6 1.01 0.66 0.45 0.59 0.60 5.8 0.20 0.08
aInterval mapping results are reported for each marker and also any intervening peaks. The experiment-wise significance thresholds
determined by permutation testing were LOD 2.2, 2.6 and 3.4 for P=<0.1, 0.05 and 0.01 respectivelybSee Table 5cPtTX3024 was significantly associated with rooting percentage when the two extreme phenotypic classes were contrasted (P-
value=0.047) (see text)dAllele substitution effects. e.g. PCH =[(E1/C1+E2/C1)�(E1/C2+E2/C2)]
Mol Breeding (2006) 18:11–28 21
123

explained by a few major effects (Orr and Coyne
1992; Bradshaw and Stettler 1995; Paterson et al.
1991). Although the mechanism by which the large
effects contributing to variance of adaptive characters
arise remains equivocal (Ridley 2004), a recent re-
view of the population genetics of adaptive traits
indicates exponential-like distributions of effect sizes
are observed because the leading factors fixed early
during adaptation are always large (Orr 1998). Hence,
although evolution is generally thought to proceed by
small changes, large effects could be common in
plant evolution where species invade new niches or
other situations where a species has moved from an
adaptive optima e.g. during domestication (Doebley
and Stec 1993; Orr 1998).
An adaptive role for adventitious root develop-
ment was suggested because it is an important
response for plant survival under stress or flooding
(De Klerk et al. 1999). The two parental species in
our study, P. caribaea and P. elliottii, inhabit non-
overlapping native environments, upland ridge sites
in Belize, South America and water-logged sandy
soils in Georgia and northern Florida (USA) respec-
tively. Experience from growing both parental taxa as
exotics in Queensland, has shown P. caribaea is
intolerant of water logging compared to P. elliottii
(Lewty 1990). P. elliottii possesses morphological
features that are associated with flood tolerance,
producing adventitious roots and other physiological
responses to flooding when grown under flooded
conditions in the glasshouse (Lewty 1990). Our
working hypothesis was that there could be strong
selection for adventitious rooting in P. elliottii as it is
adapted to water-logged environments whereas there
was likely to have been less selection in P. caribaea.
QTL congruence validates QTL and distinguishes
within-species effects
A comparative analysis of QTL was carried out to (1)
validate QTL (2) investigate QTL stability across
genetic backgrounds and different levels of inbreed-
ing, and (3) test whether between and within-species
effects could be distinguished. There was a high level
of congruence of QTL, with three QTL in each family
mapping to corresponding positions in the maps of
the two families, as well as a corresponding absence
of QTL on the remaining linkage groups. Congruent
QTL tended to have small to moderate effects
(2–5%). Congruency of QTL was important for val-
idation of QTL. Correspondence of QTL location, at
a rate greater than expected by chance in independent
populations, is strong evidence that genes influencing
the phenotype locate to that particular genomic re-
gion (Paterson et al. 1995; Doebley and Stec 1993).
Congruence of QTL was expected for within-
species effects, where one or both species’ parents for
both families were heterozygous. These loci also
segregated in the F2 because the F1 parent has an
allele from each parental species and therefore were
highly likely to differ in effect. In addition to segre-
gating for within-species effects, the F2 also segre-
gated for those loci fixed between parental species
(between-species effects). One putative between-
species effect was identified in this study (QTL H9
Peak 1), a large effect QTL explaining �50% PV
were identified uniquely in the F2. It was around 10
times the size of the average within-species effect in
this family. The approach taken, (i.e. comparing QTL
in the F1 and F2), has tentatively allowed differenti-
ation of between and within-species effects and
examination of the relative magnitudes of these ef-
fects. The majority of QTL (congruent QTL—within-
species effects) were stably expressed across the two
genetic backgrounds and in the two populations with
different inbreeding coefficients. These effects were
considerably smaller than the less frequent (1 in 4)
between-species effects.
Factors promoting QTL congruence
In this study, QTL congruence may have been pro-
moted by oligogenic architecture; low experimental
power to detect small effects; factors that increase
effect size (hence QTL are more reliably detected in
multiple populations) and, factors promoting genetic
diversity in one or both parental species populations.
Congruence of QTL would be rare under a polygenic
model. Congruency should decrease with an
increasing number of effects, as the probability that a
QTL and marker loci for each effect will segregate in
multiple families will rapidly decrease. Congruency
should also decrease with effect size, as smaller
effects will be harder to detect reproducibly. Low
experimental power to detect small effect QTL would
have also contributed to congruence as many small
effects may have been effectively hidden from
detection, reducing the number of QTL detected in
22 Mol Breeding (2006) 18:11–28
123

each family and confining the investigation to rela-
tively large effect QTL that may be detected more
reliably. Effectively we may not have been studying
congruence in the many small effects as they may
have been below the threshold of detection.
Inter-genomic interaction may have been a third
factor contributing to QTL congruence in this study
by inflating genetic variances, increasing effect size
and therefore the reproducibility of detection in dif-
ferent populations. Over dominance at one of the
shared QTL loci (H9 Peak 2 at PtTX3024) in the F2
may be evidence of inter-genomic interaction. Post-
zygotic isolation mechanisms in plants are attributed
to both genic and chromosomal structural incompat-
ibilities (Rieseberg 2001). Genetic mechanisms are
thought to be most often the cause of hybrid inferi-
ority (viability or fertility) acting via incompatible
gene combinations (negative epistasis) to reduce
introgression at hybrid fitness loci (Burke and Arnold
2001). Poor fitness or heterotic performance of het-
erozygous (EC genotype) compared to parental types
(EE and CC) may result from hybrid incompatibility.
As H9 Peak 2 was a congruent QTL, segregating in
both families, hybrid incompatibility may be con-
tributing to genetic variance in both generations.
Field performance also suggests there could be
compatibility issues with this hybrid. The P. elli-
ottii·P. caribaea hybrid is an intersectional cross and
exhibits markedly reduced and variable seed germi-
nation (0.2–43.6%) in F1 hybrids compared with its
parents (Slee 1970). High rates of aberrant mor-
phology and mortality are also found in the F1
compared with parental taxa or outcrossed second
generation hybrids (Powell 2000). Trees may appear
normal in the nursery and survive 3–4 years in the
field before showing signs of collapse and eventually
mortality.
Diversity at a locus in at least one parental species
should also promote QTL congruence. As the F2
should segregate for almost all loci (only those fixed
for the same allele in both species will not segregate),
allelic diversity in the parental populations was
probably more limiting than heterozygosity of the F1
parent for QTL congruence in this study because it
determined whether or not a locus segregated in the
F1. QTL congruence suggested that high diversity
was maintained at most loci for rooting in at least one
parental species. Our data further indicated that
variance at QTL was greater for P. caribaea than
P. elliottii. The effect of substituting alleles at within-
species effects in the F1 for P. caribaea tended to be
2–6 times larger than substitution of P. elliottii alleles
at the same loci. This higher allelic diversity in
P. caribaea than P. elliottii suggested there may be
less selection for most adventitious rooting loci in
P. caribaea.
Between-species effects were putatively identified
as large effects unique to the F2
A large effect QTL on group H9 was uniquely de-
tected in the F2, suggesting this QTL was due to a
between-species effect. QTL detected uniquely in the
F2 must be fixed in both parents otherwise segrega-
tion would occur in the F1. Natural selection may be
fixing the locus in both parental populations because
chance fixation of a locus should be infrequent in
outcrossing species and chance fixation of an effect
around 10-fold larger than any other QTL should be
extremely remote. Large effect QTL (ranging from
20% to 50% PV but as much as 88%) in plants have
been previously detected in interspecific F2 hybrids
where parents were divergent for traits involved in
adaptation, speciation or domestication (Bradshaw
and Stettler 1995; Bradshaw et al. 1995; Paterson
et al. 1991; Doebley and Stec 1991).
Where parental populations are subject to divergent
selection, the direction of an alleles’ effect in derived
inbred populations may be predictable if there is no
inbreeding depression (Forbes et al. 2004). As
P. elliottii has a strong capacity to develop adventi-
tious roots, we hypothesised that during adaptation to
waterlogged environments, selection may have re-
duced allelic diversity and fixed some loci in this
species. We speculated that P. caribaea had not been
subject to the same selection and therefore maintained
diversity at most loci involved in rooting. However,
the detection of a putative between-species effect
indicated that some loci in some P. caribaea indi-
viduals were also fixed. Further, at a between-species
effect for adventitious rooting it might be expected
that favourable alleles would originate from the
P. elliottii parent because it was the high performing
parent; however, P. caribaea provided the favourable
allele at the putative between-species effect (large
effect QTL on H9). This suggested the locus might be
fundamental to root development, involved in the
development of both primary as well as secondary
Mol Breeding (2006) 18:11–28 23
123
roots. The genetic systems of adventitious and pri-
mary rooting overlap extensively (Casson and Lind-
sey 2003), so the effects of selection on primary
rooting may be manifest in the genetics of adventi-
tious rooting.
Inbreeding depression may contribute to genetic
variation in the F2
The identification of QTL in a cross derived from
outcrossing parental populations raises the question of
whether the detected QTL were a manifestation of
inbreeding depression. Conifers, like many outcross-
ing trees species have high genetic loads and suffer
inbreeding depression (Williams and Savolainen
1996; Remington and O’malley 2000). Inbreeding
could lead to the detection of ‘‘growth’’ QTL that are
merely expression of mutational load carried by
parental taxa, rather than ‘‘growth’’ QTL reflective of
all inbred and F2 (Bradshaw and Stettler 1995). The
phenotypic variance in populations affected by
inbreeding depression may arise from mutations dur-
ing inbreeding or because of chance fixation of dele-
terious alleles present in the parental populations
(Forbes et al. 2004). Inbred populations of P. elli-
ottii·P. caribaea typically show signs of inbreeding
depression in seedling survival and early field growth.
In the current study, the family averages for early field
growth and rooting percentages were consistently
lower in the F2 than F1 families in the same trials,
strongly suggesting the influence of inbreeding
depression in the F2 (Shepherd et al. 2005).
Although inbreeding depression was likely to
affect the overall vigour and growth in the F2, several
lines of evidence suggest it was not a major factor
contributing to genetic variation attributed to rooting
QTL. The strongest evidence for this was that
inbreeding depression could not have been a factor
contributing to QTL in F1 population. Deleterious
loci linked to QTL could, however, still contribute to
variance in the F2. A second line of evidence from
marker segregation data, suggests that this should not
be the case for the QTL of the largest effect on group
H9. Markers linked to a recessive lethal show seg-
regation distortion in inbred crosses as these geno-
types are purged from the population (Bradshaw and
Stettler 1994). On a genetic map of the F2 parent no
significant marker segregation distortion was evident
on group H9 where the largest QTL was located, but
distortion was evident at PtTX2126 (group Pe7
P-value <0.005) and PtTX4228 (group H10 P-value
<0.05). Inbreeding depression was unlikely to be
influencing genetic variances attributable to the QTL
on group H9, but may have been a factor at the two
other QTL detected in the F2.
Implications for breeding and MAS
Our study showed that a greater portion of PV in the
F2 was genetic than in the F1, therefore gains from
selection should also be higher for this generation.
Increases in the genetic variance for the F2 were due
to segregation of large between-species effects. The
magnitude of between-species effects suggests it may
be more efficient to target one or a few of these
effects rather than trying to manipulate many smaller
within-species effects. Depending on the economics
of the trait and genotyping costs, it may be worth-
while exploiting the strong within-family linkage
disequilibrium (LD) created during interspecific
hybridisation for MAS, to cull poor rooting genotypes
prior to mass propagation of clones and field testing.
One of the limitations anticipated for MAS when
applied to single-species tree-breeding population is
that the LD expected in outcrossing species will
create inconsistent coupling–epulsion phase rela-
tionships between marker loci and QTL (Strauss
et al. 1992). However, if between-species effects are
targeted, MAS may be applicable to population
improvement of synthetic hybrids. If loci under
strong natural selection can be identified, because
selection will reduce allele diversity at a locus and
create locus-specific LD (Flint-Garcia et al. 2003), it
may be possible to exploit LD to provide relatively
consistent coupling–repulsion relationships for MAS
in populations of both the parental species (inter-
mated to produce F1) and synthetic hybrids (inter-
mated to produce F2 or later generation). Whether
useful LD exists at these loci is yet to be determined.
In outcrossing plant species such as maize where LD
typically declines very rapidly, extensive LD can
persist when strong artificial selection is maintained
(Palaisa et al. 2003).
Acknowledgements The authors thank R. Mellick, P. Toon
and R. Peters for assistance in the nursery, C.G. Williams,
D.G. Nikles and P. Bundock for helpful discussions on the
manuscript; and the CRC for Sustainable Production Forestry
for a Visiting Scientist fellowship for S. Huang.
24 Mol Breeding (2006) 18:11–28
123
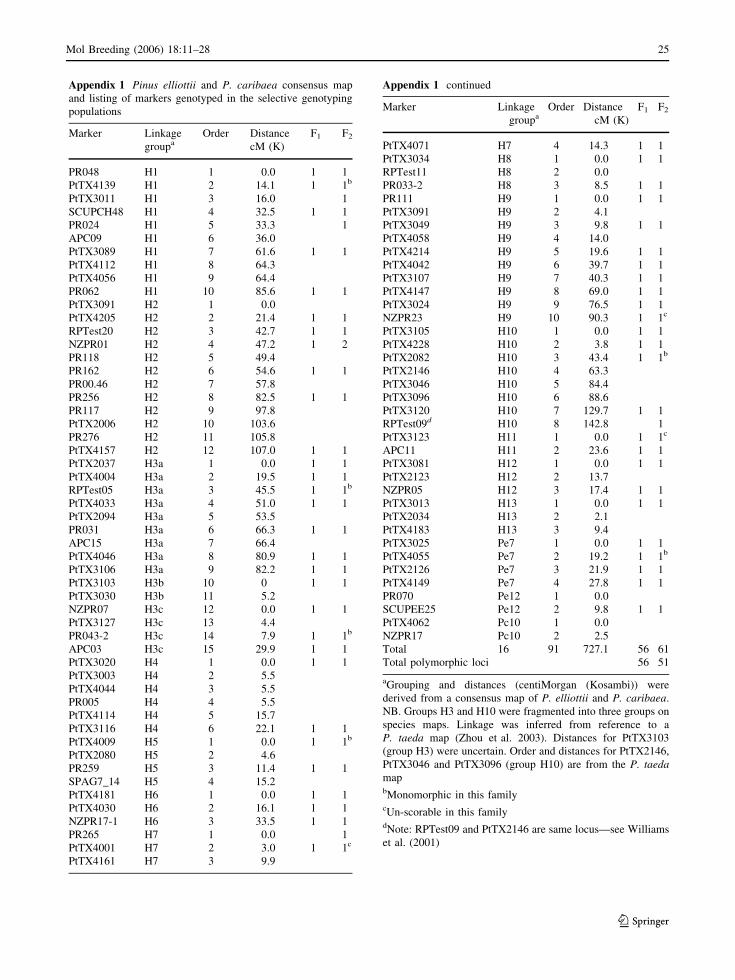
Appendix 1 Pinus elliottii and P. caribaea consensus map
and listing of markers genotyped in the selective genotyping
populations
Marker Linkage
groupaOrder Distance
cM (K)
F1 F2
PR048 H1 1 0.0 1 1
PtTX4139 H1 2 14.1 1 1b
PtTX3011 H1 3 16.0 1
SCUPCH48 H1 4 32.5 1 1
PR024 H1 5 33.3 1
APC09 H1 6 36.0
PtTX3089 H1 7 61.6 1 1
PtTX4112 H1 8 64.3
PtTX4056 H1 9 64.4
PR062 H1 10 85.6 1 1
PtTX3091 H2 1 0.0
PtTX4205 H2 2 21.4 1 1
RPTest20 H2 3 42.7 1 1
NZPR01 H2 4 47.2 1 2
PR118 H2 5 49.4
PR162 H2 6 54.6 1 1
PR00.46 H2 7 57.8
PR256 H2 8 82.5 1 1
PR117 H2 9 97.8
PtTX2006 H2 10 103.6
PR276 H2 11 105.8
PtTX4157 H2 12 107.0 1 1
PtTX2037 H3a 1 0.0 1 1
PtTX4004 H3a 2 19.5 1 1
RPTest05 H3a 3 45.5 1 1b
PtTX4033 H3a 4 51.0 1 1
PtTX2094 H3a 5 53.5
PR031 H3a 6 66.3 1 1
APC15 H3a 7 66.4
PtTX4046 H3a 8 80.9 1 1
PtTX3106 H3a 9 82.2 1 1
PtTX3103 H3b 10 0 1 1
PtTX3030 H3b 11 5.2
NZPR07 H3c 12 0.0 1 1
PtTX3127 H3c 13 4.4
PR043-2 H3c 14 7.9 1 1b
APC03 H3c 15 29.9 1 1
PtTX3020 H4 1 0.0 1 1
PtTX3003 H4 2 5.5
PtTX4044 H4 3 5.5
PR005 H4 4 5.5
PtTX4114 H4 5 15.7
PtTX3116 H4 6 22.1 1 1
PtTX4009 H5 1 0.0 1 1b
PtTX2080 H5 2 4.6
PR259 H5 3 11.4 1 1
SPAG7_14 H5 4 15.2
PtTX4181 H6 1 0.0 1 1
PtTX4030 H6 2 16.1 1 1
NZPR17-1 H6 3 33.5 1 1
PR265 H7 1 0.0 1
PtTX4001 H7 2 3.0 1 1c
PtTX4161 H7 3 9.9
Appendix 1 continued
Marker Linkage
groupaOrder Distance
cM (K)
F1 F2
PtTX4071 H7 4 14.3 1 1
PtTX3034 H8 1 0.0 1 1
RPTest11 H8 2 0.0
PR033-2 H8 3 8.5 1 1
PR111 H9 1 0.0 1 1
PtTX3091 H9 2 4.1
PtTX3049 H9 3 9.8 1 1
PtTX4058 H9 4 14.0
PtTX4214 H9 5 19.6 1 1
PtTX4042 H9 6 39.7 1 1
PtTX3107 H9 7 40.3 1 1
PtTX4147 H9 8 69.0 1 1
PtTX3024 H9 9 76.5 1 1
NZPR23 H9 10 90.3 1 1c
PtTX3105 H10 1 0.0 1 1
PtTX4228 H10 2 3.8 1 1
PtTX2082 H10 3 43.4 1 1b
PtTX2146 H10 4 63.3
PtTX3046 H10 5 84.4
PtTX3096 H10 6 88.6
PtTX3120 H10 7 129.7 1 1
RPTest09d H10 8 142.8 1
PtTX3123 H11 1 0.0 1 1c
APC11 H11 2 23.6 1 1
PtTX3081 H12 1 0.0 1 1
PtTX2123 H12 2 13.7
NZPR05 H12 3 17.4 1 1
PtTX3013 H13 1 0.0 1 1
PtTX2034 H13 2 2.1
PtTX4183 H13 3 9.4
PtTX3025 Pe7 1 0.0 1 1
PtTX4055 Pe7 2 19.2 1 1b
PtTX2126 Pe7 3 21.9 1 1
PtTX4149 Pe7 4 27.8 1 1
PR070 Pe12 1 0.0
SCUPEE25 Pe12 2 9.8 1 1
PtTX4062 Pc10 1 0.0
NZPR17 Pc10 2 2.5
Total 16 91 727.1 56 61
Total polymorphic loci 56 51
aGrouping and distances (centiMorgan (Kosambi)) were
derived from a consensus map of P. elliottii and P. caribaea.
NB. Groups H3 and H10 were fragmented into three groups on
species maps. Linkage was inferred from reference to a
P. taeda map (Zhou et al. 2003). Distances for PtTX3103
(group H3) were uncertain. Order and distances for PtTX2146,
PtTX3046 and PtTX3096 (group H10) are from the P. taeda
mapbMonomorphic in this familycUn-scorable in this familydNote: RPTest09 and PtTX2146 are same locus—see Williams
et al. (2001)
Mol Breeding (2006) 18:11–28 25
123

Appendix 2
Single marker tests were only examined using
additive models of gene action. In the F2 family
markers only occurred in an intercross (IC) config-
uration (using the coding system from Haseman and
Elston (1972); see below). The F1 was more com-
plex, with up to six possible mating configurations
(BC1, BC2, MBC, IC, MIC3 and MIC4). Several
contrasts could be constructed for some mating types
depending on whether contrasts were based on
genotypes or alleles. For example in a MIC4
(multiple intercross, 4 alleles segregating) mating
configuration each of the four genotypes could be
contrasted. This was referred to as a ‘‘MIC4G’’, i.e.
multiple intercross with four alleles segregating,
contrasting genotypes. Additionally, for this mating
configuration contrasts could be based on allele
substitution effects for each parent, ‘‘MIC4E’’,
contrasting genotypes pooled on the P. elliottii
parent and ‘‘MIC4C’’, contrasting genotypes pooled
on P. caribaea alleles. The contrasts for MIC3,
where three alleles segregated, were further com-
plicated by possibility of homoplasy. We considered
models where an allele was identical by state (IBS)
or not IBS. Where markers segregated in an IC
configuration in the F1, the only model testable was
where alleles were considered IBS.
Contrasts used in Fisher’s exact tests for marker-trait associations in selective genotyping populations derived from an F1 and F2.
NB—dominance models were not tested in either family
Pedigree Mating config.a Parental types Possible progeny contrastsb Contrast codec Tested
F2 IC A/B·A/B A/A vs. A/B vs. B/B IC Yes
Outbred F1 MIC4 E1/E2·C1/C2 E1/C1 vs. E1/C2 vs. E2/C1 vs. E2/C2 MIC4G Yes
(E1/C1+E1/C2) vs. (E2/C1+E2/C2) MIC4/C Yes
(E1/C1+E2/C1) vs. (E1/C2+E2/C2) MIC4/E Yes
MIC3 E1/A·C1/A Assume A is not IBS then three contrasts
as for MIC4
MIC3G Yes
MIC3E Yes
Assume A is IBS MIC3C Yes
A/A vs. (E1/A+A/C1) vs. E1/C1 MIC3IBS Yes
IC A/B·A/B Assume A and B are not IBS—untestable No
Assume either A or B is IBS and the other
is not IBS—untestable
No
Assume A and B are IBS—A/A vs. A/B vs. B/B ICIBS Yes
BC E1/A·A/A E1/A vs. A/A BC Yes
BC dominant E1/–·–/– E1/– vs. –/– BCdom Yes
C1/–·–/– C1/– vs. –/–
MBC E1/E2·A/A E1/A vs. E2/A MBC Yes
aMating configuration codes from Haseman and Elston (1972); BC=backcross; MBC=multiple backcross; IC=intercross, MIC3=-
multiple intercross with 3 alleles; MIC4=multiple intercross with 4 alleles
Codes E1& E2=alleles 1&2 from P. elliottii; C1 and C2=alleles 1&2 from P. caribaea and distinguishable by size from E1 and E2;
A=is an allele that occurs in both species, likewise for B; –=null allelebIBS=Identical by statecContrast codes were constructed from the mating type code with the addition of a contrast identifier. G=genotype, where all 4
genotypic means were contrasted; E=elliottii, genotypes were pooled to test the effect of substituting alternative P. elliottii alleles;
C=caribaea, where the effect of substituting alternative alleles from the P. caribaea were contrasted; dom=dominant where marker
was treated as a dominant marker
26 Mol Breeding (2006) 18:11–28
123

References
Anonymous (1977) Queensland Department of Forestry report
of research activities. Division of Technical Services;
Queensland Department of Forestry, p 52
Auckland L, Bui T, Zhou Y, Shepherd M, Williams CG (2001)
Conifer microsatellite handbook. In: Auckland L (ed)
Conifer microsatellite workshop. Texas A&M College
Station, TX, pp 57–51
Bradshaw HD, Grattapaglia D (1994). QTL mapping in inter-
specific hybrids of forest trees. For Genet 1:191–196
Bradshaw HD, Stettler RF (1994) Molecular genetics of growth
and development in Populus II. Segregation distortion due
to genetic load. Theor Appl Genet 89:551–558
Bradshaw HDJ, Stettler RF (1995). Molecular genetics of
growth and development in Populus. IV. Mapping QTLs
with large effects on growth, form, and phenology traits in
a forest tree. Genetics 139:963–973
Bradshaw HDJ, Wilbert S, Otto KG, Schemske DW (1995)
Genetic mapping of floral traits associated with repro-
ductive isolation in monkeyflowers (Mimulus). Nature
376:762–765
Brawner J, Dieter MJJ, Nikles DG (2005) Mid-rotation per-
formance of Pinus caribaea var. hondurensis hybrids with
both P. oocarpa and P. techunumanii: hybrid superiority,
stability of parental performance and potential for a multi-
species synthetic breed. For Genet 12:1–14
Burke J, Arnold M (2001) Genetics and the fitness of hybrids.
Ann Rev Genet 35:31–52
Casson SA, Lindsey K (2003) Genes and signalling in root
development. New Phytol 158:11–38
Churchill GA, Doerge RW (1994). Empirical threshold values
for quantitative trait mapping. Genetics 138:963–971
De Klerk GJ, Van der Krieken W, De Jong JC (1999). Review
– The formation of adventitious roots: new concepts, new
possibilities. In Vitro Cell Dev B 35:189–199
Devey M, Bell J, Moran G (2001) A set of microsatellite
markers for fingerprinting and breeding applications in
Pinus radiata. Genome 45:984–989
Dieters MJ, Nikles DG, Toon PG, Pomroy P (1997) Genetic
parameters for F1 hybrids of Pinus caribaea var. hon-
durensis with both Pinus oocarpa and Pinus tecunumanii.
Can J For Res 27:1024–1031
Doebley J, Stec A (1991). Genetic analysis of the morpho-
logical differences between maize and teosinte. Genetics
129:285–295
Doebley J, Stec A (1993) Inheritance of morphological dif-
ferences between maize and teosinte: comparison of
results for two F2 populations. Genetics 134:559–570
Dvorak WS, Gutiersez EA, Hodge GR, Romero J, Stock J,
Rivas O (2000) Pinus caribaea var. hondurensis. In:
Conservation and testing of tropical and subtropical forest
tree species by the CAMCORE cooperative. Vol. College
of natural resources. Raleigh, NC, USA, pp 12–33
Echt C, Burns R (1999) SSR derived from Pinus taeda ESTs.
http://www.dendrome.ucdavis.edu/Data/primer.html
Echt CS, May-Marquardt P, Hseih M, Zahorchak R (1996)
Characterisation of microsatellite markers in eastern white
pine. Genome 39:1102–1108
Edwards KJ, Barker JHA, Daly A, Jones C (1996) Microsat-
ellite libraries enriched for several microsatellite se-
quences in plants. BioTechniques 20:758–760
Eldridge K, Davidson J, Harwood C, van Wyk G (1994).
Eucalypt domestication and breeding, 1st edn. Oxford
University Press, Oxford, p 288
Elsik CG, Minihan VT, Hall SE, Scarpa AM, Williams CG
(2000) Low-copy microsatellite markers for Pinus taeda
L. Genome 43:550–555
Farjon A, Styles B (1997) Pinus (Pinaceae). Flora neotropica
monograph 75. The New York Botanical Garden, New
York, NY
Fisher PJ, Gardner RC, Richardson TE (1996) Single locus
microsatellites isolated using 5¢ anchored PCR. Nucl
Acids Res 24:4369–4371
Fisher PJ, Richardson TE, Gardner RC (1998) Characteristics
of single- and multi-copy microsatellites from Pinus
radiata. Theor Appl Genet 96:969–979
Flint-Garcia SA, Thornsberry JM, Buckler IV ES (2003)
Structure of linkage disequilibrium in plants. Ann Rev
Plant Biol 54:357–374
Forbes SN, Valenzuela RK, Keim P, Service PM (2004)
Quantitative trait loci affecting life span in replicated
populations of Drosophila melanogaster. I. Composite
interval mapping. Genetics 168:301–311
Greaves A (1978) Descriptions of seed sources and collections
for provenances of Pinus caribaea 12. University of
Oxford, Oxford, pp 1–100
Haines RJ (2000) Clonal forestry in Queensland and implica-
tions for hybrid breeding strategies. In: Hybrid breeding
and genetics of forest trees. Proceedings of QFRI/CRC-
SPF symposium, 9–14th April 2000. Noosa, Queensland,
Australia. Department of Primary Industries, Brisbane, pp
386–389
Haseman JK, Elston RC (1972) The investigation of linkage
between quantitative trait and a marker locus. Behav
Genet 2:3–19
Hicks M, Adams D, O’Keefe S, Macdonald E, Hodgetts R
(1998) The development of RAPD and microsatellite
markers in lodgepole pine (Pinus contorta var. latifolia).
Genome 41:797–805
Jansen RC, Stam P (1994) High resolution of quantitative traits
into multiple loci via interval mapping. Genetics
136:1447–1455
Kerr KE, Dieter MJJ, Tier B, Dungey H (2004a) Simulation of
hybrid forest tree breeding strategies. Can J For Res 34:
195–208
Kerr RJ, Dieters MJ, Tier B (2004b) Simulation of the com-
parative gains from four different hybrid tree breeding
strategies. Can J For Res 34:209–220
Lewty MJ (1990) Effects of water logging on the growth and
water relations of tree Pinus taxa. For Ecol Manage
30:189–201
Little E (1971) Atlas of United States trees. Vol. Conifers and
important hardwoods. Misc. Public. 1146. USDA For.
Serv., Washington, DC
Little L, Critchfield W (1969) Subdivisions of the Genus
Pinus Report no. 1144. US Forest Service Misc. Publ.
p 51
Mol Breeding (2006) 18:11–28 27
123

Nikles D (1966) Comparative variability and relationships of
Caribbean pine (Pinus caribaea Mor.) and slash pine
(Pinus elliottii Engelm.). Ph.D., North Carolina State
University, Raleigh
Nikles DG (1996) The first 50 years of the evolution of forest
tree improvement in Queensland. In: Dieters M, et al.
(eds), Tree improvement for sustainable forestry: QFRI-
IUFRO conference, Caloundra, Queensland. 27 Oct-1
Nov. QFRI, pp 51–64
Nikles DG, Dungey HS, Dieters MJ, Toon PG (1999) Perfor-
mance of Slash X Loblolly pine inbred and outcrossed F2
hybrids in Queensland, Australia. In: Southern forest tree
improvement conference, New Orleans. July 11–14.
Louisiana State University, pp 126–135
Orr HA (1998) The population genetics of adaptation: the
distribution of factors fixed during adaptive evolution.
Evolution 52:935–949
Orr HA, Coyne JA (1992). The genetics of adaptation: a
reassessment. Am Nat 140:725–742
Palaisa K, Bhatramakki D, Williams ME, Smith O, Morgante
M, Tingey S, Rafalski A (2003) Sequence diversity and
long range linkage disequilibrium around the maize Y1
locus. In: Plant and animal genomes XI, San Diego. Jan
11–15, pp Poster 441
Paterson A, Damon S, Hewitt J, Zamir D, Rabinowitch H,
Lincoln S, Lander E, Tanksley S (1991) Mendelian factors
underlying quantitative traits in tomato: comparison
across species, generations and environments. Genetics
127:181–197
Paterson A, Lin Y-R, Li Z, Schertz K, Doebley J, Pinson S, Liu
S-C, Stansel J, Irvine J (1995) Convergent domestication
of cereal crops by independent mutations at corresponding
genetic loci. Science 269:1714
Powell M (2000) Genetic parameter estimation for hybrid
pines in Queensland. PhD, University of Queensland,
Brisbane
Remington DL, O’Malley DM (2000) Whole-genome charac-
terization of embryonic stage inbreeding depression in a
selfed loblolly pine family. Genetics 155:337–348
Remington DL, Whetten RW, Liu BH, O’Malley DM (1999)
Construction of an AFLP genetic map with nearly com-
plete genome coverage in Pinus taeda. Theor Appl Genet
98:1279–1292
Ridley M (2004) Adaptive explanation. In: Evolution, vol.,
3rd edn. Blackwell Science Ltd, Oxford, UK, pp 255–
291
Rieseberg L, Baird S, Gardner K (2000) Hybridisation, intro-
gression, and linkage evolution. Plant Mol Bio 42:205–
224
Rieseberg LH (2001) Chromosomal rearrangements and spe-
ciation. Trends Ecol Evol 16:351–358
Righter F, Duffield J (1951) Interspecies hybrids in pines: a
summary of interspecific crosses in the genus Pinus
made at the Institute of Forest Genetics. J Hered 42:75–
80
Shepherd M, Cross M, Stokoe RL, Scott LJ, Jones ME (2002)
High throughput DNA extraction for forest trees. Plant
Mol Biol Rep 20: publish by abstract 1–10
Shepherd M, Jones M (2005). Molecular markers in tree
improvement: characterisation and use in Eucalyptus. In:
Lorz H, Wenzel G (eds) Molecular marker systems in
plant breeding and crop improvement, vol. 55. Springer-
Verlag, Heidelberg, pp 399–409
Shepherd M, Mellick R, Toon P, Dale G, Dieters M (2005)
Genetic control of adventitious rooting on stem cuttings in
two Pinus elliottii · P. caribaea hybrid families. Ann For
Sci 62:403–412
Slee M (1970) Crossability values within the slash-Caribbean
Pinus species complex. Euphytica 19:184–189
Smith DN, Devey ME (1994) Occurrence and inheritance of
microsatellites in Pinus radiata. Genome 37:977–983
Soranzo N, Provan J, Powell W (1998) Characterization of
microsatellite loci in Pinus sylvestris L. Mol Ecol 7:1247–
1263
Strauss SH, Lande R, Namkoog G (1992) Limitations of
molecular-aided selection in forest tree breeding. Can
J For Res 22:1050–1061
Stuber CW (1989). Molecular Markers in the Manipulation of
Quantitative Characters. In: Brown A, et al. (eds) Plant
Population genetics, breeding, and genetic resources. vol.
Sinauer Associates, Inc., Sunderland MA, pp 334–350
Vaillancourt RE, Potts BM, Watson M, Volker PW, Hodges G,
Reid JB, West A (1995) Detection and prediction of
heterosis in Eucalyptus globulus. For Genet 2:11–19
Van Ooijen J, Voorrips R (2001) JoinMap 3.0 Software for the
calculation of genetic linkage maps. Plant Research
International B.V., Wageningen
Van Ooijen J, Boer M, Jansen R, Maliepaard C (2002)
MapQTL (tm) Version 4.0, Software for the calculation of
QTL positions on genetic maps. Plant Research Interna-
tional, Wageningen, The Netherlands
Wakeley PC (1954) Planting the southern pines USDA Forest
Service agricultural monograph, vol. 18. USDA Forest
Service, Washington DC, p 233
Walker S, Haines R, Dieters M (1996) Beyond 2000: clonal
forestry in Queensland. In: Dieters M, et al. (eds) QFRI-
IUFRO conference ‘‘Tree improvement for sustainable
forestry’’, Caloundra, Queensland, Australia. 27 October–
1 November. QFRI, pp 351–354
Williams CG, Savolainen O (1996). Inbreeding depression in
conifers. For. Sci. 41:1–20
Williams CG, Zhou Y, Hall SE (2001) A chromosomal region
promoting outcrossing in a conifer. Genetics 159:1283–
1289
Zheng YQ, Ennos RA (1999) Genetic variability and structure
of natural and domesticated populations of Caribbean pine
(Pinus caribaea Morelet). Theor Appl Genet 98:765–771
Zhou Y, Bui T, Auckland L, Williams C (2002) Underme-
thylated DNA as a source of microsatellites from a conifer
genome. Genome 45:91–99
Zhou Y, Gwaze DP, Bui T, Williams CG (2003) No clustering
for linkage map based on low-copy and undermethylated
microsatellites. Genome 46:809–816
Zobel B, Talbert JT (1984) Applied forest tree improvement.
In: Applied forest tree improvement. vol., 1st ed. John
Wiley & Sons, New York, pp 437–458
28 Mol Breeding (2006) 18:11–28
123


![A Flexible Hybrid Model of Life Cycle Carbon Balance for ...carboncenter.ifas.ufl.edu/models/integrated_model...Franco) [13] or slash pine (Pinus elliottii Engelm. var. elliottii)](https://static.fdocuments.net/doc/165x107/6074fb07d893f122622c9e06/a-flexible-hybrid-model-of-life-cycle-carbon-balance-for-franco-13-or.jpg)