Congestion Management System-fulltext · Congestion Management System ... Congestion Management...
41
Page 1 Rappahannock-Rapidan Region Congestion Management System Plan Rappahannock-Rapidan Regional Commission May 2008
Transcript of Congestion Management System-fulltext · Congestion Management System ... Congestion Management...

Page 1
Rappahannock-Rapidan Region
Congestion Management System Plan
Rappahannock-Rapidan Regional Commission May 2008
Page i
Table of Contents
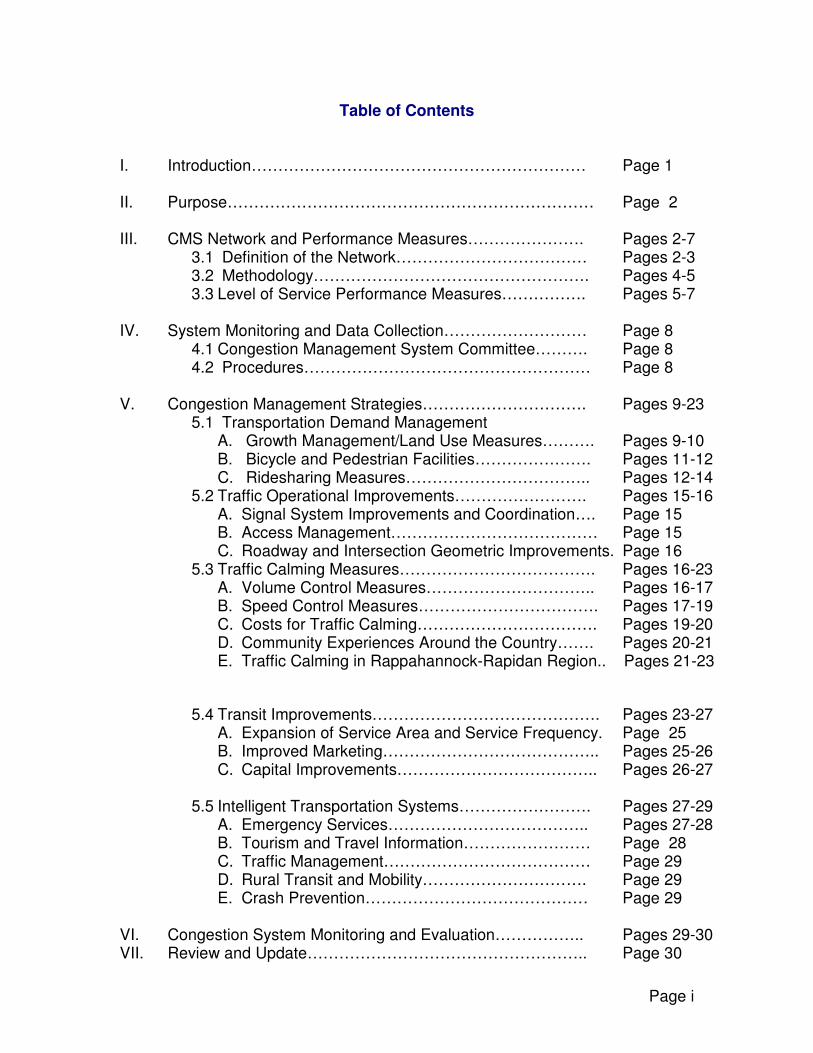
I. Introduction……………………………………………………… Page 1 II. Purpose…………………………………………………………… Page 2 III. CMS Network and Performance Measures…………………. Pages 2-7
3.1 Definition of the Network……………………………… Pages 2-3 3.2 Methodology……………………………………………. Pages 4-5 3.3 Level of Service Performance Measures……………. Pages 5-7
IV. System Monitoring and Data Collection……………………… Page 8 4.1 Congestion Management System Committee………. Page 8 4.2 Procedures……………………………………………… Page 8
V. Congestion Management Strategies…………………………. Pages 9-23 5.1 Transportation Demand Management
A. Growth Management/Land Use Measures………. Pages 9-10 B. Bicycle and Pedestrian Facilities…………………. Pages 11-12 C. Ridesharing Measures…………………………….. Pages 12-14
5.2 Traffic Operational Improvements……………………. Pages 15-16 A. Signal System Improvements and Coordination…. Page 15 B. Access Management………………………………… Page 15 C. Roadway and Intersection Geometric Improvements. Page 16
5.3 Traffic Calming Measures………………………………. Pages 16-23 A. Volume Control Measures………………………….. Pages 16-17 B. Speed Control Measures……………………………. Pages 17-19 C. Costs for Traffic Calming……………………………. Pages 19-20 D. Community Experiences Around the Country……. Pages 20-21 E. Traffic Calming in Rappahannock-Rapidan Region.. Pages 21-23
5.4 Transit Improvements……………………………………. Pages 23-27
A. Expansion of Service Area and Service Frequency. Page 25 B. Improved Marketing………………………………….. Pages 25-26 C. Capital Improvements……………………………….. Pages 26-27
5.5 Intelligent Transportation Systems……………………. Pages 27-29
A. Emergency Services……………………………….. Pages 27-28 B. Tourism and Travel Information…………………… Page 28 C. Traffic Management………………………………… Page 29 D. Rural Transit and Mobility…………………………. Page 29 E. Crash Prevention…………………………………… Page 29
VI. Congestion System Monitoring and Evaluation…………….. Pages 29-30 VII. Review and Update…………………………………………….. Page 30

Page ii
FOOTNOTES……………………………………………………….. Page 31
APPENDICES Appendix I: 2007 Rappahannock-Rapidan Region Travel Time Survey… Pages 32-36 Appendix II: 2008 Rappahannock-Rapidan Region Travel Time Survey… Page (not inc.) Appendix III: Growth in VRT Ridership by System in the PD9 Region…. Pages 37-38
Page 1
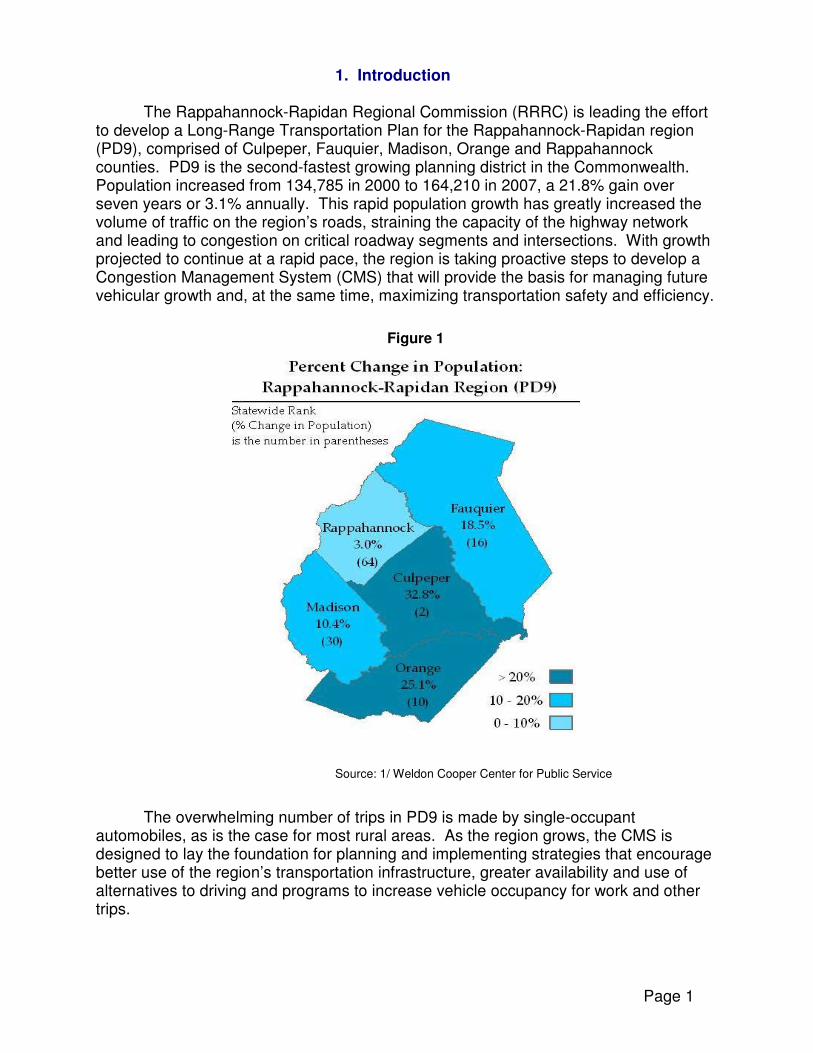
1. Introduction The Rappahannock-Rapidan Regional Commission (RRRC) is leading the effort to develop a Long-Range Transportation Plan for the Rappahannock-Rapidan region (PD9), comprised of Culpeper, Fauquier, Madison, Orange and Rappahannock counties. PD9 is the second-fastest growing planning district in the Commonwealth. Population increased from 134,785 in 2000 to 164,210 in 2007, a 21.8% gain over seven years or 3.1% annually. This rapid population growth has greatly increased the volume of traffic on the region’s roads, straining the capacity of the highway network and leading to congestion on critical roadway segments and intersections. With growth projected to continue at a rapid pace, the region is taking proactive steps to develop a Congestion Management System (CMS) that will provide the basis for managing future vehicular growth and, at the same time, maximizing transportation safety and efficiency.
Figure 1
Source: 1/ Weldon Cooper Center for Public Service
The overwhelming number of trips in PD9 is made by single-occupant automobiles, as is the case for most rural areas. As the region grows, the CMS is designed to lay the foundation for planning and implementing strategies that encourage better use of the region’s transportation infrastructure, greater availability and use of alternatives to driving and programs to increase vehicle occupancy for work and other trips.

Page 2
2. Purpose
The RRRC views the Congestion Management System as an integral part of the Long-Range Transportation Plan for the region. Federal transportation legislation requires Metropolitan Planning Organizations (MPOs) to include a CMS as part of their overall transportation planning process (see 23 C.F.R. 500). While rural but rapidly urbanizing regions like PD9 are not mandated to include a CMS in their transportation planning process, the pressures from residential and commercial development and accompanying traffic growth in PD9 due to its proximity to Northern Virginia, Washington D.C., Fredericksburg and other metropolitan areas, suggests that developing a CMS Plan is prudent and timely and will position the region well for dealing with future traffic growth.
A Congestion Management System is a systematic process of monitoring, measuring and diagnosing the causes of current and future projected congestion in major travel corridors; evaluating and recommending alternative strategies to manage or mitigate current and future congestion; and, then, monitoring and evaluating the performance of strategies that have been implemented to manage congestion. The CMS provides a systematic basis on which transportation investment decisions can be made and ensures that Travel Demand Management (TDM) and Transportation System Management (TSM) measures are considered prior to roadway expansion or, if roadway expansion is needed, act as a complement to such expansion.
The PD9 Congestion Management System consists of the following components: • CMS network • Parameters and performance measure • System monitoring and data collection • Congestion management strategies • System evaluation • Review and update
3. CMS Network and Performance Measures
3.1 Definition of the Network: The CMS network consists of the PD9 regional arterial roadway system and
selected secondary roads. The network consists of two components: 1) Regional Arterials, defined as arterials through the region that connect the region with adjacent counties and regions and that provide essential connections between towns of the region; and 2) Local Arterials, defined as arterials within the region’s largest towns and communities.
1) Regional Arterials: I-66, Route 3, Route 15, Route 17, Route 20, Route 28,
Route 29, Route 33, Route 50, Route 211, Route 229, Route 231, Route 522 2) Local Arterials: Business Route 15, Business Route 17, Business Route 29.

Page 3
Figure 2 Arterials and Towns of the Rappahannock-Rapidan Region
Page 4
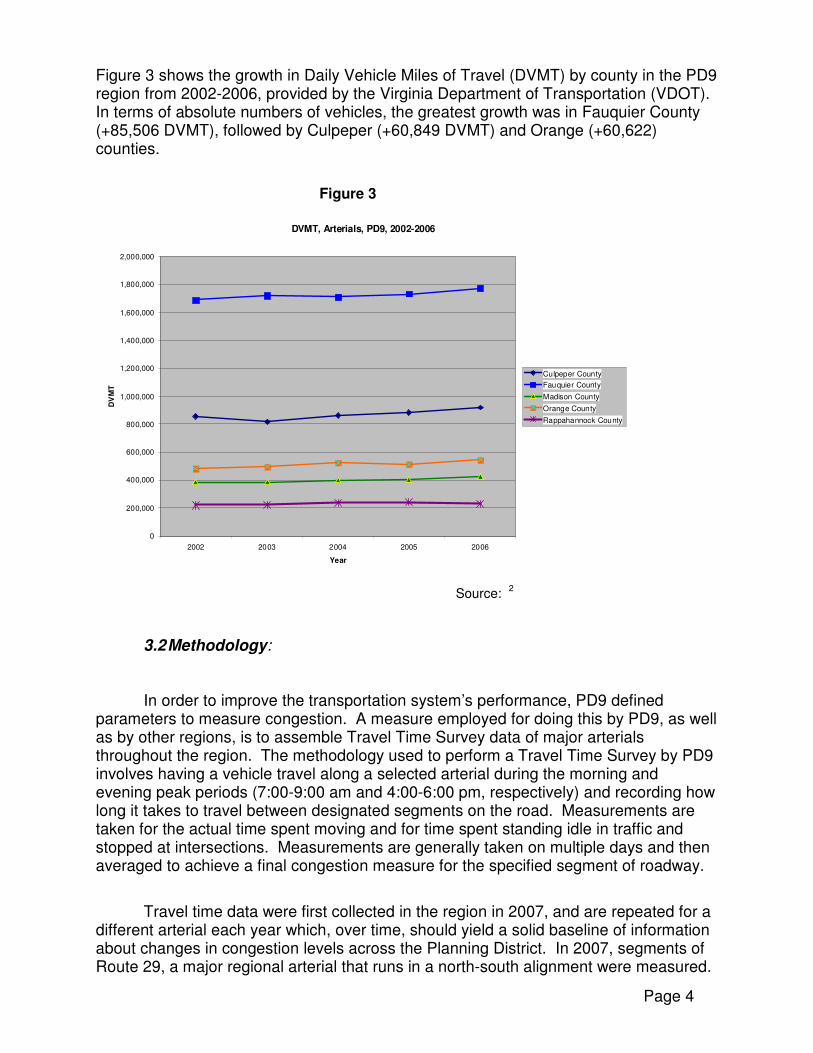
Figure 3 shows the growth in Daily Vehicle Miles of Travel (DVMT) by county in the PD9 region from 2002-2006, provided by the Virginia Department of Transportation (VDOT). In terms of absolute numbers of vehicles, the greatest growth was in Fauquier County (+85,506 DVMT), followed by Culpeper (+60,849 DVMT) and Orange (+60,622) counties.
Figure 3
DVMT, Arterials, PD9, 2002-2006
0
200,000
400,000
600,000
800,000
1,000,000
1,200,000
1,400,000
1,600,000
1,800,000
2,000,000
2002 2003 2004 2005 2006
Year
DV
MT
Culpeper County
Fauquier County
Madison County
Orange County
Rappahannock County
Source: 2
3.2 Methodology:
In order to improve the transportation system’s performance, PD9 defined parameters to measure congestion. A measure employed for doing this by PD9, as well as by other regions, is to assemble Travel Time Survey data of major arterials throughout the region. The methodology used to perform a Travel Time Survey by PD9 involves having a vehicle travel along a selected arterial during the morning and evening peak periods (7:00-9:00 am and 4:00-6:00 pm, respectively) and recording how long it takes to travel between designated segments on the road. Measurements are taken for the actual time spent moving and for time spent standing idle in traffic and stopped at intersections. Measurements are generally taken on multiple days and then averaged to achieve a final congestion measure for the specified segment of roadway.
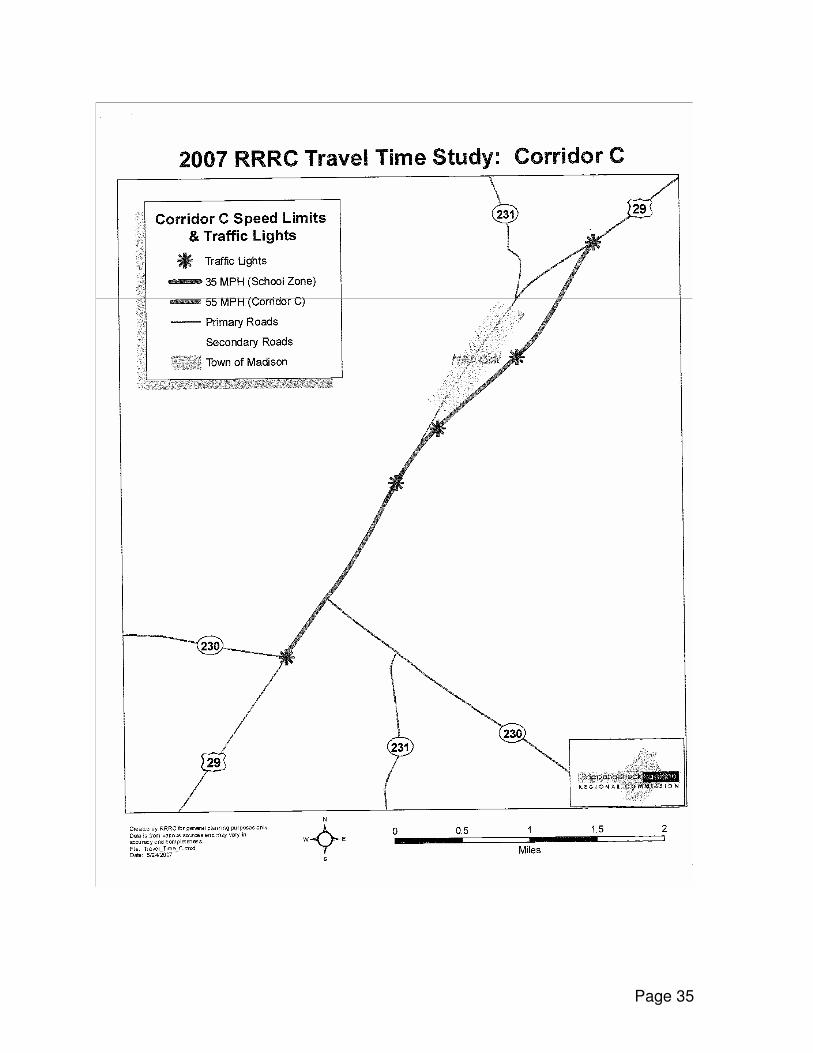
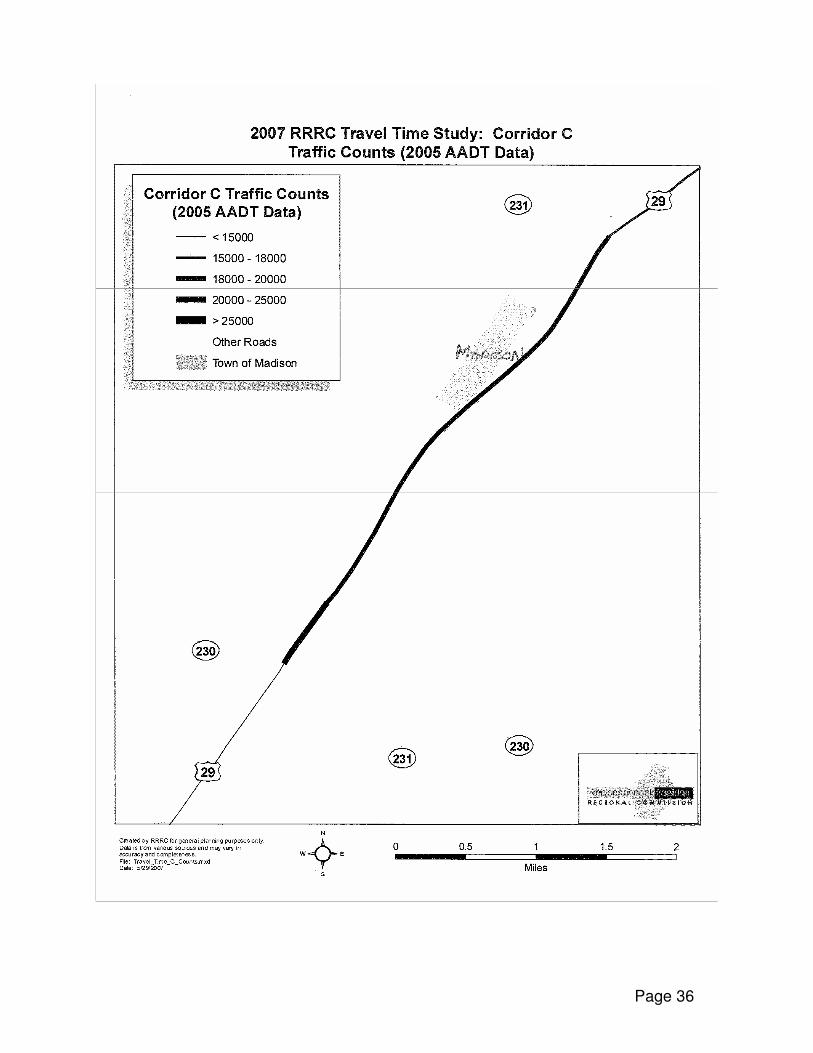
Travel time data were first collected in the region in 2007, and are repeated for a different arterial each year which, over time, should yield a solid baseline of information about changes in congestion levels across the Planning District. In 2007, segments of Route 29, a major regional arterial that runs in a north-south alignment were measured.
Page 5
In 2008, travel time data were collected on segments of Route 15, another major north-south arterial that joins with Route 29 for part of its alignment. Appendix 1 and Appendix 2 display some of the information that was collected in each of those years.
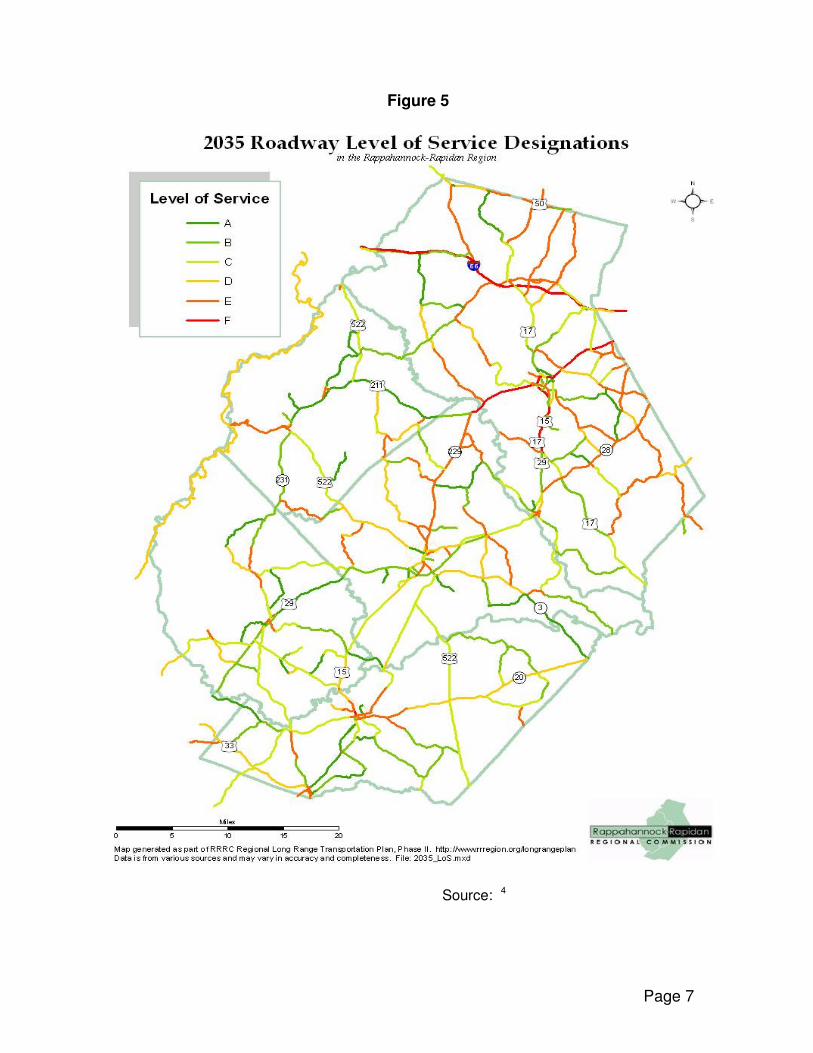
3.3 Level of Service Performance Measure: The Performance Measure that was used for the CMS is Level of Service (LOS), which is based upon the observed and projected Volume to Capacity (V/C) ratios. The V/C ratio is the demand for travel on a roadway segment divided by the capacity of the roadway segment. LOS is a qualitative measure of roadway performance, as defined in the Highway Capacity Manual, that is based on the V/C ratio. Level of Service is reported on a scale of A to F, with A representing the best operating conditions and F the worst.
Figure 4 shows the existing Level of Service Designations for the PD9 region in base year 2005, based on VDOT-provided traffic volumes and roadway capacities. As shown in the legend, green represents the best conditions or Level of Service A and red the worst conditions or Level of Service E. Figure 5 shows projections of future Level of Service Designations for the region, based on VDOT-provided projections derived from projected growth trends, land use patterns and other data.
A variety of factors determine the design capacity of a roadway, including the type of facility (arterial, secondary, etc), number of travel lanes, lane width, average travel speed, spacing of intersections and driveways, percent of truck traffic and other factors.
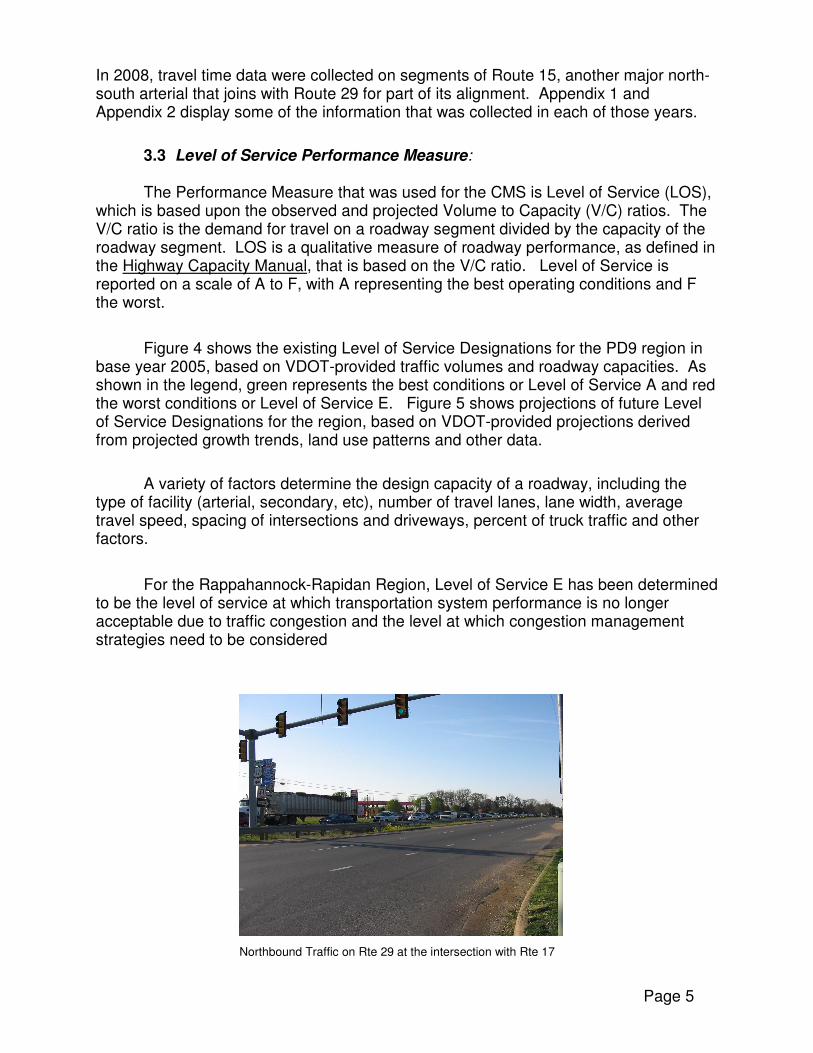
For the Rappahannock-Rapidan Region, Level of Service E has been determined to be the level of service at which transportation system performance is no longer acceptable due to traffic congestion and the level at which congestion management strategies need to be considered
Northbound Traffic on Rte 29 at the intersection with Rte 17

Page 6
Source: 3
Page 7
Figure 5
Source: 4

Page 8
4. System Monitoring and Data Collection
4.1 Congestion Management System Committee: A Congestion Management System Committee (CMSC) shall be established, comprised of members of the RRRC Transportation Technical Committee. The CMSC will meet periodically to review the CMS strategies and suggest changes, when needed and present its recommendations to the full Transportation Technical Committee. RRRC transportation staff will staff the Committee.
4.2 Procedures: The RRRC will collect Travel Time Survey data on an annual basis, with
surveys of different major regional arterials conducted each year. After all major regional arterials have been surveyed once, estimated at a cycle of five-six years, roadways that were initially surveyed will be revisited to assess changes in conges- tion levels. In this way, over time, a historical baseline of traffic congestion in the region will be developed.
Culpeper Trolley at the Depot Warrenton Circuit Rider on Main Street
Transit Use data is collected by Virginia Regional Transit (VRT) for transit service
provided in the region and is provided to the towns of Culpeper, Orange and Warrenton, which have transit service within their jurisdictions operated by VRT. Annual transit use data will be used to analyze trends in transit patronage.
In future years, as non-motorized facilities are developed, RRRC may wish to begin taking annual or bi-annual surveys of pedestrian and bicycle traffic in key locations of the region to establish a trend line of non-motorized traffic.
Also, to be included should be participation and trend data, relative the number of
carpools and vanpools across the region from the Commission’s growing Commuter Service Program. RRRC Commuter Services, in addition to providing area commuters with a car and vanpool matching service, monitors the use of a series of park-and-ride lots across the planning district, and works with area employers to encourage increased ridesharing and advancement of other TDM measures.
Page 9
5. Congestion Management Strategies
CMS are classified by the federal SAFETEA-LU legislation into five categories: 1) Demand management; 2) Traffic operational improvements; 3) Transit improvements; 4) ITS technologies; 5) Added system capacity.
The strategies within each of these categories that hold the greatest promise for
the PD9 region comprise the balance of this report.
5.1 Transportation Demand Management A. Growth Management/Land Use Measures:
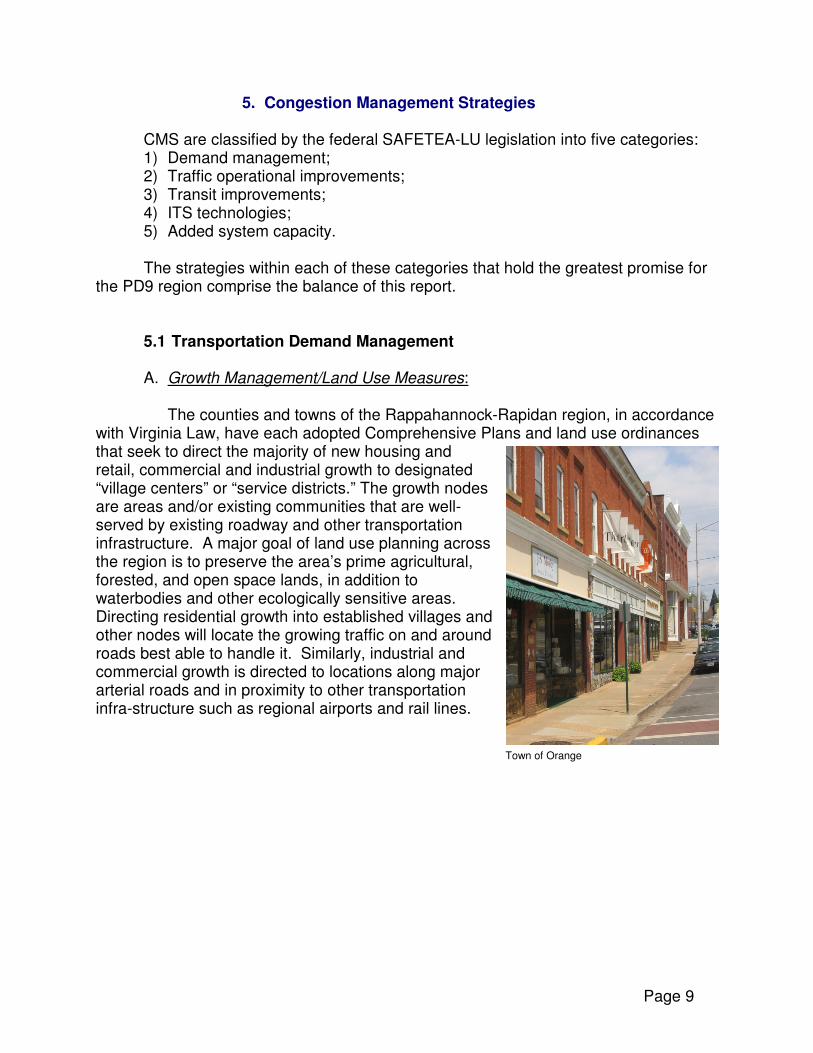
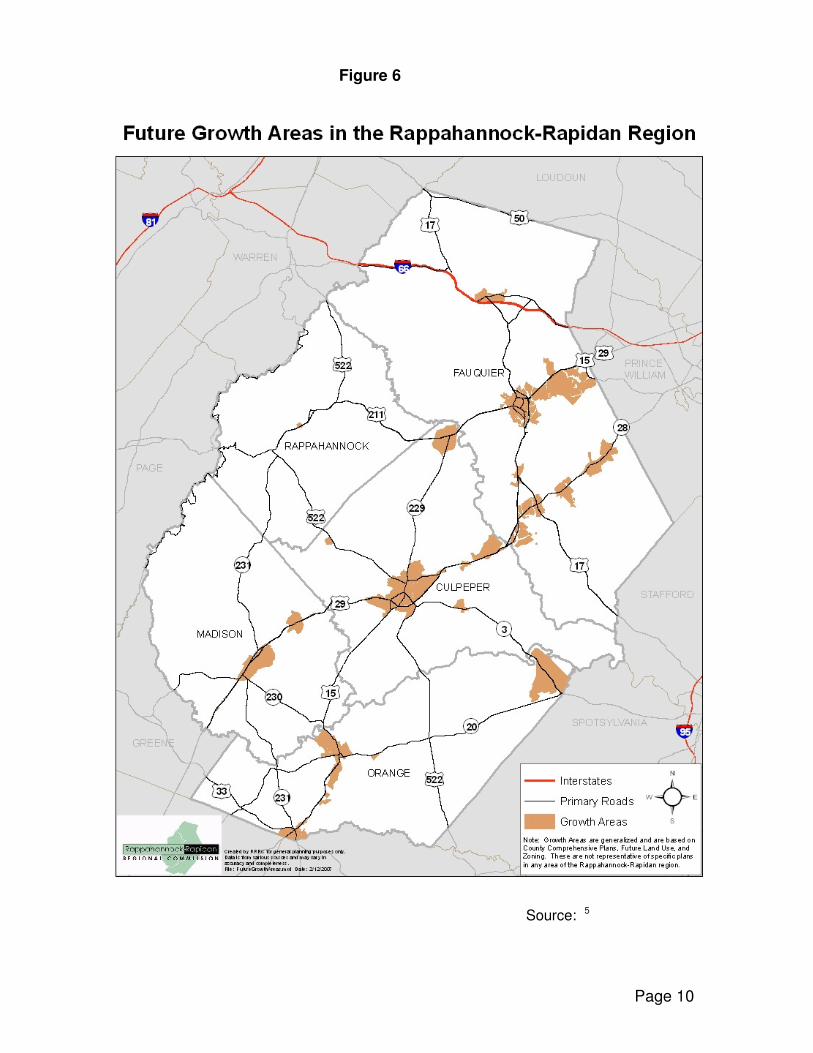
The counties and towns of the Rappahannock-Rapidan region, in accordance with Virginia Law, have each adopted Comprehensive Plans and land use ordinances that seek to direct the majority of new housing and retail, commercial and industrial growth to designated “village centers” or “service districts.” The growth nodes are areas and/or existing communities that are well-served by existing roadway and other transportation infrastructure. A major goal of land use planning across the region is to preserve the area’s prime agricultural, forested, and open space lands, in addition to waterbodies and other ecologically sensitive areas. Directing residential growth into established villages and other nodes will locate the growing traffic on and around roads best able to handle it. Similarly, industrial and commercial growth is directed to locations along major arterial roads and in proximity to other transportation infra-structure such as regional airports and rail lines.
Town of Orange
Page 10
Figure 6
Source: 5
Page 11
B. Bicycle and Pedestrian Facilities:
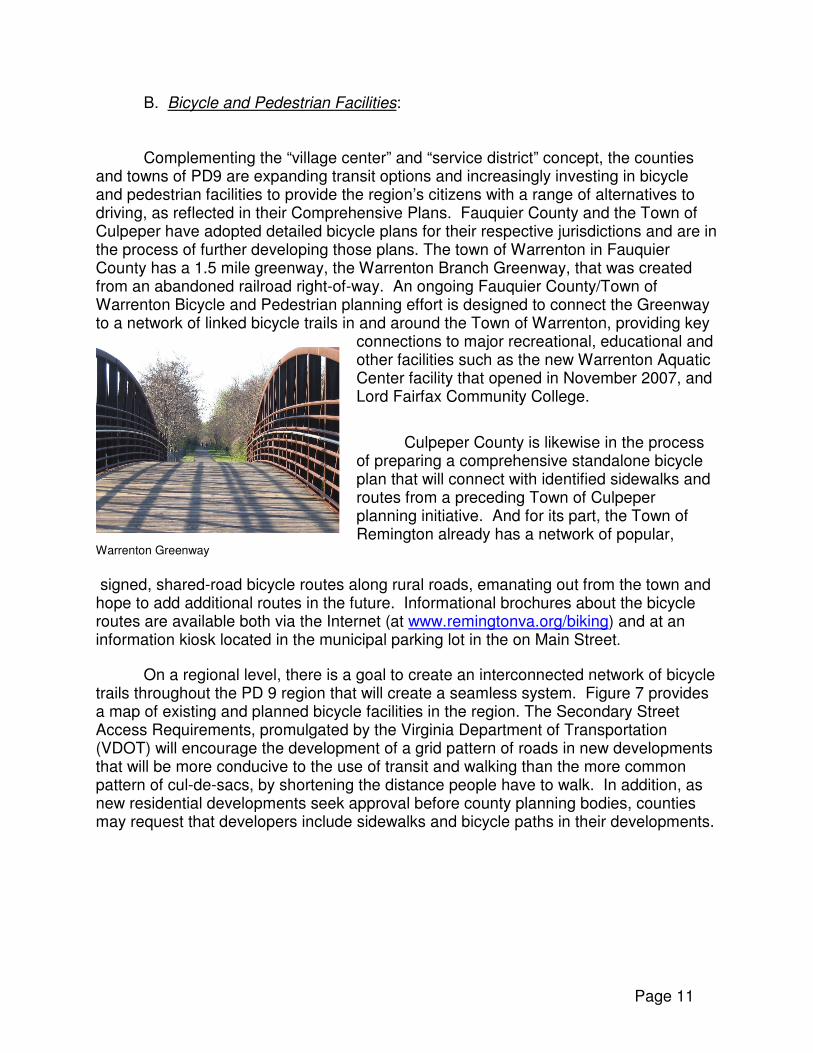
Complementing the “village center” and “service district” concept, the counties and towns of PD9 are expanding transit options and increasingly investing in bicycle and pedestrian facilities to provide the region’s citizens with a range of alternatives to driving, as reflected in their Comprehensive Plans. Fauquier County and the Town of Culpeper have adopted detailed bicycle plans for their respective jurisdictions and are in the process of further developing those plans. The town of Warrenton in Fauquier County has a 1.5 mile greenway, the Warrenton Branch Greenway, that was created from an abandoned railroad right-of-way. An ongoing Fauquier County/Town of Warrenton Bicycle and Pedestrian planning effort is designed to connect the Greenway to a network of linked bicycle trails in and around the Town of Warrenton, providing key
connections to major recreational, educational and other facilities such as the new Warrenton Aquatic Center facility that opened in November 2007, and Lord Fairfax Community College.
Culpeper County is likewise in the process of preparing a comprehensive standalone bicycle plan that will connect with identified sidewalks and routes from a preceding Town of Culpeper planning initiative. And for its part, the Town of Remington already has a network of popular,
Warrenton Greenway
signed, shared-road bicycle routes along rural roads, emanating out from the town and hope to add additional routes in the future. Informational brochures about the bicycle routes are available both via the Internet (at www.remingtonva.org/biking) and at an information kiosk located in the municipal parking lot in the on Main Street.
On a regional level, there is a goal to create an interconnected network of bicycle
trails throughout the PD 9 region that will create a seamless system. Figure 7 provides a map of existing and planned bicycle facilities in the region. The Secondary Street Access Requirements, promulgated by the Virginia Department of Transportation (VDOT) will encourage the development of a grid pattern of roads in new developments that will be more conducive to the use of transit and walking than the more common pattern of cul-de-sacs, by shortening the distance people have to walk. In addition, as new residential developments seek approval before county planning bodies, counties may request that developers include sidewalks and bicycle paths in their developments.

Page 12
Figure 7
Source: 6
C. Ridesharing
The Rappahannock-Rapidan region has developed a successful rideshare
matching service, as earlier referenced, as part of its RRRC Commuter Services program, that generates computerized match listing of like area commuters heading to

Page 13
the same destinations from across the growing PD9 region. Given the large number of employees who travel to jobs in Northern Virginia, Fredericksburg, Charlottesville, Washington, D.C, and other locations outside the planning district, ridesharing is one of the top priority congestion mitigation strategies for the region.
When used by large numbers of travelers, ridesharing reduces automobile trips and provides energy and air quality benefits for the community. Ridesharing provides substantial benefits to the users through savings on gas, wear and tear on their cars and a relaxing, stress-free way to get to and from work. For employers, ridesharing has been shown to also help reduce absenteeism.
In cooperation with VDOT, the region has established thirteen park-and-ride lots at key locations that support the use of ridesharing, as shown in Figure 8. The two largest lots are located in Warrenton and Midland, which have the capacity for 212 cars and 110 cars, respectively. The region is also working to establish a demonstration project Commuter bus service that would transport employees in the region to jobs in Northern Virginia and Washington D.C.
40%
10%
23%
12%
15%
0-15 min.
16-29 min.
30-45 min.
46-60 min.
Over 60 min.

Page 14
Figure 8
Warrenton Park and Ride Lot
Page 15
5.2 Traffic Operational Improvements
A. Signal System Improvements and Coordination
In addition, improvements to traffic signalization constitute one of the most cost-
effective means to reduce congestion. Properly timed and coordinated signals can increase the traffic-handling capacity of a roadway and also benefit pedestrians by interrupting the flow of traffic on a busy road. Improvements to traffic signalization involve optimizing the phase sequence and timing of lights to accommodate traffic volumes that have been documented through study. Signal coordination involves optimizing a series of traffic lights along a travel corridor and may also entail intersection geometric improvements. In order for traffic synchronization projects to be successful, detailed traffic data is needed for the locations and corridors in question, including: length of queue at the intersection(s), stopping delays, turning movements and link segment traffic volumes. Experience in other U.S. cities has shown that signal system improvements and coordination are highly effective tools in managing traffic. In Seattle, Washington, a 2.1-mile signal priority system was implemented and resulted in an average of 13% reduction in intersection delay during the morning peak period in the affected area. Additional delay reduction benefits occurred on side streets and left-turn lanes feeding into the main corridor.
B. Access Management
Another important strategy in promoting and ensuring efficient highway operation is access management. Access management refers to implementation and enforcement of guidelines that determine the manner in which users are provided safe access to a highway. Access management helps to reduce congestion and access-related accidents. The challenge is to create the proper balance between the private property owner’s business interests and the safety interests of the general public. VDOT promulgated Access Management Regulations in November 2007 that will become effective for all Virginia counties and communities on July 1, 2008. 9 The Virginia Code grants the Commonwealth Transportation Board (CTB) and VDOT
authority to designate highways as limited access and eliminate access routes to those facilities. The Access Management Regulations define access management as the “systematic control of the location, spacing, design and operation of entrances, median openings, traffic signals and interchanges for the purpose of providing vehicle access to land development in a manner that preserves the safety and efficiency of the transportation system.” Under the regulations, all applications for entrance permits must be obtained from the VDOT Residency for the county in which the work is located. The regulations require that all entrance design and construction “shall accommodate pedestrian and bicycle users of the highway in accordance with the CTB “Policy for Integrating Bicycle and Pedestrian Accommodations” and must also consider transit users where that is applicable and provide accommodations to the extent possible. Sections of Route 29/15 in the PD9 are already limited access highway and the region, in coordination with VDOT, is studying other segments of this major corridor to achieve limited access on them.

Page 16
C. Roadway and Intersection Geometric Improvements
Another effective means of improving traffic flow is through roadway and intersection geometric improvements. Areas of geometric design that can provide significant benefits in rural areas include improved sight distance and intersection geometrics. The level of service at an intersection can be adversely affected by left-turning vehicles that block the flow of traffic behind them, especially at peak travel times. Construction of left- and right-turning lanes provides a queue space for vehicles needing to turn at busy intersections and helps maintain traffic flow. The lanes also reduce the potential for passing-related accidents.
In addition, restrictions on turning movements on busy arterials is an effective roadway geometric improvement. This can be achieved by placement of a median barrier between the two directions on an arterial, consisting of a curb or a raised median that restricts turning movements to designated breaks in the median. A raised median also enhances pedestrian safety by providing a safe mid-point on a busy roadway where pedestrians can wait for a break in the traffic. Time of day restrictions on turning movements are also effective traffic flow and safety measures. Left turns can be restricted at key intersections during the morning and evening peak hours to prevent the disruption of traffic flow when volumes are the heaviest and lifted during the rest of the day.
5.3 Traffic Calming Measures Traffic calming is defined as “the combination of mainly physical measures that reduce the negative effects of motor vehicle use, alter driver behavior and improve conditions for non-motorized street users.” Traffic calming relies on physical changes to the built environment to bring about changes in traffic flow and driver behavior. It involves changes in street alignment, installation of barriers and other physical measures to reduce traffic speed and cut-through traffic. The result of implementing calming measures is increased safety, livability and other public benefits. Traffic calming first took root in the Netherlands in the 1960s when citizens began reclaiming some of their street space for non-vehicular use. It rapidly spread to other European countries including Germany, Sweden, Denmark and England and to Japan in Asia and began to gain popularity in the United States in the mid-1990s. Since then, it has been implemented by hundreds of U.S. cities and communities.10
Traffic calming measures are generally divided into two categories: speed
control measures and volume control measures.
A. Volume Control Measures: 11 Volume Control Measures are traffic calming measures that have a primary focus in reducing traffic volumes on streets. Some examples are:
� Full Street Closures: This involves placing a barrier across a street to close
the street to through traffic. The barriers can be landscaped islands, walls or gates;

Page 17
Full Closure, Berkeley, CA: blocks all entry by cars Half-street closure, Eugene, OR: blocks entry in one Direction by cars but allows access for bikes
� Half Closures: These are barriers that block travel in one direction for a short
distance on an otherwise two-way street. It is one of the most common volume-control measures. Half-closures are generally located at intersections but are sometimes located in the middle of blocks between residential and non-residential land uses;
� Diagonal Diverters: barriers placed diagonally across an intersection to block through movement;
� Median barriers: These are raised islands at the centerline of a street and
continuing through an intersection to block through movement at a cross street. They improve safety at the intersection of a local street with a major street by preventing dangerous turning movements.
Diagonal Diverter in Boulder, CO: uses a wide Median Barrier in Montgomery County, MD: landscaped closure with raised contour and barrier allows left turns out of the side street paved pedestrian/bicycle walkway to connect by use of a short barrier. both sides.
B. SPEED CONTROL MEASURES:12 Many communities have focused on speed control rather than volume control
measures to slow traffic through neighborhoods and on low volume roads. Examples include:
Page 18
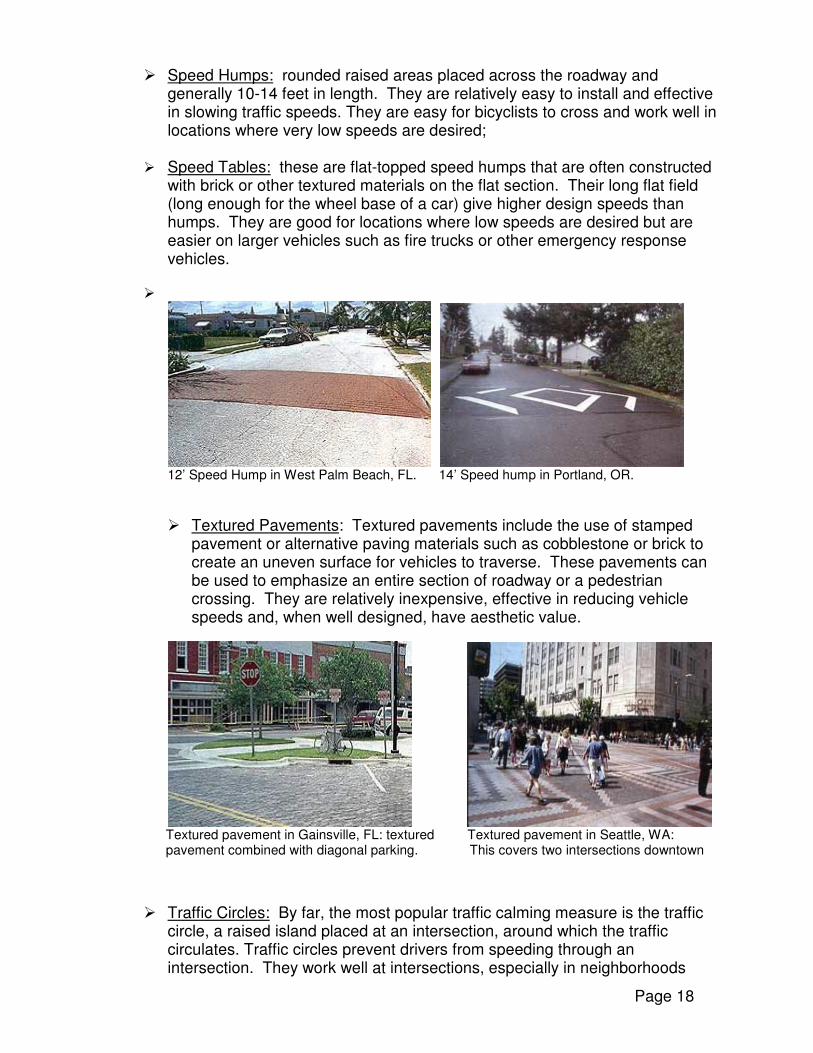
� Speed Humps: rounded raised areas placed across the roadway and generally 10-14 feet in length. They are relatively easy to install and effective in slowing traffic speeds. They are easy for bicyclists to cross and work well in locations where very low speeds are desired;
� Speed Tables: these are flat-topped speed humps that are often constructed with brick or other textured materials on the flat section. Their long flat field (long enough for the wheel base of a car) give higher design speeds than humps. They are good for locations where low speeds are desired but are easier on larger vehicles such as fire trucks or other emergency response vehicles.
�
12’ Speed Hump in West Palm Beach, FL. 14’ Speed hump in Portland, OR.
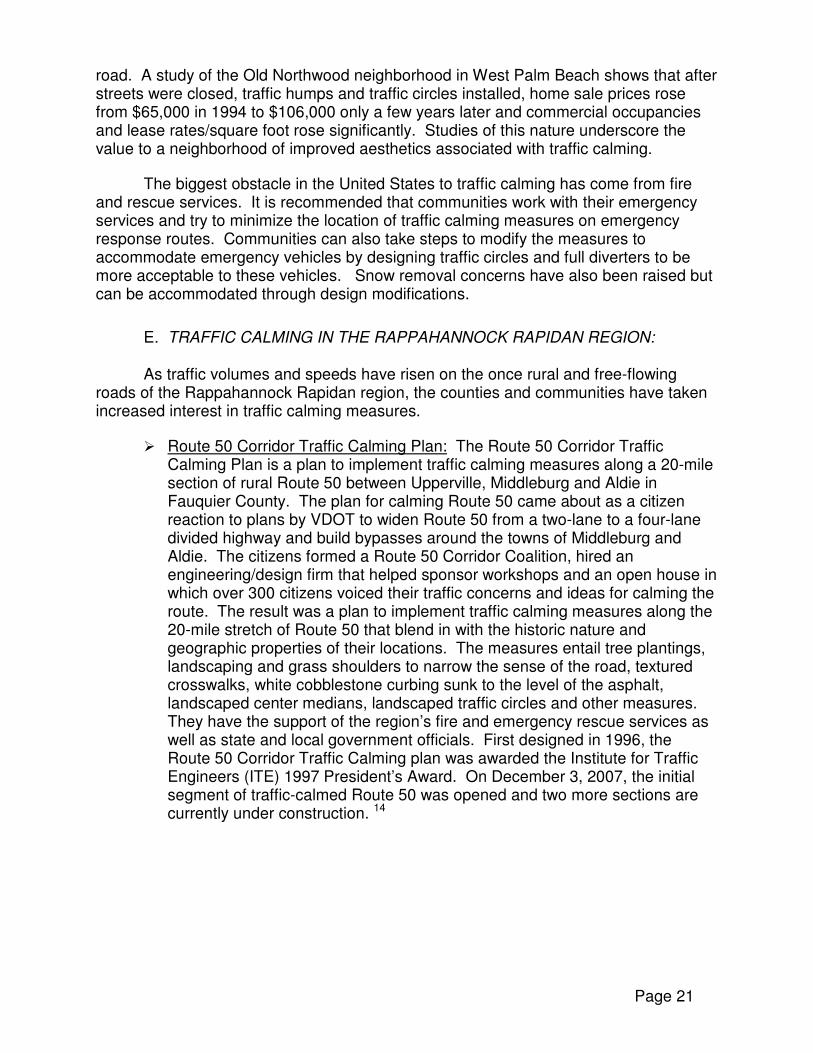
� Textured Pavements: Textured pavements include the use of stamped pavement or alternative paving materials such as cobblestone or brick to create an uneven surface for vehicles to traverse. These pavements can be used to emphasize an entire section of roadway or a pedestrian crossing. They are relatively inexpensive, effective in reducing vehicle speeds and, when well designed, have aesthetic value.
Textured pavement in Gainsville, FL: textured Textured pavement in Seattle, WA: pavement combined with diagonal parking. This covers two intersections downtown
� Traffic Circles: By far, the most popular traffic calming measure is the traffic circle, a raised island placed at an intersection, around which the traffic circulates. Traffic circles prevent drivers from speeding through an intersection. They work well at intersections, especially in neighborhoods

Page 19
where large vehicles are not present in large numbers. Unlike speed humps and speed tables, traffic circles are located at intersections which may be widely spaced. Thus, the primary benefit of traffic circles is intersection safety rather than speed reduction. Implementation of traffic circles has raised some concerns, but these generally can be resolved by a community. One concern is the inability of large vehicles to turn around small-radius curves but this can be addressed through design measures. Another concern relates to bicyclists and pedestrians. The horizontal deflection can force the motor vehicles into pedestrian crossing areas or the travel lane of bicyclists. Signs to cars to yield to pedestrians and cyclists can be put up but are not always obeyed. Traffic circles cost more than speed humps and speed tables because they need landscaping and use concrete rather than asphalt. Seattle, Washington achieved a substantial reduction in intersection collisions from implementation of traffic circles.
� Roundabouts: Roundabouts are like traffic circles but used on higher volume arterials and collector roads. They have a good safety record and substitute for traffic signals and four-way stop signs.
Traffic circle in Ft. Lauderdale, FL. Roundabout in Beaverton, OR.
� Road Narrowings: A number of measures are used to narrow the width of a street to achieve speed reductions. Center islands are raised areas located along the centerline of the street to narrow a lane. They are often nicely landscaped and add to the aesthetics of the community. They can be used near intersections to make a location more pedestrian-friendly by providing a haven for pedestrians who can cross halfway and then wait before crossing the rest of the road. Neckdowns are another type of road narrowing that involve curb extensions at intersections that reduce the roadway width that must be traversed from curb to curb.
C. Costs for Traffic Calming
Costs for traffic calming measures vary from location to location depending on the materials used, local labor costs and other factors. However, the following Table gives a perspective on the relative costs of the various measures, based on the

Page 20
experience in a number of cities. Table 1 is useful at a broad level of planning to show “orders of magnitude” differences among the measures.
Table 1
COST ESTIMATES FOR TRAFFIC CALMING MEASURES 13
Figure 8
D. COMMUNITY EXPERIENCES AROUND THE COUNTRY:
Communities seem to start by implementing one or two measures and after experience over time, they try other measures. Since all neighborhoods are different and road and traffic conditions may differ from location to location, communities search for the most appropriate measure for each location and/or implement a combination of measures. Speed humps, speed tables and traffic circles are the most common traffic calming measures in U.S. cities and communities. Studies show that the measures have positive impacts on speed reduction but another compelling reason to implement them is the positive impact on safety. By eliminating dangerous turning movements and focusing drivers’ attention, traffic calming can result in fewer accidents, and when accidents occur, they may be of less impact due to the lower traffic speed. Traffic calming also has positive quality of life benefits. Studies in European cities indicate that lower vehicle speeds and volumes after the measures are implemented, encourage increased walking, bicycling and street life. Some studies have also found they contribute to boosting property values.
Early traffic calming measures focused on volume control but, more recently, communities have begun to rely primarily on speed control measures. Generally, it is recommended to implement traffic control measures on a neighborhood basis because if just one street is selected, it might have the effect of diverting traffic to another nearby
Measure Fairfax, VA Seattle, WA Portland, OR Other cities
(2000-2005 $) (1998 $) (1997 $) SPEED HUMPS $2,000-2,400 $2,000 $2,000-2,500 --- SPEED TABLES -------- $2,000 $2,000-2,500 ---- RAISED CROSSWALK $2,000-4,000 ---- --- ---- TRAFFIC CIRCLE $2,000-6,000 $6,000 $10,000-15,000 ---- CHICANES $4,000-5,000 --- ----- $14,000 CENTER ISLAND $3,000-4,000 $ 8,000-15,000 ---- MEDIAN BARRIER $10,000-20,000 $15,000 HALF CLOSURES $35,000 $40,000
NECKDOWNS $40,000 DIAGONAL DIVERTER $85,000
Page 21
road. A study of the Old Northwood neighborhood in West Palm Beach shows that after streets were closed, traffic humps and traffic circles installed, home sale prices rose from $65,000 in 1994 to $106,000 only a few years later and commercial occupancies and lease rates/square foot rose significantly. Studies of this nature underscore the value to a neighborhood of improved aesthetics associated with traffic calming. The biggest obstacle in the United States to traffic calming has come from fire and rescue services. It is recommended that communities work with their emergency services and try to minimize the location of traffic calming measures on emergency response routes. Communities can also take steps to modify the measures to accommodate emergency vehicles by designing traffic circles and full diverters to be more acceptable to these vehicles. Snow removal concerns have also been raised but can be accommodated through design modifications.
E. TRAFFIC CALMING IN THE RAPPAHANNOCK RAPIDAN REGION: As traffic volumes and speeds have risen on the once rural and free-flowing
roads of the Rappahannock Rapidan region, the counties and communities have taken increased interest in traffic calming measures.
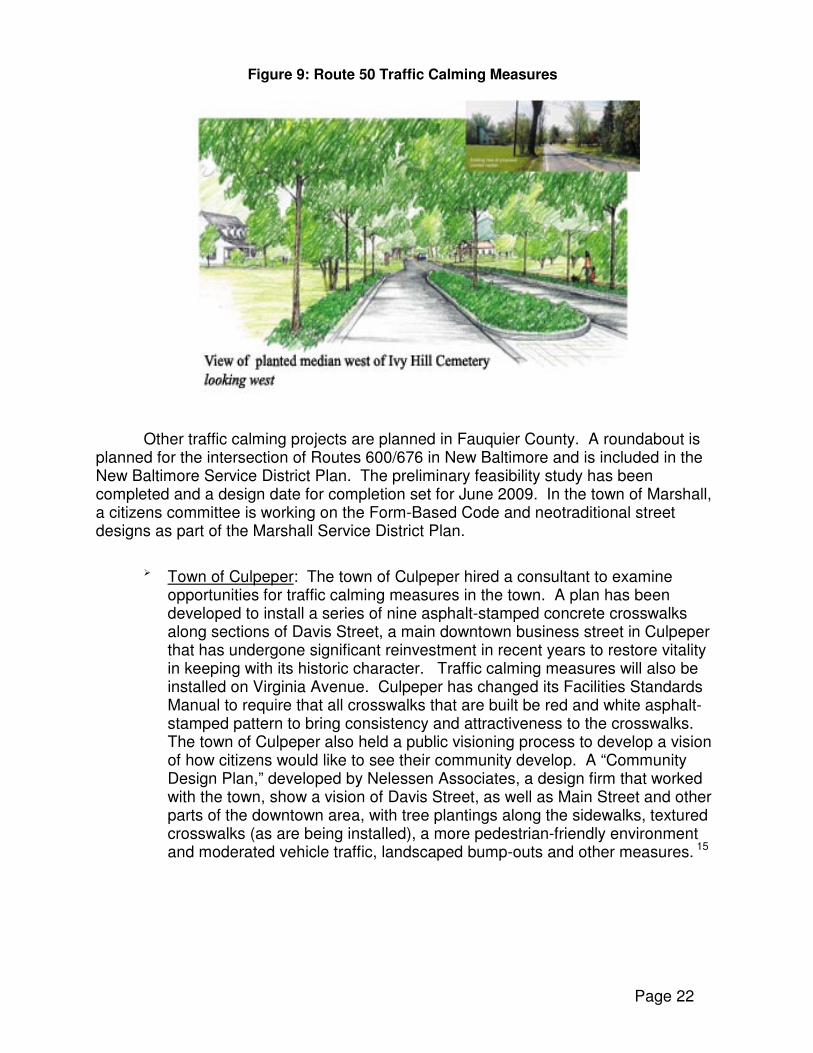
� Route 50 Corridor Traffic Calming Plan: The Route 50 Corridor Traffic Calming Plan is a plan to implement traffic calming measures along a 20-mile section of rural Route 50 between Upperville, Middleburg and Aldie in Fauquier County. The plan for calming Route 50 came about as a citizen reaction to plans by VDOT to widen Route 50 from a two-lane to a four-lane divided highway and build bypasses around the towns of Middleburg and Aldie. The citizens formed a Route 50 Corridor Coalition, hired an engineering/design firm that helped sponsor workshops and an open house in which over 300 citizens voiced their traffic concerns and ideas for calming the route. The result was a plan to implement traffic calming measures along the 20-mile stretch of Route 50 that blend in with the historic nature and geographic properties of their locations. The measures entail tree plantings, landscaping and grass shoulders to narrow the sense of the road, textured crosswalks, white cobblestone curbing sunk to the level of the asphalt, landscaped center medians, landscaped traffic circles and other measures. They have the support of the region’s fire and emergency rescue services as well as state and local government officials. First designed in 1996, the Route 50 Corridor Traffic Calming plan was awarded the Institute for Traffic Engineers (ITE) 1997 President’s Award. On December 3, 2007, the initial segment of traffic-calmed Route 50 was opened and two more sections are currently under construction. 14
Page 22
Figure 9: Route 50 Traffic Calming Measures
Other traffic calming projects are planned in Fauquier County. A roundabout is planned for the intersection of Routes 600/676 in New Baltimore and is included in the New Baltimore Service District Plan. The preliminary feasibility study has been completed and a design date for completion set for June 2009. In the town of Marshall, a citizens committee is working on the Form-Based Code and neotraditional street designs as part of the Marshall Service District Plan.
� Town of Culpeper: The town of Culpeper hired a consultant to examine opportunities for traffic calming measures in the town. A plan has been developed to install a series of nine asphalt-stamped concrete crosswalks along sections of Davis Street, a main downtown business street in Culpeper that has undergone significant reinvestment in recent years to restore vitality in keeping with its historic character. Traffic calming measures will also be installed on Virginia Avenue. Culpeper has changed its Facilities Standards Manual to require that all crosswalks that are built be red and white asphalt-stamped pattern to bring consistency and attractiveness to the crosswalks. The town of Culpeper also held a public visioning process to develop a vision of how citizens would like to see their community develop. A “Community Design Plan,” developed by Nelessen Associates, a design firm that worked with the town, show a vision of Davis Street, as well as Main Street and other parts of the downtown area, with tree plantings along the sidewalks, textured crosswalks (as are being installed), a more pedestrian-friendly environment and moderated vehicle traffic, landscaped bump-outs and other measures. 15

Page 23
Culpeper Main Street: view of the Culpeper Main Street “Vision”: view of new historic State Theater and adjacent mixed use development and parking garage surface parking lot, as exists today where the surface lot used to be and textured crosswalks and trees
� Town of Orange: The Town of Orange has plans to work with developers to incorporate traffic calming projects into new developments. The town has plans to install a roundabout at the intersection with Route 20 in the future to provide congestion relief and improved safety. The cost of installing the roundabout is estimated at about $250,000. 16
5.4 Transit Improvements
Transit in the Rappahannock Rapidan region is provided by Virginia Regional Transit (VRT), a private non-profit corporation, under contract to towns and counties in the region. A range of private human service agencies also provide transportation services for their clients to transport them to needed medical and other appointments. Ridership on VRT in the Rappahannock Rapidan region increased from 101,044 in FY 2004 to 117,526 in FY 2007, a ridership gain of 16,482 or 16.3% over the four-year period. 17
Wheel-chair accessible vans owned by the Rappahannock Rapidan Community Services Board transport clients to medical and other appointments throughout the region.

Page 24
FIGURE 10 18
VRT Ridership in PD 9 Region
117,526
119,841
109,638
101,044
90,000
95,000
100,000
105,000
110,000
115,000
120,000
125,000
2004 2005 2006 2007
Fiscal Year
An
nu
al R
iders
hip
VRT Ridership in PD 9 Region
Transit improvements encompass a broad range of measures designed to boost ridership. These generally involve improved marketing, facilities, technology development, scheduling, expanded service area, customer conveniences and comfort.
Table 2 Benefits of Various Transit Improvements 19
Type of Improvement Improves Service Incr. Affordability Incr. transit use
Added routes, expanded coverage, X X increased frequency and hours Comfort improvements: better X X seats, bus shelters Lower fares, increased public X subsidies Employer commute trip reduction X X programs and financial incentives Improved rider information and X X marketing programs Services targeting particular X X traveler needs such as commuter express buses, dial-a-ride svc. Bicycle-transit connections X X
Page 25
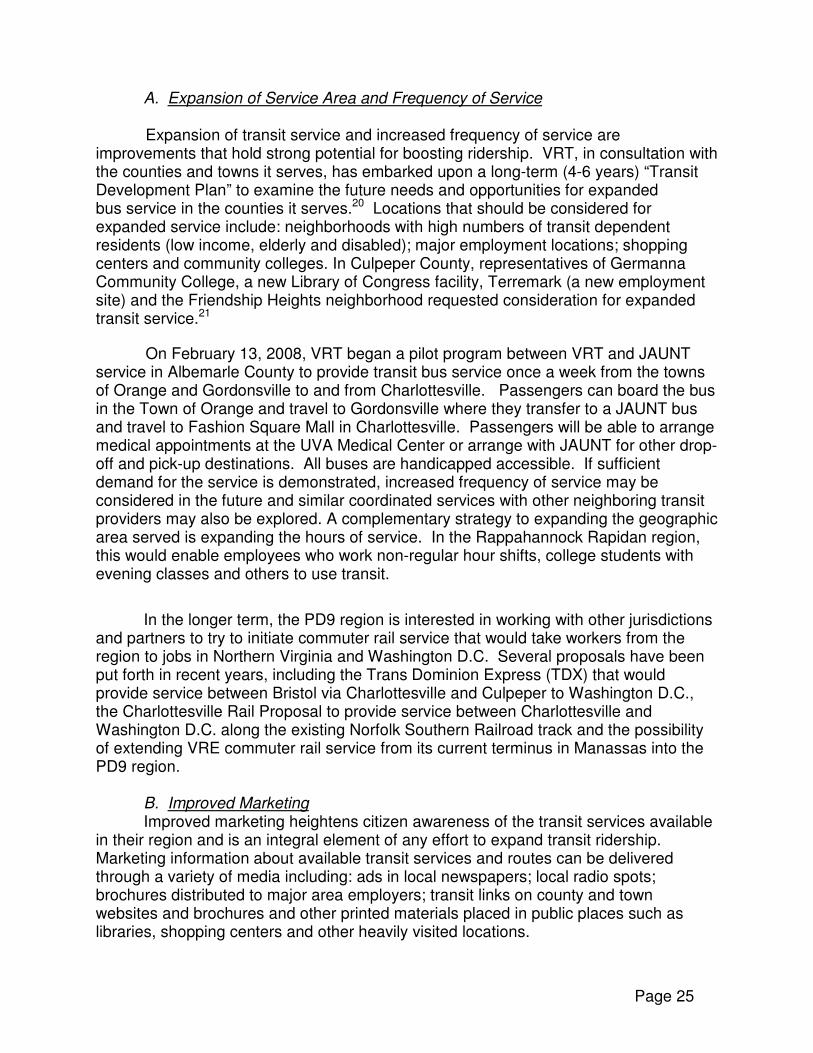
A. Expansion of Service Area and Frequency of Service
Expansion of transit service and increased frequency of service are improvements that hold strong potential for boosting ridership. VRT, in consultation with the counties and towns it serves, has embarked upon a long-term (4-6 years) “Transit Development Plan” to examine the future needs and opportunities for expanded bus service in the counties it serves.20 Locations that should be considered for expanded service include: neighborhoods with high numbers of transit dependent residents (low income, elderly and disabled); major employment locations; shopping centers and community colleges. In Culpeper County, representatives of Germanna Community College, a new Library of Congress facility, Terremark (a new employment site) and the Friendship Heights neighborhood requested consideration for expanded transit service.21
On February 13, 2008, VRT began a pilot program between VRT and JAUNT service in Albemarle County to provide transit bus service once a week from the towns of Orange and Gordonsville to and from Charlottesville. Passengers can board the bus in the Town of Orange and travel to Gordonsville where they transfer to a JAUNT bus and travel to Fashion Square Mall in Charlottesville. Passengers will be able to arrange medical appointments at the UVA Medical Center or arrange with JAUNT for other drop-off and pick-up destinations. All buses are handicapped accessible. If sufficient demand for the service is demonstrated, increased frequency of service may be considered in the future and similar coordinated services with other neighboring transit providers may also be explored. A complementary strategy to expanding the geographic area served is expanding the hours of service. In the Rappahannock Rapidan region, this would enable employees who work non-regular hour shifts, college students with evening classes and others to use transit.
In the longer term, the PD9 region is interested in working with other jurisdictions and partners to try to initiate commuter rail service that would take workers from the region to jobs in Northern Virginia and Washington D.C. Several proposals have been put forth in recent years, including the Trans Dominion Express (TDX) that would provide service between Bristol via Charlottesville and Culpeper to Washington D.C., the Charlottesville Rail Proposal to provide service between Charlottesville and Washington D.C. along the existing Norfolk Southern Railroad track and the possibility of extending VRE commuter rail service from its current terminus in Manassas into the PD9 region.
B. Improved Marketing Improved marketing heightens citizen awareness of the transit services available
in their region and is an integral element of any effort to expand transit ridership. Marketing information about available transit services and routes can be delivered through a variety of media including: ads in local newspapers; local radio spots; brochures distributed to major area employers; transit links on county and town websites and brochures and other printed materials placed in public places such as libraries, shopping centers and other heavily visited locations.
Page 26
The Rappahannock Rapidan region, like many regions around the country, has a growing senior and disabled population. VRT and a number of private human service providers such as the Rappahannock Rapidan Disability Services Board, offer on-demand transit services for their clients. To better serve this heavily transit-dependent segment of the population in the future, the Rappahannock Rapidan region is developing a Coordinated Human Services Mobility (CHSM) plan that would identify unmet transportation needs for elderly, disabled and low-income populations in the region and develop a plan for greatly improved coordination among the various human service transportation providers in the region and establish a centralized mobility
manager position. This strategy is discussed in greater detail in the Human Services Mobility Chapter of this Plan.
To provide better information about ridesharing services in the region, the Rappahannock Rapidan region’s commuter matching service, Commuter Services, Inc., unveiled a new website in 2007. Commuter Services also regularly distributes information at regional job fairs and other events to educate employers and the public about commuter matching services that are available. In 2008, Commuter Services is planning to implement an expanded outreach program to the region’s major employers to elevate awareness of the matching services available to employees and educate employers about the benefits ridesharing provides for them. Commuter Services is also conducting a survey, through its website and other means, to assess interest in a new commuter bus that is planned for 2008.
C. Capital Improvements
Investment in new transit equipment and facilities is critical to efforts to increase transit ridership. In 2007, VRT replaced 27 of the 81 buses it uses in its fifteen county service region. In FY 2007, VRT introduced a new on-demand transit bus in Culpeper County to better serve the region’s disabled population. Previously, the fixed-route trolley buses that operate in Culpeper County had to deviate from their routes to pick up disabled users which impaired the ability of the fixed-route buses to maintain schedules. The new on-demand bus includes equipment and drivers to assist riders with special needs and has proven to be popular. VRT has also been installing bus shelters at strategic locations throughout the region it serves. Several shelters were installed in Orange County and others are planned for installation in 2008 in other parts of the Rappahannock Rapidan Region. In 2007, local officials in the Rappahannock Rapidan region and VRT celebrated the opening of Phase I of a new transit maintenance and training facility in the Town of Culpeper. When completed, the $4 million project will serve as the employment base for up to 50 employees. In 2008, the new facility began to provide maintenance services for the fleet of vehicles in the West Central region of Virginia and plans to offer maintenance services for the vehicles of the region’s human service providers as well. With the growing interest in bicycling in the region, VRT has ordered bicycle racks that will be installed on some buses. This will enable employees to take their bikes on the bus and use them to get from the transit stop to their place of employment. It will also offer recreational cyclists the opportunity to ride the bus to a scenic point from

Page 27
which they can begin a ride. The addition of bicycle racks is an amenity that is expected to attract new riders to transit.
The new VRT transit facility in the Town of Culpeper is situated adjacent to the Norfolk Southern railroad tracks and holds the potential to become a multimodal transportation center if and when commuter rail service is established in the region. It is envisioned that a commuter rail stop might be located on the facility grounds, with local transit buses, taxis and other transportation modes providing connections to it.
5.5 Intelligent Transportation Systems (ITS) Intelligent Transportation Systems (ITS) encompasses a broad array of
wireless and wire-lined technologies. When ITS is integrated into the transportation system’s infrastructure and in vehicles, it helps to reduce congestion, improve safety and mobility and make the transportation system operate more efficiently. The federal government’s ITS program, operated through the U.S. Department of Transportation, provides funding to cities and communities for investment in ITS technologies and provides information to interested parties on ITS research and demonstration program results. An ITS Toolbox was developed for rural communities and presents several categories of ITS technology applications for rural communities. 22 These include:
� Emergency Services—for services provided by law enforcement, fire departments, Emergency Medical Services and related organizations;
� Tourism and Traveler Information—comprises a wide range of
information including pre-trip advisories (road closures, detours, weather, etc) and real-time traffic information;
� Traffic Management-methods to improve traffic operations; � Crash Prevention—information to help prevent crashes before they
happen;
� Rural Transit and Mobility—applications to increase rural transit mobility and better mobility for elderly and disabled users through paratransit services;
The Rappahannock Rapidan region may wish to implement one or more of
these measures in the years ahead.
A. Emergency Services 1. Emergency Vehicle Traffic Signal Pre-emption: Traffic signal preemption involves switching the appropriate traffic signal at a signalized intersection to green to give an appropriate vehicle the right-of-way. This measure improves emergency response time. Traffic signal pre-emption can be used to give emergency vehicles priority and can also be used on public snow-plow vehicles and to give transit vehicles priority at intersections. Low-powered wireless communication devices can be placed in vehicles and used to trigger receivers located at intersections to grant a green phase.
Page 28
2. “Mayday Systems:” These are emergency notification systems that serve to reduce accident response time in remote areas, provide an advanced ability to use cellular technologies and GIS for emergency notification and enhance emergency management through coordination among emergency service providers. In the case of a severe crash, a victim’s chances of survival are directly linked to the time it takes for the emergency service to respond. Studies have shown that emergency response times to an accident (from the call by a distressed driver to the dispatcher getting the information to the time the emergency response personnel arrive at the scene) averages 52.4 minutes in rural areas compared to 34.9 minutes in urban areas. These “mayday systems” bring about faster response time to accidents and thereby help reduce fatalities. They also bring about efficiencies by sending the appropriate response team to the accident. A number of issues need to be addressed including gaps in cell service in rural areas, protocol differences in routing 911 calls must be examined and training is needed for those involved.
3. Central Dispatch Center: This ITS application addresses the need to centralized and share data between many types of providers, including emergency personnel, transit providers and highway assistance organizations. On the scene incident data can be routed through a single dispatch center for processing and the dispatch center then dispatches the appropriate emergency personnel to the accident.
B. Tourism and Travel Information
1. Dynamic Message Signs: Dynamic Message Signs are useful for advising travelers of existing or upcoming problems on the roadway such as construction or an accident. The intent is to increase safety and prepare travelers for road conditions ahead. The text displayed on the signs can be programmed from a remote location using a wireless transmitter, phone or modem. The sign can be a permanent or a portable installation. Portable installations are lower in cost and have the advantage that they may be shared among several agencies.
2. Interactive Kiosks: Kiosks enable travelers to access a variety of information including special events, tourism information (lodging, restaurants, local event calendars), road information (closures, detours, bad weather) and transit schedules. Kiosks are traditionally located at tourist areas, rest stops or activity centers in rural areas. They provide a cost-effective short-term ITS application and units can be added or substituted and linked within a town or between towns. The Town of Orange has installed about eight information kiosks at heavily-visited locations throughout the county and the Town of Culpeper is in the process of installing several. Other towns in the region may also install kiosks to provide a network throughout the region.
Page 29
C. Traffic Management 1. Geographic Information Systems (GIS) Applications: GIS can be used by towns and counties to plan and analyze highway and transit networks. GIS can be integrated with Automatic Vehicle Location to enhance management and maintenance of transit vehicles and emergency vehicles. Vehicles owned by the Department of Transportation and other public entities can be equipped with GIS to collect traffic information such as travel times and data on traffic-congested areas. GIS can be used to determine where safety and traffic-related improvements should be made to highways and at railroad crossings. The Rappahannock Rapidan region is using GIS for traffic data collection, mapping of sections of highway where safety and traffic-related improvements are needed and for other purposes. 2. Integrated Signal Systems: This was discussed earlier in this section under 5.2, Traffic Operational Improvements.
D. Rural Transit and Mobility There is an interest in many rural regions in using ITS to coordinate the wide range of paratransit and other transportation services that are provided by transit agencies, human service providers, churches and other entities. Transit operations software can be used to automate, streamline and integrate many transit functions and modes including computer-aided dispatching, service monitoring, route planning and supervisory control and data acquisition. Automatic Vehicle Location technology can be used to measure the location of transit vehicles, using on-board computers, electronic tags and a global positioning system.
E. Crash Prevention
ITS can be applied to speed-warning systems to alert approaching traffic of high volume intersections, work zones, accident locations and at locations that cause a significant speed differential like sharp curves or mountain passes. Police departments are using portable speed warning systems to slow drivers on roads.
6. Congestion System Monitoring and Evaluation
6.1 Baseline Measurements:
Once the region has established a congestion management system, the system will require ongoing monitoring and evaluation to assess the results of strategies that are implemented. A baseline of measurements will be developed, including traffic volumes and speeds on the region’s arterials, monthly transit ridership levels and other measures such as the number of pedestrians and bicyclists in key locations and the number of vanpools and carpools. These statistical baselines will be used to evaluate the effectiveness of congestion management strategies by examining the impact of each strategy over time in reducing traffic volumes or increasing desired alternative transport modes such as transit, ridesharing, bicycling and walking. The Rappahannock Rapidan Region’s Travel Time Surveys, along with traffic volume and speed data collected by the region’s jurisdictions, are an important source of baseline traffic data. Monthly and annual transit ridership data is collected by VRT for each of the transit
Page 30
systems it operates in the region. This information is essential to evaluate various transit improvement strategies that are implemented. As the region develops its non-motorized facilities, a baseline will need to be developed that assesses the growth in bicycle and pedestrian traffic in key locations.
The Congestion Management System Committee (CMSC) will be responsible for ensuring that needed baseline information is collected on a regular basis and for monitoring, along with the local jurisdictions, the effectiveness of congestion management strategies that are implemented.
7. Review and Update
The CMSC will establish a regular schedule of review of the region’s congestion management system. The findings from evaluation of the implemented strategies will result in recommendations to modify some strategies, expand the most effective ones to other parts of the region and other recommendations.

Page 31
Footnotes
1. Weldon Cooper Center for Public Service, “Population Estimates for Virginia Localities and Planning Districts: Final 2006 and Provisional 2007,” University of Virginia, Charlottesville, January 28, 2008.
2. Virginia Department of Transportation website, “Daily Vehicle Miles of Travel By Federal Functional Class, by Maintenance Jurisdictions. 3. Rappahannock Rapidan Regional Commission, Phase II, Long Range Transportation Plan: 2005-2035, 2007. 4. Rappahannock Rapidan Regional Commission, Ibid. 5. Rappahannock Rapidan Regional Commission, Phase I, Long Range Transportation Plan: 2005-2035, 2007. 6. Rappahannock Rapidan Regional Commission, Ibid. 7. Commuter Services, Rappahannock Rapidan Commuter Lot Survey, p. 8, April 30, 2007. 8. Commuter Services, Inc., Ibid., p. 5. 9. Virginia Department of Transportation, “Access Management Regulations,” November 2007. 10. Fehr and Peers, Transportation Consultants, www.TrafficCalming.org 11. Fehr and Peers, Volume Control Measures, Ibid. 12. Fehr and Peer, Speed Control Measures, Ibid. 13. Fehr and Peer, Ibid. 14. Route 50 Corridor Coalition, A Traffic Calming Plan for Virginia’s Rural Route 50 Corridor, Middleburg, VA, 1996. 15. Telephone conversation with John Eggertson, Planning Director, Town of Culpeper, VA. 16. Telephone conversation with Mike Collins, Planner, Town of Orange, VA. 17. Virginia Regional Transit, Annual Ridership Data for PD9 region. 18. Virginia Regional Transit, Ibid 19. Wasatch Front Metropolitan Planning Organization, Salt Lake-Ogden Layton Urbanized Area Congestion Management System, June 2004. 20. Telephone conversation with Mike Socha, Virginia Regional Transit. 21. Culpeper Transportation Advisory Committee, January 2008. 22. U.S. Department of Transportation, Intelligent Transportation Systems, Rural ITS Toolbox.

Page 32
APPENDIX I: 2007 Rappahannock Rapidan Region Travel Time Survey

Page 33

Page 34
Page 35
Page 36
Page 37
.
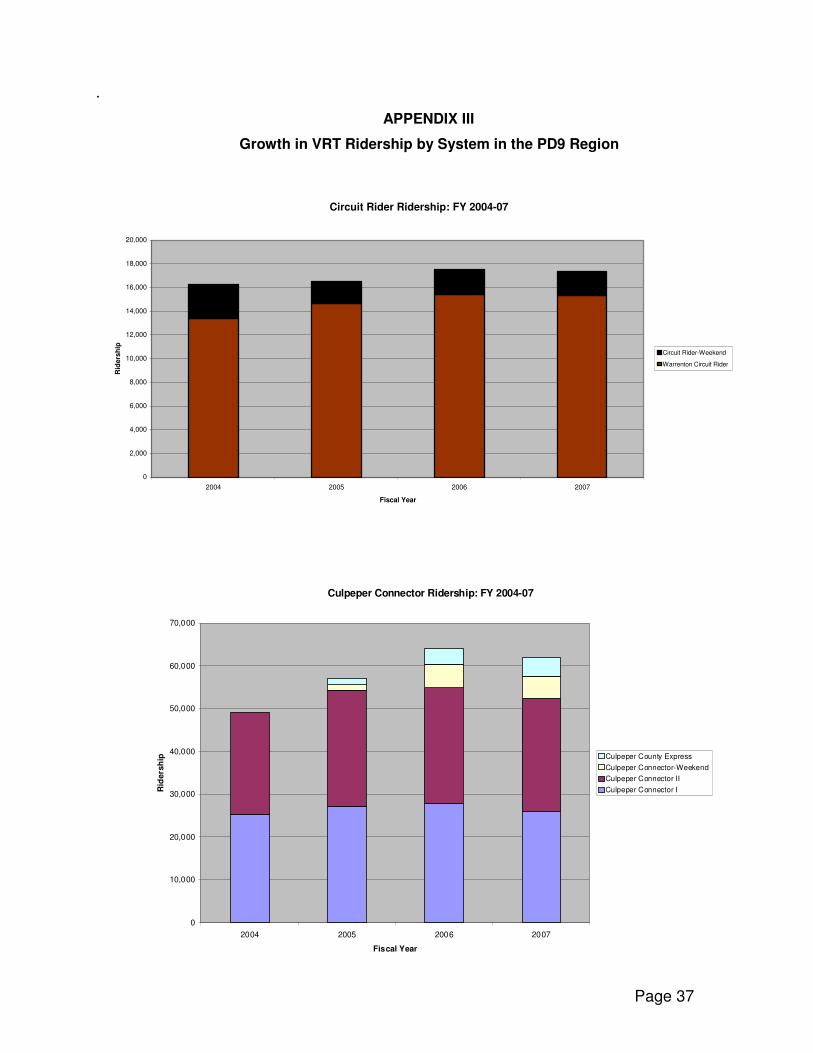
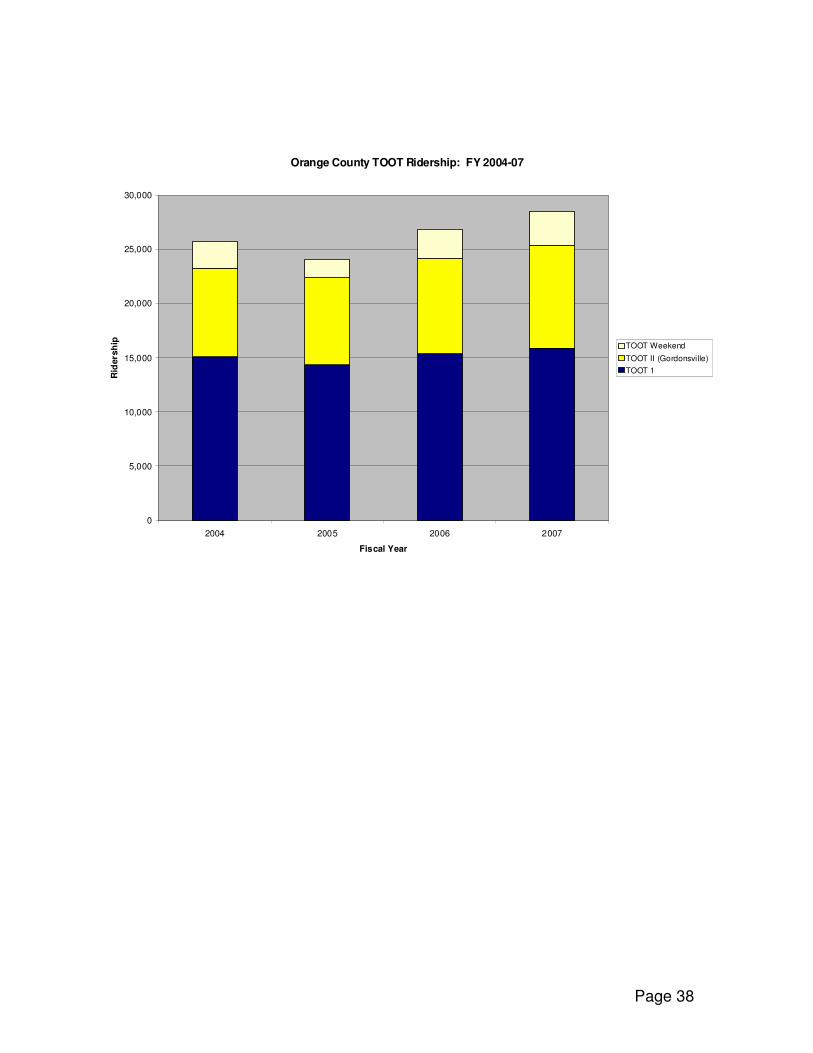
APPENDIX III
Growth in VRT Ridership by System in the PD9 Region
Circuit Rider Ridership: FY 2004-07
0
2,000
4,000
6,000
8,000
10,000
12,000
14,000
16,000
18,000
20,000
2004 2005 2006 2007
Fiscal Year
Rid
ers
hip
Circuit Rider-Weekend
Warrenton Circuit Rider
Culpeper Connector Ridership: FY 2004-07
0
10,000
20,000
30,000
40,000
50,000
60,000
70,000
2004 2005 2006 2007
Fiscal Year
Rid
ers
hip Culpeper County Express
Culpeper Connector-Weekend
Culpeper Connector II
Culpeper Connector I
Page 38
Orange County TOOT Ridership: FY 2004-07
0
5,000
10,000
15,000
20,000
25,000
30,000
2004 2005 2006 2007
Fiscal Year
Rid
ers
hip TOOT Weekend
TOOT II (Gordonsvi lle)
TOOT 1