Congestion Control Principles Floyd, S., RFC 2914: Congestion Control Principles. , 2000
1
CongestionControl Policiesfor IP-based
CDMA RadioAccessNetworks
SnehaK. Kasera RamachandranRamjee,SandraThuel Xin Wang
Schoolof Computing Bell Laboratories ComputerScienceandEngineering
University of Utah LucentTechnologies SUNY at Buffalo
Salt Lake City, UT 84112 Holmdel, NJ 07733 NY 14260
Email: [email protected]�ramjee,thuel� @bell-labs.com [email protected]
December18, 2003 DRAFT
2
Abstract
As CDMA-basedcellular networks mature, the current point-to-point links used in connecting
basestationsto network controllers will evolve to an IP-basedRadio AccessNetwork (RAN) for
reasonsof lower cost due to statisticalmultiplexing gains, better scalability and reliability, and the
projectedgrowth in data applications.In this paper, we study the impact of congestionin a best-
effort IP RAN on CDMA cellular voice networks. We proposeand evaluatethreecongestioncontrol
mechanisms,admissioncontrol, diversity control, and router control, to maximize network capacity
while maintaininggoodvoicequality. We first proposetwo new enhancementsto CDMA call admission
control that considera unified view of both IP RAN andair interfaceresources.Next, we introducea
novel techniquecalled diversity control that exploits the soft-handoff featureof CDMA networks and
dropsselectedframesbelongingto multiple soft-handoff legs to gracefullydegradevoicequality during
congestion.Finally, we studythe impactof routercontrolwhereanactive queuemanagementtechnique
is usedto reducedelay and minimize correlatedlosses.Using simulationsof a large mobile network,
we show that the threedifferent control mechanismscan help gracefully manage10-40%congestion
overloadin the IP RAN.
I . INTRODUCTION
Cellular wirelessnetworks have becomean indispensablepart of the communicationinfras-
tructure.CDMA is an importantair-interface technologyfor cellular wirelessnetworks. It has
been selectedfor implementationin both the North American and European3G standards.
Traditionally, in thesewirelessaccessnetworks,thebasestationsareconnectedto radionetwork
controllersor basestationcontrollersby point-to-point(usuallyT1/E1) links. Theselinks, also
called backhaullinks, are expensive and their use imposesan on-going cost on the service
providers.In suchnetworks,reliability comesat high price:by replicationof links or controllers.
As CDMA-basedcellular networks mature,the currentpoint-to-pointlinks will evolve to an IP-
basedRadioAccessNetwork (RAN). Replacingthepoint-to-pointlinks betweenthebasestations
andthe radio network controllersby an IP RAN hasthe following advantages:
� Cost - Point-to-pointlinks including T1 links are expensive and cannotbe shared.An IP
network will benefit from statisticalmultiplexing gains and could be sharedwith other
wirelessandwireline applications.� Scalabilityand Reliability - Replacingpoint-to-pointlinks by a distributedIP network will
provide alternatepathsto more than one network controller, therebyimproving reliability
December18, 2003 DRAFT
3
and scalability. For example,it is shown in [1] that addinga selectedfew pathsbetween
basestationsandnetwork controllersresultsin majority of thegainsin resiliency to failures.� Data Applications- Increasingly, a large numberof IP-based“data applications”including
web browsing, email, streamingand packetizedvoice (voice over IP) are being offered in
wirelessnetworks. Hencewirelessaccessnetworks must support IP traffic. An IP RAN
efficiently addressesthis eventuality.
While theuseof anIP RAN resultsin theabove advantages,mechanismsmustbedesignedto
controlIP RAN congestion.Congestionoccurswhentheofferedtraffic exceedstheengineeredIP
RAN capacity. Thereareessentiallythreeapproachesto control andavoid congestion.First, the
network canbe over-provisionedor peak-provisionedso that congestionnever occurs.Although
simple,this is not a practicalsolutionbecauseaccessnetwork bandwidthis still very expensive
comparedto corenetwork bandwidth.Accordingto thefinancialfirm FriedmanBillings Ramsey,
it costs14,000timesmoreto carrya bit of informationonemile on a local network versusa long
distancenetwork [2]. Second,one can reserve resourcesin the accessnetwork. While several
researchefforts have focusedon this problem(e.g.,[3], [4]), inaccurateresourceestimationdue
to dynamicload patternsand/ormobility, variationsin the wirelessenvironment,and the wide
rangeof applicationcharacteristicsmakesit a very hardproblemto solve. Besides,even though
variousreservation schemeshave beenproposedand implementedin routers,theseapproaches
are yet to be widely deployed in currentIP networks. The third approachis to assumea best-
effort IP RAN and useproperly designedpolicies to control and avoid congestion.This is the
focusof our paper.
We studytheimpactof congestionin a best-effort IP RAN on CDMA cellularvoicenetworks.
Congestionintroduceslossanddelay jitter in the usertraffic. Uncontrolledlossanddelay jitter
could drasticallyreducethe voice quality. Thereforecongestioncontrol techniquesareessential
in maintaininggoodvoicequality. We focuson the voiceapplicationfor two reasons:a) current
cellular networks arepredominantlyusedfor voice transmission;andb) voice hastighter delay
and loss requirementsthandata(whereretransmissionis an option).
We proposeandevaluatethreecongestioncontrol mechanismsto maximizenetwork capacity
while maintaininggood voice quality: admissioncontrol, diversity control, and router control.
Call admissioncontrol in current CDMA cellular voice networks is restrictedto controlling
the usageof air interface resources.We first proposetwo new enhancementsto CDMA call
December18, 2003 DRAFT
4
admissioncontrol that considera unified view of both IP RAN and air interface resourcesto
adequatelymatchthenumberof voiceusersto theengineeredcapacity. Theprincipleunderlying
both schemesis regulation of the IP RAN load by adjustingthe admissioncontrol criterion at
the air-interface. Next, we introduce a novel techniquecalled diversity control that exploits
one of the uniquefeaturesof CDMA, namelymacro-diversity or soft-handoff. A cellular user
in soft-handoff transmitsand listensto multiple basestationssimultaneously. During IP RAN
congestion,our diversity control techniqueallows dropping of selectedframes belonging to
potentiallyredundantsoft-handoff legs,therebyreducingcongestiongracefullywhile maintaining
adequatevoice quality. Last, we study the impactof routercontrol in the form of active queue
management[5]. IP routersusinga drop tail mechanismduring congestioncould producehigh
delaysandbursty lossesresultingin poor voice quality. Useof active queuemanagementat the
routersreducesdelaysand losscorrelation,therebyimproving voice quality during congestion.
Using simulationsof a large mobile network, we evaluatethe behavior of the three different
control mechanismsand show how thesetechniqueshelp managecongestionin the IP RAN
gracefully. To our knowledgethis is the first paperto considerthe impact of congestionin IP
RAN on CDMA network performance.
The rest of the paperis structuredas follows. In SectionII, we presentan overview of the
problem.In SectionIII, we presenttwo call admissioncontrol algorithmsthat take into account
boththeair interfaceandIP RAN resourcesto regulateincomingtraffic. In SectionIV, wepresent
our diversity control techniquesthat selectively drop soft-handoff legs to control congestion.In
SectionV, wepresentour routercontroltechniqueusingactivequeuemanagement.In SectionVI,
we presentour simulation results demonstratingthe benefitsof all three congestioncontrol
techniques.SectionVII containstheimpactof our policieson network provisioning.SectionVIII
containsfuture directionsfor enhancingour researchandfinally in SectionIX, we presentour
conclusions.
I I . PROBLEM SETTING
In this sectionwe describethe componentsof a CDMA wirelessaccessnetwork that usesan
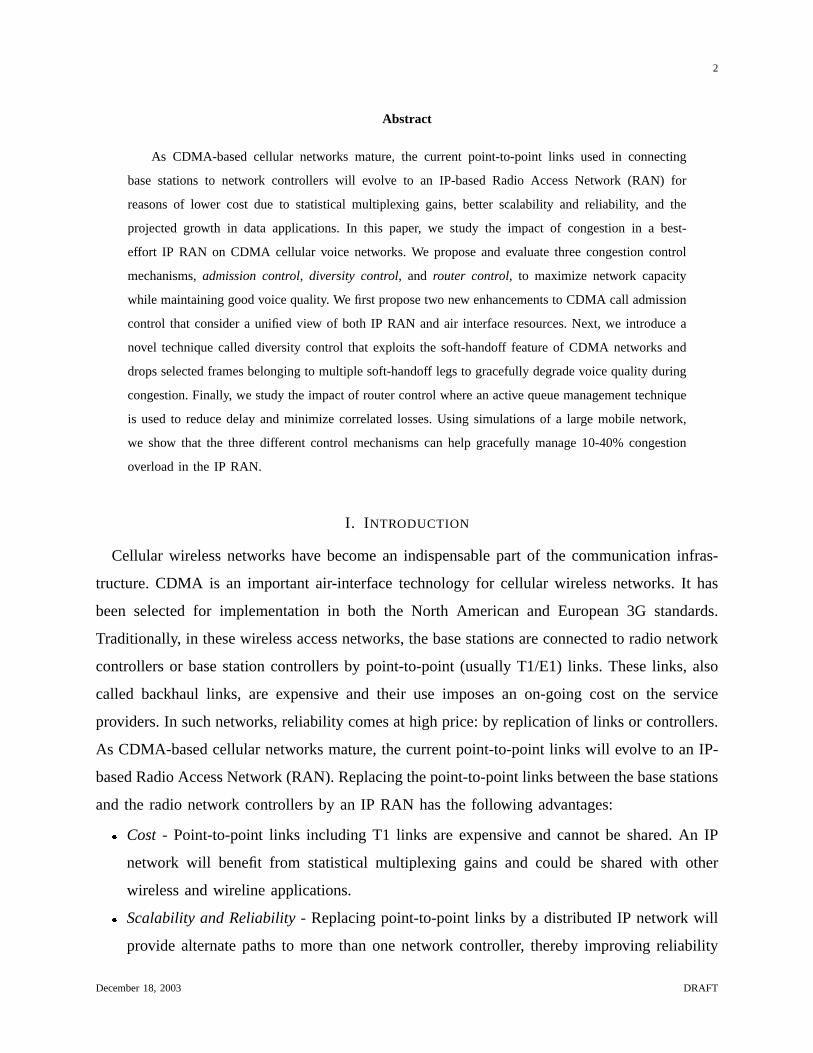
IP RAN andidentify our problemspace.Figure1 shows a wirelessaccessnetwork with mobile
devices communicatingwith basestationsover wirelesslinks. The basestationscommunicate
with the restof the voice or datanetwork throughthe accessnetwork controllers(ANCs) (also
December18, 2003 DRAFT
5
Mobile Users
Base Stations
AccessNetwork Controller
Mobile SwitchingCenter
ANC MSC
IP RANwith routers
To Public SwitchedTelephone Network
Mobile inSoft-handoff
primary
secondary
Wireless Access Network
primary
PotentialBottleneck
DSNTo Internet
DataServiceNode
Fig. 1. CDMA WirelessAccessNetwork with IP RAN
calledRadioNetwork Controller, RNC, in 3G UMTS [6], andBaseStationController, BSC, in
CDMA2000 [7]). Note that this part of the network is commonto both wirelessvoice anddata
traffic. The network separatesonly beyond the ANC wherevoice framesare forwardedto the
MSC (PSTN) and data framesare forwardedto the Data ServiceNodes(Internet).Eachbase
stationtypically communicateswith hundredor moremobilesandeachANC typically controls
several tensof basestations.An ANC performstwo main wirelessfunctions, frameselection
and reverse outer loop power control. Frameselectionexploits one of the key propertiesof
a CDMA network, namely, soft-handoff. In soft-handoff, a mobile communicateswith more
thanonebasestationsimultaneously. Soft-handoff helpsreduceinterferenceon thewirelesslink
therebyincreasingCDMA capacity. When in soft-handoff, a mobile receives multiple frames
in the downlink direction (also called forward link) and combinesthem to constructa single
voice frame. In the uplink direction (also called the reverselink) the ANC receives multiple
framesfrom the mobile. It performsthe frame selectionfunction which involves selectingthe
framewith the bestquality amongthe onesit receives. If the framesfrom all the different legs
of a call in soft-handoff call do not arrive within a presettime interval (20ms in the caseof
CDMA2000), the ANC forwardsthe currentbest frame to the network. In other words,a late
frameis treatedas if it werea droppedframeandthus,controlling delay in the accessnetwork
is extremely important.
December18, 2003 DRAFT
6
In addition to frame selection,the ANC also performsreverseouter loop power control, in
which it setstarget signalto noiseratio ( ������� ) for eachmobile at eachbasestation.The target
( ������� ) is setsuchthat thetarget frameerror ratefor theflow after frameselectionis maintained
below a presetlimit (suchas 1%). Eachbasestationreceives the target ������� for eachmobile
device from the ANC andinstructsthe devicesto increaseor decreasetheir transmissionpower.
We now describethe operationof the IP network betweenthe basestationandthe ANC. On
receiving voice framesfrom different mobiles,a basestation aggregatesseveral voice frames
into an IP packet and sendsthem out towards the ANC. Voice framesare typically only few
tensof bytes in length.Their aggregation helpsin reducingIP headeroverhead.Voice frames
belongingto thedifferentlegsof soft-handoff aretransmittedby differentbasestationsandhence
arrive at the ANC on different IP packets. On receiving IP packets from the basestations,an
ANC demultiplexesthevoice framesandperformsframeselectionandouterloop power control
functionsandforwardsthebestvoiceframeuplink. Voiceframesalsocontainpower information
that is usedby the ANC for outer loop power control. Thereforepacket loss,andhencelossof
voice frames,due to RAN congestioncould result in imperfectouter loop power control. This
could causethe power consumptionin a cell to be higher than its expectedvalue and thereby
reducethe overall capacity. Thus,controlling loss in the accessnetwork is very important1.
The link leadingto the ANC is likely to becomea bottleneckduring congestionbecausethis
link carriestheaggregatetraffic of severaltensof basestations.While thelink will beengineered
to take into accountthe statisticalmultiplexing gains of this aggregation, offered traffic could
temporarilyexceedthe engineeredcapacityof the link due to hot spotsor other reasons.We
requiremechanismsto respondto thesetemporarycongestioneventsin a gracefulmanner. This
congestionresponseis the focus of the rest of the paper. While we focus only on the reverse
pathfrom basestationstowardsthe ANC, mostof the techniquesdescribedherecanbe applied
to the forward pathaswell.
In summary, in this paper, we will studythe effect of a singlebottlenecklink in the common
path from the basestationstowardstheir ANC for aggregatedCDMA voice traffic arriving as
IP packetsandproposesolutionsto control congestiongracefully.
1Although, we do not study the imperfectionsin outer loop power control due to loss of power control information, our
congestioncontrol mechanismsdo control IP RAN loss.
December18, 2003 DRAFT

7
I I I . CALL ADMISSION CONTROL
CDMA systemsare typically interferencelimited and rely on the processinggain2 to be
able to operateat a low signal-to-interferenceratio. In order to minimize the interference,the
mechanismsadoptedby theCDMA systemscontrol thepower emittedon eachchannel(in either
direction)to keepthe signal-to-interferenceratio (SIR) at a receiver at a target value.Whenthe
power limit of a basestation is reached,the SIR can no longer be maintainedat the target
level, and calls servicedby the basestationare blocked or dropped.Hence,call admissionis
closelytied to power control.The call admissioncontrol in currentCDMA systemsis restricted
to controlling the usageof air interfaceresources.The point-to-pointaccesslinks betweenthe
basestationsandthe ANC areexpectedto be loss-free.The presenceof an IP RAN addsa new
dimensionto this processsincea lossy or congestedbest-effort IP RAN could result in high
lossesanddelays,therebyreducingthe voice quality. In this section,we describetwo schemes
to enhancethe air interface call admissioncontrol algorithmsthat also take the IP RAN loss
into considerationwhen deciding on admitting new calls. We first presentthe call admission
control mechanismthat considersthe air interface resourcesonly and then describeour two
enhancementsto admissioncontrol that considera unified view of both the IP RAN andthe air
interfaceresources.
A. AdmissionControl at Air Interface(CAC)
We considera single basestation that is serving a geographicalarea called a cell. The
relationshipbetweenreceivedpowerat thebasestationandcell load,andanassociatedadmission
control thresholdin terms of the allowed received power is describedas follows. The total
interferenceat a mobile includesthe interferencefrom the mobiles of the samecell and the
neighboringcells, and from thermal noise. For a CDMA cell with signals,one for each
mobile, thereare ��� interferersfrom the samecell. If we assumeperfectpower control on
the reverselink and that the signalstransmittedfrom all the mobilesarrive at the basestation
with thesamereceivedpower � , theratio of signalbit energy ��� to total interferenceandthermal
noisepower spectraldensity �� canbe expressedas [8]
2Processinggain is definedas the ratio of transmittedsignalbandwidthto the datasignalbandwidth(information rate).
December18, 2003 DRAFT

8
������������ � ��!"$#&%('*),+.- � "/'10(2*3*)406587 ���:9 (1)
where ;=< is the channelactivity factor, >@? representsthe interferencedue to other cells, Arepresentsthe mobile transmissionrate, B�C is the spreadingbandwidth,and DFE is the thermal
noise power spectraldensity. Given a target ������� , with the processinggain representedasG�HJI B�CK�=A , the numberof mobiles a cell canadmit is a function of the received power � :
# � 'L0NM�O '" �K� � ��� ),+.-"/'10(2*3*) % 587 ���� +.-P"/'L0Q2�3*)SR (2)
Thetotal receivedpowercanberepresentedas T total � +.-@"/'�0U2�3V) � #W0X5:Y ��� . Usingthisexpression
to obtain � as a function of the total received power and insertingit into Equation2, we can
determinethe numberof mobiles a cell can admit when the total received signal power isZtotal by the following equation:
# � 'L0NM�O [\^]`_ba 3dcfe^g�h \ [bi -kjke'L0 lnmpo`qrtotal s lnmto`q R (3)
Whenthe total received power is restrictedtoZ
max, the maximumnumberof connectionsthat
can be admittedby a cell is obtainedfrom Equation3 by replacingZ
total withZ
max. This forms
the basisof the air interfaceadmissioncontrol algorithm.Note that this algorithmdoesnot take
the quality of the IP RAN into account.In the next subsection,we enhancethis algorithm to
alsoconsideraccessnetwork load.
We end this subsectionby describingthe relationshipbetweenthe total received power and
the cell load.The cell load, representedby u , is simply determinedby the ratio# � # pole , where
pole is the maximumcell capacityor the pole capacity. The maximumcell capacity, pole, can
beobtainedby settingZ
total v w . Therefore,#
pole � '0xMKO [\y] _ a 3,cfe^g h \ [,i -kjke . Thus,thetotal received
power andcell load are relatedby the following equation:
T total5zY ��� � ''{%}| R (4)
Equation4 is usedfor call admissioncontrol enhancementsin the next subsection.
December18, 2003 DRAFT

9
B. Enhancedadmissioncontrol
In this section,we proposetwo enhancedadmissioncontrol algorithms which respondto
changes in the accessnetwork load by regulating the admissioncontrol criteria at the air
interface, thereby indirectly adjusting the load entering the accessnetwork. Insteadof using
the maximumallowable received power,Z
max, to perform admissioncontrol, eachbasestation
usesa variablereceived power threshold,Z
adm, that is periodicallycalculatedby the ANC. The
calculationsarebasedon the air interfacecapacityandcell load, aswell as IP RAN lossrate.
Our enhancedadmissioncontrol schemesare called Maximum-Power-basedcall admission
control (CAC-MPC) and Usage-basedcall admissioncontrol (CAC-UC). Both schemesshare
thesamebasicapproach:themeasuredpacket lossrateis usedto calculatea power scalingfactor~ , which is thenusedto scaletheadmissioncontrol threshold,Z
adm, for theair interface,thereby
throttling incomingtraffic andreducingcongestion.We first presentthegeneralmethodologythat
we useto adaptively quantify the loss-rateandthenpresentour two admissioncontrol schemes.
1) General Methodology: The purposeof admissioncontrol in the IP RAN is to keep the
packet lossratewithin a target level, so that thequality of voice transmissioncanbemaintained.
Weusea feedbackcontrolstrategy basedonaconstrainedintegral controllaw [9]. In thisscheme,
the packet transmissionbetweenbasestationsandthe ANC is monitoredby the ANC. Sinceall
the uplink traffic will go throughthe ANC, the ANC candetectthe packet loss in the IP RAN.
The power scalingfactor ~ is calculatedperiodicallyby comparingthe monitoredlossratewith
a target loss rate.With the measuredloss rate of the IP RAN representedas � and the target
loss rateas �8� , the scalingfactor ~ for a period � is calculatedas:
� � � min�max
� �min 9 � n-1
%}�K� % ���� � � 9 � max � 9 (5)
wherethe parameter� controlsthe adaptationspeedof the scalingfactor, and ~ min and ~ max are
the minimum andmaximumvaluesallowed of the scalingfactor.
For an integral controller suchas ours,higher � leadsto a fasterresponse.However, higher
valuesof � can causelarger oscillation and even instabilities.Also, if ���z�4� �4�� � � is too large, ~will be set to a value that could scaleup
Zadm causingundesiredair interfacecontrol. In order
December18, 2003 DRAFT

10
to obtain tighter control, we constrain~ within the range � ~ min � ~ max� 3.2) Maximum-Power-basedControl (CAC-MPC): In our Maximum-Power-basedcontrol, the
admissioncontrol thresholdpowerZ
adm is obtainedby scaling down the maximum allowed
receiving powerZ
max by ~ , when the measuredloss rateexceedsthe target value:
T adm � � T max R (6)
CombiningEquation3, 4 and6, the total numberof mobilesa cell canadmit is given by:
#adm � #
pole'L0 lnmpo`q� r max s l �po`q � #pole"/'{% '{%�|
max� ) 9 (7)
where u max is themaximumloadallowedcorrespondingto themaximumallowedreceivedpowerZmax. Hence,thetotal loadallowedin a cell is u adm
I ����� �4� max� . Sincetheloadcannotbenegative,
the range[ ~ min,~
max] for the scalingfactor is ������u max � � � .Note thatEquation7 cansettheallowedcell load to zero.We usea safe-guardmechanismto
set a lower limit on the thresholdpower accordingto a predeterminedplannedload. This also
ensuresfairnesssinceonly cells with higher thanplannedload will be throttledbackwhen the
IP RAN is congested.In this case,we set
T adm � max� T plan 9 � T max � 9 (8)
whereZ
adm is the plannedlimit on thresholdpower.
3) Usage-basedControl (CAC-UC): In Usage-basedcontrol, the admissioncontrol threshold
powerZ
adm at a cell is calculatedbasedon the current load of the cell as well as the IP RAN
loss rate.The control principle is that the cells with higher load shouldbeara larger shareof
the total load reduction.Whenthe loss rate in the IP RAN is higher than the target value,Z
adm
is obtainedby scalingdown the current received powerZ
cur of a cell, with the scaling factor~ obtainedusing Equation5. Sincethis can result in a much smallerpower thresholdrelative
to the maximum allowable powerZ
max, the power thresholdshould not be set back toZ
max
immediatelyafter the loss is restoredto the target level.Z
adm is scaledup progressively, using
3With the rangeconstraints,caremust be taken that � doesnot get absorbedinto the extremestates.Assumethat � is the
largesterror that occursoncethe systemis in closed-loopoperation.The parameter� can be preventedfrom being absorbed
into the extremestatesif �x� � max ¡ � min¢ .
December18, 2003 DRAFT

11
a scalingfactor ~ greaterthanone.Theusage-basedpower controlalgorithmis describedbelow:
Z admI £¤¥ ¤¦ max§ Z plan � ~ � plan� cur
Zcur ¨ if ~ª© � or �¬«� � .
min § ~ Z adm � Z max ¨ � otherwise®
In the above equation,u plan and u cur representseparatelythe plannedcell load andcurrentcell
load. In order to ensurefairnessto a lightly loadedcell whenpower is beingscaleddown, and
alsoto avoid anexcessively slow responsefollowing a periodof low loss(whenthe initial value
of ~ is greaterthan one), the load ratio of a cell (relative to the plannedload) is usedas an
additionalscaling factor. The useof the two factorstogether, insteadof using either the load
ratio or thescalingfactor ~ separately, resultsin fasterresponseto congestionandalsokeepsthe
losscloseto the target level. Furthermore,aswith the maximumpower basedscheme,we add
a safe-guardmechanismto placea lower limit on the thresholdpower, and prevent penalizing
cells operatingbelow the plannedload.
Detailed performanceevaluation of thesetwo admissioncontrol algorithmsis presentedin
SectionVI.
IV. DIVERSITY CONTROL
Recall that CDMA supportsmacro-diversity or soft-handoff (SHO) in which a mobile user
transmitsand listens to multiple basestationssimultaneously. The uplink packets received at
the multiple basestationsare forwardedto the ANC for frame selectionand the best frame
is forwarded into the wired network. Diversity allows mobile users to smoothly transition
their connectionsfrom one cell to the next without loosing connectivity or suffering service
degradationsas is typical in hard-handoff scenarios.
In typical cellular networks,mobilescanbe in SHO with up to six basestationsat oncewith
one primary leg and up to five secondarylegs. Thesemultiple legs constitutewhat is known
as the mobile’s active set.Field measurementsindicatethat CDMA voice userstend to operate
in SHO mode almost half of the time, with an averageof 1.5 legs per call. However, field
experiencealso suggeststhat the time interval in which a useractually needsmore than one
leg tendsto be relatively short and that the primary leg is typically the bestquality leg. This
December18, 2003 DRAFT

12
indicatesthat theremaybeextendedperiodsof time wherea userhasmorethanoneleg but the
primary leg might have beensufficient, resulting in someunnecessaryredundanttraffic in the
wirelessaccessnetwork. Clearly, how often this occursdependsheavily on the aggressiveness
or conservativenessof theactive setmanagementpolicy andrelative differencesin voicequality
acrossthe diverselegs dueto the air link quality. For wirelessaccessnetworks wherethe above
field observations hold true, one could expect non-primary legs to be redundantoften. This
redundancy canbe exploited usinga techniquewe call diversity control.
Diversity control selectivelydiscards uplink voice radio framesfrom potentially redundant
secondarylegs for somemobileusers at the basestationsin such a way that the voicequality
is not noticeablydegraded while reducingtraffic in the IP RAN to manage congestion. Key
challengesin diversity control aretheservicedegradationandrestorationpolicies,which dictate
how usersarechosenfor and freed from diversity control, respectively.
We proposeandevaluatetwo diversity control policies,referredto asthe service-degradation
policy (SDP)andthe frame-discardpolicy (FDP).SDPimplementsa binaryservice-level model
for eachmobile user, whereinthe cells tag SHO usersasbeing in a degradedor non-degraded
state;mobileswith degradedservicemust discardall their secondarylegs. FDP, on the other
hand,dropssecondarylegs for SHO usersrandomly, eachtime a packet is sentby the cell.
In both policies,eachcell periodically setsa diversity control target basedon the estimated
packet lossratein the IP RAN4. The diversity control target for the � f¯ control periodis a drop
probability denotedbyZ{°
, computedby a first-orderautoregressive modelgiven as:
T � � max�min
�*± 9 T n-1
0N�{� % ���� � � 9 ' � 9 (9)
where � , � , and �8� representtheadaptationspeedfactor, measuredlossrateandtarget lossrate,
respectively, as definedfor the admissioncontrol scaling factor in Equation5. Although this
equationis very similar to Eq. 5, the drop probability is limited to a valuerangebetween0 and
1 and the varianceterm to adjustfor the measuredloss rate error usesa positive value for the
adaptationspeedparameter� . This ensuresthat the drop probability increasesas the measured
loss rate increasesabove the target and that it decreasesotherwise. � controlshow smoothly
drop probabilitieschange,leadingto higherZ{°
variancesas � increases.While highervaluesof
4Packet lossrateestimateis conveyed to the basestationsby the ANC.
December18, 2003 DRAFT

13
� leadto fasterreactionto changesin rateloss,thehigherZ{°
variancesmaysometimesleadto a
relatively high meandropprobability. It is possibleto obtainfastreactivity anda low meandrop
probability without introducinghigh varianceby adjustingthe drop probability in a non-linear
(e.g.,exponential)fashion.However, a discussionof this topic is beyond thescopeof this paper.
Oncethe drop probability is computed,the SDP and FDP policies differ on how it is used
to discardthe traffic for non-primary legs. In SDP, the drop probability representsa service
degradationthresholdfor eachcell. This thresholdindicateswhatpercentageof SHOusersneed
to be in a degradedservicestatefor the durationof the control period andusersare randomly
selectedfor degradation.In FDP, the drop probability representsthe frame drop probability
for each cell. Every time a cell assemblesan aggregated IP packet to send to the ANC, it
randomlydropssecondaryvoice framesaccordingto the frame drop probability. Note that the
key differencebetweenSDPandFDPis thatSDPdoesnotconsiderthenumberof SHOlegseach
userhasin its selectionprocessandit forcesthe discardof all of a degradeduser’s non-primary
legs.
Restorationis the counterpartto the degradationpolicies.In SDP, a degradeduseris restored
at a control periodarrival when its service-level statusis toggledto non-degraded.As a result,
a diversity control period constitutesthe minimum amountof time a degradedusermust wait
prior to being restored.In FDP, on the other hand,restorationsoccur on a per-leg, per packet-
basis,aspreviously discardedlegs are re-enabledto transmit.Consequently, FDP exertsa finer
grain control by randomizingthe selectionof framesto be discardedon every single packet
transmission,which occurs in the millisecond timescalerather than on the secondtimescale
wherethe SDPdiversity control periodoperates.
SinceSDPexplicitly affects per-userstate,diversity control comesinto play on call handoff
events,wherea changein a user’s active set needsto be managed.For instance,if a degraded
userloosesall its non-primarylegs on a handoff, shouldthis userbe restored?If, on the other
hand,the handoff would add more legs should the new legs be degraded?For simplicity, we
assumethat degradedusersarerestoredif they looseall their secondarylegs andthat degraded
usersareprohibitedfrom addingany more legs dueto handoff. FDP would be affectedby call
handoffs if they were to trigger the re-computationof cell framedroppingprobabilitiesbut for
simplicity, we make no suchassumption.
Diversity control,by itself, might not be sufficient to recover from congestion,particularly in
December18, 2003 DRAFT

14
situationswherethe instantaneousamountof diversity to be exploited is low or the congestion
is very high. As a result, it is advantageousto apply diversity control in conjunction with
load control, to ensurethat they jointly achieve the goal of maintaininggood call quality (by
minimizing the averageuserframeerror rate,FER).
In SectionVI, we evaluatethe potentialbenefitsof diversity control and discussthe impact
of a joint diversity- and load-controlon the CDMA network.
V. ROUTER CONTROL USING ACTIVE QUEUE MANAGEMENT
When congested,a router typically follows a drop tail policy wherepackets arriving at the
routerarequeuedas long asthereis spaceto buffer themanddroppedotherwise.Even though
it is simple to implement,the drop tail policy posestwo importantproblems.
� If the buffer size is large, the queuingdelayscan be very high. Given the frameselection
deadlineof 20ms for CDMA2000 networks at the ANC, thesedelayswould causethe
transmittedpackets to arrive at the ANC too late to be of any use.However, if the routers
could provide the requireddelayboundthen this problemdoesnot exist.� The packet dropstend to be bursty. In a CDMA systemframesfrom calls in soft-handoff
arrive in different IP packetsat the IP bottlenecklink at aboutthe sameinstant.If the loss
is bursty, the multiple framesassociatedwith different legs of a soft-handoff call could be
droppedat the sametime. When the numberof calls in soft-handoff is large andmultiple
framesassociatedwith different legs of the soft-handoff are good (meaningthat it will
suffice even if any one of theseframesis received at the ANC), the bursty loss would
increasethe probability of frameerror.
Active queuemanagement(AQM) [5] is a form of router control that attemptsto provide
congestioncontrolby monitoringthecongestionstateof a routerqueueandpro-actively dropping
packetsbeforethe buffers becomefull andqueuingdelaysbecometoo high. Someof the AQM
policies (for e.g., [10]) drop packetswith a certainprobability to avoid bursty loss.
It appearsthat the randomdroppingand tight delayfeaturesof AQM policiesare an excellent
fit for the uniquedelaydeadlineand soft-handoff requirementsof a CDMA accessnetwork. For
example,anAQM policy could reducethequeuingdelaysin theroutersso that thevoice frames
could be received at the ANC by the deadline.An AQM policy could alsohelp prevent all the
framesassociatedwith different legs of a soft-handoff call from being dropped.It should be
December18, 2003 DRAFT
15
notedthat proposingor designingan efficient AQM policy is not within the scopeof this paper.
Rather, we want to study the impactof routercontrol usingany reasonableAQM policy.
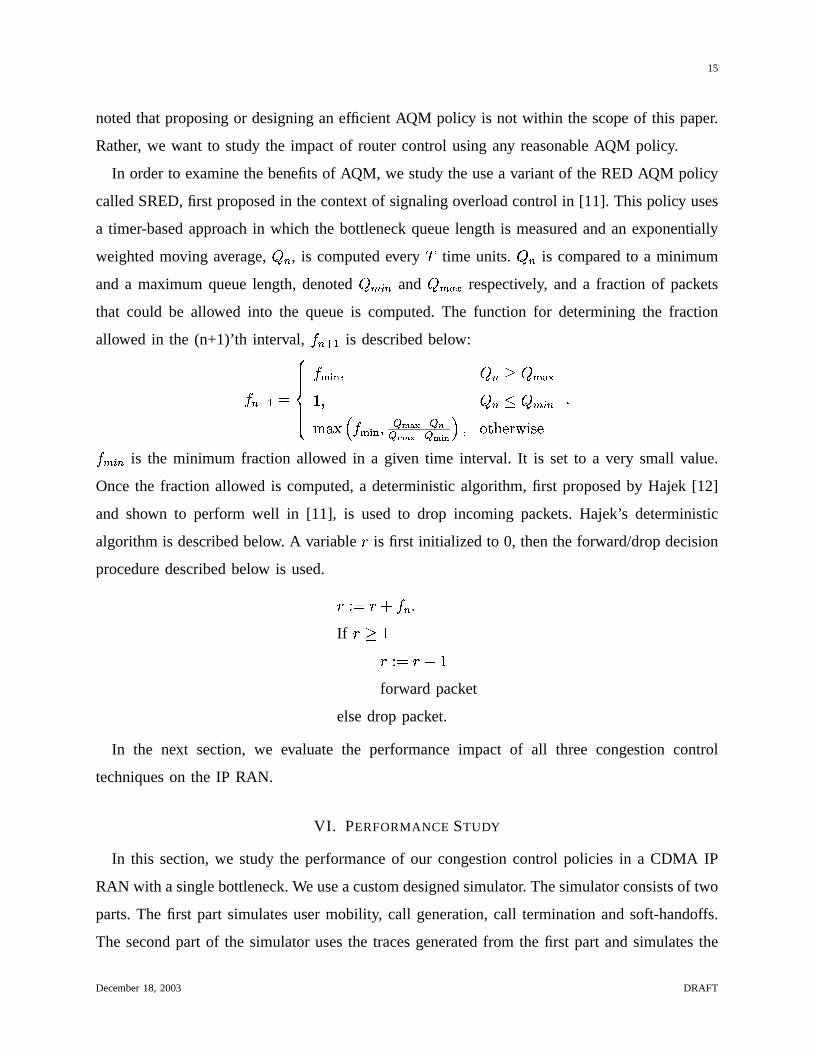
In orderto examinethebenefitsof AQM, we studytheusea variantof theRED AQM policy
calledSRED,first proposedin thecontext of signalingoverloadcontrol in [11]. This policy uses
a timer-basedapproachin which the bottleneckqueuelength is measuredandan exponentially
weightedmoving average,² ° , is computedevery ³ time units. ² ° is comparedto a minimum
and a maximumqueuelength,denoted²µ´�¶ ° and ²µ´X·¹¸ respectively, and a fraction of packets
that could be allowed into the queueis computed.The function for determiningthe fraction
allowed in the (n+1)’th interval, > °Pº � is describedbelow:
> °Pº � I£¤¤¤¤¥ ¤¤¤¤¦>P»½¼�¾ � ² °N¿ ²J»�ÀÂÁ� � ² °Nà ²µ´�¶ °ÄQÅ@Æ6Ç >P»½¼�¾ �ÉÈ�ÊÌË,Í � È�ÎÈ Ê4ËdÍ � È Ê4Ï Ð
Ñ �ÓÒ`Ô*Õ×ÖSعÙÛÚfܹ֮
>Ý´�¶ ° is the minimum fraction allowed in a given time interval. It is set to a very small value.
Oncethe fraction allowed is computed,a deterministicalgorithm,first proposedby Hajek [12]
and shown to perform well in [11], is usedto drop incoming packets. Hajek’s deterministic
algorithmis describedbelow. A variable Þ is first initialized to 0, thenthe forward/dropdecision
proceduredescribedbelow is used.
ÞÉß I ÞÛà¬> ° .If Þ ¿ �
Þ6ß I Þµ��forward packet
elsedrop packet.
In the next section, we evaluate the performanceimpact of all three congestioncontrol
techniqueson the IP RAN.
VI. PERFORMANCE STUDY
In this section,we study the performanceof our congestioncontrol policies in a CDMA IP
RAN with asinglebottleneck.Weuseacustomdesignedsimulator. Thesimulatorconsistsof two
parts.The first part simulatesusermobility, call generation,call terminationandsoft-handoffs.
The secondpart of the simulatorusesthe tracesgeneratedfrom the first part andsimulatesthe
December18, 2003 DRAFT

16
á á áá á áá á áá á áá á áá á áá á áá á áá á áá á áá á áá á áá á áá á áá á áá á áá á áá á áá á áá á áá á áá á áá á áá á áá á áá á áá á áá á áá á áá á áá á áá á áá á áá á áá á á
â â ââ â ââ â ââ â ââ â ââ â ââ â ââ â ââ â ââ â ââ â ââ â ââ â ââ â ââ â ââ â ââ â ââ â ââ â ââ â ââ â ââ â ââ â ââ â ââ â ââ â ââ â ââ â ââ â ââ â ââ â ââ â ââ â ââ â ââ â â
ã ãã ãã ãã ãã ãã ãã ãã ãã ãã ãã ãã ãã ãã ãã ãã ãã ãã ãã ãã ãã ãã ãã ãã ãã ãã ãã ãã ãã ãã ãã ãã ãã ãã ãã ã
ä ää ää ää ää ää ää ää ää ää ää ää ää ää ää ää ää ää ää ää ää ää ää ää ää ää ää ää ää ää ää ää ää ää ää ä
å åå åå åå åå åå åå åå åå åå åå åå åå åå åå åå åå åå åå åå åå åå åå åå åå åå åå åå åå åå åå åå åå åå åå å
æ ææ ææ ææ ææ ææ ææ ææ ææ ææ ææ ææ ææ ææ ææ ææ ææ ææ ææ ææ ææ ææ ææ ææ ææ ææ ææ ææ ææ ææ ææ ææ ææ ææ ææ æç ç ç ç ç ç ç ç ç ç ç ç ç ç ç ç ç çç ç ç ç ç ç ç ç ç ç ç ç ç ç ç ç ç çç ç ç ç ç ç ç ç ç ç ç ç ç ç ç ç ç çè è è è è è è è è è è è è è è è è èè è è è è è è è è è è è è è è è è èè è è è è è è è è è è è è è è è è è
é é é é é é é é é é é é é é é é é éé é é é é é é é é é é é é é é é é éé é é é é é é é é é é é é é é é é éê ê ê ê ê ê ê ê ê ê ê ê ê ê ê ê ê êê ê ê ê ê ê ê ê ê ê ê ê ê ê ê ê ê êê ê ê ê ê ê ê ê ê ê ê ê ê ê ê ê ê êë ë ë ë ë ë ë ë ë ë ë ë ë ë ë ë ë ëë ë ë ë ë ë ë ë ë ë ë ë ë ë ë ë ë ëë ë ë ë ë ë ë ë ë ë ë ë ë ë ë ë ë ëì ì ì ì ì ì ì ì ì ì ì ì ì ì ì ì ì ìì ì ì ì ì ì ì ì ì ì ì ì ì ì ì ì ì ìì ì ì ì ì ì ì ì ì ì ì ì ì ì ì ì ì ìí í í í í í í í í í í í í í í í í íí í í í í í í í í í í í í í í í í íí í í í í í í í í í í í í í í í í íî î î î î î î î î î î î î î î î î îî î î î î î î î î î î î î î î î î îî î î î î î î î î î î î î î î î î î
ï ï ï ïï ï ï ïï ï ï ïð ð ð ðð ð ð ðð ð ð ð
ñ ññ ññ ññ ññ ññ ññ ññ ññ ññ ññ ññ ññ ññ ññ ññ ññ ññ ññ ññ ññ ññ ññ ññ ññ ññ ññ ññ ññ ññ ññ ññ ññ ññ ññ ñ
ò òò òò òò òò òò òò òò òò òò òò òò òò òò òò òò òò òò òò òò òò òò òò òò òò òò òò òò òò òò òò òò òò òò òò ò
Region for four handoff legs
Region for one leg
Region for two handoff legs
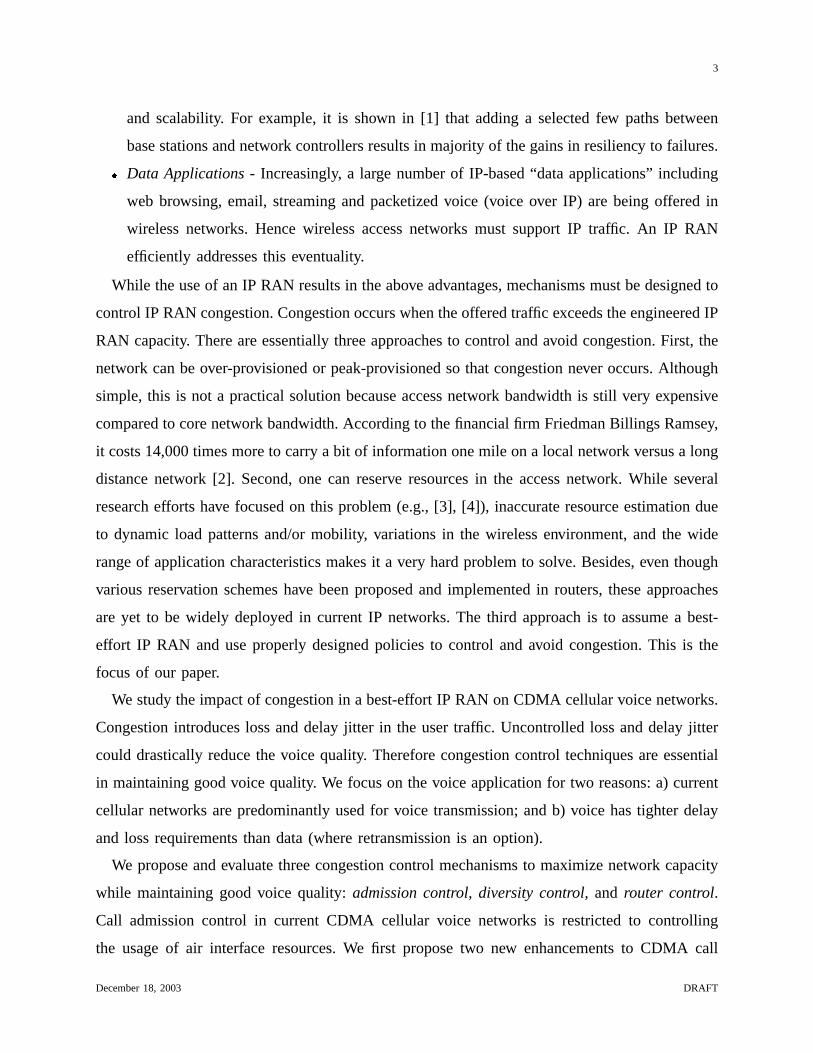
Fig. 2. Soft-Handoff Regions for a 5 X 5 cellular network
generationandaggregation of voice frames,IP packet transmissionthrougha singlebottleneck
link, and frameselectionat the ANC.
A. SimulationModel
We now describeour modeland the variousparametersthat we usein our simulationstudy.
1) Mobility Model: In order to simulatea very large PCS network we use a wrap around
technologyasadvocatedby theauthorsin [13]. This approacheliminatestheboundaryeffectsin
anun-wrappedtopology. We simulateour PCSnetwork usinga wrappedmeshtopologywith the
numberof cells rangingfrom ó`ô to õ@ö . In order to simulatesoft-handoffs, we assumethat cells
arerectangularandall neighboringcells (top, left, bottom,right) overlap.This resultsin regions
in the network with one,two, and four soft-handoff legs asshown in FigureVI-A.1. A similar
approachusingrectangularcells but with overlapbetweentwo neighboringcells only (resulting
in regionswith oneandtwo soft-handoff legs) hasbeenusedin [14] and[15]. We assumethat
the mobile userspendsan exponentialamountof time in eachregion with averageresidence
times in regionswith one,two andfour legs distributedwith the ratio 10:4:2.5.The movement
of the mobile usersis basedon the two-dimensionalrandomwalk model usedin [16]. In this
model, the mobile usersmove to one of their neighboringcells with equalprobability. In our
simulation,while the useralwaysmovesfrom a one-leg to a two-leg region andfrom a four-leg
to a two-leg region, we bias the movementsfrom two leg regions, such that there is a 80%
December18, 2003 DRAFT

17
chanceof going to a one leg region andonly a 20% chanceof going to a four-leg region. This
movementbehavior coupledwith theaverageresidencetimesin thedifferentregionsgivesusan
averageactive soft-handoff leg valueof 1.44. This is betweenthe valuesof 1.2 and1.7 average
legs aspresentedin [17] andwithin the rangeevaluatedfor a nominalpropagation environment
in [18]. Mobiles aregeneratedrandomlyanduniformly acrossthe cells. In order to load a cell,
we generatecall arrivals for eachmobile user. The call ratevarieswith the requiredsimulation
load of the cell. The arrival rateper useris determinedas follows.
We start with the assumptionthat call arrivals at eachuserare basedon a Poissonprocess
with a meanarrival rate ÷ andthe call holding timesareexponentiallydistributedwith a mean
value �P�@ø . Now, if the call holding times were always smaller than the call inter-arrival times
then ÷ could be simply determinedas a function of the requiredcell load and the numberof
users.Interestingly, even if we pick themeanarrival rate ÷ to be lessthanthemeancall holding
rate ø , inter-arrival timescanbesmallerthancall holding times.In suchsituations,a call arrival
event doesnot result in an actual call. In other words, a mobile user initiating a call at timeùÂúcannotmake anothercall soonerthan
ùÂúplus the call holding time. In order to take the call
holding time into accountin generatingthe requiredcall load we usethe following analysis.
Let û be a randomvariablethat representsthe call holding time. Let ü be anotherrandom
variablethat representsthe time betweenwhena call is over until the time thenext call is made.
Therefore,the interval betweentwo calls ( ³ ) is given by
³ I ûýàªüz®As notedearlier, �(� û � I �P�Pø . Also, sincethe call arrival eventsare generatedfrom a Poisson
distribution, the inter-arrival time is exponentially distributed. Now, due to the memoryless
property of exponential distributions, the time of a call arrival starting at an instanceùÂú
is
independentof the time of a call arrival starting at an instanceùÂú àþû . This implies that
�ÿ� ü � I �P�÷ . Therefore,
�(� ³ � I �(� û � à �(��ü �I �P�Pø(à �Ý�=÷The effective meancall arrival rate, ÷ � < < , is �P�=�(� ³ � .
For determiningthemeancall arrival rate,we first find the ÷ � <�< asa functionof thesimulation
load of a cell and the numberof mobile users.Next, we usethe above relationshipto obtain ÷December18, 2003 DRAFT
18
asa function of ÷ � <�< . In summary, althoughcall arrival eventsaregeneratedat every userwith
a meanarrival rate ÷ , not all arrivals result in an actualcall. Effectively, calls aregeneratedat
a rate ÷ � <�< which is lessthan ÷ .
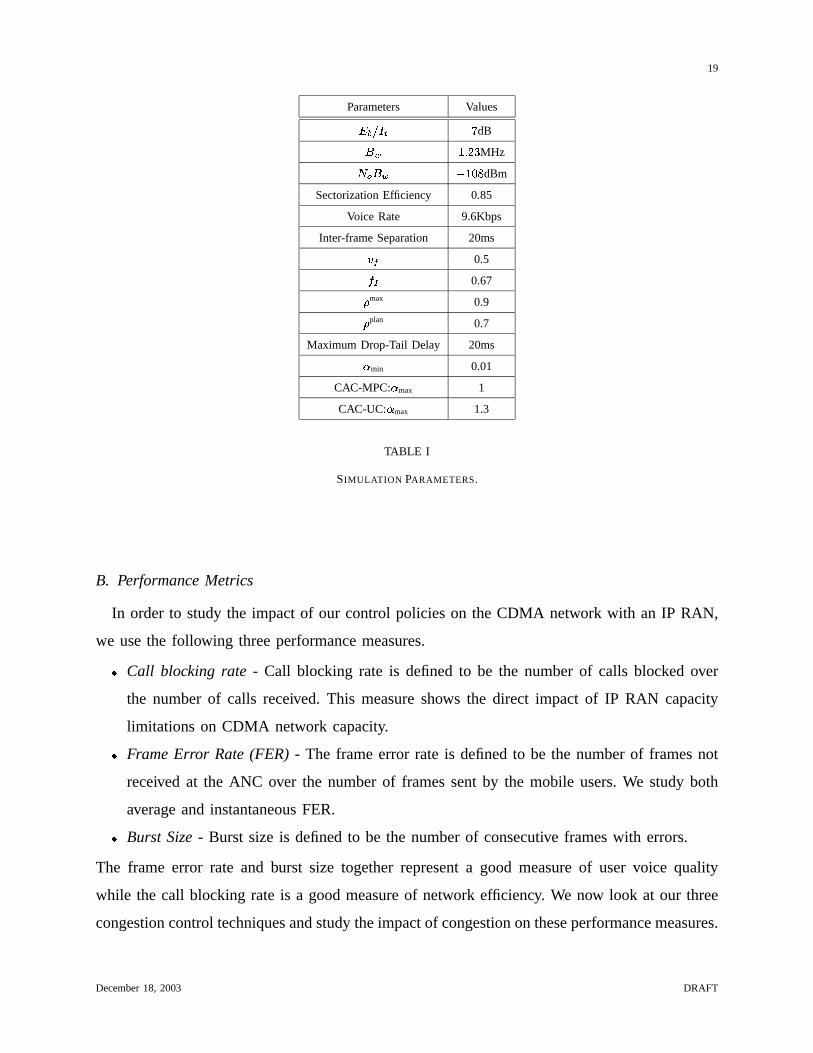
2) Air InterfaceParameters: The simulationparametersadoptedfor the air interfaceare as
follows. We use three sectorsper cell in our simulation,and the sectorizationgain is set to
2.55 [19]. This amountsto a sectorizationefficiency of 0.85 for a threesectorantenna.We set
the ratio of bit energy to noise density ������� to�
dB, the spreadingbandwidth B�C to �`® ó��MHz, thermal noise of a cell D ú B�C to �}����� dBm, voice rate to 9.6 kb/s and activity factor
to 0.5, andother cell interferenceparameter>P? to 0.67. The maximumallowable cell load and
engineeredload for eachcell are 0.9 and 0.7 respectively. The RAN is provisionedto support
the total engineeredload of all the cells. While the modelingof the dynamicquality behavior
of soft-handoff user legs remainsan open researchissue,we assumeda simple model where
weightsare assignedto eachuser leg, addingup to 1.0 acrossall legs and biasingthe weight
of the primary leg to be highest.
In orderto isolatetheeffectsof congestionin theRAN, we assumethat thebottleneckis only
in the IP RAN and thereis enoughcapacityat the air interface.Basedon the call arrival and
handoff events in the trace,we generatevoice framesevery 20msfor eachactive call. These
framesare sentto the appropriatebasestations.The basestationsthen aggregate theseframes
into IP packetswhich arethensentto the ANC throughthebottlenecklink. Theprovisioning in
the RAN is suchthat whenthe load of all the cells is 0.7, the plannedload, andthe bandwidth
utilization of the bottlenecklink in the RAN is 0.90.The maximumdrop-tail routerdelayis set
to 20ms.
The scaling factor for load control in the RAN is calculatedusing Equation 5. For both
maximum-power-basedloadcontrolandusage-basedloadcontrol,thetypicalparametersare0.01
for the targetedpacket loss rate at the RAN, 0.01 for the scalingfactor adjustmentparameters
� , and0.1 for the minimum valueof ~ . The maximumvalueof ~ is set to one for maximum-
power-basedloadcontrol,and1.3 for usage-basedloadcontrol.The typical control interval time
periodwhenparametersareupdatedis five secondsfor both admissioncontrol schemes.
The parametersusedin our simulationaresummarizedin Table I.
December18, 2003 DRAFT
19
Parameters Values���� �� �
dB��� ��� ���MHz����� � � �! �"dBm
SectorizationEfficiency 0.85
Voice Rate 9.6Kbps
Inter-frameSeparation 20ms#%$ 0.5&('
0.67) max 0.9) plan 0.7
Maximum Drop-Tail Delay 20ms� min 0.01
CAC-MPC:� max 1
CAC-UC:� max 1.3
TABLE I
SIMULATION PARAMETERS.
B. PerformanceMetrics
In order to studythe impactof our control policieson the CDMA network with an IP RAN,
we usethe following threeperformancemeasures.
� Call blocking rate - Call blocking rate is definedto be the numberof calls blocked over
the numberof calls received. This measureshows the direct impact of IP RAN capacity
limitations on CDMA network capacity.� FrameError Rate(FER) - The frameerror rate is definedto be the numberof framesnot
received at the ANC over the numberof framessentby the mobile users.We study both
averageand instantaneousFER.� Burst Size- Burst size is definedto be the numberof consecutive frameswith errors.
The frame error rate and burst size togetherrepresenta good measureof user voice quality
while the call blocking rate is a goodmeasureof network efficiency. We now look at our three
congestioncontroltechniquesandstudytheimpactof congestionon theseperformancemeasures.
December18, 2003 DRAFT
20
0.7 0.75 0.8 0.85 0.9 0.950
0.05
0.1
0.15Av
g pac
ket lo
ss
Offered load (a)
CAC CAC−MPCCAC−UC
0.7 0.75 0.8 0.85 0.9 0.950
0.2
0.4
0.6
0.8
1
Avg p
ower
thres
hold
Offered load (b)
CAC CAC−MPCCAC−UC
0.7 0.75 0.8 0.85 0.9 0.950
0.05
0.1
0.15
Avg F
ER
Offered load (c)
CAC CAC−MPCCAC−UC
0.7 0.75 0.8 0.85 0.9 0.950
0.05
0.1
0.15
0.2
Call b
lockin
g rate
Offered load (d)
CAC CAC−MPCCAC−UC
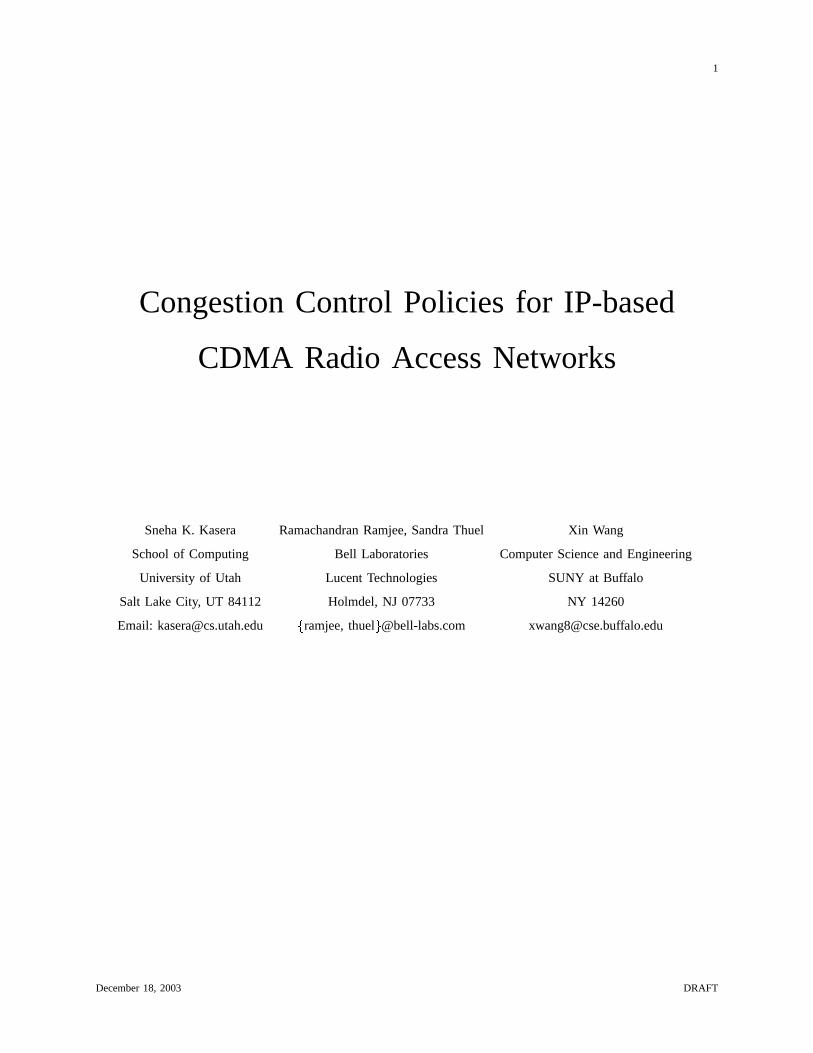
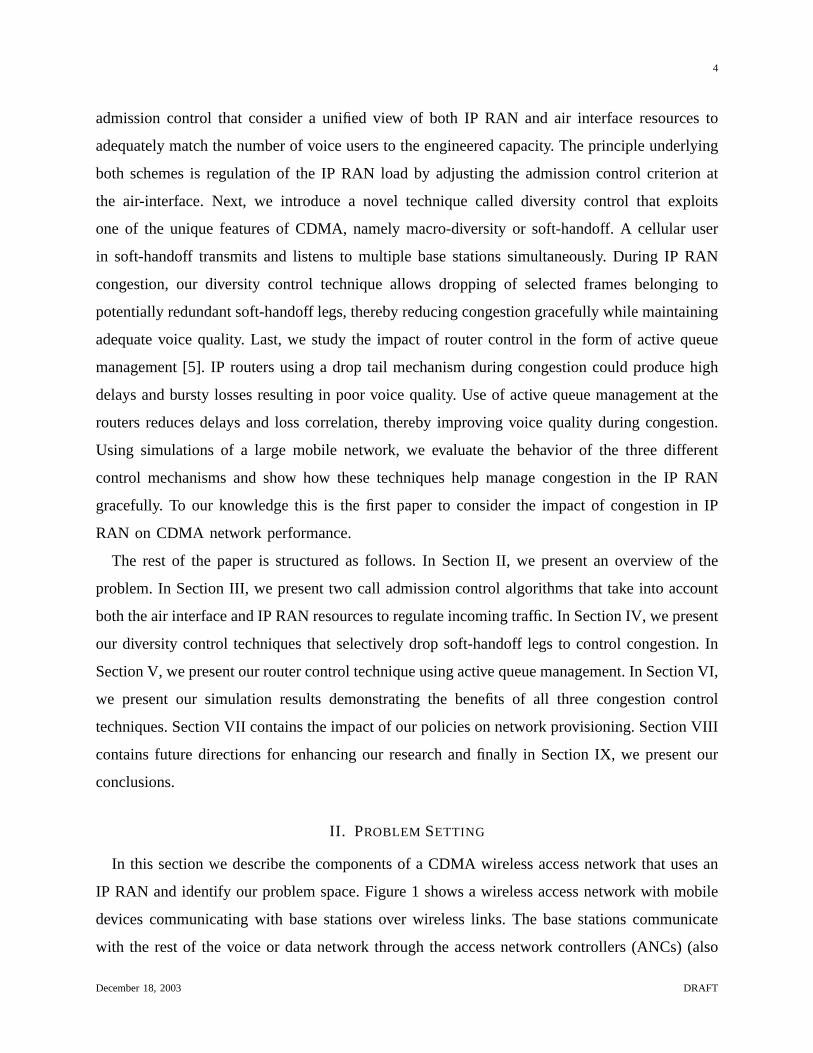
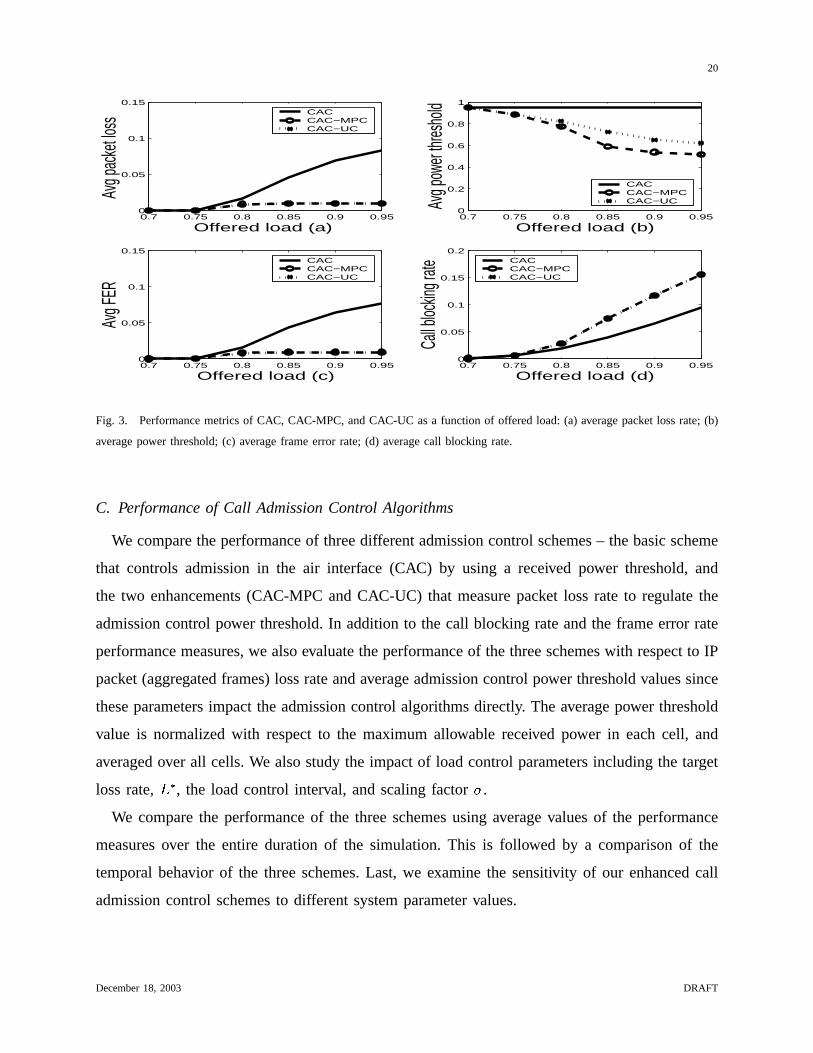
Fig. 3. Performancemetricsof CAC, CAC-MPC,andCAC-UC asa function of offeredload: (a) averagepacket lossrate; (b)
averagepower threshold;(c) averageframeerror rate; (d) averagecall blocking rate.
C. Performanceof Call AdmissionControl Algorithms
We comparetheperformanceof threedifferentadmissioncontrolschemes– thebasicscheme
that controls admissionin the air interface (CAC) by using a received power threshold,and
the two enhancements(CAC-MPC andCAC-UC) that measurepacket loss rate to regulatethe
admissioncontrol power threshold.In additionto the call blocking rateandthe frameerror rate
performancemeasures,we alsoevaluatetheperformanceof the threeschemeswith respectto IP
packet (aggregatedframes)lossrateandaverageadmissioncontrolpower thresholdvaluessince
theseparametersimpactthe admissioncontrol algorithmsdirectly. The averagepower threshold
value is normalizedwith respectto the maximumallowable received power in eachcell, and
averagedover all cells.We alsostudythe impactof load control parametersincluding the target
loss rate, �8� , the load control interval, andscalingfactor � .
We comparethe performanceof the threeschemesusing averagevaluesof the performance
measuresover the entire durationof the simulation.This is followed by a comparisonof the
temporalbehavior of the threeschemes.Last, we examinethe sensitivity of our enhancedcall
admissioncontrol schemesto differentsystemparametervalues.
December18, 2003 DRAFT

21
1) PerformanceComparisonof CAC, CAC-MPC, and CAC-UC: Fig. 3 (a) and(c) show the
variationof the averagepacket lossrateandreceived voice frameerror rateasa function of the
offered load. The loss rate is almostzero until the offered load exceeds0.7, the plannedload.
Both maximum-power-basedcontrol and usage-basedcontrol are seento maintainthe average
loss rateat the targetedlevel, 1%, which is up to 8 times lower than the performanceof basic
CAC. Fig. 3 (a) and(c) alsoshow that the averageframeerror rateandthe averagepacket loss
ratebehave almostidentically with changingload.We find similar behavior in othersimulations
aswell.
When the accessnetwork is congested,the two enhancedadmissioncontrol schemesreduce
the thresholdpower for admissioncontrol. As a result,new calls from heavily loadedcells are
blocked. Fig. 3 (d) shows that the blocking rateof all the schemesincreasesalmostlinearly as
the loadincreasesbeyond0.8.As expected,theblockingratesof theenhancedadmissioncontrol
schemesare higher than that of the basicCAC scheme.In practice,due to the self-regulating
behavior of reverseouter loop power control, the ANC would instruct the mobilesto increase
their power levels since it typically assumesthat lossesonly occur in the air interface. This
would result in a higher blocking rate than the blocking rate shown in the figure for the basic
CAC scheme.
Fig. 3 (b) plots the averageadmissionpower levels for the schemes.It can be seenthat
CAC-UC allows up to 20% higher averageadmissionpower than CAC-MPC. This is because
CAC-UC respondsfasterto the changingpower level in eachoverloadedcell. However, due to
the non-linearrelationshipbetweenthe admissioncontrol power thresholdand the air interface
capacity, the relative decreasein blocking rate is muchsmallerthan the relative increasein the
admissioncontrol power. The call blocking probability for CAC-MPC and CAC-UC is seen
almostidentical in Fig. 3 (d).
Fig. 4 shows the probability of occurrenceof successive frame errorsdenotedby the burst
size parameter. We find that both the load control schemeskeep the burst size low with the
CAC-UC schemeperformingslightly betterthanthe CAC-MPC scheme.As expected,the basic
CAC schemedoesnot performaswell, showing higherburst losses.
2) SystemDynamics: In orderto understandandcomparethe temporalbehavior of the three
schemes,we usea snapshotof the simulationbetween7500secondsand8000seconds.Figs.5
(a) and(b) depictthe variationwith time of offeredcell load, the power thresholdfor admission
December18, 2003 DRAFT

22
1 1.5 2 2.5 3 3.5 4 4.5 5 5.5 60
0.005
0.01
0.015
0.02
0.025
0.03
0.035
0.04
Pro
babi
lity
Burst size
CAC CAC−MPCCAC−UC
Fig. 4. Probabilityvs Burst Size,offered load = 0.85, for CAC, CAC-MPC andCAC-UC
control, andpacket loss rateat two valuesof averageofferedcell load, 0.8 and0.9.
As before,maximum-power-basedload control resultsin a lower (moreconservative) power
threshold;consequently, the thresholdneedsto be adjustedless often and less drastically as
comparedto usage-basedload control. At the higher offered load, both load control schemes
apply a lower power threshold,while CAC-UC alsoadjuststhe thresholdmore frequentlythan
CAC-MPC. Both the load control schemes,effectively control the packet loss rate keepingit
stableandcloseto the target. Figs. 5 (a) and(b) alsoshow that CAC-UC andCAC-MPC have
similar behavior of packet lossvariationwith time.
Theinstantaneousframeerror rate,which directly impactsvoicequality, is shown in Fig. 6 (a)
and(b), again in the time-window between7500and8000seconds.Similar to the instantaneous
loss rate, the frame error rate is well-controlledunderboth load control schemes.At light to
mediumloads,the frameerror rate is reducedfasterby usage-basedcontrol thanby maximum-
power-basedcontrol,but the formerschemealsoresultsin largerandmorefrequentoscillations.
The frame error rate variation is smaller at higher loads, since the admissioncontrol power
thresholdis better-controlled.
3) Sensitivityto Target LossRate, Control Interval, and Load AdaptationSpeed:We study
the systemperformanceat threedifferent valuesof the target loss rate: 0.008,0.01, and 0.03.
Fig. 7(a)shows thattheproposedloadcontrolschemescaneffectively guaranteea rangeof voice
December18, 2003 DRAFT

23
7500 7550 7600 7650 7700 7750 7800 7850 7900 7950 80000.75
0.8
0.85
Offe
red
load
Time (s) (a.1)
7500 7550 7600 7650 7700 7750 7800 7850 7900 7950 80000
0.5
1
Adm
issi
on p
ower
Time (s) (a.2)
CAC CAC−MPCCAC−UC
7500 7550 7600 7650 7700 7750 7800 7850 7900 7950 80000
0.02
0.04
Pac
ket l
oss
Time (s) (a.3)
CAC CAC−MPCCAC−UC
7500 7550 7600 7650 7700 7750 7800 7850 7900 7950 80000.8
0.85
0.9
0.95
1
Offe
red
load
Time (s) (b.1)
7500 7550 7600 7650 7700 7750 7800 7850 7900 7950 80000
0.5
1
Adm
issi
on p
ower
Time (s) (b.2)
CAC CAC−MPCCAC−UC
7500 7550 7600 7650 7700 7750 7800 7850 7900 7950 80000
0.05
0.1
Pac
ket l
oss
Time (s) (b.3)
CAC CAC−MPCCAC−UC
Fig. 5. Time variationof offeredload,power thresholdandpacket lossratefor CAC, CAC-MPC andCAC-UC: (a) at offered
load 0.8; (b) at offered load 0.9
frameerror rates(andsimilar IP packet loss rates).Fig. 7 (b) shows that blocking increasesas
the target loss rate is lowered(therebyincreasingvoice quality). As before,CAC-UC allows a
higherpower thresholdfor admissioncontrol thanCAC-MPC,andcorrespondinglyhasa slightly
lower call blocking rate.
In order to study the impact of the control interval at which packet loss is estimatedand
power thresholdsare computedby the ANC, we perform simulationsfor three valuesof the
control interval: onesecond,five secondsand 10 seconds.Fig. 8 (a) shows that more frequent
December18, 2003 DRAFT

24
3.75 3.8 3.85 3.9 3.95 4
x 105
0
0.01
0.02
0.03
0.04
0.05
0.06
FE
R (
load
0.8
)Frame number (a)
CAC CAC−MPCCAC−UC
3.75 3.8 3.85 3.9 3.95 4
x 105
0
0.02
0.04
0.06
0.08
FE
R (
load
0.9
)
Frame number (b)
CAC CAC−MPCCAC−UC
Fig. 6. Time variationof the received voice frameerror rate: (a) at offered load 0.8; (b) at offered load 0.9.
0.7 0.75 0.8 0.85 0.9 0.950
0.005
0.01
0.015
0.02
0.025
0.03
0.035
Avg F
ER
Offered load (d)
L*: 0.008 (MPC)L*: 0.01 (MPC) L*: 0.03 (MPC) L*: 0.008 (UC) L*: 0.01 (UC) L*: 0.03 (UC)
0.7 0.75 0.8 0.85 0.9 0.950
0.05
0.1
0.15
Call b
lockin
g rate
Offered load (d)
L*: 0.008 (MPC)L*: 0.01 (MPC) L*: 0.03 (MPC) L*: 0.008 (UC) L*: 0.01 (UC) L*: 0.03 (UC)
Fig. 7. Performancemetricsof CAC, CAC-MPC, and CAC-UC as a function of offered load at target loss rate 0.008,0.01,
and0.03: (a) averageframeerror rate; (b) averagecall blocking rate.
0.7 0.75 0.8 0.85 0.9 0.950
0.002
0.004
0.006
0.008
0.01
Avg F
ER
Offered load (a)
p: 1s (MPC) p: 5s (MPC) p: 10s (MPC)p: 1s (UC) p: 5s (UC) p: 10s (UC)
0.7 0.75 0.8 0.85 0.9 0.950
0.05
0.1
0.15
Call b
lockin
g rate
Offered load (b)
p: 1s (MPC) p: 5s (MPC) p: 10s (MPC)p: 1s (UC) p: 5s (UC) p: 10s (UC)
Fig. 8. Performancemetricsof CAC, CAC-MPC,andCAC-UC asa function of offeredload with control interval 1s, 5s,and
10s: (a) averageframeerror rate; (b) averagecall blocking rate.
December18, 2003 DRAFT
25
0.7 0.75 0.8 0.85 0.9 0.950
0.005
0.01
0.015Av
g pac
ket lo
ss
Offered load (a)
scale: 0.005 (MPC)scale: 0.01 (MPC) scale: 0.05 (MPC) scale: 0.005 (UC) scale: 0.01 (UC) scale: 0.05 (UC)
0.7 0.75 0.8 0.85 0.9 0.950
0.05
0.1
0.15
Call b
lockin
g rate
Offered load (b)
scale: 0.005 (MPC)scale: 0.01 (MPC) scale: 0.05 (MPC) scale: 0.005 (UC) scale: 0.01 (UC) scale: 0.05 (UC)
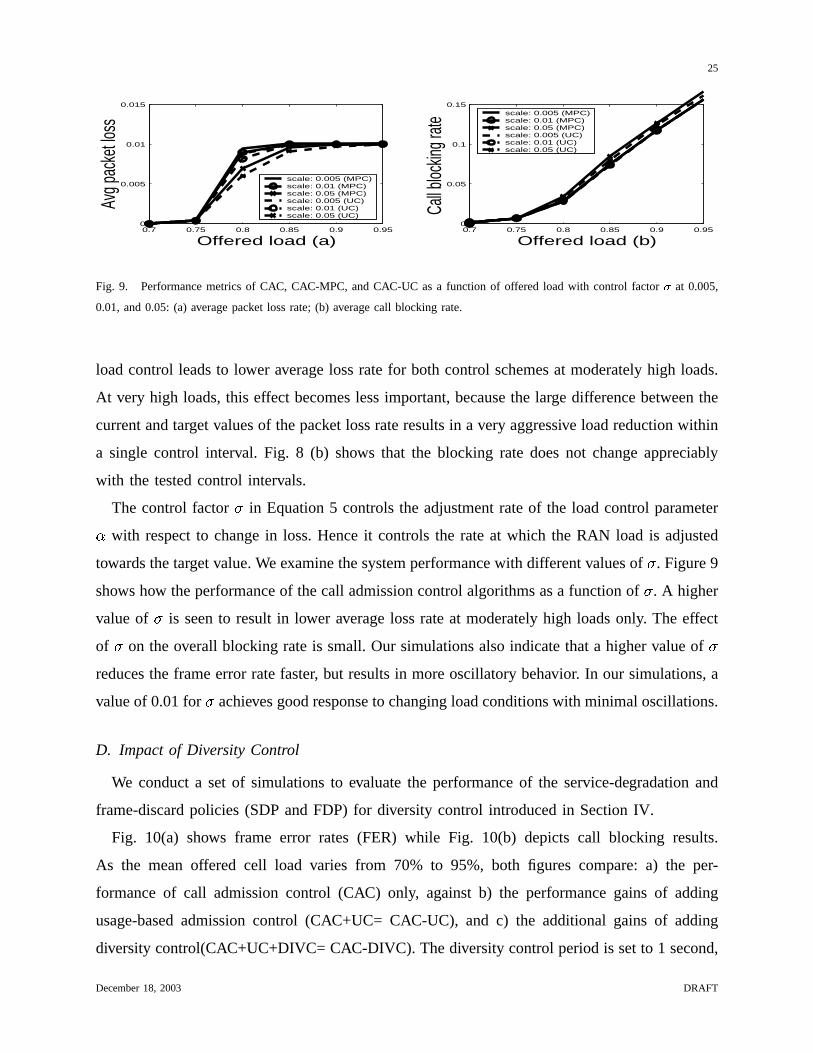
Fig. 9. Performancemetricsof CAC, CAC-MPC, andCAC-UC as a function of offered load with control factor � at 0.005,
0.01,and0.05: (a) averagepacket loss rate; (b) averagecall blocking rate.
load control leadsto lower averagelossratefor both control schemesat moderatelyhigh loads.
At very high loads,this effect becomeslessimportant,becausethe large differencebetweenthe
currentandtargetvaluesof thepacket lossrateresultsin a very aggressive loadreductionwithin
a single control interval. Fig. 8 (b) shows that the blocking rate doesnot changeappreciably
with the testedcontrol intervals.
The control factor � in Equation5 controlsthe adjustmentrateof the load control parameter~ with respectto changein loss.Henceit controlsthe rateat which the RAN load is adjusted
towardsthetargetvalue.We examinethesystemperformancewith differentvaluesof � . Figure9
shows how theperformanceof thecall admissioncontrolalgorithmsasa functionof � . A higher
valueof � is seento result in lower averagelossrateat moderatelyhigh loadsonly. The effect
of � on the overall blocking rateis small.Our simulationsalsoindicatethat a highervalueof �reducesthe frameerror ratefaster, but resultsin moreoscillatorybehavior. In our simulations,a
valueof 0.01for � achievesgoodresponseto changingloadconditionswith minimaloscillations.
D. Impactof Diversity Control
We conducta set of simulationsto evaluatethe performanceof the service-degradationand
frame-discardpolicies (SDPandFDP) for diversity control introducedin SectionIV.
Fig. 10(a) shows frame error rates (FER) while Fig. 10(b) depicts call blocking results.
As the mean offered cell load varies from 70% to 95%, both figures compare:a) the per-
formanceof call admissioncontrol (CAC) only, against b) the performancegains of adding
usage-basedadmissioncontrol (CAC+UC= CAC-UC), and c) the additional gains of adding
diversitycontrol(CAC+UC+DIVC= CAC-DIVC). Thediversitycontrolperiodis setto 1 second,
December18, 2003 DRAFT

26
0.7 0.75 0.8 0.85 0.9 0.950
0.02
0.04
0.06
0.08Av
g FER
Offered load (a)
CAC CAC−UC CAC−DIVC
0.7 0.75 0.8 0.85 0.9 0.950
0.05
0.1
0.15
0.2
Call b
lockin
g rate
Offered load (b)
CAC CAC−UC CAC−DIVC
Fig. 10. Performanceof CAC and the incrementalgains of diversity and load control with respectto: a) meanuserFER; b)
call blocking rate.
aspreliminarysensitivity studiessuggestthis to beareasonablebalancebetweencontroloverhead
andreactivity. Theadmissioncontrolperiodis setto 5 seconds,asdonein all previousadmission
control experiments.The drop probability is computedby Equation9.
TheDIVC curvesshown arefor theframe-discardpolicy, FDP, asperformancefor theservice-
degradationpolicy, SDP, is virtually indistinguishablefrom FDP. Interestingly, we observe that
althoughboth policiesdiffer on how they discardframesfor certainmobile users,the diversity
selectioneffect at theANC masksthesedifferences,resultingin anuplink traffic streamwith the
sameFERin bothcases.This suggeststhatbothstreamsperformcomparablywell in discarding
the legs of leastquality.
Fig. 10(b)shows thatthediversityandcall admissioncontrolsexhibit comparablecall blocking
rateat all loads(note that the CAC-DIVC andCAC curves arealmostidentical).This demon-
stratesthat the enhancedadmissioncontrol is rarely triggered,if at all, so any call blocking
observed is dueto thebasicCAC schemeandnot dueto IP RAN capacityconstraints.Diversity
control operatesat the relatively low call blocking ratesof CAC while maintainingthe FER
at or below the target level of 1%. Thus, diversity control delivers both low blocking and the
desirableFER resultingin a gracefuladaptationto congestion.
Intuitively, by discardingframesat the cells that would have likely beenredundantin the
diversity selectionprocessat the ANC, the packet loss rate in the RAN is reduced.This keeps
the FER below the trigger point where load control would have beenneededto increasecall
blocking in order to reducepacket loss.For instance,at a load of 95%, usingload control only
to reducecongestionrequiresabouta 6% increasein the call blocking rate to maintaina target
December18, 2003 DRAFT

27
FER below 1%. CAC, on the other hand,operatesat low blocking ratesbut doesnot react to
any fluctuationsin RAN congestionstateresultingin large increasesin FER aslossin the RAN
increasesat higherloads.This illustratesanimportantpoint: providedthatsoft-handoff legshave
a high probability of beingredundantmostof the time, diversity control resultsin a win-win by
reducingloss in the RAN andalsomaintaininglow call blocking rates.
Recall that the aggressivenesswith which diversity control reactsto changesin measured
rate loss is controlled by the adaptationspeedparameter� . We observe that a value of 0.10
for � , usedfor the simulationresultsshown in Fig. 10, provides a good balancebetweenfast
responsivenessandmeandropprobability. Thoughthevariancewasreasonable,efforts to further
reduceit by lowering the value of � would make the control’s responsesluggish,causingthe
load control to be triggeredandsubsequentlyincreasethe call blocking rate.For instance,at a
load of 95%, valuesof 0.05 and 0.01 for � yielded call blocking ratesof 11.7% and 13.2%,
respectively (contrastingwith the9.5%observedfor � I ��® ��� ). This clearly illustratesthatwhile
the joint operationof diversity and load control is effective at maintainingthe target FER, the
trigger point for load control dependson the aggressivenesswith which the diversity control is
tunedto reactto congestionepisodes.
It is desirableto use a fast-actingdiversity control whenever possiblein order to avoid or
minimize the increasein call blocking ratesthat will ensuewhen the load control is triggered.
However, regardlessof how aggressive the diversity control policy is, its capabilitiesarelimited
by theaverageamountof redundantdataavailablefor discardat thecells.Whentheaverageload
increasesbeyond the limits of whatdiversitycontrolcanmanage,loadcontrol shouldbeapplied
to increasecall blocking ratesin order to ensureacceptablequality levels are maintained.The
applicationof both load and diversity controls, in fact, achieves the joint goal of maximizing
network call capacitywhile minimizing voicequality degradationsduringcongestionepisodesin
the IP RAN. Note that the benefitsof a joint diversity- andload-controlledRAN arenot visible
in Fig. 10 becausethe offered load rangedepictedis well within the limits of what diversity
control canindependentlymanage.Simulationexperimentswith bothcontrolsoperative confirm
that diversity control hasa dominanteffect in this load range.
In conclusion,since diversity control exploits traffic redundancy, it can be a very effective
congestioncontrol techniqueby adaptingto congestionwithout either increasingthe frame
error rate or blocking. However, its performancedependscrucially on the averageamountof
December18, 2003 DRAFT

28
redundancy per user(i.e., numberof SHO legs) as well as on the ability to selectlow-quality
legs to be discarded.
E. Impactof RouterControl Using AQM
We now studythe impactof routercontrolusingactive queuemanagement(AQM) by turning
AQM on and off in the router. The AQM policy used in thesesimulationsis describedin
SectionV.
We first considerthe scenariowherea router guaranteesthat packets do not experienceany
delay more than a pre-specifieddelay threshold.The router queueis set to a maximumlength
suchthat the queuingdelay never exceedsthe delay threshold.Any packets arriving when the
queueis full are droppedin a drop tail manner. If this delay thresholdis set to the time by
which the packets are expectedto arrive at the ANC then all packets arrive in time at the
ANC. We find that turning on AQM in this scenariodoesnot help improve the CDMA network
performance.In fact,both the blocking rateandaverageframeerror rateareslightly worsethan
the scenariowhenAQM is turnedoff. Thereare two reasonsfor this behavior. First, the router
is able to boundthe delaysof packets within the requiredthreshold.An attemptto reducethe
delaycausesunnecessaryloss.Proactively droppingpacketsdoesnot speedup the load control
becauseloadcontroloperatesat muchlargertime scales(5 seconds).Second,in our experiments,
the probability of multiple framesassociatedwith different legs of a soft-handoff beinggoodis
low. This implies that randompacket droppingdoesnot necessarilyensurethat a goodframeis
received at the ANC. Hence,thereis no drasticimprovementin the frameerror rate.
When the router is not able to provide the requireddelayguarantee(for example,to accom-
modatedata bursts), we find that turning on AQM helps improve performanceconsiderably,
especiallywhen no additionalcontrolssuchas load control or diversity control are appliedat
the ANC. We conductan experimentin which the requireddelaythresholdat the ANC is 20ms
but the routerqueuesup packetswith a maximumdelayof 30msandusesSREDas the AQM
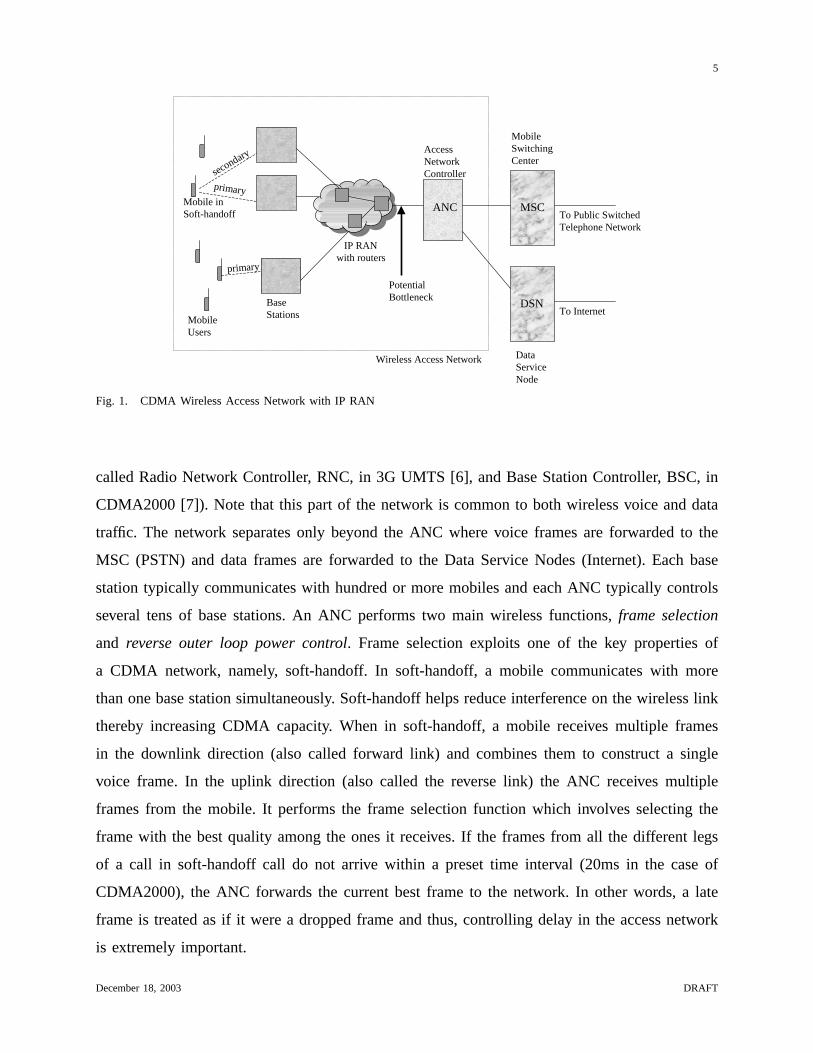
policy. Fig. 11 (a) shows the frame error rate as a function of frame number. Here, only the
basicCAC schemeis being used.The averagecell load offered to the IP RAN is 85% of the
maximumcell load.This is muchmorethanthe load (70%) that the line capacityis provisioned
to handle.We seethat without AQM, the frame error rate is very high and closeto 100% but
with AQM, theframeerror rateis broughtdown to lessthan10%.This is becausethebottleneck
December18, 2003 DRAFT

29
3.75 3.8 3.85 3.9 3.95 4
x 105
0
0.2
0.4
0.6
0.8
1
FE
R (
CA
C)
Frame number (a)
without AQMwith AQM
3.75 3.8 3.85 3.9 3.95 4
x 105
0
0.2
0.4
0.6
0.8
1F
ER
(C
AC
−M
PC
)
Frame number (b)
without AQMwith AQM
Fig. 11. FER vs FrameNumber, OfferedLoad = 85%, Maximum RouterQueuingDelay = 30ms(a) CAC (b) CAC-MPC
queuebecomesfull very fastandpacketsdo not getprocessedfastenough.Every packet arriving
after the queueis full or nearly full suffers a delay greaterthan 20msand arrives at ANC too
late. We also find that the averageframe error rate over the entire simulation time is reduced
from 98% to 4%, whenusingAQM with the basicCAC scheme.
Fig. 11 (b) shows the frameerror rateasa function of framenumberwhenmaximumpower-
basedload control is usedwith AQM turned on and AQM turned off. We find that without
AQM, high delaysin routerqueuedueto drop tail packet droppingcauselarge spikes in frame
error rate.The magnitudeof thesespikes is broughtdown when AQM is applied.We observe
that thespikesareseveralhundredframeswide. This is becauseour loadcontrol policy controls
admissionof new calls only anddoesnot drop existing calls. The existing calls could continue
to contribute to the congestionfor several seconds.In our experimentsusing AQM and CAC-
MPC, we also find that the call blocking rate is broughtdown from 15.7% to 13.4% and the
averageframeerror rateduring the entiredurationof the simulationis reducedfrom about2%
to 1%. As expected,our experimentswith other maximumqueuingdelay valuesshow that as
the maximumrouterqueuingdelayvalueis increased(i.e., the drop tail buffer sizeis increased)
the improvementdue to AQM becomeseven higher.
In summary, router control using an AQM policy that ensuressmallerdelayswill result in
betterCDMA network performance.
December18, 2003 DRAFT

30
100 120 140 160 180 2002
2.5
3
3.5
4
4.5
5
5.5
OC3 n
eede
d
Number of cells
OC−3 peak provision OC−3 with load control
2 3 4 50
100
200
300
400
Cells
supp
orted
Number of OC3
OC−3 peak provision OC−3 with load control
Fig. 12. Performanceof CAC and the incrementalgains of diversity and load control with respectto: a) meanuserFER; b)
call blocking rate
VII . IMPACT ON NETWORK PROVISIONING
Voice transmissionsgenerallyhave high quality requirementsandpeakprovisioning could be
usedfor supportingvoice calls in the IP radio accessnetwork. However, the dynamicvariations
in call traffic patternsmayresultin under-utilization of a peakprovisionedIP RAN. Additionally,
the rapid growth of wirelesstraffic and the evolution of radio technologymay quickly render
the resourcesin an existing peak-provisionedIP RAN in-sufficient.
In previous sections,we have shown that our proposedcongestioncontrol algorithmscould
effectively control the network load and maintain the expectedvoice quality under various
network conditions.In this section,we study the effect of efficient load control on network
provisioning. We considercells that have threesectors,and eachsectorhasthreecarriers.The
air interface parametersare the sameas in SectionVI, and the plannedair interface load to
supportis alsosetat 0.7.We first vary thenumberof cellsconnectingto oneANC andcompare
thenumberof OC-35 links neededto supporttherequiredvoicequality. Next we vary thenumber
of OC-3 links in the IP RAN, andcomparethe numberof cells that canbe supported.
Fig. 12 (a) depictsrespectively the numberof OC-3 links neededto supportthe traffic from
variousnumberof cells to theANC usingpeakprovisioningandefficient provisioningenhanced
with our load control algorithms.With the sametarget voice quality, the provisioning with our
algorithmsis seento requireup to 20% lessOC-3 links. This reducesthe IP RAN bandwidth
costsignificantly.
5OC-3 standsfor Optical CarrierLevel 3 andcorrespondsto 155.52Mb/sec[20].
December18, 2003 DRAFT

31
With an IP RAN provisionedin advance,Fig. 12 (b) shows the numberof cells that can be
supportedwith andwithout loadcontrolalgorithmsenabled.With loadcontrol,about30%more
cells can be supportedby an existing IP RAN provisioning. In other word, if the numberof
cells connectingto an ANC is fixed,up to 30% moretraffic is allowed for eachcell without the
needto upgradethe IP RAN.
VII I . FUTURE DIRECTIONS
In this sectionwe presentanddiscusssomefuture directionsfor enhancingour research.
A. CongestionControl for Data
Oneinterestingdifferencebetweenvoiceanddatawith respectto the frameselectionfunction
of the ANC is that while the bestvoice frame is always forwarded,the bestdataframe is only
forwardedif the cyclic redundancy check(CRC) is successful.Thus,one can further improve
diversity control techniquesby dropping data frames that fail the CRC at the basestation.
Currently, we arestudyingthe impactof thesetechniquesfor IP RAN congestioncontrol in the
presenceof wirelessdatatraffic.
B. Congestionin the Downlink Direction
The focus of this paperhas beencongestionin the uplink direction. While call admission
controlandroutercontroltechniquesareapplicableequallyin bothdirections,theuseof diversity
control in the downlink direction is not asstraightforward. This is because,in CDMA systems,
while frameselectionfrom different legs is performedin the uplink direction,framecombining
(using maximal rate combining) is performedin the downlink direction at the mobile device.
This requiresthat all basestationstransmit the sameframe at the sametime in the downlink
direction.Thus,droppingof framesfrom selectedlegsduringsoft-handoff usingdiversitycontrol
could result in higher error ratesfor a given mobile device but this also reducesthe overall
interferencelevel on the wirelessdownlink andcould result in betterreceptionfor othermobile
devices.A detailedstudyof diversitycontrol in thedownlink directionis necessaryto determine
its efficacy. It is importantto notethat in thedownlink directionIP multicast(e.g.sourcespecific
multicast [21]) could be usedto transmit the framesfrom the ANC to multiple basestations,
therebyreducingthe usageof the link connectingthe ANC and the router.
December18, 2003 DRAFT

32
C. WirelessRAN
So far, we have assumedthat the radio accessnetwork is comprisedof wired links with fixed
capacities.However, it might be advantageousin certainlocationsto connectbasestationsto a
network controllerthroughfixedwirelessbackhaullinks (possibly, multihopfor rangeextension).
Theemerging IEEE 802.16standard[22] with rangeup to 30 milesis onesuitablewirelessRAN
technology. In this case,capacityof the RAN is no longer fixed and congestionin the RAN
could also be causedby variationsin the wirelesslink capacitypotentially due to interference
or atmosphericeffects.An adaptive solution,asproposedin this paper, is essentialin combating
thesedynamiccongestioneventsin the wirelessbackhaul.
IX. CONCLUSIONS
In this paper, westudiedtheproblemof congestioncontrol in theIP RAN of aCDMA wireless
accessnetwork andexaminedthreecontroltechniquescalledadmissioncontrol,diversitycontrol,
androutercontrol.
In the caseof call admissioncontrol, we presentedtwo enhancedadmissioncontrol mecha-
nisms.Theseschemesmake useof a variablepower-basedadmissioncontrol thresholdat the
air interfaceto regulateload enteringthe RAN. Simulationsshow that both algorithmsareable
to control packet loss rateandframeerror rate in the RAN at a desiredlevel. The usage-based
control schemeachieves a higher power-thresholdand henceslightly lower call-blocking than
the maximum-power-basedscheme,but the latter schemeresultsin a smoother, lessoscillatory
control. Both algorithmswere also shown to be robust to the control parameters.In the case
of diversity control, we proposedtwo novel policies called ServiceDegradationPolicy (SDP)
and FrameDiscardPolicy (FDP) for gracefully adaptingto congestion.The resultswere very
promising.Both policieswereshown to be ableto adaptto significantcongestionwithout either
increasingthe frameerror rateor blocking. In the caseof routercontrol,we evaluatedan active
queuemanagementpolicy calledSREDandfound that routercontrol that ensureslow delaysis
essentialfor achieving low frameerror rateduring congestion.
In the future, issuesrelated to data traffic, downlink congestion,and wireless RANs as
discussedin SectionVIII, needcarefulexamination.
December18, 2003 DRAFT
33
ACKNOWLEDGMENT
The authorsthank Tom LaPorta,Srinivas Kadaba,GaneshSundaramfor useful discussions
on the topic.
REFERENCES
[1] T. Bu, M.C. Chan, and R. Ramjee, “Connectivity, performance,and resiliency of ip-basedcdma radio access,” in
Proceedingsof IEEE Infocom(to appear), 2004.
[2] Kevin Maney, “Future not so bright for telecoms,” in USAToday, July 2002.
[3] Anup KumarTalukdar, B. R. Badrinath,andA. Acharya,“Mrsvp: A resourcereservationprotocolfor anintegratedservices
network with mobile hosts,” WirelessNetworks, vol. 7, no. 1, 2001.
[4] G. Heijenk, G. Karagiannis,V. Rexhepi, and L. Westberg, “Dif fserv resourcemanagementin ip-basedradio access
networks,” in Proceedingsof WPMC, Aalborg, Denmark,September2001.
[5] B. Bradenetal, “Recommendationsonqueuemanagementandcongestionavoidancein theinternet,” Requestfor Comments
2309,Network Working Group,April 1998.
[6] 3G PartnershipProject, “Release99,” .
[7] TIA/EIA/cdma2000, Mobile Station - BaseStationCompatibility Standard for Dual-Mode WidebandSpread Spectrum
Cellular Systems”, Washington:TelecommunicationIndustryAssociation,1999.
[8] V. Garg, WirelessNetworkEvolution2G to 3G, Prentice-Hall,2001.
[9] R. Vaccaro,Digital control, a statespaceapproach, McGraw Hill, 1998.
[10] S. Floyd and V. Jacobson,“Random early detectiongateways for congestionavoidance,” IEEE/ACM Transactionson
Networking, vol. 1, no. 4, pp. 397–413,August1993.
[11] S. Kasera,J. Pinheiro,C. Loader, M. Karaul, A. Hari, and T. LaPorta, “Fast and robust signalingoverloadcontrol,” in
Proceedingsof ICNP, Riverside,CA, November2001.
[12] B. Hajek, “External splitting of point processes,” Mathematicsof OperationsResearch, vol. 10, pp. 543–556,1985.
[13] Y.-B. Lin and V.W. Mak, “Eliminating the boundaryeffect of a large-scalepersonalcommunicationservicenetwork
simulation,” ACM Transactionson Modelingand ComputerSimulation, vol. 1, no. 2, pp. 165–190,1994.
[14] J.K. Kwon and D.K. Sung, “Soft handoff modelingin cdmacellular systems,” in Proceedingsof Vehicular Technology
Conference, May 1997.
[15] D.K. Kim and D.K. Sung, “Characterizationof soft handoff in cdmasystems,” in Proceedingsof Vehicular Technology
Conference, June1999.
[16] Y.-B. Lin and W. Chen, “Impact of busy lines and mobility on cell blocking in pcs networks,” International Journal of
CommunicationSystems, , no. 9, pp. 35–45,1996.
[17] M. Wallace and R. Walton, “Cdma radio network planning,” in Third Annual International Conferenceon Universal
PersonalCommunications, Sept.1994.
[18] S. Hong and I-T Lu, “Soft handoff parameteroptimization in various propagation environments,” in Proceedingsof
Vehicular Technology Conference, 2001.
[19] Qualcomm,TheCDMA networkengineeringhandbook, Qualcomm,1993.
[20] C. Partridge, Gigabit Networking, Addison-Wesley, 1994.
[21] H. Holbrook andB. Cain, “Source-specificmulticast,” InernetDraft draft-ietf-ssm-arch-04.txt,Oct. 2003.
December18, 2003 DRAFT

34
[22] IEEE 802.16-2001,IEEE Standard for Local andMetropolitanAreaNetworks- Part 16: Air Interfacefor FixedBroadband
WirelessAccessSystems, Apr. 2001.
December18, 2003 DRAFT