CONFIDENTIAL WHOLESALE BANKING & MARKETS DUTCH ACT CONFERENCE THE ECONOMIC OUTLOOK FOR CORPORATES...
34
CONFIDENTIAL WHOLESALE BANKING & MARKETS DUTCH ACT CONFERENCE THE ECONOMIC OUTLOOK FOR CORPORATES PRESENTED BY PROFESSOR* TREVOR WILLIAMS CHIEF ECONOMIST LLOYDS BANK 9 NOVEMBER 2012 * Visiting professor of the University of Derby
-
Upload
adela-burns -
Category
Documents
-
view
214 -
download
0
Transcript of CONFIDENTIAL WHOLESALE BANKING & MARKETS DUTCH ACT CONFERENCE THE ECONOMIC OUTLOOK FOR CORPORATES...

CONFIDENTIAL WHOLESALE BANKING & MARKETS
DUTCH ACT CONFERENCETHE ECONOMIC OUTLOOK FOR CORPORATES
PRESENTED BY
PROFESSOR* TREVOR WILLIAMS
CHIEF ECONOMISTLLOYDS BANK
9 NOVEMBER 2012
* Visiting professor of the University of Derby

• European debt crisis – lingering effect of
global financial crisis
• ‘Fiscal cliff’ in the US
• Higher food and commodity price inflation
• Financial market shock that hits confidence
• Harder landing in China?
• Growth shift from developed to developing
countries
• Growth of developing Asia
• Ageing populations
• Growing income/wealth inequality
• Heightened geopolitical tensions?
FIVE KEY SHORT-TERM RISKS FIVE LONGER-TERM ISSUES
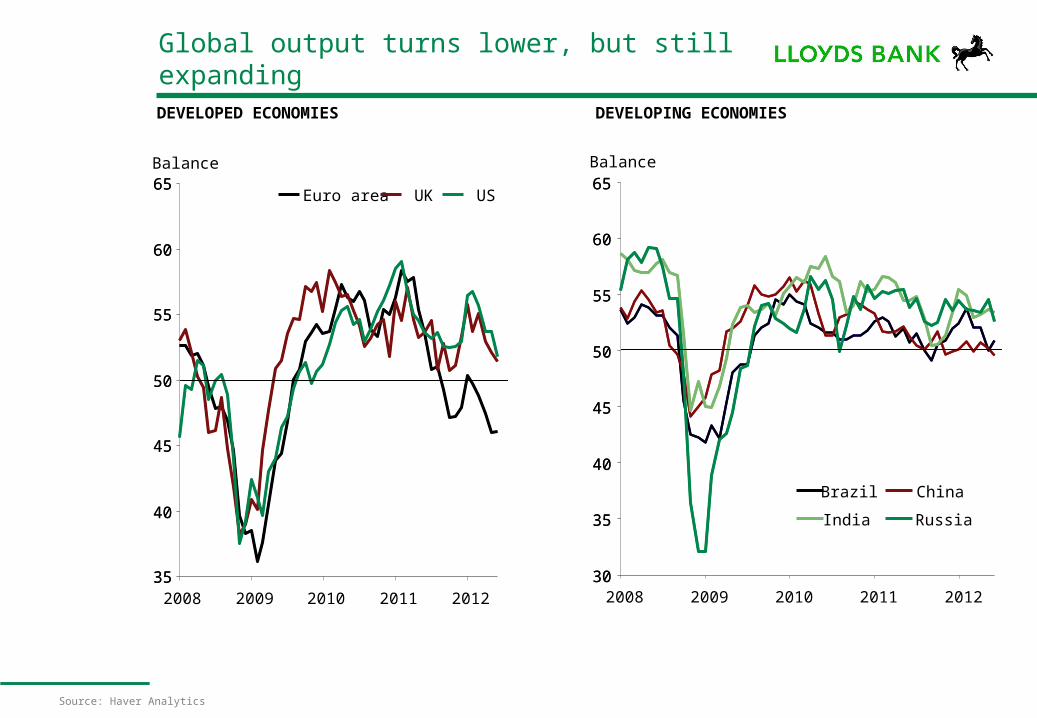
Global output turns lower, but still expanding
Source: Haver Analytics
35
40
45
50
55
60
65
35
40
45
50
55
60
65
2008 2009 2010 2011 2012
Euro area UK US
Balance
30
35
40
45
50
55
60
65
2008 2009 2010 2011 201230
35
40
45
50
55
60
65
Brazil China
India Russia
Balance
DEVELOPED ECONOMIES DEVELOPING ECONOMIES

● Eurozone financial crisis:
► Severe fiscal austerity across the Eurozone
► World trade effects
► Deepening credit crunch, spreading to other regions
► Global confidence effects
● But also significant policy tightening elsewhere:
► Spending cuts in the US
► Monetary policy tightening in emerging markets now reversing as growth slows
● High oil and commodity prices
● US growth stuck between 1-1 ¾% since Q4 2011
● China and India and other emerging slowed more than expected
4
Why has growth been poor?

On the surface, conditions have improved - global equity markets off lows of the yearU.S., EURO AREA AND EMERGING MARKETS EQUITIES
5Source: MSCI, Datastream, IIF calculations
90
95
100
110
115
Jan Feb Mar Apr May Jun Jul Aug Sep
US
Euro area
Emerging markets
105
MSCI index, rebased 12/31/2011 = 100

Corporate bond issuance on the upGLOBAL CORPORATE BOND ISSUANCE IN AUGUST*
6Source: Dealogic *includes IG, HY, MTNs, preferred shares, covered bonds and securitisation
120
1995
Number of issues (RHS)
100
USD billion
340
360
1800
2011
Total deal value
80
60
40
20
300
320
260
280
200
240
200
Number of issues
2009200720052003200119991997

Commodity prices also risingAGRICULTURAL COMMODITIES SPOT PRICES
7Source: Lloyds Bank WBM
70
210
Jan 2010
Agriculture
Corn
Sep 2012
190
Jan 2012May 2011Sep 2010
index, rebased, 1/1/2010 = 100
Livestock
Wheat
Soybeans
170
150
130
110
90

GDP GROWTH, % INCREASE ON YEAR
2010 2011 2012 2013 2014
US 3.0 1.7 2.2 2.5 3.0
JAPAN 4.5 -0.7 1.8 2.4 2.0
CHINA 10.4 9.2 8.0 8.9 8.9
EURO ZONE 1.9 1.5 -0.6 -0.2 1.0
UK 2.1 0.7 0.0 1.0 2.0
WORLD 3.9 2.8 2.4 3.0 3.6
Global growth will eventually recover…
8Source: Lloyds Bank WBM

…but this is underpinned by unprecedented monetary expansion…
9Source: Lloyds Bank WBM
0
2
4
6
8
10
12
14
16
1990 1992 1994 1996 1998 2000 2002 2004 2006 2008 2010 2012
UK
US
Euro areaJapan
%

…with central bank balance sheets likely to expand further
10Source: Oxford Economics/Haver Analytics
0
50
100
150
200
250
300
350
400
450
500
Jan 2007 Jan 2008 Jan 2009 Jan 2010 Jan 2011 Jan 2012
US Fed
ECB
Bank of England
Bank of Japan
Index, Jan 2007=100

FOCUS ON THE EUROZONE
11

• Fear of a breakup
− Potentially toxic as it paralyses financial and physical investment
− ECB action targeted to address this risk.
− Imminent breakup now seen less likely (Dutch elections have gone way pro EU parties, Germany signed for the EMS, Spain and Portugal 1 more year to pay debt and Greece may be given 2 more years)
• Too tight fiscal policy
− Has austerity has become part of the problem instead of the solution?
− Where has the Growth Pact gone?
• Social cost of reforms
− Correcting competitiveness and current account imbalances comes at a cost of (very) high unemployment for a (very) long time
• Slow pace of politics
Breakup looked imminent…
12
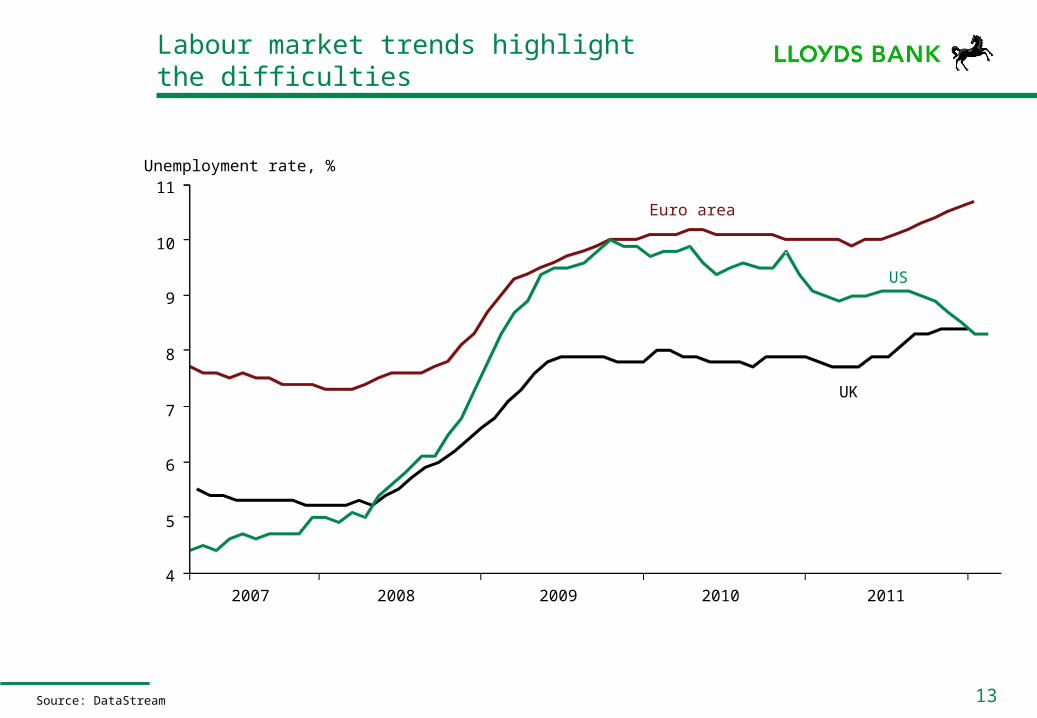
Labour market trends highlight the difficulties
13Source: DataStream
Unemployment rate, %
2007 2008 2009 2010 20114
5
6
7
8
9
10
11
Euro area
UK
US

…and had already started in banking…
14
TYPICAL INTEREST RATES ON LOANS TO BUSINESSES
Source: ECB
2
3
4
5
6
7
8
Jan 05 Jan 06 Jan 07 Jan 08 Jan 09 Jan 10 Jan 11 Jan 12
%
Germany
Spain

… which prompted a very strong ECB pledge to intervene
15
SOVEREIGN BOND SPREADS
Source: Oxford Economics\Haver Analytics
2.0
2.5
3.0
3.5
4.0
4.5
5.0
5.5
6.0
6.5
1 Sep 2011 24 Nov 11 16 Feb 12 10 May 12 2 Aug 12
% spread over German bunds
Italy
Spain
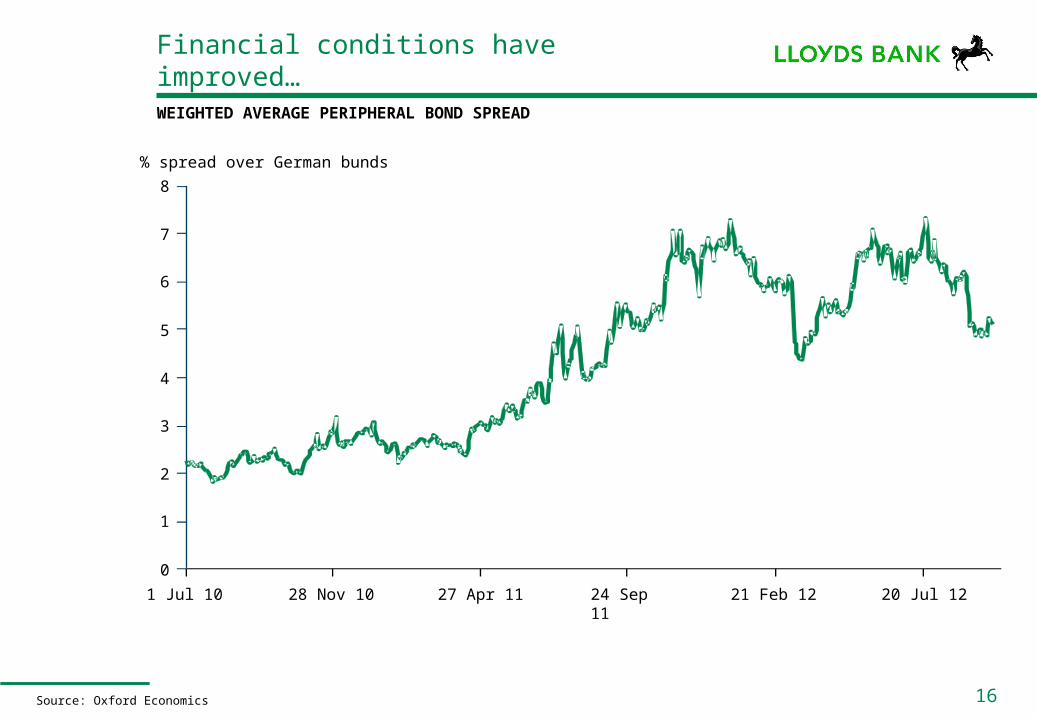
Financial conditions have improved…
16
WEIGHTED AVERAGE PERIPHERAL BOND SPREAD
Source: Oxford Economics
0
1
2
3
4
5
6
7
8
1 Jul 10 28 Nov 10 27 Apr 11 24 Sep 11
21 Feb 12 20 Jul 12
% spread over German bunds

• Economic cost of collapse would be enormous
− Future direction of European Union would also be challenged
− Do not underestimate political investment in Eurozone
• So, our baseline forecast is that policy-makers will ultimately do whatever is needed to hold Eurozone together
− But the reform process will be erratic and slow
Will it happen?
17

Outlook remains challenging…
18
EUROZONE PMIS
Source: Markit
30
35
40
45
50
55
60
65
1998 2000 2002 2004 2006 2008 2010 2012
PMI index
Services
Manufacturing
Values above 50 indicate
expansion in activity; values
below 50 indicate contraction

…with domestic demand dragging on growth
19
EUROZONE GDP AND DOMESTIC DEMAND
Source: Oxford Economics/Haver Analytics
0
1
2
3
4
2006 2008 2010 2012 2014
GDP
Domestic demand
% year
2007 2009 2011 2013 2015
-5
-4
-3
-2
-1

Growth is struggling even in the ‘core’
Source: DataStream
-8
-6
-4
-2
0
2
4
6
2005 2006 2007 2008 2009 2010 2011 2012 2013
Germany
France
Euro area
% increase in year, economic growth
forecast

But at least inflation is low
Source: DataStream
-1
0
1
2
3
4
5
2005 2006 2007 2008 2009 2010 2011 2012 2013
% increase in year, inflation
forecast
GermanyFrance
Euro area

Growth negative for ‘peripherals’
-10
-8
-6
-4
-2
0
2
4
6
8
2005 2006 2007 2008 2009 2010 2011 2012 2013
% increase in year, economic growth
forecast
Portugal
Spain
Italy
Source: DataStream

…but there too inflation is weak
-2
0
2
4
6
2005 2006 2007 2008 2009 2010 2011 2012 2013
% increase in year, inflation
forecast
Portugal
Spain
Italy
Source: DataStream

Emerging Europe is stronger
-12
-9
-6
-3
0
3
6
9
12
15
18
2005 2006 2007 2008 2009 2010 2011 2012 2013
forecast
Poland
Hungary
Czech Republic
% increase in year, economic growth
Source: DataStream

Though inflation higher
-2
0
2
4
6
8
10
12
2005 2006 2007 2008 2009 2010 2011 2012 2013
forecast
Poland Hungary
Czech Republic
% increase in year, inflation
Source: DataStream
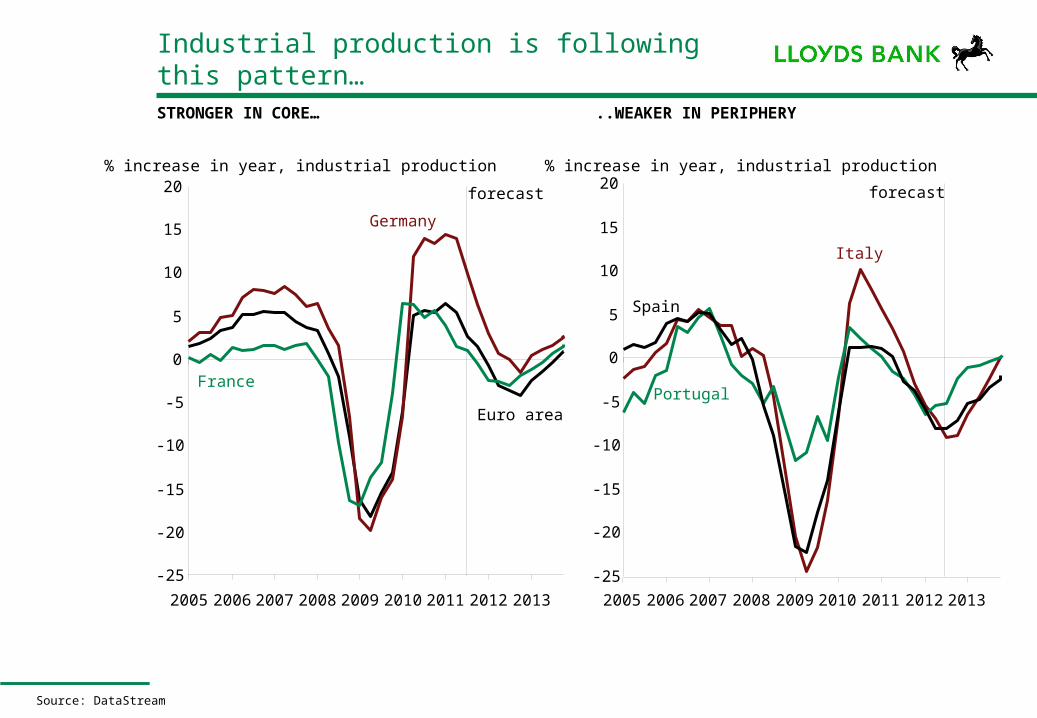
Industrial production is following this pattern…
-25
-20
-15
-10
-5
0
5
10
15
20
2005 2006 2007 2008 2009 2010 2011 2012 2013
% increase in year, industrial production
forecast
Portugal
Spain
Italy
-25
-20
-15
-10
-5
0
5
10
15
20
2005 2006 2007 2008 2009 2010 2011 2012 2013
Germany
France
Euro area
% increase in year, industrial production
forecast
Source: DataStream
STRONGER IN CORE… ..WEAKER IN PERIPHERY

…but companies are cash rich - is there a chance of an upside surprise?
Source: US Flow of Funds
9.5
10.5
11.0
13.5
14.0
2000 2001
US (RHS)
Euro Area13.0
% of total assets
2002
10.0
2003 2004 2005
12.0
12.5
11.5
2006 2007 2008 2009 2010 2011 2012
9.5
10.0
8.5
9.0
7.5
8.0
6.5
7.0
CASH HOLDINGS: EURO AREA AND US CORPORATES

• Recent policy moves from the ECB have worked to lower tensions, with financial conditions improving over the summer (although there has been a partial reversal in recent weeks).
• It seems the ECB’s actions were necessary but not sufficient to solve the problems faced by the currency block.
• The recent data indicate that the region is still in recession, with domestic demand being held back by fiscal austerity, and stubbornly high inflation, which is depressing real income.
• As a result, our forecast for the short term is broadly unchanged, with the economy expected to contract this year and next (by 0.6% and 0.2% respectively) before growing by 1.0% in 2014.
Summary of Eurozone forecast
28

UK SUMMARY OVERVIEW

30
• UK economy - showing recent signs of improvement?
• Fall in inflation - key to boosting household and corporate real incomes
• UK Bank Rate on hold - further QE in prospect
• Global economic weakness - threat to UK export rebalancing
• World economic recovery - still underway as policy stays loose
• Euro area – the single largest risk to UK economic stability
Key issues affecting the UK economy
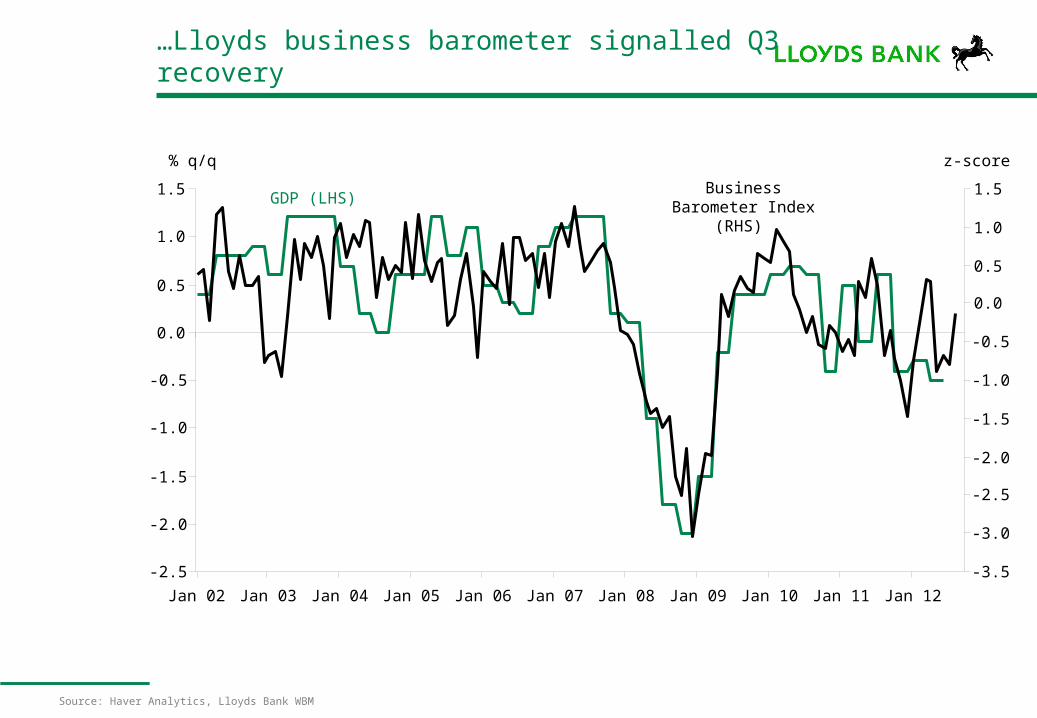
…Lloyds business barometer signalled Q3 recovery
Source: Haver Analytics, Lloyds Bank WBM
-2.5
-2.0
-1.5
-1.0
-0.5
0.0
0.5
1.0
1.5
Jan 02 Jan 03 Jan 04 Jan 05 Jan 06 Jan 07 Jan 08 Jan 09 Jan 10 Jan 11 Jan 12
-3.5
-3.0
-2.5
-2.0
-1.5
-1.0
-0.5
0.0
0.5
1.0
1.5
% q/q z-score
GDP (LHS)Business Barometer
Index(RHS)

…as did the Lloyds job security survey
Source: Lloyds Bank WBM/BDRC Continental
70.0
70.5
71.0
71.5
72.0
72.5
73.0
73.5
Jan 05Jul 0
5Jan 06
Jul 06
Jan 07Jul 0
7Jan 08
Jul 08
Jan 09Jul 0
9Jan 10
Jul 10
Jan 11Jul 1
1Jan 12
Jul 12
-35
-30
-25
-20
-15
-10
-5
0
5
10
ONS empl. rate (LHS)
Job security (RHS)
% index

2010 2011 2012 (f) 2013 (f)
GDP %Yr 1.8 0.8 0.0 1.2
Interest rates (%, end yr)
Bank Rate 0.50 0.50 0.50 0.50
3m (offer) 0.76 1.08 0.70 0.70
5yr swap rate (mid) 2.63 1.56 1.30 1.50
FX rates (end year)
£:$ 1.57 1.55 1.54 1.49
£:€ 1.17 1.20 1.27 1.25
€:$ 1.34 1.30 1.22 1.19
Source: Lloyds Bank WBM
Key forecasts for the UK
Disclaimer
This presentation does not constitute or imply an offer or commitment whatsoever on the part of Lloyds TSB Bank plc (“Lloyds TSB”). Any such offer may only be made after the negotiation of satisfactory documentation and only after appropriate credit authority has been obtained. The pricing discussed herein is based on our view of current market conditions and is for discussion purposes only.
This presentation and all ancillary documents relating to it (together the "Presentation") was prepared by Lloyds TSB exclusively for you for the purpose of analysing certain potential transactions. The Presentation is being made available on a strictly confidential basis to you and is intended only for the internal use of authorised recipients (“Recipients”) and no part of it may be disclosed to any third party. This Presentation and the information contained herein are the property of Lloyds TSB. Recipients are hereby notified that photocopying, scanning, or any other form of reproduction, or distribution - in whole or in part - to any other person at any time is strictly prohibited without the prior written consent of Lloyds TSB.
The information in this Presentation reflects prevailing conditions and our judgment as of this date, all of which are subject to change or amendment without notice and the delivery of such amended information at any time does not imply that the information (whether amended or not) contained in this Presentation is correct as of any time subsequent to its date. Whilst Lloyds TSB have exercised reasonable care in preparing this presentation and any views or information expressed or presented are based on sources they believe to be accurate and reliable, neither Lloyds TSB, nor any of their officers, servants, agents, employees or advisors make any representation or warranty, express or implied, as to the fairness, accuracy, adequacy, completeness or correctness of such information, nor as to the achievement or reasonableness of any projections, targets, estimates, or forecasts and nothing in this Presentation should be relied upon as a promise or representation as to the future. Neither Lloyds TSB nor any of their officers, servants, agents, employees or advisors or any affiliate or any person connected with them accepts any liability whatsoever for any direct, indirect or consequential damages or losses arising from any use of this Presentation or its contents or otherwise arising in connection therewith. Lloyds TSB undertakes no obligation to update or correct any information contained herein or otherwise to advise as to any future changes to it. Applicable tax, accounting and legal considerations are subject to change and in all cases independent professional advice should be sought in those areas.
This Presentation is provided for information purposes only: there has been no independent verification of the contents of this Presentation. It does not constitute or contain investment advice. It is not and shall not be construed as an offer, invitation, recommendation or solicitation to sell, issue, purchase or subscribe for any securities in any jurisdiction or to enter into any transaction. It is not and shall not be construed as an offer to arrange, underwrite, finance, purchase or sell any security, financial instrument, assets, business, or otherwise provide monies to any party. Such offers may only be provided in writing after satisfactory legal, financial, tax, accounting and commercial due diligence, as well as approval from the relevant business and credit committees of Lloyds TSB and/or their affiliates. The information contained in this Presentation is in summary form for the convenience of presentation and may therefore not be complete.
Products and services that may be referenced in the Presentation may be provided through affiliates of Lloyds TSB or any person connected with them.
Lloyds Bank, Lloyds TSB Corporate Markets and Lloyds TSB are trading names of Lloyds TSB Bank plc and Lloyds TSB Scotland plc. Lloyds Bank and Lloyds TSB Corporate Markets are trading names of Bank of Scotland plc. Lloyds TSB Bank plc. Registered Office: 25 Gresham Street, London EC2V 7HN. Registered in England and Wales no. 2065. Lloyds TSB Scotland plc. Registered Office: Henry Duncan House, 120 George Street, Edinburgh EH2 4LH. Registered in Scotland no. 95237. Bank of Scotland plc. Registered Office: The Mound, Edinburgh EH1 1YZ.Registered in Scotland no. SC327000. Authorised and regulated by the Financial Services Authority under registration numbers 119278, 191240 and 169628 respectively.