Confidential Restricted – Not to be disclosed beyond authorised roles within Standard Life group...
19
Confidential Restricted – Not to be disclosed beyond authorised roles within Standard Life group or authorised third parties Charity Investors Symposium Charity Trustees Investors Association (CTIA) 2 nd September 2014
-
Upload
verity-doyle -
Category
Documents
-
view
213 -
download
0
Transcript of Confidential Restricted – Not to be disclosed beyond authorised roles within Standard Life group...

Confidential Restricted – Not to be disclosed beyond authorised roles within Standard Life group or authorised third parties
Charity Investors Symposium
Charity Trustees Investors Association (CTIA)
2nd September 2014

Confidential Restricted – Not to be disclosed beyond authorised roles within Standard Life group or authorised third parties
September 2014
Economic and market review
For use by individuals who are familiar with investment terminology.
Please contact your adviser or your Client Portfolio Manager if you need any explanation of any of the terms used.
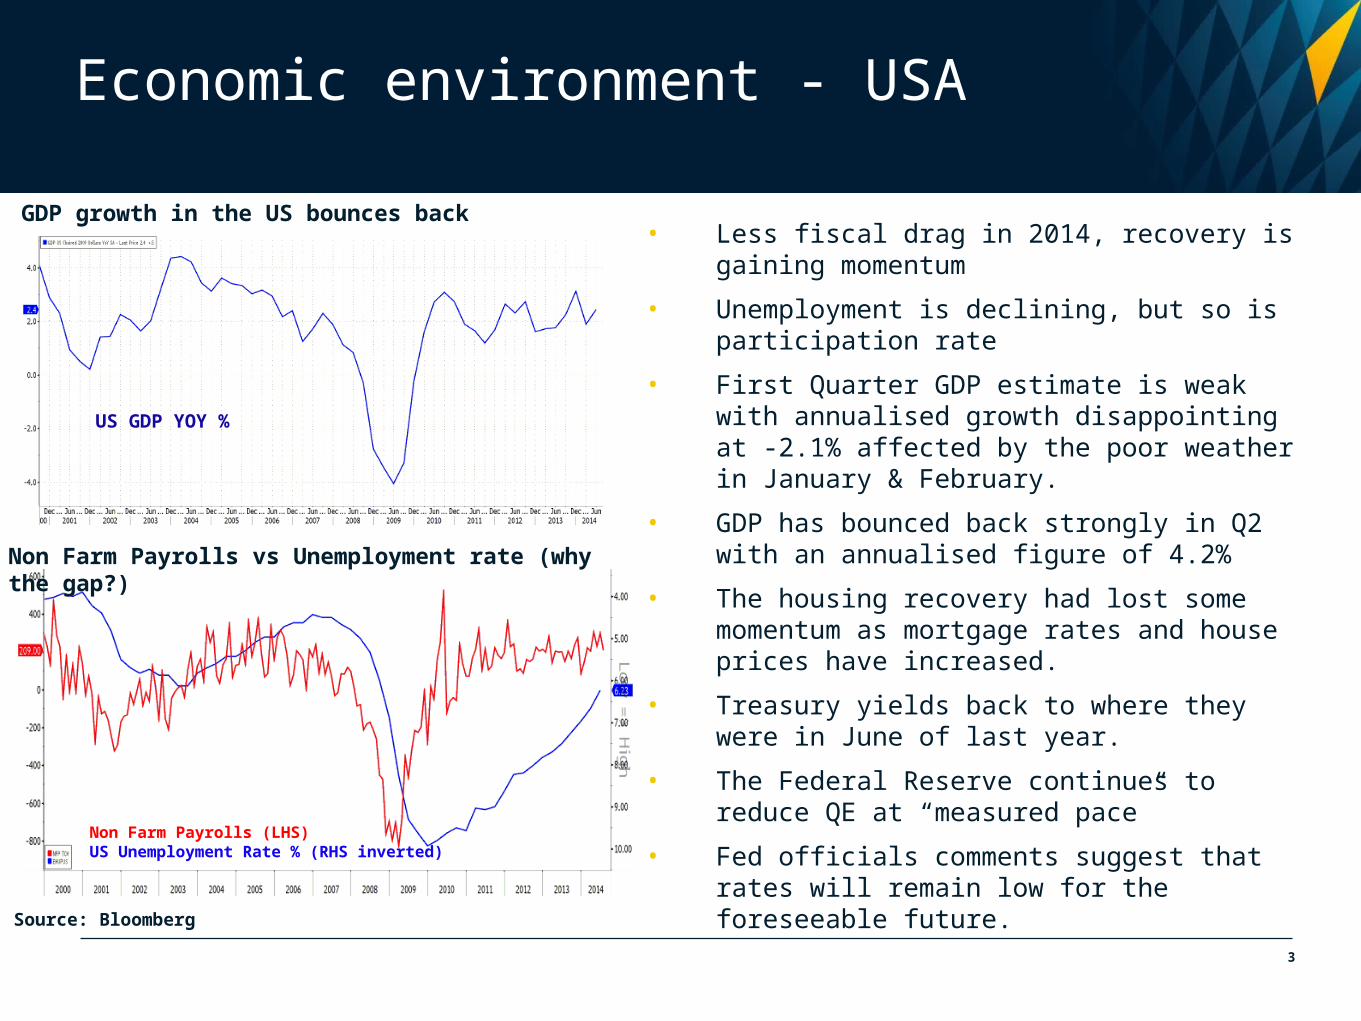
Non Farm Payrolls vs Unemployment rate (why the gap?)
GDP growth in the US bounces back
3
Source: Bloomberg
• Less fiscal drag in 2014, recovery is gaining momentum
• Unemployment is declining, but so is participation rate
• First Quarter GDP estimate is weak with annualised growth disappointing at -2.1% affected by the poor weather in January & February.
• GDP has bounced back strongly in Q2 with an annualised figure of 4.2%
• The housing recovery had lost some momentum as mortgage rates and house prices have increased.
• Treasury yields back to where they were in June of last year.
• The Federal Reserve continues to reduce QE at “measured pace”
• Fed officials comments suggest that rates will remain low for the foreseeable future.
Economic environment - USA
US GDP YOY %
Non Farm Payrolls (LHS)US Unemployment Rate % (RHS inverted)

UK GDP growth gaining momentum
4
Consumer Confidence & House Prices closely Correlated
Source: Bloomberg
• GDP grew by 0.8% in Q2. This translates into a YOY rate of 3.1%.
• Indication that GDP is beginning to be driven by business investment rather than consumer spending.
• Unemployment declining faster than expected but productivity stagnates
• Housing market continues to be robust, supported by Help to Buy
• PMI Surveys gaining momentum and consistent with stronger economy
• Consumer confidence is improving
• Inflation is at 1.6% p.a, but evidence that wage growth is still under pressure.
• BOE policy will continue to be accommodative but rate rises are likely in the foreseeable future.
• Politics is the risk which will be difficult to quantify.
Economic environment – UK
UK GDP QOQ % (LHS)UK Unemployment Rate % (RHS inverted)
UK Consumer Confidence (RHS)Nationwide House Price Annual %

Differential between Countries still exist
Eurozone: low growth, high unemployment
5
Source: Bloomberg
• Economic data has improved from the levels experienced in the summer of 2012.
• Unemployment remains stubbornly high, over 11%
• Aggregate data masks wide disparities between countries.
• Eurozone crisis has not been resolved and cannot be solved by ECB - it can only give support to Governments
• Weak inflation data has forced ECB to cut rates. Local deflation for some members.
• Further stimulus has been delivered through negative deposit rates and TLTRO.
• The path for QE has been opened.
• European Governments need to implement structural reform, e.g. banking union, but are prevented from action by vested national interests
• Tail risks diminished but focus shifts from sovereigns to banks in 2014. Asset Quality Review.
• A multi year process (if it is achieved at all)
Economic environment – Europe
Euro Zone Unemployment Rate % (LHS)
Euro Zone GDP YOY %(RHS inverted)
Italian Unemployment % (LHS)
Spanish Unemployment % (RHS)
German Unemployment % (LHS)

Economic environment – China
Retail Sales vs Consumer Confidence
Chinese economy growing slower, inflation benign
6
Source: Bloomberg
• Growth is slowing but should be about 7.5% in 2014. New leadership seems comfortable with lower growth.
• Industrial production, exports and investment lower than boom years but holding firm.
• Benign inflation at 2.3% versus target of 3.5%
• Interest rates on hold at 6.0% since summer 2012.
• Social and political hurdles remain and there are risks in shadow-banking and property sectors.
• Small focused stimulus targeted at specific areas of the economy (rail roads, social housing).
• Plans of plenary conference need to be implemented.
• Longer term challenge of rebalancing economy from export and investment towards more domestic consumption.
• Good investment opportunities in the long term but risks are evident over shorter time frames.
China GDP YOY % (LHS)Chinese CPI % (RHS)
China Retail Sales YOY % (LHS)Chinese Consumer Confidence (RHS)

Future strategy
Bonds• Duration looks unattractive.• Prefer Corporate Bonds to Government Bonds on a relative basis.• Value in selected High Yield Bonds at decent yields, (Europe over US).
Equities• Positive on equities at present. US, Europe, UK and Japan favoured.
• We have shifted our equity exposure from sustainable yield towards sustainable earnings growth.
• Selected areas of value, e.g. global energy and Chinese equities
Other assets• Global real estate offers value and attractive yields are supportive for higher quality property.
• Cash and short dated gilts / bonds offer little attraction at current levels
7

Confidential Restricted – Not to be disclosed beyond authorised roles within Standard Life group or authorised third parties
Why targeted return investing for Charities?
James England, IMC, ACSIHead of Charity and Corporate Investing, Standard Life Wealth
2nd September 2014

Agenda
•Is there an alternative to traditional Investing? Definitions of relative and targeted return
•Why targeted return could be beneficial to charities specifically
•The Standard Life Wealth target return approach

10
Some Definitions:
Relative return:• Aim to maximise the return relative to the stated benchmark or market indices.
• Assets are usually “long only” (buy and hold).
• Clients are often categorised - “cautious, medium, aggressive” for example.
• Both peer group (other funds and managers) and market benchmarks (indices) are used. WMA is a common benchmark in the charity sector.
• If the portfolio performs better than the benchmark in either a positive or negative direction, the manager has achieved the stated objective.
Target return:• Establish what the charity wants/ needs to achieve over what timescale
• The manager employs a range of different strategies in order to aim for a positive return over a set period of time regardless of the direction and the fluctuations of traditional markets.
• Performance is then measured against the return objective, rather than relatively to the market.
• Benchmarks are often cash or inflation measures, plus a % return.

0814
Your goals are our goals
11
Time
Target return portfolio
Equity index returns
Client goals
Our target return approach is to stay as close to your goals as possible at all times.
11

Why could a target return strategy be beneficial to Charities?
• Align the portfolio with charity’s specific goals
• Manager is accountable for hitting the return. Can’t blame the markets
• Less correlation to wider economy/ markets. Legacies, government funding and donations tend to go down at the same time as economy/ markets suffer (as we saw since 2008)
• Ability to avoid short term losses is desirable if the charity has to unexpectedly access capital/ taking regular income.
• A target return strategy can work well as a “buffer” between cash and a market relative portfolio
• More certainty in being able to carry out the charity’s day to day functions (such as payroll, grants etc) when income/ legacies could be variable
• Avoiding significant losses will help in maintaining confidence from donors/ sponsors
• Same return as equities over the long term, but delivered with less ups and downs

Target return, volatility managed
0814 13

Investing in a changing world
Strategic Investment
Allocation Fund (SIA)
non-traditional investmentsTraditional
investments
Market return andstock selection
Relativevolatility
Relativesector
movements
Relativeinflation
movements
Relativemarketindex
movements
Relativevalue
Property
Currencies
Bond duration
Inflation
Creditprotection
Opportunistic
US equity
CurrenciesEuropean
equity
UK equityoptions
Risk mitigationFutures and Options
(market returns)
0814 1414

0814 15
Uncorrelated source of returns Target: LIBOR + 3%
The Strategic Investment Allocation Fund is a simple and efficient way of delivering institutional-grade strategies into your portfolios and helps you to cope with market volatility
Source: Standard Life Wealth, Datastream (31 July 2008 to 31 July 2014). Representative performance of the Standard Life Wealth medium low risk (previously medium risk portfolio) model from inception. Portfolio targeting a Libor +3% return after fees and charges (assuming an annual management fee of 1.375%). The FTSE ® All Share Total Return Index does not include fees. The Strategic Investment Allocation Fund Performance is net of 0.6% AMC. Cash is based on 6 month Libor. LIBOR is the rate by which the banks will lend each other money. Data is shown in GBP.
As with any investment, the value of your fund can go down as well as up and may be worth less than you invested. It is therefore important that you understand the risks and commitments. The figures here refer to the past. Past performance is not a reliable guide to future performance.
Standard Life Wealth Medium Low Risk Portfolio
Strategic Investment Allocation Fund
FTSE® All Share
LIBOR +3%
Standard Life Wealth Medium Low Risk Portfolio Performance
15

Delivering on your target returnsTarget: LIBOR + 3%
Source: Standard Life Wealth, Bloomberg, Brown Brothers Harriman, Platform Securities. The graph demonstrates how a Standard Life Wealth Medium Low Risk Portfolio targeting LIBOR+3% (previously Medium Risk Portfolio) has performed after fees and charges (assuming an annual management fee of 1.375%) from inception (31 July 2008) to 31 July 2014 compared to the FTSE® All Share Total Return. The table above shows how the same portfolio compares over the available discrete annual returns since 31 December 2008 and three year cumulative returns to 31 July 2014. The portfolio target and Cash return is based on 6 month LIBOR. LIBOR is the rate by which the banks will lend each other money. * From 31 July 2008. ** To 31 July 2014.
As with any investment, the value of your fund can go down as well as up and may be worth less than you invested. It is therefore important that you understand the risks and commitments. The figures here refer to the past. Past performance is not a reliable guide to future performance.
0814
Medium Low Risk Portfolio: 43.3%
LIBOR + 3%: 30.8%
FTSE® All Share: 61.7%
Since launch: 31 July 2008
Cu
mu
lati
ve p
erfo
rman
ce
2008* 2009 2010 2011 2012 2013 2014**3 years
(returns p.a.)3 years
(cumulative)
Standard Life Wealth Medium Low Risk Portfolio
-0.4% 13.5% 7.8% 2.8% 5.9% 5.4% 2.6% 5.4% 17.2%
LIBOR + 3% 4.2% 5.0% 4.0% 4.1% 4.3% 3.6% 2.1% 4.0% 12.3%
16

Consistent approachTarget: LIBOR + 3%
As with any investment, the value of your fund can go down as well as up and may be worth less than you invested. It is therefore important that you understand the risks and commitments. The figures here refer to the past. Past performance is not a reliable guide to future performance.
0814 17
Source: Standard Life Wealth, Bloomberg, Brown Brothers Harriman, Platform Securities .The Standard Life Wealth Medium Low Risk Portfolio targeting LIBOR+3% (previously Medium Risk Portfolio), after fees and charges (assuming an annual management fee of 1.375%) from inception (31 July 2008) to 31 July 2014 over a 3-year rolling and 12-month rolling period. The portfolio target and cash return is based on 6-month LIBOR. LIBOR is the rate by which the banks will lend each other money.
Rolling 12 month returns
Delivered positive returns over 97% of the time59 positive periods out of 61
Rolling 3 year returns
Outperformed its target over 92% of the timeOutperformed 34 periods out of 37
17
Strategic Investment Allocation Fund risksSpecific to our target return approach
The Strategic Investment Allocation Fund is designed to be used as part of a strategic approach to individual client wealth objectives and should not be considered as a stand-alone investment.
The fund is designed to generate an absolute return when viewed with other assets in the client’s portfolio. As a result, if other assets in the portfolio are performing well, this fund may not produce a positive return.
The use of derivatives in the fund may result in increased volatility in the fund’s price.
Due to the leveraged nature of derivatives, gains and losses can be greater than associated with traditional investment instruments.
The fund will have the ability to hold short derivative positions. This means that the fund will not necessarily follow market trends i.e. if stock markets rise the fund may not do so at the same rate, or at all.
0814 1818

Standard Life Wealth Limited, registered in Scotland (SC317950) at 1 George Street, Edinburgh EH2 2LL.
Standard Life Wealth is authorised and regulated by the Financial Conduct Authority.
www.standardlifewealth.com 2014 © Standard Life, images reproduced under licence
0814 19
As with any investment, the value can go down as well as up and may be worth less than invested.
Past performance is not a guide to future performance.
Where we mention FTSE we are referring to FTSE®
"FTSE" is a trademark of the London Stock Exchange Plc and The Financial Times Limited and is used by FTSE International Limited ("FTSE") under licence. Standard Life Wealth is licensed by FTSE to redistribute the FTSE All Share and FTSE 100. All rights in and to the FTSE All Share and FTSE 100 vest in FTSE and/or its licensors. All information is provided for reference only. Neither FTSE nor its licensors shall be responsible for any error or omission in the FTSE All Share and FTSE 100.
Any data contained herein which is attributed to a third party ("Third Party Data") is the property of (a) third party supplier(s) (the “Owner”) and is licensed for use by Standard Life**. Third Party Data may not be copied or distributed. Third Party Data is provided “as is” and is not warranted to be accurate, complete or timely. To the extent permitted by applicable law, none of the Owner, Standard Life** or any other third party (including any third party involved in providing and/or compiling Third Party Data) shall have any liability for Third Party Data or for any use made of Third Party Data. Past performance is no guarantee of future results. Neither the Owner nor any other third party sponsors, endorses or promotes the fund or product to which Third Party Data relates.
**Standard Life means the relevant member of the Standard Life group, being Standard Life plc together with its subsidiaries, subsidiary undertakings and associated companies (whether direct or indirect) from time to time.
19