Confidential information not to be made public without ... · PDF filethermal comfort,...
45
Confidential information not to be made public without permission from the UC Regents. SUMMARY REPORT APRIL 2008 COMFORT, PERCEIVED AIR QUALITY, AND WORK PERFORMANCE IN A LOW-POWER TASK-AMBIENT CONDITIONING SYSTEM Hui Zhang, DongEun Kim, Edward Arens, Elena Buchberger, Fred Bauman, and Charlie Huizenga Center for the Built Environment (CBE), University of California, Berkeley EXECUTIVE SUMMARY Zhang’s thermal comfort model predicts that the local comfort of feet, hands, and face predominate in determining a person’s overall comfort in warm and cool conditions. We took advantage of this by designing a task-ambient conditioning (TAC) system that heats only the feet and hands, and cools only the hands and face, to provide comfort in a wide range of ambient environments. Per workstation, the TAC system uses less than 42W for cooling and 60W for heating. By reducing the amount of control normally needed in the overall building, it could be possible to save much larger amounts of energy in the building HVAC system. We tested the TAC system on 18 subjects in our environmental chamber, at temperatures representing a wide range of practical winter and summer conditions (18-30ºC, or 65-86 ºF). A total of 90 tests were done. We measured subjects’ skin and core temperatures, obtained their subjective responses about thermal comfort, perceived air quality, and air movement preference. The subjects performed three different types of tasks to evaluate their productivity at white-collar-types of work during the testing. The TAC system was able to maintain positive comfort levels across the entire temperature range tested. TAC did not significantly affect the task performance of the occupants compared to a neutral ambient condition. Whenever air motion was provided, perceived air quality was significantly improved, even if the air movement was re-circulated room air. There was no dry-eye discomfort with the head ventilation device as designed, even at 1 m/s in the breathing zone. The acceptable thermal sensation levels were from –2.2 to 2. In our tests, subjects found thermal environments acceptable even if they were judged slightly uncomfortable (-0.5). Simulated annual energy savings with the TAC system in Fresno, Oakland, and Minneapolis were each about 40% with intensive use of TAC (allowing 18-30ºC ambient interior temperature), and 30% with a moderate use (in 20-28ºC ambient temperature).
Transcript of Confidential information not to be made public without ... · PDF filethermal comfort,...

Confidential information not to be made public without permission from the UC Regents.
SUMMARY REPORT APRIL 2008
COMFORT, PERCEIVED AIR QUALITY, AND WORK PERFORMANCE IN A LOW-POWER TASK-AMBIENT CONDITIONING SYSTEM
Hui Zhang, DongEun Kim, Edward Arens, Elena Buchberger, Fred Bauman, and Charlie Huizenga
Center for the Built Environment (CBE), University of California, Berkeley EXECUTIVE SUMMARY
Zhang’s thermal comfort model predicts that the local comfort of feet, hands, and face predominate in determining a person’s overall comfort in warm and cool conditions. We took advantage of this by designing a task-ambient conditioning (TAC) system that heats only the feet and hands, and cools only the hands and face, to provide comfort in a wide range of ambient environments. Per workstation, the TAC system uses less than 42W for cooling and 60W for heating. By reducing the amount of control normally needed in the overall building, it could be possible to save much larger amounts of energy in the building HVAC system.
We tested the TAC system on 18 subjects in our environmental chamber, at temperatures representing a wide range of practical winter and summer conditions (18-30ºC, or 65-86 ºF). A total of 90 tests were done. We measured subjects’ skin and core temperatures, obtained their subjective responses about thermal comfort, perceived air quality, and air movement preference. The subjects performed three different types of tasks to evaluate their productivity at white-collar-types of work during the testing.
The TAC system was able to maintain positive comfort levels across the entire temperature range tested. TAC did not significantly affect the task performance of the occupants compared to a neutral ambient condition. Whenever air motion was provided, perceived air quality was significantly improved, even if the air movement was re-circulated room air. There was no dry-eye discomfort with the head ventilation device as designed, even at 1 m/s in the breathing zone. The acceptable thermal sensation levels were from –2.2 to 2. In our tests, subjects found thermal environments acceptable even if they were judged slightly uncomfortable (-0.5).
Simulated annual energy savings with the TAC system in Fresno, Oakland, and Minneapolis were each about 40% with intensive use of TAC (allowing 18-30ºC ambient interior temperature), and 30% with a moderate use (in 20-28ºC ambient temperature).

PAGE 2 COMFORT, PAQ, AND WORK PERFORMANCE IN A LOW-POWER TAC SYSTEM APRIL 2008
1. BACKGROUND
Office occupant surveys show that thermal discomfort is a major cause of dissatisfaction with office environments (Huizenga et al. 2006), and is linked with occupants’ perceived work productivity (Goins 2007). Surveys have also shown that providing occupants with personal control of temperature and air movement enlarges the range of ambient temperatures in which they are comfortable (Brager et al. 2004, Bauman et al. 1998). Other surveys suggest that increased air movement improves occupants’ perceived air quality (Zhang et al. 2007). Finally, a laboratory study has demonstrated that in warm conditions, the comfort of the head and hands dictates a person’s overall discomfort; in cool conditions, the comfort of the feet and hands dictate overall discomfort (Arens et al. 2006, Zhang 2003). These results suggest that a personally controlled task-ambient system (TAC) that focuses directly on these body parts may efficiently improve comfort in office environments.
2. OBJECTIVES
The study was designed to:
• Examine the ability of a low-power task-ambient conditioning system to maintain comfort over a wide range of ambient room temperatures.
• Explore productivity effects associated with this type of task-ambient conditioning.
• Examine connections between air speed near the face and the perception of air quality.
• Examine how the presence of personal control affects comfort.
• Quantify this TAC system’s ability to reduce overall building energy use.
3. METHODS
3.1 Summary
We designed a Task-Ambient Conditioning (TAC) system consisting of 4 subcomponents, each under the user’s control. The four subcomponents address the head-hand-foot combinations identified by Zhang (2003, Arens et al., 2006a, b). The system’s peak wattage for cooling is 41W, and for heating at steady state is 59W. The system was tested in an environmental chamber operated across a range of temperatures representing a wide range of practical winter and summer conditions (18-30ºC, or 65-86 ºF). Electricity use of the TAC system and environmental parameters were measured.
Human subject tests were conducted from February through May, 2007. We measured subjects’ skin and core temperatures, asked their subjective responses related to thermal comfort, perceived air quality, air movement preference, etc. We had the subjects perform 3 different types of tasks to evaluate work performance during the test.
The following sections describe the TAC design, chamber setup, and human subject tests.
3.2 TAC system design
Figure 1 shows the four TAC devices. A conductive hand warmer and a radiant foot warmer heat these extremities in cool (winter) conditions. For summer conditions, a head-ventilation device cools the head by air motion, and a hand-cooling device operates through conduction and air motion. During the design process of these TAC systems, we took IR images to examine the effectiveness of the systems. The IR images are displayed in Figure 1 as well.

PAGE 3 COMFORT, PAQ, AND WORK PERFORMANCE IN A LOW-POWER TAC SYSTEM APRIL 2008
In designing these systems, we paid attention to make them simple, energy efficient, and as practical as possible.
Cold conditions Warm conditions
palm warmer and a heated keyboard
heated mouse head ventilation device
before applying TAC after applying TAC
before applying TAC (head and hands)
after applying TAC (head and hands)
Foot warmer
before applying TAC after applying TAC inside foot warmer
hand cooling device
Figure 1. Four TAC systems, with example infrared images of their effects on skin temperature
(1) Hand warmer. The hand warmer is a curved surface made of 1/16”aluminum sheet which has very high heat conductance. There are electrical heating tapes underneath the aluminum to warm the palm surface quickly and efficiently. See Figure 1. The aluminum surface temperature is typically 35ºC. The keyboard and mouse are also heated. These are commercially available units, controlled by on-off switches.
We found during the testing that the surface temperature of the heated keyboard (32ºC) was too low to have a strong impact on hand warming. The hand warming observed in these tests came mainly
Heated keyboardPalm warmer
Heated keyboardHeated keyboardPalm warmer
PAGE 4 COMFORT, PAQ, AND WORK PERFORMANCE IN A LOW-POWER TAC SYSTEM APRIL 2008
from the palm warmer, with its higher temperature and a more conductive surface. This could be corrected in future keyboard designs. We built a more successful prototype later that effectively warmed the fingers with plastic keys at 43 ºC.
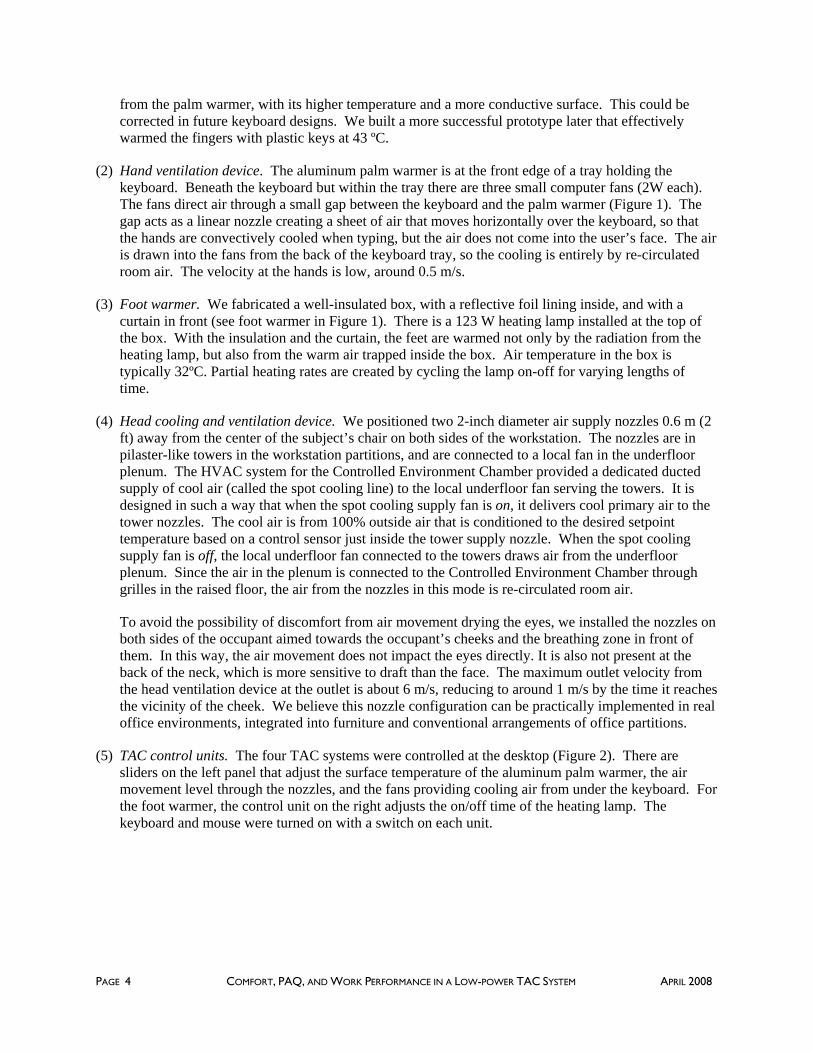
(2) Hand ventilation device. The aluminum palm warmer is at the front edge of a tray holding the keyboard. Beneath the keyboard but within the tray there are three small computer fans (2W each). The fans direct air through a small gap between the keyboard and the palm warmer (Figure 1). The gap acts as a linear nozzle creating a sheet of air that moves horizontally over the keyboard, so that the hands are convectively cooled when typing, but the air does not come into the user’s face. The air is drawn into the fans from the back of the keyboard tray, so the cooling is entirely by re-circulated room air. The velocity at the hands is low, around 0.5 m/s.
(3) Foot warmer. We fabricated a well-insulated box, with a reflective foil lining inside, and with a curtain in front (see foot warmer in Figure 1). There is a 123 W heating lamp installed at the top of the box. With the insulation and the curtain, the feet are warmed not only by the radiation from the heating lamp, but also from the warm air trapped inside the box. Air temperature in the box is typically 32ºC. Partial heating rates are created by cycling the lamp on-off for varying lengths of time.
(4) Head cooling and ventilation device. We positioned two 2-inch diameter air supply nozzles 0.6 m (2 ft) away from the center of the subject’s chair on both sides of the workstation. The nozzles are in pilaster-like towers in the workstation partitions, and are connected to a local fan in the underfloor plenum. The HVAC system for the Controlled Environment Chamber provided a dedicated ducted supply of cool air (called the spot cooling line) to the local underfloor fan serving the towers. It is designed in such a way that when the spot cooling supply fan is on, it delivers cool primary air to the tower nozzles. The cool air is from 100% outside air that is conditioned to the desired setpoint temperature based on a control sensor just inside the tower supply nozzle. When the spot cooling supply fan is off, the local underfloor fan connected to the towers draws air from the underfloor plenum. Since the air in the plenum is connected to the Controlled Environment Chamber through grilles in the raised floor, the air from the nozzles in this mode is re-circulated room air.
To avoid the possibility of discomfort from air movement drying the eyes, we installed the nozzles on both sides of the occupant aimed towards the occupant’s cheeks and the breathing zone in front of them. In this way, the air movement does not impact the eyes directly. It is also not present at the back of the neck, which is more sensitive to draft than the face. The maximum outlet velocity from the head ventilation device at the outlet is about 6 m/s, reducing to around 1 m/s by the time it reaches the vicinity of the cheek. We believe this nozzle configuration can be practically implemented in real office environments, integrated into furniture and conventional arrangements of office partitions.
(5) TAC control units. The four TAC systems were controlled at the desktop (Figure 2). There are sliders on the left panel that adjust the surface temperature of the aluminum palm warmer, the air movement level through the nozzles, and the fans providing cooling air from under the keyboard. For the foot warmer, the control unit on the right adjusts the on/off time of the heating lamp. The keyboard and mouse were turned on with a switch on each unit.
PAGE 5 COMFORT, PAQ, AND WORK PERFORMANCE IN A LOW-POWER TAC SYSTEM APRIL 2008
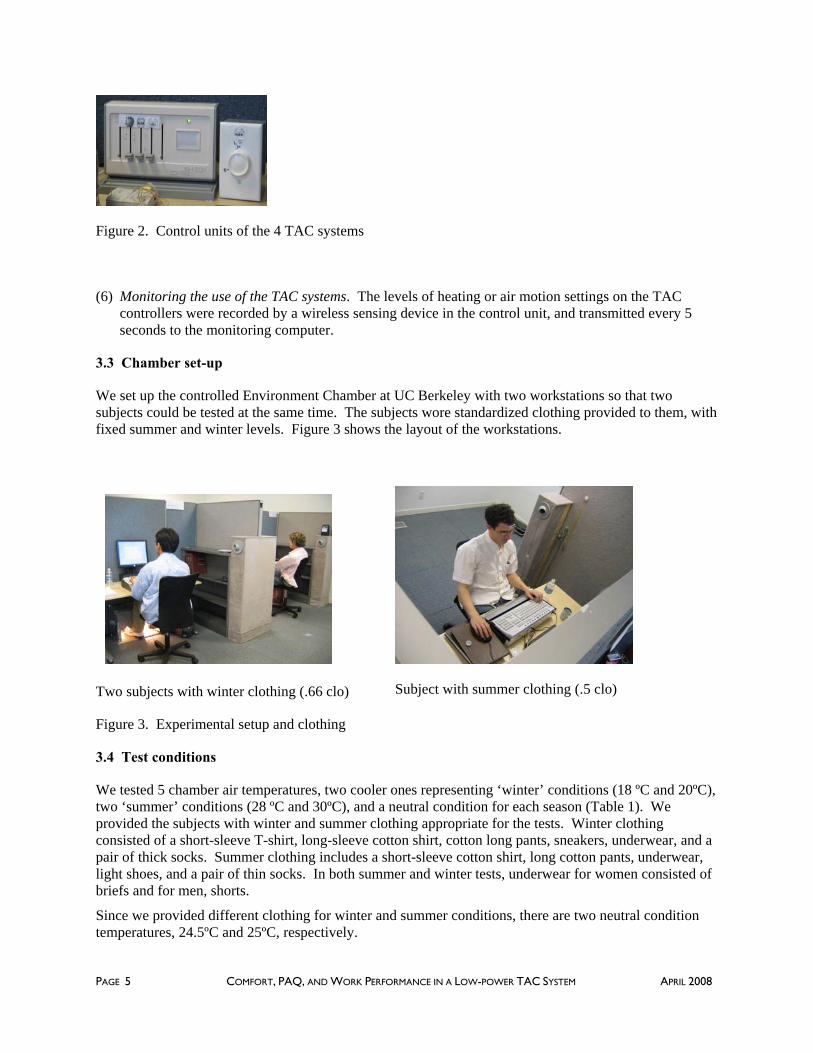
(6) Monitoring the use of the TAC systems. The levels of heating or air motion settings on the TAC controllers were recorded by a wireless sensing device in the control unit, and transmitted every 5 seconds to the monitoring computer.
3.3 Chamber set-up
We set up the controlled Environment Chamber at UC Berkeley with two workstations so that two subjects could be tested at the same time. The subjects wore standardized clothing provided to them, with fixed summer and winter levels. Figure 3 shows the layout of the workstations.
Two subjects with winter clothing (.66 clo)
Subject with summer clothing (.5 clo)
Figure 3. Experimental setup and clothing
3.4 Test conditions
We tested 5 chamber air temperatures, two cooler ones representing ‘winter’ conditions (18 ºC and 20ºC), two ‘summer’ conditions (28 ºC and 30ºC), and a neutral condition for each season (Table 1). We provided the subjects with winter and summer clothing appropriate for the tests. Winter clothing consisted of a short-sleeve T-shirt, long-sleeve cotton shirt, cotton long pants, sneakers, underwear, and a pair of thick socks. Summer clothing includes a short-sleeve cotton shirt, long cotton pants, underwear, light shoes, and a pair of thin socks. In both summer and winter tests, underwear for women consisted of briefs and for men, shorts.
Since we provided different clothing for winter and summer conditions, there are two neutral condition temperatures, 24.5ºC and 25ºC, respectively.
Figure 2. Control units of the 4 TAC systems

PAGE 6 COMFORT, PAQ, AND WORK PERFORMANCE IN A LOW-POWER TAC SYSTEM APRIL 2008
Table 1. Chamber air temperatures and effective temperatures
Each test included three control strategies for operating the TAC system: ‘No TAC’, ‘Fixed TAC’, ‘User Control’. ‘No TAC’ means none of the TAC features are enabled. ‘Fixed TAC’ means that the TAC settings are fixed at levels prescribed by the experimental design. Under ‘User Control’, the subjects were allowed to adjust the levels of heating and cooling provided by the TAC system. In ‘winter’ conditions (18 and 20ºC) tests, the heating TAC system was provided: foot warmer, palm warmer, heated keyboard, and heated mouse. In the ‘Fixed TAC’ mode, the aluminum surface of the palm warmer was controlled at 35ºC, and the heated keyboard and mouse were each fixed at 32 ºC. The foot warmer was controlled at the on/off ratio of 4/12 (4 seconds on and 12 seconds off), producing inside the warmer an average radiant flux of 45W, and an internal air temperature of 32 ºC. In the 28ºC ‘summer’ condition test, air motion was provided through the head and the hand ventilation devices, both using re-circulated room air. The 30ºC tests are the same as the 28ºC tests, except that the head cooling airflow in this case is outside air, supplied at 24ºC (6ºC cooler than the room air temperature). Due to mixing, by the time the air reaches the breathing zone of an occupant, the air temperature is around 28ºC. Under neutral conditions, there is no ‘Fixed TAC’ condition, because at neutral we assumed that the occupants would not need any local conditioning. Eighteen subjects (9 male and 9 female) participated in each of the 5 test conditions listed in Table 1. In total, we conducted 90 three-hour tests.
3.5 Schedule for human subject tests
Each test took three hours, divided into 3 one-hour sessions, corresponding to three control strategies: No-TAC, Fixed-TAC, and User-Controlled TAC. The sequence of the three sessions was alternated to keep a balanced order. For the neutral condition, in which there was no Fixed-TAC session, the three-hour test was divided into either of the following two sequences: No-TAC, User-Control, No-TAC, or User-Control, No-TAC, User-Control. The subjects arrived 15 minutes before the test started to change into the test clothing, tape on the skin temperature sensors, and swallow a transducer pill which measures their body core temperatures (described in detail later).
Figure 4 shows the plan of each test. The vertical arrows indicate the times that subjective surveys were administered. These were done at 30 minutes intervals, with a survey at the beginning of each test session, one in the middle, and one at the end. In the short interval between sessions, the researchers adjusted the test conditions (e.g., put the TAC into its fixed value settings), provided a light snack for the subjects and let the subjects stretch and move about (described in detail later).
Room air temperature Effective temperature (ET*) hot 30ºC (86ºF) 29ºC ±0.1
warm 28ºC (82.4ºF) 27.5ºC ±0.1 neutral 25 or 24.5 ºC (77ºF or 76ºF) 24.2ºC ±0.1
cool 20 (68ºF) 19.9ºC ±0.1 cold 18 ºC (64.4ºF) 18ºC ±0.1

PAGE 7 COMFORT, PAQ, AND WORK PERFORMANCE IN A LOW-POWER TAC SYSTEM APRIL 2008
Alternating sequence of one-hour sessions
(Arrows indicate times when surveys are administered. Each survey addresses thermal comfort, perceived air quality, air movement, and dry-eye discomfort) No TAC (60 min) Fixed TAC (60 minutes) User Control (60 minutes) Occupant no control Occupant no control Occupant control Task performances Figure 4. The schedule of sessions and surveys within a 3-hour test
The schedule for each hour is described in Figure 5. The surveys and subjects’ tasks (sudoku, math, and typing; described later) were all pre-scheduled into the computers that the subjects worked on, so they automatically appeared on their screens according to the timeline shown here.
Figure 5. Schedule of tasks performed in each 1-hour test session
Figure 5: schedule for each hourly test
15 min setup
PAGE 8 COMFORT, PAQ, AND WORK PERFORMANCE IN A LOW-POWER TAC SYSTEM APRIL 2008
3.6 Subjective surveys
The survey questionnaires appeared automatically on the subject’s computer screen at the times shown in Figure 4. The subjects’ votes were stored in the computer. In each test a subject answered the following questions on 17 pages. The order of the 17 pages did not alternate. A subject typically finished the questions in 2 minutes.
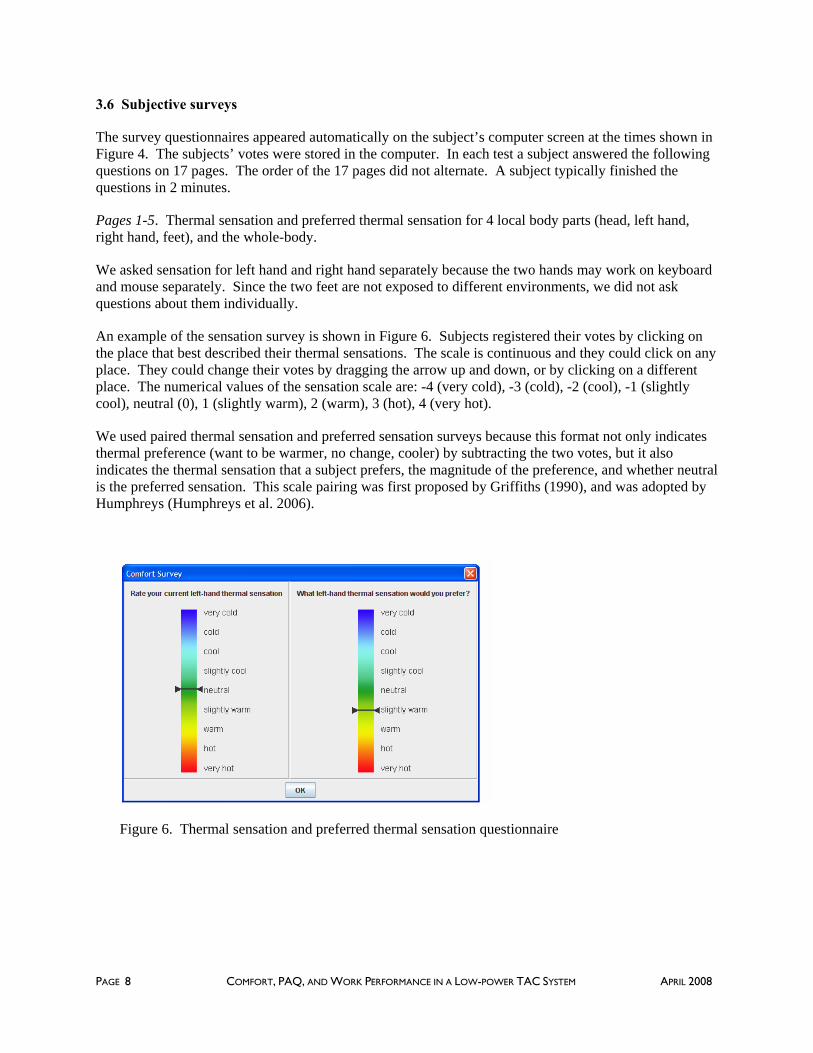
Pages 1-5. Thermal sensation and preferred thermal sensation for 4 local body parts (head, left hand, right hand, feet), and the whole-body.
We asked sensation for left hand and right hand separately because the two hands may work on keyboard and mouse separately. Since the two feet are not exposed to different environments, we did not ask questions about them individually.
An example of the sensation survey is shown in Figure 6. Subjects registered their votes by clicking on the place that best described their thermal sensations. The scale is continuous and they could click on any place. They could change their votes by dragging the arrow up and down, or by clicking on a different place. The numerical values of the sensation scale are: -4 (very cold), -3 (cold), -2 (cool), -1 (slightly cool), neutral (0), 1 (slightly warm), 2 (warm), 3 (hot), 4 (very hot).
We used paired thermal sensation and preferred sensation surveys because this format not only indicates thermal preference (want to be warmer, no change, cooler) by subtracting the two votes, but it also indicates the thermal sensation that a subject prefers, the magnitude of the preference, and whether neutral is the preferred sensation. This scale pairing was first proposed by Griffiths (1990), and was adopted by Humphreys (Humphreys et al. 2006).
Figure 6. Thermal sensation and preferred thermal sensation questionnaire

PAGE 9 COMFORT, PAQ, AND WORK PERFORMANCE IN A LOW-POWER TAC SYSTEM APRIL 2008
Pages 6-8. Thermal sensation for leg, arm, and trunk
We asked only thermal sensation for these three body parts, not the preferred thermal sensation, because TAC does not influence these body parts directly. Therefore, only the left side of the Figure 6 was used on these pages.
Pages 9-13. . Comfort for the 4 local body parts and the whole-body
We used the same comfort scale (Figure 7) as in our previous human subject studies (Zhang 2003, Arens et al. 2006a & b). Again, it is a continuous scale, from just comfortable (+0) to very comfortable (4), just uncomfortable (-0) to very uncomfortable (-4). There is a gap between just comfortable and just uncomfortable to ask the subjects to make a decision whether they are on the comfortable side, or on the uncomfortable side. We asked about comfort for the same 4 local body parts, and for the whole-body.
Figure 7. Thermal comfort questionnaire
Page 14. Perceived air quality
The appearance of the perceived air quality questionnaire is very similar to the comfort scale. The continuous scale runs from just acceptable (+0) to very good (4), just unacceptable (-0) to very bad (-4). Again there is a gap between just acceptable and just unacceptable to ask the subjects to make a clear distinction between the acceptable and unacceptable perceived air quality (Figure 8).
Figure 8. Perceived air quality questionnaire

PAGE 10 COMFORT, PAQ, AND WORK PERFORMANCE IN A LOW-POWER TAC SYSTEM APRIL 2008
Page 15. Acceptance of the air movement and preference
We provided two questionnaires regarding air movement, one on its acceptability, and one on preference for more, less, or the same (Figure 9). The acceptance scale runs from just acceptable (+0) to clearly acceptable (+4), just unacceptable (-0) to clearly unacceptable (-4). The air movement scale has three choices, less air movement (-1), no change (0), more air movement (1). Both questionnaires have been commonly used when evaluating the effects of air movement on comfort.
Figure 9. Air movement acceptance and preference
Page 16. Acceptance of the thermal environment
The subjects were asked to give votes regarding the acceptance of the thermal environments (Figure 10). The numerical values of the scale are the same as the air movement acceptable scale shown in Figure 9.
Figure 10. Thermal environment acceptance

PAGE 11 COMFORT, PAQ, AND WORK PERFORMANCE IN A LOW-POWER TAC SYSTEM APRIL 2008
Page 17. Dry-eye discomfort
Air movement could cause dry-eye discomfort (Wyon 1987, Wolkoff et al. 2005, Pejtersen et al. 2005). We designed the head ventilation system so that the air does not blow directly onto the face and eyes. The purpose of this questionnaire is to examine whether dry-eye discomfort occurs (Figure 11). The numerical values are the same as the other comfort and acceptable scales.
Figure 11. Dry-eye discomfort questionnaire
3.7 Productivity evaluation
Common approaches to evaluating productivity in laboratory studies include math exercises (normally addition), typing, proof reading, and creative thinking. It often happens in laboratory studies that the differences in the task performances between different environmental conditions are not significant, while in field studies, significant differences are seen (Niemela, R. et al. 2002, Tham et al. 2004, Tanabe et al. 2005). The lack of response in laboratory studies could mean that the environment did not impact productivity. It could also mean that the methods used in the laboratory studies did not properly represent normal office work, or that the motivation of subjects over the short duration of laboratory tests overwhelms environmental influences that in normal life would have an impact on office work. We looked for ways to evaluate task performances (productivity), over a reasonably long time period, involving both mental and dexterity work, and providing resolution in the level of response. We spent some time exploring the possibility of using Graduate Record Examination (GRE) or Student Aptitude Testing (SAT) practice tests as a way to evaluate the performance. The advantages are that such tests involve both thinking and typing, cover a reasonable length of time, and are real work that is being undertaken anyway by university student subjects, for whom the pacing of work and motivation would be realistic. However, we found that during the one-hour test sessions planned for our experiment, including the time needed for the subjective surveys, we could only arrange to do one session of the GRE test. One session normally only covers 18 – 25 questions, so the resolution was too low (e.g. if one question is wrong, it has a large impact on the score). The GRE and SAT tests may be a good approach if the test session is longer (for example, people can do two SAT sessions). It was not a feasible choice for this test. We chose the following three tasks to evaluate work performance, each of which was automated on the computer. The schedule for performing the three tasks in each hour session is shown above in Figure 5.

PAGE 12 COMFORT, PAQ, AND WORK PERFORMANCE IN A LOW-POWER TAC SYSTEM APRIL 2008
Logical thinking: Sudoku, 15 min. Medium difficulty examples were chosen so that subjects could complete more than one in a session, and not become stuck on any test.
Figure 12. A screen shot of an automated Sudoku of medium difficulty Mental performance: Math problems, 8 min. We chose fraction multiplication for the math problems, because the exercises were not tedious but also not too difficult; always solvable but at varying rates of speed depending on how many mental shortcuts are employed.
Figure 13. A screen shot of math test sheet
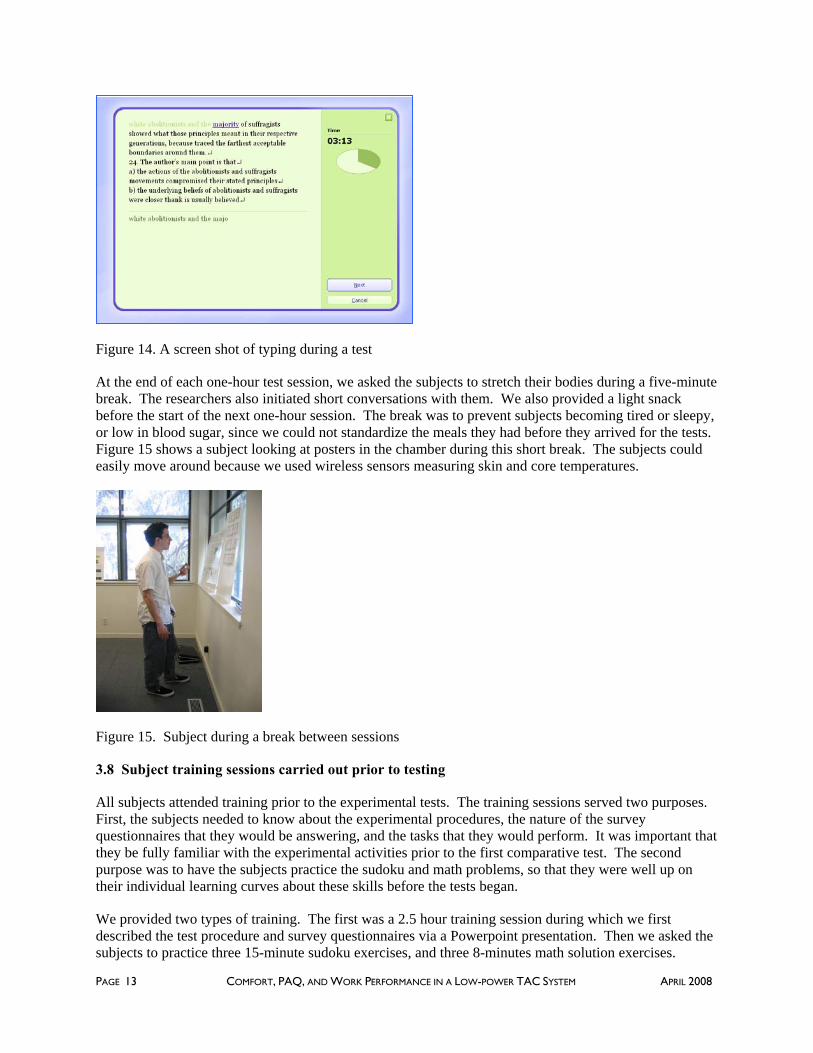
Dexterity: Typing, 10 min. We used commercially available typing training software that automatically scored the speed and accuracy of the typing.
PAGE 13 COMFORT, PAQ, AND WORK PERFORMANCE IN A LOW-POWER TAC SYSTEM APRIL 2008
Figure 14. A screen shot of typing during a test
At the end of each one-hour test session, we asked the subjects to stretch their bodies during a five-minute break. The researchers also initiated short conversations with them. We also provided a light snack before the start of the next one-hour session. The break was to prevent subjects becoming tired or sleepy, or low in blood sugar, since we could not standardize the meals they had before they arrived for the tests. Figure 15 shows a subject looking at posters in the chamber during this short break. The subjects could easily move around because we used wireless sensors measuring skin and core temperatures.
Figure 15. Subject during a break between sessions
3.8 Subject training sessions carried out prior to testing
All subjects attended training prior to the experimental tests. The training sessions served two purposes. First, the subjects needed to know about the experimental procedures, the nature of the survey questionnaires that they would be answering, and the tasks that they would perform. It was important that they be fully familiar with the experimental activities prior to the first comparative test. The second purpose was to have the subjects practice the sudoku and math problems, so that they were well up on their individual learning curves about these skills before the tests began.
We provided two types of training. The first was a 2.5 hour training session during which we first described the test procedure and survey questionnaires via a Powerpoint presentation. Then we asked the subjects to practice three 15-minute sudoku exercises, and three 8-minutes math solution exercises.

PAGE 14 COMFORT, PAQ, AND WORK PERFORMANCE IN A LOW-POWER TAC SYSTEM APRIL 2008
Figure 16 shows the researchers explaining the test procedure and the three tasks. After they practiced the sudoku and math, they went to the environmental chamber to visit the work stations and to learn how to use the control units of the four TAC systems.
Figure 16. Subject training sessions
Following this training session, we had the subjects come in twice over two weeks to do example math, sudoku, and typing tests, answer survey questions, and use the TAC systems in the chamber, working just as they would be doing in the real test. After the two weeks, the subjects were thoroughly familiar with the test procedures and the TAC control units, and had reached a fairly steady state in their skills with the productivity tests.
3.9 Physiological measurements
We measured skin temperature at 10 locations (Figure 17). Two of the locations represent places on bare skin that are directly heated or cooled by the TAC systems, and therefore undergo fast transients in skin temperature (finger and cheek). Eight other locations are under clothing and not directly under the influence of the TAC. Seven of these are used for the calculation of mean skin temperature, and one was added to measure upper arm temperature. For the bare-skin locations we used fine thermocouples, each connected to an Onset Corp Hobo thermocouple data logger (represented by stars in the figure). The eight other locations used more massive thermistor sensors, connected to two 4-channel Hobo temperature loggers (grouped as blue rectangles and pink ovals). Altogether each subject had 4 hobo loggers, located in a small fanny pack worn at the waist. The thermistors were recorded in 10-second intervals, and the thermocouples in 5-second intervals.
The core temperature was measured by a wireless transducer (a pill, size of a vitamin capsule) which each subject swallowed before the start of a test. A receiver/logger was put into the pocket of the shirts that subjects wore. The core temperature data was recorded in 20-second intervals.

PAGE 15 COMFORT, PAQ, AND WORK PERFORMANCE IN A LOW-POWER TAC SYSTEM APRIL 2008
Figure 17. Skin and core temperature sensors and skin temperature measurement locations
3.10 Measurement of environmental conditions
At each workstation, 3 Hobo thermistors measured the air temperature at the three standard heights (0.1, 0.6, 1.1m) specified for seated subjects in the ASHRAE and ISO environmental standards. Globe temperature and humidity were measured at 1.1 m. Another Hobo thermistor measured the air temperature at the outlet of the nozzle (Figure 18), and a thermocouple to measure the surface temperature of the palm warmer. Because the foot warmer was controlled by cycling the heat lamp inside, an illumination-sensing Hobo in the warmer monitored the on/off times of the lamp.
Figure 18. Thermistors and thermocouple to measure workspace environmental conditions and the TAC system temperatures
Figure 19, breathing-zone velocity measurement near the heated thermal manikin
The air velocity field in the workstation was characterized before the actual tests, because velocity measurement during testing would have been too intrusive. This was done with a manikin (Figure 19), with the head-cooling air jets set at various velocities. The manikin surface was heated to generate a realistic buoyant plume around the person. During the subsequent human subject tests, the experimenters did spot checks of velocity around the head with hand instrumentation, to assure that actual airflows matched the values predicted from the airflow control settings.

PAGE 16 COMFORT, PAQ, AND WORK PERFORMANCE IN A LOW-POWER TAC SYSTEM APRIL 2008
4 RESULTS AND ANALYSIS
4.1 Whole-body thermal sensation
Figure 20 presents the 18 subjects’ average whole-body (‘overall’) thermal sensation, for each of the 5 environmental conditions and the three control strategies. From the figure we see that the TAC systems bring thermal sensation almost to the ‘neutral’ level for the 20ºC and 28ºC air temperatures, and that they bring the sensation at 18ºC and 30ºC to within ‘slightly cool’ (-1) and ‘slight warm’ (1). No obvious difference is seen between the Fixed-TAC and the User-Controlled strategies.
Figure 20. Whole-body thermal sensation
Figure 21 plots the same sensation data against room air temperature, for the three control strategies. The slope of the No-TAC data is steeper than the slopes of Fixed-TAC and User-Controlled, indicating that the TAC devices compensate somewhat for both the high and low air temperatures. We see no difference in the slopes for Fixed-TAC and User-Controlled TAC, indicating that in these tests, with the Fixed-TAC settings we chose, we didn’t detect an advantage coming from occupants being able to control their TAC devices.
The sensation differences between No-TAC and with TAC (Fixed-TAC and User-Controlled) are significant for all conditions. They are much larger in warm environments with ventilation devices than in cool environments with local heating devices; and the significant level is also higher (Figure 21). This indicates that ventilation-cooling devices are more effective than heating devices at improving thermal sensation.
-4
-3
-2
-1
0
1
2
3
4
no TAC fixed TAC user controlled
Very hot
Neutral
Very cold
30ºC (86ºF) 28ºC (82.4ºF) 24.5ºC (76ºF) 20ºC (68ºF) 18ºC (64.4ºF)

PAGE 17 COMFORT, PAQ, AND WORK PERFORMANCE IN A LOW-POWER TAC SYSTEM APRIL 2008
-2.5-2.0-1.5-1.0-0.50.00.51.01.52.02.5
18℃ 20℃ Neutral 28℃ 30℃Room Temperature
Sen
satio
nNoTAC FixedTAC UserControlled
Figure 21. Whole-body thermal sensation with air temperatures for three control strategies
4.2 Whole-body thermal comfort
Comfort was improved by TAC systems in all conditions except one (20ºC with Fixed-TAC, Figure 22). The TAC systems made people comfortable (comfort scale equal or above 1) over a large air temperature range, from 18ºC to 30ºC.
The comfort level was slightly higher with User-Control than with Fixed-TAC, significant at two conditions (28 and 20ºC). When the air temperature is as low as 18ºC and as high as 30ºC, the User-Controlled TAC does not provide obvious advantage over Fixed-TAC because people’s requirements for warmth and coolth are clear and the Fixed-TAC can be easily set to fulfill the requirements. It is in the less extreme conditions (in our test conditions, 20 and 28ºC air temperatures), that the User-Controlled shows significant improvement over Fixed-TAC. People’s demand for warmth and coolth is more variable and sensitive in these less extreme conditions.
We found that at 20ºC room air temperature, the palm warmer was often regarded by subjects as unnecessary, and that it could create discomfort. The Fixed-TAC surface temperature for the palm warmer was supposed to be set at 35ºC, but we discovered that this value was sometimes exceeded. The higher palm temperatures were less welcome to subjects in the 20ºC environment than in the cooler 18ºC environment. Local palm discomfort affects the whole-body comfort at 20ºC.
P <0.0001
P <0.001
P <0.03
P <0.03

PAGE 18 COMFORT, PAQ, AND WORK PERFORMANCE IN A LOW-POWER TAC SYSTEM APRIL 2008
Figure 22. Whole-body thermal comfort
In the neutral condition, comfort is significantly improved (p<0.04) with User-Controlled TAC (overall comfort 2.5) compared with No-TAC (overall comfort 2.0), even there should be no thermal discomfort with the No-TAC neutral condition. However, because we didn’t provide a perfect neutral condition for the No-TAC neutral condition (overall sensation is 0.35 instead of zero, Figure 21), we could not attribute this improvement entirely to the ability to control.
Figure 23 plots whole-body comfort data against air temperature for the three control strategies. With No-TAC (blue diamonds), we see that people’s comfort decreases more rapidly on the warm side than on the cool side, indicating that people are more sensitive to warm discomfort than to cool discomfort. Both the Fixed- and User-Controlled TAC strongly improve subjects’ comfort on the warm side (p<0.04 at neutral, p<0.01 at 28 and 30ºC), and less strongly on the cool side (p<0.04 at 20 ºC and not significant for 18ºC).
-4
-3
-2
-1
0
1
2
3
4
no TAC fixed TAC user controlled
30ºC (86ºF) 28ºC (82.4ºF) 24.5ºC (76ºF) 20ºC (68ºF) 18ºC (64.4ºF)
P <0.01
P <0.05
Very comfortable
Just comfortable Just uncomfortable
Very uncomfortable
P <0.04

PAGE 19 COMFORT, PAQ, AND WORK PERFORMANCE IN A LOW-POWER TAC SYSTEM APRIL 2008
-2.5-2.0-1.5-1.0-0.50.00.51.01.52.02.53.0
18 20 Neutral 28 30
Room Temperature
Com
fort
NoTAC FixedTAC UserControlled
Figure 23. Whole-body thermal comfort with air temperatures for three control strategies
4.3 Acceptability of the thermal environment
(1) Comfort and acceptability
The scatter plot in Figure 24 shows the subjects’ thermal comfort votes to be linearly related to their thermal acceptability votes. After binning the data (to get average values for each 0.5 comfort interval), the linear relationship is clearer (Figure 25). The regression line shows people felt ‘just acceptable’ when their comfort averaged –0.5; ie., people found the environment acceptable even when they felt slightly uncomfortable (-0 means ‘just uncomfortable’).
Examining the Figure 25 data for the three control strategies (blue diamond for No-TAC, red square for Fixed-TAC, and green triangle for User-Controlled-TAC), we see that the data for no-TAC has a steeper trend than the other two. We therefore did separate linear regressions for the three strategies (Figure 26), and indeed, the three linear regressions show different slopes and intercepts (comfort thresholds for ‘just acceptable’). Figure 27 – 29 show regressions for comfort and acceptance using binned data for each control strategy. From these equations, we calculate the comfort thresholds for No-TAC at –0.2, Fixed-TAC at –0.7, and User-Controlled-TAC at –0.84. These different thresholds means that with either TAC system, people accept thermal environments at lower comfort levels than under No-TAC, even when people don’t have control over the TAC systems. This is encouraging for the design of TAC systems. In addition, because the comfort votes with TAC systems in general are higher than with No-TAC, therefore, with the TAC, these lower thresholds are less frequently reached.
P <0.01
P <0.04
P <0.05
P <0.01
P <0.01

PAGE 20 COMFORT, PAQ, AND WORK PERFORMANCE IN A LOW-POWER TAC SYSTEM APRIL 2008
No TAC Fixed TAC User Controlled
Figure 24. Thermal comfort and thermal acceptance (just acceptable at comfort –0.6)
Figure 25. Thermal comfort and thermal acceptance with binned data (just acceptable at comfort –0.5)
Figure 26. Thermal comfort and thermal acceptance with binned data for all three control strategies
Figure 27. Thermal comfort and thermal acceptance with binned data for No-TAC (just acceptable at comfort –0.2)
T h e rm a l C o m f o rt a n d A c c e p ta b ility
- 4
- 3
- 2
- 1
0
1
2
3
4
- 4 - 3 - 2 - 1 0 1 2 3 4
y =0 .81x + 0 .4 8R ©÷=0.59
Just acceptableJust unacceptable
Clearly acceptable
Clearly unacceptable
Thermal comfort
T h e rm a l C o m f o rt a n d A c c e p ta b ility
- 4
- 3
- 2
- 1
0
1
2
3
4
- 4 - 3 - 2 - 1 0 1 2 3 4
y =0 .81x + 0 .4 8R ©÷=0.59
Just acceptableJust unacceptable
Clearly acceptable
Clearly unacceptable
Thermal comfort
p yy = 0.8x + 0.4
R2 = 0.83
-4
-3
-2
-1
0
1
2
3
4
-4 -3 -2 -1 0 1 2 3 4
thermal comfort
ther
mal
acc
epta
bilit
y
Clearly acceptable
Clearly unacceptable
Just acceptableJust unacceptable
p yy = 0.8x + 0.4
R2 = 0.83
-4
-3
-2
-1
0
1
2
3
4
-4 -3 -2 -1 0 1 2 3 4
thermal comfort
ther
mal
acc
epta
bilit
y
Clearly acceptable
Clearly unacceptable
Just acceptableJust unacceptable
y
-4
-3
-2
-1
0
1
2
3
4
-4 -3 -2 -1 0 1 2 3 4therma l comfort
ther
mal
acc
epta
bili
ty
.
Clearly acceptable
Clearly unacceptable
Just acceptableJust unacceptable
4 y
-4
-3
-2
-1
0
1
2
3
4
-4 -3 -2 -1 0 1 2 3 4therma l comfort
ther
mal
acc
epta
bili
ty
.
Clearly acceptable
Clearly unacceptable
Just acceptableJust unacceptable
4y = 0.83x + 0.16
R2 = 0.95
-4
-3
-2
-1
0
1
2
3
4
-4 -3 -2 -1 0 1 2 3 4
therm al comfort
ther
mal
acc
epta
bili
ty
.Clearly acceptable
Clearly unacceptable
Just acceptableJust unacceptable
y = 0.83x + 0.16R2 = 0.95
-4
-3
-2
-1
0
1
2
3
4
-4 -3 -2 -1 0 1 2 3 4
therm al comfort
ther
mal
acc
epta
bili
ty
.Clearly acceptable
Clearly unacceptable
Just acceptableJust unacceptable
PAGE 21 COMFORT, PAQ, AND WORK PERFORMANCE IN A LOW-POWER TAC SYSTEM APRIL 2008
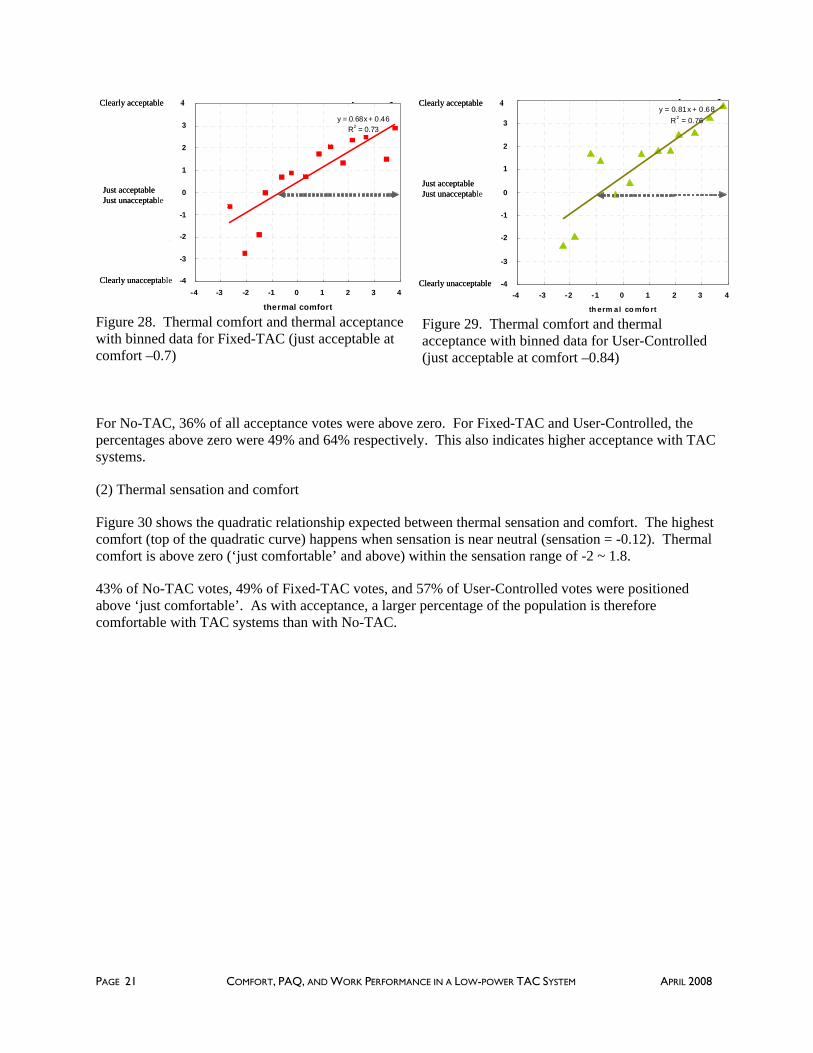
Figure 28. Thermal comfort and thermal acceptance with binned data for Fixed-TAC (just acceptable at comfort –0.7)
Figure 29. Thermal comfort and thermal acceptance with binned data for User-Controlled (just acceptable at comfort –0.84)
For No-TAC, 36% of all acceptance votes were above zero. For Fixed-TAC and User-Controlled, the percentages above zero were 49% and 64% respectively. This also indicates higher acceptance with TAC systems.
(2) Thermal sensation and comfort
Figure 30 shows the quadratic relationship expected between thermal sensation and comfort. The highest comfort (top of the quadratic curve) happens when sensation is near neutral (sensation = -0.12). Thermal comfort is above zero (‘just comfortable’ and above) within the sensation range of -2 ~ 1.8.
43% of No-TAC votes, 49% of Fixed-TAC votes, and 57% of User-Controlled votes were positioned above ‘just comfortable’. As with acceptance, a larger percentage of the population is therefore comfortable with TAC systems than with No-TAC.
p yy = 0.81x + 0.68
R2 = 0.76
-4
-3
-2
-1
0
1
2
3
4
-4 -3 -2 -1 0 1 2 3 4
th erm al co mfo rt
Clearly acceptable
Clearly unacceptable
Just acceptableJust unacceptable
4p y
y = 0.81x + 0.68R2 = 0.76
-4
-3
-2
-1
0
1
2
3
4
-4 -3 -2 -1 0 1 2 3 4
th erm al co mfo rt
Clearly acceptable
Clearly unacceptable
Just acceptableJust unacceptable
4p y
y = 0.68x + 0.46R2 = 0.73
-4
-3
-2
-1
0
1
2
3
4
-4 -3 -2 -1 0 1 2 3 4
thermal comfort
ther
mal
acc
epta
bilit
y .
Clearly acceptable
Clearly unacceptable
Just acceptableJust unacceptable
4 p y
y = 0.68x + 0.46R2 = 0.73
-4
-3
-2
-1
0
1
2
3
4
-4 -3 -2 -1 0 1 2 3 4
thermal comfort
ther
mal
acc
epta
bilit
y .
Clearly acceptable
Clearly unacceptable
Just acceptableJust unacceptable
4

PAGE 22 COMFORT, PAQ, AND WORK PERFORMANCE IN A LOW-POWER TAC SYSTEM APRIL 2008
No TAC Fixed TAC User Controlled
Figure 30. Thermal sensation and thermal comfort
(3) Sensation and acceptability
In Figure 31, the most acceptable sensation is also near neutral (sensation = -0.11) in the quadratic relationship. The range of acceptable sensations ranges from -2.2 ~ 2, 0.2 scale units wider on both sides than the range for comfortable sensations. Again, a larger percentage of the population finds the environment acceptable with the TAC systems than without. 40% of No-TAC votes, 47% votes of Fixed-TAC votes, and 67% of User-Controlled votes coincided with acceptance above zero.
Thermal Sensation and Comfort
y = -0.51x2 - 0.13x + 1.83R2 = 0.44
-4
-3
-2
-1
0
1
2
3
4
-4 -3 -2 -1 0 1 2 3 4thermal sensation
thermally comfortable sensation range
Very comfortable
Very uncomfortable
Just comfortable Just uncomfortable

PAGE 23 COMFORT, PAQ, AND WORK PERFORMANCE IN A LOW-POWER TAC SYSTEM APRIL 2008
No TAC Fixed TAC User Controlled
Figure 31. Thermal sensation and thermal acceptance
From the above figures relating thermal acceptance and comfort with thermal sensation, one can see that the thermal sensations –2 and +2 are the thresholds within which most people are comfortable and accept the environment, and that people accept thermal environments when comfort is slightly uncomfortable (-0.5) and above.
4.4 Task performance
The levels at which individual subjects performed the 3 different types of tasks are very different. Also, the differences between the subjects are larger than the intrapersonal productivity effects caused by the environment.
We normalized each subject’s task scores using the score of the same person under a reference condition, the neutral condition without TAC. The reference score was set as 100% and the other scores were converted into either increases or decreases from the reference. The results for the three task performances are presented in Figure 32.
Clearly acceptable
Clearly unacceptable
Just acceptableJust unacceptable
p y
y = -0.48x2 - 0.11x + 2.05R2 = 0.35
-4
-3
-2
-1
0
1
2
3
4
-4 -3 -2 -1 0 1 2 3 4thermal sensation
thermally acc eptable s ens ation range
Clearly acceptable
Clearly unacceptable
Just acceptableJust unacceptable
p y
y = -0.48x2 - 0.11x + 2.05R2 = 0.35
-4
-3
-2
-1
0
1
2
3
4
-4 -3 -2 -1 0 1 2 3 4thermal sensation
thermally acc eptable s ens ation range

PAGE 24 COMFORT, PAQ, AND WORK PERFORMANCE IN A LOW-POWER TAC SYSTEM APRIL 2008
In general, having TAC produces better performance for sudoku and math (the pink and light blue lines are above the dark blue line in Figure 32). However, the differences are significant at level p<0.05 only under two conditions, marked by the two dashed boxes in the figure. For Sudoku (logical thinking), performance was better in warm conditions and for the Math (mental performance), performance was better in cool conditions. We were expecting to see that mental performance (sudoku and math) would be better under cool environments. For typing, we might have expected to see improved performance as the air temperature gets warmer (Alan Hedge (2006) found this and attributed it to improved dexterity). However, in this test, the differences in typing rate among all the conditions are insignificant. Typing does not appear to be a sensitive method for evaluating performance in this range of environmental conditions. Possibly mental effects act to counteract dexterity effects, but we cannot test this with our data.
It is interesting to see that for sudoku and math tasks, the performance with TAC systems in many cases is better than in the neutral condition. That could be an encouraging sign for the design of non-uniform environments.
Figure 32. Task performance normalized to the neutral condition
As we saw before with the subjective comfort votes, math performance was unexpectedly low in the 20ºC air temperature condition with TAC systems. The same explanation may hold--that the room wasn’t sufficiently cold for the high surface temperature of the palm warmer to feel comfortable. From their comments, we know that it bothered some subjects and may have lowered their performance.
It is possible that the task performance under User-Control may be lowered because it takes time for subjects to make adjustments to the TAC systems. Over the limited time period of the tasks, this lost time might act to lower the performance scores. We are not able to quantify this potential effect.
4.5 Perceived air quality
The lower red curve in Figure 33 presents the perceived air quality (PAQ) under 30ºC air temperature, under fixed velocities without User Control. It shows that PAQ is significantly better with 1 m/s air
M ath: M en ta l Perfo rm an ce
8 0
8 5
9 0
9 5
10 0
10 5
11 0
11 5
12 0
1 8¡ É 20¡ É 24.5 ¡ É 28¡ É 30 ¡ É
Average Math
No
mai
lized
Sco
re
SUDOKU: Logical Thinking
80
85
90
95
100
105
110
115
120
18¡ É 20¡ É 24.5¡ É 28¡ É 30¡ É
Average SUDOKU
Nom
ailiz
ed S
core
P<0.05
P<0.05
No TAC Fixed TAC Us er Controlled
Typing:Dexterity(Speed)
80
85
90
95
100
105
110
115
120
18¡ É 20¡ É 24.5¡ É 28¡ É 30¡ É
Average Typing(Speed)
No
mai
lized
Sco
re

PAGE 25 COMFORT, PAQ, AND WORK PERFORMANCE IN A LOW-POWER TAC SYSTEM APRIL 2008
movement at the breathing zone than with still air (increased by 2.4 scale units, from –0.8 to 1.6; p<0.001).1
Since in the 30ºC tests the nozzle air supply was cooled (24ºC right at the outlet of the nozzle, about 28ºC when it reaches the breathing zone), and coming from the outdoors, one might attribute the improved PAQ to three causes: air movement, lower air temperature, and/or the freshness of the supply air.
The middle curve in Figure 33 tends to reject both lower supply air temperature and fresher supply air as causes of the improvement. This curve represents the 28ºC room condition (also fixed velocities without User Control), in which the nozzle supply air was entirely re-circulated room air drawn from near the floor. Since the air temperature and freshness were identical to those of the surrounding room air, the 1.6 scale unit improvement in PAQ at 28ºC (p<0.001) must be attributed to air movement. This is further supported by the top curve in the figure representing neutral temperature, with the airspeed under User Control. In this, the PAQ under neutral conditions was increased (0.6 scale, P<0.004) when subjects increased the air speed. Again, the moving air was re-circulated room air. No cooled or fresh supply air was involved.
Figure 33. Perceived air quality versus air speed measured in the breathing zone
One can see that the large difference in PAQ between the air temperatures 28ºC and 30ºC (middle and bottom curves) under still air (p<0.05), dropped to a small difference when the air speed was 1 m/s. Air
1 (The small ‘n’ number for the air speed 0.5 m/s results from a small number of tests we did at that condition early in the project when the overall test duration was four hours. We found that four hours was too long for the subjects, and that their performance was lowered toward the end of each test. In order to drop this last hour, we chose to drop the 0.5 m/s condition
-1
0
1
2
0 0.2 0.4 0.6 0.8 1 1.2
Airspeed at Breathing Zone (m/s)
Perc
eive
d A
ir Q
ualit
y
Troom/Tsupply 28ºC/28ºC Troom/Tsupply 30ºC/24ºC
Neutral, Troom/Tsupply 24.5ºC/4.5ºC
(n=26, overall comfort=0.2)
(n=7)
(n=26, overall comfort=1.2)
(n=25, overall comfort = -1.5)
(n=3)
(n=25, overall comfort=0.9)
p<0.05
(n=25, overall comfort = 2)
(n=25, overall comfort = 2.5)
p<0.01

PAGE 26 COMFORT, PAQ, AND WORK PERFORMANCE IN A LOW-POWER TAC SYSTEM APRIL 2008
movement caused part of this improvement. Presumably the cooler supply air provided in the 30ºC ambient tests (which reached the breathing zone at 28ºC) also improved PAQ .
Figure 34 shows the increases in PAQ for a range of airspeeds that were chosen by the user (User Control), compared against still air (No-TAC). Each line represents the results measured for 18 subjects. The velocities were chosen by the subjects. It shows that when the air temperature was high (28 and 30ºC in the figure), the higher the airspeed, the better the PAQ. Under neutral conditions, once the air velocity reached about 0.3 m/s, further airspeed did not enhance the PAQ.
Figure 34. Increases in perceived air quality caused by air speed, at three temperatures (user-controlled TAC)
Figure 35 allows us to further examine how much air movement improved PAQ. Under Fixed-TAC, a 1 m/s air speed (shown in Figure 33) almost brought the PAQ up to the levels found in cool and neutral conditions. Figure 35 also shows that the significant improvement in PAQ occurred mostly when adding air motion for cooling (right part of the figure shown by a gray bar), not when adding local heating (left part of the figure, shown by a gray bar), although comfort was significantly improved for both cooling and heating (Figure 22 and 23). Both these observations indicate that it is mainly the air movement, not increased comfort, that enhanced the PAQ.
0.0
0.5
1.0
1.5
2.0
2.5
0.0 0.2 0.4 0.6 0.8 1.0 1.2 1.4
Airspeed at Breathing Zone (m/s)
Perc
eive
d A
ir Q
ualit
y In
crea
se
28ºC
30ºC
neutral
PAGE 27 COMFORT, PAQ, AND WORK PERFORMANCE IN A LOW-POWER TAC SYSTEM APRIL 2008
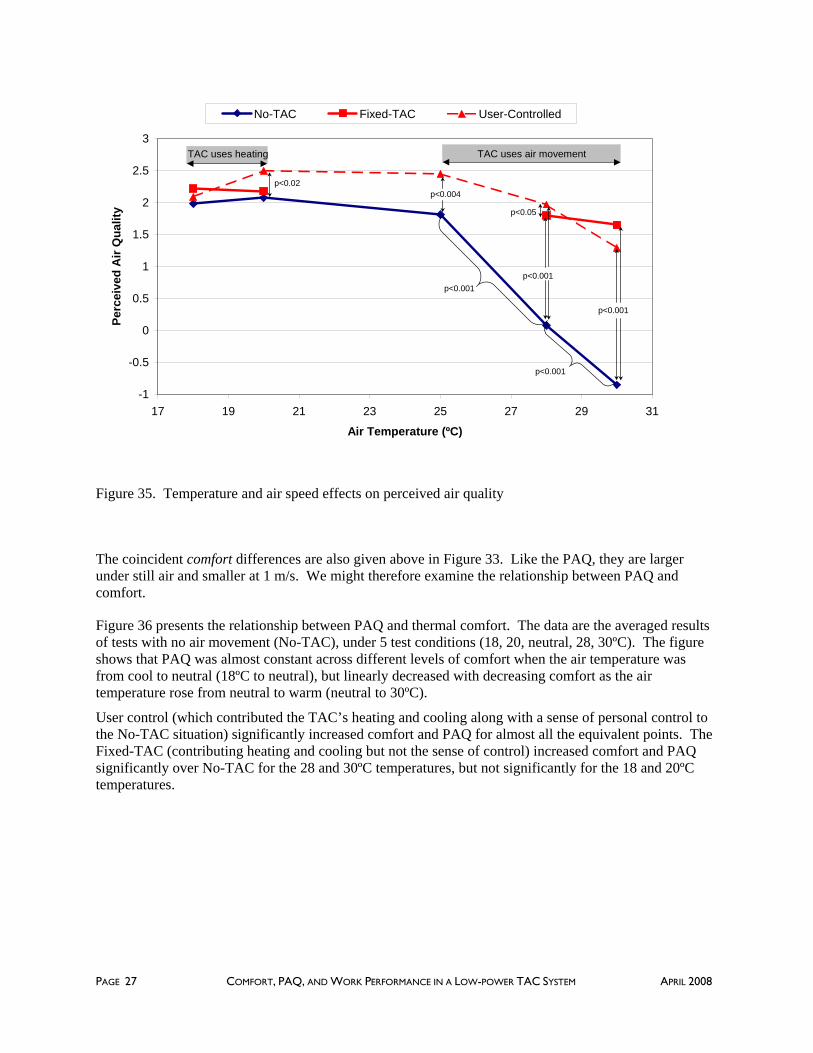
Figure 35. Temperature and air speed effects on perceived air quality
The coincident comfort differences are also given above in Figure 33. Like the PAQ, they are larger under still air and smaller at 1 m/s. We might therefore examine the relationship between PAQ and comfort.
Figure 36 presents the relationship between PAQ and thermal comfort. The data are the averaged results of tests with no air movement (No-TAC), under 5 test conditions (18, 20, neutral, 28, 30ºC). The figure shows that PAQ was almost constant across different levels of comfort when the air temperature was from cool to neutral (18ºC to neutral), but linearly decreased with decreasing comfort as the air temperature rose from neutral to warm (neutral to 30ºC).
User control (which contributed the TAC’s heating and cooling along with a sense of personal control to the No-TAC situation) significantly increased comfort and PAQ for almost all the equivalent points. The Fixed-TAC (contributing heating and cooling but not the sense of control) increased comfort and PAQ significantly over No-TAC for the 28 and 30ºC temperatures, but not significantly for the 18 and 20ºC temperatures.
-1
-0.5
0
0.5
1
1.5
2
2.5
3
17 19 21 23 25 27 29 31
Air Temperature (ºC)
Perc
eive
d A
ir Q
ualit
yNo-TAC Fixed-TAC User-Controlled
TAC uses heating
p<0.001
p<0.004
p<0.001
p<0.001
p<0.001
TAC uses air movement
p<0.05
p<0.02

PAGE 28 COMFORT, PAQ, AND WORK PERFORMANCE IN A LOW-POWER TAC SYSTEM APRIL 2008
Figure 36. Comfort and perceived air quality under still air
In conclusion: air movement by itself affects PAQ, and thermal comfort may affect (or be affected by) PAQ under warm still-air conditions.
4.6 Dry-eye discomfort and air movement preference
We designed the head ventilation nozzles to supply air into the occupant’s breathing zone from the side, for two reasons: to avoid dry-eye discomfort, and to avoid draft discomfort. The survey results shown in Figure 37 demonstrate that the air movement at the 28 and 30ºC did not cause any dry-eye discomfort. In the left figure, the lines including the head ventilation device are similar to the No-TAC line without the device. In general, the eye-dryness comfort was lower when the air temperature was warmer.
With the air speed 1 m/s in the breathing zone at warm temperatures (middle figure, again the two TAC lines), the air movement was judged acceptable. Still air was not acceptable in warm environments (No-TAC line).
The air movement preference shown in the right figure indicates that with 1m/s at the breathing zone under warm environments (TAC lines), people preferred ‘no change’ (didn’t want the air movement slower). In still air (No-TAC line), people preferred more air movement, in both the warm environments and the neutral one.
Perceived Air Quality vs. Thermal Comfort
-1.5
-1
-0.5
0
0.5
1
1.5
2
2.5
3
-3 -2 -1 0 1 2 3
Overall Thermal Comfort
Perc
eive
d A
ir Q
ualit
y
No-TAC User-Controlled Fixed-TAC
18ºC20ºC
neutral
28ºC
30ºC

PAGE 29 COMFORT, PAQ, AND WORK PERFORMANCE IN A LOW-POWER TAC SYSTEM APRIL 2008
Figure 37. Dry-eye discomfort, air movement acceptance and preference
4.7 Body temperatures
Table 2 shows the cheek, finger, and foot skin temperatures, and the core temperature measured under all the test conditions. The data are the average of the last 5 minutes of each one-hour session, under each air temperature and control strategy (No-TAC, Fixed-TAC, User-Controlled-TAC). We assume the body had reached a stable temperature condition after one-hour exposure to each air temperature.
The core temperature was lowered in cool environments (18, 20ºC) when heating had been applied to hands and feet by the heated TAC devices. The core temperature was increased in warm environments (28, 30ºC) when ventilation had been applied to cool head and hands. Following the core temperatures under No-TAC for each air temperature, we also see that the core temperature decreased as the air temperature increased from 18 to 30ºC. These are expected results, showing that under our test conditions (which are not extreme conditions), human body thermoregulation caused the core temperature to go in the opposite direction as the environmental temperature.
Table 2. Skin and core temperatures under five environmental conditions and three TAC control strategies
18ºC No TAC Fixed TACUser-
Controlled TAC
∆x= (FixedTAC-
NoTAC )
∆x= (UserContrlTAC-
NoTAC)
Cheek(n=18) 30.49 30.46 30.41 -0.03 -0.09
Finger(n=16) 24.57 25.81 26.41 1.24 1.83
Foot(n=18) 32.28 33.53 33.32 1.25 1.03
CORE(n=11) 37.24 37.21 37.18 -0.03 -0.06
No TAC Fixed TAC User Controlled
more
No change
Less
Air Preference
-1.0
-0.5
0.0
0.5
1.0
18 20 N(24.5) N(25) 28 30
Air Preferencemore
No change
Less
Air Preference
-1.0
-0.5
0.0
0.5
1.0
18 20 N(24.5) N(25) 28 30
more
No change
Less
Air Preference
-1.0
-0.5
0.0
0.5
1.0
18 20 N(24.5) N(25) 28 30
Air PreferenceClearly
Acceptable
Just Acceptable
Just Unacceptable
ClearlyUnacceptable
Air Movement Acceptability
-4
-3
-2
-1
0
1
2
3
4
18 20 N(24.5) N(25) 28 30
Air movement acceptabilityClearly
Acceptable
Just Acceptable
Just Unacceptable
ClearlyUnacceptable
Air Movement Acceptability
-4
-3
-2
-1
0
1
2
3
4
18 20 N(24.5) N(25) 28 30
Air movement acceptabilityClearly
Comfortable
just Comfortable
just Uncomfortable
ClearlyUncomfortable
Eye Dryness
-4
-3
-2
-1
0
1
2
3
4
18 20 N(24.5) N(25) 28 30
Eye drynessClearly
Comfortable
just Comfortable
just Uncomfortable
ClearlyUncomfortable
Eye Dryness
-4
-3
-2
-1
0
1
2
3
4
18 20 N(24.5) N(25) 28 30
Eye dryness

PAGE 30 COMFORT, PAQ, AND WORK PERFORMANCE IN A LOW-POWER TAC SYSTEM APRIL 2008
20ºC No TAC Fixed TACUser-
Controlled TAC
∆x= (FixedTAC-
NoTAC )
∆x= (UserContrlTAC-
NoTAC)
Cheek(n=18) 31.12 31.10 31.26 -0.01 0.14
Finger(n=16) 27.18 28.81 28.91 1.64 1.74
Foot(n=18) 32.74 33.41 33.15 0.67 0.42
CORE(n=7) 37.16 37.04 37.03 -0.11 -0.13
Neutral No TAC User-
Controlled TAC
∆x= (FixedTAC-
NoTAC )
∆x= (UserContrlTAC-
NoTAC)
Cheek(n=18) 33.50 32.52 -0.98
Finger(n=16) 32.04 30.60 -1.43
Foot(n=18) 33.25 33.26 0.02
CORE(n=14) 37.02 37.06 0.05
28ºC No TAC Fixed TACUser-
Controlled TAC
∆x= (FixedTAC-
NoTAC )
∆x= (UserContrlTAC-
NoTAC)
Cheek(n=18) 34.35 32.96 33.29 -1.40 -1.06
Finger(n=16) 33.82 32.64 32.60 -1.17 -1.21
Foot(n=18) 34.42 34.10 34.04 -0.32 -0.38
CORE(n=18) 37.07 37.07 37.11 -0.01 0.03

PAGE 31 COMFORT, PAQ, AND WORK PERFORMANCE IN A LOW-POWER TAC SYSTEM APRIL 2008
30ºC No TAC Fixed TACUser-
Controlled TAC
∆x= (FixedTAC-
NoTAC )
∆x= (UserContrlTAC-
NoTAC)
Cheek(n=18) 35.56 33.13 33.48 -2.44 -2.08
Finger(n=18) 34.97 33.54 33.91 -1.43 -1.06
Foot(n=18) 35.29 34.84 34.75 -0.45 -0.54
CORE(n=16) 37.03 37.13 37.11 0.14 0.08
Figure 38 shows these core and skin temperatures from the last 5 minutes of each test, together with the coincident local- and whole-body thermal comfort.

PAGE 32 COMFORT, PAQ, AND WORK PERFORMANCE IN A LOW-POWER TAC SYSTEM APRIL 2008
cheek fingerfoot COREhead comfort hand comfort foot comfort whole body comfort
18 Condition
24
26
28
30
32
34
36
38
_ _
No TAC Con
Tem
pera
ture
( )
-4-3-2-1
01234
20 Condition
2426283032343638
_ _
No TAC Con
-4-3-2-101234
Neutral Condition
2426283032343638
_ _
No Con
-4-3-2-101234
28 Condition
2426283032343638
_ _
No TAC Con
-4-3-2-101234
30 Condition
2426283032343638
_ _
No TAC Con
-4-3-2-101234
Figure 38. Comfort votes and physiological temperatures over the final 5 minutes of each test
The
rmal
com
fort

PAGE 33 COMFORT, PAQ, AND WORK PERFORMANCE IN A LOW-POWER TAC SYSTEM APRIL 2008
In the neutral condition, comfort for the local body parts and the whole-body increased going from No-TAC to User-Controlled. This is true for the foot even though its skin temperature did not change (green line). This might have been caused by the subjects’ perception that control was available. However we did not see many control-availability benefits in most of the other tests in this experiment.
At 28ºC, cheek and finger temperatures decreased and comfort increased under Fixed-TAC. Foot temperature decreased by 0.38ºC even when there was no cooling for feet. All comfort increased further under User-Controlled, even though finger and foot skin temperatures in fact increased slightly.
At 30ºC, we see a similar trend as in 28ºC, that the comfort increases as the skin temperature decreases under Fixed-TAC. We did not see a further increase in comfort when user had control. A temperature decrease was observed for the foot under Fixed-TAC.
Generally, whole-body comfort follows the changes in local body comfort. Under our 5 test conditions, we found the skin temperatures associated with highest comfort to be:
• Cheek: 32.5 ‒ 33.5ºC, found in the neutral condition tests
• Finger: 30.6 - 32ºC, found in the neutral condition tests
• Foot: 33.15ºC, found in the 20ºC User-Controlled tests and in the neutral condition tests
These temperatures might be useful for the design and control of TAC systems.
4.8 Comparing the energy use of the TAC system with that of a conventional HVAC system
The energy use of our TAC system was compared to a conventional HVAC system in Oakland and Fresno California, using the simulation program EnergyPlus. Oakland is in a mild coastal climate, while Fresno’s Central Valley location is both hotter in summer and colder in winter.
(1). Measured energy use of TAC systems
We measured the power consumption of each of the four TAC systems under tested conditions. Following figures (Figure 39 and 40) present the energy consumption for cooling and heating.
1 fan @ 35W cooling head through 2 nozzles 3 fans @2W each, cooling hands through
keyboard
Together, 41W
Figure 39. Summer Condition (Cooling Mode): measured energy use for cooling

PAGE 34 COMFORT, PAQ, AND WORK PERFORMANCE IN A LOW-POWER TAC SYSTEM APRIL 2008
We did not estimate the energy required to cool the TAC supply air to 24 ºC (for the 30 ºC ambient condition), because doing so requires a number of assumptions about the building’s overall HVAC system and operation. The amount of air passing through the TACs is very small relative to that of the overall system, so this would be a small load.
Winter Condition (Heating Mode at 18ºC) air.
25.6W, aluminum palm warmer 30.8W, warming feet
Palm-Warmer: 25.6W
Heated Mouse: (powered through the
computer USB port): 3W
Together, 59W
Foot-Warmer: 123W x 0.25 (fraction of time
heating lamp on) =30.8W
Figure 40. Measured energy use for heating
As described earlier, our commercially obtained heated keyboard was not effective at heating the hand, and the hand heating from the experiments derived almost entirely from the palm-warmer and the heated mouse. Therefore, in this analysis we exclude the energy used by the keyboard from the energy required to obtain the levels of heating observed in our human subject test. (2) Simulating the energy savings of a TAC-equipped building
(A) Description of the building and energy simulation approach
The energy use of the TAC system is here compared to a conventional HVAC system in Oakland (a mild coastal climate), Fresno (Central Valley climate, hotter in summer and colder in winter), and Minneapolis (hot in summer, very cold in winter). The simulations were performed using EnergyPlus/DesignBuilder. The comparison building is 90 x 60m, with three stories (Figure 41). Each floor plate is 5,400 m2 (usable area 5,312 m2/story). The glazing area is 30% of the wall area. Each floor consists of five zones of open office plan, with the perimeter zones 4.5m in depth. The occupant density is 0.04 persons/m2. Internal loads include 8.07 W/m2 computer heat gain, and 10.76 W/m2 (200 lux) lighting. Infiltration is assumed to be 0.85 air changes per hour.
In this paper we term the indoor temperature range between thermostat calls for heating and cooling a ‘dead-band’, as in deadband thermostats. The conventional building has VAV with terminal reheat, maintaining a room air temperature dead-band of 21.5 – 24 ºC. Mechanical ventilation provides fresh air at 7.1 l/s per person (15cfm). Heating is by gas boiler and cooling by an electrical chiller. The TAC

PAGE 35 COMFORT, PAQ, AND WORK PERFORMANCE IN A LOW-POWER TAC SYSTEM APRIL 2008
building has the same HVAC system and ventilation rate, but the ambient conditions are controlled to two different dead-bands: 20 – 28ºC, and 18 – 30ºC. As presented in section 4.2 and Figure 22, occupant comfort is well-maintained in all these temperature ranges. The palm-warmer and the foot warmer are added to each workstation for heating, and the head and hand ventilation devices for cooling. The total energy is the sum of ambient HVAC energy and local TAC energy.
Figure 41. Configuration of the simulated building with perimeter and core zones
The energy use for a conventional HVAC system is the energy used to keep the indoor air temperature within 21.5 – 24ºC.
The energy use of the TAC plus HVAC system consists of two parts. The first is the HVAC energy used to keep the indoor air temperature within 20 – 28ºC or 18 – 30ºC. The energy needed to maintain each of these ranges was simulated by EnergyPlus, providing the two base conditions in the description below. The second part is the energy used by all the individual TAC systems at the workstations. When the air temperature is within 21.5 – 24ºC, no TAC is applied.
The TAC system components for heating (0.059kW/person or workstation) are used when the indoor air temperature is above 24ºC:
• 5480 m²/story x 3 story x 0.09 people/m² x 0.8 (occupancy) x 0.059kW/person x (number of hours above 24ºC) = 69.85kWh
The TAC system components for cooling (0.041kW/person or workstation) are used when the indoor air temperature is above below 21.5ºC:5480 m²/story x 3 story x 0.09 people/m² x 0.8 (occupancy) x
0.041kW/person x (number of hours below 21.5ºC)= 48.54kWh
In summer, because the indoor air temperature is always above 21.5ºC, no heating TAC is applied. In winter, because the indoor air temperature may be both below 21.5ºC and above 24ºC (Table 3, winter), either cooling or heating TAC may be applied.
Because 0.059kW/person for heating is data we measured for TAC system under our coldest test condition (18ºC air temperature), the energy savings results will be conservative for TAC systems operated under less extreme conditions. When the indoor air temperature is higher than 18ºC, less heat will be needed for the palm and foot warmers.
In contrast, we overestimated the cooling energy savings of TAC at 30ºC by a small amount, because we did not attempt to include the energy required to cool the 24ºC supply air through the TAC nozzles in the 30ºC condition. The supply volume through the nozzles was very small, and because of the mixing between the TAC ventilation nozzle and the breathing zone, the breathing zone temperature experienced
PAGE 36 COMFORT, PAQ, AND WORK PERFORMANCE IN A LOW-POWER TAC SYSTEM APRIL 2008
by the occupant was 28ºC, close to that of room air. We believe the human subject results would have been very similar using recirculated room air through the nozzles.
In our calculations, we assumed 80% workstation occupancy. Bauman et al. (1994) measured 70% average occupancy in an office field study. Since TAC systems are automatically turned off when there is no occupant, this mode of occupant-sensitive environmental conditioning produces significant energy savings.
One might ask whether the hottest and coldest ambient conditions would be acceptable for office workers when they are not at their workstations. In our tests, our subjects took a five-minute break between each one-hour session. During the breaks the subjects left their workstations and were exposed to the ambient condition. There was no discomfort noted, either in the hot or cold conditions. Comfort at the workstations therefore persists for a length of time, but we did not examine this beyond five minutes. This might be a reasonable time period for going to copy machines, bathroom, etc., but it would be useful for future TAC design to obtain statistical data for both the length of typical breaks and the occupants’ reactions to them.
(B). Floating indoor air temperature without heating or cooling.
Expanding a dead-band produces savings in two ways: it reduces the temperature difference between the set points and the building’s floating temperature, and it reduces the number of hours per year needed for mechanical conditioning. Some of the savings of TAC systems will come from the opportunity to use unconditioned outside air--through economizer or natural ventilation--to satisfy the wider ambient temperature deadbands that TAC enables.
We first examine the building’s annual indoor air temperature distribution in the absence of mechanical heating or cooling. The internal loads, solar load, and required ventilation air changes cause the indoor temperature to float above the outdoor temperature. Figures 42a (Fresno), 42b (Oakland), and 42c (Minneapolis) show outdoor and floating indoor temperatures, along with the temperature dead-bands assumed for TAC-based systems (20 – 28ºC and 18 – 30ºC) and conventional systems (21.5 – 24ºC). The accumulated time when the naturally-occurring indoor temperature is within the TAC dead-bands but outside the conventional dead-band indicates when energy may be saved by TAC systems. In Fresno, the main demand is for cooling and in Minneapolis, it is for heating. In Oakland the overall demand is less, but for this internal-load-dominated building cooling demand is larger than heating.

PAGE 37 COMFORT, PAQ, AND WORK PERFORMANCE IN A LOW-POWER TAC SYSTEM APRIL 2008
Figure 42a. Outdoor air temperature and indoor air temperature (with internal and solar loads but without AC or heating applied) in Fresno
Figure 42b. Outdoor air temperature and indoor air temperature (with internal and solar loads but without AC or heating applied) in Oakland
Hourly indoor air temperature unconditioned Outside dry-bulb temperature
18 - 30¡ É
21.5 - 24¡ É
20 - 28 ¡ É
Hourly indoor air temperature unconditioned Outside dry-bulb temperatureHourly indoor air temperature unconditioned Outside dry-bulb temperature
18 - 30¡ É
21.5 - 24¡ É
20 - 28 ¡ É18 - 30¡ É
21.5 - 24¡ É
20 - 28 ¡ É

PAGE 38 COMFORT, PAQ, AND WORK PERFORMANCE IN A LOW-POWER TAC SYSTEM APRIL 2008
Figure 42c. Outdoor air temperature and indoor air temperature (with internal and solar loads but without AC or heating applied) in Minneapolis
Table 3 gives the number of working hours (8 AM – 6 PM, Monday – Friday) in which the floating air temperature is within each temperature deadband enabled by TAC. Hours within the deadbands would otherwise require mechanical heating or cooling so that they would be within 21.5-24ºC. Fresno and Oakland benefit a great deal from raising the deadband upper limit, but not at all from reducing the lower limit. Minneapolis benefits at both ends. The number of hours outside of the TAC-enabled deadbands is much smaller than within them, with Oakland having the smallest number of hours needing conditioning.
Table 3. Annual working hours (8 AM – 6 PM, Monday – Friday) binned by interior floating temperatures. The total number of working hours in a year is 2613.
Temperature range (ºC) 18 –21.5 24 - 3
<18 or >30
20 - 21.5℃ 24 - 28℃
<20 or >28ºC
Fresno 5 2465 143 6 2344 263
Oakland 1 2576 36 0 2547 66
Minneapolis 774 1566 273 761 1484 368
(C). Seasonal energy consumption calculations
The energy consumption of the conventional and TAC systems is usefully compared on a seasonal basis, to clarify when the performance differs and why. The summer and winter seasons are each 3 months long. The simulation results are presented in Table 4.

PAGE 39 COMFORT, PAQ, AND WORK PERFORMANCE IN A LOW-POWER TAC SYSTEM APRIL 2008
Table 4. Seasonal energy use of the TAC+HVAC system, compared with a conventional HVAC system
System type Fresno Oakland Minneapolis
summer winter summer winter summer winter
Conventional HVAC (kWh) 324,038 169,832 183,174 115,004 238,826 566,956
TAC system, dead-band 18 – 30ºC
Ambient conditioning (kWh) 224,884 51,025 97,197 42,105 141,622 370,641
(% of Conventional HVAC) 69.4% 30.0% 53.1% 36.6% 59.3% 65.4%
Local task conditioning: heating (kWh)
873 30 16,790
(% of Conventional HVAC)
0
0.50%
0
0.03%
0
2.96%
Local task conditioning: cooling (kWh)
13,592 8,239 13,801 10,371 13,801 585
(% of Conventional HVAC) 4.20% 4.90% 7.53% 9.02% 5.78% 0.10%
Local+ambient system (kWh)
(% of Conventional HVAC)
238,475
73.6%
60,136
35.4%
110,997
60.6%
52,506
45.7%
155,422
65.1%
388,017
68.4%
Savings of TAC system versus conventional HVAC
26.4% 64.6% 39.4% 54.3% 34.9% 31.6%
TAC system, dead-band 20 – 28ºC
Ambient conditioning (kWh) 255,564 79,836 116,575 54,775 169,055 422,821
(% of Conventional HVAC) 78.90% 47% 63.64% 47.63% 70.77% 74.58%
Local task conditioning: heating (kWh)
1,023 30 16,880
(% of Conventional HVAC)
0
0.60%
0
0.03%
0
2.98%
Local task conditioning: cooling (kWh)
13,592 5,771 13,801 12,128 13,780 314
(% of Conventional HVAC) 4.20% 3.40% 7.53% 10.54% 5.77% 0.06%
Local+ambient system (kWh)
(% of Conventional HVAC)
269,156
83.1%
86,630
51.0%
130,375
71.2%
66,933
58.2%
182,835
76.6%
440,015
77.6%
Savings of TAC system versus conventional HVAC
16.9% 49.0% 28.8% 41.8% 23.4% 22.4%

PAGE 40 COMFORT, PAQ, AND WORK PERFORMANCE IN A LOW-POWER TAC SYSTEM APRIL 2008
One can see that the TAC-assisted HVAC system uses between 17 to 65% less seasonal energy to maintain its broader dead-bands than the narrower conventional dead-band. The savings come mostly from the ambient HVAC, since the TAC local heating components use less than 3% of the conventional HVAC use, and cooling components less than 11%.
Figure 42 a, b, &c show the extent to which internal and solar loads raise the interior room air temperature above the outdoor air temperature in Fresno, Oakland, and Mineapolis. This indicates that natural ventilation would be beneficial much of the year. We simulated continuous natural ventilation at 2.5 and 4.5 ACH (air change rate per hour) for the Oakland building. Natural ventilation reduced the floating indoor air temperature significantly. Without NV, the hours above 30ºC and 28ºC indoors are 571 and 657, respectively. These numbers are 111 and 235 at 2.5ACH, and 30 and 90 at 4.5 ACH. These numbers represent the time that mechanical air conditioning is needed; with natural ventilation at 4.5 ACH, air conditioning is needed less than 1% of all hours for both TAC 30ºC and 28ºC cooling setpoints. (D). Annual energy savings from TAC systems.
The total annual HVAC consumptions and savings attributed to TAC at the two interior temperature deadbands is presented in Table 5 and 6. The total energy consumption is highest in Minneapolis, middle in Fresno, and lowest in Oakland, due to the difference in severity of the three different climates. The savings are greatest in Oakland’s milder climate, where natural ventilation can be used most frequently. Savings are roughly the same in Fresno and Minneapolis. The numbers in Tables 4 and 5 are different because Table 5 includes all four seasons, whereas Table 4 is for summer and winter only. The transition seasons vary in their effect and importance among the three climates.
Table 5. Annual HVAC energy consumption of TAC system
Annual energy intensity (kWh/m2)
Interior temperature range
Fresno Oakland Minneapolis
18 - 30℃ 34.8 20.7 52
20 - 28℃ 40.8 24.5 60
21.5 - 24℃ 56.1 37.0 85.1
Table 6. Annual HVAC energy saving of TAC system
Annual Saving
Interior temperature range
Fresno Oakland Minneapolis
18 - 30℃ 38% 44% 39%
20 - 28℃ 27% 34% 29%
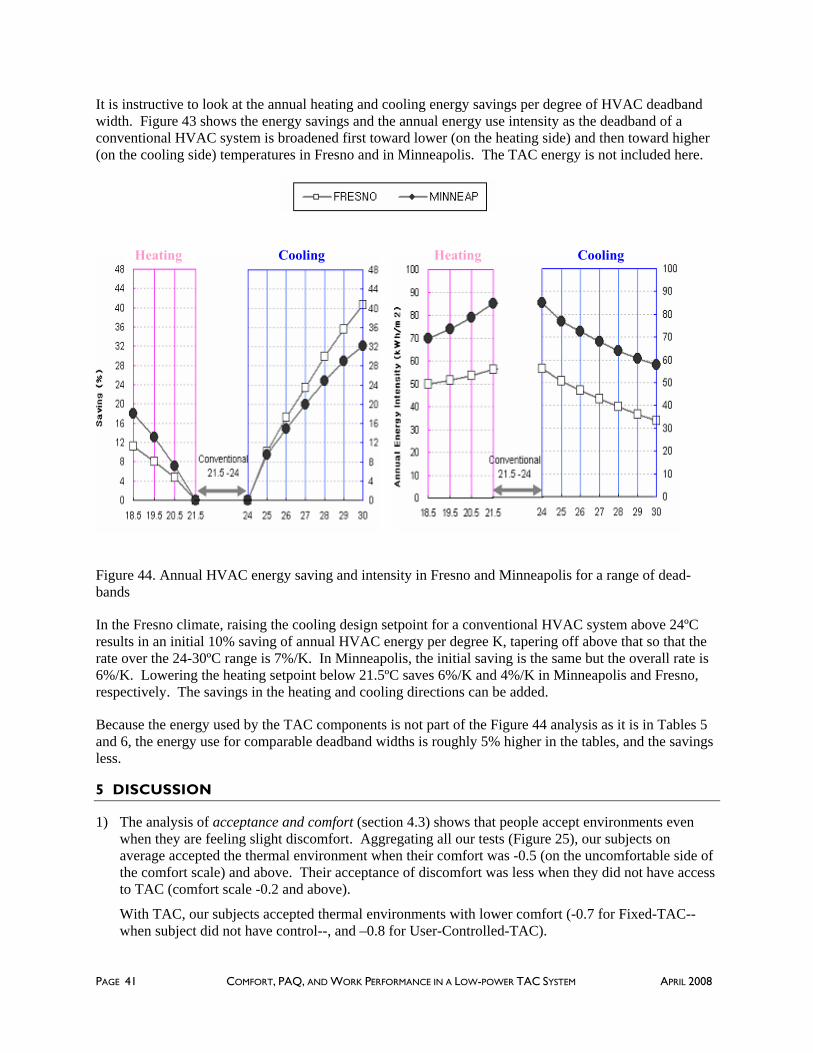
PAGE 41 COMFORT, PAQ, AND WORK PERFORMANCE IN A LOW-POWER TAC SYSTEM APRIL 2008
It is instructive to look at the annual heating and cooling energy savings per degree of HVAC deadband width. Figure 43 shows the energy savings and the annual energy use intensity as the deadband of a conventional HVAC system is broadened first toward lower (on the heating side) and then toward higher (on the cooling side) temperatures in Fresno and in Minneapolis. The TAC energy is not included here.
Figure 44. Annual HVAC energy saving and intensity in Fresno and Minneapolis for a range of dead-bands
In the Fresno climate, raising the cooling design setpoint for a conventional HVAC system above 24ºC results in an initial 10% saving of annual HVAC energy per degree K, tapering off above that so that the rate over the 24-30ºC range is 7%/K. In Minneapolis, the initial saving is the same but the overall rate is 6%/K. Lowering the heating setpoint below 21.5ºC saves 6%/K and 4%/K in Minneapolis and Fresno, respectively. The savings in the heating and cooling directions can be added.
Because the energy used by the TAC components is not part of the Figure 44 analysis as it is in Tables 5 and 6, the energy use for comparable deadband widths is roughly 5% higher in the tables, and the savings less.
5 DISCUSSION
1) The analysis of acceptance and comfort (section 4.3) shows that people accept environments even when they are feeling slight discomfort. Aggregating all our tests (Figure 25), our subjects on average accepted the thermal environment when their comfort was -0.5 (on the uncomfortable side of the comfort scale) and above. Their acceptance of discomfort was less when they did not have access to TAC (comfort scale -0.2 and above).
With TAC, our subjects accepted thermal environments with lower comfort (-0.7 for Fixed-TAC--when subject did not have control--, and –0.8 for User-Controlled-TAC).
Cooling Cooling Heating Heating

PAGE 42 COMFORT, PAQ, AND WORK PERFORMANCE IN A LOW-POWER TAC SYSTEM APRIL 2008
Our TAC system improves comfort in the three important body parts (head, hand, foot) identified by Zhang (2003). Other systems have been designed that impact other body parts. Zhang and Zhao (2008) tested a Fixed-TAC system that provided local cooling to the face, chest, and back. Under test conditions neutral and warmer, using the same sensation, comfort, and acceptance scales, their results show that the threshold of acceptance corresponded to comfort of -0.14 (calculated from the regression equation in the paper). This value is close to our No-TAC result, but not as low as our result with Fixed-TAC. The difference could be that the three local body parts impacted by our TAC design are more effective at influencing people’s acceptance of thermal environments.
2) The thresholds of thermal sensation for acceptance above zero (sensation range –2.2, +2) is slightly wider (0.2 scale units) than the threshold of comfort for acceptance above zero (sensation range -2, +1.8, described in section 4.3). These results in general match the studies from the literature. Data from Gagge et al. (1967; discussed in McIntyre 1980 and Wang et al. 2007) found that sensation –1.5 and 2 are the thresholds ensuring comfort. Wang et al. (2007) found that for keeping comfort above zero, the thresholds for sensation are –1.3 and 1.8. Again, under test conditions neutral and warmer, Zhang and Zhao (2008) show that for acceptance above zero, the threshold for warm sensation is 1.4; for comfort above zero, the sensation threshold is 1.27. Their results agree with ours that the range of thresholds for acceptance is slightly wider than the range of thresholds for comfort.
3) User control. In the more extreme test conditions (18 and 30ºC), there was no significant improvement in comfort with User-Controlled over Fixed-TAC. We were able to select control settings for the TAC system that worked well for our test subjects. This appears to be easier to do when people clearly need warming (at 18ºC) and cooling (at 30ºC). In the less extreme conditions (20 and 28ºC in our test), the degree of heating and cooling appeared to differ among subjects and the User-Controlled TAC was rated more comfortable than Fixed-TAC. This finding does not support the contention that “being able to control” contributes substantially to occupants’ comfort (Bauman et al. 1998) and (Brager (2004). If this were true, we would expect to have seen significant improvements in all our User-Controlled test conditions.
Under neutral conditions, people’s comfort was significantly improved with User-Controlled compared to the No-TAC. However, because our neutral test condition was perceived as slightly warm, the increase in comfort cannot be attributed only to the availability of control.
4) For perceived air quality, Fang et al. (1998) found that PAQ is better in cooler environments. Our data supports this finding only when the environment is neutral to warm. Because our PAQ does not decrease with air temperature from cool to neutral, we cannot conclude that the lower the air temperature, the better the PAQ. Humphreys et al. (2002) found that PAQ is mostly related to thermal comfort. PAQ was the best under neutral conditions. When people preferred to be either warmer or cooler, the PAQ was lowered, with a stronger reduction when people preferred cooler. Our study supports part of this finding by showing a very linear relationship between PAQ and comfort in neutral and warm environment. However, the PAQ decrease as people become cooler than neutral is insignificantly small, which is different from Humphreys’ finding.
5) The results from our study demonstrate that air movement not only provides comfort, it also significantly improves PAQ. How air movement physically affects PAQ is not clear. The air movement might be disrupting the thermal plume around an occupant’s body, or an association with ventilation and outdoor breezes might be causing people to associate perceived air movement with better air quality. It could also be true that the air movement improves comfort, which, as in Humphreys’ finding, might cause people to feel better about the PAQ.
6) Wang et al. (2007) found that 30ºC was the finger temperature threshold below which whole-body cool discomfort begins. Our study found that at finger temperature 30.6 – 32, the whole body and finger experienced the highest comfort.

PAGE 43 COMFORT, PAQ, AND WORK PERFORMANCE IN A LOW-POWER TAC SYSTEM APRIL 2008
7) Although the results are not statistically significant, we did observe that for Sudoku and math tasks, the performance with TAC systems was frequently better than in the neutral condition. In an early study (Arens et al. 2006), we showed that people’s comfort is better under some transient and non-uniform conditions than the uniform neutral condition. From both types of studies, we see that non-uniform or transient conditions do not necessarily reduce comfort and task performance. That is an encouraging sign for the use of non-uniform environments in office environments.
8) Practicality of TAC system. The system tested was designed to be practically feasible in current open-plan office design. However it will be useful to know how great the distance between nozzle and occupant can be. We intend to examine in a new project the performance of such a TAC system with a variety of jet nozzles and throw distances.
6 CONCLUSIONS
1) Comfort was well-maintained at an acceptable level (comfort above 1) in wide range of room temperatures (18 – 30 ºC) by a TAC heating and cooling system. Our ventilation cooling devices seemed to be more effective at improving comfort than our heating devices.
2) The non-uniform environments provided by the TAC devices did not lower the task performance of the occupants. In fact, under some TAC conditions, performance was better than under the neutral condition. Two conditions produced significant improvements in Sudoku and math. Typing showed no significant difference across all the tests.
3) Perceived air quality was significantly improved by providing air motion, even if it was re-circulated room air. The impact from 1 m/s air movement on PAQ was about equivalent to reducing the temperature from warm (28ºC) and hot (30ºC) to a neutral environment at 24.5 ºC. The PAQ decreased with rising air temperature under neutral to warm conditions. It is almost constant from neutral to cool conditions.
4) There was no dry-eye discomfort with the head ventilation device as designed. People accepted the air movement when it was 1 m/s around the breathing zone. People expressed a preference for more air movement in neutral and warm conditions when the TAC devices were off.
5) The acceptable thermal sensation levels were from –2.2 to 2. For maintaining comfort above ‘just comfortable’ (zero), this range is –2 to 1.8.
6) Instead of air-conditioning the entire room to a tight dead-band, the TAC system focuses on the three most influential local body parts, while using HVAC to condition the room to a wider dead-band. This can be done very efficiently compared to conventional systems. For our three test cities, the annual HVAC energy saving is approximately 40% for the wider 18 – 30ºC ambient deadband, and 30% for the narrower 20 – 28ºC one.
7) Natural ventilation design combines well with TAC. NV can by itself provide the TAC space’s wide range of ambient temperatures for a larger number of hours than it can provide the narrow range of interior temperatures required in a conventional HVAC space.
8) A plot of energy use and savings against dead-band width shows the rate of change per degree. In the Fresno climate, raising the cooling design setpoint for a conventional HVAC system above 24ºC results in an initial 10% saving of annual HVAC energy per degree K, tapering off above that so that the rate over the 24-30ºC range is 7%/K. In Minneapolis, the initial saving is the same but the overall rate is 6%/K. Conversely, lowering the heating setpoint below 21.5ºC saves 6%/K and 4%/K in Minneapolis and Fresno, respectively.

PAGE 44 COMFORT, PAQ, AND WORK PERFORMANCE IN A LOW-POWER TAC SYSTEM APRIL 2008
ACKNOWLEDGMENTS
Special thanks to UC Berkeley’s Center for Information Technology Research in the Interest of Society (CITRIS) for allowing us to continue the study, through its NSF ITR Grant # EIA-0122599.
We also thank CBE’s Industry Partners for their support and feedback for this project. Current CBE members (as of April 2008) include:
Armstrong World Industries Arup* California Energy
Commission Charles M. Salter Associates Cohos Evamy CPP EHDD Architecture Engineered Interiors Group Environmental Systems
Design Flack + Kurtz Glumac Haworth
HOK Johnson Controls* KlingStubbins Larson Binkley Pacific Gas & Electric
Company Price Industries RTKL Associates Skidmore, Owings & Merrill Stantec Steelcase Syska Hennessy Group Tate Access Floors*
Taylor Team: Taylor Engineering, CTG Energetics, Guttmann & Blaevoet, Southland Industries, Swinerton Builders
Trane Uponor U.S. Department of Energy* U.S. General Services
Administration* Webcor Builders* Zimmer Gunsul Frasca
Architects
* founding partner
REFERENCES
Arens, E., H. Zhang, C. Huizenga, 2006, “Partial- and whole body thermal sensation and comfort, Part I: uniform environmental conditions”. Journal of Thermal Biology, Vol. 31, 53 - 59.
Arens, E., H. Zhang, C. Huizenga, 2006, “Partial- and whole body thermal sensation and comfort, Part II: non-uniform environmental conditions”. Journal of Thermal Biology, Vol. 31, 60 - 66.
Bauman, F., E. Arens, M. Fountain, C. Huizenga, K. Miura, T. Xu, T. Akimoto, H. Zhang, D. Faulkner, W. Fisk, and T. Borgers. 1994, “Localized thermal distribution for office buildings; Final Report - Phase III.” Center for Environmental Design Research, University of California, Berkeley, July, 115 pp.
Brager, G., G. Paliaga, and R. de Dear, 2004, “Operable windows, personal control and occupant comfort.” ASHRAE Transactions, Vol. 110 (2), June.
Fang, L., Clausen, G, and Fanger, P.O. 1998, “Impact of temperature and humidity on the perception of indoor air quality during immediate and longer whole-body exposure”. Indoor Air, Vol. 8, 276-284.
Gagge AP, Stolwijk JA, Hardy JD. 1967, “Comfort and thermal sensations and associated physiological responses at various ambient temperatures”. Environmental Research, Vol. 1, 1–20.
Griffiths, I.D. 1990, “Thermal comfort in buildings with passive solar features: field studies”. Reports to the commission of the European communities ENS3S-090-UK, Department of Psychology, University of Surrey, GU2 5XH, UK, Pp123.
Goins, J., 2007, “Productivity and IEQ satisfaction”, CBE TechNote, Center for the Built Environment, October.
PAGE 45 COMFORT, PAQ, AND WORK PERFORMANCE IN A LOW-POWER TAC SYSTEM APRIL 2008
Hedge, A. 2004, “Linking environmental conditions to productivity”. Eastern Ergonomics Conference and Exposition, June 2004
Humphreys, M.A., Nicol, J.F. and McCartney, K.J., 2002, “An analysis of some subjective assessments of indoor air-quality in five European countries”. Indoor Air 2002: Proceedings of the 9th International Conference on Indoor Air Quality and Climate Vol. 5, 86-91, ed H. Levin, Indoor Air 2002, Santa Cruz, USA ISBN 0-9721832-0-5
Huizenga, C., S. Abbaszadeh, L. Zagreus and E. Arens, 2006, “Air quality and thermal comfort in office buildings: results of a large indoor environmental quality survey.” Proceedings, Healthy Buildings 2006, Vol. 3, 393-397, Lisbon, Portugal, June.
McIntyre DA. 1980, Indoor climate. London: Applied Science Publishers
Niemela, R., M. Hinnula, K. Reijula, and J. Railio, 2002, “The effect of air temperature on labour productivity in call centers – A case study”. Energy and Buildings, Vol. 34 (8): 759 – 764.
Pejtersen, J., AK Blangsted, K Søgaard and P Wolkoff, 2005 , “The measurement of eye symptoms: a pilot study’. Proceedings of Indoor Air, Beiling.
Tham KW and HC Willem, 2004, “Temperature and ventilation effects on performance and neurobehavioral-related symptoms of tropically acclimatized call center operators near thermal neutrality’. ASHRAE Transactions.
Tanabe, S. and N. Nishihara, 2004, “Productivity and fatigue’. Indoor Air, Vol. 14 (suppl 7): 126 – 133.
Wang, D., H. Zhang, E. Arens, C. Huizenga, 2007, “Time-series observations of upper-extremity skin temperature and corresponding thermal sensations”. Building and Environment, Vol. 42 No. 12, 3933 – 3943.
Wolkoff P, Nojgaard J K, Troiano P, and Piccoli B (2005), “Eye complaints in the office environment: precorneal tear film integrity influenced by eye blinking efficiency”, Occupational and Environmental Medicine, 62, 4–12.
Wyon, N.M. and Wyon, D. (1987), “Measurement of acute response to draught in the eye”, Acta Ophthalmologica, 65, 385 – 392
Zhang, H. 2003, “Human thermal sensation and comfort in transient and non-uniform thermal environments”. Ph. D. Thesis, CEDR, University of California at Berkeley, 415 pp.
Zhang, H., E. Arens, S. Abbaszadeh, C. Huizenga, G. Brager, G. Paliaga, and L. Zagreus, 2007. “Air movement preferences observed in office buildings.” Int J Biometeorol Vol. 51, 349–360
Zhang, Y. and R. Zhao, 2008, “Overall thermal sensation, acceptability and comfort”. Building and Environment, Vol. 43, 44 – 50.