Conference Theatre Day One - 6 July
321
UK AD & BIOGAS TRADESHOW 6-7 JULY 2016 NEC BIRMINGHAM
-
Upload
gayle-brandon-kirby-mcipr -
Category
Environment
-
view
243 -
download
2
Transcript of Conference Theatre Day One - 6 July
UK AD & BIOGAS
TRADESHOW
6-7 JULY 2016NEC BIRMINGHAM

WELCOME AND
INTRODUCTION
BUILDING A WORLD CLASS AD INDUSTRY
CHARLOTTE MORTONADBA CEO
IAN FARRHEAD OF SALES – BIOGAS , EDINA GROUP

DRIVING WORLD CLASS PERFORMANCE:
LAUNCHING AN INDUSTRY BEST PRACTISE
SCHEME
CHARLOTTE MORTON, ADBA CEO
JESS ALLAN, ENVIRONMENT AND REGULATION MANAGER, ADBA
FRAN LOWE, ENVIRONMENT AND BUSINESS MANAGER, ENVIRONMENT AGENCY
CARL GURNEY, RENEWABLE ENERGY DIRECTOR, JELF INSURANCE BROKERS
DAVID WOOLGAR, DIRECTOR OF TECHNOLOGY, BIOGEN
AMAYA ARIAS-GRACIA, TECHNICAL DIRECTOR, GOALS PROJECT MANAGEMENT &
ENGINEERING SUPPORT

BEST PRACTICE SCHEME
FOR AD
JESS ALLANENVIRONMENT AND REGULATION MANAGER
AMAYA ARIAS-GARCIATECHNICAL DIRECTOR (GOALS PROJECT MANAGEMENT AND ENGINEERING)

Overview
• Aims
• Industry Engagement
• Steering Group
• Delivery Plan
• Best Practice Checklists
• Next Steps
• Get Involved

Aims
The Best Practice Scheme aims to help the industry to:
• Improve environmental performance.
• Improve safety performance.
• Improve operational performance.

Industry Engagement
• Member survey
• Steering Group
• Operator Groups
• Working Groups
• Stakeholder Meeting – May 2016
• Updates at ADBA events – Regulatory Forum, Members Meeting

Steering Group
Chaired by Amaya Arias-Garcia (Goals-PME)ADBA
Chartered Institute of Wastes Management (CIWM)
Chartered Institute of Water and Environmental Management (CIWEM)
CNA Hardy (insurer)
Country Land and Business Association (CLA)
Energy Networks Association (ENA)
Environmental Services Association (ESA)
Institute of Chemical Engineers (IChemE)
Jelf (insurance broker)
NFU
NFU Cymru
NFU Scotland
Renewable Energy Association (REA)
Water UK
WRAP
Zero Waste Scotland
Plus input from regulators:
APHA, EA, HSE, NRW, SEPA

Steering Group Conclusions
• Priority topics identified included: odour management, containment, digestate quality,
risk management, training and competence.
• Scheme should improve awareness of existing guidance, standards and legislation
and make it more accessible.
• Checklists were proposed as a first step towards a certification scheme.

Delivery Plan
Step 2: Best Practice Certification Scheme
(July 2017)Develop a certification scheme, informed by the
checklists.
Step 1: Best Practice Checklists
(July 2016)Develop a series of Best Practice checklists which bring together regulations, guidance,
standards relating to best practice.

Best Practice Checklists
• Checklist-style guides on key topics identified through industry engagement:
Operational Performance
Risk Management
Procurement
• Raise awareness of existing guidance, regulations and standards that contribute to
best practice.
• Collate guidance to make it more accessible.
• Provide a foundation for a certification scheme.

Risk Management
• Covers identifying and managing risks to:
- Health and safety
- Environment
• Explains benefits of effective risk management.
• Promotes instilling risk awareness for all individuals involved in operating a plant,
from senior management to site operatives and contractors.
• Encompasses risk management at different stages of an AD project.

• Guide to making procurement decisions for items of plant, equipment or
machinery, and services such as maintenance contracts.
• Focuses on ensuring:
- Compliance with legislative requirements
- Safety and environmental protection
- Suitability for intended purpose
- Cost-effectiveness
Procurement

Operational Performance
• Focuses on identifying and overcoming barriers to good performance.
• Features guidance and tips on:
- Monitoring operational performance
- Ensuring competence
- Managing digester biology
- Understanding feedstock
- Making the most of digestate

Next Steps
• July 2016 – end year
• Will be seeking feedback andactively engaging with individualorganisations and working groups.
Test the checklists
• July 2016 – throughout 2017
• Will entail devising suitableassessment criteria, working withUKAS and third party accreditationbodies.
Design the certification
scheme
• Intention is to start from summer 2017
• Will be looking for operators to helpus pilot the scheme.
Pilot the certification
scheme

Get Involved
• Stakeholder Meeting – this afternoon (15:00, Piazza Suite)
• Food Waste Operator Group
• Crop Operator Group
• Training, Safety and Environment Working Group
• Finance Forum
• Visit ADBA website
• AD & Bioresources News
• ADBA events
• Get in touch with Jess

Industry Best Practice Scheme for AD- an Environment Agency perspective
UK AD & Biogas 2016
Fran Lowe – Environment & Business Manager

The Environment Agency
Established in 1996 to:protect and improve the environment
promote sustainable development, using resources wisely
Main roles, environmental:regulator – scrapyards to nuclear power stations, farms to fishing licences, main regulator for waste-fed AD
operator – managing flood risk, responding to emergencies
advisor – independent, to Govt, LAs & others

The Environment Agency and AD
AD was a newly emerging industry (non water UK) in 2010 when we introduced standard rules for AD
AD often the best environmental option for certain biowastes
We have continued to support the growth of AD through appropriate regulation:
that reflects both risks and benefits to the environment
isn’t unnecessarily burdensome
is responsive to new developments and issues
20

What and how we regulate AD
Determine environmental permit applications and assessing compliance/enforcing against issued permits
Various types of environmental permits for waste-fed AD plants and combustion of biogas – on-farm, merchant, standard rules and bespoke, waste operations and installations
Light touch regulation - registered exemptions for smaller scale waste-fed facilities and RPS
Sewage sludge AD at STWs – currently only permit biogas combustion and co-digestion AD plants
Crop-fed and other non-waste AD plants – don’t currentlyregulate
21

Pollution incidents at permitted AD sites
The biowaste treatment sector has had the highest proportion of serious and
significant pollution incidents of any sector we regulate and AD has been the worst
performer.
22Anaerobic digestionCompostingTreatmentWWTW
2.6 3.7 9.0 21.9Pollution incidents per 100
permits for 2013,
3 year average of serious pollution incidents, by sector and normalised per 100 permits in the sector
Number of incidents
Number per 100 permits
All other FAR Sectors not shown have a 3 year average of 0.7 incidents per 100
permits or less and fewer than 15 incidents in total
70 6 9 3 0.3 0.3 54 1 33 6 2 0.3 43
0.3 0.8 0.8 0.9 1.0 1.1 1.3 1.4 1.5 1.6 1.9 2.6 7.0
3 y
ear
avera
ge 2
012 -
2014Most of these have been preventable – causes can be grouped under poor design,
construction, maintenance or management/competence
Best Practice Scheme
Promotes well built, well-managed, profitable AD plants
Helps improve the environmental performance of the AD industry, giving confidence to the public, investors and insurers, supporting further growth of AD
Complements our permitting approach for those sites we do regulate – permit conditions largely focus on the outcomes to be achieved, NOT How
We no longer produce comprehensive guidance on the ‘how to’ elements – a role for industry, best practice will help to fill the gaps; covering areas outside our remit
Help new entrants go into AD with their eyes wide open!
23

Best Practice scheme
Whole heartedly support the introduction of this new scheme
It is much needed
Phase 1 is a great start and we await phase 2 with anticipation
24

Best Practice from an Insurers Perspective
Carl Gurney
Renewable Energy Director
Jelf Group

Best practice | Page 26
over £3.7 million paid out in claims over the last 3 years
Environmental claims in excess of £800K over last 18 months
Continuing incidents means premiums will continue to rise and insurers will, if not already, pull out of the market
Claims and insurance industry trends

Best practice | Page 27
Continuing Claims
Poor Practice
No insurance
& no investment
Claims and insurance industry trends

Best practice | Page 28
Causes of
claims
Operator error
Poor design
Over foaming
Poor upkeep
Storms
Claims

Best practice | Page 29
Best practice
Best practice
ADBA guidance
Insurer involvement
Investor and stakeholder confidence
Better ROI

Best Practice Scheme
Insurer / Investor /
Stakeholder Confidence
Industry growth (safely!)
Best practice | Page 30
Conclusion

Food waste to renewable energy 31
ADBA Best Practice Guidance
David Woolgar

Food waste to renewable energy 32
Introduction
• David Woolgar Director of
Technology at Biogen
• Responsible for design and
commissioning farm, crop and
foodwaste plants over the past
10 years
• The best practice guidance is
based on ADBA colleagues
sharing the pain and learning
• Highlight very quickly some key
topics. Come back with
questions

Food waste to renewable energy 33
Specification
What do you want the plant to do
• Feedstocks – what types, how much, storage, processing
• Plant construction – tanks, pipework, buildings
• Gas usage – CHP, Heat, Biomethane
• Digestate usage – liquid, solid, biofertiliser, treatment
• Regulation – EA, Ofgem

Food waste to renewable energy 34
UK Legislation
UK legislation is specific
• EU suppliers may not be familiar with UK
legislation.
• England, Scotland, Wales and NI have different
rules.
• CE marked equipment meets harmonised
standards.
• Owner is responsible for compliant site

Food waste to renewable energy 35
Gas Safety
ATEX
ATEX is the overall EU regulation.
DSEAR
DSEAR is the UK regulation and covers defining
hazardous zones and formal risk assessment.
BS EN 60079
International standard covering definition of
hazardous zones and the design and installation of
appropriate equipment.
IGEM Guidance
There is not a lot of specific legislation or guidance
for biogas pipework design, however IGEM natural
gas guidance is applicable. There is specific
guidance for biomethane pipework
These are areas where expert advice is
recommended

Food waste to renewable energy 36
Lightning Protection
Lightning protection
Recent photos in press about AD plant that was struck by
lightning.
Key is good earth path from strike point
Guidance in BS 62305 – specialist area
Earthing
Earthing generally is important
for personnel safety and for plant safety
Not just the power circuits but the structures and pipework

Food waste to renewable energy 37
Maintenance
Maintenance
The AD plant will be working hard and will require to be
maintained. Most equipment suppliers will provide
training on their equipment. Develop a maintenance
schedule
Critical spares
These are items required for safe, compliant and
effective operation of the AD plant.
Identify key items, know how to get them quickly
Consider holding spares on site.

Food waste to renewable energy 38
Thank You
www.biogen.co.uk

QUESTIONS AND COMMENTS FROM THE FLOOR

CIRCULAR SOLUTIONS FOR
GLOBAL CHALLENGERS
THE FIFTH CARBON BUDGET AND THE
POLICIES NEEDED FROM THE UK
GOVERNMENT TO MEET IT
DR DAVID JOFFETEAM LEADER: BUILDINGS & INDUSTRY, COMMITTEE ON CLIMATE CHANGE

41
The fifth carbon budget and the policies needed from the UK
government to meet it
Dr. David Joffe
ADBA Conference
6 July 2016

42
The Climate Change Act sets a framework to drive change
Requirement that Government brings forward policies
Committee on Climate Change to monitor progress and suggest
changes
Carbon budgets
2050 Emissions Target
A toolkit
A monitoringframework
A pathway
A goal1
2
3
4
The Climate Change Act

43
The Committee recommended for the fifth carbon budget (2028-32) that emissions fall by 57% vs. 1990, on the path to a reduction by 2050 of at least 80% - the Government has accepted this

44
Progress reducing emissions since 2012 has been almost entirely due to the power sector

45
Electricity
Buildings
Transport
Industry
Non-CO2
Aviation & shipping
45
Further expansion and decarbonise mid-merit/peak
Low-carbon electrified heatCommercial Residential Hard-to-treat
Roll out low-carbon vehicles to fleet
More on-farm measures, F-gases, reduce waste and improve diet?
Efficiency
Decarbonise baseload
EV penetration up;Early H2 adoption
Efficiency
CCS, electrification and other fuel switching? Product substitution?
Efficiency
Efficiency on farms, divert waste from landfill
Operational measures, new plane/ship efficiency, whilst demand grows (though possibly constrained)
The broad story behind our scenarios to 2050
2010s 2020s 2030s 2040s
46
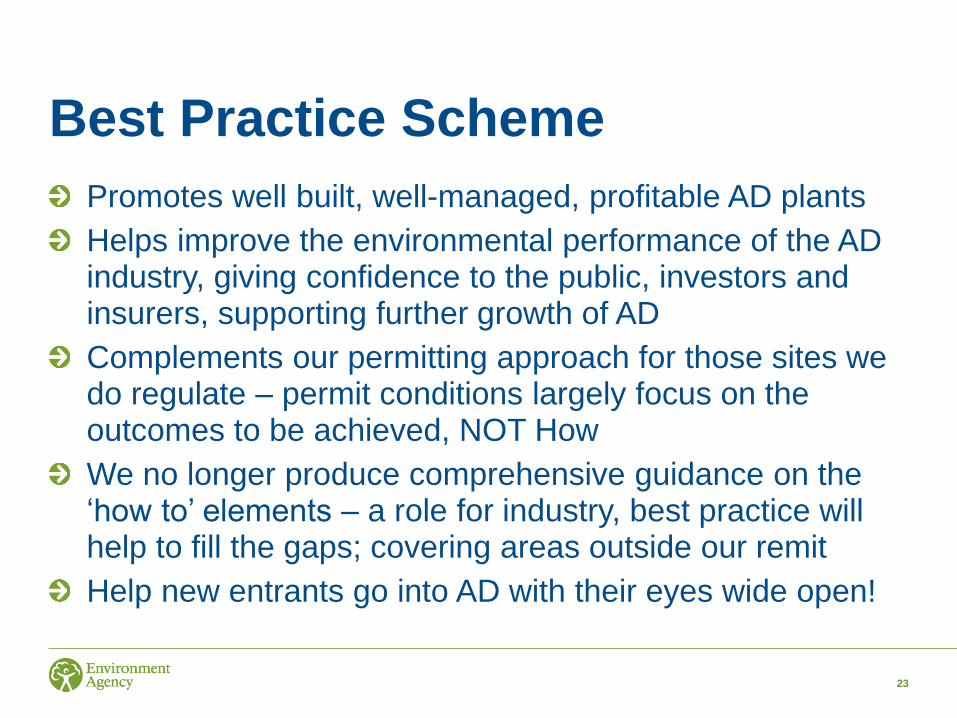
Budget requires action by government, businesses and households – action that is easier the earlier it starts.
heat networks, heat pumps, etc
Insulation, efficiency & behaviour change
By 2030s: 1 in 7 homes, half of public and commercial use, low-carbon heat
Further conventional fuel efficiency improvement
By 2030 around 60% new cars & vans electric (hybrid or full)
Travel behaviour change: mobility choices, driving styles
Options: wind, nuclear, CCS, interconnection, gas, storage
Demand-side behaviour
By 2030s: <100 g/kWh, smart demand
Adjusting industrial processes, energy efficiency, heat recovery
Development of CCS
Through 2020s: apprx. 1%/yr fall emissions from measures
efficient fertiliser use, animal diets, breeding, fuel efficiency
Through 2020s: apprx. 1%/yr decrease emissions
All main biodegradable waste diverted from landfill, alternatives to F-gases
By 2030s: apprx. 50% decrease emissions from today

47
Assessment of current policies against the cost-effective path to meet carbon budgets and the 2050 target

48
Why is there a policy gap?
In part the policy gap reflects mixed progress in developing the policy framework in those areas in the last year:
– Some areas have progressed, for example: funding available for offshore wind has been extended to 2026, for renewable heat to 2020/21 and for electric vehicles to 2018.
– There have been backward steps in other areas: cancellation of the Commercialisation Programme for carbon capture and storage (CCS), a reduction in funding for energy efficiency and cancellation of the zero carbon homes standard.
– Other priorities have not moved forward: no further auctions have been run or planned for the cheapest low-carbon generation (e.g. for onshore wind and solar in windy/sunny sites that are locally acceptable), there is no action plan for low-carbon heat or energy efficiency and there are no vehicle efficiency standards beyond 2020.
Given the need for progress across the economy, it is important that policy gaps are addressed in all areas.

49
Priority areas (1): Low-carbon heat

50
Priority areas (2): Transport through the 2020s

51
Priority areas (3): Power – carbon capture and storage and mature low-carbon generation

52
The Committee has a full work programme over the coming months
Post-Paris: net zero emissions and well below 2ºC
Deep dive on heat and energy efficiency, including consideration of the future of the gas grid
Implications of Brexit for the policy framework [may not be a stand-alone report]
Land use and agriculture – opportunities for climate adaptation and mitigation

53
Thank you for your attention

QUESTIONS AND COMMENTS FROM THE FLOOR

WHAT WILL BREXIT MEAN FOR BIOGAS?
MATT HINDLE, HEAD OF POLICY, ADBA
CHRIS HUHNE, STRATEGIC ADVISOR, ADBA
DAVID NEWMAN, PRESIDENT, ISWA
JONATHAN SCURLOCK, CHIEF ADVISOR, RENEWABLE ENERGY AND CLIMATE
CHANGE, NFU
NICHOLAS WHYTE & JULIE KJESTRUP, APCO WORLDWIDE
STUART HAYWARD-HINGHAM, TECHNICAL DIRECTOR, SUEZ

Brexit: the fall outThe implications of the 23 June 2016 referendum
UK AD & Biogas, Birmingham, 6 July 2016
Chris Huhne, Strategic Adviser, ADBA


Overview
Political uncertainty
Policy uncertainty
Economic uncertainty
What next?

Uncertainty and resolution
Political uncertainty over UK leadership and
policy options will slowly clear
Policy uncertainty could continue for some
time, as it depends on EU partners too
Recession likely, though more modest than
1992 or 2008
But AD is an essential part of domestic and
EU policy goals
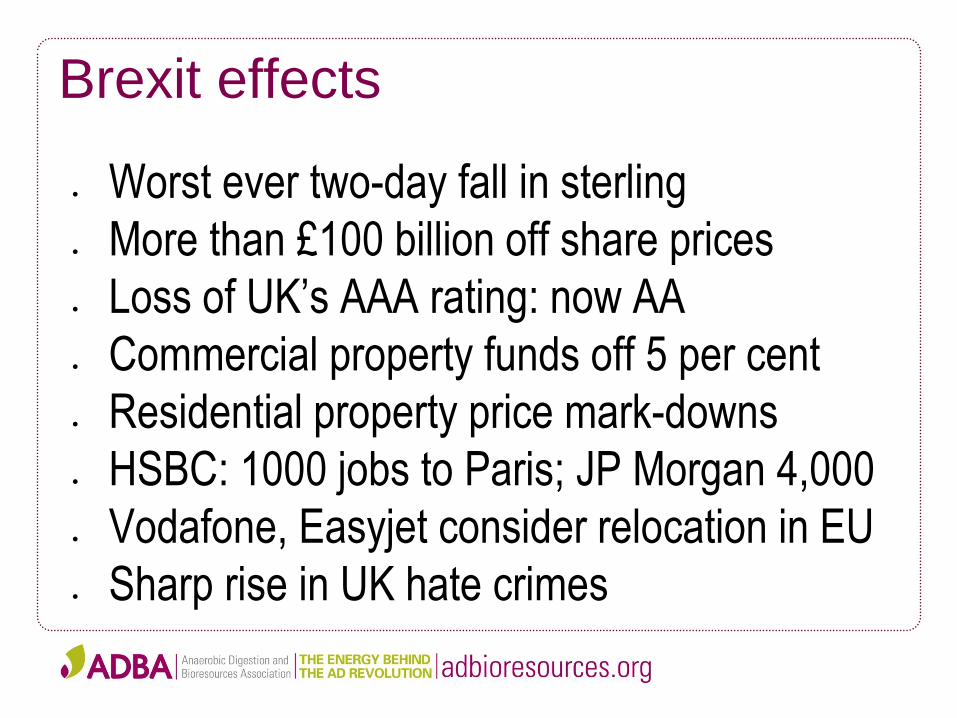
Brexit effects
Worst ever two-day fall in sterling
More than £100 billion off share prices
Loss of UK’s AAA rating: now AA
Commercial property funds off 5 per cent
Residential property price mark-downs
HSBC: 1000 jobs to Paris; JP Morgan 4,000
Vodafone, Easyjet consider relocation in EU
Sharp rise in UK hate crimes

Sterling’s worst ever fall

Sterling volatility over time

British politics and Article 50
Continuity or radicalism? Theresa May is
continuity. Andrea Leadsom is safer Brexiteer.
Michael Gove is the radical.
Everyone will say respect the referendum, but
range of possible outcomes is EU membership
and Norway (limited immigration control) to WTO
(and full immigration control)
May knows more net immigration is from outside
the EU (188,000 last year) than inside (184,000)

Short-term: economic pressure
Average forecast for growth in 2017 down from 2.1
per cent to 0.3 per cent: recession by year end
Boards will defer investment, consumers defer big-
ticket spending, until outlook is clearer
Fall in pound to 31-year lows against dollar will
raise import prices and cut real incomes
Historic payments deficit of nearly 7% of GDP
Sterling constrains Bank of England rate freedom
AD? Public finance threat to RHI

Long-term: trade uncertainty
Half of UK trade with EU: trade determined by
distance and income
Best case: EEA/EU access to single market
Worst case: CET of 6.7% (+2% admin)
This matters to AD because of living standards
and the public finances (eg Renewable Heat
Incentive)
Openness also determines productivity growth
But most Brexit voters wanted barriers, not
openness

Single market boosts UK trade

Trade means lower prices

Timing
Speed resolves uncertainty, but may worsen long-
term outcome for the UK. Allow tempers to cool.
EU position: conclude two years of article 50
negotiations on withdrawal BEFORE trade deal
EEA/EU access only with free movement of labour
Uncertainty could last for 9 years (2 + 7) on
Canadian precedent
Can Germany, Scandinavia and Visegrad speed it
up and find more concessions on free movement?

Effects on AD deployment
AD could lose support of EU renewables target (15
per cent of UK’s PEC in 2020)
Waste directives also in the air
Fiscal weakness limits capacity to fund Renewable
Heat Incentive
Legislative overload of Whitehall
But fifth carbon budget is agreed, and in principle
provides a similar framework to EU targets

Favourable view of EU: contagion?

Summary
Business needs speed, but politics cannot deliver
British politics looks unstable and juvenile: House
of Cards meets Game of Thrones
Likely recession will increase Brexit remorse
Possible disintegration of EU: see bond markets
Limited room for EU fudge for fear of populism
Norway (40%), EU (20%), or WTO (40%)?
Economics is not a zero-sum game: all can lose

QUESTIONS AND COMMENTS FROM THE FLOOR

THE GLOBAL DRIVERS
FOR AD
ENERGY SYSTEMS-HOW BIG COULD ADS
ROLE BE?
CHRIS HUHNE, STRATEGIC ADVISOR, ADBA
HENRY FERLAND, CO-DIRECTOR, GLOBAL METHANE INITIATIVE
SECRETARIAT
MIKE MASON, CHAIRMAN, TROPICAL POWER

THE GLOBAL DRIVERS FOR
AD
WHERE DOES AD FIT IN THE FUTURE
GLOBAL ENERGY SYSTEMS?
CHRIS HUHNESTRATEGIC ADVISOR, ADBA

The future for biogasThe global and UK role for anaerobic digestion
UK AD & Biogas, Birmingham, 6 July 2016
Chris Huhne, Strategic Adviser, ADBA

Overview
COP 21 and 5th
carbon budgetTargets will
tighten
Short term problems,
long-term gains
Most important roles
for biogas

Paris COP 21
Goal is “well below” 2º warming and hope for 1.5º
Business as Usual is estimated at 3.6º to 4.5º
Estimated INDCs varies from 2.7º to 3.5º if fully
implemented
COP21 is a process, not a destination
So was 1987 Montreal Protocol on CFCs: first hard
evidence last week that ozone hole is closing
We do not have time: 5 to 10 years maximum
No silver bullet: need many actions to attain goal

EU carbon price since Paris

UK Climate Change Act
Climate Change Act 2008 mandates 80% cut in
emissions by 2050 (from 1990 levels)
Fifth carbon budget (2028 to 2032) recommended
by CCC in November: 1.725 MtCO2e
Acceptance by HMG on 30th June 2016
Demanding target assessed in annual reports by
independent Climate Change Committee
But any Act can be repealed and amended...

UK carbon emissions and targets...despite income drops

UK carbon emissions by sector

The benefits of biogas
Biogas turbines can generate electricity when and
where needed (despatchable power)
Power can be for baseload or for peak-lopping
Biogas in the grid can be stored cheaply through
pressure changes
Green biogas can be used in heating from grid
without retiring equipment
Biogas is one low carbon solution for HGVs
AD can help to decarbonise agriculture

Short term problems
EU target of 15% of energy consumption from
renewables by 2020 will no longer operate in UK
Major uncertainty for renewables organisations as
much less direct link with outcomes
Waste directives are EU law (like much else in the
environment)
DECC was relying on interconnectors to import
power: may be more difficult

Look at the alternative uses
Transport
Electricity generation (power)
Heat
Agriculture (either heat or power or both)
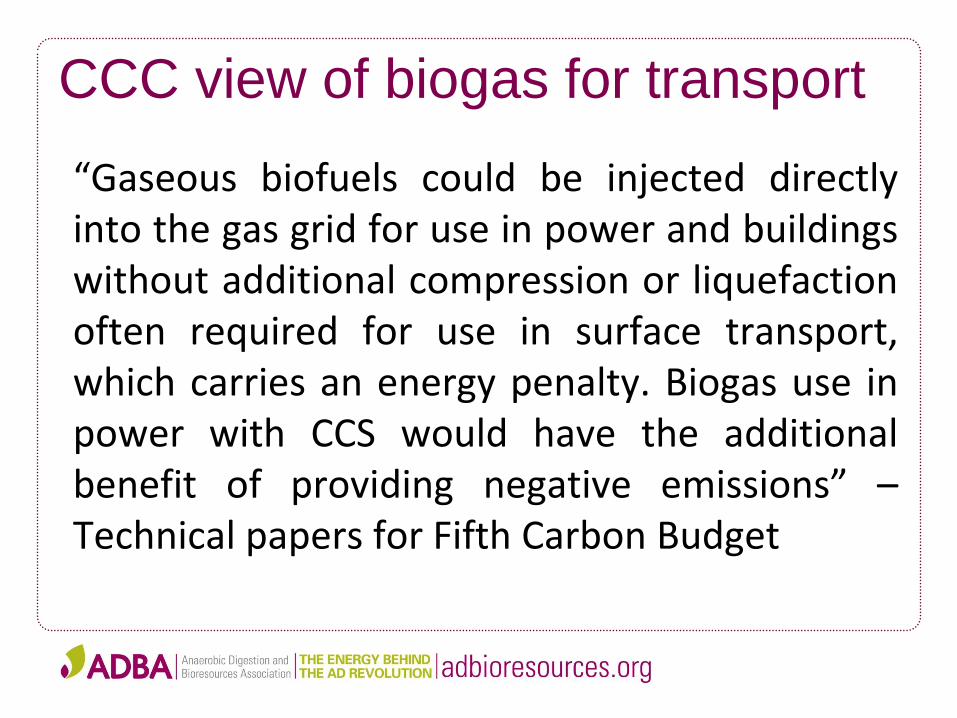
CCC view of biogas for transport
“Gaseous biofuels could be injected directlyinto the gas grid for use in power and buildingswithout additional compression or liquefactionoften required for use in surface transport,which carries an energy penalty. Biogas use inpower with CCS would have the additionalbenefit of providing negative emissions” –Technical papers for Fifth Carbon Budget

Remember the competition: solar
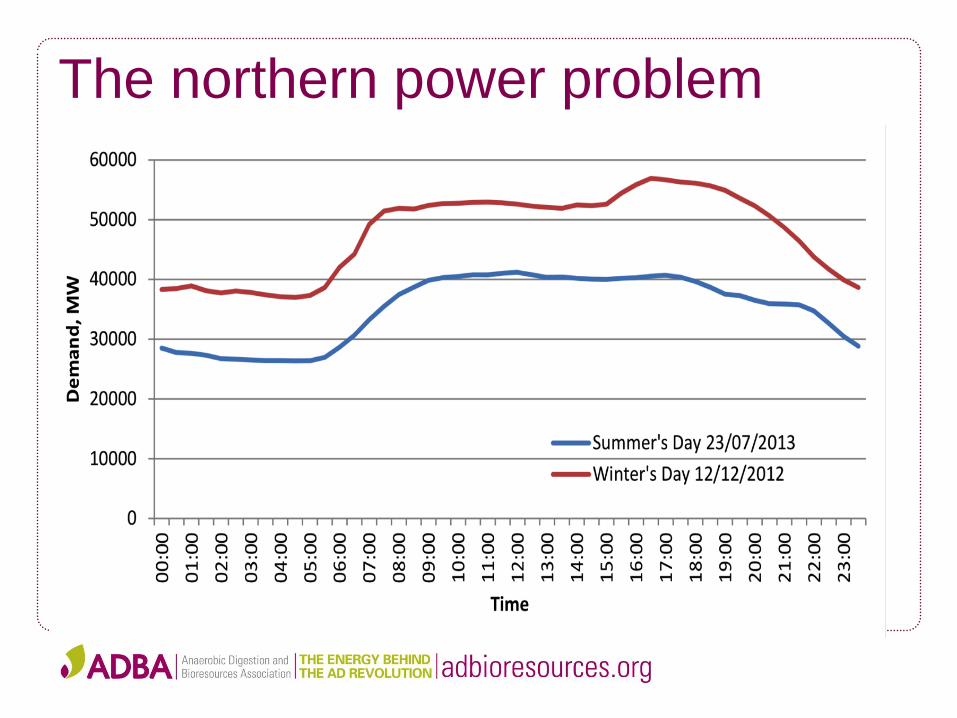
The northern power problem
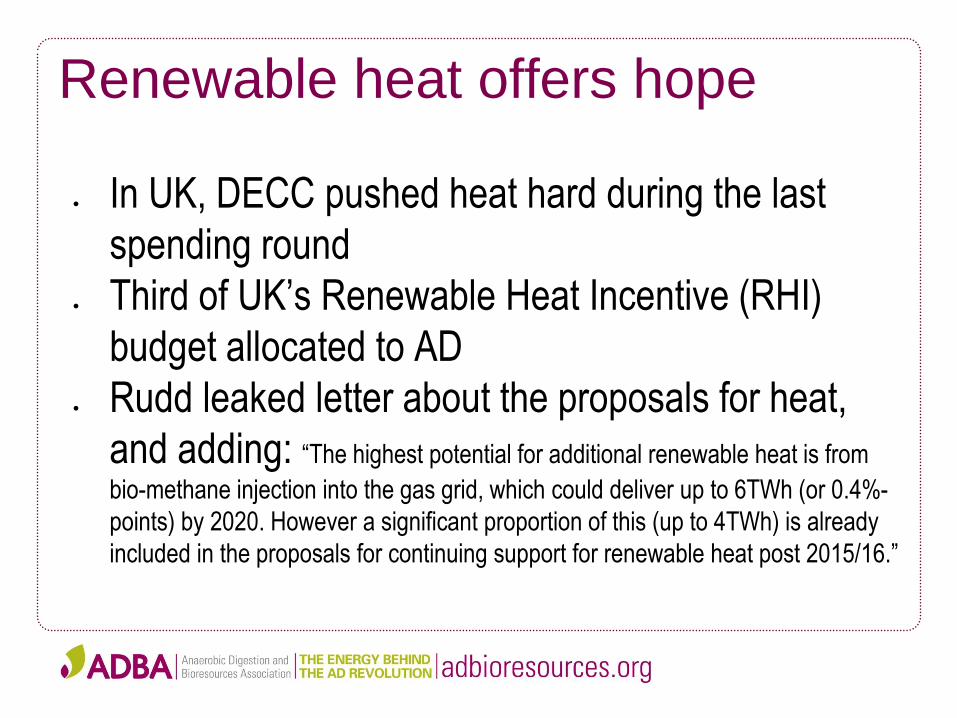
Renewable heat offers hope
In UK, DECC pushed heat hard during the last
spending round
Third of UK’s Renewable Heat Incentive (RHI)
budget allocated to AD
Rudd leaked letter about the proposals for heat,
and adding: “The highest potential for additional renewable heat is from
bio-methane injection into the gas grid, which could deliver up to 6TWh (or 0.4%-
points) by 2020. However a significant proportion of this (up to 4TWh) is already
included in the proposals for continuing support for renewable heat post 2015/16.”

UK case: agriculture
GHG from agriculture are 9.5% of total (2013)
Joint work with CCC and Irish equivalent (40%)
Projected fall from 53.5 MtCO2e in 2013 to 46
MtCO2e in 2030
2 MtCO2e from livestock diet, health and breeding
1.3 MtCO2e from manure management, energy
efficiency and on-farm AD
2.7 MtCO2e from cuts in N2O from crops through
better or less nitrous fertiliser

AD: making progress Ministers want farm decarbonisation, but
restrictions on crop AD
Third of RHI budget to AD
Movement on tariff guarantees
Increase in biomethane tariff
AD is always in MACC curves
But big uncertainties – EU renewables
targets for 2020, EU waste law, policy resets,
abolition of CCA

AD capacity in the UK
0
100
200
300
400
500
600
700
800
900
1000
2006 2007 2008 2009 2010 2011 2012 2013 2014 2015 2016 2017 2018
MW
e-e
Projected cumulative electrical-equivalent (electrical plus biomethane) capacity
Actual Projected 'High' Projected 'Low'

THE GLOBAL DRIVERS FOR
AD
UTILISING METHANE FOR ENERGY AND
MAXIMISING CARBON ABATEMENT
HENRY FERLANDCO-DIRECTOR, GLOBAL METHANE INITIATIVE SECRETARAIT

93
Global Methane Initiative Reducing Global Methane
Emissions – Biogas Approach
Henry Ferland, Co-Director of GMI
Administrative Support Group
UK AD & Biogas – July 6, 2016

94
Why Methane Matters

95
Mitigation Benefits

96
Targeted Sectors
GMI-targeted sectors contribute more than half of total global
methane emissions.

97
Partners
98
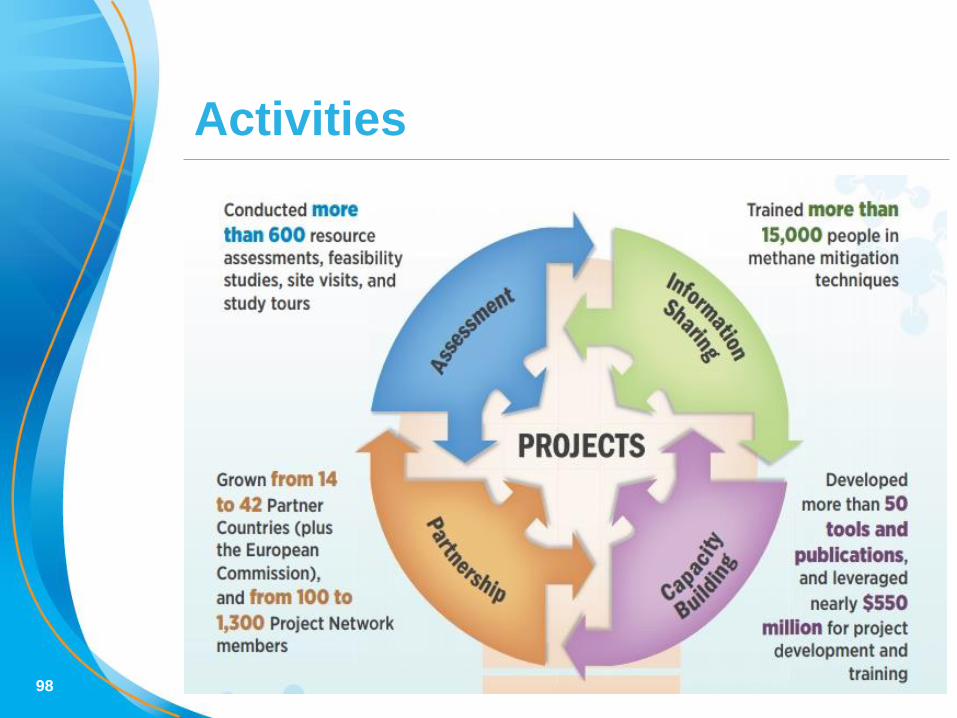
Activities

99
By 2017, GMI-supported projects are projected to yield
cumulative methane emission reductions of more than 430
MMtCO2e.
Accomplishments
MMTCO2e = Million metric tons of carbon dioxide equivalent, with methane GWP = 25
100
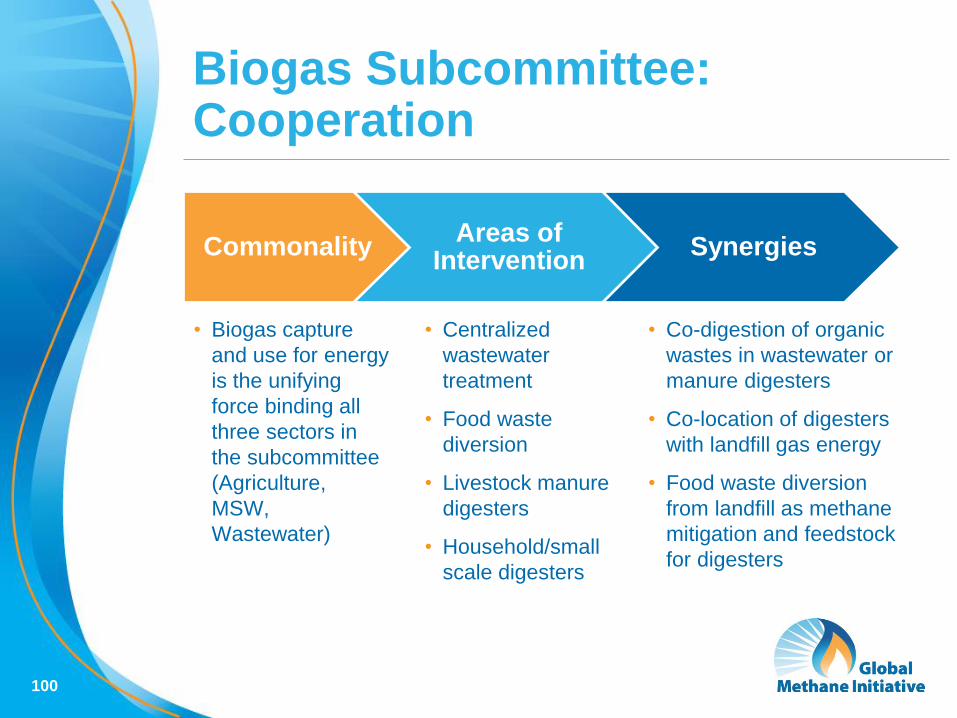
Biogas Subcommittee: Cooperation
CommonalityAreas of
InterventionSynergies
• Biogas capture
and use for energy
is the unifying
force binding all
three sectors in
the subcommittee
(Agriculture,
MSW,
Wastewater)
• Centralized
wastewater
treatment
• Food waste
diversion
• Livestock manure
digesters
• Household/small
scale digesters
• Co-digestion of organic
wastes in wastewater or
manure digesters
• Co-location of digesters
with landfill gas energy
• Food waste diversion
from landfill as methane
mitigation and feedstock
for digesters

101
Biogas Subcommittee:Sector Sources of Methane
Agriculture Municipal Solid Waste Municipal Wastewater
Livestock waste
management:
Anaerobic
management
of manure
• Anaerobic
decomposition of
organic waste
portion of municipal
solid waste
• Anaerobic
decomposition of
wastewater during
collection, handling,
and treatment.

102
Biogas Subcommittee:Sector Methane Reductions
Agriculture Municipal Solid Waste Municipal Wastewater
• Managing manure in
anaerobic digesters
or covered lagoons.
• Modifying how the
waste is treated, for
example:• Diverting organic
waste from
landfills to
anaerobic
digestion.
• Diverting organic
waste to
composting.
• Collecting landfill
gas and using it as
fuel.
• Modifying how
wastewater is treated,
for example:• Switching from a
latrine or septic
tank to an aerobic
treatment plant.
• Operating existing
plants more efficiently
• Installing anaerobic
digestion systems at
wastewater treatment
plants.
indicates options that have the potential to produce electricity

103
Biogas Subcommittee: Anaerobic Digestion and Biogas Use

104
Biogas Subcommittee:Renewable Energy from Biogas
Biogas from
animal waste
anaerobic digester
used as cooking
fuel (Philippines)
Biogas from
wastewater
sludge treated
and sold to gas
plant (Chile)
Biogas from a
landfill used in IR
heater (Bosnia
and Herzegovina)

105
Biogas Subcommittee: Emissions/Reductions in 2020
Based on data from EPA, 2013. Global Mitigation of Non-CO2 Greenhouse Gases: 2010-2030
Total from All Biogas Sectors:
2020 Total Estimated Emissions: 1,832 MMTCO2e
2020 Potential Emissions Reductions: 979 MMTCO2e
0 200 400 600 800 1000
Municipal Solid Waste
Wastewater
Manure Management
2020 Total Estimated Emissions and Potential Emissions Reductions, MMTCO2e
Potential Emissions Reductions
Total Estimated Emissions

106
Biogas Subcommittee: Energy Potential in 2020
-
2,000
4,000
6,000
8,000
10,000
12,000
Agriculture Municipal SolidWaste
Wastewater
2020 Potential Electricity Generation Capacity, MW
Total from All Biogas Sectors:
2020 Electricity Generation Capacity: 15 GW
Based on data from EPA, 2013. Global Mitigation of Non-CO2 Greenhouse Gases: 2010-2030

107
Future GMI/CCAC Work
GMI is enhancing its focus on building knowledge platforms
and developing policy guidance in the future.
– Less project directed work
Key opportunity to support GMI and CCAC Partner Countries
with their Nationally Determined Contributions (NDCs) to
include methane reduction as an important element of climate
mitigation strategy.
Work jointly with Ag, MSW, Oil and Gas Initiatives and CCAC
SNAP initiative to target our efforts on joint knowledge platform
and policy guidance in particular sectors.
The GMI Biogas Subcommittee is currently developing a work
plan to determine future work products and focus areas.

108
Of the 188 country Nationally Determined Contributions
(NDCs) developed, 27 have specifically addressed short-lived
climate pollutants (SLCPs) and integrated mitigation co-
benefits into their submissions
Many others included projects and activities directly relevant
to the work of GMI, CCAC, and SLCP reductions
64 countries included activities in the Waste Sector, nine are
in GMI Partner Countries:
China Mongolia
European Union Turkey
Ghana United States
Japan Vietnam
Jordan
Biogas Opportunities: NDCs

109
Thank You!
GMI maintains an extensive website at:
www.globalmethane.org
Social Media:
ASG Co-Directors:– Monica Shimamura
Phone: (202) 343-9337
Email: [email protected]
– Henry Ferland
Phone: (202) 343-9330
Email: [email protected]
110
APPENDIX

111
MSW Initiative Synergies Example
GMI CCAC Synergy
Country-focused
approach
City-focused approach Coordination can help scale
up action in both national
and municipal jurisdictions
Pipeline of projects
and tools
development
Small scale projects
and tool development
Joint tools development,
financing assistance, policy
guidance
Focus on methane
and biogas cross-
sector solutions
Focus on source
separation and basic
best practices
Anaerobic Digesters, cross-
sector solutions, methane
abatement and reduction
ideas.
New Biogas
Subcommittee
(national policy
discussions)
Regional workshops
(targeted capacity
building)
Future joint work on
workshops, policy guidance
and cross-sector biogas
solutions

112
This Nicaraguan wastewater treatment
plant has an anaerobic digester which:
– Reduces 2,520 MtCO2e/year of emissions
– Has electricity capacity of 655 kW
Biogas Project Example: Managua WWTP

113
Biogas PotentialCountry Example: Mexico
0 20 40 60
Municipal SolidWaste
Wastewater
Agriculture
2020 Potential Emissions Reductions, MMtCO2e
Total from All Biogas Sectors:
2020 Emissions Reductions: 75 MMtCO2e
2020 Electricity Generation Capacity: 944 MW
- 400 800
Municipal SolidWaste
Wastewater
Agriculture
2020 Potential Energy Generation Capacity, MW

114
Global Mitigation of Non-CO2 Greenhouse
Gases: 2010-2030
https://www3.epa.gov/climatechange/Downloads/EPAactivities/MAC_Report_2013.pdf
Biogas Subcommittee:Emissions Reductions and Energy

THE GLOBAL DRIVERS FOR
AD
TURNING AD INTO A GLOBAL PLAYER
MIKE MASONCHAIRMAN, TROPICAL POWER

3rd Generation Bioenergy
Moving from ‘fuel OR food’ to
‘fuel and MORE food’

The case for Biogas
Ethanol Methane
Feedstock (kg) 1,000 1,000
Gross fuel yield (kg) 227
Gross fuel yield (m3) 327
Gross Energy Yield (MJ/tonne) 5,176 10,791
Useful energy @40% efficiency (MJ) 2,070 4,316
Surplus/(Parasitic) electricity (MJ) 670 (302)
NET USEFUL ENERGY (MJ/tonne) 2,740 4,014
Relative yield 100% 143%

Maximising the value of Biogas
Three challenges
• Get the cost of bioenergy low enough to compete with coal
• Get the scale up so it is large enough to matter
• Make sure it adds to food security and doesn’t detract from it
Biogas – the key technology
• Massive potential to reduce costs
• Biogas is a cheaper and more efficient energy store than batteries. Perfect for grid or off-grid applications
• Perfect to hybridise with solar – use gas when the sun doesn’t shine.

Cutting the cost – bio-mimicry of cows
• A cow can digest 150 kg of biomass per m3 of rumen per day
• An AD plant can digest 4-6 kg of biomass per m3 of reactor per day
• Both use the same bacteria and chemistry
• Mimicking the cow could make digesting agricultural waste as cheap as burning coal

Getting the scale up
• Use agricultural waste not energy crops on good land ≈4 bn tonnes/yr at 1.2MWh/tonne
• Use hyper-water efficient CAM plants. There are ≈3 bn ha of under-used semi-arid land
0.0
1.0
2.0
3.0
4.0
5.0
6.0
7.0
8.0
9.0
10.0
Oil AgResiduesHydro Gas CAMPlants Coal
Annualgen
era
onPWh/yr
Solarcomplement
AD
• Hybridise AD with solar to make large scale solar grid friendly. Biogas is a cheap energy store, batteries are expensive

Fuel and MORE food
• The liquid that comes out from AD is warm and nutrient rich
• Lemna are the world’s fastest growing plants, and will grow on AD digestate
• Lemna can produce 10x as much protein/ha as soy beans
• With CAM plants as the crop this can happen in semi-deserts

So how can we do it?
Or “why is a cow so unreasonably good at cellulolysis?”

Saliva – a key?
Cow
Cow
Sheep
Kangaroo
Human
0%
100%
200%
300%
400%
500%
600%
HCO3- PO4 pH N Na K Ca Mg Cl
Rela
veconcentra
ons-nromalised
tosheep

Sharma’s experiment
0%
20%
40%
60%
80%
100%
120%
0 20 40 60 80 100 120 140 160 180
Rela
verateofgasevolu
onperunitsurfacearea
Rela vesurfaceareapergramofpar cles(1forlargest,157forsmallest)
Gasevolu onperunitofsurfacearea,asf(par clesize)
Ini alreac onrate

Biofilms are heterogeneous and ever changing
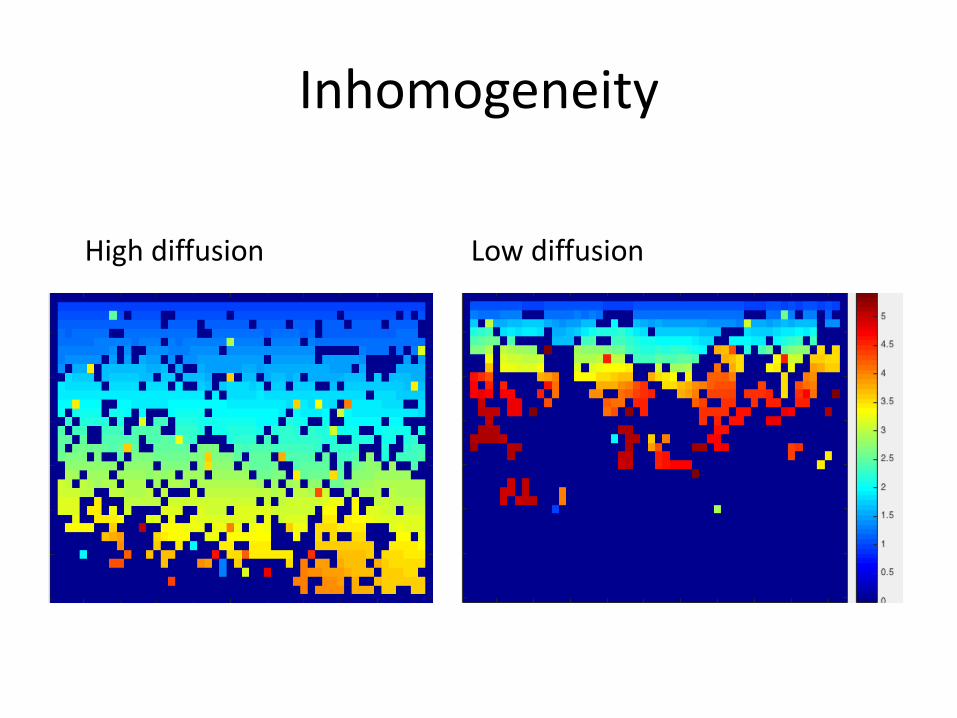
Inhomogeneity
High diffusion Low diffusion

Effect of Boundary Layers.

QUESTIONS AND COMMENTS FROM THE FLOOR

THE GLOBAL DRIVERS FOR
AD
RECYCLING NUTRIENTS AND SAVING
FOOD WASTE
CHARLOTTE MORTON, CEO, ADBA
MARK VARNEY, DIRECTOR OF FOOD, FARESHARE
DR RICHARD SWANNELL, DIRECTOR OF SUSTAINABLE FOOD SYSTEMS,
WRAP

THE GLOBAL DRIVERS FOR
AD
DELIVERING THE FOOD EFFICIENCY
FRAMEWORK
MARK VARNEYDIRECTOR OF FOOD, FARESHARE

FareShare is a UK-wide charity fighting hunger and
food waste. We redistribute surplus food to
frontline charities and community groups that
support vulnerable people.

Food Poverty in the UK
people struggle to afford a meal –
equivalent to the entire
population of London(Voices of the Hungry, Food & Agriculture Organisation
of the United Nations, 2016)
people are destitute - meaning they
cannot afford essentials such as food (Destitution in the UK, Joseph Rowntree, 2016)
8.4
million
1.3
million

How FareShare Works

FareShare in the CommunityFareShare redistributes food to a wide
range of charities and community
groups across the UK.
• Lunch clubs for older people
• Breakfast clubs for disadvantaged
children
• Homeless hostels
• Domestic violence refuges
Partnerships and collaboration with a
number of Local Authorities across the
UK in a broad range of ways
• Access to storage and warehousing
• Hosting “Local Collection Points”
• Collaborating on food provision for
vulnerable people

FareShare’s Work in 2016

Food Surplus in the UK Food Supply Chain
Farms
Processing & Manufacture
Wholesale & Distribution
Retail
Typic
al Pro
duct
Lif
e R
em
ain
ing Good life
7 – 28 days
5 – 30 days
1 – 3 days
100,000 – 500,000**
300,000+ locations
At least 160 000*
2,128 Large locations
80– 120 000**
1,000+ locations
47-110 000*
30 – 40,000 locations
Tonnes Surplus
* Quantification of food surplus, waste and related materials in the grocery supply chain, WRAP, 2016
** FareShare estimates

Supporting the food industry to
follow the Food Use Hierarchy

Funding support to help ensure the Food Use
Hierarchy is respected…?
Food businesses are
encouraged to take
“reasonable steps”
to follow the waste
hierarchy.
But it is often
neither cheaper nor
easier to do so for
many large food
manufacturers

Our aim is to grow the
volume of surplus food
that is redistributed to
charity to
100,000 tonnes
per yearand save the voluntary
sector > £150m per
year

Industry Testimonials
“They have immaculate codes of
practice. I kind of refer to FareShare
as a social distributer, a partner, it’s
not someone who takes our waste,
they are a means by which we fulfil
one of our commitments to society”
Bruce Learner - Kellogg Europe
“No surplus food from our stores that can
be eaten should go to waste - this will help
to provide millions of meals to feed people
in need. Helping to fight food waste with
FareShare FoodCloud is, undoubtedly, one
of the things I’m most proud of at Tesco.”
Dave Lewis - Tesco
“Yes, supporting FareShare was
initially a decision from the
heart, it seemed the right thing
to do, but we’ve quickly learned
that our involvement has helped
us to be a better business and it
is something that all of those
involved are very proud to be a
part of.”
Chris Mack - Fresca Group
“You might just be surprised
how simple it can be to turn
your waste into something that
delivers so much more for so
many people.”
Suzie McIntyre - Kettle Produce
“The best commercial decision I can make
with that waste product that I cannot sell is
to absolutely donate it to charity.”
Mike Coupe - Sainsbury’s

THE GLOBAL DRIVERS FOR
AD
AD AND WASTE – WHY SHOULD AD BE AT
THE HEART OF ALL WASTE RECYCLING
INITIATIVES
DR RICHARD SWANNELLDIRECTOR OF SUSTAINABLE FOOD SYSTEMS, WRAP

AD & Waste – why AD is key to food waste recycling
Richard Swannell
Director of Sustainable Food Systems
@R_Swannell
6th July 2016

WRAP’s
vision is a
world in which
resources
are used
sustainably

WHAT WRAP DOES
Research & evidence
Collaboration through voluntary
agreements
CampaignsGrant-
making & investment
Evaluation of impact
HOW WRAP WORKS
© WRAP 2016
WRAP works
with governments,
businesses and
communities to deliver
practical solutions to
improve resource
efficiency


By 2030 the world will need 40-50% more water, food and energy. Interdependence will increase volatility. More energy needs more water, more food and water need more energy. To meet those needs, business as usual will not be an option – we require business unusual.
Peter Voser
CEO
Royal Dutch Shell
Why do we need to act?

www.wrap.org.uk/foodquantification

The opportunityPost-farm gate food waste in UK
7.0 mt
1.7 mt
0.2 mt
0.9 mt0.1mt 0.02 mt
Tonnage (mt)
Household
Manufacturing
Retail
Hospitality & food service
Food waste in litter
Wholesale

AD growth to 2016

Sources of feedstock

Driving
Change

Opportunities in household
• Preventing food remains priority,
• Almost 3 Mt is unavoidable
• 40% of UK local authorities do not collect food
waste
• Only 12% of UK food waste is recycled by
local authorities

Helping to increase food waste recycling
• Updated WRAP food waste collections guide
for local authorities
• Refreshed Recycle Now communications
materials
• Improved householder engagement in
collections
• Greater consistency in household recycling
collections

Food Waste Recycling Action Plan
Aims to:
• Increase the amount of food waste collected
• Provide long term sustainable feedstocks for operators

Food Waste Recycling Action Plan
Increases capture of food waste…
Benefits to treatment plant operators from profit made
from increased feedstock
Benefits to local authorities from avoided residual
disposal costs
Find out more at the launch of the
Food Waste Recycling Action Plan,
UK AD & Biogas 2016, 1000 tomorrow
www.wrap.org.uk/foodwasterecycling

Supporting market development
• DC-Agri – supports the confident use of digestates by
farmers and growers as renewable fertilisers
• Increased focus on sustainable soil management
• More precision farming
• Adding more value to products

… delivered face-to-face
training to
3,526 people, increasing farmer
awareness of digestate and
it’s fertiliser value…

… and produced
training materials and
resources, including the
bulletins that have been
downloaded over
6,000times.

Conclusion
• Need to drive improvements in food
system sustainability
• Driving a more resource efficient more
circular approach will drive:
• Less material inputs
• Less waste
• More recycling and more innovative
uses of collected waste
Thank you
WRAP
Second Floor,
Blenheim Court,
19 George Street,
Banbury,
OX16 5BH
UK
www.wrap.org.uk
Dr Richard Swannell
@R_Swannell
+44 (0)1295 819900

QUESTIONS AND COMMENTS FROM THE FLOOR

THE GLOBAL DRIVERS FOR
AD
FARMING, SOIL AND FOOD SECURITY –
FEEDING THE WORLD AND FARMING
SUSTAINABLY
CHARLOTTE MORTON, CEO, ADBA
GUY HILDRED, FARMER, GREEN GAS OXON
DR STEPHEN RAMSDEN, UNIVERSITY OF NOTTINGHAM

THE GLOBAL DRIVERS FOR
AD
THE ROLE OF ENERGY CROPS IN
SUPPORTING FOOD SECURITY
GUY HILDREDFARMER, GREEN GAS OXON

Food Security:
a farmer’s view
Guy Hildred

Background
2 MW equivalent AD plant gas to grid
Fed on crops and some pig slurry
6,000 arable acres and 2,000 ewes on
1,500 acres
Degree in mechanical engineering

Land use pressures
Food
Medicinal
Fibre
Biomass
Leisure
Energy
Environment
Housing and infrastructure

Commodity volatility
1992 wheat price was £100 per ton. 2016
wheat price is…. £100 per ton
But price ranged in same period from £59
to £212 per ton
Energy crops help reduce this volatility
Increasing demand when prices are low
Suppressing demand when prices are high
Encourages investment

Soil health
Organically derived fertilizers
More varied cropping
Compaction
Erosion
Ignorance

Food versus fuel
Four crops in three years
Two energy
Two food
Digestate gives huge saving in GHG
A fuel crop is just another land use
Which is more important?
THE GLOBAL DRIVERS FOR
AD
SUSTAINABLE FARMING PRACTICES AND
AGRICULTURAL ECONOMICS
DR STEPHEN RAMSDENASSOCIATE PROFESSOR IN MANAGEMENT AND DIRECTOR OF UNIVERSITY
FARM, FACULTY OF SCIENCE, UNIVERSITY OF NOTTINGHAM

Sustainable Farming Practices and Agricultural Economics
Dr Stephen RamsdenSchool of Biosciences
University of Nottingham

Overview
1. What is Agricultural Economics?
2. Sustainable farming
3. The components of a sustainable system
4. Lessons and conclusions

What is Agricultural Economics?

http://onlinelibrary.wiley.com/journal/
10.1111/(ISSN)1477-9552
http://www.aes.ac.uk/
What is Agricultural Economics? In the UK, a Society and a Journal

What is Agricultural Economics?
• How to allocate scarce resources (land) productively and efficiently
• Where are the trade-offs?
• Agri-environment (physical, biological)
• Understand markets: farmers are price takers (and sometimes risk averse) and unit cost reducers (for commodities)
• Better policy (“value for money” – David Pannell)
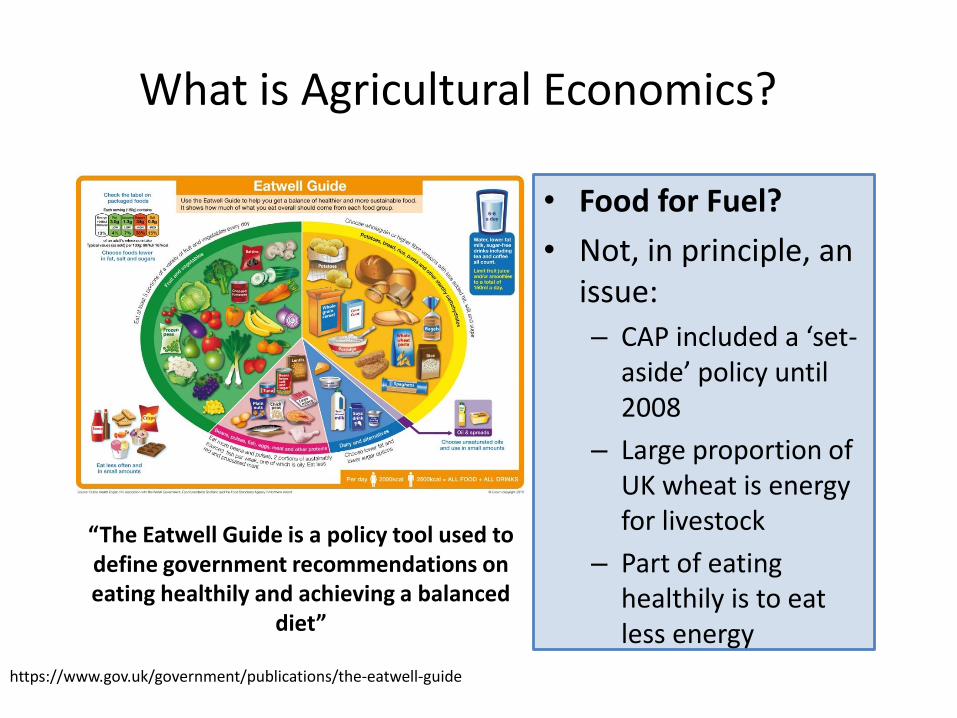
• Food for Fuel?
• Not, in principle, an issue:
– CAP included a ‘set-aside’ policy until 2008
– Large proportion of UK wheat is energy for livestock
– Part of eating healthily is to eat less energy
What is Agricultural Economics?
https://www.gov.uk/government/publications/the-eatwell-guide
“The Eatwell Guide is a policy tool used to define government recommendations on eating healthily and achieving a balanced
diet”

• Food for Fuel?
• Not, in principle, an issue:
– More diversified portfolio (risk)
– Miscanthus fertiliser and sprays: £25/ha
– Winter wheat fertiliser and sprays: £480/ha (Nix, 2015)
What is Agricultural Economics?
Crop Diversification at the University of Nottingham Farm

+ Environment- Environment
× 2×
× 1
×
× 𝐹𝑎𝑟𝑚𝑠:1 = Organic?
2 = Conventional?
× 𝐸𝑓𝑓𝑖𝑐𝑖𝑒𝑛𝑡 𝐹𝑎𝑟𝑚𝑠?
Greater productivity in both ‘E’ and ‘P’
Productivity and Efficiency
𝑃𝑟𝑜𝑑𝑢𝑐𝑡𝑖𝑜𝑛Possibility
Frontier
Production
𝑃𝑟𝑜𝑑𝑢𝑐𝑡𝑖𝑜𝑛Possibility
Frontier
Yield 14.50 t/hacv Kielder Sown 14th Sept
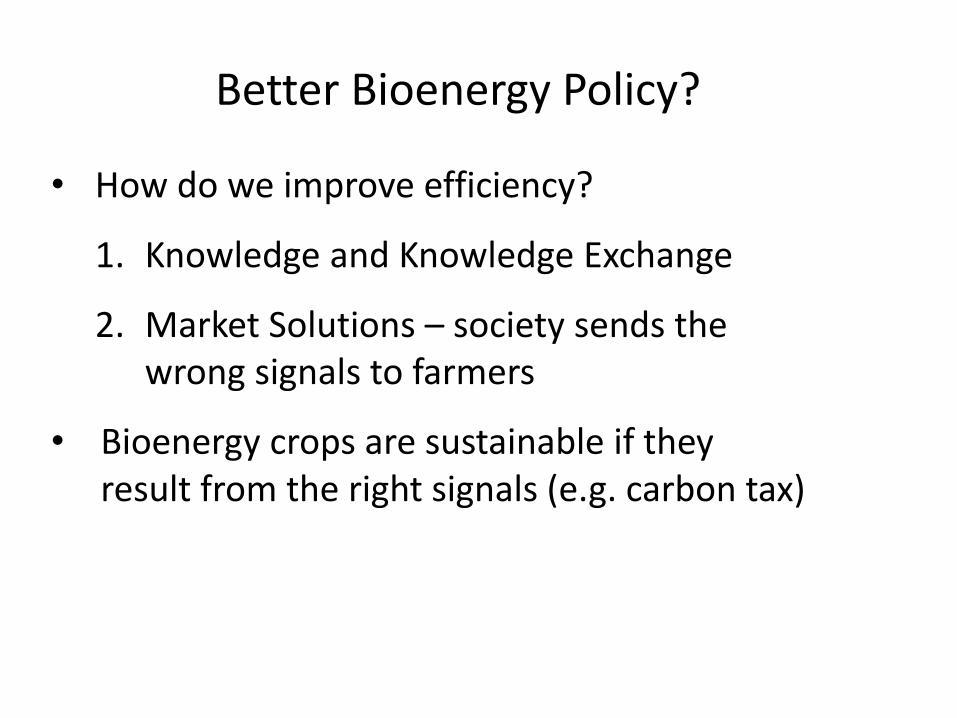
• How do we improve efficiency?
1. Knowledge and Knowledge Exchange
2. Market Solutions – society sends the wrong signals to farmers
• Bioenergy crops are sustainable if they result from the right signals (e.g. carbon tax)
Better Bioenergy Policy?

Sustainable farming –some example
sustainable intensification metrics
for cereal farms

Winter Wheat, 50.9%
Winter Oilseed Rape, 20.6%
Sugar Beet , 9.9%
Beans, 3.6%
Spring Barley , 2.7%
Winter Barley, 2.5%
Spring Wheat, 1.2%
Legumes and Potatoes, 0.9%
Other, 7.7%
Sample Cereal Farms: Land Use

0
5
10
15
20
25
30
35
40
0 5 10 15 20 25 30 35 40Nit
rate
Lo
ss k
g p
er
ha
Farm
Water Quality
Not so
good
Better

Nutrient Loss: N everywhere
• Nitrate
– Indicator of water quality
• Nitrous Oxide
– Indicator of global warming
• Ammonia
– Indicator of air quality
𝑵𝑶𝟑−
𝑵𝟐O
𝑵𝑯𝟑

0
2000
4000
6000
8000
10000
12000
14000
1 2 3 4 5 6 7 8 9 10 11 12 13 14 15 16 17 18 19 20 21 22 23 24 25 26 27 28 29 30 31 32 33 34 35 36
Co
st p
er
farm
£
Farm (ranked by cost)
Cost of N loss to the farmer
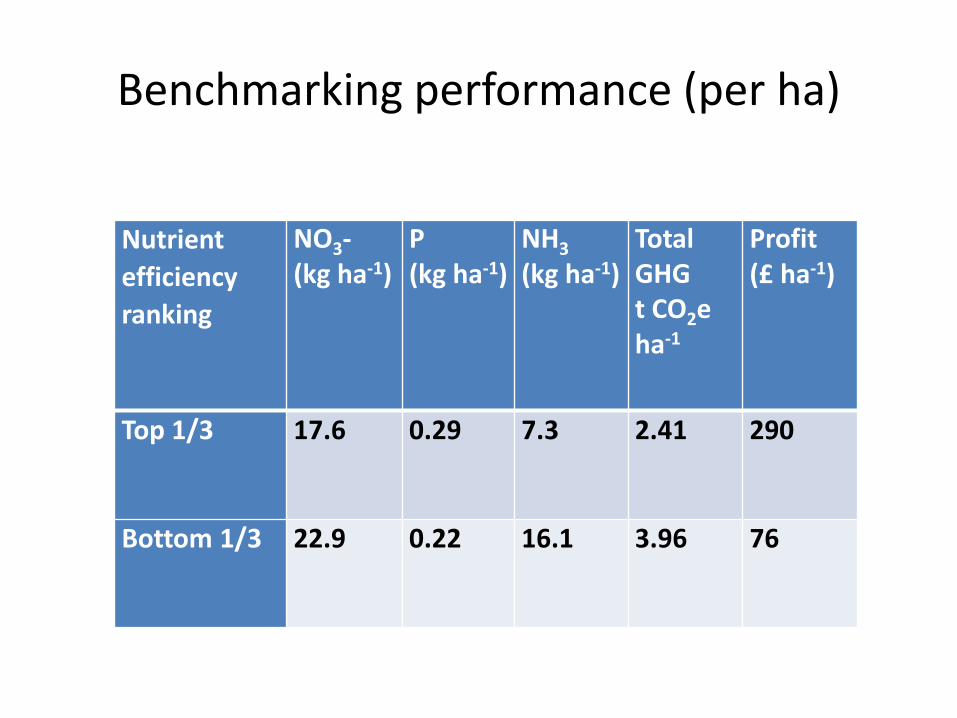
Benchmarking performance (per ha)
Nutrient
efficiency
ranking
NO3-(kg ha-1)
P(kg ha-1)
NH3
(kg ha-1)Total GHG t CO2e ha-1
Profit (£ ha-1)
Top 1/3 17.6 0.29 7.3 2.41 290
Bottom 1/3 22.9 0.22 16.1 3.96 76

The components of a sustainable agricultural
system
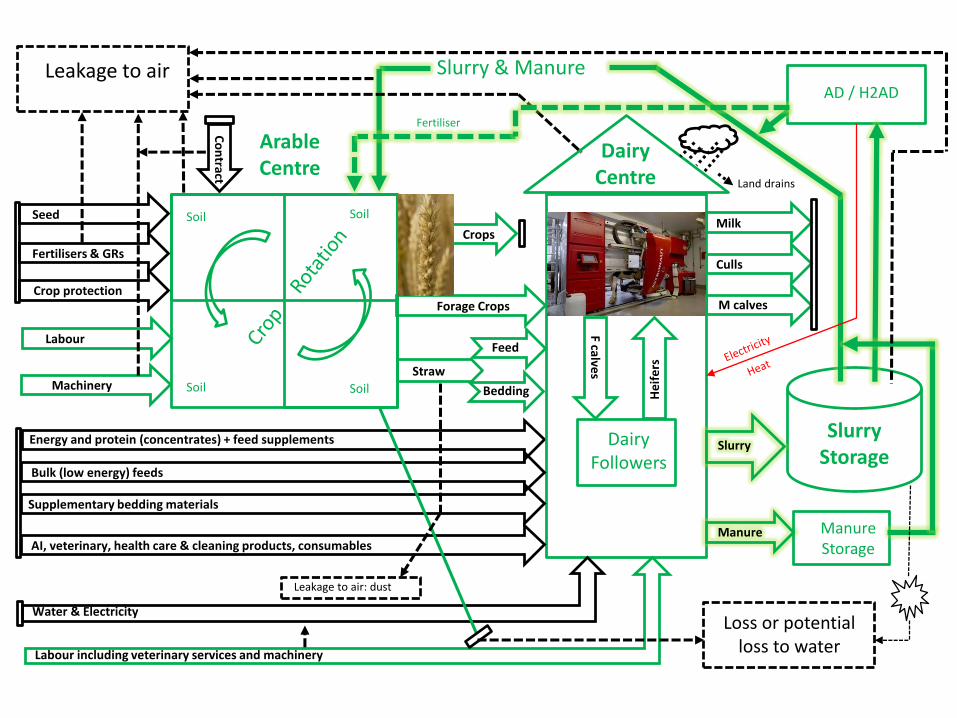
Forage Crops
Crops
Arable Centre
Energy and protein (concentrates) + feed supplements SlurryStorage
AI, veterinary, health care & cleaning products, consumables
Bulk (low energy) feeds
Machinery
Labour
Crop protection
Fertilisers & GRs
Seed
Water & Electricity
Supplementary bedding materials
Labour including veterinary services and machinery
Straw
Feed
Bedding
Milk
Culls
M calves
DairyFollowers
F calves
He
ife
rs
Slurry
DairyCentre
Co
ntract
Manure ManureStorage
AD / H2AD
Slurry & Manure
Loss or potential loss to water
Leakage to air
Leakage to air: dust
Soil
Soil
Soil
Soil
Fertiliser
Land drains

How do we cultivate in England? Reduced Tillage (RT)
• Survey: 249 English arable farmers
• 32% of arable land was established under RT
• 46% of farms using some form of RT
• Main crops: wheat and oilseed rape
• How ‘reduced’ is reduced?

Cultivations and Drilling
‘Reduced Cultivation’
1 pass with 3m ‘Sumo’ discs and tines1 pass with 5m ‘Vaderstad Carrier’ discs
1 pass with 6m ‘Horsch Sprinter’ seed drill
Photos courtesy of James Beeby

Soil Use and Management
Volume 32, Issue 1, pages 106-117, 11 DEC 2015 DOI: 10.1111/sum.12241
http://onlinelibrary.wiley.com/doi/10.1111/sum.12241/full#sum12241-fig-0002
Tillage depths still quite deep with RT

Effects of Reduced Tillage: yields, costs and margins
Soil Use and Management
Volume 32, Issue 1, pages 106-117, 11 DEC 2015 DOI: 10.1111/sum.12241

Put RT into a (simplified!) model
Zero Tillage – lower emissions per unit of biomass produced by profit maximising farm…
MAX PROFIT Conventional Tillage Zero Tillage
Net energy (GJ farm− 1) 25,700 28,000
GHG emissions (t CO2-eq farm− 1)
1,767 1,567
Kg CO2-eq GJ − 1 69 56
MIN EMISSIONS Conventional Tillage Zero Tillage
Net energy (GJ farm− 1) 20,900 22,400
GHG emissions (t CO2-eq farm− 1)
764 639
Kg CO2-eq GJ − 1 37 29
… but greater scope when farm objective = minimise emissions
Agricultural Systems 146, 91-102. 10.1016/j.agsy.2016.04.005

Lessons and Conclusions

Sustainable Farming Practices- what can we learn from Ag Econ
1. There is scope to become more sustainable –e.g. RT
2. We need ways of measuring what is sustainable…
3. … and we need models (= understanding) of what happens when we intervene (there will be trade-offs)

Forage Crops
Crops
Arable Centre
Energy and protein (concentrates) + feed supplements SlurryStorage
AI, veterinary, health care & cleaning products, consumables
Bulk (low energy) feeds
Machinery
Labour
Crop protection
Fertilisers & GRs
Seed
Water & Electricity
Supplementary bedding materials
Labour including veterinary services and machinery
Straw
Feed
Bedding
Milk
Culls
M calves
DairyFollowers
F calves
He
ife
rs
Slurry
DairyCentre
Co
ntract
Manure ManureStorage
AD / H2AD
Slurry & Manure
Loss or potential loss to water
Leakage to air
Leakage to air: dust
Soil
Soil
Soil
Soil
Fertiliser
Land drains

References and further reading
• BUCKWELL et al., 2014. The Sustainable Intensification of European Agriculture. A review sponsored by the RISE Foundation. http://www.ieep.eu/assets/1404/111120_BROCH_SUST_INTENS_DEF.pdf.
• GLITHERO, N., RAMSDEN, S.J. and WILSON, P. 2012. Farm systems assessment of bioenergy feedstock production: Integrating Bio-economic models and Life Cycle Analysis approaches, Agricultural Systems 109, 53-64. 10.1016/j.agsy.2012.02.005
• GLITHERO, NJ, WILSON, P and RAMSDEN, SJ, 2015. Optimal combinable and dedicated energy crop scenarios for marginal land, Applied Energy 147, 82-91. 10.1016/j.apenergy.2015.01.119
• PANNELL, D. 2003. Value for Money in Environmental Policy and Environmental Economics. http://ageconsearch.umn.edu/bitstream/146501/2/WP130004.pdf
• TOWNSEND, T.J., RAMSDEN, S.J. and WILSON, P. 2015. How do we cultivate in England? Tillage practices in crop production systems, Soil Use and Management 36, 106-117. 10.1111/sum.12241
• TOWNSEND, T.J., RAMSDEN, S.J. and WILSON, P. 2016. Analysing reduced tillage practices within a bio-economic modelling framework, Agricultural Systems 146, 91-102. 10.1016/j.agsy.2016.04.005

QUESTIONS AND COMMENTS FROM THE FLOOR

THE GLOBAL DRIVERS FOR
AD
OPPORTUNITIES IN A GLOBAL MARKET
DR SARIKA JAIN, MARKET RESEARCH ANALYST, ADBA
PATRICK SERFASS, AMERICAN BIOGAS COUNCIL
JAKE DEBRUYN, ONTARIO MINISTRY OF AGRICULTURE
JORGE ANTONIO HILBERT, NATIONAL AGRICULTURAL TECHNOLOGY
INSTITUTE
DIARMID JAMEISON, SLR CONSULTING
CONRAD BURKE, DUPONT INDUSTRIAL BIOSCIENCES
LORENZO MAGGIONI, CIB
EDUARDO GRIFFONI, THAIS OLIVERIA, FCO

THE GLOBAL DRIVERS FOR
AD
AN OVERVIEW OF GLOBAL AD MARKET
POTENTIAL AND ITS DRIVERS
DR SARIKA JAINMARKET RESEARCH ANALYST, ADBA

GLOBAL AD MARKET
POTENTIAL AND ITS DRIVERS
Dr. Sarika JainMARKET RESEARCH ANALYST, ADBA

Global Overview
• Established as a renewable energy generation technology
• Benefits beyond electricity production recognised –
greenhouse gas abatement, waste management, sanitation,
vehicular fuel, domestic cooking fuel,
• Waste based potential (Animal manure, human waste and
food waste) - £150 billion or installed capacity of 300GW.

Animal Manure• Global livestock is responsible for 14.5% of all anthropogenic greenhouse gas
emissions
• Role AD can play:
─ Greenhouse gas (GHG) abatement AD can reduce the methane and nitrous
oxide emissions significantly from manure storage and fertiliser production.
─ Women empowerment, indoor quality and health By substituting the
traditionally used biomass as domestic fuel, biogas can have multiple social
benefits in the developing countries
• There is a market potential of £133 billion on an annual basis with a much larger
environmental and social impact
• Special mention: Micro-digesters in India, China, Bangladesh and other emerging
markets and the large scale digesters at US dairy farms.

Food Waste• World food production: 4 billion tonnes p.a. of which a third is wasted or lost.
• Role AD can play:
─ Pressure on the planet– Digesting food waste aids in nutrient recycling,
reduction of emissions and thereby reducing the pressure on the planet.
─ Waste management –Food waste often ends up in a landfill or with municipal
solid waste causing emissions.
─ Energy generation – Food waste with its high calorific value can be digested
to produce electricity, heat or upgraded biogas and also make digestion of
other feed stocks more feasible.
• Market potential for digestion of food waste is £15 billion
• Special mention: South Korea food collection and disposal system
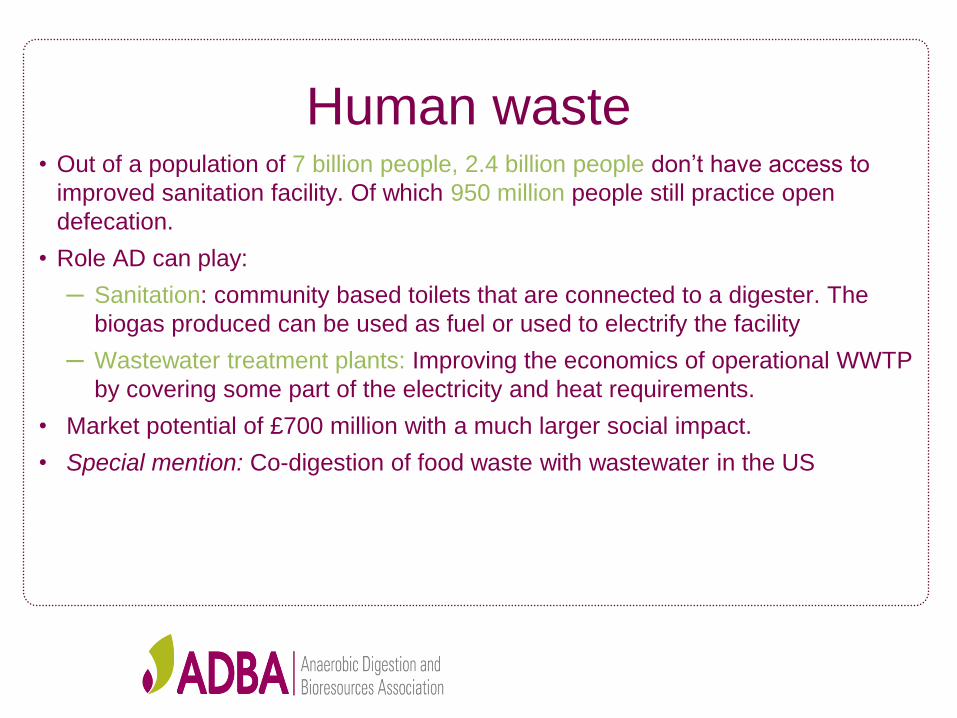
Human waste• Out of a population of 7 billion people, 2.4 billion people don’t have access to
improved sanitation facility. Of which 950 million people still practice open
defecation.
• Role AD can play:
─ Sanitation: community based toilets that are connected to a digester. The
biogas produced can be used as fuel or used to electrify the facility
─ Wastewater treatment plants: Improving the economics of operational WWTP
by covering some part of the electricity and heat requirements.
• Market potential of £700 million with a much larger social impact.
• Special mention: Co-digestion of food waste with wastewater in the US

Energy generation potential

Drivers• GHG commitments
• Regulatory support
─ Feed in tariffs
─ Renewable Heat Incentive
─ Subsidies
─ Mandatory renewable fuel mix
• Waste management
• Social drivers like domestic fuel, sanitation

THE GLOBAL DRIVERS FOR
AD
INSIGHT INTO UNITED STATES OF
AMERICA
PATRICK SERFASSAMERICAN BIOGAS COUNCIL

US Biogas Market3 Challenges | 3 Opportunities
Patrick Serfass - American Biogas Council6 July 2016| NEC, Birmingham, UK

American Biogas Council: The Voice of the US Biogas Industry
The only U.S. organization representing the biogas and anaerobic digestion industry
Over 200+ Organizations from the U.S., Germany, Italy, Canada, Sweden, Belgium and the UK
All Industry Sectors Represented:
project developers/owners
anaerobic digestion designers
equipment dealers
waste managers
waste water companies
farms
utilities
consultants and EPCs
financiers, accountants, lawyers and engineers
Non-profits, universities and government agencies
Join Us! www.AmericanBiogasCouncil.org OR [email protected] OR 202.640.6595
213
0
50
100
150
200
250
300
2010 2011 2012 2013 2014 2015
ABC Membership
Organizations Linear (Organizations)


247on Farm
(Dairy AND Swine)
1,241Wastewater
(860 using their biogas)
645at Landfills
2,100+Operational
Biogas Systems
11,000+Potential
Biogas Systems
8,241on Farm
(Dairy AND Swine)
2,400Wastewater
(incl. 381 making biogas but not using it)
440 at Landfills
U.S. Biogas Market – Current and Potential

Wastewater Sector

U.S. Biogas Market – Potential Impact
Enough energy to power 3.5 million American
homes
Emission reductions equivalent to removing
up to 11 million passenger vehicles from the road
13,000+Biogas Systems
$33 Billion in construction spending, creating
approximately 275,000 short –term construction jobs and
18,000 permanent jobs

3 Challenges: Project Permitting
Selling Products (Elec., Gas, Digestate)
andFew/Unstable Incentives
218

3 Opportunities: Adding Food WasteMaking Vehicle Fuel
andMaking Products from Digestate
219

220
Food Waste

What wastes are BEST for making biogas?
25x manure
10x manure
35x manure

70% of the electricity from food waste
Manure Digester + Food Waste
222
10% food waste can DOUBLE
biogas production

5 States + 5 Cities: Food Waste Recycling PoliciesMunicipalities: San Francisco, Seattle, Austin, Vancouver, New York City, most starting in
2009-10
2011: Connecticut, Public Act 11-217 (updated in 2013)
2012: Vermont, Universal Recycling Law, Act 148—all organics, largest generators first, effective 7/1/2016
2013
• CT: Public Act 13-285 (update to 2011)—Commercial organics, effective 1/1/14
• NYC: Local Law 146-2013—Commercial organics, effective 7/1/2015
2014
• Massachusetts: 310 CMR 19.000 regulations—Commercial organics, effective 10/1/14
• Rhode Island: Act Relating to Health and Safety—Commercial organics, eff. Jan 2016
• California AB 1826: Mandatory Commercial Food Waste Recycling, effective 1/1/2016
2016: Maryland? New Jersey? New York (state)?
223


3 Opportunities: Adding Food WasteMaking Vehicle Fuel
andMaking Products from Digestate
225

Vehicle Fuel and Plastic• Greening fleets
• Garbage truck collects enough food waste to fuel the daily route
• Making RNG generates RINs worth $0.75 - $1.30/gallon
• Greening product packaging with bioplastic (Dell computer bags)

3 Opportunities: Adding Food WasteMaking Vehicle Fuel
andMaking Products from Digestate
227

Chesapeake Bay Phosphorus Risk Map
228
Red and pink areas: no more fertilizers containing phosphorus
Green and yellow areas: can continue to use manure or unseparated digested material
Chesapeake Bay Foundation

Summary of Systems
229Frear,C. (2013) Review of Emerging Nutrient Recovery Technologies and Discussion on Performance/Cost Structures for WSU/DVO Integrated Approach -Capturing Valuable Nutrients from Manure: Part 2

230
Soil Products (liquid/solids)

Digester PRODUCTS market potential*
$2.9 Billion
*agricultural sector only
231

Policies to Help US Project Development
• Make permitting and interconnection easier. Less time to develop = less expensive installations
• Buy the digestate. Revenue for the project, easier to get financing.
• Make long-term feedstock contracts with waste generators easier to obtain by project developers:
• Help project developers sell their gas/energy. Revenue for the project, easier to get financing:– FIT (Feed In Tariff)
– Get gas utilities to buy pipeline quality RNG from new projects and offer local “green gas” to their gas customers

Thank You!
• Learn More• Sign up for the FREE Biogas News• www.AmericanBiogasCouncil.org
• Become a Member• Application online, or contact us
Patrick Serfass, Executive DirectorAmerican Biogas Council1211 Connecticut Ave NW #650Washington, DC [email protected] [email protected]
THE GLOBAL DRIVERS FOR
AD
INSIGHT INTO CANADA
JAKE DEBRUYNONTARIO MINISTRY OF AGRICULTURE, FOOD AND RURAL AFFAIRS

Jake DeBruyn
Ontario Ministry of Agriculture,
Food and Rural Affairs
UK ADBA Conference, July 6 & 7, 2016
Canadian Biogas
Update

Today’s Presentation
• Introduction to biogas opportunity in Canada
– Key provincial initiatives
– Areas where UK leadership may have direct application to Canada
– Contact information to engage further with Canada

Ontario Quick Fact• 152 million consumers within a
day’s drive of Toronto
238
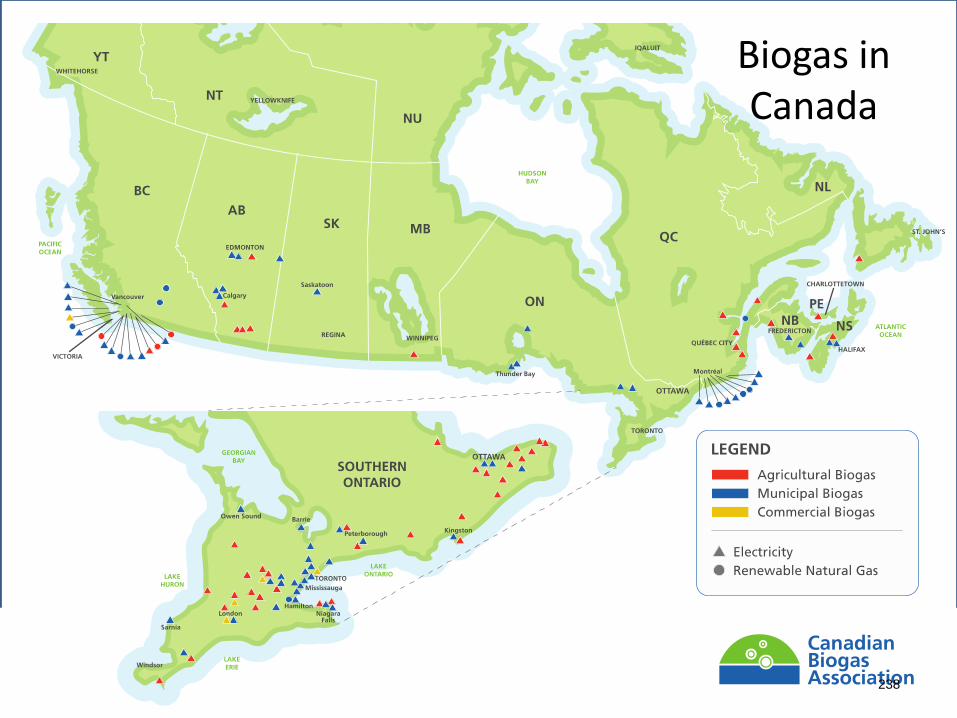
Biogas in Canada

Biogas Policies Across Canada• British Columbia
– Voluntary RNG program, carbon tax, low carbon fuels standard
• Alberta
– Carbon price and emitters regulation, biogas offset protocols, localized organics bans
• Quebec
– Ban on organics in landfill by 2022, municipal capital incentives, carbon tax, RNG momentum project by project
– Canada’s largest landfill in Quebec started selling Renewable Natural Gas (RNG) to California in 2015
• Nova Scotia
– Ban on organics in landfill, community feed-in-tariff program (on hold)
239
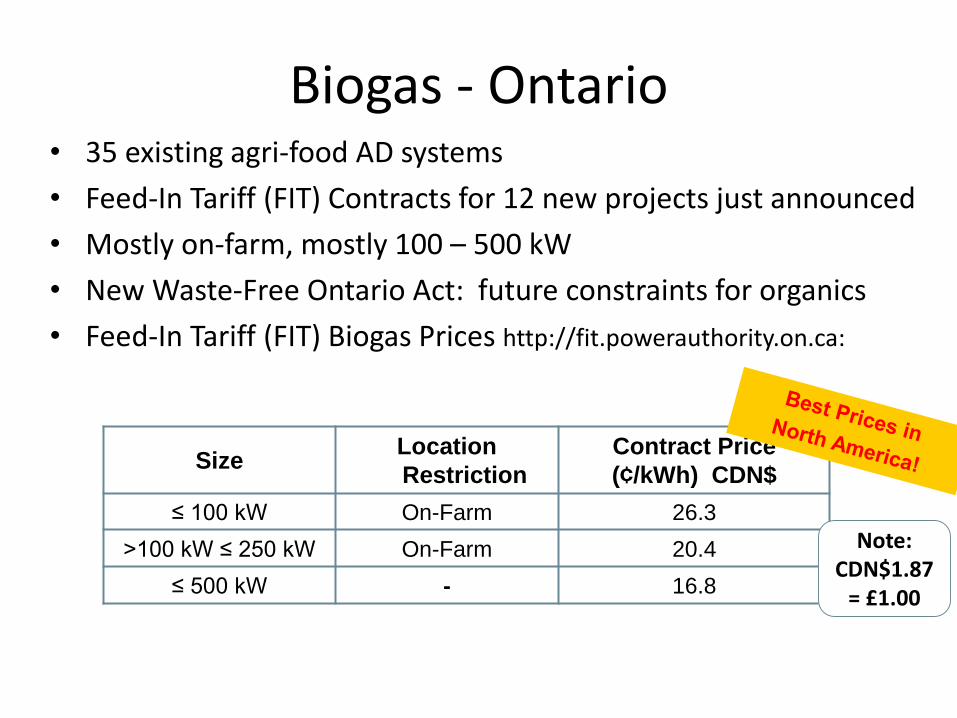
Biogas - Ontario• 35 existing agri-food AD systems
• Feed-In Tariff (FIT) Contracts for 12 new projects just announced
• Mostly on-farm, mostly 100 – 500 kW
• New Waste-Free Ontario Act: future constraints for organics
• Feed-In Tariff (FIT) Biogas Prices http://fit.powerauthority.on.ca:
SizeLocation
Restriction
Contract Price
(¢/kWh) CDN$
≤ 100 kW On-Farm 26.3
>100 kW ≤ 250 kW On-Farm 20.4
≤ 500 kW - 16.8
Note: CDN$1.87
= £1.00

Ontario – Climate Change Action Plan
• Cap and trade program
– 5 year plan to fight climate change, reduce greenhouse gas pollution and transition to a low-carbon economy.
– Emissions reductions targets

Ontario’s Climate Change Action Plan:
Anaerobic Digestion Opportunities:
1.3 Pilot waste and agricultural methane as a fuel source
– Biogas from agricultural materials or food wastes for transportation purposes, with funding for commercial-scale demonstration projects.
4.1 Green Commercial Vehicle Program
– Incentives to buy low-carbon commercial vehicles and technologies
4.2 Build a network of low-emission fuelling stations
– Establish a network of natural gas and low- or zero carbon fuelling stations.
6.1 Establish low-carbon content for natural gas
– Renewable content requirement for natural gas

UK Biogas Opportunities in Canada
• Canadian biogas companies experienced in international partnerships
• UK programs (Renewable Heat Incentive, Low Carbon Truck Demo) give UK companies experience for new biomethane opportunities in Canada
• Similar business culture and language

Next Steps for UK Companies
• Summary: Why do Biogas Business in Canada?
1. Ontario Climate Change Action Plan: exciting pathway forward
2. Ontario: Best Feed-In Tariff in North America
• Contact the Canadian Trade Commissioner Service
– Rachel Soares, Trade Commissioner | SustainableTechnologies
– Tel: 020 7004 6219 [email protected]
• Business Immigration to Ontario: www.investinontario.com/bi/

Come to Toronto March 2017!
www.biogasassociation.ca
• Ontario Ministry of Agriculture Food and Rural Affairs (OMAFRA) www.ontario.ca/biogas
• OMAFRA Biogas contacts:• [email protected]• [email protected]

THE GLOBAL DRIVERS FOR
AD
INSIGHT INTO ARGENTINA
JORGE ANTONIO HILBERTNATIONAL AGRICULTURAL TECHNOLOGY INSTITUTE

INSIGHTS INTO ARGENTINA
Jorge Antonio Hilbert

The law prioritizes projects that accomplish the following criteria:
Sponsored by small and medium sized companies. Belong to farming producers. Located in regional and rural economies. New law imposes renewable targets for the private sector
* Law 26.093 extends benefits to sugar plants, sugarcane and ethanol producers
LAW 26.093/2006: PROMOTES THE PRODUCTION AND USE OF BIOFUELS(Implemented by Decree 109/07).Mandatory use 7% bioethanol and 9% biodieselDefinition of domestic prices for biofuelsQuality standardsLAW 26.190/2006 8 % Renewables in Electric energy generationLAW 27.191/2015 20% 2020 Under regulation process
PROMOTION OF RENEWABLE ENERGY

Agriculture Sector
Livestock Sector
Forestry Sector
Argentina is a main producer of raw materials and manufactures
Based on WISDOM, power installed capacity could be increased up to 1,325 MW of total electricity capacity and by 1,325 MW of thermal generation by 2030
Industries
BIOENERGY FROM RESIDUES IN ARGENTINA

*
Program to promote the use of biomass for energy production in Argentina (PROBIOMASA)
Implemented by the Government of Argentina through the Ministries of Agriculture and Energy, with technical
assistance from FAO.

0
20
40
60
80
100
120
140
160
180
200
220
240
260
280
300
40% 35% CC TV CC Pulveriz IGCC
VIENTO MINI HIDRO GEOTÉRM. SOLAR (CSP) GASNATURAL
FUEL OIL DIESEL CARBÓN NUCLEAR
US$/MWh
CO2 @ 20 US$/ton
Combustible
O&M
Costo Capital
Cost of competitive MWh
Costo Combustible.: Gas Natural @ 12 US$/MMBTU
Petróleo @ 100 US$/bbl
Carbón CIF @ 150 US$/ton
Costo de Capital (US$/kW) / Viento 2000/40% Mini Hidro 2200/50%
Factor de Carga (%): Solar CSP 4000/30% Geotérmica 3900/85%
CC (gas) 900 Carbón Pulv. 2000
Nuclear 4000 Carbón IGCC 3000
Rentabilidad: TIR 10% después de IG
sobre activos (i.e. sin leverage)
Sin IVA. Contratos de 20 años .
Prices payed by consumers 3 to 10 US$/MWh
251

80PROJECTS UNDER
CONSTRUCTION
35PROJECTS
UNDER
EVALUATION
16PROJECTS IN
OPERATION
FIRST SURVEY OF BIOGAS PROJECTS

49
14
37
PLANTS SIZE
Small less than 1 to100 m3 Medium 100 to 1000 m3 Big over 1000 m3


Technology Providers


Empresa Provincia LocalidadEtapa del
proyectoSector Actividad
Capacidad
instalada
Origen de la
biomasa
Biogás Argentina Buenos Aires Carlos Tejedor ConstrucciónEnergía termica o
eléctrica
Biodigestion de
efluentes0,4 MW Feedlot
Bio4/Bioeléctrica Córdoba Rio Cuarto Construcción Energía eléctricaProducción de
biogás1 MW
Cereales &
Oleaginosas
Alimentos Magros
S.A. (ACA)San Luis Juan Llerena Construcción Cogeneración
Producción de
biogás1,5 MW
Industria
porcina
Gral. Pirán Biogás
guano aviarBuenos Aires General Pirán Cartera
Biogás- energía
eléctricacama de pollos 0,6 MW
Industria
avícola
Proyecto RSU
Cooperativa Rocío
(Gral. Rodríguez)
Buenos AiresGeneral
RodriguezCartera
Biogás- energía
eléctricaRSU - biomasa 11 MW? RSU
Adecoagro Tambos
La LacteoCórdoba
Capilla de los
RemediosCartera
Biogás- energía
eléctricatambo bovino 1-3 MW Tambo
Avícola Las Camelias
S.A.Entre Ríos San José Cartera Energía Eléctrica
Motor con
biogás0,6 MW
Industria
avícola
Don Guillermo S.R.L Misiones El dorado CarteraBiogás- energía
eléctrica
Producción de
biogás100 kw
Feedlot,
Cerdos
Solamb SRL Santa Fe Timbúes Cartera Energía eléctricaMotor con
biogás1 MW
Efluentes
biodiesel
Cooperativa Agricola
e Industrial San
Alberto (Puerto
Rico)
Misiones Puerto Rico Cartera Energía térmicaProducción de
biogás
10000
m3/día
biogás
Paladini Santa Fe Arroyo Seco Cartera Energia termicaBiodigestión de
efluentes
FIRST SURVEY OF BIOGAS PROJECTS

RESOURCES FOR BIOGASPRODUCTION
DEPTH OF STUDIES
NATIONAL
PROVINCIAL
LOCAL
CASE STUDIES

BIOMASS SOURCES STUDIED BY INTA
biogas from whine industry
biogas from vinace from sugarcane bioethanol
biogas from fruit juices
AGROINDUSTRY biogas from dairy industry
biogas from fruit and vegetable processing
biogas from beer industry
biogas from bread and other flour industries
SLAUGHTERHOUSESbiogas from slaughterhouses and meat processing
FISHERIES biogas from fish transforming chain
ANIMAL RESIDUES biogas from feedlots and dairies
biogas from confines swine production
biogas from chicken and egg production
CROP RESIDUES …

Implementation
of an
Geographic
Information
System on
Biomass
Resources
WISDOM-FAO
MethodologyWoodfuel Integrated
Supply/Demand Overview
Mapping

IDENTIFICATION OF RAW MATERIALS THAT COULD
BE USED
STUDY OF WASTE-GENERATING
AGRICULTURAL CHAINS
LOCALIZATION OF THE INFORMATION IN THE GEOGRAPHICAL SPACE
AGROINDUSTRIAL RESIDUOS DE CULTIVOS PODA
METHODOLOGY

Argentinean Crop Residue Supply E F M A M J J A S O N D
Vineyard pruning X X X X
Grape pomace X X X X
Olive pruning X X X
Olive Pomace X X X X X X
Sugaarcane--RAC X X X X X X X
Sugarcane-Bagaze X X X X X X X
Wheat X X X
Maize X X X X

SUrveyed projects 2016

Surveyed projects 2016

Research at experimental stations

YANQUETRUZ 1300 Mothers
SUBSTRATES Pig manure: 150 m3/day Corn/sorghum silage: 50 ton/day
PLANTA CONFIGURATION two Primary Biodigestrs 3619 m3 c/u Two secundary Biodigesters 2897 m3 c/u Two CATERPILLAR engines 756 kw Electric power= 1,53 Mw Heating system Emergency Torch 800 m3 / h Blowers 400 mbar y 390 m3/h
BIOGÁS PRODUCTION12.887 m3/day8.000 Mw/year

BIOELECTRICA FINISHED FIRST DIGESTER WITH PLANS TO CONSTRUCT 60 PLANTS OF 1 Mw
Investors 29 farmers

FIRST FEEDLOT IN THE PROVINCE OF BUENOS AIRES


281
New Plants 2015
Feedlot biogás plant in Buenos Aires province
Wet residue plant in San Luis Urban + agroindustrial residues Santa Fe

WORLD CONFERENCE BUENOS AIRES 23 AL 25 SEPTEMBER 2016
Workshop (1)
Merida
Workshop (2)
Buenos Aires
Conference (3)
Brazil
Workshop (4)
Houghtona. Community
impacts,
b. water /
energy
nexus,
c. biodiversity /
ecosystems
d. energy policy,
e. life cycle
assessment,
f. food and other
systems,
g. biogeochemical
cycles, and
h. biomass supply
transportation
logistics.
http://www.aiche.org/panamrcn/events/rcn-conference-on-pan-american-
biofuels-and-bioenergy-sustainability

283
Former Agriculture Subcommittee
The Subcommittee has:
– Hosted meetings and workshops in more than a
dozen countries.
– Assisted in the development of 13 country-
specific action plans and 10 resource
assessments.
– Showcased more than 30 project opportunities
and success stories at the 2010 Expo.
– Developed international guidance for evaluating
and reporting Anaerobic Digestion system
performance

284
Subcommittees Commonality
Municipal Wastewater
Municipal Solid Waste
Agriculture
Biogas

285
Biogas Subcommittee
Municipal Solid Waste
Subcommittee
Agriculture
Subcommittee
Municipal Wastewater
Subcommittee
Biogas
Subcommittee

286
Subcommittee Cooperation
• Biogas capture and
use for energy is the
unifying force binding
all 3 sectors in the
Biogas
Subcommittee
• Centralized
wastewater
treatment
• Food waste
diversion
• Livestock manure
digesters
• Household/small
scale digesters
• Co-digestion of organic
wastes in wastewater or
manure digesters
• Co-location of digesters
with landfill gas energy
• Food waste diversion
from landfill as methane
mitigation and feedstock
for digesters
CommonalityAreas of
InterventionSynergies

287

288
http://inta.gob.ar/bioenergia

Ing.Agr. M.Sc. Jorge A. Hilbert
› INTA y UTN
› Tel +54 11 4665-0495 0450
› Mail [email protected]
› http://inta.gob.ar/bioenergia

THE GLOBAL DRIVERS FOR
AD
INSIGHT INTO SOUTH AFRICA
DIARMID JAMEISONSLR CONSULTING
THE GLOBAL DRIVERS FOR
AD
CASE STUDY FROM DUPONT
CONRAD BURKEDUPONT INDUSTRIAL BIOSCIENCES

Bioscience in Biogas
© DuPont 2016

Page 293
Bioscience in Action All Around Us
Animal Nutrition
Home Care and Cleaning
© DuPont 2016

Page 294
Bioscience in Action All Around Us
Sustainable Textiles
Sustainable Deicing Fluids
© DuPont 2016

Of the 900 million solar panels installed in the past 40 years,
½ of them contain DuPont materials
In the past 12 years, solar cell improvements,
with our materials, have yielded
30% higher efficiencies
i.e. same power with
fewer solar panels
Page 295© DuPont 2016

DuPont Not New to Renewable Energy
Page 296
Bioscience transforming today’s fuel supply
© DuPont 2016

297
World’s Largest Cellulosic Ethanol Plant
Enzymes Converting
Biomass into Fuel
© DuPont 2016 Photo: DuPont Cellulosic Ethanol Plant, Nevada, Iowa

Wastewater Treatment Plant
Anaerobic
Digestion
Biogas (rich in methane)
Gas Network
Transportation Fuel
Heat and Electricity
sludge
organic
waste
Fertilizer
Biogas Production Today
Page 298© DuPont 2016

Wastewater Treatment Plant
Anaerobic
Digestion
Biogas (rich in methane)
Gas Network
Transportation Fuel
Heat and Electricity
sludge
organic
waste
Fertilizer
Enzymes Making A Difference
Enzymes Added to
Anaerobic Digestion
Increases
Gas Production
Reduces
Substrate Intake
Page 299© DuPont 2016

Enzymes Reduce Feedstock Intake Requirements
Page 300© DuPont 2016

Enzymes Reduce Viscosity
Page 301© DuPont 2016

Enzymes Increases Biogas Output
Page 302© DuPont 2016

Enzymes Lower Operating Costs
Page 303© DuPont 2016

© DuPont 2016

THE GLOBAL DRIVERS FOR
AD
ITALIAN BIOGAS CHAIN
LORENZO MAGGIONICONSORZIO ITALIANO BIOGAS

The Italian biogas chain:state of art and prospective of
development
Lorenzo Maggioni, R&D

Consorzio Italiano Biogas
(Italian Biogas Consortium)
The CIB - Italian Biogas Consortium, formed in March 2009, has national coverage and aimes to be the reference point in the italian biogas and biomethane sector.
European
projects
MEMBERS

BIOGAS IN ITALYState of art
• 3th biogas sector after China & Germany.
• 4 Billion € invested in the last 5 years.
• > 1800 biogas plants built (agriculture + sewage + waste + industrial).
• > 1.300 MWel.
• About 3 billion Nmc Biomethane equivalent utilized per year .
• Less than 2% of italian agricultural land used for monocultures.
• 12.000 qualified green jobs created thanks to biogas
(for the moment biogas used only
for electricity production!)

Entry into force (art. 9 of the Decree) :
18 december 2013
Duration: upgrading plants that will be in service by 17 december 2018
PROSPECTIVE OF DEVELOPMENTBiomethane - Decree 05 December 2013

PREMIUM TARIFF linked to the market price of natural gas
Duration of the incentive: 20 years
Supplementary incentives for use of by-products and if < 500 m3 CH4/h
CASE 1: Biomethane injected into the natural gas grids
In the best scenario
(< 500 m3 CH4/h, use of 100% by-products, single buyer = GSE):
79,6 €/MWh
FOR THE MOMENT, ISN’T POSSIBLE
DIFFERENT SCENARIOS DEPENDING ON FINAL USE OF BIOMETHANE
BUT THEY HAVE RECENTLY PUBLISHED IMPORTANT TECHNICAL
RULES
PROSPECTIVE OF DEVELOPMENTBiomethane - Decree 05 December 2013

UNCERTAINTY
• Quality parameters and quality measurement?
• Value of certificates?
• Injection into the grid?
During the Summer 2016, they will publish a new Decree for biomethane
subsidies
29/05/2016: Delibera 204/2016/R/gas
PROSPECTIVE OF DEVELOPMENTBiomethane - weakness

Why USING BIOMETHANE LIKE A FUEL ?
Why BIOMETHANE?
flexible input material, flexible sale options, storable,
efficient, tailored to demand, climate-friendly
PROSPECTIVE OF DEVELOPMENTBiomethane - strenghts

316
In 2018 it means ~225 Mm3 biomethane (compressed or liquified)
ADVANCED BIOFUELS MANDATE
biofuels Advanced biofuels
PROSPECTIVE OF DEVELOPMENTBiomethane - Opportunities

Italian Gas Grid infrastructure data:
• Primary transport network: 34,000 km;
• Distribution: 250.000 km networks.
High interest from industrial groups
Total NGV Number of NG filling station
~ 1.000.000 ~ 1.150
PROSPECTIVE OF DEVELOPMENTBiomethane - opportunities

A realistic development plan of methane/biomethane within 2020
• doubling service stations to 2000;
• Doubling current means of transport consumption of CNG methane (preferably
LNG) up to about 2 billions Nm3 by 2020;
• Increasing biomethane consumption up to 25% of the total consumption, about
500.000.000 Nm3/year (bio-CNG or bio-LNG)
PROSPECTIVE OF DEVELOPMENTBiomethane - potential

CONCLUSIONS
As the chemical composition and energy content of biomethane are close to natural gas, it can likewise be used in the same way:
• gas grid injection and used as a natural gas substitute in any blend proportion;
• vehicle fuel .
Biomethane is a very important advanced bio-fuel. It could contribute to the European climate targets thanks to the reduction of CO2 eq emissions, it advances security of supply and European energy independency from third countries.Biomethane production also generates green jobs.
In Italy biomethane has enormous potential. It is important to remove, as soon as possible, some of the major barriers for his development.

CIBConsorzio Italiano Biogas
c/o Parco Tecnologico PadanoVia Einstein, Loc. Cascina Codazza Lodi (LO)
+39(0)3714662633 Fax +39(0)3714662401www.consorziobiogas.it
Lorenzo Maggioni, [email protected]
THANKS FOR YOUR ATTENTION!

QUESTIONS AND COMMENTS FROM THE FLOOR