Conference Proceedings International Conference …...Contextualization and Localization:...
95
Conference Proceedings International Conference on Climate Change-2017 (ICCC 2017) 16 th -17 th , February, 2017 Colombo, Sri Lanka Committee of the ICCC - 2017 The International Institute of Knowledge Management (TIIKM) Tel: +94(0) 11 3132827 [email protected]
Transcript of Conference Proceedings International Conference …...Contextualization and Localization:...

Conference Proceedings
International Conference on Climate Change-2017
(ICCC 2017)
16th-17th, February, 2017
Colombo, Sri Lanka
Committee of the ICCC - 2017
The International Institute of Knowledge Management (TIIKM)
Tel: +94(0) 11 3132827

ii
Disclaimer
The responsibility for opinions expressed, in articles, studies and other contributions in this
publication rests solely with their authors, and this publication does not constitute an
endorsement by the ICCC or TIIKM of the opinions so expressed in them.
Official website of the conference
www.climatechangeconferences.com
Conference Proceedings of the International Conference on Climate Change - 2017
(ICCC 2017)
Edited By Dr. Erandathie Lokupitiya
ISSN 2513-258X online
Copyright @ 2017 TIIKM
All rights are reserved according to the code of intellectual property act of Sri Lanka,
2003
Published by The International Institute of Knowledge Management (TIIKM), 531/18,
Kotte Road, Pitakotte, 10100, Sri Lanka
Tel: +94(0) 11 3132827
Fax: +94(0) 11 2835571
iii
Hosted By:
University of Colombo, Sri Lanka
Academic Partner:
The University of Leicester, United Kingdom
Supporting Ministry:
Climate Change Secretariat, the Ministry of Mahaweli Development and Environment, Sri
Lanka
Strategic Partners:
Environmental Foundation (Guarantee) Limited, Sri Lanka.
Co - Organized By:
The International Institute of Knowledge Management (TIIKM)
Jlanka Technologies (Pvt) Ltd
DR. ERANDATHIE LOKUPITIYA (Chair, ICCC 2017)
Department of Zoology and Environmental
Sciences, University of Colombo, Sri Lanka
PROF. SCOTT DENNING (Keynote Speaker, ICCC 2017)
Monfort Professor, Department of Atmospheric
Science, Colorado State University, Director of
Education, Center for Multiscale Modelling of
Atmospheric Processes
DR. ELEANOR MILNE (Keynote Speaker, ICCC 2017)
University of Leicester, UK
MR. ISANKA. P. GAMAGE (Conference Convener, ICCC 2017)
The International Institute of Knowledge
Management
ICCC 2017 Committee

iv
MR. OSHADEE WITHANAWASAM (Conference Publication Chair, ICCC 2017)
The International Institute of Knowledge
Management
MS. SANDALI GURUSINGHA (Conference Coordinator, ICCC 2017)
The International Institute of Knowledge
Management

v
DIRECTOR’S MESSAGE, CLIMATE CHANGE SECRETARIAT
It is an honour and a privilege to deliver this message on behalf of the Climate Change Secretariat of
the Ministry of Mahaweli Development and Environment for this important event of the International
Conference on Climate Change 2017 organized by the International Institute of Knowledge
Management and hosted by the University of Colombo, Sri Lanka. As most of us aware, one of the
major challenges faced by the world community today is the rise of global warming mainly due to
human activities. With the world population increase, it seems more pollution will be taken place.
Hence it is undebatable that immediate actions have to be taken to control further rise of global
warming due to unlimited targets.
During the last three decades, concerns have constantly been growing on climate change and its
consequences. At the 21st session of Conference of Parties of the United Nations Framework
Convention on Climate Change (UNFCCC) conducted in Paris in 2015 a decision was taken to act
together as a global community to limit the rise of global warming below 2 degree Celsius by 2100.
Additionally, the agreement aims to strengthen the ability of countries to deal with the adverse
impacts of climate change.
Climate change is now inevitable and it will affect all systems, sectors and communities. Some of
them may be highly vulnerable and some may be less vulnerable. However all sectors and
communities must put an effort to build resilience over adverse impacts of climate change
accordingly. There are many scientific researches going on regarding climate change and its various
aspects all over the world. Intergovernmental Panel on Climate Change (IPCC) is the main institution
where all these research information gathered and compiled for the future requirements. Even though
there are many researches going regarding climate change in Sri Lanka, this information is scattered
in many local and international research agencies. In addition quantitative climate change impact
assessments, reliable forecasting are still hard to find. Therefore these areas should be particularly
addressed in research fields.
At this juncture I must emphasise that climate change mitigation and adaptation will require close
cooperation between scientific and development communities. This effort therefore is both timely and
important. Finally I take this opportunity to express my sincere gratitude to International Institute of
Knowledge Management and University of Colombo for their collaborative effort in organizing this
conference and I wish a great success of this great event.
Dr. R.D.S. Jayathunga,
Director,
Climate Change Secretariat,
Ministry of Mahaweli Development and Environment,
Sri Lanka.

vi
THE MESSAGE FROM THE CONFERENCE CHAIR
Climate change has become the most important environmental issue of the century, given the
devastating impacts it has caused all over the world. Increased frequency of floods, heatwaves,
droughts, and associated impacts can be heard not only from tropical islands like Sri Lanka, but also
from land-locked countries or areas within such countries all around the world. The history since
industrial revolution provides ample evidence for human interference with the earth’s climate system
mainly through increased rates of deforestation, fossil fuel burning, and various other activities, in
fulfilling the ever-increasing needs of the humanity.
In dealing with climate change, international cooperation and knowledge sharing with regard to new
developments in the field are essential, as no single nation alone can deal with the complicated
impacts associated with this global issue. The Paris Agreement adopted at the 21st Conference of the
Parties of the UNFCCC (COP21) held in Paris in 2015 aims at limiting the global average
temperature rise during the century to well below 2 0C above pre-industrial levels by taking necessary
action. The 1st International Conference on Climate Change 2017 (ICCC-2017) organized by The
International Institute of Knowledge Management (TIIKM) will be held with the theme ‘Climate
Change, Facing the challenge beyond COP21’, as there is a big challenge ahead of us in facing the
impacts of climate change while trying our best to reach the above targeted emission reduction by the
end of the century.
One of the key goals of the conference is creating dialogue among those involved in research and
development activities in Climate Change Mitigation, Vulnerability, and Adaptation, nationally and
internationally. As the Chair of the conference I hope this event will create continued dialogue during
and beyond the ICCC-2017, with the participation of local and international scientists. Through this
event, it is envisaged to share and disseminate information relevant to research and development
experiences encompassing important areas such as vulnerability to the impacts of climate change on
food security, biodiversity and natural resources, health and sanitation, developments in adaptation
and mitigation research, and various other aspects such as greenhouse gas measurements, modelling
and climate predictions, etc. It was a difficult task to select the abstracts for the conference from the
large number of abstracts we received. I wish the presenters of selected abstracts, representatives of
the universities, research institutes, and governmental- and non-governmental institutions, etc.,
including the young scientists to have a fruitful gathering benefitting towards the betterment of their
future work.
Dr. Erandathie Lokupitiya,
Senior Lecturer,
Department of Zoology and Environment Sciences,
Faculty of Science,
University of Colombo,
Sri Lanka.
vii
Editorial Board-ICOM 2013
Editor in Chief
Dr. Erandathie Lokupitiya, Department of Zoology and Environmental Sciences, University of
Colombo, Sri Lanka
The Editorial Board is not responsible for the content of any abstract
Prof. Chandana Jayaratne, University of Colombo, Sri Lanka
Prof. S.W. Kotagama, University of Colombo, Sri Lanka
Prof. Keith Paustian, Colorado State University, USA
Prof. Prem Chand Pandey, The Institutes of Technology Bhubaneswar, India
Prof. Md. Giashuddin Miah, Bangabandhu Sheikh Mujibur Rahman Agricultural University, Bangladesh
Dr. Catherine Stewart, USDA‐ ARS, USA
Dr. Thusitha Sugathapala, University of Moratuwa, Sri Lanka
Dr. M.C.M Iqbal, National Institute of Fundamental Studies, Sri Lanka
Dr. Bashir Ahmad, Climate Change, Alternate Energy and Water Resources Institute (CAEWRI),
Pakistan
Dr. Tapas Bhattacharyya, Dr. Balasaheb Sawant Konkan Krishi Vidyapeeth, India
Dr. Peter Kamoni, Kenya Agricultural and Livestock Research Organization (KALRO), Kenya
Dr. Prabir Patra, Japan Agency for Marine-Earth Science and Technology (JAMSTEC), Japan
Dr. Divya Pandey, Stockholm Environment Institute, UK
Dr. Eric D. Wikramanayake, Environmental Foundation Limited, Sri Lanka
Dr. Sushil Kumar Dash, Indian Institute of Technology Delhi, India
Dr. K. J Sreekanth., Energy and Building Research Center (EBRC) at Kuwait Institu te of Scientific
Research (KISR), Kuwait
Mr. Dinaratne Sirisena, Rice Research Development Institute, Sri Lanka
Ms. Chamila Weerathunghe, Environmental Foundation Limited, Sri Lanka
Prof. Sara Curran, Henry M. Jackson School of International Studies, University of Washington, USA
Dr. Sameera R Samarakoon, Institute of Biochemistry, Molecular Biology and Biotechnology, University
of Colombo, Sri Lanka
Dr. Farshid Talat, West Azarbaijan Agricultural and Natural Resources Research and Education Center,
Iran
Prof. Deepthi Wickramasinghe, Department of Zoology,University of Colombo
Editorial Board - ICCC - 2017
Scientific Committee - ICCC - 2017

viii
Dr. Athula Senarathne, Institute of Policy Studies
Mr. Anura Ranwala, Coastal Inland Water and Environmental Consultant
Mr. K. H. M. S. Premalal, Department of Meteorology, Sri Lanka
Ms. I. M. S. P. Jayawardane, Department of Meteorology, Sri Lanka
ix
Table of Contents Page No
1. Climate Change: Biodiversity Conservation with Reference to Thar Desert
Hansa Meena
1-6
2. Estimation of Asian and Global Carbon Fluxes Using Maximum
Likelihood Ensemble Filter (MLEF)
K.M.P. Perera, R.S. Lokupitiya, D. Zupanski, A.S. Denning, R.G.N.
Meegama, E.Y.K. Lokupitiya, P.K. Patra
7-19
3. Contextualization and Localization: Acceptability of the Developed
Activity Sheets in Science 5 Integrating Climate Change Adaptation
Kim Alvin De Lara
20-24
4. Institutional Analysis of the Global Climate Change Regime:
Literature Review of International Climate Negotiations Minna Havukainen
25-39
5. Impact of Changed Rainfall Patterns Due to Climate Change and
Usage of Available Weather Information by Communities Who Face Human Elephant Conflict (HEC) in Udawalawe, Sri Lanka
N.M.K.C. Premarathne, S.T.M. Dissanayake, S. De Silva, U.S. Weerathunga, T.V.P Kumara
40-50
6. Drip Irrigation to Enhance Water Productivity of Rice under Climate Change
S.N.C.M. Dias, Niels Schütze, Franz Lennartz
51-56
7. Uncertainties and Challenges in Distribution of Groundwater Recharge in Climate Change Scenario
Shivaji Patil, Jagottam Agrawal
57-78
8. Future Climate Projections for Annual and Seasonal Rainfall in Sri Lanka using CMIP5 Models
Thanuja Darshika, Shiromani Jayawardane
79-85

x

Proceedings of the International Conference on Climate Change, Vol. 1, 2017, pp. 1-6
Copyright © 2017 TIIKM
ISSN 2513-258X online
DOI: https://doi.org/10.17501/iccc.2017.1101
International Conference on Climate Change - 2017 (ICCC 2017)
Climate Change: Biodiversity Conservation with Reference to
Thar Desert
Hansa Meena
University of Rajasthan, India
Abstract:
The aim of this paper is to analyze the impact of climate change on biodiversity; study the
conservation of biodiversity and implications of government policies in the study area. The pattern
of current rainfall and temperature in the study area has unexpectedly changed. This paper focuses
on the conservation of the species that reached the verge of extinction in the Thar Desert of Western
Rajesthan, India.
The information relevant to climate change, degradation of biodiversity and conservation of
Biodiversity were collected from state Weather Department and State Biodiversity Board,
Government of Rajasthan, Jaipur, India. The information of rain rainfall and air temperature were
collected from State Irrigation Department, Government of Rajasthan, Jaipur and the Research
stations of Central Arid Zone, Research Institute of Bikaner, Jaisalmer, Jodhpur and Pali. The data
was analyzed for long term changes using regression analyses.
According to the data from weather department of Rajasthan government the pattern of rainfall and
temperature has been changed over the past 100 years. Many of the protected species of fauna and
flora are on the verge of extinction; forested area is also decreasing in the area. The conservation of
water has become the vehicle for the conservation of the biodiversity in the Thar Desert. The water
in the Indira Gandhi canal command area, if used judiciously, may encourage biodiversity.
It was found that the awareness creation among people is very important for biodiversity
conservation.
It is helpful to understand impact of climate on fauna and flora in conservation planning.
The maintenance and conservation of biodiversity is needed for human survival. People in Thar
Desert have survived for ages with the application of their collective intelligence in conserving
biodiversity.
Keywords: Thar Desert, climate change, biodiversity, variability
Introductioni
By the end of 21st century the impact of climate change as projected by Inter Governmental panel on climate
change (IPCC, 2007) is more likely on arid ecosystem than in semi-arid or sub-humid regions of India. Thar
Desert in Rajasthan, spreading in twelve western districts of the state covering 19.61 million ha, is very
fragile and subjected to excessive stresses due to frequent drought and low rainfall. Climate change results in
shifting rainfall patterns, increased temperature, more demand for water and it can be a significant driver of
biodiversity with changing life cycles, migration, loss and invasion of new habitat s in Thar region. Biological
diversity and climate are closely interconnected and each impacts the other. Biodiversity always builds natural
resilience to climate extremes as forests are natures social security check in times of disaster and crisis,
additionally forests also act as a sink for greenhouse gas emissions such as Carbon dioxide.

Hansa Meena / Climate Change: Biodiversity Conservation ….
2
Rajasthan state is the largest state of India, where has areas of climate change sensitivity.
In the recent times the state has experienced severe and frequent spells of drought than any other region in
India. According to the State Control Board the reason suffers from increased water shortage due to reduction
in rainfall as well as increased evapo-transpiration due to global warming. These types of changes are directly
responsible for the loss of biodiversity.
The desertification process may continue due to increased biological activity , as a result of over-grazing and
loss of vegetation cover with consequent more radiant energy loss and reduction in convective activity
(Sikka.1997). Soil degradation and loss of vegetation impact the thermodynamic balance in the north western
India and expansion of Thar Desert due to this can lead to a pronounced and large scale impact on summer
monsoon hydro climate of the north western region of India. (Bollasina and Nigam, 2011)
Western part of India is rich in biological diversity with arid climatic conditions of the region suitable for
adaptation of different species in the TharDesert. There are extreme weather conditions such as low rainfall,
high temperatures, strong winds as well as low humidity making it inhospitable to different habitats leading to
animal migration and loss of their habitats within the Thar region (Rao, 1992; 2005; 2009). The objectives of
this research are to analyze the impact of climate change on biodiversity in the Thar Desert, study the status of
conservation of biodiversity, study implication of government policies in Thar Desert to conservation of
biodiversity, and study the level of environmental awareness among the people.

Proceedings of the International Conference on Climate Change, Vol. 1, 2017, pp. 1-6
3
Study Area
Figure: 1. Map of the study area
The study area is located in Western Rajasthan covering around 2% of the land of Jaisalmer, Barmer, Bikaner
and Jodhpur district; it is a part of the Thar desert spread over 446,000 sq. km on both sides of Indo -Pak
border covering the southern part of Haryana, Punjab and province o f Pakistan. Bounded by River Sindh in
the West, River Sutlej in the northwest, the Aravalli range in the east, and the salty marshes of the Rann of
Kutch in the South, the study area extends over 208, 110 sq. km. Climatically, it is hot and dry rainfall is
scanty. Its physical build is however not so uniform; there are sand dunes, plains, hills, and salty marshes, etc.
Luni is the only river that meanders through the desert and reaches the Arabian Sea through the Rann of
Kutch; it is said to be the remnant of river Saraswati along which Vedas, the first written books of the world ,
were composed. Apparently, what is scrubland today was full of lush vegetation once upon a time. 300
million years ago, the dinosaurs and their ascendants roamed in this part of India.
Methodology
The information relevant to climate change, degradation of biodiversity and conservation of Biodiversity were collected
from state Weather Department and State Biodiversity Board, Government of Rajasthan, Jaipur, India. The information of
rain rainfall and air temperature were collected from State Irrigation Department, Government of Rajasthan, Jaipur and
the Research stations of Central Arid Zone, Research Institute of Bikaner, Jaisalmer, Jodhpur and Pali. The data was
analyzed for long term changes using regression analyses.
Variation in rainfall
Thar Desert covered twelve arid districts in the western part of Rajasthan. This region constitutes 61% of
India area of India hot arid zone, where the annual rainfall varies from 100mm in the extreme, west to 400mm

Hansa Meena / Climate Change: Biodiversity Conservation ….
4
towards eastern part of the study area. The coefficient of annual rainfall varies from 40% in the eastern and
70% in western part of the Thar region, causing larger inter-annual variability in rainfall influencing crop
production; the drought has affected crop as well as fodder production. Bikaner district experienced severe
agricultural drought in 24% of the years and moderate drought in 26% of the years, whereas, Jodhpur district
experienced severe drought in 18% of the years and moderate drought in 29% of the years, showing its
variation in rainfall pattern due to climate change.
According to the present study, the overall regional annual rainfall (1911-2011) for Thar showed no
significant rise (0.56 mm/year) in the rainfall. The rainfall trend at different locations showed that the annual
rainfall is likely to change by +100 mm at Bikaner, +124mm at Jaisalmer, -40mm at Jodhpur and +21 mm at
Pali. Long- duration crops like pearl millet, Sorghum are likely to be replaced with short duration and
traditional crops like cluster bean, moth bean and gram where rainfall is expected to decrease in 21st century
(Rao and Purohit, 2009). To cope up with the delayed monsoon conditions, crop contingency plans (Joshi and
Amalkar, 2009) should be adopted.
Biodiversity of Thar Desert:
Thar Desert is not all sand; there are hillocks and sandy as well as grow plains too. This diversity in habitat
has given rise to more diversity in vegetation, animal life and human culture in comparison to the ot her desert
regions of the world. Trees are few ; but thorny bushes and shrubs in small patches are scattered all over the
region. The main tree species found here are Acacia, milotica, tamarix aphylla, prosopis cineraria (Khejri).
The dominant scrubs are calligonum polygonoides, crotalaria Spp, and Haloxylon recurvum. Among the
xerophilious grasses of the region are Aristida adscensionis, and Cenchrus biflorus.
The desert of Rajasthan contains 25 species of serpents and 23 species of lizards. The endangered Great
Indian Bustard, the Black buck, Indian wild ass and the Indian Gazelle are found here.
Out of the above species, some species like the great Indian bustard are being affected by climate change as
well as human causes.
Major findings in relation to climatic change
The Northern part of India is expected to be warmer than the southern part of the country. The summer monsoon
rainfall in India will increase and extreme rainfall events would rise sharply. The rainfall trend during the last
100 years revealed that the summer monsoon rainfall, which contributes more than 85% of the total annual
rainfall in the region, has increased marginally (<10%) in the South and East part of the Thar Desert, but has
already declined by 10-15% in its north-western part of India. Earlier studies on changes in rainfall and air
temperatures of north-west part of India showed that the rainfall increased marginally by 141 mm in the past
100 years (Pant and Hingane, 1988), especially in the irrigated belt of Ganganagar region particularly during the
past 3 decades (Rao, 1996)
Conservation of Biodiversity
Biodiversity can be conserved in two ways: ex-situ (i.e. out of the natural habitat) and (in-situ within the
natural habitat) conservation.
In-situ conservation maintains the genetic diversity of the species; at the same time it helps the species to
adapt to the changing environment caused by nature or anthropogenic activities. It also helps in preservation
of other related species of the habitat. For this type of conservation technique certain a rea are designated as
protected sites. It is being promoted by the man and Biosphere (MAB) program of the United Nations
educational, scientific and cultural organization (UNESCO).
The ex-situ methods of biodiversity conservation include creation of zoos where captive breeding programs
are carried out; development of aquaria for research, public information and education; and plant collections
Proceedings of the International Conference on Climate Change, Vol. 1, 2017, pp. 1-6
5
through seed storage and breeding. Zoos are not just public display facilities and for educating people about
wild animals, but are also for captive breeding specially of the vertebrates such as panda and dormouse that
are facing extinction.
There are a number of biodiversity conservation sites in Indian desert. The most important and by for the
largest among them is Desert National Park, Jaisalmer. It spreads over 3162 km2, and it is an excellent
example of the ecosystem of the Thar Desert, and its diverse fauna. Among the measures being adopted to
conserve and preserve the plant life in Indian desert is greening of the desert.
The scientists of Central Arid Zone Research Institute (CAZRI), have successfully developed and improved
dozens of traditional and non-traditional crop/fruit plants that produce much larger fruits than before where
can thrive with minimal rainfall. Arid Forest Research Institute (AFRI) situated at Jodhpur, has carried out
scientific research in forestry on order to provide technologies to increase the vegetative cover and to
conserve the biodiversity in the hot arid and semi-arid region of Rajasthan .
In the Thar Desert agriculture is not a dependable proposition because after the rainy season, at least one third
of crops fail. Animal husbandry, with trees and grasses, intercropped with vegetables or fruit trees, is the most
viable model for arid, droughts-prone regions. The region faces frequent droughts and overgrazing due to high
animal populations, wind and water erosion, mining and other industries have resulted in serious land
degradation. In this desert region of Rajasthan is a major opium production and consumption.
The Thar Desert is one of the most heavily populated desert areas in the world with the main occupations of
its inhabitant’s agriculture and animal husbandry. Animal husbandry is the major livelihood in the Thar
Desert. Livestock depends for grazing on common lands in villages. During famine years in the Desert the
nomadic rebari people move with large heards of sheep and camel to the forested areas of south Rajasthan.
Concluding Remarks
The Thar Desert region is a very sensitive region to changing global climate. Development of strategies,
adaptation of traditional knowledge and practices related to biodiversity conservation and sustainable use
along with modern scientific interventions will lead to mitigation of adverse effects of anticipated climate
change on biodiversity in Thar Desert region.
The present government policies on biodiversity conservation are not working well. Many of the protected
species of wild life are on the verge of extinction and forests are decreasing in area as the pressure of
variability of rainfall and temperature pattern as well as population on land increases. The stage has come,
when each village and city should be asked to reserve at least 20 percent of its land for forests. It may be that
several villages can join hands and have joint forests reserves along the rivers on the hills and other areas not
used for agriculture. Some of the less productive areas can be devoted to forestry. This may not be a very
feasible proportion in states like Rajasthan when climatic restrictions affect forestry.
References
IPCC, Cambridge, Climate Change 2007: The Physical Science Basis. Contribution of the Working Group 1 to
the Fourth Assessment Report of the Intergovernmental Panel on Climate Change. 996 pp. [Solomon, S., D.,
Qin., M. Manning., Z. Chen., M. Marquis., K.b. Averyt., M. Tignor and H.L. Miller (Eds)]. Cambridge University Press, Cambridge. U.K., and New York, the USA, 2007.
Joshi, N.L. and Amal Kar. 2009. Contingency crop planning for dry land areas in relation to climate change. Indian J. Agro. 54 (2): 237-243.
Pant, G.B. and Hingane. L.S. 1988. Climatic changes in and around the Rajasthan desert during the 20 thcentury,
J. Climate 8: 391-401.

Hansa Meena / Climate Change: Biodiversity Conservation ….
6
Ramana Rao. B.V., Sastri and Ramakrishna. Y.S. 1981 an integrate scheme of drought classification as applicable to Indian arid region Idojaras 85: 317-322.
Rao. A.S. Climate. Climatic changes and Paleo-climatic aspects of Rajasthan. In: Geographical facets of
Rajasthan. (Eds: H.S. Sharma and M.L. Sharma), Kuldeep Publications. Ajmer, 1992, pp. 38-44.
Rao, A.S. 1996. Climatic changes in the irrigated tracts of Indira Gandhi Canal Region of arid western Rajasthan. India. Ann. of Arid Zone 38(2): 111-116.
Rao. A.S. 2005. Impact of introduction of IGNP canal irrigation on Micro and Secular changes in Climate of
Thar Desert region In: Changing Faunal Ecology in the Thar Desert (Eds: B.K. Tyagi and Q.H. Baqri).
Scientific Publishers. Jodhpur, pp. 37-44.
Rao, A.S. and Purohit, R.S. 2009. Spatial variability and shifts in rainfall patterns of arid Rajasthan. India.
Proceedings International Conference on "Nurturing Arid Zone for People and the Environment: Issues and Agenda for the 21st Century". Central Arid Zone Research Institute, Jodhpur, pp. 9.
Rupa Kumar. K. Sahai, A.K. Krishna Kumar. K. Patwardhan, S.K. Mishra. P.K., Revadekar, J.V. Kamala. And
Pant. G.P., 2006. High-resolution climate change scenarios for India for the 21st century. Current Sci. 90 : 334-345.
Sikka. D.R. 1997. Desert climate and its dynamics 72(1): 35-46.
Sco.wikipedia.org/wiki/Thar_Desert
www.indiaweather.gov.in
www.rajasthan.gov.in
www.environment.gov.in
Proceedings of the International Conference on Climate Change, Vol. 1, 2017, pp. 7-19
Copyright © 2017 TIIKM
ISSN 2513-258X online
DOI: https://doi.org/10.17501/iccc.2017.1102
International Conference on Climate Change - 2017 (ICCC 2017)
Estimation of Asian and Global Carbon Fluxes Using
Maximum Likelihood Ensemble Filter (MLEF)
K.M.P. Perera1*, R.S. Lokupitiya1**, D. Zupanski2, A.S. Denning3, R.G.N.
Meegama4, E.Y.K. Lokupitiya5, P.K. Patra6
1Department of Statistics, University of Sri Jayewardenepura, Sri Lanka 2Zupanski Consulting, LLC, Fort Collins, CO, USA
3Department of Atmospheric Science, Colorado State University, Fort Collins, Colorado, USA 4 Department of Computer Science, University of Sri Jayewardenepura, Sri Lanka
5 Department of Zoology, University of Colombo, Sri Lanka 6 Research Institute for Global Change, JAMSTEC, Yokohama, Japan
Abstract:
Purpose: CONTRAIL (Comprehensive Observation Network for Trace gases) observations
retrieved by passenger aircrafts is becoming more popular among the researchers who are doing
inverse modelling. The inverted Asian CO2 fluxes still remains challenging with a large uncertainty
due to lack of observations. In this study, we use maximum likelihood ensemble filter (MLEF)
method to estimate the carbon fluxes using CONTRAIL observations in addition to the existing flask
and continuous measurements.
Methodology: A pseudodata experiment is carried out with the artificially generated biases for the
CO2 fluxes. Hourly land fluxes (Net Ecosystem Exchange (NEE)) derived from Simple Bioshere-
version 3 (SiB3) model, Takahashi ocean fluxes and Brenkert fossil fuel emissions are the fluxes
used. Estimated fluxes defined in monthly scale are recovered for the months from May to October
using MLEF coupled with Parametric Chemistry Transport Model (PCTM).
Findings: CONTRAIL observations give a considerable uncertainty reduction for the estimated land
fluxes for the Asian region and more than 50% uncertainty reduction for North American and
European regions. Pseudo truth has been well recovered using this assimilation scheme.
Originality: In the future, this model is going to be used with real observations to identify the
carbon sinks and sources globally as well as mainly for the South Asian region.
Keywords: ensemble data assimilation, Maximum Likelihood Ensemble Filter, CONTRAIL data,
Asian region
Introduction
Climate change is a critical environmental issue closely linked with the increase of greenhouse gases in the
atmosphere. Among greenhouse gases, CO2 plays the main role in greenhouse effect.
Inverse modelling has been used to quantify the spatial and temporal variations of sources and sinks of CO2. The
spatial and temporal distribution of CO2 fluxes provides more information about the global carbon cycle, which
has been analyzed using inverse methods to estimate regional sources and sinks. The literature is rich on inverse
modelling and several applications to CO2 fluxes are Tans et al., 1990; Gurney et al., 2002; Rodenbeck et al.,
2003; Michalak et al., 2004; Bruhwiler et al. 2005; Peters et al. 2005; Zupanski et al. 2007a; Lokupitiya et al.
2008; “Carbon Tracker”, 2011; Niwa et al. 2012; Jiang et al. 2014; Zhang et al. 2014; Thompson et al. 2016.
During past two decades, greenhouse gas emissions from Asian countries have also been increasing rapidly
particularly due to industrialization and population growth. Asia is an important region for the global carbon
Corresponding Author: *[email protected], **[email protected]

K.M.P. Perera et al / Estimation of Asian and Global Carbon Fluxes Using…
8
budget and it is the 4th of the world’s 10 largest national emitters of CO2 (Thompson et al., 2016). Therefore, it
is vital to estimate the CO2 fluxes with high precision for the Asian region. Many efforts have been carried out
to estimate the Asian terrestrial carbon sources and sinks using inverse modelling. But the inverted Asian CO2
fluxes using inverse modelling still remains challenging with a large uncertainty due to lack of observations
(Patra et al., 2012, 2013; Piao et al., 2012; Jiang et al., 2013; Zhang et al.,2014). A comparison study of carbon
flux inversions by Peylin et al. (2013) has shown that there is more consistency between inversions for larger
scales and for the regions where the atmospheric network is denser, as expected. Those studies highlighted t he
importance of the collecting more CO2 observations using new methods in order to achieve good estimates for
the CO2 fluxes. Niwa et al. (2012) has mentioned that the lack of measurements at the surface can be partially
compensated by satellite observations and increasingly by aircraft measurements in the free troposphere.
Newly available, CONTRAIL (Comprehensive Observation Network for Trace gases) observations by Airliner
using passenger aircraft is becoming more popular among the researchers who are d oing inverse modelling.
CONTRAIL aircraft project provides CO2 mole fractions using on-board passenger flights since 2005 and has
produced a large coverage of in situ CO2 data ranging over various latitudes, longitudes and altitudes (Machinda
et al., 2008). Compared to research aircrafts, passenger aircraft CO2 measurements are done at a much lower
cost and could cover larger areas. The CONTRAIL project measures CO2 continuously between Japan and
Europe, Australia, South and Southeast Asia, and North America (Jiang et al., 2014). CONTRAIL CO2
measurements have been used in an inversion system for the first time by Niwa et al. (2012) to identify the areas
of greatest impact in terms of reducing flux uncertainties. Patra et al. (2011) and Zhang et al. (2014) a lso
successfully used CONTRAIL measurements to estimate surface CO2 fluxes.
In this study, we used ensemble based method called maximum likelihood ensemble filter (MLEF) (Zupanski et
al., 2005; Zupanski and Zupanski et al., 2006, Lokupitiya et al., 2008) to estimate the carbon fluxes for the
South Asian Region using the CONTRAIL observations in addition to the existing flak and continuous
measurements. Similar to the pseudodata experiment done by Lokupitiya et al. (2008), we conducted a
pseudodata experiment to test the performance of MLEF on estimating the carbon fluxes by assimilating
CONTRAIL measurements, which mainly cover the Asian region.
This paper consists with four sections. Section 2 describes the data assimilation method used in this study.
Results based on the pseudodata experiment is given in Section 3. The final section, Section 4 gives the
conclusion and discussion with future work of the study.
Methodology
Lokupitiya et al. (2008), has been successfully carried out a pseudodata experiment by using the MLEF method,
coupled with a global atmospheric transport model to estimate the global CO2 fluxes at regional scale with an
existing observation network that includes flask, aircraft profiles and continuous measurements. The MLEF has
been developed by incorporating ideas from variational methods, iterated Kalman filters and ensemble
transform Kalman filter. A cost function is minimized numerically, which allows one to incorporate nonlinear
models if necessary. MLEF incorporates iterative minimization of a non-linear cost function with advanced
Hessian preconditioning, which makes it more robust for non-linear processes. The method is based on
maximum likelihood (rather than minimum variance) estimation and thus the optimal solution is given by t he
mode (rather than the mean) of the posterior distribution (Lokupitiya et al. 2008).
Data Assimilation Scheme
Hourly land fluxes (Net Ecosystem Exchange (NEE) = Respiration (RESP) – Gross Primary Productivity
(GPP)) derived from Simple Bioshere-version 3 (SiB3) model (Baker et al., 2003; 2007), Takahashi ocean
fluxes (Takahashi et al., 2002) on a monthly time scale and Brenkert fossil fuel emissions (Brabkert (1998)) are
Proceedings of the International Conference on Climate Change, Vol. 1, 2017, pp. 7-19
9
the fluxes used. The mid monthly values of the ocean fluxes are interpolated to hourly time resolution in order
to be consistent with the hourly land fluxes.
In this study, the fluxes are estimated by optimizing the unknown biases added to each flux component. Bias
term for the fossil fuel emission was not considered due to the low variations of the fossil fuel emissions within
a year. Biases are defined at 100 longitude by 60 latitude spatial resolution. The biases added to the NEE and air-
sea gas exchange are estimated using the MLEF data assimilation method.
Mathematical representation of the optimization problem is given as follows:
F(x,y,t) = (1+βNEE (x,y))×NEE(x,y,t) + (1+βocean(x,y))×Ocean(x,y,t) + FF(x,y,t), (1)
where NEE(x,y,t), Ocean(x,y,t) and FF(x,y,t) are the fluxes from land, ocean and fossil fuel emissions at the x, y
spatial coordinates and time t, which is at hourly resolution. Slowly varying biases defined in monthly scale are
recovered by estimating those for the months from May to October using MLEF coupled with Parametric
Chemistry Transport Model (PCTM). Since there are few number of CONTRAIL observations for the first few
months of the selected year, data assimilation was started from May. Number of data assimilation cycles had to
be limited to six in order to save the time to complete the experiment due to computational restrictions on
available resources. The transport model is run at 2.50 longitude and 20 latitude spatial resolution with 25
vertical levels.
To examine the impact of CONTRAIL data on flux estimates, pseudodata experiment was conducted and the
uncertainty reduction of the biases were compared by carrying out two experiments with and without
CONTRAIL data for the selected time period. The selected year for the experiment is year 2006. The size of the
data assimilation window is 4 weeks and the biases are assumed to stay constant throughout this 4 week time
period. At the starting point of the data assimilation (first data assimilation cycle) we used unbiased case (βNEE =
βocean = 0) at every grid point. This is called as the background or first guess. Prior uncertainties (standard
deviations) are selected as 0.4 and 0.2 for land and ocean priors. The selection of the prior uncertainties for the
biases is very important in inverse modelling. Selection of larger prior uncertainties may allow more freedom
for the biases to move, which may prevent reaching a reasonable solution when the observation network has few
number of observations. Smaller prior uncertainties may lead biases to get stuck in a wrong solution (Lokupitiya
et al., 2008).
The fist guess vector along with the perturbed background vectors (ensemble members) was used to compute
the hourly CO2 fluxes using equation (1). For this experiment, we use 90 ensemble members. The created hourly
CO2 fluxes under each ensemble member was run through the transport model for 4 weeks (data assimilation
window) to simulate CO2 concentrations at the observation sites. Then the optimized β were obtained by
minimizing the distance between the simulated and observed CO2 concentrations using the method of MLEF. In
each subsequent cycle, the average of posterior from the previous cycle and prescribed values from the initial
cycle was considered as the prior. This was done for both mean and the uncertainty of the biases.
Observations
Three types of observations are used for the data assimilation. Those are 59 CMDL surface flask observations
that are collected on weekly basis, 32 continuous sites that are measured in-situ at different vertical levels on an
hourly basis and CONTRAIL aircraft locations on hourly basis. Observation locations and site names for flask
and continuous sites are given in Figure 1 and Table 1. There are very few number of flask and continuous sites
over the Asian region. But CONTRAIL observations increase the observation number in those regions. For the
year 2006, CONTRAIL aircraft tracks are plotted in Figure 1. It does not include all the CONTRAIL locations
for year 2006 as the location file used for this pseudodata experiment was from May to October.

K.M.P. Perera et al / Estimation of Asian and Global Carbon Fluxes Using…
10
Observation error is the most important part in inverse modelling method. It should be pre-defined in the inverse
modelling framework. It is the sum of the instrument, representation (error due to scale mismatch between the
observations and the transport model) and forward model errors. In this pseudodata experiment, a random error
term was added by assuming that the observation errors follows a normal distribution with zero mean and
standard deviation of one. On average 2ppm (parts per million) error was assumed for each data point.
But for the real data experiment, the observation errors (model-data mismatch) have to be calculated using the
true concentrations and the simulated concentrations which can be obtained from the transport model. Also, for
the continuous sites, uncertainty has to be added according to the local time and station height as used in
Lokupitiya et al. (2008). In observation error covariance matrix (R), observation errors are represented by the
diagonal elements of the matrix. In this experiment, we assume that the observation errors are uncorrelated in
between the observation stations. That is the observation stations are far from each other.
Pseudodata
Pseudo truth was calculated by using monthly varying artificially generated bias maps for the flux components.
Pseudo CO2 concentrations were created by running the transport model forward for three years (3-year spin-up)
and then sampled the CO2 concentrations at the observation locations in the fourth year by running the model
with the biased fluxes. Each observation was perturbed by adding an error term generated randomly. At the end
of the third year, 3D model state was saved and those were used as the true CO2 concentrations for the data
assimilation scheme.
Fig. 1. A map of the stations used and CONTRAIL aircraft tracks for year 2006.
Open circles - continuous measurement sites, Crosses - flask sampling stations (NOAA-ESRL
network),
Solid circles - CONTRAIL data - Provided by Dr. Prabir Patra, Senior Scientist, Research Institute of
Global Change, JAMSTEC, Japan.

Proceedings of the International Conference on Climate Change, Vol. 1, 2017, pp. 7-19
11
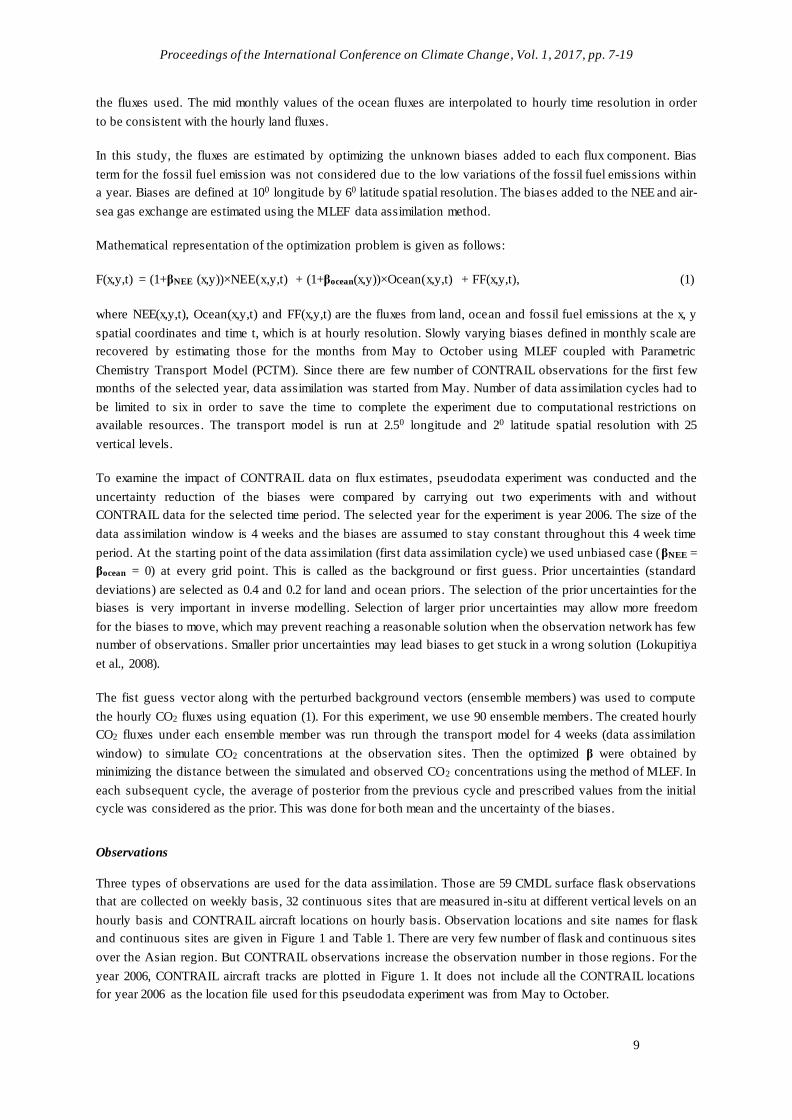
Table 1 Names of the flask and continuous sites
Code Name Lat () Lon () Alt /Height(m)
Flasks:
ALT Alert, Nunavut, Canada 82.45 -62.52 0.
AMS Amsterdam Island, Indian ocean (France) -37.95 77.53 0.
ASC Ascension Island, UK -7.92 -14.42 0.
ASK Assekrem. Algeria 23.18 5.42 2728
AVI St. Croix, Virgin Islands, USA 17.75 -64.75 0.
AZR Terceira Island, Azores, Portugal 38.77 -27.38 0.
BAL Baltic Sea, Poland 55.50 16.67 0.
BHD Baring Head Station, New Zealand -41.42 174.87 0.
BKT Bukit Kototabang, Indonesia -0.20 100.32 0.
BME St. Davis Head, Bermuda, UK 32.37 -64.65 0.
BMW Tudor Hill, Bermuda, UK 32.27 -64.88 0.
BRW Barrow, Alaska, USA 71.32 -156.60 0.
BSC Black Sea, Constanta, Romania 44.17 28.68 0.
CBA Cold Bay, Alaska, USA 55.20 -162.72 0.
CGO Cape Grim, Tasmania, Australia -40.68 144.68 0.
CHR Christmas Island, Republic of Kiribati 1.70 -157.17 0.
CMO Cape Meares, Oregon, USA 45.48 -123.97 0.
CRZ Crozet Island, France -46.45 51.85 0.
EIC Easter Island, Chile -27.15 -109.45 0.
GOZ Dwejra Point, Gozo, Malta 36.05 14.18 0.
GMI Mariana Island, Guam 13.43 144.78 0.
HBA Halley Station, Antarctica, UK -75.58 -26.50 0.
HPB Hohenpeissenberg, Germany 47.80 11.02 0.
HUN Hegyhatsal, Hungary 46.95 16.65 0.
ICE Storhofdi, Vestmannaeyjar, Iceland 63.25 -20.15 0.
IZO Tenerife, Canary Islands, Spain 28.30 -16.48 2360
KCO Kaashidhoo, Republic of Maldives 4.97 73.47 0.
KEY Key Biscayne, Florida, USA 25.67 -80.20 0.
KUM Cape Kumukahi, Hawaii, USA 19.52 -154.82 0.
KZD Sary Taukum, Kazakhstan 44.45 77.57 0.
KZM Plateau Assy, Kazakhstan 43.25 77.88 1262
LMP Lampedusa, Italy 35.52 12.62 0.
MHD Mace Head, County Galway, Ireland 53.33 -9.90 0.
MID Sand Island, Midway, USA 28.22 -177.37 0.
MKN Mt. Kenya, Kenya -0.05 37.30 3897
MLO Mauna Loa, Hawaii, USA 19.53 -155.58 3397
NWR Niwot Ridge, Colorado, USA 40.05 -105.58 1541
OPW Olympic Peninsula, Washington, United States 48.25 -124.42 0.
PAL Pallas-Sammaltunturi, GAW Station, Finland 67.97 24.12 0.
PSA Palmer Station, Antarctica, USA -64.92 -64.00 0.
PTA Point Arena, California, USA 38.95 -123.73 0.
RPB Ragged Point, Barbados 13.17 -59.43 0.
SEY Mahe Island, Seychelles -4.67 55.17 0.
SGP 36.80 -97.50 0.
SHM Shemya Island, Alaska, USA 52.72 174.10 0.
SMO Tutuila, American Samoa -14.25 -170.57 0.
SPO South Pole, Antarctica, USA -89.98 -24.80 0.
STC Ocean Station C, North Atlantic Ocean, USA 54.00 -35.00 0.
STM Ocean Station M, Norway 66.00 2.00 0.
SUM Summit, Greenland 72.58 -38.48 470
SYO Syowa Station, Antarctica, Japan -69.00 39.58 0.
TAP Tae-ahn Peninsula, South Korea 36.73 126.13 0.
TDF Tierra Del Fuego, La Redonda Island, Argentina -54.87 -68.48 0.
THD Southern Great Plains, Oklahoma, United States -41.05 -124.15 0.
UTA Wendover, Utah, USA 39.90 -113.72 0.
UUM Ulaan Uul, Mongolia 44.45 111.10 0.
WIS Sede Boker, Negev Desert, Israel 31.13 34.88 0.
WLG Mt. Waliguan, Peoples Republic of China 36.29 100.90 0.
K.M.P. Perera et al / Estimation of Asian and Global Carbon Fluxes Using…….
12
ZEP Ny-Alesund, Svalbard, Norway and Sweden 78.90 11.88 0.
Continuous Sites:
ALT Alert, Nunavut, Canada 82.45 -62.52 30.
AMT Argyle, Maine, USA 45.03 -68.68 107.
SGP Southern Great Plains, Oklahoma, USA 36.61 -97.49 25.
CDL 53.87 -104.65 20.
FRS 49.88 -81.57 20.
HRV Harvard Forest, Massachusetts, USA 42.90 -72.30 30.
LEF Park Falls, Wisconsin, USA 45.92 -90.27 Multiple
SBI 43.93 -60.00 5.
WKT Moody, Texas, USA 31.32 -97.32 Multiple
WPL 55.00 -112.50 9.
MHD 53.32 9.88 0.
HEI 49.40 8.70 0.
HUN Hegyhatsal, Hungary 46.95 16.65 115.
BRW 71.32 -156.60 11.
TPJ -2.86 -54.96 50.
PLS 67.97 24.12 565
ZEP 78.90 11.88 0.
NGL 53.17 13.30 0.
PLR 45.93 7.70 2601
SSL 47.92 7.92 326.
MLO 19.53 -155.58 3397.
MAL 15.30 -1.74 100.
Transport Model
Inverse modelling methods for carbon fluxes require a transport model to produce 3-D CO2 fields, from which
we sample the CO2 at the location and times of the observations . This approach is limited by the accuracy of the
numerical transport model, the circulation/wind inputs that derive the transport and the observational CO2 data
(Kawa et al., 2004). The transport model serves as the observation operator in the assimilation scheme and it
performs the necessary interpolations and transformations from the state variable to the observat ion space. As in
Lokupitya et al. (2008), Parametrized Chemistry Transport Model (PCTM) (Kawa et al., 2004) driven by
assimilated weather data from the GEOS-4 (Goddard Earth Observation System, version 4) reanalyse was used
as the observation operator for this experiment. The PCTM was run at 2.50 longitude by 2.00 latitude horizontal
resolution with 25 vertical levels. The model integration time was 15 minutes, which was consistent with the
spatial resolution.
MLEF
The MLEF coupled with the PCTM (Zupanski M., 2005; Lokupitiya et al., 2008) is the main theoretical
framework applied in this study. MLEF method is described briefly here. MLEF finds the maximum likelihood
state solution employing an iterative minimization of a cost function. In Bayesian data assimilation, the cost
function is optimized and it can be defined as follows.
(2)
where y is a vector of observations of dimension equal to number of observations (Nobs), H is an observation
operator, β is a vector of unknowns which is the state vector we are solving for (given in equation (3)), βb is the
prescribed prior estimate, R is the observation error covariance matrix with the size Nobs× Nobs and it includes
instrumental and representativeness errors, and Pf is the prior error covariance matrix.
(3)

Proceedings of the International Conference on Climate Change, Vol. 1, 2017, pp. 7-19
13
In the cost function, first part controls the difference between observations and second part constrains the
solution by an a priori flux distribution. The solution for the state vector β is obtained by minimizing the cost
function in equation (2). The solution for a state vector of dimension Nstate is obtained by minimizing the above
cost function by assuming a linear observation operator as follows.
(4)
(5)
where is the posterior estimate of the state vector β and is its corresponding posterior covariance
(Tarantola, 1987). The minimization is done using an iterative conjugate-gradient algorithm, which converges in
a single iteration to the Kalman filter solution given in equation (4) when H is a linear function and the
ensemble size equal to the size of the control variable.
Results
Uncertainty reduction of the land and ocean fluxes, comparison of the truth and the recovered land fluxes and
comparison of the truth and the recovered land fluxes with their relevant standard deviations for the TransCom
regions are discussed under the results.
Uncertainty reduction
In order to identify the effect of CONTRAIL observations for surface flux estimation, the pseudodata
experiment was conducted separately with and without the CONTRAIL observations. Uncertainty reduction
maps for land fluxes (Net Ecosystem Exchange) and ocean fluxes are given in Figure 2. Uncertainty reduction
was calculated as in Equation 6.
(6)
(a) (b)
Fig. 2. Uncertainty reduction maps for land fluxes and ocean fluxes with (a) and without (b) CONTRAIL
observations.

K.M.P. Perera et al / Estimation of Asian and Global Carbon Fluxes Using…
14
Higher uncertainty reduction (more than 50%) of estimated land fluxes can be observed in the North American
and European regions due to the plenty of observation sites in those regions. Uncertainty reduction for the ocean
fluxes is very low because of the weaker signal from the ocean fluxes to the observation sites. Also, a very low
uncertainty reduction can be observed for the sparsely observed land regions. Considerable change of the
uncertainty reduction of the land fluxes can be seen in Asian and European regions with added CONTRAIL
observations. Figure 3 focuses on the uncertainty reduction of land fluxes for the Asia with CONTRAIL
observations.
Fig. 3. Uncertainty reduction map for the Asian region with CONTRAIL observations
Difference between the uncertainty reductions of the land fluxes due to the CONTRAIL observations is given in
Figure 4. It clearly shows the considerable uncertainty reduction in Tropical Asia and Eurasian temperate due to
CONTRAIL effect. For Tropical Asia, the maximum uncertainty reduction is in between 45% - 47.5% and for
Eurasian Temperate it is in between 32.5% - 35%.
Fig. 4. Change of the uncertainty reduction (%) due to CONTRAIL data.
Proceedings of the International Conference on Climate Change, Vol. 1, 2017, pp. 7-19
15
According to Figure 3 and Figure 4, it can be said that the additional CONTRAIL CO2 observations includes an
extra constraint that can help to reduce the uncertainty on the inverted Asian and Eurasian CO2 fluxes.
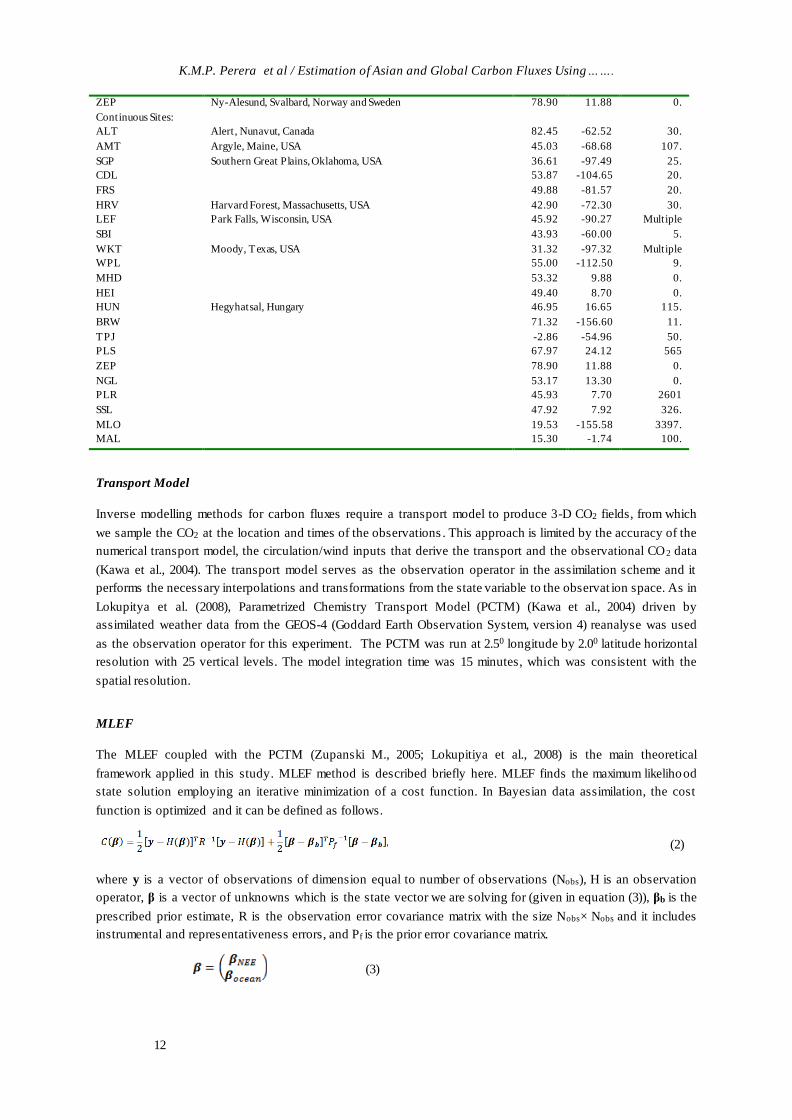
Comparison between recovered and the true fluxes
Pseudo truth and the recovered mean fluxes for the months from May to October for NEE are shown in Figure
5, (a) and (b) with CONTRAIL CO2 observations.
(a) (b)
Fig. 5. Pseudo truth (a) and the recovered (b) mean land fluxes (NEE). Units are in moles/m2/s
According to the Figure 5, a better agreement can be observed in between the recovered land fluxes and the
truth except for the South American Tropical. The observation network of this study consists with only one
observation site over the South American Tropical region. The assumed observation error may be not enough to
capture the variations of observations around this region . Difference between the recovered fluxes from the two
experiments that is the experiment run with CONTRAIL observations and without CONTRAIL observations are
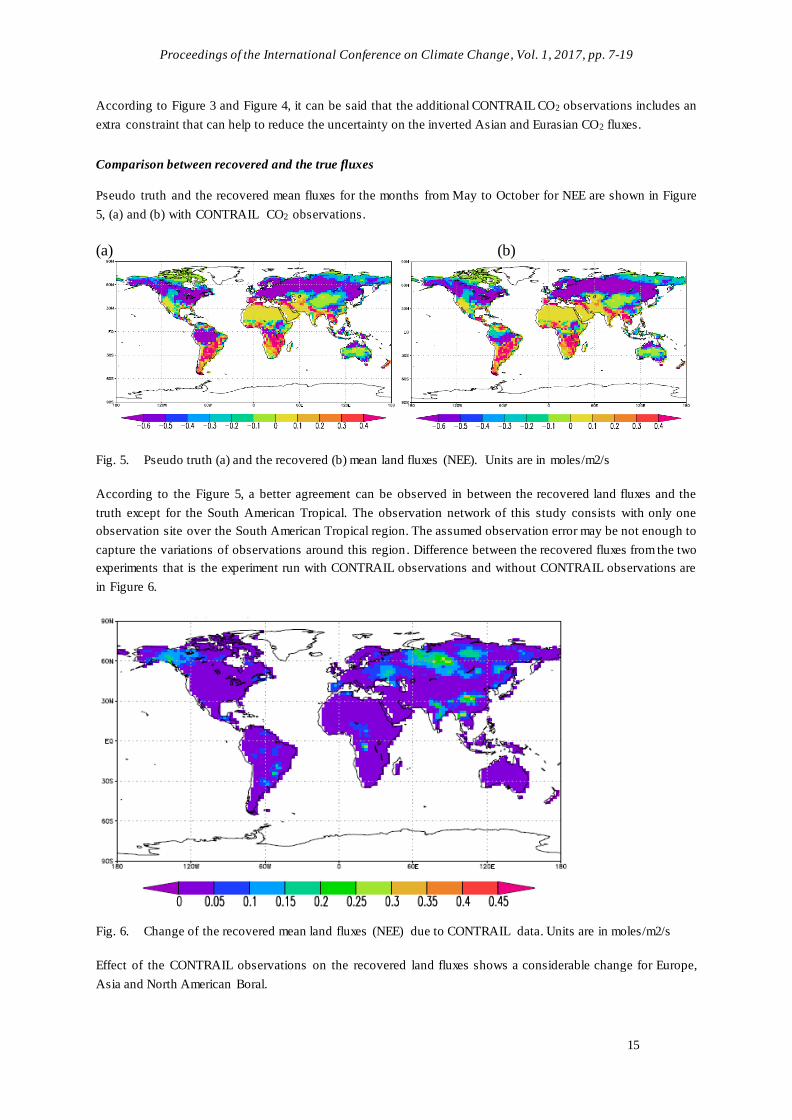
in Figure 6.
Fig. 6. Change of the recovered mean land fluxes (NEE) due to CONTRAIL data. Units are in moles/m2/s
Effect of the CONTRAIL observations on the recovered land fluxes shows a considerable change for Europe,
Asia and North American Boral.
K.M.P. Perera et al / Estimation of Asian and Global Carbon Fluxes Using…
16
-1
-0.8
-0.6
-0.4
-0.2
0
0.2
0.4
0.6
Eurasian Temperate Tropical Asia
Truth Recoverd with CONTRAIL Recovered without CONTRAIL
-2
-1.5
-1
-0.5
0
0.5
BrealN.America
TemperateN.America
S.AmericaTropical
Eurasian Boreal
Truth Recoverd with CONTRAIL Recovered without CONTRAIL
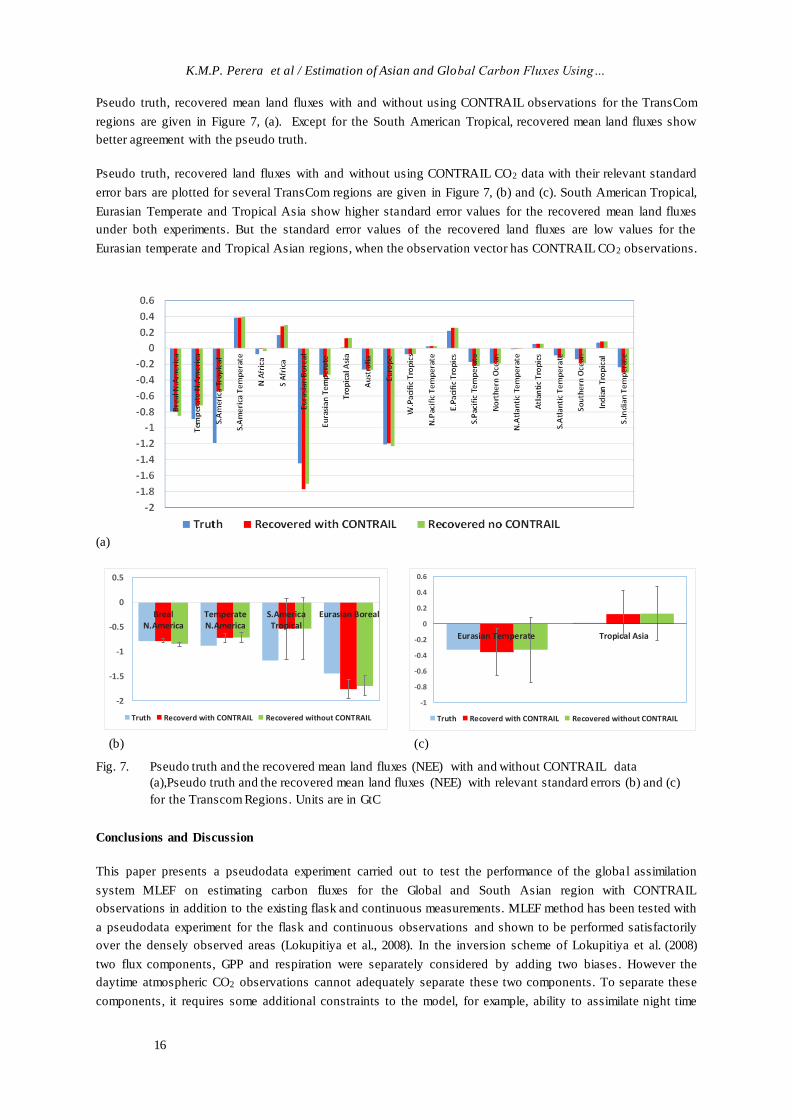
Pseudo truth, recovered mean land fluxes with and without using CONTRAIL observations for the TransCom
regions are given in Figure 7, (a). Except for the South American Tropical, recovered mean land fluxes show
better agreement with the pseudo truth.
Pseudo truth, recovered land fluxes with and without using CONTRAIL CO2 data with their relevant standard
error bars are plotted for several TransCom regions are given in Figure 7, (b) and (c). South American Tropical,
Eurasian Temperate and Tropical Asia show higher standard error values for the recovered mean land fluxes
under both experiments. But the standard error values of the recovered land fluxes are low values for the
Eurasian temperate and Tropical Asian regions, when the observation vector has CONTRAIL CO2 observations.
(a)
(b) (c)
Fig. 7. Pseudo truth and the recovered mean land fluxes (NEE) with and without CONTRAIL data
(a),Pseudo truth and the recovered mean land fluxes (NEE) with relevant standard errors (b) and (c)
for the Transcom Regions. Units are in GtC
Conclusions and Discussion
This paper presents a pseudodata experiment carried out to test the performance of the global assimilation
system MLEF on estimating carbon fluxes for the Global and South Asian region with CONTRAIL
observations in addition to the existing flask and continuous measurements. MLEF method has been tested with
a pseudodata experiment for the flask and continuous observations and shown to be performed satisfactorily
over the densely observed areas (Lokupitiya et al., 2008). In the inversion scheme of Lokupitiya et al. (2008)
two flux components, GPP and respiration were separately considered by adding two biases . However the
daytime atmospheric CO2 observations cannot adequately separate these two components. To separate these
components, it requires some additional constraints to the model, for example, ability to assimilate night time

Proceedings of the International Conference on Climate Change, Vol. 1, 2017, pp. 7-19
17
observations and/or other traces such as carbonyl sulfide. Because of these reasons, in this study, flux estimation
was done by considering only NEE component without separating it into two components as GPP and
respiration.
It is assumed that the observation covariance matrix (R) is diagonal, which means that the observation stations
are far enough from each other so that the correlations among their errors are negligible. This was assumed for
all flask, continuous and CONTRAIL observations. For the real data experiment, observation error is going to
be calculated considering the true observations and the simulated observations by running transport model. In
case of CONTRAIL CO2 concentrations, model-data mismatch is going to be calculated as a representation error
that varies with altitudes as used in Verma et al. (2016). The mismatch is very high for measurements that lie
closer to the surface while the model performs better for higher altitudes that are not directly affected by the
fluxes. Hence the mismatch can be computed by considering the functional dependency of the mismatch with
altitude (Verma et al., 2016).
Results of the pseudodata experiment for the land fluxes show better agreement in between the recovered and
the true mean annual fluxes. More uncertainty reduction can be observed in Asian region by including the
CONTRAIL CO2 observations. These results reveal that the additional aircraft observations may change the
inverted CO2 flux estimates by imposing further constraints than existing flask and continuous observations.
The observation vector used for this experiment did not include all the CONTRAIL locations for year 2006 as it
was not a complete data file for this year. Our assimilation scheme works well with CONTRAIL CO2
observations. In the future, this model is going to be used with real observations to identify the carbon sinks and
sources globally as well as mainly for the South Asian region.
Acknowledgements
This research is supported by the grants from National Research Council (NRC), Sri Lanka (Grant No:13-056)
and ARCP 2012-01 CMY-Patra/Canadell. We would also like to thank Dr. Toshinobu Machida, Center for
Global Environmental Research, National Institute for Environmental Studies , Dr. Hidekazu Matsueda,
Oceanography and Geochemistry Research Department, Meteorological Res earch Institute , Dr. Yousuke Sawa,
Oceanography and Geochemistry Research Department, Meteorological Research Institute and Dr. Prabir
Kumar Patra, Japan Agency for Marine-Earth Science and Technology for providing CONTRAIL CO2
locations. We gratefully acknowledge the computer support provided by Professor Gayan Meegama,
Department of Computer Science, University of Sri Jayewardenepura, Sri Lanka.
References
Baker, I. T. et al, 2007, Global net ecosystem exchange (NEE) fluxes of CO2., Oak Ridge National Laboratory Distributed Active Archive Center, Oak
Ridge, Tenn. (Available at http://www.daac.ornl.gov).
Baker, I. T., A. S. Denning, N. Hanan, L. Prihodko, P. –L. Vidale, K. Davis, and P. Bakwin. 2003, Simulated
and observed fluxes of sensible and latent heat and CO2 at the WLEF-TV Tower using SiB2.5. Global Change
Biology, 9, 1262-1277.
Bruhwiler, L. M. P., A. M. Michalak, W. Peters, D. F. Baker, and P. Tans, 2005, An improved Kalman Smoother for atmospheric inversions. Atmos. Chem. Phys. Discuss., 5, 1891-1923.
CarbonTracker CT2011_oi., Date of access: 10/12/2013. http://www.esrl.noaa.gov/gmd/ccgg/Carbontracker.
Gurney, K. R., R. M. Law, A. S. Denning, P. J. Rayner, D. Baker, P. Bousquet, L. Bruhwiler, Y. H. Chen, P.
Ciais, S. Fan, I. Y. Fung, M. Gloor, M. Heimann, K. Higuchi, J, John, T. Maki, S. Maksyutov, K. Masarie, P.
Peylin, M. Prather, B. C. Pak, J. Randerson, J. Sarmiento, S. Taguchi, T. Takahashi, and C. W. Yuen, 2002,
Towards robust regional estimates of CO2 sources and sinks using atmospheric transport models. Nature, 415, 626-630.

K.M.P. Perera et al / Estimation of Asian and Global Carbon Fluxes Using…
18
Jiang F., Wang H. M., Chen J. M., Machida T., Zhou L. X., Ju W. M., Matsueda H., and Sawa Y., 2014, Carbon
balance of China constrained by CONTRAIL aircraft CO2 measurements, Atoms. Chem. Phys., 14, 10133-
10144
Kawa, S. R., D. J. Erickson III, S. Pawson, and Z. Zhu, 2004, Global CO2 transport simulations using
meteorological data from the NASA data assimilation system. J. Geophys. Res., 109(D18), doi: 10.1029/2004JD004554.
Lokupitiya, R. S., Zupanski, D., Denning, A. S., Kawa, S. R., Gurney, K. R., and Zupanski, M., 2008,
Estimation of global CO2 fluxes at regional scale using the maximum likelihood ensemble filter. J. Geophys. Res. 113, D20110, doi:10.1029/2007JD009679.
Michalak, A. M., Bruhwiler, L., and Tans, P. P., 2004, A geostatistical approach to surface flux estimation of atmospheric trace gases. J. Geophys. Res. 109, D14109, doi:10.1029/2003JD004422.
Machida, T., and Coauthors, 2008, Worldwide Measurements of Atmospheric CO2 and Other Trace Gas
Species Using Commercial Airlines. J. Atmos. Oceanic Technol., 25, 1744–1754, doi: http://dx.doi.org/10.1175/2008JTECHA1082.1.
Niwa, Y., Machida, T., Sawa, Y., Matsueda, H., Schuck, T. J., Brenninkmeijer, C. A. M., Imasu, R., and Satoh,
M., 2012, Imposing strong constraints on tropical terrestrial CO2 fluxes using passenger aircraft based
measurements. J. Geophys. Res. 117, D11303, doi:10.1029/2012JD017474.
Patra, P. K., Niwa, Y., Schuck, T. J., Brenninkmeijer, C. A. M., Machida, T., Matsueda, H., and Sawa, Y., 2011,
Carbon balance of South Asia constrained by passenger aircraft CO2 measurements. Atmos. Chem. Phys, 11, 4163-4175.
Patra, P. K., Canadell, J. G., Houghton, R. A., Piao, S. L., Oh, N. –H., Ciais, P., Manjunath, K. R., Chhabra, A.,
Wang, T., Bhattacharya, T., Bousquet, P., Hartman, J., Ito, A., Mayorga, E., Niwa, Y., Raymond, P. A., Sarma, V. V. S. S., and Lasco, R. 2013, The carbon budget of South Asia.Biogeosciences, 10, 513-527.
Peters, W., Miller, J. B., Whitaker, J., Denning, A. S., Hirsch, A., Krol, M. C., Zupanski, D., Bruhwiler, L., and
Tans, P. P., 2005, An ensemble data assimilation system to estimate CO2 surface fluxes from atmospheric trace
gas observations. J. Geophys. Res. 110(D24), doi:10.1029/2005JD006157.
Peylin, P., Law, R. M., Gurney, K. R., Chevallier, F., Jacobson, A. R., Maki, T., Niwa, Y., Patra P. K., Peters,
W., Rayner, P. J., Rödenbeck, C., van der Laan-Luijkx, I. T., and Zhang, X., 2013, Global atmospheric carbon budget: results from an ensemble ofatmospheric CO2 inversions. Biogeosciences Discuss., 10, 5301–5360
Piao, S. L., Ito, A., Huang, S. G. Li, Y., Ciais, P., Wang, X. H., Peng, S. S., Nan, H. J., Zhao, C., Ahlstr¨om, A.,
Andres, R. J., Chevallier, F., Fang, J. Y., Hartmann, J., Huntingford, C., Jeong, S., Levis, S., Levy, P. E., Li, J.
S., Lomas, M. R., Mao, J. F., Mayorga, E., Mohammat, A., Muraoka, H., Peng, C. H., Peylin, P., Poulter, B.,
Shen, Z. H., Shi, X., Sitch, S., Tao, S., Tian, H. Q., Wu, X. P., Xu, M., Yu, G. R., Viovy, N., Zaehle, S., Zeng,
N., and Zhu, B., 2012,The carbon budget of terrestrial ecosystems in East Asia over the last two decades. Biogeosciences, 9, 3571–3586.
Ro¨denbeck, C., S. Houweling, M. Gloor, and M. Heimann, 2003, CO2 flux history 1982– 2001 inferred from atmospheric data using a global inversionof atmos pheric transport, Atmos. Chem. Phys., 3, 1919–1964.
Verma, S., Marshall, J., Gerbig, C., Roedenbeck, C., and Totsche, K. U., 2016, The constraint of CO2
measurements made onboard passenger aircraft on surface atmosphere fluxes: the impact of transport mode l errors in vertical mixing, Atmos. Chem. Phys., 2016, 1–20.
Thompson, R.L., Patra,P.K., Chevallier, F., Maksyutov, S., Law,R.M., Ziehn, T., van der Laan -Luijkx, I.T.,
Peters, Ganshin, W., A., Zhuravlev, R., Maki, T., Nakamura, T., Shirai, T., Ishizawa, M., Saeki, T., Machida, T.,
Poulter, B., Canadell J.G. & Ciais, P. , 2016, Top–down assessment of the Asian carbon budget since the mid 1990s
Takahashi, T., Sutherland, S. C., Sweeney, C., Poisson, A., Metzl, N., Tilbrook, B., Bates, N., Wanninkhof, R.,
Feely, R. A., Sabine, C., Olafsson, J., and Nojiri, Y., 2002, Global sea-air CO2 flux based on climatological
surface ocean pCO2 and seasonal biological and temperature effects. Deep-Sea Res. Part II49(9-10), 1601-1622.
Tans, P. P., Fung, I. Y., and Takahashi, T.,1990, Observational constraints on the global atmospheric CO2 budget .Science. 247, 1431-1438.
Tarantola, A., 1987, The Least-Squares (12-norm) Criterion in Inverse Problem Theory: Methods for Data Fitting and arameter Estimation, pp. 187– 287, Elsevier Sci., New York
Zupanski, M., 2005, Maximum likelihood ensemble filter: Theoretical aspects. Mon. Wea. Rev.133, 1710-1726.

Proceedings of the International Conference on Climate Change, Vol. 1, 2017, pp. 7-19
19
Zupanski D. and M. Zupanski, 2006, Model error estimation employing an ensemble data assimilation approach. Mon. Wea. Rev., 134, 1337-1354.
Zupanski, D., Denning, A. S., Uliasz, M., Zupanski, M., Schuh, A. E., Rayner, P. J., and Peters, W., 2007a,
Carbon flux bias estimation employing Maximum Likelihood Ensemble Filter (MLEF). J. Geophys. Res. 112, D17107, doi:10.1029/2006JD008371.
Zhang H. F., Chen1 B. Z., van der Laan-Luijkx I. T., Machida T., Matsueda H., Sawa Y., Fukuyama Y.,
Langenfelds R., van der Schoot M., Xu G., Yan J. W., Cheng M. L., Zhou L. X., Tans P. P., and Peters W.,
2014, Estimating Asian terrestrialcarbon fluxes from CONTRAIL aircraft and surface CO2 observations for the period 2006–2010, Atoms. Chem. Phys., 14, 5807-5824
Proceedings of the International Conference on Climate Change, Vol. 1, 2017, pp. 20-24
Copyright © 2017 TIIKM
ISSN 2513-258X online
DOI: https://doi.org/10.17501/iccc.2017.1103
International Conference on Climate Change - 2017 (ICCC 2017)
Contextualization and Localization: Acceptability of
the Developed Activity Sheets in Science 5
Integrating Climate Change Adaptation
Kim Alvin De Lara
Niogan Elementary School, Department of Education, Philippines
Abstract:
The research aimed to assess the level of acceptability of the developed activity sheets in Science 5
integrating climate change adaptation of grade 5 science teachers in the District of Pililla school
year 2016-2017. In this research, participants were able to recognize and understand the importance
of environmental education in improving basic education and integrating them in lessons through
localization and contextualization. This study was conducted to develop material to use by Science
teachers in Grade 5, which would also serve as a self-learning resource for students. The respondents
of the study were the thirteen Grade 5 teachers teaching Science 5 in the District of Pililla.
Respondents were selected purposively and identified by the researcher. A descriptive method of
research was utilized in the research. The main instrument was a checklist which include items on
the objectives, content, tasks, contextualization and localization of the developed activity sheets. The
researcher developed a 2-week lesson in Science 5 for 4th Quarter based on the curriculum guide
with integration of climate change adaptation. The findings revealed that majority of respondents are
female, 31 years old and above, greater than 10 years above in teaching science and have units in
master’s degree. With regard to the level of acceptability, the study revealed developed activity
sheets in science 5 is very much acceptable. In view of the findings, lessons in science 5 must be
contextualized and localized to improve to make the curriculum respond, conform, reflect, and be
flexible to the needs of the learners, especially the 21st century learners who need to be holistically
and skillfully developed. As revealed by the findings, it is more acceptable to have localized and
contextualized learning materials for pupils. Policy formulation and re-organization of the lessons
and competencies in Science must be reviewed and re-evaluated. Lessons in science must also be
integrated with climate change adaptation, since nowadays people are experiencing change in
climate due to global warming and other factors. The developed activity sheets strongly support
environmental education and will serve as a way to instill environmental literacy among students.
Keywords: Climate Change Adaptation, Contextualization, Localization, Activity Sheets
Introduction
Standards in Science Education today provide expectations for the development of scientific inquiry and
environmental stewardship for 21st century learners. Science Education generally concentrates on the teaching
of science facts and concepts. It includes work in the science content, pedagogy, processes and strategies. To
apply these concepts and facts, Science being taught in the classroom should include experimentation, inquiry-
based and real-life experiences of awareness of changes in the environment or climate change. The climate is
one of the Earth’s life support system. Nowadays, as the earth grows older, number of people increase s and
continue to demand for water, food, land, transport and energy. Human activities such as the release of
greenhouse gases from burning fossil fuels contribute to the current rise in Earth's mean surface temperature. In
fact, the activities are not only completely interconnected but also interact with the complex system living on
Earth. One of the solutions is public awareness or informing the people by including Environmental Education
in teaching science in early grades of schools.

Kim Alvin De Lara, Contextualization and Localization: Acceptability of the Developed Activity Sheets…..
21
In line with the Republic Act 9152 or “An Act to Promote Environmental Awareness Through
Environmental Education” which is also known as known as the “National Environmental Awareness and
Education Act of 2008”, the Department of Education together with other relevant agencies, shall integrate
environmental education in its school curricula at all levels, whether public or private, including in barangay
daycare, preschool, non-formal, technical vocational, professional level, indigenous learning and out-of-school
youth courses or programs. Environmental education shall encompass environmental concepts and principles,
environmental laws, the state of international and local environment, local environmental best practices, the
threats of environmental degradation and its impact on human well-being, the responsibility of the citizenry to
the environment and the value of conservation, protection and rehabilitation of natural resources and the
environment in the context of sustainable development.
Recognizing the importance of environmental education in improving basic education and integrating them in
lessons would realize these laws. Education sector should take steps to strengthen environmental education in
dealing with climate change. Developing and producing teaching materials should be encouraged among
teachers since they are the ones who interact and know the needs of learners.Teachers have to int ensify lessons
regarding environment in all science subjects as well as in classroom discussions, drills and activities that lead
in promoting environmental awareness by enhancing environmental education and pursuing activities in schools
that nurture the environment and seek to match lectures in the classroom with concrete school-based activities
that will preserve and protect the environment.
On the other hand, another underlying issue and concern of teachers teaching in the 5 th Grade is lack of teaching
guides and learning materials.
Lack of preparedness of the department procuring Grade 5 Learner’s Materials (LM) and Teacher’s Modules
(TG) limit the students and teachers in the access to quality education. The Department of Education must plan
adequate procurement and delivery timelines when it comes to learning and teaching materials.
The study was conducted to develop material to use by Science teachers in Grade 5 in the District of Pililla
especially for beginning teachers. It would serve as a tool, guide, reference and supplementary material for
teachers if found to be accepted, since there are no available materials yet. It could also be a self-learning
resource for students.
It could use as a recommending material for the development of learning modules for teachers and students and
be used as a guide of other action plans for researchers. It could also help in policy formulation for curriculum
development by adapting or integrating climate change awareness to subjects and lessons. The researcher also
strongly supports environmental education and believes this to serve as a means to instill environmental literacy
among students. Climate change awareness should be a part of the science curriculum because student
knowledge of environmental concepts establishes a foundation for their future understandings and actions as
citizens of the country.
Methodology
A descriptive method of research was utilized in the research to assess the level of acceptability of the
developed activity sheets in fourth quarter science 5 integrating climate change adaptation of grade 5 science
teachers in the District of Pililla during the school year 2016-2017.
A descriptive method research (Shields & Rangarjan, 2013) is used to describe characteristics of a population or
phenomenon being studied. It does not answer questions about how/when/why the characteristics occurred.
Rather it addresses the "what" question (what are the characteristics of the populat ion or situation being studied?

Proceedings of the International Conference on Climate Change, Vol. 1, 2017, pp. 20-24
22
Participants (Jackson, 2009) answered the questions administered through interviews or questionnaires. The
responses were analyzed after the participants answered the questions.
In descriptive research, the study focuses on the present condition. In this study descriptive method research was
used, to gather the required data. The questionnaire – checklist was useful in collecting specific data from the
teachers, focusing attention on the most important facts to be reported.
The researcher developed a 2-week lesson in Science 5 for 4th Quarter based on the curriculum guide with the
integration climate change adaptation.
The developed lesson material was checked, improved, critiqued and validated by some selected specialists in
the field of Science Teaching. After revision, the final hard copies of the developed materials were given to the
Science teachers of grade 5 and was checked on the potential use for their teaching.
In data gathering, a questionnaire-checklist was used as an instrument to assess the level of acceptability and it
was developed and conceptualized by the researcher. It composed of two parts. The first part determined the
personal profile of Grade 5 Science Teachers and second part was composed the level of acceptability of the
developed material. In the second part, the respondent answers the questionnaire using Likert Scale.
Questionnaire-checklist was also checked and validated. For the validity of the instrument, it was undergone
modification through consultation by a panel of specialists in the field of Science instruction and development
of learning materials. After validating the checklist, it was given to the respondents to rate the acceptability of
the developed lesson materials. The data that were obtained from the questionnaires were summarized,
tabulated, presented, analyzed, and interpreted. Possible trends were established which served as the basis for
conclusions and recommendations
Data Analysis
The following measures were utilized for the purpose of treating the data:
What is the profile of the teachers in terms of age, gender, no. of years in teaching Science 5, highest
educational attainment, number of subjects/loads? ---percentage and rank were used.
What is the level of acceptability of the developed lesson in fourth quarter science 5 integrating climate change
adaptation of grade 5 science teachers in the District of Pililla during school year during 2016-2017 in terms of
objectives, content, strategies and tasks when grouped according to personal profile? -- weighted mean and rank
were used.

Kim Alvin De Lara, Contextualization and Localization: Acceptability of the Developed Activity Sheets…..
23
Results
Table 1: Composite Table of Level of Acceptability of the Developed Activity Sheets in Fourth Quarter Science 5
Integrating Climate Change Adaptation
Factors Gender Age No. of Years
Teaching
Science
Highest
Educational
Attainment
Average
Wx R VI Wx R VI Wx R VI Wx R VI Wx R VI
Objective 4.12 4 VMA 4.18 4 VMA 4.22 3 VMA 4.20 3 VMA 4.18 2 VMA
Content 4.21 3 VMA 4.26 3 VMA 4.15 4 VMA 4.17 4 VMA 4.20 3 VMA
Task 4.10 5 VMA 4.02 5 VMA 4.08 5 VMA 4.11 4 VMA 4.07 5 VMA
Contextualization 4.50 1 VMA 4.46 1 VMA 4.62 1 VMA 4.53 1 VMA 4.53 1 VMA
Localization 4.35 2 VMA 4.30 2 VMA 4.37 2 VMA 4.45 2 VMA 4.37 2 VMA
Legend
VMA- Very Much Accepted
VA – Very Accepted
A- Accepted
NMA – Not Much Accepted
NA- Not Accepted
VI- Verbal Interpretation
R-Rank
Wx- Weighted Mean
The Table 1 presents the composite table of the level of acceptability of the developed activity sheets in fourth
quarter science 5 integrating climate change adaptation of grade 5 science teachers in the District of Pililla
during school year 2016-2017.
The table revealed that in terms of gender, contextualization ranked first with a weighted mean of 4.50 with a
verbal interpretation of ‘very much accepted’. In terms of age, contextualization ranked first with a weighted
mean of 4.46 with a verbal interpretation of ‘very much accepted’. In terms of the no. of years in service,
contextualization ranks first with a weighted mean of 4.62 with a verbal interpretation of very much accepted. In
terms of highest educational attainment, contextualization ranked first with a weighted mean of 4.53 with a
verbal interpretation of ‘very much accepted’. Overall, contextualization ranked first with a general weighted
mean of 4.53 with a verbal interpretation of very much accepted

Proceedings of the International Conference on Climate Change, Vol. 1, 2017, pp. 20-24
24
Conclusions
Based on the results of the study, it could be concluded that majority of respondents are female, 31 years old and
above, 10 years above in teaching Science and have a Master’s degree. With regard to the level of acceptability,
the study revealed that in terms of age, gender, number of years in teaching science 5, and highest educational
attainment, with respect to objectives, contents, tasks, contextualization and localization , the developed activity
sheets in Science 5 were very much acceptable.
Based on the findings, the following recommendations can be made
Lesson material in science 5 must be contextualized and localized to improve to make the curriculum respond,
conform, reflect, and be flexible to the needs of the learners, especially the 21st century learners who need to be
holistically and skilfully developed. As revealed by the findings, it is more acceptable have to localize and
contextualized learning materials for pupils.
Lessons in science 5 must re-organized since the country experiences weather disturbances and calamities like
typhoons and “habagat” (southwest monsoon) during the first quarter of the school year. Lessons about effects
of typhoon and precautionary measures are included in the fourth quarter which is the start of the summe r
season. Policy formulation and re-organization of the lessons and competencies in Science must be reviewed
and re-evaluated,
Lessons in science must integrate climate change adaptation since nowadays people are experiencing changes in
climate due to global warming and other factors.
Such material will create public awareness and help in reducing the risk of the effects of climate related
calamities.
References
Boakye, C. (2015). Climate Change EducationThe Role of Pre-Tertiary Science. Curricula. University of Cape Coast, Ghana: Sage Publication
Shields, P & Rangarjan, N. (2013). A Playbook for Research Methods: Integrating Conceptual Frameworks and
Project Management. Stillwater, OK: New Forums Press. pp71
Jackson, S.L. (2009). Research Methods and Statistics: A Critical Thinking Approach 3rd Edition. Belmont, CA: Wadsworth.
Department of Education. (2010) Curriculum Guide in Science. Pasig City Philippines
Department of Education. (2015). Revised Guidelines for the Basic Education Research Fund (No.42) Pasig City Philippines
Department of Education. (2016). Amendment to DepEd Order 43, Series of 2015 Revised Guidelines
for the Basic Education Research Fund (No.4) Pasig City Philippines
Republic Act No. 10533An Act Enhancing the Philippine Basic Education System By Strengthening Its
Curriculum and Increasing the Number of Years for Basic Education, Appropriating Funds Therefore and For Other Purposes Pasig City Philippines.
Republic Act 9152 An Act to Promote Environmental Awareness Through Environmental Education”
also known as known as the “National Environmental Awareness and Education Act of 2008”
Republic Act No. 9729 An Act Mainstreaming Climate Change into Government Policy Formulations,
Establishing The Framework Strategy and Program on Climate Change also known as “Climate Change Act of 2009
http://polisci.la.psu.edu/people/exp12 July17,2016
http://sgo.sagepub.com/content/5/4/2158244015614
611 July17,2016

Proceedings of the International Conference on Climate Change, Vol. 1, 2017, pp. 25-39
Copyright © 2017 TIIKM
ISSN 2513-258X online
DOI: https://doi.org/10.17501/iccc.2017.1104
International Conference on Climate Change - 2017 (ICCC 2017)
Institutional Analysis of the Global Climate Change
Regime: Literature Review of International Climate
Negotiations
Minna Havukainen1
1Lappeenranta University of Technology
Abstract:
Climate change is the biggest challenge for humanity and international climate negotiations have
been put in place to deal with the challenge. However, the international climate negotiations have not
been able to achieve the global binding climate agreement to limit the warming under 2 0C during
this century. Previously the literature has covered the impacts, costs, benefits and the efficiency in
terms of greenhouse gas emission reduction, sustainable development, climate justice and
technology transfer. However less focus has been put on the institutional aspect of international
climate negotiations. The aim of the paper is to describe the outcome of the international climate
negotiations by institutional analysis and development framework. We conducted a literature review
of the international climate negotiations including unilateralism, multilateralism, minilateralism and
carbon markets. The results assist to clarify the role of climate governance approaches in tackling
climate change.
Keywords: International climate negotiations, institutional analysis and development framework,
unilateralism, multilateralism
Introduction
Climate change is the biggest challenge for humanity and to avoid the climate change catastrophe political
decisions and technology are needed to put in place. The political decisions can be studied based on rational
choice model or system model. Our study is based on institutional model assuming that the institutions have a
great impact on which policies are likely to be implemented. The international institutions have formed rules
used by countries to organize repetitive activities. The United Nations Framework (UNFCCC) has formed a
such set of rules for climate change mitigation and they set the frame for climate action. The UNFCCC was
established in 1994 to answer the challenge of climate change framed by the the sovereignty of states as well as
common but differentiated responsibilities. At first the objective of the international climate negotiation was to
set a binding target for emission reductions, but since that proved to be impossible the outcome o f the Paris
conference was pledges. The international negotiations have agreed to limit the global warming under 1.5 0C
while the national policies in many countries would lead to warmer climate.
Previously the literature has explained the impacts of climate change and climate mitigation and costs (Rogelj;
McCollum; Reisinger; Meinshausen; & Riahi, 2013), (Stern, 2006), sustainable development (Beg, ym., 2002)
(Swart;Robinson;& Cohen, 2003) and technology transfer (Abbott, 2009) (Dechezleprêtre; Glachant; Haščič;
Johnstone; & Ménière, 2011).
This paper focuses on the institutional characteristics of the international climate negotiations. The aim of the
paper is to describe the outcome of the international climate negotiations by institutional analysis an d
development framework. The institutional analysis and development framework is a systematic method for
analysing analysing institutions (Polski & Elinor, 1999) This analysis consists of policy arena, action arena,
patterns of interaction and outcomes. The figure 1 presents our simplified model of institutional analysis and

Minna Havukainen / Institutional analysis of the global climate change …..
26
development framework. The policy analysis consists of physical world, the community and the rules. The
action arena means the decisions and action put in place. Our analysis includes the most significant strategies of
both negotiating and implementing climate change mitigation. Unilateralism, multilateralism, minilateralism,
emission trading, carbon taxes and pledges are the most significant aspects of climate governance.
Figure 1. Institional analysis and development framework
Climate change in the international policy arena
Analysis of the international policy arena is part of institutional analysis and development framework.
Achieving an ambitious binding global climate agreement is difficult to negotiate because the burden of climate
change is not equally divided. Some countries can even benefit from climate change by expanded farmland. The
policy arena in climate change is highly fragmented and the resources and funds to implement the necessary
actions are mainly channeled through governments with different resources and objectives.
Energy is the most significant part of climate policy. The growth of energy use is also leading to growth of
energy goods. Energy policies in a country can impact the climate change mitigation in other countries. As the
energy markets gets liberalized the significance of institutions increases. The international policy arena for
climate change is shaped by lack of political will for cooperation, lack of binding targets, sovereignty of states
and free rider problem. (Deepti, 2012).
Methodology
This is a literature review of the international climate negotiations to conduct an institional analysis and
development framework. The available articles were collected from google by using the key words, climate
change mitigation, unilateralism, multilateralism, pledges, market based approach and carbon tax because these
are the major aspects of climate governance. To limit the number of articles we have only looked at the articles
published after 2012.

Proceedings of the International Conference on Climate Change, Vol. 1, 2017, pp. 25-39
27
Results
In total 54 articles were reviewed. A majority of articles focused generally on international climate policy and
climate governance. Table 1 presents the articles reviewed.
Table 1 The articles reviewed
Key words Number of articles Author
Climate governance
Climate policy
14 (Gupta & Mason, 2016)
(Bodansky & Rajamani, 2013)
(Ventura, et al., 2015) (Stewart,
et al., 2013) (Moncel & Asselt,
2012) (Otto, et al., 2014)
(Marcucci & Turton, 2013)
(Kriegler, et al., 2015) (Riahi, et
al., 2015) (Arroyo-Currás, et al.,
2015) (Briner & Prag, 2013)
(Chaturvedi, 2015) (Glomsrød, et
al., 2013) (Gilley & Kinsella,
2015)
Carbon tax 10 (Strand, 2013) (Alton, et al.,
2014) (Wang & Li, 2015) (Gale,
et al., 2013) (Elliott, et al., 2013)
(Elliott & Fullerton, 2013)
(Sundar, et al., 2016) (Brooks,
2015) (Pezzey & Jotzo, 2013)
(Lamperti, et al., 2015)
Emission trading, trade, carbon markets 10 (Perthuis & Trotignon, 2013)
(Uddin & Holtedahl, 2013)
(Anon., 2013) (Goulder, 2013)
(Lutz, et al., 2013) (Rabe, 2016)
(Stiglitz, 2015) (Cormier, 2013)
(Erickson, et al., 2014)
(Sreekanth, et al., 2014)
Carbon tax and cap-and trade 5 (Goulder, 2013) (Goulder &
Schein, 2013) (Lui, 2016)
(Sewalk, 2013) (Repetto, 2013)
Minilateralism 8 (Debaere, et al., 2014) (Falkner,
2015) (Hjerpe & Nasiritousi,
2015) (Happaerts & Bruyninckx,
2013) (Nordhaus, 2015) (Potoski,
2015) (Hovi, et al., 2015)
(Weischer, et al., 2012)
Minilateralism and multilateralism 3 (Engelbrekt, 2015) (Eckersley,
2012) (Morgera & Kulovesi,
2013)
Unilateralism 2 (Bernauer, et al., 2014) (Schmid,
2013)
Multilateralism, unilateralism,
minilateralism
1 (Kulovesi, 2012)

Minna Havukainen / Institutional analysis of the global climate change …..
28
Unilateralism
Unilateral approach to a problem means only that one party makes a promise that is open and available to
anyone to join. In other words, anyone can participate the agreement but the specific principles and rules are
designed by one party unilaterally. During the Copenhagen conference Kyoto Protocol strengthened the
unilateral approach.
This unilateralism has been criticized for contributing to an inequitable distribution of projects. However the
unilateral approach has gained some support and raised a question of whether unilateralism could be used more
effectively for example even countries that are certainly capable to have more ambitious emission reduction
targets but have been rather reluctant to move forward on GHG mitigation unilaterally.
Kulovesi (2012) studied how to address sectoral emissions outside the United Nations Framework Convention
on Climate Change (UNFCCC). She assumed that a coordinated international legal response would be the best
way to mitigate climate change. The research focused on the aviation and maritime transport that are excluded
from the Kyoto protocol. As a conclusion Kulovesi (2012) stated that all possibilities for managing climate
change mitigation including unilateral, bilateral and multilateral agreements should be investigated. In addition
she argued that the lack of global agreement on how to address emissions has weakened the unilateral approach.
The strongest criticism towards the unilateral regime presented Schmid (2013). He studied the role of
unilateralism in unequal distribution of Clean development mechanism. Schmid (2013) claimed that the
unilateral CDM does not benefit the least developed countries but only the countries that already have an access
to international financing. Schmid (2013) assumed that the purpose of the Clean Development Mechanism
(CDM) was to involve the participation of the private sector and engage developing countries in to international
climate policy. However according to the CDM rules the purpose of the mechanism is to reduce the greenhouse
gas emissions and improve the sustainable development regardless of the participation of the private sector.
Schmid (2013) also assumes that equal distribution of the projects is part of sustainable development and
therefore the unilateral CDM that does not support the equal distribution of the projects does not improve
sustainable development.
A more positive attitude towards unilateralism is presented by Marcucci and Turton (2013) who studied the role
of unilateralism technology adoption. Like Kulovesi (2012), Marcussi and Turton (2013) also stated the lack of
globally coordinated measures as a major issue in the climate change mitigation. Their study focused on the
electricity sector and they concluded that the unilateral regime might lead to some additional technology
learning by using a fragmented regime with moderate climate and technology targe ts.
The studies have moved towards assuming that the unilateral regime has become a default regime and studying
the effects of unilateralism instead of comparing it to other models. For example Bernauer (2014) studied
whether and how such unilateralism affects public opinion. He assumed that the unilateral policies have
naturally been more attractive to politicians as seen from the taxation and trade politics. Bernauer (2014)
concluded that cost and sovereignty play a significant role in accepting the unila teral regime. In 2015 Bernauer
(2014) studied if the countries can afford to pursue for more ambitious unilateral regime. He stated that the
countries aim for balanced or equal international commitments with transparent statement of what is given and
what is taken. He concluded that in India and USA the unilateralism is supported and ambitious unilateral
climate policies are affordable.
Kriegler et al. (2015) studied the role of unilateralism in establishing the climate targets via the staged accession
scenarios. They assumed that the future climate regime involves strong mitigation efforts but does not have
sanctions for the parties emitting too much. The authors concluded that the unilateralism can have an extensive
role in both establishing or ruing the climate targets. Kriegler et al. (2015) noticed that the focus in climate
change mitigation has shifted from global cooperative action to regional climate action. In fact Kriegler et al.

Proceedings of the International Conference on Climate Change, Vol. 1, 2017, pp. 25-39
29
(2015) suspected that the world may be locked into moderate and fragmented climate action because of the
institutional, ethical and political challenges. In addition more themes have risen such as the energy security and
the development policies and therefore the seek for a universal target might not be the best option.
Multilateralism and minilateralism
Multilateral approach means that more than two parties decide on the solution for a problem and make a
promise for anyone to follow. As seen in Paris negotiations the traditional unilateral approach is slowly replaced
by the multilateral approach. This new approach includes the multilateral assessment of the progress towards the
emission reductions for each country. However, Christina Figueres argued that the multilateral process is an
ineffective tool for three reasons. Firs t, climate change is a global problem requiring all the countries to
participate in the solution, however the multilateral approach has not been able to fully engage all the parties.
Second, every country can make a contribution according to their own capability. This means that the
multilateral approach might not support the ambitious emission reduction targets enough. Third a unison rules
for all the countries are needed to achieve the global target. However the multilateral approach has not
succeeded in establishing unison rules for all the participants.
The multilateralism has regarded having some limitations to answer the global climate change challenge. It
might be argued that the multilateral negotiations have not succeeded to reach a universal, bind ing international
agreement to cut emissions. In addition the concerns related to the capability of multilateralism have risen.
Therefore alternative options such as minilateralism, standards and climate clubs have been proposed.
It is been discussed whether a multilateral approach should be preferred over a unilateral approach. Even if the
unilateralism has become a default model for managing the climate change mitigation it has also been seen as
one of the major causes for the failure of the Kyoto mechanism by some researchers. Many researchers
proposed alternatives for unilateral model such as multilateral model and minilateralism. Especially the EU has
supported the multilateral negotiations leading the kick start of multilateralism at the 2009 Copenhage n climate
conference.
Weischer et al. (2012) assumed that the attempts towards multilateral regime have been too slow and the process
towards limiting the greenhouse gas emissions has not been adequate, because there are still a gap between the
multilaterally formed pledges and the level actual emission reductions needed. Therefore options outside the
Kyoto protocol have gained interest and they might assist the Kyoto protocol to reach its target. The so -called
climate clubs have been suggested as an alternative for struggling multilateral regime. Weischer et al.(2012)
concluded that the climate clubs might be an option for climate change mitigation strategy. Eckersley (2012)
presented a critical view on multilateralism. He studied if the multilateralism could be replaced by more flexible
model called the minilateralism. He assumed that the strive for multilateralism has not responded the challenge
of climate change mitigation. He assumed that the consensus decision making by 194 parties is impossible.
However at Durban the international negotiations gained a second chance. He claimed that the minilateralism
could be a more convenient option than multilateralism. Like Wong (2015) claimed that the negotiations have
not been ambitious enough and the failure to act now will result in need for more ambitious actions in the future.
Hovi et al. (2015) also studied the effectiveness of the climate club approach. They assumed that the current
development in negotiations is not adequate but the climate clubs could offer an option. They even claimed that
even a club with very few members can grow and reduce global emissions effectively. However the study by
Hovi et al. (2015) was one of the few studies recognizing the importance of non -climate benefits instead of
merely focusing on the greenhouse gas emission reductions.
Harsh criticism towards multilateralism was also presented by Moncel and Asselt (2012). They assumed that
multilateralism has not supported a political will to reduce emissions so far. However they stated that the
UNFCCC and the Kyoto protocol is no longer solely capable of addressing the problem. They studied how
Minna Havukainen / Institutional analysis of the global climate change …..
30
international institutions outside of the UNFCCC have addressed the climate change and concluded that the
climate change is simply too complex issue to be solved through a single multilateral forum. Also Engelbrekt
(2015) proposed harsh critique on multilateral approach. He stated that the multilateral negotiations to reach a
universal, binding international agreement is not consistent with the s cientific knowledge on climate change. He
assumes that even theoretically multilateralism is not able to bring long-term stability to institutional form.
Instead of multilateralism Engelbrekt (2015) suggests minilateralism as a method to address the problem.
Morgera and Kulovesi (2012) assumed that the slow process towards multilateral regime have raised a question
of alternative models. They aimed to find out if standards could be an option for multilateralism. Morgera and
Kulovesi (2012) assumed that the whole question of climate change mitigation has become more visible in
political debate. For example it was noticed in the Treaty of Lisbon. Morgera and Kulovesi (2012) discussed
whether the EU could promote the progress towards multilateralism and more certain emission reductions.
However the authors claimed that even if the EU:s multilateral cooperation struggles to fulfill their emission
reduction targets it is becoming a default model for managing the climate change mitigation. Minilateral and
bilateral cooperation should be used to support the multilateralism. Also Bäckstrand and Elgström (2013)
concluded that the multilateral regime is becoming a default model for EU and other models have not been
seriously discussed. They assumed that the EU had lost its power in global climate change negotiation after the
Copenhagen failure in 2009 because of the unilateralism and unrealistic expectations. Even if the Durban
conference in 2011 was more successful for the EU it still has not gained its power back. EU is among the
largest greenhouse gas emitters and the weakened power in global climate change negotiations has diminished
its options to reduce the emissions.
The most positive attitude towards multilateralism was presented by Stewart (2013). He claims that the
multilateral regime is a necessity to address the problem of climate change, because the unilateral and bilateral
agreements have failed to do that. He even stated that the multilateral approach to address the climate change
can achieve the emissions reductions in addition to build global cooperation.
Wong (2015) claimed that multilateral agreements should be supported by bilateral agreements to achieve the
emission reduction targets. She assumed that the negotiations run by the EU have not been able t o deliver
transformational change needed to limit the emissions. She even claimed that the gap between what we need to
do and what we are doing is not closing but widening. Potoski (2015) studied if the voluntary environmental
programs, that are also called the green clubs, could be an alternative for multilateral negotiations. He assumed
that the government efforts towards ambitious emission cuts have not been adequate and the effectiveness of a
multilateral approach towards emission reductions remains unclear. He concluded that the green clubs can play
a significant role in addressing the climate change mitigation problem.
As a conclusion multilateral approach has caused criticism because of the weak link to science and failure to
answer the real challenge. One researcher even claimed that the multilateralism can nott work even in theory.
However plenty of alternative options have been proposed either to support the multilateralism or to replace it
entirely. Some researchers have come into conclusion that even if the multilateralism has been criticized it also
becoming a default model for EU. One researcher claimed that the multilateral approach is a necessity to
address the problem of climate change.
Minilateralism has been seen as a form of multilateralis m but with a limited amount of participants. Debaere &
al (2014) examine the G20 as a role of minilateralism. They came into conclusion that the EU supports for
‘effective minilateralism’. However Falkner (2015) studied the role of minilateralism in the in ternational climate
regime. He argued that minilateralism is unlikely to overcome the structural barriers, including national political
systems to a comprehensive and ambitious international climate agreement. Hjerpe & Nasiritousi (2015)
examined the alternative forums tackling the climate change. They confirm the difficulties in coordinating
global climate policy in a highly fragmented governance landscape and the weakness of minilateralism.
Proceedings of the International Conference on Climate Change, Vol. 1, 2017, pp. 25-39
31
Happaerts & Bruyninckx (2013) explored the formation of regime complexes and the appeal of minilateralism.
They argue that the minilateralism does not provide a solution for multilateralism, but The G20 does only have a
limited, instrumental role in the regime complex. Engelbrekt (2015) also state that the minilateralis m cannot
wholly replace the legitimizing role of multilateralism.
As a conclusion minilateralism cannot replace multilateralism and fix the structural problems regarding it but
can support traditional multilateralism.
Pledges
The Durban platform offered a new strategy for climate change mitigation which was used in Paris negotiations.
Instead of aiming for a unilaterally set target each country determined their own targets and roadmaps for
climate change mitigation. These pledges cover about 80% of current global emissions and they are part of
progress towards multilateralism. The pledges are voluntary created but they go through the official evaluation
by the UNFCCC. At first the pledges were supported by some researchers but subsequently the approach has
been predicted to fail based on historical and scientific analysis since there is still a large gap between actual
pledges and the actual emission reductions required to not to exceed the 2 degrees of warming.
Glomsrød et al. (2013) studied the effect of the pledges on the biggest polluters and he claimed that several
factors support the pledges and they are convenient in terms of emission reductions. Briner and Prag (2013) also
stated that the pledges could work under certain circumstances even if they hav e flaws. He argues that the
climate change mitigation needs certain flexibility that pledges could provide.
However some researchers think that “the pledge and review” model there is today is not sufficient to mitigate
climate change but the global carbon tax would be better. One of the most critical view towards pledges was
presented by Riahi et al. (2013). They claim that the pledges would not result in ambitious emission cuts
enough, but instead create a “carbon lock–in”. This situation would be extremely harmful for the global climate
change mitigation. Also Arroyo-Currás et al. (2013) came in to conclusion that the pledges are not ambitious
strategy enough for reducing the emissions. Otto et al. (2014) claimed that the pledges are not the best option for
climate change mitigation because of the carbon leakage and the lack of efficiency.
Some researcher found that the pledges might be a good option. Chaturvedi (2015) stated that even if the actual
pledges do cover the emission reduction needed they are still a good start for fruitful negotiations. However he
also stated that Paris will have to find ways to scale up the GHG emission reduction commitments far higher
than the current INDC pledges. Hovi et al. (2015) studied the “club approach” as an alternative for a pledge
approach. They concluded that the pledges with certain conditions can be a useful part of global climate change
mitigation strategy.
Market based approach
A market based mechanism means that emissions are regarded as tradable units with a price. According to the
Article 17 of the Kyoto Protocol allows countries to sell their excess emission units to countries that need some.
Carbon is traded like any other commodity on a global market also called the "carbon market". The purpose of
the carbon market is to reduce the emissions by putting a price for carbon and mitigate the climate change cost -
effectively.
One of the most discussed issue is that should emission reductions be based on global carbon tax or could
market based mechanism fulfill the targets. By market based mechanisms we mean mechanisms that allows the
trading of greenhouse gas emission allowances. The clean development mechanism is the most important
market based mechanism.

Minna Havukainen / Institutional analysis of the global climate change …..
32
The researchers have studied the carbon markets from different perspectives. Some researchers have defined
market-based policies to include a wide range of tools from carbon tax to tradable carbon allowances. This
means basically any mechanism that puts a price for carbon. Lamperti (2015) included taxes and subsidies into
the definition of the market based policies.
Carbon markets can be determined either as one of the tools for achieving the emission reductions but also it can
be seen as the final aim of the climate change mitigation policy. Ventura & al (2015) defined carbon markets as
a tool to mitigate climate change in a cost-effective way. They left out the global carbon tax from the definition.
Uddin and Holtedahl (2012) stated the global carbon market as the ultimate aim of the policies. He assumed t hat
the ultimate goal should be the effective market instead of the global carbon tax.
Bodansky and Rajamani (2012) saw market based approach as an opposite to regulated global carbon tax.
Nordhaus (2015) also stated that the market based mechanism is the opposite of government lead regulated
approach. Many researchers focused to study specific examples of the market based approach. For example
Goulder (2013) studied the markets for pollution allowances. Sreekanth et al. (2014), Erickson et al. (2014),
Cormier and Bellassen (2012) studied the clean development mechanism as an example of the most significant
market based mechanism. Perthuis and Trotignon (2013) studied the EU Emission trading scheme as an
example of market based approach. Burtraw (2013), Rabe (2016), Carmton and Stoft (2012), Lutz (2013),
Repetto (2013), Anand and Giraud-Carrier (2013) studied only the cap-and-trade markets. They used example
from the US, which is the largest emitter with the cap-and trade scheme.
By the start of 2010s it was clear that the market based approach was to be part of global climate change
mitigation strategy in the future with CDM as the most significant mechanism under Kyoto protocol. Cramtom
(2012) assumed that setting a global price for carbon is essential for emission reductions. He stated that the
commonly used cap-and trade system is able to set a price for carbon. Many of the researchers focused merely
on the emission reduction. However, Böhm et al. (2012) discussed the possibilities for markets to turn the
society more sustainable. They concluded that the carbon markets are unlikely to provide any sustainable
benefits because of the capitalist nature of the market.
One of the most positive attitude towards market based mechanism was presented by Goulder (2013). He also
assumed that the trading of emission allowances is a desirable outcome of the climate policy and finally he
concluded that the cap-and-trade has successfully reduced emissions. Also Repetto (2013) came into conclusion
that cap-and trade system is a better way for climate change mitigation than global carbon tax. He stated that
unlike the cap-and-trade carbon tax allows emissions to vary according to the economic situation instead of
leading to steadily declining emissions.
Perthuis and Trotignon (2013) took a slightly more critical view and stated that carbon market needs flexibility
to work effectively. However they highlighted the importance of regulation as well. Uddin and Holtedahl (2013)
assumed that the carbon markets have become a preferred mechanism but they discussed the importance of
global accreditation and standards in reducing the greenhouse gas emissions. They claimed that the climate
change mitigation cannot solely being see as an air pollution problem but in a wider scope.
Similar conclusions were made by Burtraw et al. (2013) who stated that carbon price has been created
unilaterally leading in to default markets. They assumed that mechanism to put a price on carbon emissions in
the United States has not yet reached its final form and cap-and-trade could be a method for this. They stated
that the potential linking of individual cap-and-trade programs could be effective. However, in order to link
different cap-and-trade programs the price for carbon should be the same. That is still not the case yet. Leal-
Arcas (2013) discussed how to combine the different goals of international trade agreements and climate change
regime. He came into the conclusion that the regional trade arrangements could support the ultimate goal of
global climate regime if it is designed well. The author claims that the regional agreements are more effective
than an attempt to reach global agreement. He claims that the Kyoto Protocol has not succeeded in engaging all
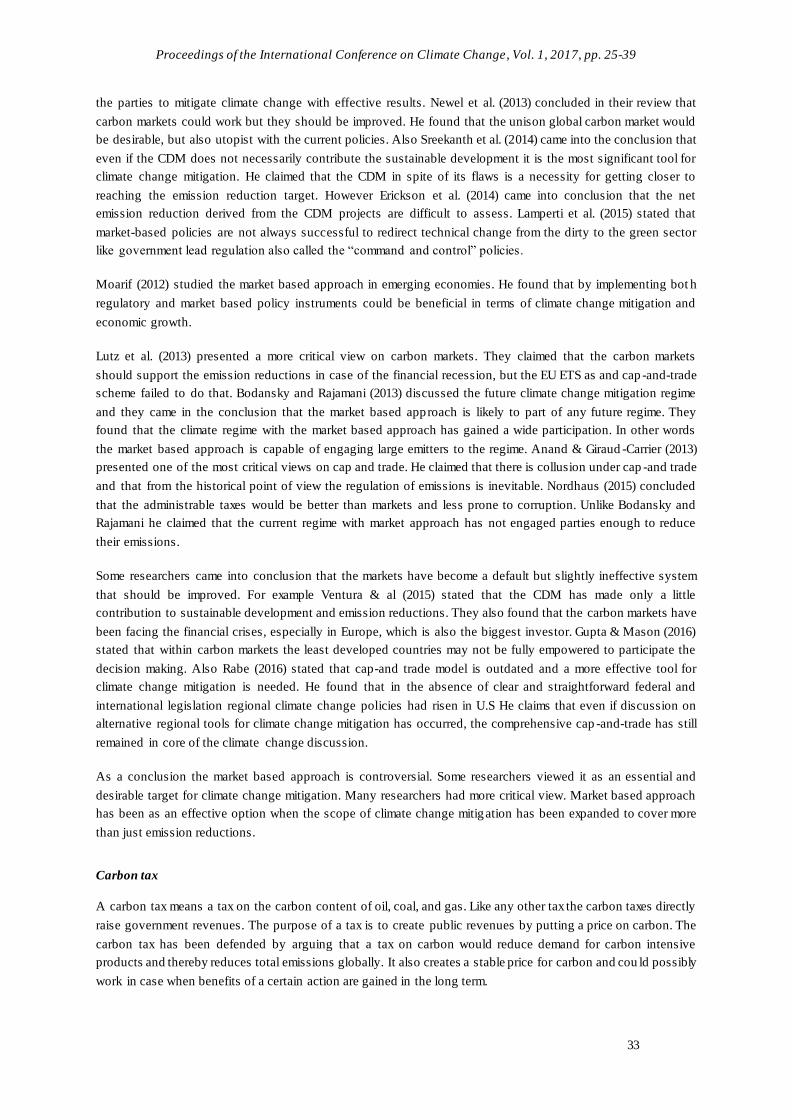
Proceedings of the International Conference on Climate Change, Vol. 1, 2017, pp. 25-39
33
the parties to mitigate climate change with effective results. Newel et al. (2013) concluded in their review that
carbon markets could work but they should be improved. He found that the unison global carbon market would
be desirable, but also utopist with the current policies. Also Sreekanth et al. (2014) came into the conclusion that
even if the CDM does not necessarily contribute the sustainable development it is the most significant tool for
climate change mitigation. He claimed that the CDM in spite of its flaws is a necessity for getting closer to
reaching the emission reduction target. However Erickson et al. (2014) came into conclusion that the net
emission reduction derived from the CDM projects are difficult to assess. Lamperti et al. (2015) stated that
market-based policies are not always successful to redirect technical change from the dirty to the green sector
like government lead regulation also called the “command and control” policies.
Moarif (2012) studied the market based approach in emerging economies. He found that by implementing bot h
regulatory and market based policy instruments could be beneficial in terms of climate change mitigation and
economic growth.
Lutz et al. (2013) presented a more critical view on carbon markets. They claimed that the carbon markets
should support the emission reductions in case of the financial recession, but the EU ETS as and cap -and-trade
scheme failed to do that. Bodansky and Rajamani (2013) discussed the future climate change mitigation regime
and they came in the conclusion that the market based approach is likely to part of any future regime. They
found that the climate regime with the market based approach has gained a wide participation. In other words
the market based approach is capable of engaging large emitters to the regime. Anand & Giraud -Carrier (2013)
presented one of the most critical views on cap and trade. He claimed that there is collusion under cap -and trade
and that from the historical point of view the regulation of emissions is inevitable. Nordhaus (2015) concluded
that the administrable taxes would be better than markets and less prone to corruption. Unlike Bodansky and
Rajamani he claimed that the current regime with market approach has not engaged parties enough to reduce
their emissions.
Some researchers came into conclusion that the markets have become a default but slightly ineffective system
that should be improved. For example Ventura & al (2015) stated that the CDM has made only a little
contribution to sustainable development and emission reductions. They also found that the carbon markets have
been facing the financial crises, especially in Europe, which is also the biggest investor. Gupta & Mason (2016)
stated that within carbon markets the least developed countries may not be fully empowered to participate the
decision making. Also Rabe (2016) stated that cap-and trade model is outdated and a more effective tool for
climate change mitigation is needed. He found that in the absence of clear and straightforward federal and
international legislation regional climate change policies had risen in U.S He claims that even if discussion on
alternative regional tools for climate change mitigation has occurred, the comprehensive cap -and-trade has still
remained in core of the climate change discussion.
As a conclusion the market based approach is controversial. Some researchers viewed it as an essential and
desirable target for climate change mitigation. Many researchers had more critical view. Market based approach
has been as an effective option when the scope of climate change mitigation has been expanded to cover more
than just emission reductions.
Carbon tax
A carbon tax means a tax on the carbon content of oil, coal, and gas. Like any other tax the carbon taxes directly
raise government revenues. The purpose of a tax is to create public revenues by putting a price on carbon. The
carbon tax has been defended by arguing that a tax on carbon would reduce demand for carbon intensive
products and thereby reduces total emissions globally. It also creates a stable price for carbon and cou ld possibly
work in case when benefits of a certain action are gained in the long term.

Minna Havukainen / Institutional analysis of the global climate change …..
34
Carbon taxes have already been introduced by a number of industrialized countries, including Finland, the
Netherlands, Norway, and Sweden. The tax must be well designed to adjust for different market situations. The
researchers have tried to focus on how effective the carbon tax is in mitigating the climate change. The studies
suggest that an effective carbon tax is high enough to receive an actual response from the emit ting sectors such
as energy sector. Some researchers regard an effective carbon tax as comprehensive and internationally
coordinated. However concerns have raised regarding the motivation of all the large emitters to apply the global
tax. Also it has been questioned whether a carbon tax could achieve the emission reductions fast enough. One of
the significant issue with carbon tax is that it should be applied globally also in the emerging economies. A
carbon tax in the developed nations would lead only to modest emission reductions compared to a global tax.
Carbon tax is one option that has been suggested but some think that it might not be more effective than “the
pledge and review”. Elliott & al (2012) studied what was the impact of unilateral carbon tax in developing
countries. They came into the conclusion that the Border tax agreements, (BTAs) may be effective in reducing
the emissions. However the authors found that the carbon leakage resulted from the carbon tax reduces the
incentives to mitigate climate change. Other researchers were also positive about implementing a carbon tax.
For example Sewalk (2013) stated that the cap-and- trade system is based on weak historical assumptions and
the carbon tax would be much better option for the United States. Pezzey & Jotzo (2013) came into similar
conclusions but emphasized the importance of planning. They assumed that putting a price on carbon is widely
accepted as being far cheaper for countries overall than regulation and tax is the most effective way to put a
price on carbon. According to the review by Goulder & Schein (2013) a hybrid scheme with a carbon tax as a
part of climate change mitigation strategy is suggested. The authors found that putting a price to carbon is the
more cost-effective than direct regulation, but a neither a pure carbon tax or pure cap—and trade can solely
solve the problem. They evaluated the effectiveness based on several dimensions such as sharing the political
burden.
Elliott & Fullerton (2013) completed another study in US and concluded that the carbon tax might be the best
option. Subsequently Elliott & al concluded that carbon tax only in Annex1 countries would not be effective but
the carbon tax should be adopted globally. Wang & Li (2015) also discussed the importance of carb on tax. They
stated that the carbon tax is an effective tool to reduce the greenhouse gas emissions. The authors stated that the
carbon tax together with removing fossil fuel subsidies could reduce the greenhouse gas emissions.
Alton & al (2013) completed a study in South Africa and stated that the carbon tax might increase the welfare in
the whole country. They assumed that the carbon tax does reduce the greenhouse gas emissions and evaluated
the socioeconomic consequences of the carbon tax. Strand (2013) compared the carbon tax to the cap-and-trade
system and concluded that the carbon tax is better for importers. He stated that there is not a big difference
between the difference between a climate policy involving a carbon tax, and a cap -and-trade scheme under a
carbon tax. The question is mainly on should emissions have a cap or not. One of the most supportive comment
on carbon tax was presented by Gale & al (2013). They concluded that the carbon tax improves the
sustainability in the whole society. They discussed the effects beyond the greenhouse gas emissions. They also
stated that the carbon tax could raise significant revenues to cover the costs from the climate change mitigation.
Gilley & Kinsella (2015) completed a study in China and concluded that s ome form of taxes are required on
products linked with carbon emissions to reduce the greenhouse gas emissions. They focused on the border tax
adjustments and the effects on greenhouse gas emissions.
Sundar & al (2016) stated that the carbon tax is one of the most important tools for reducing the greenhouse gas
emissions. They used a mathematical tool to explain the link between the level of the tax and actual emissions.
Stiglitz (2015) discussed that the voluntary agreements will fall short and therefore a carbon tax or equal cap-
and-trade would be better.

Proceedings of the International Conference on Climate Change, Vol. 1, 2017, pp. 25-39
35
Stiglitz (2015) discussed that a mechanism to put a price on carbon is essential for emission reductions, but fully
voluntary agreement is not likely to be able to deliver emission reductions needed. He concluded that the carbon
tax would be an effective method to cover the costs of climate change mitigation.
One of the slightly suspicious opinions was presented by Lui (2016). He concluded that the world cap -and-trade
scheme would improve welfare better than a world carbon tax. However the political barriers for clean energy
investments determine if carbon tax or cap-and-trade scheme would be better in cutting emissions. Lui (2016)
was the first to discuss the political barriers related to carbon tax. Also Brooks (2015) was critical about some
principles related to the taxation. For example he stated that the polluter pays principle is not functional from
justice-based perspective. However generally the critical voices on carbon tax have been very modest.
As a conclusion the effectiveness of the carbon tax has been mainly investigated based on the greenhouse gas
emissions. However some studies focused also on socioeconomic effects and welfare. The carbon tax was found
to be an effective method to mitigate climate change also when looking at the climate change mitigation from
the wider scope beyond the greenhouse gas emissions. However the biggest obstacles were seen a political
barriers in many countries. However what is not fully agreed is that should carbo n tax completely replace the
cap-and-trade or could it be part of the solution.
Discussion
In the mid-90s the discussion on climate change mitigation was very narrow. There was a simple target ,
measured simply with GHG-emission reductions in the developed Annex 1-countries. Subsequently more
themes, measures, sectors and parties have joined the climate change mitigation discussion. These themes
include sustainable development, technology transfer and capacity building. At first , targets were presented as
reduction in GHG-emissions. Subsequently targets were also presented as technology targets. At first the
climate change mitigation was an issue concerning the energy sector in developed countries. However, later on
the developing countries also joined the climate change mitigation discussion even if they did not have similar
targets as the developed countries. In addition to energy sector, other major emitting sectors such transportation,
waste and agriculture have joined the discussion. Traditionally the aim was to reach the climate change
mitigation targets by regulation. However this turned out to be politically difficult; so different market based
approaches were suggested and implemented. These approaches include trading of emission permits and carbon
tax. When the discussion has expanded climate change mitigation has become more challenging to manage for
Europeled Kyoto protocol. Therefore a discussion on a new regime and tools has risen.
For the future climate change mitigation regime the targets have been agreed quite clearly. The researchers and
the parties have agreed on limiting the warming to 2 celcius degrees globally. However, couple of issues still
remain more unclear. First, how much the climate change mitigation should be regulated and how much could
be left to markets? Second, what is the optimal amount of participants? Too little participants would make
inadequate contribution but too many participants might not agree on the important issues and the decision
making would become more challenging. Third, what is the role of carbon tax in future?
The negotiation strategies have led to different outcomes. Unilateral negotiations have led to establishment of
emission trading schemes in Europe as well as many other parts of the world. With multilateral negotiations, the
outcome was different. There was no universal carbon market but instead pledges and climate clubs. Perhaps in
the future, climate clubs become more significant and they can establish their own regulation or carbon markets
with carbon tax. Figure 2 presents the options for climate negotiations. Unilatralism has led to limited amount of
options while multilateralism has provided more flexibility and options for climate governance.
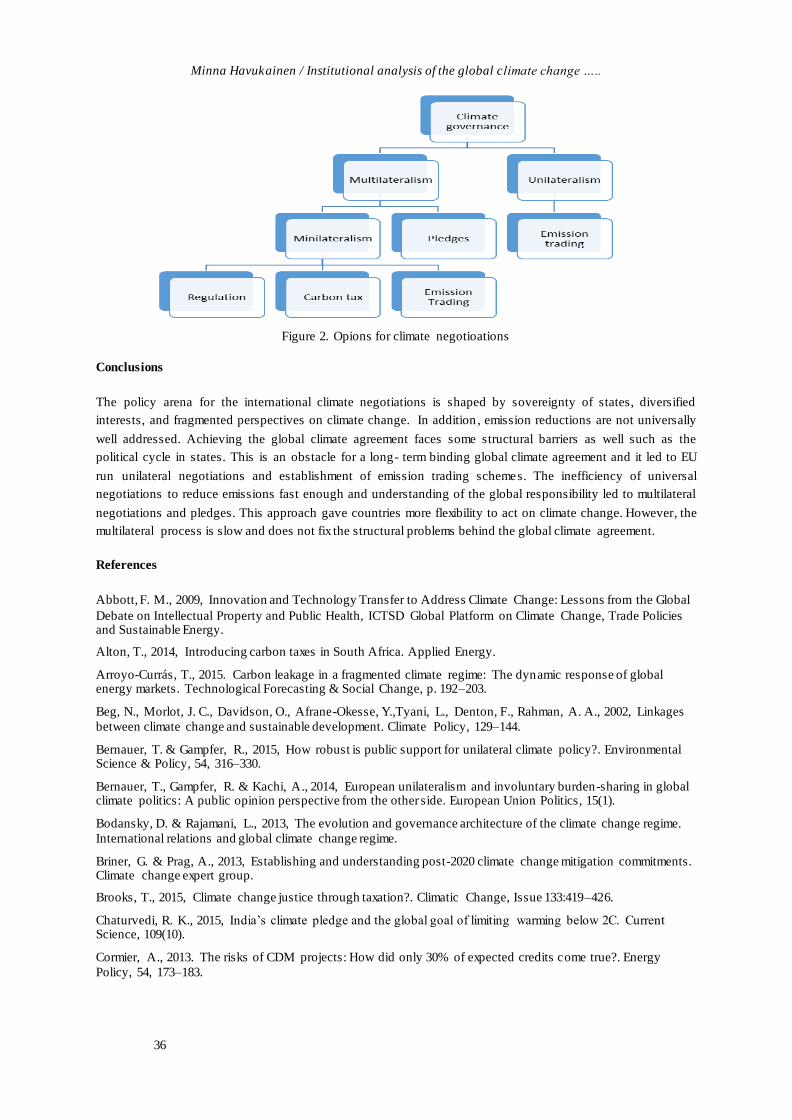
Minna Havukainen / Institutional analysis of the global climate change …..
36
Figure 2. Opions for climate negotioations
Conclusions
The policy arena for the international climate negotiations is shaped by sovereignty of states, diversified
interests, and fragmented perspectives on climate change. In addition , emission reductions are not universally
well addressed. Achieving the global climate agreement faces some structural barriers as well such as the
political cycle in states. This is an obstacle for a long- term binding global climate agreement and it led to EU
run unilateral negotiations and establishment of emission trading schemes. The inefficiency of universal
negotiations to reduce emissions fast enough and understanding of the global responsibility led to multilateral
negotiations and pledges. This approach gave countries more flexibility to act on climate change. However, the
multilateral process is slow and does not fix the structural problems behind the global climate agreement.
References
Abbott, F. M., 2009, Innovation and Technology Transfer to Address Climate Change: Lessons from the Global
Debate on Intellectual Property and Public Health, ICTSD Global Platform on Climate Change, Trade Policies and Sustainable Energy.
Alton, T., 2014, Introducing carbon taxes in South Africa. Applied Energy.
Arroyo-Currás, T., 2015. Carbon leakage in a fragmented climate regime: The dynamic response of global energy markets. Technological Forecasting & Social Change, p. 192–203.
Beg, N., Morlot, J. C., Davidson, O., Afrane-Okesse, Y.,Tyani, L., Denton, F., Rahman, A. A., 2002, Linkages
between climate change and sustainable development. Climate Policy, 129–144.
Bernauer, T. & Gampfer, R., 2015, How robust is public support for unilateral climate policy?. Environmental Science & Policy, 54, 316–330.
Bernauer, T., Gampfer, R. & Kachi, A., 2014, European unilateralism and involuntary burden-sharing in global climate politics: A public opinion perspective from the other side. European Union Politics, 15(1).
Bodansky, D. & Rajamani, L., 2013, The evolution and governance architecture of the climate change regime.
International relations and global climate change regime.
Briner, G. & Prag, A., 2013, Establishing and understanding post-2020 climate change mitigation commitments. Climate change expert group.
Brooks, T., 2015, Climate change justice through taxation?. Climatic Change, Issue 133:419–426.
Chaturvedi, R. K., 2015, India’s climate pledge and the global goal of limiting warming below 2C. Current Science, 109(10).
Cormier, A., 2013. The risks of CDM projects: How did only 30% of expected credits come true?. Energy
Policy, 54, 173–183.

Proceedings of the International Conference on Climate Change, Vol. 1, 2017, pp. 25-39
37
Debaere, P., Lesage, D. & Orbie, J., 2014, Effective ‘minilaterlism`: The European Union’s pragmatic
embarcement of the G20. Teoksessa: The EU and effective multilateralism: external and internal reform in the
first decade. London: Routledge.
Dechezleprêtre, A.,Glachant, M.,Haščič, I.,Johnstone, N., Ménière, Y., 2011, Invention and Transfer of Climate Change Mitigation Technologies: A Global Analysis. Review of environmental economics and policy, 109-130.
Deepti, M., 2012, Energy in the international policy arena: Determining the role of multilateral institutions. TERI-NFA Working Paper No.1.
Eckersley, R., 2012, Moving Forward in the Climate Negotiations: Multilateralism or Minilateralism?. Global
Environmental Politics.
Elliott, J., 2013, Unilateral Carbon Taxes, Border Tax Adjustments and Carbon Leakage. Theoretical Inquiries in Law.
Elliott, J. & Fullerton, D., 2013, Can a unilateral carbon tax reduce emissions elsewhere?. CESifo Working Paper: Energy and Climate Economics, Issue 4113.
Engelbrekt, K., 2015, Minilateralism matters more? Exploring opportunities to end climate negotiations
gridlock. Global Affairs.
Erickson, P., Lazarus, M. & Spalding-Fecher, R., 2014, Net climate change mitigation of the Clean Development Mechanism. Energy Policy, 72, 146–154.
Falkner, R., 2015, ‘A minilateral solution for global climate change? On bargaining efficiency, club benefits and international legitimacy’. Centre for Climate Change Economics and Policy Working Paper No. 222.
Gale, W. G., Brown, S. & Saltiel, F., 2013, Carbon Taxes as Part of the Fiscal Solution, s.l.: s.n.
Gilley, B. & Kinsella, D., 2015, Coercing Climate Action. Survival.
Glomsrød, S., Wei, T. & Alfsen, K. F., 2013, Pledges for climate mitigation: the effects of the Copenhagen
accord on CO2 emissions and mitigation costs. Mitigation and Adaptation Strategies for Global Change, 18(5), 619-636.
Goulder, L., 2013, Climate change policy's interactions with the tax system. Energy Economics, Issue 40, p. S3–S11.
Goulder, L., 2013, Markets for Pollution Allowances: What Are the (New) Lessons?. The Journal of Economic
Perspective, 1(27), pp. 87-102.
Goulder, L. H. & Schein, A., 2013, Carbon taxes vs cap-and-trade: a critical review. NBER Working Paper No. 19338.
Gupta, A. & Mason, M., 2016, Disclosing or obscuring? The politics of transparency in global climate governance. Current Opinion in Environmental Sustainability.
Happaerts, S. & Bruyninckx, H., 2013, Rising power in global climate governance.Negotiating the new world
order. Working paper 124.
Hjerpe, M. & Nasiritousi, N., 2015, Views on alternative forums for effectively tackling climate change. Nature Climate Change.
Hovi, J., Sprinz, D., Sælen, H. & Underdal, A., 2015, The club approach: A gateway to effective cooperation, s.l.: CICERO.
Kriegler, E & AL, 2015, Making or breaking climate targets: The AMPERE study on staged accession scenarios
for climate policy. Technological Forecasting & Social Change, Osa/vuosikerta 90, p. 24–44.
Kulovesi, K., 2012, Addressing Sectoral Emissions outside the United Nations Framework Convention on
Climate Change: What Roles for Multilateralism, Minilateralism and Unilateralism?. Review of European Community & International Environmental Law.
Lamperti, F., Napoletano, M. & Roventini, A., 2015, Preventing Environmental Disasters:Market-Based
vs.Command-and-Control Policies, s.l.: Scuola Superiore Sant'Anna.
Lui, C. Y., 2016, Keeping the Carbon Buried: Cap-and-Trade Is More Efficient Than A World Carbon Tax, s.l.: University of Victoria.
Lutz, B., Pigorsch, J. & Rotfub, U., 2013, Nonlinearity in cap-and-trade systems: The EUA price and its fundamentals. ZEW Discussion Papers.

Minna Havukainen / Institutional analysis of the global climate change …..
38
Marcucci, A. & Turton, H., 2013, Induced technological change in moderate and fragmented climate change mitigation regimes. Technological Forecasting and Social Change.
Moncel, R. & Asselt, H., 2012, All Hands on Deck! Mobilizing Climate Change Action beyond the UNFCCC.
Review of European Community & International Environmental Law.
Morgera, E. & Kulovesi, K., 2013, The Role of the EU in Promoting International Standards in the Area of Climate Change. University of Edinburgh School of Law Research Paper No 2013/22.
Nordhaus, W., 2015, Climate Clubs: Overcoming Free-riding in International Climate Policy. American Economic Review, 4(105), p. 1339–1370.
Otto, S. A & Al, 2014. Impact of fragmented emission reduction regimes on the energy market and on CO2
emissions related to land use: A case study with China and the European Union as first movers. Technological Forecasting & Social Change.
Parker, C., Karlsson, C. & Hjerpe, M., 2014, Climate change leaders and followers: Leadership recognition and selection in the UNFCCC negotiations. International Relations.
Perthuis, C. D. & Trotignon, R., 2013, Governance of CO2 markets: Lessons from the EU ETS. Energy Policy,
Issue 75, pp. 100-106.
Pezzey, J. C. & Jotzo, F., 2013, Carbon tax needs thresholds to reach its full potential, s.l.: s.n.
Polski, M. & Elinor, O., 1999, An Institutional Framework for Policy Analysis and Design.
Potoski, M., 2015, Green clubs in building block climate change regimes. Climatic Change, pp. 1-11.
Rabe, B. G., 2016, The Durability of Carbon Cap-and-Trade Policy. Governance: An International Journal of Policy, Administration, and Institutions, pp. 103-119.
Repetto, R., 2013, Cap and Trade Contains Global Warming Better Than a Carbon Tax. Challenge, 5(56), 31-61.
Riahi, K. & al., 2015, Locked into Copenhagen pledges — Implications of short-term emission targets for the
cost and feasibility of long-term climate goals. Technological Forecasting & Social Change, 8-23.
Rogelj, J.,Mccollum, D. L.,Andy Reisinger, A.,Meinshausen, M., Riahi, K., 2013, Probabilistic cost estimates for climate change mitigation. Nature, ss. 79–83.
Schmid, G., 2013, Unilateral Clean Development Mechanism and financial development: is there a link?, s.l.: University of Geneva.
Sewalk, S., 2013, Carbon Tax with Reinvestment Trumps Cap-and-Trade. Nanotechnology and the
Environment, 2(20).
Sreekanth, K. J., Sudarsan, N. & Jayaraj, S., 2014, Clean development mechanism as a solution to the present
world energy problems and a new world order: a review. International Journal of Sustainable Energy, 1(33), 49-75.
Stern, N., 2006, What is the Economics of Climate Change? World Economics.
Stewart, R., Oppenheimer, M. & Rudyk, B., 2013, A new strategy for global climate protection. Climatic
Change, 1(120), 1-12.
Stiglitz, J. E., 2015, Overcoming the Copenhagen Failure with Flexible Commitments
Strand, J., 2013, Strategic climate policy with offsets and incomplete abatement: Carbon taxes versus cap-and-trade. Journal of Environmental Economics and Management.
Sundar, S., Kumar Mishra, A. & Naresh, R., 2016, Effect of Environmental Tax on Carbon Dioxide Emission: A Mathematical Model. American Journal of Applied Mathematics and Statistics,, 4(1), 16-23.
Swart, R.,Robinson, J.,& Cohen, S., 2003, Climate change and sustainable development:expanding the options.
Climate Policy, S19–S40.
Uddin, N. & Holtedahl, P., 2013, Emission trading schemes e avenues for unified accounting practices. Journal of Cleaner Production, 46-52.
Wang, Q. & Li, R., 2015, Cheaper oil: A turning point in Paris climate talk?. Renewable and Sustainable Energy Reviews.

Proceedings of the International Conference on Climate Change, Vol. 1, 2017, pp. 25-39
39
Weischer, L., Morgan, J. & Patel, M., 2012, Climate Clubs: Can Small Groups of Countries make a Big
Difference in Addressing Climate Change?. Review of European Community & International Environmental
Law.
Ventura, A. C. & al, 2015, Carbon market and global climate governance: limitations and challenges. Interntional Journal of Innovation and Sustainable Development,, 1(9), 28–47.

Proceedings of the International Conference on Climate Change, Vol. 1, 2017, pp. 40-50
Copyright © 2017 TIIKM
ISSN 2513-258X online
DOI: https://doi.org/10.17501/iccc.2017.1105
International Conference on Climate Change - 2017 (ICCC 2017)
Impact of Changed Rainfall Patterns Due to Climate
Change and Usage of Available Weather Information by
Communities Who Face Human Elephant Conflict
(HEC) in Udawalawe, Sri Lanka
N.M.K.C. Premarathne1, S.T.M. Dissanayake2, S. De Silva3, U.S. Weerathunga3,
T.V.P Kumara3
1Institute of Policy Studies of Sri Lanka 2 Colby College and the University of Minnesota
3 Trunks and Leaves
Abstract:
Purpose: Weather information is essential for farmers who face wild elephant conflict because,
since their farming activities and elephant encounters both are influenced by the climate conditions.
The weather information needs of such communities are different from normal farmers. The purpose
of the study was to examine farmers’ point of view towards the particular information needs,
perception towards existing information sources, perusing climate change impacts and elephant
encounters due to climate change etc., in order to focus the attention of policy makers and
meteorologists when planning activities for such small communities. This study was carried out in
Panahaduwa and Rathabalagama villages in Udawalawe using a random sample of 50 farmers.
Structured questionnaire has been used to collect information. The structured questioner was pre
tested with a similar group and local language was used to communicate with respondents. All the
respondents were above 18 years old. Both male respondents and female respondents were used to
conduct the survey. According to the findings farmers perceive ongoing changes in rainfall pattern in
the area. Farmers are more sensitive to changes taken place in local area whereas the level of
perception decreases gradually towards countrywide and global climate changes. A majority of
farmers has adjusted their crop calendar in response to these changes and perceived that elephant
encounters increases in drought periods. Results shown, farmers are aware about the necessity of
adaptation of farming practices to face climate change impacts. However, adapting to impacts of
climate change while also minimizing the risk of wild elephant damage needs reliable weather
information. Even though Farmers use both scientific weather information and traditional knowledge
on climate to plan their crop calendar, they rely more on traditional knowledge due to the perceived
poor accuracy of weather forecasts. Overall policies and measures are necessary to improve the
availability of weather information that facilitates adaptation practices which could reduce damages
from elephants as well as extreme weather conditions. Reliable weather information could help their
decision making process to achieve a better outcome of production.
Keywords: climate change, perception, weather information

N.M.K.C.Premarathne et al / Impact of Changed Rainfall Patterns Due to Climate Change….…..
41
Introduction
Agriculture plays an important role in human lives, providing food and fibre. Farming is an important
economic activity in many parts of the world, including both developed and developing nations.
(Federico,2005) .The climate is the primary determinant of the agricultural productivity. Weather and climate
influence on all components of crop production. (Lizumi and Ramankutty, 2015).Therefore, it needs to
understand the future impacts of climate change to support crop production. The agricultural productivity is
expected to decrease due to the ongoing climate changes and turbulences. Therefore, many studies have been
conducted to address these issues.(Lobell et al., 2008; Dixon et al., 2001; Fischer et al.,2002). The agriculture
is affected by many other factors in addition to climate change. One such activity is crop raiding of wild
animals. (Hill, 1997) Among them, elephants are concerned as critical where farmers live near to park borders
and rural areas. There are a number of studies have been carried out in both Asia and Africa to study the
impact of elephant crop raiding and its impact on livelihoods. (Granados and Weladji, 2012.; Naughton-
Treves, 1998; Hoare ,2000).Climate change is expected to influence badly on both animals and humans
which can make changes in behaviours and feeding habits. (WHO, 2015).Nevertheless, due to climate change,
the land productivity is expected to reduce and increase the struggle for land between animal and
human.(IFPRI Report, 2009). This will open a new dialogue on elephants’ crop raiding behaviour and human
elephant conflict.(Thuppiland Coss, 2012.) In the same time, it emphasizes the importance of climate change
adaptations to withstand the impacts due to climate change and elephant crop raiding in relevant areas. Due to
the competition for land, both humans and elephants are gett ing damaged all over the world where elephants
live (Hoare ,2000). Elephants are critically important not only as a living creature of the environment, but also
as a symbol of culture in most of the countries. (Jayewardene ,1994; Wisumperuma, 2004).Therefo re, it is
important to protect these animals by avoiding possible encounters with human. As a solution for this, climate
change adaptation activities should be implemented along with the expected behavioural changes of elephants
in such areas. The climate change adaptation of a particular community depends on perusing climatic
impacts, loss and damages, socioeconomic characters, policy measures, etc. Adaptation to climate change has
the potential to substantially reduce many of the adverse impacts. (Smit and Pilifosova, 2003). The
identification of factors affecting to adapt could improve the farmers’ adaptability. In this regard, the studies
have found out location specific knowledge is important to develop the adaptation. (Gadgil et al.,2002),
nevertheless information for various farming decisions could positively help farmers in developing strategies
to overcome the perusing risks.(Gadgil et al.,2002)
At this backdrop, the research includes the major objective to analyse the impact of changed rainfall patterns
due to climate change and usage of available weather information. This study specifically aims to study the
level of sensitivity towards the seriousness of climate change to different geographical areas, awareness of
rural farmers on climate change, determine farmers’ perception of the causes of climate change; and identify
the approaches to climate change adaptation by farmers.
Research Background
The prevalence of human-elephant conflict in some areas of Sri Lanka influences the economic activities and
livelihoods in rural communities. It results in crop losses, the deaths of both elephants and human and
property damages annually. (Performance Report – 2011 Department of Wildlife Conservation, Sri
Lanka;Sathiyapille et al. ,2010; Fernando,2015). The reasons for the human-elephant conflict in Sri Lanka are
rapid human population growth, wildlife habitat degradation and deforestation for various purposes.(
Fernando et al., 2011) However, an ongoing climate changes have created unfavorable conditions for
elephants in the protected forest areas. This has studied in some other Asian countries as well (Thuppil and
Coss , 2012.). The unfavourable conditions could create behavioural changes which affect badly on the lives
of those farmers who live near the national park borders like Udawalawe National park, Sri Lanka.
In addition to wild elephant damages on the other hand, the farmers in rural areas experience crop losses due
to climate changes at the same time. The climate change adaptation practices are not well established and

Proceedings of the International Conference on Climate Change, Vol. 1, 2017, pp. 40-50
42
implemented even though there is an emerging need to use to mitigate the crop loss and damages. The
existing adaptations have not used scientific weather information due to a number of reasons like poor
credibility and not availability. (National Climate Change Adaptation Strategy for Sri Lanka 2011 to
2016).Weather information usage in Sri Lankan for developing the adaptation is in its initial stage where
rural farmers are not sufficiently equipped yet. (National Climate Change Adaptation Strategy for Sri Lanka
2011 to 2016). However, The weather information is essential for rural Sri Lankan farmers in order to plan
their crop calendar events and avoid the elephant encounters who are vulnerable to both risks like farmers in
Udawalawe, Sri Lanka
Materials and Methods
Research design
To study about the research questions, a survey was conducted in January 2016 in Panahaduwa and
Rathamabalagama area after pre testing the questionnaire with a similar set of respondents. Data collection
was carried out by using both structured questionnaire and small group discussions. The respondents were
selected randomly. Door to door visit approach was used to collect data. Structured questionnaires were read
in local language by the enumerators to the respondents. The questionnaire was inquired about their climate
related observations, crop losses, elephant crop raiding behaviour, weather information usage, etc. The crop
raiding patterns, crop calendar planning details were collected during the small group discussions in addition
to structured questionnaire. The particular two survey tools were used to collect both quantitative and
qualitative data. The survey was carried out with 50 respondents. All the respondents were above 18 years
old.
Study area
The study area is situated in the border of the Sabaragamuwa province of Sri Lanka. This area is close to the
well-known Udawalawe Ath Athru Sewana (Elephant Transit Home) and Udawalwe National Park
(6.5159100 latitude and 80.8538800 longitude) Study area is situated near to the electric fences of the
Udawalwe National Park border. There are number of researches have been undergone in the Udawalawe
National Park area(UNP) and surrounding villages with respect to mitigation of Human Elephant Conflict
(HEC). Therefore the study area is not a hidden place for the researchers and it is concerned as one of critical
areas where HEC exists in southern Sri Lanka. (Performance Report – 2011 Department of Wildlife
Conservation, Sri Lanka 14-17)
In the communities surrounding and adjacent to this UNP Area, high numbers of HEC incidents have been
reported. The incidents of crop raiding, injuries, property damages have been reported annually in significant
quantities for many years. (Performance Report – 2011 Department of Wildlife Conservation, Sri Lanka 14-
17). The area has a poor precipitation. The study area belongs to dry zone of Sri Lanka, which receives less
than 2500mm rainfall annually. The area is mostly dry throughout the year (Panabokke and Walgama 1974.).
Prolonged drought condition exists for more than three months consecutively after the month of May of
every year, with even longer periods in certain years like 2016 when Sri Lanka experienced severe drought
conditions all over the island.
More than 300 families live near the UNP border in the studied area and share the park area with wildlife for
various purposes such as fuel wood, fodder, building materials, bees’ honey ,medicinal plants, etc. The farm
lands are situated close to electric fences and in some cases they have cultivated crops up to the electric fence.
The study area is poor in infrastructure facilitates like transport, drinking water (both service lines and well
water), hospitals, etc. The villagers have no public transport services as elsewhere in the island. They use their
own three-wheelers or two wheel tractors for transport their farm products to the market or patients to the
nearest government hospital. Transportation during the rainy season is extremely hard due to poor road
conditions and flash floods; nevertheless transportation at night is extremely risk due to roaming elephants.

N.M.K.C.Premarathne et al / Impact of Changed Rainfall Patterns Due to Climate Change….…..
43
All populations are Sinhalese Buddhist in the studied area. Their major livelihood activity is farming under
rain fed irrigation. Farmers cultivate mainly cassava, low country vegetables like eggplants, chilli as cash
crops. Some people grow ground nut as their main cash crop because of drought tolerance, but poor selling
price and price discrimination have demotivated such farmers. Paddy cultivatio n is not practiced and famous
among these farmers like elsewhere in the Island due to lack of rains. Agriculture machinery usage is limited
to tractors and chemical sprayers. Most of the villagers use family labour and shared labour for their farming
activities. Most of the farmers experiences crop losses due to droughts in this area in additions to elephants.
Theory /Calculation
The climate adaptation has been studied for about couple of decades in different parts of the world. Therefore,
abundant knowledge has uncovered. But site specific knowledge and relatedness of the research findings are
needed to confirm before planning activities for climate change adaptation. Therefore, a structured
questionnaire was developed to collect such important information by incorporating findings from different
studies to see the level of consistency of them in the studied area. A study carried out in the Nile basin of
Ethiopia has identified, that climate adaptation has two- steps, which initially requires farmers’ perception
that climate is changing prior to responding to changes through adaptation. According to the same study,
farmers’ perception of climate change is determined by the age of the head of the household, wealth,
knowledge of climate change, social capital and agro-ecological settings. The adaptation to climate change
has been determined by the level of education of the head of the household, household size, whether the head
of the household was male, whether livestock were owned, the use of extension s ervices on crop and livestock
production, the availability of credit and the environmental temperature (Deressa et al., 2011.). A similar
study in Nigeria also has revealed similar findings as factors affecting adaptation. It has further revealed
barriers to adaptation to climate change which include lack of information, lack of money, and inadequate
land. (Ofuoku, 2011).There for these, things can be concerned as important factors for adaptation. But in this
research, the focus was on the Impact of changed rainfall patterns due to climate change and usage of
available weather information by the community for their crop calendar planning. This study would not
concern about the factors affecting the adaptation in that particular community because it has concerned in
many researchers sufficiently.
Similar Studies have further indicated that the perception or awareness of climate change (Semenza et al.,
2008; Sampei and Aoyagi-Usui, 2009; Akterand Bennett, 2009) and taking adaptive measures (Maddison,
2006; Hassan and Nhemachena, 2008) are influenced by different socioeconomic and environmental factors.
Some studies have emphasized the importance of famers’ perception is important to plan future adaptive plans
for them. Their perception about ongoing changes, past experiences and believes on future changes are
necessary to guide future adaptation strategies. Studies have indicated that farmers perceive the on -going
climate changes and also adapt to reduce the negative impacts of climate change (Thomas et al., 2007; Is haya
and Abaje, 2008; Mertz et al., 2009). Therefore, the research was designed to inquire the particular perception
and existing adaptation. The climate information is important to develop the adaptability of farmers. This has
concerned in this research by examining the information usage and their trustworthiness. The importance of
climate information has been emphasized by a study conducted in Argentina. It has pointed out the value of
assessing the climate information for regional agriculture is to gauge user perceptions concerning the use of
that information as the initial step. Further, it has revealed the importance of research and outreach to
downscaling forecasts temporally and spatially toward user communities would help to narrow down the gap
of expectations between user and producer in order to facilitate the trust building process (Letson et al, 2001).
A similar study in Sub-Saharan Africa has indicated the importance of knowing the environment in which end
users operate and usage information. Purposes of use, Uncertainty, perception was important to determine the
dissemination of information for an area. ( Vogel and O’Brien, 2006.) The information gap has identified as
one of the constraints for climate adaptation similar study Ghana, it has shown barriers included lack of
information on adaptation strategies, poverty, and lack of information about weather lead to poor adaptation.

Proceedings of the International Conference on Climate Change, Vol. 1, 2017, pp. 40-50
44
(Fosu-Mensah et al., 2012). The usage of traditional knowledge along with the modern weather forecasting is
one of the highly researched areas. The term traditional knowledge is referred to as the place-based
knowledge that is rooted in local cultures and generally associated with long -settled communities which have
strong ties to their natural environments. Such knowledge is a result of cumulative experience and
observation, tested in the context of everyday life, and devolved by oral communication and repetitive
engagement rather than through formal instruction. (Ingold, 2003; Sillitoe, 2006, 2007). A study in Uganda
has shown the local knowledge system is consisted of four major components :(1)longstanding familiarity
with the seasonal patterns of precipitation and temperature, (2) a set of local traditional climate indicators, (3)
observation of meteorological events, (4) information about the progress of the seasons elsewhere in the
region.( Orlove et al., 2010). Therefore, this study has concerned the similar findings as important to build the
adaptation and this research has been conducted to find out similar facts pertain to the local area.
Results and Discussion
Socio-Economic Characteristics of Respondents
Respondents consisted of 24% males and 76% females. However, these females contribute their efforts to
farming activities similarly to their husbands. Therefore the collected data do not represented the ideas of
anyone who do not have experience in agriculture. The most of males were not found in the houses during the
survey time since they were busy with farming activities. The small group discussions were carried out with
males in convenient time slots to fill this information gap. Respondents’ average age and farming experience
are shown in the table 1. This shows that they have fairly good farming experience with respective to their
mean age.
Table 1 Respondents average age and farming experience (years)
Variable Observations Mean SD Min Max
Respondent’s age 50 36.82
14.08 18 64
Farming experience 48 19.19 11.82 1 50
When considering about the occupation of the respondents, they were inquired how they would like to
introduce their family occupation. The table 2 shows their typical response to this.
Table .2 Occupation of respondents
Occupation Frequency Percentage Cum.
Full time farming
Small business
25
1
52.08
2.08
52.08
54.17
Part time farming
Other
17
5
35.42
10.42
89.58
100.00
The majority of farm families have fairly small annual incomes. The average annual income was
3,58,096LKR (SD2,70,084). The annual monthly income of the farm families has shown in the table 3.
Table 3 Monthly income of respondents’ family
Monthly income Frequency Percentage Cum.
Less than 15,000LKR
Between 15,000-25,000LKR
37
10
74.00
20.00
74.00
94.00
Between 25,000-35,000LKR 3 6.00 100.00

N.M.K.C.Premarathne et al / Impact of Changed Rainfall Patterns Due to Climate Change….…..
45
Respondents have farm lands on average 3.071 acres (SD 2.30308).The farm lands are located approximately
on average 157.28m (SD249.0045) to the park boundary.
Climate change related information
The respondents had familiarity with the climate changes, 94% of the respondents have heard about climate
change and could answer the questions with correct terminology. The table 4 indicates respondents’ belief
levels about their own familiarity on climate change.
Table 4. Respondents’ believe levels about their own familiarity levels on climate change.
Familiarity level Frequency Percentage Cum.
Very Familiar
Familiar
7
35
14.00
70.00
14.00
84.00
Not familiar 8 16.00 100.00
The study identified that farmers perceive ongoing climate changes ; .their experience and idea about ongoing
climate change were inquired to collect the responses. The results in table 5 indicate that the majority of
farmers are experiencing and sensitive to the ongoing changes. However, a tiny portion of respondents expect
it in the future.
Table 5 Respondents’ experience and belief about climate change
Perception Frequency Percentage Cum.
Currently feeling 42 87.50 87.50
Feel in 5-10 years 6 12.50 100.00
The study revealed that the sensitivity level on the seriousness of climate change and its impacts gradually
decrease from their community level to the country level and further decrease towards t he world level. This
shows farmers are more concerned and sensitive towards the impacts on their area rather than the countrywide
issues or world level issues. They believe their community is affected and habitats will be endang ered than
elsewhere. Table 6 indicates their sensitivity levels on the seriousness of climate change with respect to their
community, country and finally the world. The selection percentages of five sensitivity levels differed
according to the concerned geographical area.
Table 6 Sensitivity levels on the seriousness of climate change to different geographical areas
Geographical area Sensitivity level Frequency Percentage Cum.
To Community Extremely serious
Very serious
Serious
Not very serious
Not at all serious
11
19
19
0
1
22.00
38.00
38.00
0
2.00
22.00
60.00
98.00
98.00
100.00
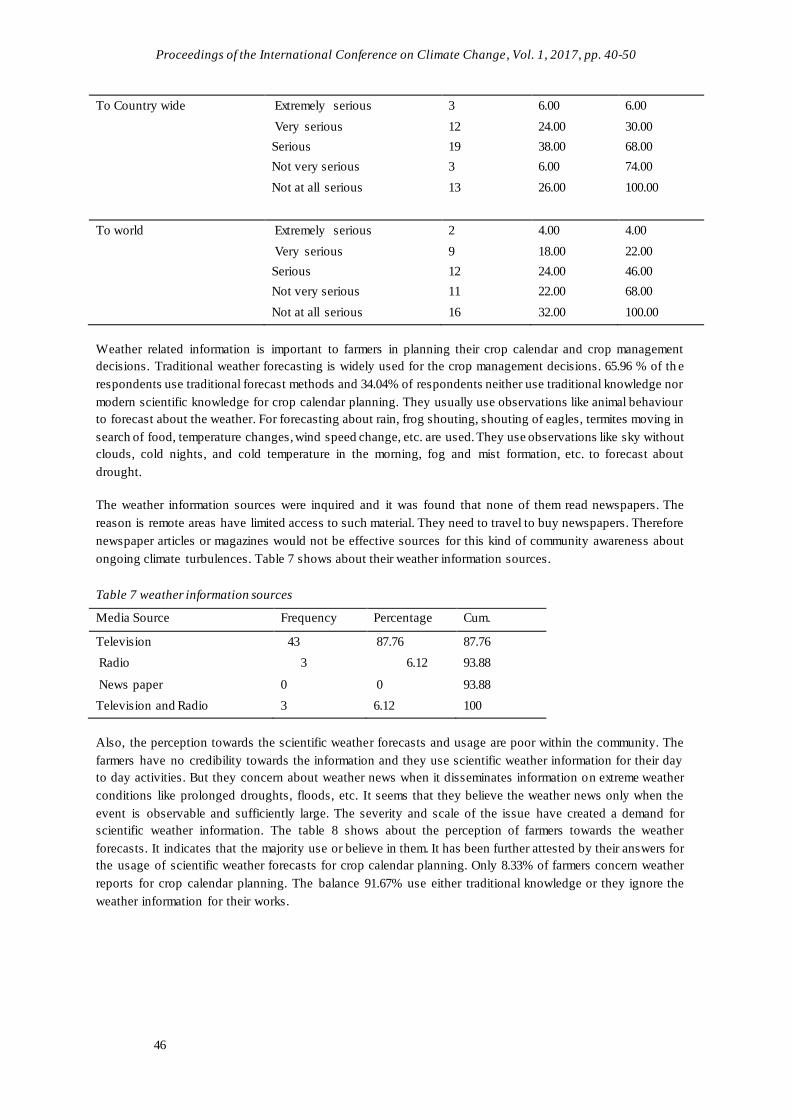
Proceedings of the International Conference on Climate Change, Vol. 1, 2017, pp. 40-50
46
To Country wide Extremely serious
Very serious
Serious
Not very serious
Not at all serious
3
12
19
3
13
6.00
24.00
38.00
6.00
26.00
6.00
30.00
68.00
74.00
100.00
To world Extremely serious
Very serious
Serious
Not very serious
Not at all serious
2
9
12
11
16
4.00
18.00
24.00
22.00
32.00
4.00
22.00
46.00
68.00
100.00
Weather related information is important to farmers in planning their crop calendar and crop management
decisions. Traditional weather forecasting is widely used for the crop management decisions. 65.96 % of th e
respondents use traditional forecast methods and 34.04% of respondents neither use traditional knowledge nor
modern scientific knowledge for crop calendar planning. They usually use observations like animal behaviour
to forecast about the weather. For forecasting about rain, frog shouting, shouting of eagles, termites moving in
search of food, temperature changes, wind speed change, etc. are used. They use observations like sky without
clouds, cold nights, and cold temperature in the morning, fog and mist formation, etc. to forecast about
drought.
The weather information sources were inquired and it was found that none of them read newspapers. The
reason is remote areas have limited access to such material. They need to travel to buy newspapers. Therefore
newspaper articles or magazines would not be effective sources for this kind of community awareness about
ongoing climate turbulences. Table 7 shows about their weather information sources.
Table 7 weather information sources
Media Source Frequency Percentage Cum.
Television
Radio
43
3
87.76
6.12
87.76
93.88
News paper
Television and Radio
0
3
0
6.12
93.88
100
Also, the perception towards the scientific weather forecasts and usage are poor within the community. The
farmers have no credibility towards the information and they use scientific weather information for their day
to day activities. But they concern about weather news when it disseminates information on extreme weather
conditions like prolonged droughts, floods, etc. It seems that they believe the weather news only when the
event is observable and sufficiently large. The severity and scale of the issue have created a demand for
scientific weather information. The table 8 shows about the perception of farmers towards the weather
forecasts. It indicates that the majority use or believe in them. It has been further attested by their answers for
the usage of scientific weather forecasts for crop calendar planning. Only 8.33% of farmers concern weather
reports for crop calendar planning. The balance 91.67% use either traditional knowledge or they ignore the
weather information for their works.

N.M.K.C.Premarathne et al / Impact of Changed Rainfall Patterns Due to Climate Change….…..
47
Table.8 Perception towards the scientific weather reports
Perception Frequency Percentage Cum.
Very accurate and good to follow
Very accurate but no need to follow
Neither accurate nor need to follow
Poorly accurate but no need to follow
6
3
28
11
12.50
6.25
58.33
22.92
12.50
18.75
77.08
100.00
Impacts of changed rainfall patterns and adaptation
92 % of farmers had experienced rainfall pattern changes during the last five years. 59.8% of farmers were
aware about climate change adaptations. Among the farmers who were aware about climate change
adaptations, 69.57 % of farmers have adjusted their crop cycle according to the rainfall pattern changes. Their
most prominent adaptation method was to delay the land preparation until they receive sufficient rains. They
have not used short term varieties or drought resistant varieties, etc. This indicates clearly even though they
are aware and ready to use adaptation practices, they have not been given the required knowledge. Further,
this indicates that they are not receiving accurate weather information in a timely manner. Their common
practice is observation of the rains and use different traditional knowledge to forecast about the intensity and
duration of rain. Table 9 indicates details about adaptation and experience on rain fall pattern changes.
Table 9 Adaptation and experience on rainfall pattern changes
Event Sensitivity level Frequency Percentage Cum.
Rain fall pattern change Experienced
Not experienced
46
4
92
8
92
100
Aware about climate
adaptation
Aware
Not aware
29
20
59.18
40.82
59.18
100.00
Adjusted Crop cycle
according to rain fall
(who are aware adaptation)
Adjusted
Not adjusted
16
7
69.57
30.43
69.57
100.00
Rainfall pattern changes and elephants crop raiding behaviour
Farmers were inquired about their experience related to crop raiding behaviour of elephants. All of them have
experienced crop losses due to wild elephant attacks. 82% of respondents have identified special
seasons/months where elephant crop raiding is high. 76% of the respondents mentioned drought season as the
special season where they experience frequent elephant encounters. 90% of the respondents have expressed
crop raiding as the biggest damage in such attacks. This shows that elephants have insufficient feed and water
inside the jungle during drought seasons. This reason has impacted on elephants and forced them to change
their original feeding habits during droughts. However, the farmers are not well aware about the drought
periods and they use local knowledge to forecast the drought. But due to changes in local climate, farmers fail
to predict the duration or the beginning of drought by using existing local knowledge any more. Therefore,
they cannot cultivate crops which have a less elephant attraction. They usually cultivate the same crop even
though they are well aware about elephant attacks. Table 10 shows the details about farmers’ experience of
crop raiding behaviour.
Proceedings of the International Conference on Climate Change, Vol. 1, 2017, pp. 40-50
48
Table 10 Farmers’ experience of crop raiding behaviour
Variable Response Frequency Percentage Cum.
Have you identified any
special season/ months?
elephants crop raids are high
Yes
No
41
9
82.00
18
82.00
100.00
Which season you
experienced frequent
elephants crop raids
Drought
No season
38
12
76
24
76
100.00
Which is the damage you
experience due to attack
during drought
People
Crops
Property
Property and crops
1
36
2
1
2.5
90
5
2.5
2.5
92.5
97.5
100.00
Conclusion
The results of the study indicate that farmers are well aware of climate change and adaptation. Famers are
more seriously sensitive towards their community- related climate changes. They perceive ongoing climate
changes; however, only 69.57% have taken adaptation measures to reduce its impact of changed rainfall. The
study also revealed that adaptation actions are not very familiar and their practice is not technical. The crop
raiding pattern of elephants has shown an increase in drought seasons and more crop damages. Elephants face
hardships in finding sufficient water and feed during drought periods; Therefore, they come to villages in
search of their needs. The farmers experience crop losses due to climate change. However, people still
practice the same crop cultivation irrespective of the damages caused by both climate and elephants. The
traditional weather information usage is prominent in the community due to the perceived poor accuracy of
scientific weather information. Therefore, policies and measures are necessary to improve the availability of
weather information that facilitates adaptation practices which could reduce damages from elephants as well
as extreme weather conditions. Reliable weather information could help their decision making process to
achieve a better outcome of production.
References
Akter, S. and Bennett, J., 2011. Household perceptions of climate change and preferences for mitigation action: the case of the Carbon Pollution Reduction Scheme in Australia. Climatic change, 109(3), pp.417-436.
Deressa, T.T., Hassan, R.M. and Ringler, C., 2011. Perception of and adaptation to climate change by farmers in the Nile basin of Ethiopia. The Journal of Agricultural Science, 149(1), p.23.
Dixon, J., Gulliver, A. and Gibbon, D. (2001).FarmingSystems and Poverty: Improving Farmers Livelihoods in
a Changing World. Rome and Washington, DC: FAO and World Bank.
Federico, G., 2005. Feeding the world: an economic history of agriculture, 1800-2000.Princeton University Press.
Fernando, P., Jayewardene, J., Prasad, T., Hendavitharana, W. and Pastorini, J., 2011.Current status of Asian elephants in Sri Lanka. Gajah, 35, pp.93-103.
Fernando, P., 2015. Managing elephants in Sri Lanka: where we are and where we need to be. Ceylon Journal of
Science (Biological Sciences), 44(1).
Fischer G., Shah M. and van Velthuizen H. (2002) "Climate Change and Agricultural Vulnerability".
International Institute for Applied Systems Analysis. Report prepared under UN Institutional
Contract Agreement 1113 for World Summit on Sustainable Development.Laxenburg, Austria.
N.M.K.C.Premarathne et al / Impact of Changed Rainfall Patterns Due to Climate Change….…..
49
Fosu-Mensah, B.Y., Vlek, P.L. and MacCarthy, D.S., 2012. Farmers’ perception and adaptation to climate
change: a case study of Sekyedumase district in Ghana. Environment, Development and Sustainability, 14(4),
pp.495-505
Gadgil, S., Rao, P.S. and Rao, K.N., 2002. Use of climate information for farm-level decision making: rainfed groundnut in southern India. Agricultural Systems, 74(3), pp.431-457.
Granados, A. and Weladji, R.B., 2012. Human–elephant conflict around Bénoué National Park, Cameroon: Influence on local attitudes and implications for conservation. Human Dimensions of Wildlife, 17(2), pp.77-90.
Hassan, R. and Nhemachena, C., 2008. Determinants of African farmers’ strategies for adapting to climate
change: Multinomial choice analysis. African Journal of Agricultural and Resource Economics, 2(1), pp.83-104.
Hill, C.M., 1997. Crop-raiding by wild vertebrates: The farmer's perspective in an agricultural community in western Uganda. International Journal of Pest Management, 43(1), pp.77-84.
Hoare, R., 2000. African elephants and humans in conflict: the outlook for co ‐existence. Oryx, 34(1), pp.34-38
International Food Policy Research Institute Report, Climate Change Impact on Agriculture and Costs of
Adaptation (2009). Online at http://www.ifpri.org/sites/default/files/publications/pr21.pdf (accessed 26 Feb. 2016).
Ishaya, S. and Abaje, I.B., 2008.Indigenous people's perception on climate change and adaptation strategies in
Jema'a local government area of Kaduna State, Nigeria. Journal of geography and regional planning, 1(8),
p.138.
Jayewardene J (1994) The Elephant in Sri Lanka.Wildlife Heritage Trust of Sri Lanka, Colombo.
Letson, D., Llovet, I., Podestá, G., Royce, F., Brescia, V., Lema, D. and Parellada, G., 2001. User perspectives of climate forecasts: crop producers in Pergamino, Argentina. Climate Research, 19(1), pp.57-67.
Lizumi, T. and Ramankutty, N., 2015. How do weather and climate influence cropping area and intensity? Glob. Food Secur, 4, pp.46-50.
Lobell DB, Burke MB, Tebaldi C, Mastrandrea MD, Falcon WP, Naylor RL (2008). "Prioritizing climate
change adaptation needs for food security in 2030". Science 319 (5863): 607–10
Maddison, D., 2007. The perception of and adaptation to climate change in Africa (Vol. 4308).World Bank Publications.
Mertz, O., Mbow, C., Reenberg, A. and Diouf, A., 2009. Farmers’ perceptions of climate change and agricultural adaptation strategies in rural Sahel. Environmental management, 43(5), pp.804-816.
Naughton‐Treves, L., 1998. Predicting patterns of crop damage by wildlife around Kibale National Park,
Uganda. Conservation biology, 12(1), pp.156-168.
Ofuoku, A.U., 2011. Rural farmers’ perception of climate change in central agricultural zone of Delta State, Nigeria. Indonesian Journal of Agricultural Science, 12(2), pp.63-69.
Orlove, B., Roncoli, C., Kabugo, M. and Majugu, A., 2010. Indigenous climate knowledge in southern Uganda:
the multiple components of a dynamic regional system. Climatic Change, 100(2), pp.243-265.
Panabokke, C.R. and Walgama, A., 1974. The Application of Rainfall Confidence Limits to Crop Water Requirements in Dry Zone Agriculture in Srilanka”. J. Natn. Sci. Coun. Sri Lanka, 2(2), pp.95-113.
Performance Report – 2011 Department Of Wildlife Conservation. Colombo: Department of Wildlife Conservation,Sri lanka, 2011. Web. 8 Feb. 2017.
Sampei, Y. and Aoyagi-Usui, M., 2009.Mass-media coverage, its influence on public awareness of climate-
change issues, and implications for Japan’s national campaign to reduce greenhouse gas emissions. Global Environmental Change, 19(2), pp.203-212.
Sanga, G. and Ortalli, G., 2003. Nature knowledge: ethnoscience, cognition, and utility. Berghahn books
Santiapillai, C., Wijeyamohan, S., Bandara, G., Athurupana, R., Dissanayake, N. and Read, B., 2010.An assessment of the human-elephant conflict in Sri Lanka. Ceylon Journal of Science (Biological Sciences), 39(1).
Secretariat, C.C., 2010.National Climate Change Adaptation Strategy for Sri Lanka 2011 to 2016.
Semenza, J.C., Hall, D.E., Wilson, D.J., Bontempo, B.D., Sailor, D.J. and George, L.A., 2008. Public perception
of climate change: voluntary mitigation and barriers to behavior change. American journal of preventive medicine, 35(5), pp.479-487.
Sillitoe, P., 2006. Indigenous Knowledge in Development. Anthropology in Action, 13(3), pp.1-12.

Proceedings of the International Conference on Climate Change, Vol. 1, 2017, pp. 40-50
50
Sillitoe, P., 2007. Local science vs. global science: An overview. Local science vs. global science: Approaches to indigenous knowledge in international development, pp.1-22.
Smit, B. and Pilifosova, O., 2003. Adaptation to climate change in the context of sustainable development and
equity. Sustainable Development, 8(9), p.9.
Thomas, D.S., Twyman, C., Osbahr, H. and Hewitson, B., 2007. Adaptation to climate change and variability: farmer responses to intra-seasonal precipitation trends in South Africa. Climatic change, 83(3), pp.301-322.
Thuppil, V. and Coss, R.G., 2012.Using threatening sounds as a conservation tool: evolutionary bases for managing human–elephant conflict in India. Journal of International Wildlife Law & Policy, 15(2), pp.167-185.
Vogel, C. and O’Brien, K., 2006. Who can eat information? Examining the effectiveness of seasonal climate
forecasts and regional climate-risk management strategies. Climate Research, 33(1), pp.111-122.
Wisumperuma D (2004) Human-elephant relationships in Sri Lanka: An historical and archaeological
perspective. In: Endangered Elephants, Past Present and Future. Biodiversity and Elephant Conservation Trust, Rajagiriya, Sri Lanka.pp 6-12.
World Health Organization and United Nations Framework Convention on Climate Change. Climate and health
country profiles – 2015. A global overview. 2015. http:// www.who.int/globalchange/resources/countries/en/

Proceedings of the International Conference on Climate Change, Vol. 1, 2017, pp. 51-56
Copyright © 2017 TIIKM
ISSN 2513-258X online
DOI: https://doi.org/10.17501/iccc.2017.1106
International Conference on Climate Change - 2017 (ICCC 2017)
Drip Irrigation to Enhance Water Productivity of Rice
under Climate Change
S.N.C.M. Dias1*, Niels Schütze1, Franz Lennartz1
1Institute of Hydrology and Meteorology, Dresden University of Technology, Germany
Abstract:
Despite the high-water requirement of rice plant, paddy farmers grow rice mainly under flood
irrigation. Irrigation in rice plays a major role in improving water productivity. Water productivity is
the amount of yield produced per unit amount of water used by crop. Nevertheless, it depends on
soil, climate, agronomic practices and method of irrigation. This study evaluates the water
productivity of rice grown under the drip irrigation in comparison to flood irrigation. A container
experiment was carried out in summer 2015, inside a constructed climate chamber at Dresden
University of Technology, Germany. Three large PVC containers were used and in each 18 rice
plants were grown (variety Bg300). Three soil matric potential based irrigation treatments were
imposed from 14 days after seed establishment until 14 days before physiological maturity.
Treatment T1 was maintained with a ponded depth of 3cm water. Treatments T2 and T3 were drip
irrigated maintaining soil matric potentials at -150 mbar and -300mbar respectively. Compared to the
water productivity of Bg300 under flooded conditions (0.58 kg /m3), all treatments show higher
(1.08 kg/m3, 1.49 kg/m3 and 1.78 kg/m3) water productivities. In conclusion, water productivity of
rice variety Bg300 shows very good results under drip irrigation in comp arison to flood irrigation.
Drip irrigation is the most efficient method of water application to crops including rice. However, its
acceptance and implementation is relatively low among farmers due to technology involved in
design, operation and maintenance. Still, it is a promising technology in rice cultivation in water
scarce conditions under climate change.
Keywords: water productivity, Bg300, rice, drip irrigation
Introduction
Rice is the most important staple food in Asia and approximately 90% of world rice is produced and consumed
in Asia (Nand Kumar Fageria et al., 2010). Rice production under flooded conditions is highly sustainable.
However, rice production needs to increase in coming decades to meet the food demand on growing p opulations
to meet dual challenges of producing enough food and alleviating poverty (Bouman et al., 2007).
Water scarcity in some parts of the world is a limiting factor to produce rice under flooded conditions as
explained above. On the other hand, flood irrigation leads to more evaporation, seepage and deep percolation
which could be considered as losses under water scarce conditions. Dramatic changes in climate such as drought
could severe the environmental conditions unfavourable for Agriculture. On the other hand, land degradation
regarding population growth decreases arable land area. This reduces the agricultural production per un it land
area or in other words reduces land productivity. Though, rice can grow under a wide range of agro-ecological
conditions such as flooded lowlands, temperate cool climates, and drought prone uplands, its yield decline when
soil dries below saturation.
Therefore, increasing crop water productivity or the amount of agricultural output produced per unit amount of
water used, is a viable solution to overcome the above mentioned challenges .
Corresponding Author Email: *[email protected]

S.N.C.M. Dias et al / Drip irrigation to enhance water productivity of rice under…..
52
Agricultural production including rice cultivation in some countries already practices water saving irrigation
practices such as alternate wetting and drying, saturated soil culture, partial root zone irrigation, deficit
irrigation, and aerobic rice cultivation.
In all these practices, method of irrigation plays a major role in water savings. For instance, flood irrigation,
sprinkler irrigation and drip irrigation can be used in rice cultivation. However, many farmers by convention use
flood irrigation as a method of weed control and easy way of practice, but not to save water.
Unlike fertilizers and pesticides, water is not actively traded in Asia and government-administered fees for
irrigation water are often low or zero. This discourages farmers from treating water as a scarce resource. On the
other hand, they get no incentive on saving water. Therefore farmers in certain areas of China where farmers are
charged based on volume of water used for irrigation are practicing water saving irrigation methods. (J.W. Kijne
et al., 2003).
Fundamentally different approach to grow rice is aerobic rice cultivation such as production of wheat and maize
in non-flooded conditions (Bouman et al., 2002). According to literature, aerobic rice cultivation is practiced
large scale in northern China and in Brazil with aerobic rice varieties produced by breeders (Bouman et al.,
2002).
Dry seeding is another practice of rice cultivation in dry areas. In this method land preparation is minimum to
zero, thereby saves large amount of water. However, these methods are associated with some yield reductions.
Therefore, evaluation of water productivity under different irrigation methods is of importance. This could be a
motivation for farmers to adopt to these waters saving techniques.
Therefore, objective of this study was to evaluate water productivity of a Sri Lankan lowland rice variety Bg300
under drip irrigation in comparison to flood irrigation.
Drip irrigation is being practiced in many other crops such as vegetable production, fruit production and in
horticulture. For instance drip irrigation becomes popular in onion cultivation due to its water application
efficiency and precise irrigation management (Shock et al., 2000). Though the method of irrigation is drip, the
criteria used to irrigate is based on soil matric potential. This is a very effective technology where plant is
irrigated based on the crop water demand. Soil matric potential might be an ideal criterion for irrigation, since
variable atmospheric evaporation, soil texture, cultural practices and water management affect rice irrigation
water requirements (Kukal et al., 2005).
Materials and Methods
A container experiment was conducted within the laboratory premises of Dresden University of Technology .
Duration of the experiment was from 08th of May untill 19th of September, 2015. Soil matric potential based
irrigation treatments, namely T1, T2 and T3 were imposed in three large PVC containers as shown in Figure 1.

Proceedings of the International Conference on Climate Change, Vol. 1, 2017, pp. 51-56
53
Figure 1: Experimental Set-up in the climate chamber
Treatment T1, was maintained with a 3cm of ponding water level throughout the treatment period (see Figure
2). Other two treatments were maintained at the soil matric potential levels of -150mbar (T2) and -300mbar
(T3) respectively throughout the treatment period.
Containers of treatments T2 and T3 were placed on two weighing balances which were connected to a data
logger for automatic water balance measurements. However, the container with treatment T1 was placed at the
same height with other two, but without a weighing balance.
Figure 2: Irrigation treatment T1 with ponded water.
Construction of climate chamber
Containers were placed inside a constructed climate chamber. It was built using hardboard and steel with a cross
sectional area of 4m2 and a height of 4m. Climate chamber inner walls and roof were covered with aluminium
foils to provide homogeneous lighting conditions. Tropical climate conditions were simulated using growing
lamps (Osram power star HQI-BT 400 W/D PRO). Two lamps were hanged 2m above each container. Lamps
were connected to a timer to automatically switch on and off creating 12 hours of each day and night cycles.

S.N.C.M. Dias et al / Drip irrigation to enhance water productivity of rice under…..
54
Installation of soil moisture sensors
Required soil matric potential thresholds in T2 and T3 were maintained using Tensiometers. Bambach digital
and T4 tensiometers were installed at 10cm interval up to 40cm depth. Twelve tensiometers were installed in
each container at different locations. Control tensiometers were installed at 20cm depth to maintain soil matric
potential at threshold level to trigger the irrigation system.
Soil moisture content was measured using time domain reflectometry (Campbell Scientific, TDR100) probes
installed at the same depths. Two TDR probes were installed at each depth on each half of the container to check
for any variations in the same depth. Both tensiometers and TDR probes were connected separately to two data
loggers.
Seed Establishment
Rice variety Bg300 which was developed by Rice Research and Development Institute of Sri Lanka was used in
this experiment. Seeds were soaked in water for 24 hours and incubated in a cloth bag for 48 hours. Germinated
seeds were Direct seeded in soil at a planting space of 20cm x 15cm in all containers. each container
accommodated 18 planting hills. Two weeks after seeding, excess seedlings were removed by leaving 3 plants
per planting hill. During these two weeks, all three containers were maintained at saturation to establish similar
growth condition at the beginning of the experiment. Two weeks after seeding, irrigation treatments were
initiated and continued until two weeks before physiological maturity.
Method of Irrigation
Sub-surface drip irrigation system (Netafim NMC-pro) was installed to irrigate treatments T2 and T3 (see
Figure 2). Irrigation system was triggered upon reaching relevant soil matric potential thresholds at 20cm depth.
Each drip emits 1.2 l/hr of water to plants. Single irrigation event was set to 5 minutes and allowed to distribute
water for 2 hours. After 2 hours, if required threshold level is not achieved then it re -irrigates to bring down the
soil tensions.
Management Practices
After seed establishment, basal fertilizer (N P K) was applied at a rate of 5 kg/ha, 50 kg/ha and 20 kg/ha
respectively to all three containers. All other fertilizer applications were carried out according to the local
fertilizer recommendations of the Department of Agriculture, Sri Lanka.
When necessary, chemical pest and disease management was carried out. However, throughout the period plants
were free from severe pest and disease attacks. Soil in Weed management was carried out manually. All
containers were kept at saturation for two weeks to establish homogeneous plant density. At two weeks
additional plants were removed by leaving 3 plants per planting hill.
Data Collection
Maximum and minimum air temperatures, soil surface temperature and temperature at weighing balance (to
account for changes in resistance in load bearing cells) were measured using temperature sensors. Other climate
data such as radiation, relative humidity were measured periodically with a wireless weather station placed
inside the climate chamber.
Plant growth parameters such as plant height, number of green, yellow and dead leaves, tillers, panicles, were
weekly measured. In addition to that, leaf area index (LAI), leaf nitrogen content (SPAD Value), stomatal
conductance, leaf rolling score were measured weekly. Plant phenological developmental stages were recorded
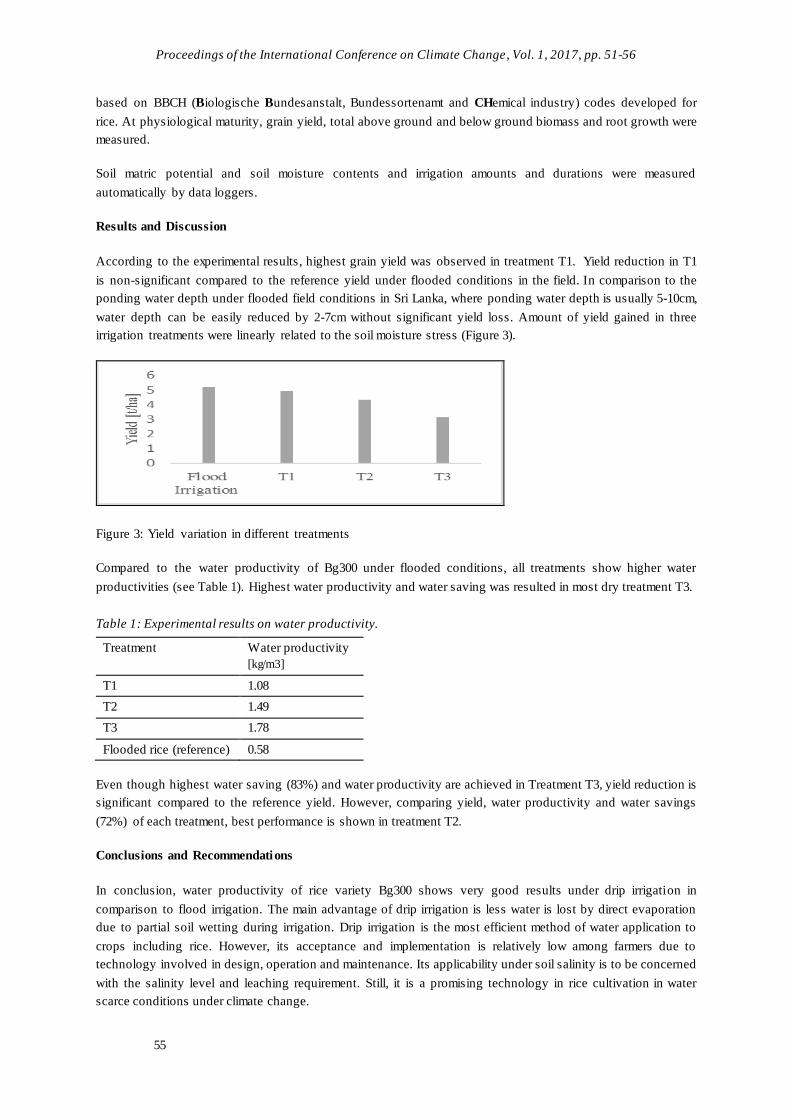
Proceedings of the International Conference on Climate Change, Vol. 1, 2017, pp. 51-56
55
based on BBCH (Biologische Bundesanstalt, Bundessortenamt and CHemical industry) codes developed for
rice. At physiological maturity, grain yield, total above ground and below ground biomass and root growth were
measured.
Soil matric potential and soil moisture contents and irrigation amounts and durations were measured
automatically by data loggers.
Results and Discussion
According to the experimental results, highest grain yield was observed in treatment T1. Yield reduction in T1
is non-significant compared to the reference yield under flooded conditions in the field. In comparison to the
ponding water depth under flooded field conditions in Sri Lanka, where ponding water depth is usually 5-10cm,
water depth can be easily reduced by 2-7cm without significant yield loss. Amount of yield gained in three
irrigation treatments were linearly related to the soil moisture stress (Figure 3).
Figure 3: Yield variation in different treatments
Compared to the water productivity of Bg300 under flooded conditions, all treatments show higher water
productivities (see Table 1). Highest water productivity and water saving was resulted in most dry treatment T3.
Table 1: Experimental results on water productivity.
Treatment Water productivity
[kg/m3]
T1 1.08
T2 1.49
T3 1.78
Flooded rice (reference) 0.58
Even though highest water saving (83%) and water productivity are achieved in Treatment T3, yield reduction is
significant compared to the reference yield. However, comparing yield, water productivity and water savings
(72%) of each treatment, best performance is shown in treatment T2.
Conclusions and Recommendations
In conclusion, water productivity of rice variety Bg300 shows very good results under drip irrigation in
comparison to flood irrigation. The main advantage of drip irrigation is less water is lost by direct evaporation
due to partial soil wetting during irrigation. Drip irrigation is the most efficient method of water application to
crops including rice. However, its acceptance and implementation is relatively low among farmers due to
technology involved in design, operation and maintenance. Its applicability under soil salinity is to be concerned
with the salinity level and leaching requirement. Still, it is a promising technology in rice cultivation in water
scarce conditions under climate change.

S.N.C.M. Dias et al / Drip irrigation to enhance water productivity of rice under…..
56
Acknowledgements
IPSWaT Scholarship programme and Graduate Academy of Dresden University of Technology is
acknowledged for providing financial support. Members of Institute of Hydrology and Meteorology, Dresden
University of Technology are acknowledged for their immense support during the research work.
References
Bouman, B.A.M., Humphreys, E., Tuong, T.P., Barker, R., 2007. Rice and Water. Adv. Agron.
Bouman, B., Hengsdijk, H., Hardy, B., Bindraban, P., Tuong, T., Ladha, J., 2002. Water-wise Rice Production, Proceedings of the International Workshop on Water-Wise Rice Production.
J.W. Kijne, Barker, R., D. Molden (Eds.), 2003. Water Productivity in Agriculture:Limits and Opportunities for Improvement. CABI publishing, CPI Antony Rowe, Eastbourne.
Kukal, S.S., Hira, G.S., Sidhu, A.S., 2005. Soil matric potential-based irrigation scheduling to rice (Oryza
Sativa). Irrig. Sci. 23, 153–159.
Nand Kumar Fageria, Baligar, V.C., Allan Jones, C., 2010. Growth and mineral nutrition of field crops, third edit. ed. CRC Press, Taylor and Franciss group, Boca Raton, London, New York.
Shock, C.C., B.G.Feibert, E., Lamont D. Saunders, 2000. Irrigation Criteria for Drip-irrigated Onions. HORTSCIENCE 35, 63–66.
Proceedings of the International Conference on Climate Change, Vol. 1, 2017, pp. 57-78
Copyright © 2017 TIIKM
ISSN 2513-258X online
DOI: https://doi.org/10.17501/iccc.2017.1107
International Conference on Climate Change - 2017 (ICCC 2017)
Uncertainties and Challenges in Distribution of
Groundwater Recharge in Climate Change Scenario
Shivaji Patil 1*, Jagottam Agrawal2
1 S. P. Pune University, DYPIET, Pimpri, Pune, India 2 Ports and Harbors Division, CWPRS, Khadakwasla, Pune, India
Abstract:
Groundwater use is of fundamental importance to meet the rapid expanding urban, industrial, and
agricultural water requirements throughout the world and also in India. To quantify the distribution
of groundwater recharge is a prerequisite for efficient and sustainable groundwater resource
management in the arid and semi arid regions. Groundwater recharge in these regions shows
variability, as per the assessment carried out by using various methods such as Soil Water Balance
(SWB) analysis, Integrated Landscape Hydrology Model (ILHM), Water Table Fluctuations (WTF),
Isotopic Tracers methods - Chloride Mass Balance, Carbon-14,etc, WetSpass model, SWAT-
MODFLOW model, Empirical method, Numerical Modelling, etc. The interaction of soil, climate,
slope, geology, geomorphology, land use land cover, rainfall, drainage pattern and other methods
used for recharge determines the recharge process. The study reveals that the reasons causing this
variability are ranging from uncertainties in recharge influencing factors to change in climatic
conditions. The study also shows that the uncertainties in distribution of groundwater recharge occur
differently in different regions, due to the impact of various factors such as change in climatic
conditions, land use, soil types, etc. In conclusion, it can be stated that realistic estimation of
recharge depends mainly on identifying prominent features influencing recharge for a certain region
and probable flow mechanism for targeted aquifer, multiple dependent models / approaches may be
applied for estimation of recharge and output may be compared to actual field conditions.
Keywords: groundwater, recharge, uncertainties, challenges
Introduction
Understanding the spatial and temporal distribution of groundwater recharge is a pre-requisite for efficient and
effective groundwater management and modelling. In a country like India, it is essential that a careful water
balance study is carried out. The scarcity of water and the competition for freshwater demand for domestic,
industrial and agricultural uses is increasing. The spatio-temporal attributes of groundwater use data are ideally
suited for analysis. It is very common that the period of lowest natural groundwater supplies coincides with
largest demand and vice versa. Sometimes region deficient in surface water supplies may be underlain by
excessive groundwater reserves. Therefore the need for reliable estimate of groundwater recharge is well
recognised. A better understanding of the methods, their applicability and limitations is an important pre-
requisite to choose the appropriate techniques for groundwater recharge estimation. Even though the number of
studies were conducted, determination or estimation of groundwater recharge still remains fraught with
uncertainty.
This paper aims to focus on concepts of groundwater recharge, uncertainties and challenges, which occurs in the
study of distribution of recharge, in different regions in accordance with the influence of various prominent
factors. Efforts have also been made to adopt the appropriate method for selected region of study suiting the
various controlling factors and climate change scenario.
Corresponding Author Email: *[email protected]

Shivaji Patil, Jagottam Agrawal / Uncertainties and challenges in distribution of…..
58
Groundwater Recharge
Types of Recharge
Recharge is defined as the downward flow of the water reaching the water table forming an addition to the
groundwater reservoir (Jacobes J. de Vries & Simmers, 2002). Lerner (1990).
There are three main types:
Direct Recharge: In this type water is added to the groundwater reservoir in excess of soil moisture deficit and
evapotranspiration by direct vertical percolation through the vadose zone.
Indirect Recharge: Water from the surface courses like rivers and canals percolate to the groundwater.
Localised Recharge: It is an intermediate form of groundwater recharge resulting from surface of near surface
concentration of water.
Recharge Mechanisms
Groundwater recharge involves movement of moisture through the unsaturated zone. There are two major
mechanisms, which control such moisture movement viz. Interstitial (Matrix) flow and Macropore recharge. In
interstitial flow mechanism recharge, water is stacked as layers one above the other. Any fresh layer of water is
added on the surface pushes an equal amount of water beneath so that the moisture of the last layer is added to
the groundwater. During this movement the younger water never overtakes the older water.
Macropore recharge occurs through preferred pathways in the soil matrix like cracks, fractures, solution holes,
animal burrows, root tubes, etc. Jacobes J. de Vries & Simmers (2002) suggested an additional term
‘preferential flow’ to describe flow caused by unstable wetting fronts and differential soil physical
characteristics within the soil.
However, not all this water essentially reaches the water table. It might be hampered by low conductivity
horizons and disappear as interflow to nearby local depressions, where it runs off or evaporates instead of
joining the regional groundwater system. In shallow aquifers a rise in the water table by recharge could initiate
a local groundwater system with associated local seepage discharge within the considered area. A similar
problem in areas with a high water table is associated with a time scale: water may initially join the groundwater
reservoir but might subsequently be extracted by evapotranspiration.
The term potential recharge as introduced by Rushton (1988) includes the excesses of precipitation over
evapotranspiration, which subsequently disappear through a local discharge system or by evapotranspiration
from the saturated zone. However, this could become ‘permanent’ recharge by lowering the water table after
extraction. Moreover, lowering of a shallow water table can induce additional recharge by reducing
evapotranspiration.
These conceptual problems do occur, normally, in areas with deep water tables, far below the root zone. Under
such conditions, virtually all water that passes the root zone is assumed to have escaped evapotranspiration and
could recharge the groundwater reservoir.
Various techniques are available for estimation of groundwater recharge (Simmers, 1988; Scanlon, 2002). The
recharge estimation methods have been divided into three broad categories (Table 1).
Methods based on physical parameters
Chemical and Isotopic methods
Numerical modelling and Empirical methods

Proceedings of the International Conference on Climate Change, Vol. 1, 2017, pp. 57-78
59
Methods used in previous studies
Various methods such as Soil Water Balance (SWB) analysis, Integrated Landscape Hydrology Model (ILHM),
Water Table Fluctuations (WTF), Isotope Tracers methods - Chloride Mass Balance, Carbon-14, WetSpass
model, SWAT-MODFLOW model, Empirical method, Numerical Modelling, etc., of groundwater recharge
shows the variability in the climate change scenario.
The present research work summarises the existing studies and their respective significance in various field
conditions as well as climate change scenario. These studies are categorised into three broad types based on the
analysing methods.
(a) Methods with physical parameters
WetSpass Model
In this WetSpass (Water and Energy Transfer between Soil, Plants and Atmosphere under quasi-Steady State)
model, the methodology used delivers spatially distributed recharge as a function of vegetation, soil type, slope,
groundwater depth, precipitation regime, and other climatic variables. Adnan M. Aish (2010), developed a
WetSpass model for estimating spatially distributed, long-term average recharge for the Gaza Strip, for partly
semi-arid and partly desert climate, with mostly coastal aquifers. Mustafa Al Kuisi (2013) carried out study for
GIS based spatial groundwater recharge estimation in the Jafr basin, Jordan. These investigations have
demonstrated that the estimation of groundwater recharge using WetSpass is in good agreement with those
obtained by other studies. O. Batelaan (2007) made an attempt to develop spatially distributed water balance
model to simulate long-term average recharge depending on land cover, soil texture, topography and
hydrometeorological parameters. Parameter estimation for the model is performed on the basis of literature
values of water balance fluxes from mainly Belgium and the Netherlands. Moreover, it was concluded that the
shallow groundwater levels in valleys cause negative recharge conditions as a result of evapotranspiration by
abundant phreatophytic vegetation. GIS analysis showed how recharge strongly varies for different
combinations of land cover and soil texture classes. Z. Zomlot et. al. (2015) assessed controlling factors causing
spatial distribution of groundwater recharge and base flow in Flanders, Belgium, using spatially distributed
water balance model WetSpass.
Soil Water Balance Analysis
Alan Mair (2013) carried out a study to estimate groundwater recharge on the island of Jeju, Korea, for baseline,
drought, and climate-land use change scenarios, in which soil water balance analysis was conducted. The Soil
Water Balance (SWB) computer code was used to compute groundwater recharge and other water balance
components at a daily time step using a 100 m grid cell size for an 18-year baseline scenario.
Gravity Recovery and Climate Experiment (GRACE)
Alexander Y. Sun. (2013) conducted a study aimed for predicting groundwater level changes using GRACE
data with an aim to investigate the feasibility of downscaling Gravity Recovery and Climate Experiment
(GRACE) satellite data for predicting groundwater level changes and, thus, enhancing current capability for
sustainable water resources management. The statistical downscaling method adopted in this study was
Artificial Neural Network (ANN).
Integrated Landscape Hydrology Model (ILHM)

Shivaji Patil, Jagottam Agrawal / Uncertainties and challenges in distribution of…..
60
David W. Hyndman (2007) prepared a ILH Model which accounts for the processes and mass balance in a most
rigorous manner than semi-distributed codes, which tend to lump or oversimplify important watershed processes
and use parameters that cannot be independently measured.
Hydrologic model
Mikko I. Jyrkama(2007) conducted a study to characterize both the temporal and spatial effect of climate change
on groundwater recharge. In this study, 40 years of actual weather data, and future changes in the hydrologic
cycle of the Grand River watershed were used. The impact of climate change is modelled by perturbing the
model input parameters using predicted changes in the regions climate.
RIB model
X. Sun (2013) conducted a study for groundwater recharge estimation in arid and semi-arid areas by developing
a rainfall infiltration breakthrough (RIB) model, by establishing a relationship between rainfall events and
groundwater level fluctuations (WLF) on a monthly basis.
Aquifer systems
Thomas Meixner (2016) carried out a study for analysing the implications of projected climate change for
groundwater recharge in the western United States, in which an analysis is presented by synthesizing existing
studies and applying current knowledge of recharge processes. In this study, available climate-change
projections were analysed to determine likely changes in temperature and precipitation in the sub-regions
containing eight representative aquifers. A confidence level (high, medium or low) was assigned to predicted
recharge changes. This structured approach provides a template for how large scale regional assessments of the
response of groundwater recharge to climate change might be useful for other regions.
SWAT model
Anna Malago et.al.(2016) carried out a case study of the Island of Crete (Greece) for regional scale hydrologic
modeling of a karst-dominant geomorphology for quantification of a spatially and temporally explicit
hydrologic water balance of karst-dominated geomorphology in order to assess the sustainability of the actual
water use, using SWAT model and a karst-flow model (KSWAT model).
WTF, DHB & HB method
T. Ahmadi et. al. (2013) conducted a study for estimation of groundwater recharge using various methods in
Neishaboor Plain, Iran, using three methods, based on the water balance principle (rainfall-groundwater level
relationship), including Water Table Fluctuation (WTF), Distributed Hydrological Budget (DHB) and
Hydrological Budget (HB).
GIS-based NDVI model
Vijai Singhal and Rohit Goyal (2012) carried out a study for understanding effect of rainfall and vegetation
density on groundwater recharge using a methodology based on spatial distribution of parameters such as
Normalised Difference Vegetation index (NDVI) for part of Pali district in Rajasthan, India. New methodology,
for different cause, has been developed and demonstrated for understanding affect of rainfall and vegetation
density on recharge.

Proceedings of the International Conference on Climate Change, Vol. 1, 2017, pp. 57-78
61
(b) Chemical and isotopic methods
Tracers Isotope / Carbon-14 and Chlorine Mass Balance composite method
Glenn A. Harrington et. al. (2002) conducted a study, aimed to estimate the average recharge rate over the
interval between where the groundwater sample first entered the saturated zone and above. Two environmental
tracer methods were applied in this study to the Ti-Tree basin in central Australia to focus on the importance of
recharge from flood outs of ephemeral rivers in this arid environment. The results of the two tracer approaches
indicate that recharge rates around one of the rivers and an extensive flood plain were generally higher than
rates of diffuse recharge that occurred in areas of lower topographic relief. Richard Taylor et. al. (1996)
conducted a study for supporting for soil moisture balance approach using stable isotope tracers and flow
modelling i.e. it includes three different methods.
Chlorine Mass Balance method
Jozsef Szilagyi et. al. (2011) carried out a study for mapping mean annual groundwater recharge in the Nebraska
Sand Hills, USA. Monthly precipitation (P) values came from the PRISM and monthly evapotranspiration (ET)
values were derived from linear transformations of the MODIS daytime land-surface temperature values into
pixel ET rates with the help of ancillary atmospheric data (air temperature, humidity, and global radiation). The
uncertainty level of the resulting recharge-rate estimates can be easily defined from known or estimated levels
of inaccuracy in the P and ET variables. Tianming Huang and Zhonghe Pang (2010) conducted a study for
estimating groundwater recharge following land-use change using chlorine mass balance of soil profiles in
Loess Plateau of China. A model was prepared in this study for the use of chloride to evaluate reduced
groundwater recharge following a land-use change. F. Manna et. al. (2016) conducted a study for groundwater
assessment in an upland sandstone aquifer of southern California using Chlorine Mass Balance (CMB) method.
Felix Oteng Mensah et. al. (2014) conducted a study for evaluation of groundwater recharge estimates in a basin
in tropical environment by using natural tracers. The current study evaluates the performance of the CMB
methodology in a typical tropical climatic environment where the availability of groundwater resources is
critical to socioeconomic conditions of populations and the survival of ecosystems that depend on such
groundwater resources for sustenance. Jacob Nyende et. al. (2013) conducted a study in investigating surface
water and groundwater in fractured aquifer under influence of climate variability using application of isotopes
and recharge analysis in Kyoga basin in Uganda. In this study the impact of climate variability on water
resources (surface and ground) was conducted to assess the effect of meteorological forcing on isotopic and
recharge characteristics of the granitic and fractured aquifer, using environmental isotopes and also using
EARTH model in determining the groundwater levels response to rainfall of the fractured aquifer.
Radiation-based method
Mohammad Valipour (2015) conducted a study aimed to compare radiation-based methods to determine the best
method under different weather conditions. The potential evapotranspiration was estimated using 22 radiation-
based methods and compared with the Food and Agriculture Organization of the United Nations (FAO)
Penman-Monteith method.
(c) Numerical modelling and empirical methods
GROWA model
H. Bogena et. al. (2005) conducted a study for finding out uncertainties in the simulation of groundwater
recharge at different scales using GROWA model, which consists of several modules for determining the long-
term annual averages of water-balance components, viz. Actual evapotranspiration, total discharge, direct runoff
and groundwater recharge.

Shivaji Patil, Jagottam Agrawal / Uncertainties and challenges in distribution of…..
62
Frequency Domain Analysis
Joaquin Jimenez-Martinez et. al. (2013) conducted a study for temporal and spatial scaling of hydraulic response
to recharge in fractured aquifers, using frequency domain analysis. In order to reduce potential sources of non-
linearity coming from unsaturated zone processes, the recharge at the bottom of the soil layer was used as input
for the frequency domain analysis. Transfer functions are calculated in a range of temporal scales from 1 day
upto a few years, for a fractured crystalline-rock aquifer located in Ploemeur (France), using recharge and
groundwater fluctuations as input and output respectively.
Numerical Modelling method
(i) Precipitation model
Sarit Kumar Das and Rajib Maity (2014) carried out a study for finding potential of probabilistic
hydrometeorological approach for precipitation-based soil moisture estimation. The time series of in situ soil
moisture and meteorological variables at a monthly scale from different monitoring stations across India are
utilised.
(ii) Leaf Area Index
P. Ala-aho et.al. (2015) conducted a study for estimation of temporal and spatial variations in groundwater
recharge in unconfined sand aquifers using Scots pine inventories. The modelling approach uses data-based
estimates for the most important parameters controlling the total amount (canopy cover) and timing (thickness
of the unsaturated zone) of groundwater recharge. Scots pine canopy was parameterised to Leaf Area Index
(LAI) using forestry inventory data. Uncertainty in the parameters controlling sediment hydraulic properties and
evapotranspiration (ET) was carried over from the Monte Carlo runs to the final recharge estimates.
MODFLOW model
Nam Won Kin et. al. (2008) carried a study for development and application of the integrated SWAT-
MODFLOW model, with main factors are the land use, surface runoff and other factors. SWAT is a basin scale,
continuous time model that operates on a daily time step and designed to predict the impact of management on
water, sediment, and agricultural chemical yields in ungauged watersheds. MODFLOW is used in layered
aquifer systems with the use of modular three-dimensional block-centered finite difference code. The main
program of the SWAT-MODFLOW model is simply a modified version of the main program of SWAT. H.
Hashemi et. al. (2014) conducted a study with an extended modelling approach to assess climate change impacts
on groundwater recharge and adaptation in arid areas. Rainfall-runoff modelling used to simulate runoff from a
basin for given meteorological data. Future runoff was simulated using a conceptual box model (Qbox) utilizing
the three future climate scenarios for the future periods. A GW flow and recharge model was used to simulate
GW flow and estimate aquifer hydraulic parameters by MODFLOW.
WAVES model with improvements
Russell S. Crosbie et. al. (2013) conducted a study for finding out the potential climate change effects on
groundwater recharge in the High Plains Aquifer, USA, using WAVES numerical model with improvements.
WAVES require three main data sets: climate, soils, and vegetation. The upper boundary condition is forced
with climate data and the lower boundary condition is free drainage, consistent with previous studies of the
impacts of climate change on recharge.

Proceedings of the International Conference on Climate Change, Vol. 1, 2017, pp. 57-78
63
Empirical Formulae
Oluseyi O. Adeleke et.al. (2015) conducted a study for estimation of groundwater recharges in Nigeria using
empirical formulae. In this study comparative analysis of three empirical formulae to estimate recharge, which is
a prerequisite for groundwater resource management was carried out.
Results from previous studies
(a) Results based on methods with physical parameters
WetSpass Model
Results of the WetSpass model developed by Adnan M. Aish (2010) show that the estimated distributed
recharge can be used in regional steady-state groundwater models and decrease the uncertainty in simulations.
Results from the study of Mustafa Al Kuisi (2013), using WetSpass model, shows that there is a good agreement
in the simulated recharge. The water balance model of O Batelaan (2007) coupled to a regional groundwater
model is applied and successfully tested on the 17 catchments. Study showed that the resulting recharge has a
spatial complex pattern, depending to a large extend on the soil texture and land cover. Z. Zomlot (2015) found
that the annual recharge shows a large spatial variation and negative recharge occurred in zones with shallow
groundwater. Negative recharge occurs, in case the total evapotranspiration is higher than the infiltration. Soil
properties appear to have a major contribution in spatial variation of recharge.
Soil Water Balance Analysis
Alan Mair (2013)’s model was capable to estimate recharge in a temperature-humid area of diverse land use,
high rainfall temporal and spatial variability, high topographic relief and generally high infiltration capacity.
The model produces reliable estimates of spatially-varying recharge in temperature-humid climates.
GRACE Model
It was observed in the study, conducted by Alexander Y. Sun. (2013) that, downscaling of GRACE data to
multiple wells at the sub-grid scale is feasible. Practical application of model for local water resources is limited.
Approach developed can be applied to force multiple ANNs developed for a network of wells, the outputs of
which can be combined via spatial interpolation techniques.
ILHM
ILH Model accounts for the processes and mass balance in a most rigorous manner than semi-distributed codes,
which tend to lump or oversimplify important watershed processes and use parameters that cannot be
independently measured.
Hydrologic model
The results of the study indicate that the overall rate of groundwater recharge is predicted to increase as a result
of climate change. It is also observed that the higher intensity and frequency of precipitation could also
contribute significantly to surface runoff, while global warming may result in increased evapotranspiration rates.
RIB model
The Pearson correlation coefficients indicate that the results of the rib model are more significantly correlated to
observed values than those of the CRD method. The Spearman correlation coefficients between rainfall and

Shivaji Patil, Jagottam Agrawal / Uncertainties and challenges in distribution of…..
64
observed WLF together with recharge estimates obtained from other methods in these areas demonstrate that the
recharge estimates on a monthly basis are more realistic than those on a daily basis.
Aquifer systems
In the most of the systems studied, vadose zone storage and the dynamic interaction of surface water flows with
groundwater recharge was not included. Recharge to the Death Valley regional flow system occurs almost
entirely from infiltration of precipitation and runoff in mountain systems and is low, reflecting the area’s
extreme aridity. Recharge to the Central Valley is dominated by irrigation recharge, with mountain system
recharge (MSR) and diffuse recharge playing subsidiary roles. Diffuse recharge is the primary recharge
mechanism for the Columbia Plateau aquifer system, with irrigation providing the balance of the recharge.
Recharge to the Williston Basin consists almost entirely of diffuse recharge, with a small amount of focused
recharge through streambeds.
SWAT model
Results demonstrated that the karst-flow model correctly simulated the discharge of springs increasing the
SWAT model performance. However, the karst-flow model markedly overestimated the discharge for five
springs, may be due to the quality of the observed data.
WTF, DHB & HB method
Hydrological Budget (HB) was used to calculate groundwater recharge, which shows 61 % of the total
groundwater recharge including net groundwater inflow, infiltration and irrigation return flow. The difference
between groundwater recharge rate estimated through Distributed Hydrological Budget (DHB) and Water Table
Fluctuation (WTF) is less than 20 %.
GIS-based NDVI model
With the increase in value of NDVI from 0.13 to about 0.18, the value of groundwater recharge increases, as
water is retained at the surface due to increase in vegetation density and thus has stronger chance of infiltrating
into the ground. However, when value of NDVI is beyond 0.18, groundwater recharge starts decreasing with
increase in NDVI value.
(b) Results based on chemical and isotopic methods
Tracers Isotope / Carbon-14 and Chlorine Mass Balance composite method
Glenn A. Harrington et. al. (2002) recorded the results that the mean carbon-14-derived recharge rate for the
entire Ti-Tree basin is 3.5 mm/year. However, the median carbon -14-derived rate is only -0.9 mm/year, which
is close to the mean rate determined from chloride mass balance (0.8 mm/year). Recharge rates are generally
higher for boreholes located around the Allungra Creek floodplain and the northern section of the Woodforde
River, compared with other parts of the basin. This is consistent with enhanced recharge in these areas after
infrequent storm events. Richard Taylor et. al. (1996) noted in soil moisture balance technique that despite the
slight rise in the annual rainfall observed between the periods, the increase in recharge results primarily from
changes in land use, which have reduced evapotranspiration. Results simulation of groundwater flow model
show that the water table in the regolith can be adequately represented when recharge is applied at a rate of 200
mm per year. Stable isotope measurements of Entebbe precipitation, supported in part by the limited data set
generated in the study area, reveal that heavy monsoonal rainfall in the Victoria Nile basin not only is more
depleted in heavy isotopes than lighter rains in a manner commonly known as the ‘amount effect’ but also
Proceedings of the International Conference on Climate Change, Vol. 1, 2017, pp. 57-78
65
displays an isotopic composition which, falling parallel to the global meteoric waterline, is unaffected by
evaporation.
Chlorine Mass Balance method
Jozsef Szilagyi et. al. (2011) found that the mean annual recharge rate estimates based on this method were
consistent with independent estimates based on base flow/ stream flow, groundwater modelling and chloride
mass balance given their uncertainty ranges. The semi-arid climate of a large portion of Nebraska Sand Hills
region necessarily increases the error range for water balance recharge estimation. Tianming Huang and
Zhonghe Pang (2010) found the results that the regional afforestation and other land-use conversions have
resulted in deep soil desiccation and have caused an upper boundary to form with low matrix potential, thus
preventing the soil moisture from actually recharging the aquifer. F. Manna et. al (2016) observed that the
annual total volume of runoff discharged at the outfalls varies. The aerial distribution of chlorine demonstrates
the absence of a visible trend, with a uniform distribution of values across the site and observation wells shows
no evident trend, indicating no source of chloride other than atmospheric. Felix Oteng Mensah et. al. (2014)
noted the results that the observed pattern is consistent with conditions of lower relative humidity than 100 %
and high ambient temperatures as is common in the study area. The ratio of the rarer isotope to the more
abundant isotope provides an indication of the relative enrichment of the two isotopes in the medium or the
original source of recharge. Jacob Nyende et. al. (2013) found the result showing that oxygen-18 and deuterium
compositions mostly plot below the Local Meteoric Water Line (LMWL) indicating that the surface water and
groundwater in the aquifer was exposed to evaporation before or in the recharging process and groundwater
levels response to rainfall events by the EARTH method is the quantitative estimation of groundwater recharge
for Pallisa District watershed,
Radiation-based method
The results indicate that each method estimates the potential evapotranspiration under specific weather
conditions. The results show that the Stephens method estimates the potential evapotranspiration better than
other methods for provinces of Iran.
(c) Results based on numerical modelling and empirical methods
GROWA model
H. Bogena et. al. (2005) found the results of the groundwater recharge calculation for the macro scale study area
and the corresponding uncertainties as a result of the uncertainties of all data sets used. In the consolidated rock
region, the low hydraulic conductivity of the solid rocks leads to groundwater recharge rates that are often less
than 100 mm/a. Only the karstified carbonate rocks show significantly higher hydraulic conductivities and the
groundwater recharge rate increases to more than 300 mm/a. In the unconsolidated rock region, groundwater
recharge levels between 200 and 300 mm/a are most common. This distinct dichotomy in the distribution of
groundwater recharge rates is also apparent for the corresponding uncertainties.
Frequency Domain Analysis
The computed transfer functions are plotted for the wells located around the pumping site, showing the general
pattern, i.e. a flat section at low frequency, a decreasing section at intermediate frequency, and finally, different
behaviours at high frequency are observed in all cases, which confirm that the fractured aquifer acts as a low-
pass filter. No remarkable changes are detected for the characteristic response time, or in the asymptotic
behaviour at low frequency.
Shivaji Patil, Jagottam Agrawal / Uncertainties and challenges in distribution of…..
66
Numerical Modelling method
(i) Precipitation model
Precipitation-based probabilistic estimation of soil moisture using the proposed hydrometeorological approach
is tested with in situ observed soil moisture data and with soil moisture data of the Climate Change Initiative
project. The results are found to be promising and able to provide the information on uncertainty associated with
the estimation. Result also shows that the parameter of the developed model is linked to the predominant soil
textural class.
(ii) Leaf Area Index
The WTF method agreed well with the simulated values, with overlapping estimates between the methods for all
but two recharge events. Also the median value of simulations was close to the WTF method, with some bias to
higher estimates from the simulations. Both annual recharge and infiltration displayed an increasing trend.
MODFLOW model
Nam Won Kin et. al. (2008) observed that the results, which were compared and simulated hydrograph by
SWAT was compared with that by SWAT-MODFLOW, shows that the SAWT was notable to correctly
reproduce the stream flow dynamics in low flow, even after a comprehensive calibration. The differences in the
low flows were due to insufficient baseflow resulting from the limitation of the groundwater module in SWAT.
H. Hashemi et. al. (2014) found the results that, in arid regions, the change in precipitation, surface runoff, and
GW recharge are expected to be the most substantial consequence of climate change. In the future scenarios,
there will be no significant change for all climate variables during the spring and summer season relative to the
historical climate. During the cold and wet seasons, both temperature and potential evaporation is slightly
increased in all projected scenarios. In general, the average reduction in precipitation in the near and far future is
about 2 and less than 1 % respectively.
WAVES model with improvements
The trend show expected relationships between recharge and rainfall (positive correlation), soil texture (higher
rates under coarser-textured soils), and vegetation (lower recharge rates under perennial vegetation). The
historical climate baseline raster produces spatial trends that are consistent with previously published recharge
estimates for the High Plains.
Empirical Formulae
The result revealed that the three empirical formulae gave comparable results. Low rainfall causes low
groundwater recharge infiltrating into the aquifer, this is due to increase in temperature and evapotranspiration
and vice versa. Low recharge causes high runoff over the surface. It is evident that the recharge in no-stationary
and likewise, the annual rainfall, but are stationary after the second differencing, hence there exists a long
relationship between the climate parameters.
Analysis/ Discussion on previous individual studies
(a) Methods with physical parameters
The WetSpass model was used in various regions such as Gaza strip, which is a characteristically semi-arid and
desert climate, in Jafr basin, which is arid desert and in Belgium and the Netherlands, where area is dominated
by agriculture, forests, built up areas and meadows. GIS-based WetSpass methodology is a tool which can
simulate the spatial distribution of long-term average groundwater recharge.

Proceedings of the International Conference on Climate Change, Vol. 1, 2017, pp. 57-78
67
Soil Water Balance Analysis
The Soil water balance model does not include a mechanism to account for additional sources of groundwater
recharge, such as fog drip, irrigation, and artificial recharge, and may also overestimate evapotranspiration
losses. As such this study represents a conservative estimate of total recharge.
GRACE Model
Results indicate that GRACE data play a modest but significant role in the performance of Artificial Neutral
Network ensembles, especially when the cyclic pattern of groundwater hydrograph is disrupted by extreme
climate events.
ILHM
ILHM is well suited for forecasting purposes because it allows forcing data and component process models to be
interchangeable.
Hydrologic model
Groundwater recharge is influenced not only by hydrologic processes, but also by the physical characteristics of
the land surface and soil surface. While knowing the average change in recharge and groundwater levels over
time is important, these changes will not occur equally over a regional catchment or watershed. Studies
concerned with climate change should therefore also consider the spatial change in groundwater recharge rates.
RIB model
The RIB model is capable of recharge estimation, if specific yield is known and certain assumptions are met.
RIB model can be used only under certain conditions in shallow unconfined aquifers with relatively low
transmissivity.
Aquifer systems
Together these results show that the wet areas will get wetter and the dry areas will get drier. Recharge is a
threshold process, as dry places get drier, recharge will decrease more sharply than precipitation declines. The
results of available studies indicate that this overdraft will become more severe as recharge declines and
pressure to increase groundwater pumping grows. In contrast, there is a potential for increased recharge across
the northern set of aquifers, though confidence in the expected changes is low
SWAT model
SWAT model has allowed the estimation of the water balance of Crete resulting in significantly different
estimates. In the wettest year the main component of hydrological process was the deep aquifer recharge, while
in the driest year the evapotranspiration had the main role. As a consequence, during the wet conditions there
was high infiltration, but also the surface runoff was larger than that during driest and normal hydrological
condition.
WTF, DHB & HB method
Hydrological Budget (HB) is a lumped method and wouldn’t report any further information about distribution of
groundwater recharge rate in region. Groundwater recharge resulting from both rainfall deep percolation and
irrigation return flow for each sub-zone can be estimated using DHB method. WTF method gives distinct results
for contribution of rainfall and irrigation return flow towards groundwater recharge. There is a good agreement
Shivaji Patil, Jagottam Agrawal / Uncertainties and challenges in distribution of…..
68
between groundwater echarge estimated using the DHB and WTF model. The difference between these results
and those of the HB method arises from (1) considering net groundwater inflow as an average groundwater
recharge in this method and (2) assuming constant groundwater level to calculate groundwater flow from one
cell to adjacent cell during a month time period which is not well matched with aquifer condition in reality,
GIS-based NDVI model
It can be seen that overall there is a linear trend between groundwater recharge and rainfall. The value of
groundwater recharge depends strongly upon the density of vegetation before the monsoon. Increase or decrease
in groundwater recharge would be due to the reason that vegetation density increased to such a level that the
interception and absorption of water out weights the factors responsible for further increase in recharge.
(b) Chemical and isotopic methods
Tracers Isotope / Carbon-14 and Chlorine Mass Balance composite method
Glenn A. Harrington et. al. (2002) discussed that the stable isotopic compositions and, to a lesser degree, the
raw chloride concentrations of soil and groundwater samples provide compelling evidence that the groundwater
in the Ti-Tree Basin is recharged only after the most intense rainfall events of at least 150 to 200 mm/month.
Carbon-14 data was combined with physical parameters including sample depth, aquifer depth, and distance
from the groundwater flow divide to obtain estimates of the average recharge rate between where a groundwater
sample first entered the saturated zone and the borehole. This approach, however, is limited by both the ability
to construct accurate groundwater flow lines and having a sample (bore) density that reflects the scale of the
different recharge areas. Richard Taylor et. al. (1996) shown that owing to the conservative behaviour of stable
isotopes in low-temperature groundwater systems, groundwater will retain the isotopic signature of recharging
precipitation provided that (1) the isotopic content of the incident rainfall is not affected by soil zone processes
immediately before infiltration, and (2) the source of recharge is restricted to the direct infiltration of rainfall.
Chlorine Mass Balance method
Jozsef Szilagyi et. al. (2011) discussed that the associated error bounds in the recharge estimates may be
significant in arid and semi-arid regions where a large portion of the precipitation was evaporated/ transpirated.
Such uncertainty was considered acceptable for many problems in view of the current state of uncertainty
associated with other recharge estimation techniques. Tianming Huang and Zhonghe Pang (2010) in their study
shows that the decrease in groundwater recharge when the vegetation is converted to a type with higher water
demands. In the study by F. Manna et. al. (2016) the main uncertainty in the application of the method is related
to the assumption that atmospheric chloride must be the only source of chloride in the sub-surface system.
Uncertainties can be derived by the slope effect, i.e. the mixing of water due to up-slope recharge. This process
is believed to minimally affect the results of the analysis because of the topographic and hydrogeological
characteristics of the study area. Felix Oteng Mensah et. al. (2014) mentioned that the ratio of the rarer isotope
to the more abundant isotope provides an indication of the relative enrichment of the two isotopes in the
medium or the original source of recharge. The sources and origin of groundwater recharge in the Voltaian was
assessed using stable isotope data of precipitation, groundwater, and surface water from parts of Voltaian. Jacob
Nyende et. al. (2013) mentioned that the clustering of groundwater samples observed suggests that both
evaporation and isotopic exchange with the aquifer minerals may be occurring into the system. The effect of
evaporation is greatest for light precipitation.
Radiation-based method
Evapotranspiration has a significant role in irrigation scheduling and water resources management. The highest
precision of evapotranspiration could be obtained using lynsimeter or imaging techniques, but their costs are too

Proceedings of the International Conference on Climate Change, Vol. 1, 2017, pp. 57-78
69
high. The radiation-based method is one of the most widely used methods to estimate potential
evapotranspiration. Finally, a list of the best performances of each method is presented to use in other region
studies according to mean, maximum, and minimum temperature, relative humidity, solar radiation, elevation,
sunshine, and wind speed. The precision of estimation by radiation-based methods was very sensitive to
variations of the parameters used in each method. Thus, the coefficients of the radiation-based methods need to
be adjusted based on weather conditions of each province.
(c) Numerical modelling and empirical methods
GROWA model
Most parts of the consolidated rock region show uncertainties well below 20%, except for the karstified
carbonate rocks with significantly higher values (more than 30%). The unconsolidated rock region, on the other
hand, shows uncertainties between 15 and 40%. In order to facilitate an analysis of the differently scaled data
ensembles on the calculated groundwater recharge, averaged values of the uncertainties in percent of the mean
groundwater recharge are calculated. The differences between the scales cannot be generalised since the
identified uncertainties are determined by the individual characteristics of the catchment area and the available
database.
Frequency Domain Analysis
The estimation of recharge at the bottom of the soil horizon is uncertain. The observed non-classical log-log
slopes for some observation wells are not influenced by uncertainties in the computation of input recharge, and
thus correspond to an intrinsic property of the aquifer.
Numerical Modelling method
(i) Precipitation model
Soil moisture has a significant impact on the temperature-evaporation-precipitation feedback loop and plays a
significant role in numerical weather prediction using climate variables at a regional scale. It also controls the
terrestrial water balance through partitioning precipitation among infiltration, runoff, and evapotranspiration.
The capillary action that determines the evaporative demand and withdrawal of the water through plant roots is
driven by soil moisture content.
(ii) Leaf Area Index
The method used here to estimate LAI from forestry inventories introduces a new approach for incorporating
large spatial coverage of detailed conifer canopy data into groundwater recharge estimations.
MODFLOW model
SWAT is not able to represent the spatial distribution of the groundwater table because the model is an HRU-
based quasi-distributed model rather than a grid-based fully distributed model. Since SWAT-MODFLOW uses
MODFLOW as the groundwater model, it is capable of calculating the spatially distributed groundwater table
and also capable of simulating the spatio-temporal variation of groundwater recharge rates. H. Hashemi et. al.
(2014) observed that the results of projected climate variables (precipitation, temperature, and
evapotranspiration) show no significant increase or decrease in rainfall quantity relative to the historical climate
but a slight increase in surface runoff.
Shivaji Patil, Jagottam Agrawal / Uncertainties and challenges in distribution of…..
70
WAVES model with improvements
The trend for future recharge projections differs from the trend of the future rainfall projections. There is a
general trend across all three sites for the slope of the mean annual rainfall versus mean annual recharge to
decrease with increasing recharge. Model results show a trend with projected increases in recharge for the low
global warming scenario and then a reduction in recharge with further increases in global warming that is not
related to changes in rainfall.
Empirical Formulae
There is no significance at any level among the other parameters with regression analysis, which was conducted
to evaluate the effect of climate parameters on estimated recharge. All parameters showed minimal relationships
to estimated recharge, except precipitation, which showed a dominant role of rainfall percolation of water into
the ground in the study area.
Summary/ Conclusions from previous individual studies
(a) Methods with physical parameters
WetSpass Model
Adnan M. Aish (2010) concluded that the comparison of results of WetSpass model and previous studies shows
good agreement and indicates the validity of the simulated recharge, changes in land use impact the recharge
and the presented recharge map can serve not only as a basis for future land use conditions, but also as a basis
for comparisons with past land use conditions, and the model is especially suitable for studying effects of land-
use changes on the water regime in a basin. Mustafa Al Kuisi (2013) concluded that the aquifers receive
recharge from the western highlands by direct and indirect infiltration of rainfall. This model is specially suited
for studying long-term effects of land use changes on the water regime in a watershed. Z. Zomlot (2015)
concluded that the groundwater is strongly influenced by soil texture and land use; the spatial correlation,
however, is relatively low
Soil Water Balance Analysis
Soil water balance Model can produce reliable estimates of spatially-varying recharge in temperature-humid
climates.
GRACE Model
GRACE satellite data only takes ∆TWS but not changes of individual hydrologic components such as surface
water, soil moisture and groundwater.
ILHM
ILHM is well-suited for forecasting purposes because it allows forcing data and component process models to
be interchangeable; thus a model developed and calibrated with current data can be rapidly converted to a
forecast simulation by adding the appropriate component process code.
Hydrologic model
Groundwater resources are related to climate change indirectly through the process of recharge, and directly
through the interaction with surface water bodies such as rivers and lakes. The process of groundwater recharge
is not only influenced by the spatial and temporal variability in the major climate variables, but also dependent
Proceedings of the International Conference on Climate Change, Vol. 1, 2017, pp. 57-78
71
on the spatial distribution of land-surface properties and the depth and hydraulic properties of the underlying
soils.
RIB model
The sensitivity analysis showed that the recharge rate by the RIB model is specifically sensitive to the parameter
of specific yield; therefore the accurate representative specific yield of the aquifer needs to be selected with
caution. The RIB model is a simple and efficient method to estimate groundwater recharge and fill water level
data gaps in shallow unconfined aquifers where groundwater levels respond distinctly to rainfall.
Aquifer systems
Anticipated changes in recharge mechanisms display definite regional patterns in magnitude and confidence.
MSR is expected to decrease with high certainty in the southern and western portions of the region and with
lower certainty in the northern and eastern portions. Patterns of expected recharge change ( in total recharge and
recharge mechanism) inherit all of the uncertainties of the underlying GCMs and downscaled average
climatologies. Uncertainties regarding the impacts of future climate change on MSR, focused recharge, and
irrigation recharge present the greatest opportunities for improvement through process level studies.
SWAT model
The seasonal variation of volume of springs suggests that these valuable sources should be conserved and
preserved in particular from April to September when available volumes are the lowest and agriculture and
tourism demand increases. The analysis of the water balance also showed that water resources are not
homogeneously distributed in Crete and change significantly in different hydrological conditions.
WTF, DHB & HB method
In the HB method specific yield is the only estimated parameter. Although it plays a critical role in the water
budget, this parameter has a limited domain of variation. Accuracy and reliability of groundwater recharge
estimated with these methods depends on those of the input datasets and their assumptions. The DHB and WTF
models provided spatial and temporal distribution of natural groundwater recharge. The WTF model clearly
exhibited groundwater recharge components.
GIS-based NDVI model
This delivers a new methodology for understanding affect of rainfall and vegetation density on groundwater
recharge based on spatial distribution of these parameters in a given geographical area. The study establishes a
very strong polynomial correlation of second degree between groundwater recharge and NDVI indicating
increase in recharge with increase in NDVI values upto a certain level.
(b) Chemical and isotopic methods
Tracers Carbon-14 and Chlorine Mass Balance composite method
Glenn A. Harrington et. al. (2002) concluded that the application of the carbon-14 and chloride approaches to
the arid Ti-Tree Basin in central Australia has revealed the magnitude and spatial extent of recharge from
ephemeral rivers. The equations used to estimate recharge rates from carbon-14 data and the length scale over
which they apply also rely on knowledge of the aquifer characteristics (e.g. porosity) and geometry. Richard
Taylor et. al. (1996) concluded that the combined techniques reveal that recharge is restricted to the heavier
rainstorms of the monsoons. The magnitude of the recharge estimate demonstrates a stronger dependence on the
number of heavy rain events than on the total volume of rainfall.

Shivaji Patil, Jagottam Agrawal / Uncertainties and challenges in distribution of…..
72
Chlorine Mass Balance method
Jozsef Szilagyi et. al. (2011) concluded that the application of a water balance recharge estimation technique
based on MODIS and ancillary climate data demonstrates that the mean annual recharge rate based on this
method are consistent with independent estimates based on baseflow, groundwater modelling and chloride mass
balance given their uncertainty ranges. The MODIS-based method may be applicable for estimating spatially
distributed mean annual recharge rates in sandy areas of the world, where basic climate data (precipitation, air
temperature and humidity, global radiation or sunshine duration) are available. Tianming Huang and Zhonghe
Pang (2010) concluded that reduced groundwater recharge caused by land-use change can be estimated by
comparing the chloride concentration in the soil water from the base of the root zone to the base of the chloride
concentrated zone, for pre-converted and converted land uses, based on the chloride mass balance and using the
unconverted land use as the background for comparison. Regional afforestation and other land-use conversions
to vegetation with higher water demand may have caused soil-water depletion and solute concentration, and
are, therefore, not favourable to groundwater recharge and ecosystem restoration. F. Manna et. al (2016)
concluded that the application of this approach was exceptionally well-suited for this study area because of the
extraordinarily large number of groundwater samples collected from a dense network of monitoring wells
collected over three decades combined with a robust surface water drainage monitoring program. The analysis
of tritium concentration in the groundwater indicates that recharge occurred at the shallowest monitoring wells
assuming a plug downward flow rate of 0.2 m per year. It is also found that infiltration water slowly moves the
aqueous phase of the contaminant mass stored in the unsaturated zone toward the water table is important for
remediation plans. Felix Oteng Mensah et. al. (2014) concluded that the CMB approach performs well in a
tropical setting in providing fairly accurate estimates of groundwater recharge for groundwater resources
evaluation. Jacob Nyende et. al. (2013) concluded that replenishment of groundwater in the study area is entirely
through precipitation, shallow underground waters have undergone evaporation and the evaporation line above
the GMWL. Also the EARTH model analysis indicates that groundwater fluctuations are affected by the natural
climate variations and anthropogenic influences.
Radiation-based method
The precision of estimation by radiation-based methods is very sensitive to variations of the parameters used in
each method. Thus, the coefficients of the radiation-based methods need to be adjusted based on weather
conditions of each province. Only if the radiation-based methods are used for suitable and specific weather
conditions, the highest precision of recharge estimation is obtained.
(c) Numerical modelling and empirical methods
GROWA model
The Gaussian error propagation method is a usefully technique for analysing the influence of input data on the
simulated groundwater recharge. The present uncertainty analysis showed that the BFI and precipitation
uncertainties had the greatest impact on the total groundwater recharge error. This result is achieved by using a
specific model and is therefore not simply transferable to other hydrological models. Furthermore, it has to be
noted that this analysis has the character of a worst case study, since the climate parameter used in this study
shows a significant correlation.
Frequency Domain Analysis
The contribution of different hydrogeological structures to the hydraulic response to recharge is indicated by the
dependency of the transfer function amplitude on frequency. The variability of transmissivity and storage
coefficient tends to decrease with scale, and the average estimates converge toward the highest values at large
scale. The small-scale variability of diffusivities, which implies the existence of a range of characteristic

Proceedings of the International Conference on Climate Change, Vol. 1, 2017, pp. 57-78
73
temporal scales associated with different pathways, is suggested to be at the origin of the unconventional
temporal scaling of the hydraulic response to recharge at high frequency.
Numerical Modelling method
(i) Precipitation model
The strength of association is higher between soil moisture and precipitation compared to that between soil
moisture and temperature. The model parameter is higher for those locations having higher clay content,
whereas the parameter is lower for those locations having a coarse texture. This suggests that the signature of
soil texture is manifested in the model parameter as reflected in soil moisture simulation curves obtained using
the study approach. The result indicates the importance of soil texture information and the spatial transferability
of the proposed Hydrometeorological approach.
(ii) Leaf Area Index
A physically based approach to simulate groundwater recharge for sandy unconfined aquifers in clod climates
was developed. The method accounts for the influence of vegetation, unsaturated zone thickness, presence of
lakes, and uncertainty in simulation parameters in the recharge estimate. It is capable of producing spatially and
temporally distributed groundwater recharge values with uncertainty margins, which are generally lacking in
recharge estimates, despite understanding of uncertainty related to recharge estimates being potentially crucial
for groundwater resource management. However, the parameter uncertainty defined for the study area was of
minor significance compared with inter-annual variations in the recharge rates introduced by climate variations.
MODFLOW model
The application demonstrates that an integrated SWAT-MODFLOW is capable of simulating the spatio-
temporal distribution of groundwater recharge rates, aquifer evapotranspiration and groundwater levels and that
it enables the interaction between the saturated aquifer and channel reaches, which plays an important role in the
generation of groundwater discharge in the basin, especially during the low flow period. The comprehensive
results demonstrate that the model is able to represent the integrated watershed modelling results that contain
surface hydrologic components such as distributed recharge rates, groundwater levels and discharge, with or
without well pumping. H. Hashemi et. al. (2014) concluded, it appears that the GW abstraction has the most
substantial effect on GWL drawdown that needs to be taken into account in the water resources management
plan. The methods used in this study are suitable for assessing the climate change impacts on GW for local-scale
aquifer systems. GWL projection by MODFLOW, particularly in a sophisticated aquifer system, shows the great
potential of recharge modelling to address the sustainable GW management through adaptation scenarios.
WAVES model with improvements
Russell S. Crosbie (2013) concluded that vegetation is not necessarily a strong determinant of the sensitivity of
recharge to climate change as sensitivity differs based on the amount of historical baseline recharge and not
necessarily vegetation type. Sensitivity of recharge to changes in rainfall is least for high baseline recharge and
greatest for low baseline recharge. Sensitivity is greater than one, meaning that there is amplification with
greater changes in recharge than changes in rainfall.
Empirical Formulae
The study shows that there is variability in climate parameters. The study also shows that the climate has a
significant effect on groundwater resources, which is revealed from the rainfall variable; however,
evapotranspiration and solar radiation have a relationship with each other.

Shivaji Patil, Jagottam Agrawal / Uncertainties and challenges in distribution of…..
74
Overall Discussion and Conclusions
The study reveals that the reasons causing the variability in groundwater recharge are ranging from uncertainties
in recharge influencing factors to change in climatic conditions. The study also shows that the uncertainties in
distribution of groundwater recharge occur differently in different regions, due to the impact of various factors
such as change in climatic conditions, change in land use, soil types, etc.
Broadly, according to the present study the uncertainties and challenges could be shortly enumerated, as per
grouping of their types, as below:
Methods with physical parameters
Using the distributed recharge from WetSpass in a steady-state groundwater model will improve the prediction
of the simulated groundwater level and recharge and this will lead to a stable solution for the groundwater level
and recharge areas. Sometimes, for simplicity an assumption needed to be considered such as changes in tree
and plant phenology (i.e. lower or higher leaf or plant area index) under drought or climate change conditions
translate into minimal changes in interception storage capacities. Since outputs from the model are grid maps
and not the tabular values, it would be helpful to combine two or more grid maps. WetSpass is especially suited
for studying long-term effects of land use changes on the water regime in a watershed. In the case of GRACE
satellite, it only tracks changes in terrestrial water storage but not changes of individual hydrologic components
e.g. surface water, soil moisture, and groundwater and hence practical application of GRACE data for local
water resources management, especially nowcasting and forecasting is limited. Combination of process-based
APLIS modelling and GIS data analysis, makes us able to provide spatio-temporal information of groundwater
recharge and sub-surface flow dynamics also during varying hydroclimatic conditions for karst aquifers.
Forecasting those changes at regional scales requires new modelling tools, such as ILHM, which take advantage
of increases in computational power and the latest GIS and remote sensing datasets. Together, the two datasets
i.e. the soil moisture data and water table data, allow for a holistic assessment of the groundwater recharge
process from the ground surface through the unsaturated zone down to the water table. Quantifying the impact
of climate change on groundwater resources requires a physically based approach, such as hydrologic model, for
estimating groundwater recharge that includes all of the important processes in the hydrologic cycle, such as
infiltration, surface runoff, evapotranspiration, and snowmelt. Analysis of aquifer systems in a region can be
done by splitting the aquifers sub-region wise and model-based study of projected climate-change effects on
recharge can be done. RIB model is suitable for shallow unconfined aquifer systems, under certain conditions
such as sufficient data about long time series of groundwater level and rainfall available in similar regions.
Chemical and isotopic methods
Groundwater recharge is possibly the most important, but generally the most difficult, component of a water
resource evaluation. Determining recharge rates in arid regions, where net water fluxes are extremely low, is
particularly difficult because many of the techniques used to estimate recharge in wetter environments (e.g.
water balance, applied tracers) can yield large uncertainties when applied to arid regions. Therefore, to
determine recharge rates in arid and semi-arid regions, tracer approach proves to be extremely valuable.
MODIS-based method, with ancillary data, may be applicable for estimating spatially distributed mean annual
recharge rates in sandy areas of the world where basic climate data from the year 2000 and on are available. The
uncertainty level of the resulting recharge-rate estimates can be easily defined from known or estimated levels
of inaccuracy in the precipitation and evapotranspiration variables. Radiation method is best suited method to
estimate potential evapotranspiration. Natural tracer method, which is based on baseflow recession, is applicable
mostly in the large basins. EARTH model helps to determine the groundwater levels response to rainfall of the
fractured aquifer.

Proceedings of the International Conference on Climate Change, Vol. 1, 2017, pp. 57-78
75
Numerical modelling and empirical methods
The precipitation uncertainties have the greatest impact on the total groundwater recharge error and GROWA
model, in which the Gaussian error propagation method is used, is best suited for analysing the influence of
input data on the simulated groundwater recharge. For quantification of the recharge in fractured aquifers,
frequency domain approach proved to be useful, considering its ability to handle the multi-scale heterogeneity
and the range of temporal scales involved. SWAT-MODFLOW is a combination of two numerical models,
which is capable of simulating a spatio-temporal distribution of groundwater recharge rates, aquifer
evapotranspiration and groundwater levels and it enables an interaction between the saturated aquifer and
channel reaches. MODFLOW method is suitable for assessing the climate change impacts on groundwater for
local-scale aquifer systems. Computational methods to estimate groundwater recharge vary from simple water
balance models, where water stores and fluxes are represented conceptually and related with adjustable
parameters, to physically based models using Richards’ equation to solve water fluxes through an unsaturated
zone. A physically based method, such as LAI method, is useful for estimation of recharge for sandy unconfined
aquifers. WAVES model uses three datasets i.e. climate, soils and vegetation and is applicable where sensitivity
analysis is of importance.
Conclusions
In conclusion, it should be noted that realistic estimation of recharge depends mainly on identifying prominent
features influencing recharge for a certain region and probable flow mechanism for targeted aquifer. Multiple
dependent models / approaches needs to be applied and output could be compared with actual field conditions.
The interaction of soil, with climate in the region, slope in the terrain, geology, geomorphology of the area, land
use land cover, rainfall, drainage pattern and various other methods used for recharge determines the recharge
quantity. The carbon-14 and chloride approaches have advantages over “conventional” numerical modelling
approaches, because the degree of spatial parameterization required for the latter can generally not be matched
by available data or understanding. Combination of three methods viz. Water table fluctuation (WTF),
distributed hydrological budget (DHB) and hydrological budget (HB) proved to be a good example to know
how to overcome the gaps in datasets and also the processing the datasets due to their limitations or gaps
therein. Thus such combination of methods proved to be more reliable for estimation of groundwater recharge
and also the impacts of the climate change on recharge. When these methods are coupled with remote sensing
and GIS method, these combined methods are very useful and suitable as these are easy to use, cost effective,
simple, requiring a few non-deterministic data such as groundwater level measurements, rainfall, aquifer
properties, and groundwater extraction datasets.
It is also seen that whenever two or more methods or models are combined for bringing down the gaps in either
datasets or the processing the datasets, helps to understand the uncertainties and encompass the maximum
possible process components under one roof so as to take the challenge in estimating groundwater recharge rate
under climate change scenario. Due to such combination of different methods or models relationship between
different available hydrogeological and climate components can be assessed with great accuracy and can obtain
better understanding of effects of climate change on groundwater recharge and also behaviour of groundwater
recharge.
Combination of process-based modelling and GIS analysis allows circumventing the problem of data scarcity
that most distributed models face and also can assess the impact of hydroclimatic extremes on groundwater
recharge.
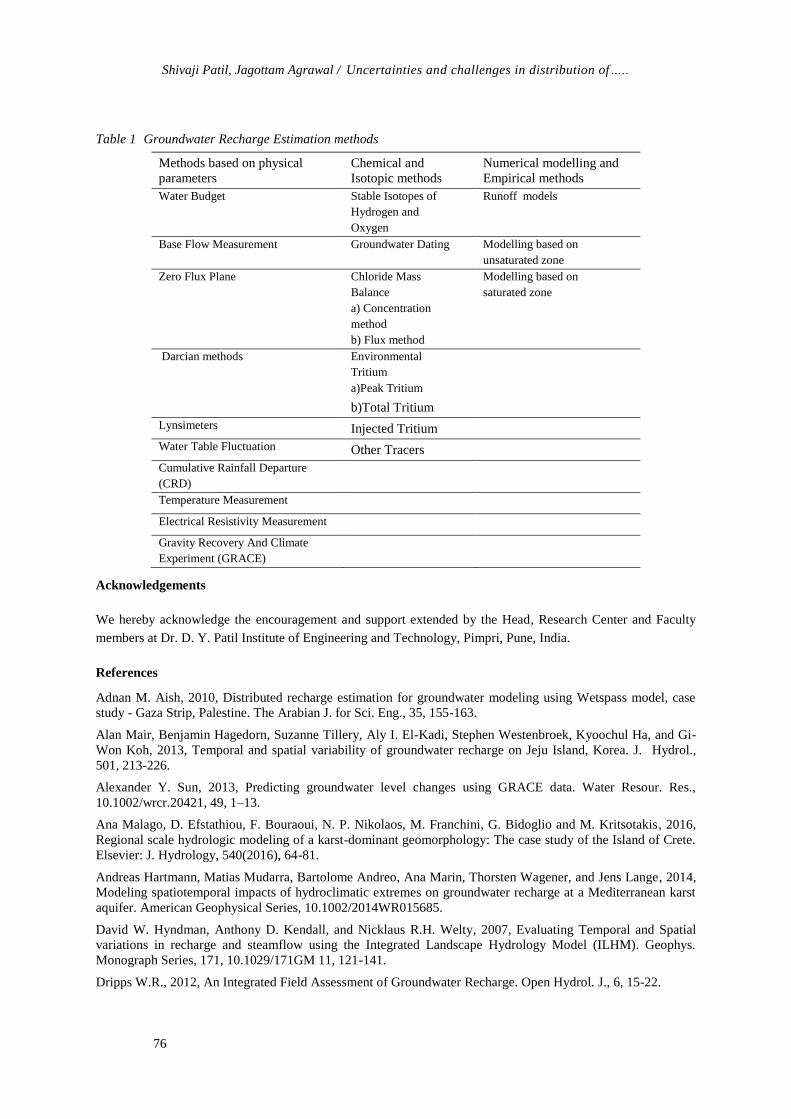
Shivaji Patil, Jagottam Agrawal / Uncertainties and challenges in distribution of…..
76
Table 1 Groundwater Recharge Estimation methods
Methods based on physical
parameters
Chemical and
Isotopic methods
Numerical modelling and
Empirical methods
Water Budget Stable Isotopes of
Hydrogen and
Oxygen
Runoff models
Base Flow Measurement Groundwater Dating Modelling based on
unsaturated zone
Zero Flux Plane Chloride Mass
Balance
a) Concentration
method
b) Flux method
Modelling based on
saturated zone
Darcian methods Environmental
Tritium
a)Peak Tritium
b)Total Tritium
Lynsimeters Injected Tritium
Water Table Fluctuation Other Tracers
Cumulative Rainfall Departure
(CRD)
Temperature Measurement
Electrical Resistivity Measurement
Gravity Recovery And Climate
Experiment (GRACE)
Acknowledgements
We hereby acknowledge the encouragement and support extended by the Head, Research Center and Faculty
members at Dr. D. Y. Patil Institute of Engineering and Technology, Pimpri, Pune, India.
References
Adnan M. Aish, 2010, Distributed recharge estimation for groundwater modeling using Wetspass model, case
study - Gaza Strip, Palestine. The Arabian J. for Sci. Eng., 35, 155-163.
Alan Mair, Benjamin Hagedorn, Suzanne Tillery, Aly I. El-Kadi, Stephen Westenbroek, Kyoochul Ha, and Gi-
Won Koh, 2013, Temporal and spatial variability of groundwater recharge on Jeju Island, Korea. J. Hydrol.,
501, 213-226.
Alexander Y. Sun, 2013, Predicting groundwater level changes using GRACE data. Water Resour. Res.,
10.1002/wrcr.20421, 49, 1–13.
Ana Malago, D. Efstathiou, F. Bouraoui, N. P. Nikolaos, M. Franchini, G. Bidoglio and M. Kritsotakis, 2016,
Regional scale hydrologic modeling of a karst-dominant geomorphology: The case study of the Island of Crete.
Elsevier: J. Hydrology, 540(2016), 64-81.
Andreas Hartmann, Matias Mudarra, Bartolome Andreo, Ana Marin, Thorsten Wagener, and Jens Lange, 2014,
Modeling spatiotemporal impacts of hydroclimatic extremes on groundwater recharge at a Mediterranean karst
aquifer. American Geophysical Series, 10.1002/2014WR015685.
David W. Hyndman, Anthony D. Kendall, and Nicklaus R.H. Welty, 2007, Evaluating Temporal and Spatial
variations in recharge and steamflow using the Integrated Landscape Hydrology Model (ILHM). Geophys.
Monograph Series, 171, 10.1029/171GM 11, 121-141.
Dripps W.R., 2012, An Integrated Field Assessment of Groundwater Recharge. Open Hydrol. J., 6, 15-22.

Proceedings of the International Conference on Climate Change, Vol. 1, 2017, pp. 57-78
77
Felix Oteng Mensah, Clement Alo and Sandow Mark Yidana, 2014, Evaluation of groundwater recharge
estimates in a partially metamorphosed sedimentary basin in a tropical environment: Application of natural
tracer. The Scientific World Journal, Vol. 2014, 419508, 1-8.
F. Manna, J. A. Cherry, D. B. McWhorter and B.L. Parker, 2016, Groundwater recharge assessment in an
upland sandstone aquifer of southern California. Elsevier: J. Hydrology, 541(2016), 787-799.
Glenn A. Harrington, Peter G. Cook, and Andrew L. Herczeg, 2002, Spatial and temporal variability of
groundwater recharge in Central Australia: A Tracer Approach. Ground Water J., 40, 518-528.
H. Bogena, R. Kunkel, C. Montzka, and F. Wendland, 2005, Uncertainties in the simulation of groundwater
recharge at different scales. Advances in Geosci., 5, 25–30.
H. Hashemi, C.B. Uvo and R. Berndtsson, 2014, An extended modelling approach to assess climate change
impacts on groundwater recharge and adaptation in arid areas. Open Access Hydrology and Earth System
Sciences Discussions, 11, 11797-11835, 2014.
Jacob Nyende, van Tonder G and Danie Vermeulen, 2013, Application of isotopes and recharge analysis in
investigating surface water and groundwater in fractured aquifer under influence of climate variability. J. Earth
Science & Climatic Change, Vol. 4, Issue 4, 1-14.
Jozsef Szilagyi, Vitaly A. Zlotnik, John B. Gates, and Janos Jozsa, 2011, Mapping mean annual groundwater
recharge in the Nebraska Sand Hills, USA. Springer: Hydrogeology J. 10.1007/s10040-011-0769-3.
Joaquin Jimenez-Martinez, Laurent Longuevergne, Tanguy Le Borgne, Philippe Davy, Anna Russian, and
Olivier Bour, 2013, Temporal and spatial scaling of hydraulic response to recharge in fractured aquifers:
Insights from a frequency domain analysis. Water Resour. Res., 49, 1–17.
Mikko I. Jyrkama and Jon F. Sykes, 2007, The impact of climate change on spatially varying groundwater
recharge in the grand river watershed (Ontario). J. Hydrol., 338, 237– 250.
Mohammad Valipour, 2015, Comparative Evaluation of Radiation-Based Methods for Estimation of Potential
Evapotranspiration. ASCE J. Hydrol. Eng., 04014056, 1-14.
Mustafa Al Kuisi and Ali El-Naqa, 2011, GIS based Spatial Groundwater Recharge estimation in the Jafr basin,
Jordan – Application of WetSpass models for arid regions. Revista Mexicana de Ciencias Geológicas, 30, 96-
109.
Nam Won Kim, Il Moon Chung, Yoo Seung Won, and Jeffrey G. Arnold. (2008). Development and application
of the integrated SWAT-MODFLOW model. J. Hydrol., 10.1016 / 356, 1-16.
O. Batelaan, and F. De Smedt, 2007, GIS-based recharge estimation by coupling surface-subsurface water
balances. J. Hydrol., 337, 337– 355.
Oluseyi O. Adeleke, V. Makinde, A.O. Erula, O. F. Dada, A.O. Ojo and T. J. Aluko, 2015, Estimation of
groundwater recharges in Odeda Local Government area, Ogun State, Nigeria using Empirical Formulae.
Challenges 2015, 6, 271-281.
P. Ala-aho, P. M. Rossi, and B. Klove, 2015, Estimation of temporal and spatial variations in groundwater
recharge in unconfined sand aquifers using Scots pine inventories. Hydrol. Earth Syst. Sci., 19, 1961-1976.
Richard G. Taylor, and Ken W.F. Howard, 1996, Groundwater recharge in the Victoria Nile basin of east
Africa: support for the soil moisture balance approach using stable isotope tracers and flow modelling.” J.
Hydrol., 180:31-53.
Russell S. Crosbie, Bridget R. Scanlon, Freddie S. Mpelasoka, Robert C. Reedy, John B. Gates and Lu Zhang,
2013, Potential climate change effects on groundwater recharge in the High Plains Aquifer, USA. Water
Resources Research, American Geophysical Union, Vol. 49, 1-16
Sarit Kumar Das and Rajib Maity, 2014, Potential of Probabilistic Hydrometeorological Approach for
Precipitation-Based Soil Moisture Estimation. ASCE, J. Hydrol. Eng., 04014056, 1-14.
T. Ahmadi, A.N. Ziaei, K. Davary, A. Faridhosseini and A. Izadi, 2013, Estimation of groundwater recharge
using various methods in Neishaboor Plain, Iran. Taylor & Francis Group: Groundwater Modeling and
Management under Uncertainty, 9-15.
Thomas Meixner, A. H. Manning, D. A. Stonestrom, D. M. Allen, H. Ajami, K. W. Blasch, A. E. Brookfield, C.
L. Castro, J. F. Clark, D. J. Gochis, A. L. Flint, K. L. Neff, R. Niraula, M. Rodell, B. R. Scalon, K. Singha and
M. A. Walvoord, 2016, Implications of projected climate change for groundwater recharge in the western
United States. Elsevier: J. Hydrology, 534|(2016), 124-138.

Shivaji Patil, Jagottam Agrawal / Uncertainties and challenges in distribution of…..
78
Tianming Huang, and Zhonghe Pang, 2010, Estimating groundwater recharge following land-use change using
chloride mass balance of soil profiles: a case study at Guyuan and Xifeng in the Loess Plateau of China.
Springer: Hydrogeology J., 10.1007/s10040-010-0643-8.
Vijai Singhal and Rohit Goyal, 2012, A methodology based on spatial distribution of parameters for
understanding affect of rainfall and vegetation density on groundwater recharge. European Journal of
Sustainable Development, 1, 2, 85-96.
X. Sun, Y Xu, NZ Lovanovic, E. Kapangaziwiri, L. Brendonck and RDH Bugan, 2013, Application of the
rainfall infiltration breakthrough (RIB) model for groundwater recharge estimation in west coastal South Africa.
Water SA, Vol. 39, No. 221-230.
Z. Zomlot, B. Verbeiren, M. Huysmans and O. Batelaan, 2015, Spatial distribution of groundwater recharge and
base flow: Assessment of controlling factors. Elsevier: J. Hydrology: Regional Studies, 4|(2015), 349-368.
Proceedings of the International Conference on Climate Change, Vol. 1, 2017, pp. 79-85
Copyright © 2017 TIIKM
ISSN 2513-258X online
DOI: https://doi.org/10.17501/iccc.2017.1108
International Conference on Climate Change - 2017 (ICCC 2017)
Future Climate Projections for Annual and Seasonal
Rainfall in Sri Lanka using CMIP5 Models
Thanuja Darshika, Shiromani Jayawardane
Department of Meteorology, Sri Lanka
Abstract:
Statistically downscaled data into 25kmx25km grid resolution of 6 earth system models under
coupled model inter-comparison project 5 (CMIP5) are analyzed to see the future Changes in annual
as well as seasonal Rainfall over Sri Lanka for 3 time periods; 2020–2040, 2040-2060 and 2070-
2090 relative to baseline climatology period 1975-2005 for two emission scenarios; Rcp4.5
representing low emission and Rcp8.5 representing high emission scenario. The results of Rainfall
changes are indicated that
Annual rainfall anomaly is negative in Northeastern parts, and positive in Southwestern parts
for the period 2020-2040 and positiveand increasing there after under RCP 4.5 scenario.
Annual rainfall anomaly is positive and increasing for all 3 time periods under RCP 8.5
scenario .
Southwest monsoon rainfall anomaly is positive and increasing inboth RCP 4.5 and RCP 8.5
scenarios with significant increase in rainfall over the wet zone.
Northeast monsoon rainfall anomaly negative and negative trend is observed in RCP 4.5
and RCP 8.5. Decrease in rainfall is significant in the dry zone.
First Inter Monsoon rainfall anomaly is negative in 2020-2040 , slightly negative in 2040-
2060 and positive except Northeastern parts under RCP 4.5. First Inter Monsoon rainfall
anomaly is negative in all 3 time periods under RCP 8.5 scenarios No significant trend is
evident in RCP 8.5
Second Inter Monsoon rainfall anomaly is negative in Northeastern parts, and positive in
Southwestern parts in 2020-2040 and positive and increasing after that under RCP 4.5.
Second Inter Monsoon rainfall anomaly is positive and increasing in 8.5 scenarios with
increase in rainfall is significant in the Southwestern and Southeastern parts.
Introduction
Climate models are currently the most credible tools for making projections of future climate over the next
100 yr. A range of different climate models exist, from the simplest energy balance models to the most
sophisticated global circulation models (GCMs; see, for example, McGuffie and Henderson -Sellers, 2004).
Uncertainty in climate change projections include representation of the GHG emissions scenarios,
uncertainties associated with future estimates of population growth, changes in land use, and the economic
growth ect. Further uncertainties in climate modeling arise from uncertainties in initial conditions, boundary
conditions, observational uncertainties, uncertainties in model parameters and structural uncertainties
resulting from the fact that some processes in the climate system are not fully understood or are impossible to
resolve due to computational constraints (IPCC, AR4).
The Intergovernmental Panel on Climate Change (IPCC) Fourth assessment report (AR4) stated that the
current understanding of future climate change in the monsoon regions remains one of considerable
uncertainty with respect to circulation and precipitation (IPCC AR4 Sections 3.7, 8.4.10 and 10.3.5.2).
Multi-model ensembles are defined in these studies as a set of model simulations from structurally different
models, where one or more initial condition ensembles are available from each model an d it is identified that
projections have higher reliability and consistency when several independent models are combined ( Doblas -

Thanuja Darshika, Shiromani Jayawardane / Future Climate Projections for Annual and…..
80
Reyes et al. 2003; Yun et al. 2003). Multi-model projections for long-term climate change were used in
reports of the Intergovernmental Panel on Climate Change (IPCC), where unweighted multi-model means
rather than individual model results were often presented as best guess projections (IPCC 2001).
According to previous studies, an increase in precipitation is projected in th e Asian monsoon (along with an
increase in interannual season-averaged precipitation variability) and the southern part of the west African
monsoon with some decrease in the Sahel in northern summer, as well as an increase in the Australian
monsoon in southern summer in a warmer climate. Differently from precipitation, Asian monsoon circulation
was projected to decrease by 15 % (Tanaka et al. 2005; Ueda et al. 2006).
The main objective of this paper is to to develop CMIP5-based short-term (2030s representing climatology
over 2021–2040), medium-term (2050s representing climatology over2041–2060) and long-term (2080s
representing climatology over 2071–2090)climate change projections in Rainfall for Sri Lanka based on a
multi-model ensemble of 6 models .
The remainder of the paper is organized as follows. Descriptions of the data and analysis method used are
presented in section 2. In section 3, Future climate projections for annual and seasonal rainfall in Sri Lanka
using CMIP5 models are investigated. Conclusion is presented in section 4.
Data and Methodology
NASA Earth Exchange Global Daily Downscaled Projections (NEX-GDDP) dataset is comprised of
downscaled climate scenarios for the globe that are derived from the General Circulation Model (GCM) runs
conducted under the CMIP5 and across two of the four greenhouse gas emissions scenarios known as
Representative Concentration Pathways (RCPs). The CMIP5 GCM runs were developed in support of the
Fifth Assessment Report of the Intergovernmental Panel on Climate Change (IPCC AR5). The NEX-GDDP
dataset includes downscaled projections for RCP 4.5 and RCP 8.5.
Table1Earth System models used to evaluate
CanESM2 The Second Generation Coupled Global Climate Model
Canadian Centre for Climate Modelling and Analysis
(2.8*2.8)
CNRM-CM5 National Centre for Meteorological Research/ Meteo-
France (1.4 * 1.4)
CSIRO-MK3-6-0 Commonwealth Scientific and Industrial Research
Organization (CSIRO) and the Queensland Climate
Change Centre of Excellence (QCCCE). (1.895*1.875)
GFDL-CM3 Geophysical Fluid Dynamic Laboratory NOAA, USA
Coupled Climate Model (2 * 2.5)
MRI-CGCM3 Global Climate Model of the Meteorological Research
Institute, Japan (1.132*1.125)
NCAR-CCSM4 National Center for Atmospheric Research, USA
Coupled Climate Model (0.942 * 1.25)
Based on the model performance of historical runs NASA Earth Exchange Global Daily Downscaled
Projections of 6 GCM models (CanESM2, CNRM-CM5, CSIRO-MK3-6-0, GFDL-CM3, MRI-CGCM3 and
NCAR-CCSM4) with 25km grid spacing were used future projections for Sri Lanka(Herath.2016). Future
change of precipitation for 3 time periods 20-year centered on 2030s, 2050s and 2080s (2020-2040, 2040-

Proceedings of the International Conference on Climate Change, Vol. 1, 2017, pp. 79-85
81
2060 and 2070-2090) for 2 emission scenarios RCP 4.5 and RCP 8.5 were constructed by comparing
climatological means during the historical run period (1975–2005). Spatial patterns of precipitation for all
three futures are discussed on Seasonal and annual basis. Never the less this work is giving good initial idea
about the future climate changes in precipitation over Sri Lanka.
Results
Three time slices incorporating 20-year centered on 2030s, 2050s and 2080s were examined to gain some
insight into the range of future prediction of temperature and precipitation for Rcp8.5 and Rcp4.5 scenarios.
Spatial patterns of precipitation and temperature for all three futures are discussed on Seasonal and annual
basis. Never the less this work is giving good initial idea about the future climate changes in temperature and
precipitation over Sri Lanka.
Figure1: Multi model ensemble of change in Southwest Monsoon Rainfall, relative to 1975-2005 for low emission scenario
(RCP 4.5) (upper) and high emission scenario (RCP 8.5) for time periods (2020-2040), (2040-2060), (2070-2090).
For the period from 2020 to 2040 positive anomaly rainfall is predicted over most parts of the island by multi-
model ensemble prediction under low and high (Figure. 1) emission scenarios.
For the period from 2040 to 2060, and 2070 to 2090 positive anomaly rainfall is predicted over most parts of
the island by multi-model ensemble prediction under low and high (Figure.1) emission scenarios. Higher
positive values are clearly apparent in the wet zone. It is evident that the intensity as well as areal extension of
the positive rainfall anomaly over the wet zone increases with time (Figure. 1).
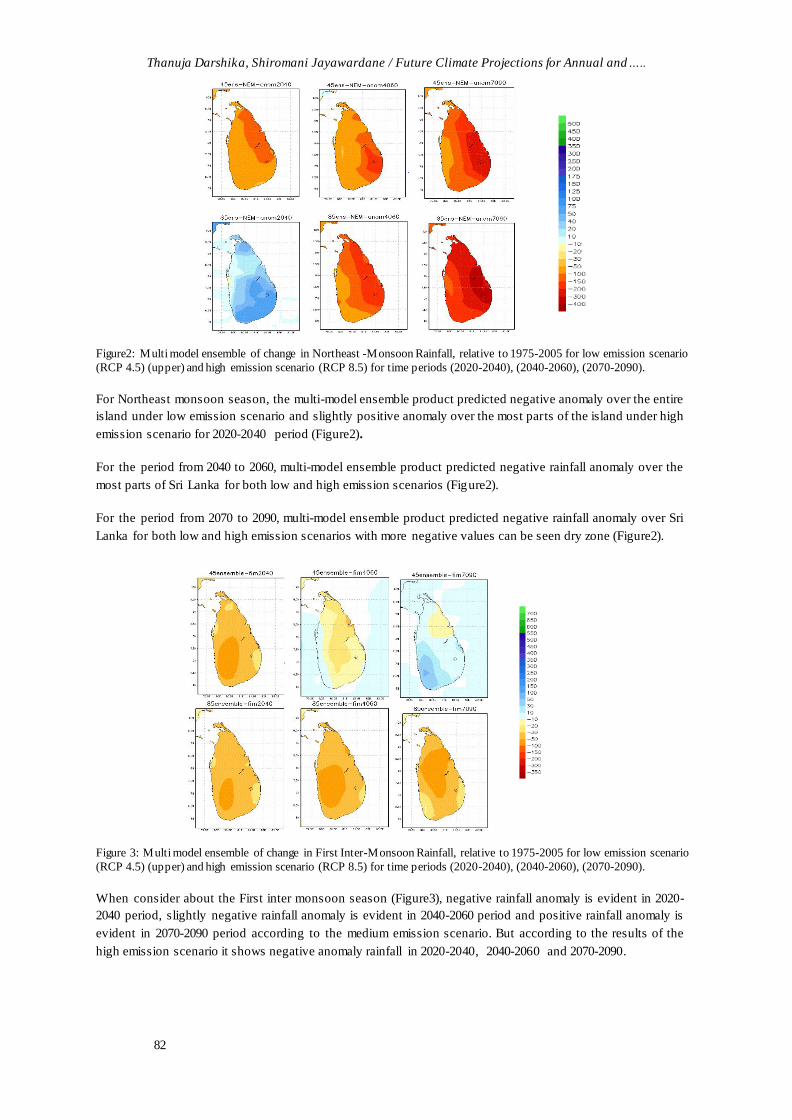
Thanuja Darshika, Shiromani Jayawardane / Future Climate Projections for Annual and…..
82
Figure2: Multi model ensemble of change in Northeast -Monsoon Rainfall, relative to 1975-2005 for low emission scenario
(RCP 4.5) (upper) and high emission scenario (RCP 8.5) for time periods (2020-2040), (2040-2060), (2070-2090).
For Northeast monsoon season, the multi-model ensemble product predicted negative anomaly over the entire
island under low emission scenario and slightly positive anomaly over the most parts of the island under high
emission scenario for 2020-2040 period (Figure2).
For the period from 2040 to 2060, multi-model ensemble product predicted negative rainfall anomaly over the
most parts of Sri Lanka for both low and high emission scenarios (Figure2).
For the period from 2070 to 2090, multi-model ensemble product predicted negative rainfall anomaly over Sri
Lanka for both low and high emission scenarios with more negative values can be seen dry zone (Figure2).
Figure 3: Multi model ensemble of change in First Inter-Monsoon Rainfall, relative to 1975-2005 for low emission scenario
(RCP 4.5) (upper) and high emission scenario (RCP 8.5) for time periods (2020-2040), (2040-2060), (2070-2090).
When consider about the First inter monsoon season (Figure3), negative rainfall anomaly is evident in 2020-
2040 period, slightly negative rainfall anomaly is evident in 2040-2060 period and positive rainfall anomaly is
evident in 2070-2090 period according to the medium emission scenario. But according to the results of the
high emission scenario it shows negative anomaly rainfall in 2020-2040, 2040-2060 and 2070-2090.

Proceedings of the International Conference on Climate Change, Vol. 1, 2017, pp. 79-85
83
Figure 4. Multi model ensemble of change in Second Inter -Monsoon Rainfall, relative to 1975-2005 for low emission scenario (RCP 4.5) (upper) and high emission scenario (RCP 8.5) for time periods (2020-2040), (2040-2060), (2070-2090).
For second-inter monsoon season, the multi-model ensemble product predicted negative anomaly over the
northeastern parts while slightly positive anomaly elsewhere (Figure4) for low emission scenario for 2020-
2040 period. For high emission scenario, the multi-model ensemble product predicted positive anomaly
rainfall over most parts of the island (Figure4) for 2020-2040 period.
For the period from 2040 to 2060, the multi-model ensemble product predicted positive rainfall anomaly over
Sri Lanka for both low and high emission scenarios (Figure 4).
The multi-model ensemble prediction predicted positive rainfall anomaly over the entire country for 2070-
2090 period under low and high emission scenario (Figure 4).
Figure 5: Multi model ensemble of change in Annual Rainfall, relative to 1975-2005 for low emission scenario (RCP 4.5) (upper) and high emission scenario (RCP 8.5) for time periods (2020-2040), (2040-2060), (2070-2090).
The multi-model ensemble product indicated negative anomaly over the dry zone and positive anomaly over
the dry zone for 2020-2040 period under low emission scenario. Multi-model ensemble predicted positive
anomaly over most parts of the island for 2020-2040 period under high emission scenario (Figure 5).
Increasing rainfall is significant over the wet zone in most models.

Thanuja Darshika, Shiromani Jayawardane / Future Climate Projections for Annual and…..
84
The multi-model ensemble product indicated positive rainfall anomaly over the entire country for 2040-2060
period under both low and high emission scenarios with significant increase in rainfall over the wet zone.
The multi-model ensemble product indicated positive rainfall anomaly over the entire country for 2070-2090
period under both low and high emission scenarios with significant increase in rainfall over the wet zone.
Increase in rainfall over the wet zone is more significant in high emission scenario than high emission
scenario.
The nonlinear and chaotic nature of the climate system imposes natural limits on the extent to which skilful
predictions of climate statistics may be made. Model-based ‘predictability’ studies, which probe these limits
and investigate the physical mechanisms involved, support the potential for the skilful prediction of annual to
decadal average temperature and, to a lesser extent precipitation (IPCC, AR5 Synthesis report). Even though
the Near-term (2020-2040) climate projections are important to decision makers in government and industry,
the uncertainty during this period is high due to the climate is more reliance on the initial state of internal
variability and less reliance on external forcing from emission scenarios.
Conclusion
NASA Earth Exchange Global Daily Downscaled Projections (NEX-GDDP) data GCM 6 climate models (25-
kilometer (km) grid resolution) were compared with model historical runs and observed data from 1975-2005
to evaluate model performance. NEX-GDDP downscaled models were captured the bi-modal pattern of
annual cycle of precipitation in Sri Lanka as well as the spatial pattern of precipitation of annual average as
well as seasonal average.
NEX-GDDP data of GCM 6 climate models were used to develop figurers climate projections.
The Representative Concentrated Pathways (RCP) RCP 8.5 and 4.5 scenarios from of the IPCC AR5 2013,
representing high and medium futures, respectively, were adopted, with three time periods —2030s, 2050s,
and 2080s.
The results indicated that the Annual rainfall anomaly is negative in Northeastern parts, and positive in
Southwestern parts in 2020-2040, while Annual rainfall anomaly is positive and increasing thereafter under
low emission scenario RCP 4.5.
Southwest monsoon rainfall anomaly is positive and increasing in both low (RCP 4.5) and high (RCP 8.5)
emission scenario.
Northeast monsoon rainfall anomaly is negative for short term, medium term and long term projections
observed under low emission scenario RCP 4.5.
Northeast monsoon rainfall anomaly slightly positive in short term term projection 2020-2040, and negative
thereafter for medium term and long term projections under high emission scenario.
First Inter Monsoon rainfall anomaly is negative in 2020-2040, slightly negative in 2040-2060 and positive
except Northeastern parts under low emission scenario RCP 4.5.
First Inter Monsoon rainfall anomaly is negative in all 3 time frames with no significant trend under high
emission scenario 8.5.
Second Inter Monsoon rainfall anomaly is negative in in Northeastern parts, and positive in Southwestern
parts in 2020-2040. Positive and increasing after that under RCP 4.5.

Proceedings of the International Conference on Climate Change, Vol. 1, 2017, pp. 79-85
85
Second Inter Monsoon rainfall anomaly is positive and increasing in 8.5 scenarios with significant increase of
positive rainfall anomaly over the Southwestern and Southeastern parts .
Acknowledgment
Technical support provided by RIMES under the "Capacity building on generation and application of
downscaled climate change projections" project funded by UN ESCAP Trust Fund for Tsunami, Disaster and
Climate Preparedness in Indian Ocean and Southeast Asian Countries (LOA No. 2014-0036) is
acknowledged. Climate scenarios used were from the NEX-GDDP dataset, prepared by the Climate Analytics
Group and NASA Ames Research Center using the NASA Earth Exchange, and distributed by the NASA
Center for Climate Simulation (NCCS) .
References
Cayan, D.R., Maurer, E.P., Dettinger, M.D., Tyree, M. and Hayhoe, K., 2008. Climate change scenarios for the California region. Climatic change, 87, pp.21-42.
Doblas-Reyes, F. J., Pavan, V. & Stephenson, D. B. 2003 The skill of multimodel seasonal forecasts of the wintertime North Atlantic Oscillation. Clim. Dynam. 21, 501–514. (doi:10.1007/s00382- 003-0350-4)
Gbode, I.E., Akinsanola, A.A. and Ajayi, V.O., 2015. Recent Changes of Some Observed Climate Extreme
Events in Kano. International Journal of Atmospheric Sciences, 2015.
IPCC 2001 In Climate change 2001: the scientific basis. Contribution of working group I to the third assessment
report of the Intergovernmental Panel on Climate Change (eds J. T. Houghton, Y. Ding, D. J. Griggs, M.
Noguer, P. J. van der Linden, D. Xiaosu, X. Dai, K. Maskell & C. A. Johnson), p. 881. Cambridge, UK:
Cambridge University Press.
Karmacharya, J., Shrestha, A. and Shrestha, M.L., 2007. Climate change scenarios for South Asia and Central Himalayan region based on GCM ensemble. Department of Hydrology and Meteorology, Kathmandu .
Lee, J.Y. and Wang, B., 2014. Future change of global monsoon in the CMIP5. Climate Dynamics, 42(1-2), pp.101-119.
McGuffie, K. and Henderson-Sellers, A., 2005. A climate modelling primer. John Wiley & Sons.
Tanaka, H.L., Ishizaki, N. and Nohara, D., 2005. Intercomparison of the intensities and trends of Hadley,
Walker and monsoon circulations in the global warming projections. SOLA, 1, pp.77-80.
Vera, C., Silvestri, G., Liebmann, B. and González, P., 2006. Climate change scenarios for seasonal
precipitation in South America from IPCC‐AR4 models. Geophysical Research Letters, 33(13).
Yun, W. T., Stefanova, L. & Krishnamurti, T. N. 2003 Improvement of the multimodel supersensemble
technique for seasonal forecasts. J. Clim. 16, 3834–3840.