Conference of New England Governors and Eastern Canadian ...
158
31 th Conference of New England Governors and Eastern Canadian Premiers Conference of New England Governors and Eastern Canadian Premiers Briefing Book Addendum CD-ROM Rodd Brudenell Resort Roseneath, Prince Edward Island June 26, 2007 New England Secretariat Eastern Canadian Secretariat New England Governors’ Conference, Inc. Eastern Canadian Premiers’ Office 76 Summer Street P.O. Box 2044 Boston, Massachusetts 02110 Halifax, Nova Scotia B3J 2Z1
Transcript of Conference of New England Governors and Eastern Canadian ...
31th Conference of New England Governors and Eastern Canadian Premiers
Conference of New England Governors
and Eastern Canadian Premiers
Briefing Book
Addendum CD-ROM
Rodd Brudenell Resort Roseneath, Prince Edward Island
June 26, 2007
New England Secretariat Eastern Canadian Secretariat New England Governors’ Conference, Inc. Eastern Canadian Premiers’ Office 76 Summer Street P.O. Box 2044 Boston, Massachusetts 02110 Halifax, Nova Scotia B3J 2Z1
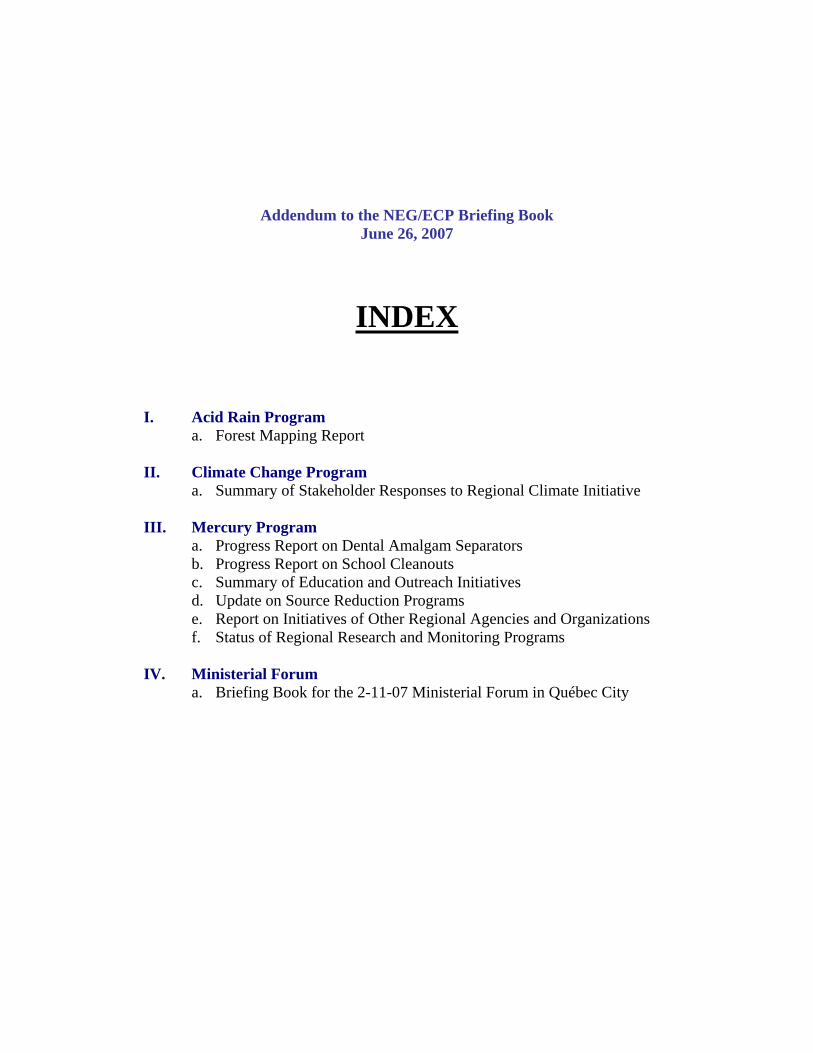
Addendum to the NEG/ECP Briefing Book June 26, 2007
INDEX
I. Acid Rain Program a. Forest Mapping Report
II. Climate Change Program
a. Summary of Stakeholder Responses to Regional Climate Initiative
III. Mercury Program a. Progress Report on Dental Amalgam Separators b. Progress Report on School Cleanouts c. Summary of Education and Outreach Initiatives d. Update on Source Reduction Programs e. Report on Initiatives of Other Regional Agencies and Organizations f. Status of Regional Research and Monitoring Programs
IV. Ministerial Forum
a. Briefing Book for the 2-11-07 Ministerial Forum in Québec City
SECTION I
Acid Rain Program
New England Governors/Eastern Canadian Premiers
Acid Rain Action Plan Action Item 4 : Forest Mapping Project
Mapping Forest Sensitivity to Atmospheric Acid Deposition
2006-2007 Annual Report
Prepared by
The Forest Mapping Group
For
The Committee on the Environment of The Conference of New England Governors and Eastern Canadian Premiers

2
Summary The Forest Mapping Work Group has undertaken to map the sensitivity of the entire New England Governor and Eastern Canadian premier (NEG/ECP) jurisdictions’ forests to atmospheric sulfur and nitrogen deposition loadings. Unprecedented for level of detail and size of area studied, this comprehensive project is the first scientific large-scale study of forest sensitivity to sulfur and nitrogen deposition in northeastern North America. Critical Load The term ‘critical load’ implies a tipping point, or threshold. Most generally, critical load may be defined as the maximum load that a system can tolerate before failing. As applied to environmental issues, however, critical load usually refers to exposure to pollutants; a critical load is an estimate of the level of exposure to one or more pollutants below which no harmful effects are known to occur to specified elements within an environment.
The common definition of critical loads agreed upon by the Forest Mapping Group is the definition originally developed by the United Nations Economic Commission for Europe in 1988:
A critical load is a quantitative estimate of the exposure to one or more pollutants below which significant harmful effects on specific sensitive elements of the environment do not occur according to present knowledge (Nilsson and Grennfelt, 1988).
The use of critical loads within the context of air quality management is premised on the notion that the effectiveness air quality policy is reflected in ecosystem impacts. The critical load concept is uniquely well suited toward informing air quality policy because its receptor-based approach takes into account both the spatial and topographical variables of atmospheric deposition. As it applies to the atmospheric deposition of acid forming compounds then, a critical load is that level of exposure to sulfur and nitrogen compounds below which no harmful effects are known to occur within a specified environment (or ecosystem). A unified critical load map for NEG/ECP region is now being completed; for this map, critical loads have been calculated for Northeastern North American forest ecosystem. The approach used to identify critical loads for sulfur and nitrogen in the region’s forest ecosystem is an ecological assessment based on an overall (steady-state) ecosystem budget for nutrient cations of calcium (Ca2+), magnesium (Mg2+), and potassium (K+). This budget exists within a dynamic system of nutrient inputs, exports, and recycling. In its simplest terms, the inputs to the nutrient budget for the Maine forest ecosystem include the addition of the nutrients Ca, Mg, and K through atmospheric deposition; acid forming compounds of sulfur (S) and nitrogen (N) are also introduced through

3
deposition. Additional inputs of Ca, Mg, and K are occur through the chemical weathering of the bedrock and soils. Nutrient losses or exports from the system occur as a result of chemical reactions within the root zone which may render a portion of nutrients unavailable for plant nutrition, and through soil leaching in response to the presence of acids. Additional losses or exports occur as a result of forest fires and through the harvesting of trees from the forest. Nutrient recycling occurs throughout the lifecycle of the trees in the forest through the shedding of leaves and/or needles and through the decay of vegetative and woody debris on the forest floor. The overall ecosystem budget is based upon the relative values of the inputs to and exports from the system. A condition where nutrient input values exceed exports suggests that an equilibrium state of biologic capacity exists for that ecosystem. Conversely, a condition where nutrient exports exceed imports suggests a net nutrient deficit and increasing soil acidification; conditions ultimately unsustainable for that ecosystem over the long term. The critical load map developed for the NEG/ECP region is derived on the basis of steady-state or static models. Consequently the map reflects conditions of nutrient balance rather than absolute measures of soil acidity/fertility. Nevertheless one might observe that where a negative nutrient imbalance is small, forest health problems and growth decline may not yet be evident; in those locations where the imbalance is significant, the impacts on forest health are likely to be observable today. Critical load approaches offer air quality and natural resource managers a powerful tool with which to identify ecosystems at risk and to tailor management strategies to address specific resource issues.
Results
The Critical Load mapping performed for the Region indicates that up to 61% of forested land within certain of the region’s jurisdictions have been characterized as ‘sensitive’, and thus may be experiencing a net nutrient deficit and increasing soil acidification. Soil mineral nutrient depletion has been linked to a wide variety of forest health problems, including reduced growth rates and increased mortality.
4
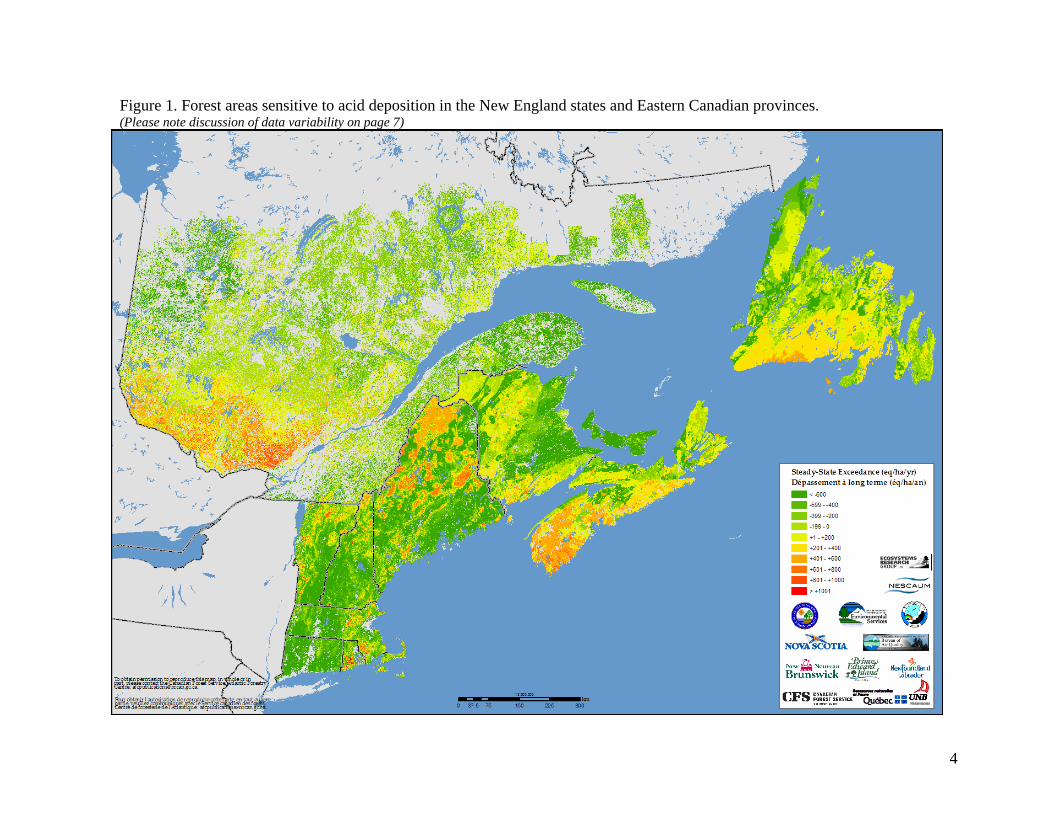
Figure 1. Forest areas sensitive to acid deposition in the New England states and Eastern Canadian provinces. (Please note discussion of data variability on page 7)

5
Table 1. Forest soil critical loads by NEG/ECP jurisdictions and their exceedances. Values are area-weighted. The terrestrial mapped area covers 162,674 km2 in the U.S. and 547,424 km2 in Canada.
Critical Load Exceedance
Median 5th
percentile Median 95th
percentile exceedance
Area mapped as exceeded Jurisdiction
(eq ha-1 y-1) (%) Maine 1280 340 -420 660 35.8 New Hampshire 1350 440 -520 600 17.6 Vermont 1600 390 -390 930 29.9 Rhode Island 1130 230 70 1260 51.6 Massachusetts 1770 540 -420 1250 29.1 Connecticut 2290 1330 -790 -10 4.4 Total New England states 1590 360 -470 730 29.3
Newfoundland 519 227 16 343 52.3 Nova Scotia 692 353 81 538 61.2 Prince-Edward-Island 2212 876 -1549 -190 3.3 New Brunswick 960 488 -215 298 28.2 Quebec 934 420 -175 532 31.6 Total Eastern Canadian provinces 946 423 -220 444 37.6
6
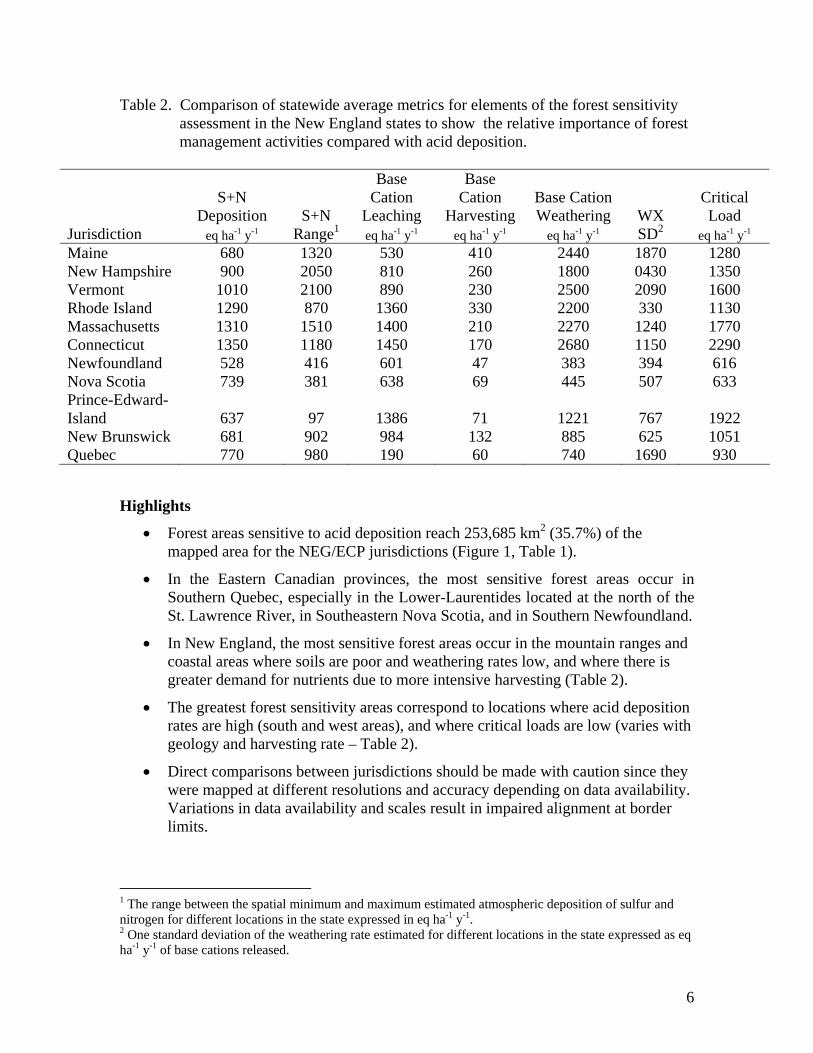
Table 2. Comparison of statewide average metrics for elements of the forest sensitivity assessment in the New England states to show the relative importance of forest management activities compared with acid deposition.
S+N
Deposition S+N
Base Cation
Leaching
Base Cation
Harvesting Base Cation Weathering WX
Critical Load
Jurisdiction eq ha-1 y-1 Range1 eq ha-1 y-1 eq ha-1 y-1 eq ha-1 y-1 SD2 eq ha-1 y-1 Maine 680 1320 530 410 2440 1870 1280 New Hampshire 900 2050 810 260 1800 0430 1350 Vermont 1010 2100 890 230 2500 2090 1600 Rhode Island 1290 870 1360 330 2200 330 1130 Massachusetts 1310 1510 1400 210 2270 1240 1770 Connecticut 1350 1180 1450 170 2680 1150 2290 Newfoundland 528 416 601 47 383 394 616 Nova Scotia 739 381 638 69 445 507 633 Prince-Edward-Island 637 97 1386 71 1221 767 1922 New Brunswick 681 902 984 132 885 625 1051 Quebec 770 980 190 60 740 1690 930
Highlights
• Forest areas sensitive to acid deposition reach 253,685 km2 (35.7%) of the mapped area for the NEG/ECP jurisdictions (Figure 1, Table 1).
• In the Eastern Canadian provinces, the most sensitive forest areas occur in Southern Quebec, especially in the Lower-Laurentides located at the north of the St. Lawrence River, in Southeastern Nova Scotia, and in Southern Newfoundland.
• In New England, the most sensitive forest areas occur in the mountain ranges and coastal areas where soils are poor and weathering rates low, and where there is greater demand for nutrients due to more intensive harvesting (Table 2).
• The greatest forest sensitivity areas correspond to locations where acid deposition rates are high (south and west areas), and where critical loads are low (varies with geology and harvesting rate – Table 2).
• Direct comparisons between jurisdictions should be made with caution since they were mapped at different resolutions and accuracy depending on data availability. Variations in data availability and scales result in impaired alignment at border limits.
1 The range between the spatial minimum and maximum estimated atmospheric deposition of sulfur and nitrogen for different locations in the state expressed in eq ha-1 y-1. 2 One standard deviation of the weathering rate estimated for different locations in the state expressed as eq ha-1 y-1 of base cations released.

7
• Research has shown that sensitive forest areas show losses in forest health and productivity, and are more susceptible to climatic stress events, pests and diseases. For instance, preliminary results from the 30 sites of the Quebec Forest Monitoring Network (RESEF) show that forest sites in sensitive areas are growing 30% more slowly than sites located in tolerant areas. These findings point out the need to a more precise assessment of the risks associated with critical load exceedances.
Data variability within the NEG/ECP Region
The Forest Mapping Group recognized early on that the type and availability of the data necessary to perform critical load mapping for the region was not consistently uniform among the jurisdictions; consequently a certain amount of variability becomes evident upon close examination of the mapping results, particularly along the U.S./Canadian border. The Forest Mapping Workgroup agrees that each jurisdiction has been mapped in accordance with the Forest Mapping Protocol. The variability of the mapping results in no way detracts from or diminishes the impact or value of the data presented here as a tool with which to inform policymakers within the region. Some of the variability noted at the US/Canadian border is also due to differences in land use and landcover differences which can be pronounced in some border regions.
For example, the atmospheric deposition rates for sulphur and nitrogen which were used to identify exceedences of the calculated critical load values for forest ecosystems in the New England states are based on 1999-2003 total atmospheric deposition using a high-resolution deposition model (Miller, 2000; Miller et al., 2005); while they are based on the 1999-2002 total atmospheric deposition for forest ecosystems in Quebec and the Atlantic Canadian provinces (Shaw et al., 2006).
The critical load map for the Atlantic Provinces doesn’t differentiate between agricultural and forested lands; whereas the maps for Quebec and the New England States include only forested land. The variability in data attributes resulted in the New England states, the Atlantic provinces, and Quebec being mapped at different resolutions, varying from 0.09 ha grid cells for the New England states up to an average polygon size of 150 ha in Atlantic Canada (average polygon size in Quebec: 14.6 ha). The soil mineral weathering rate estimation methods applied were also different among jurisdictions as permitted in the protocol (NEG/ECP Environment Task Group 2001). For the New England states, it was possible to use the data-intensive PROFILE model to estimate soil chemical weathering rates, while in Atlantic Canada the simpler soil substrate – texture model was used and its values seemed to correctly reflect forest soil conditions in Atlantic Canada (Whitfield et al., 2006). For Quebec, the latter model was applied with the use of a correction factor derived from the PROFILE model outputs from Maine used as calibration. The Forest mapping Group suggests that the evaluation of soil mineral weathering rates could be improved – and uncertainty reduced – through additional field studies.

8
Conclusions More than one third of the mapped area of the NEG/ECP has been designated as sensitive to the extent that these areas are subjected to acid deposition in excess of their terrestrial critical loads. The possibility that high critical load exceedances leading directly or indirectly to poor forest growth and health in the exceeded regions appears strong. The critical load maps produced thus far demonstrate that further reductions in national and international S and N emission rates should be undertaken in order to protect forests from excessive soil acidification. Additional work is necessary to improve upon the accuracy which could enhance and the utility of the regional critical load maps. Data variability between jurisdictions compromises our ability to draw seamless maps and a workshop bringing together forest mapping specialists and related disciplines in the region would build upon the success demonstrated to date. Recommendations 1. In general, that a sustained incremental effort be made to improve the consistency of
the data and the spatial resolution of the regional critical load map.
2. A regional forest sensititivity mapping workshop be organized within the next year.
3. An effort be made to improve the resolution of the soil weathering maps for the New England states, Quebec, and the Atlantic provinces.
4. Areas designated sensitive undergo further investigation to more precisely determine the scope and magnitude of the nutrient depletion occurring under current conditions of use and deposition.
References and deliverables Aherne, J., Ryan, D., de Kluizenaar, Y., van den Beuken, R. and Farell, E.P., 2000.
Literature review of the current state of knowledge regarding the calculation and mapping of critical loads: Determination and mapping of critical loads for sulphur and nitrogen and critical levels for ozone in Ireland, Environmetnal Protection Agency, Dublin.
Arp, P.A., Leger, W., Moayeri, M.H. and Hurley, J.E., 2001. Methods for mapping Forest Sensitivity to Acid Deposition for northeastern North America. Ecosystem Health, 7: 35-47.
DeMerchant, I., Hurley, J.E., Ouimet , R., Watmough, S.A. and Arp, P.A., 2004. Critical soil acidification loads and exceedances for Eastern Canada, Workshop report to Environment Canada, Fredericton, N.B.
Jeffries, D.S. and Ouimet , R., 2005. Critical loads: are they being exceeded? Chapter 8. In: Environment Canada Science Assessment and Integration Branch (Editor),
9
2004 Scientific Assessment of Acid Deposition, Downsview, ON, Canada, pp. 341-369.
Jeffries, D.S. et al., 2006. Combining aquatic and forest soil critical load and exceedance estimates for southeastern Canada. Water Air and Soil Pollut. Focus: (submitted at the 2005 Acid Rain Congress).
Miller, E.K. 2000. Atmospheric Deposition to Complex Landscapes: HRDM – A Strategy for Coupling Deposition Models to a High-Resolution GIS. Proceedings of the National Atmospheric Deposition Program Technical Committee Meeting, October 17-20, 2000, Saratoga Springs, New York.
Miller, E.K., VanArsdale, A., Keeler, G.J., Chalmers, A., Poissant, L., Kamman, N., and Brulotte, R. (2005) Estimation and Mapping of Wet and Dry Mercury Deposition across Northeastern North America. Ecotoxicology 14, 53-70.
Miller, E.K., 2005. Assessment of forest sensitivity to nitrogen and sulfur deposition in New Hampshire and Vermont, Conference of the New England Governors and Eastern Canadian Premiers, Forest Mapping Group, Halifax, N.S.
Miller, E.K., 2006. Assessment of forest sensitivity to nitrogen and sulfur deposition in Maine. Report prepared for the Maine Department of Environmental Protection, Bureau of Air Quality, Ecosystem Research Group Ltd., Norwich, VT.
Moayeri, M., Meng, F., Rui, Arp, P.A. and Foster, N.W., 2001. Evaluating critical soil acidification loads and exceedances for a deciduous forest at the Turkey Lakes watershed. Ecosystems, 4: 555-567.
NEG/ECP Environment Task Group, 2001. Critical load of sulphur and nitrogen assessment and mapping protocol for upland forests., NewEngland Governors and eastern canadian Premiers, Acid Rain Action Plan, Halifax, Canada.
Nilsson, J. and Grennfelt, P., 1988. Critical loads for sulphur and nitrogen. Report from a workshop held at Skokloster, Sweden, Miljorapport 1988:15, Nordic Council of Ministers, Copenhagen, Denmark.
Ouimet , R., Arp, P.A., Watmough, S.A., Aherne, J. and DeMerchant, I., 2006. Determination and mapping critical loads of acidity and exceedances for upland forest soils in Eastern Canada. Water Air Soil Pollut., 172: 57-66.
Ouimet, R., Duchesne, L., Houle, D. and Arp, P.A., 2001. Critical loads of atmospheric S and N deposition and current exceedances for Northern temperate and boreal forests in Quebec. Water Air Soil Pollut. Focus, 1(1/2): 119-134.
Pardo, L.H., Robin, Abbott, M., Duarte, N. and Miller, E.K., 2005. Tree chemistry database (version 1.0). Gen. Techn. Rep. NE-324, USDA For. Serv., Northeast. Res. Stn., Delaware, OH.
Shaw, M., Vet, R.J. and Zhang, L., 2006. Analyzed data fields from the National Atmospheric Chemistry Database (NAtChem) and Analysis Facility, Air Quality Research Division, Meteorological Service of Canada, Environment Canada, 4905 Dufferin St., Toronto, Ontario, Canada M3H 5T4.
Watmough, S.A., Aherne, J., Arp, P.A., DeMerchant, I. and Ouimet, R., 2004. Canadian Experiences in Development of Critical Loads for Sulfur and Nitrogen. In: Aguirre, C. Bravo and et. al. (Editors), Monitoring Science and Technology Symposium: Unifying Knowledge for Sustainability in the Western Hemisphere. Proceedings RMRS-P-000. Ogden, UT: U.S. Department of Agriculture, Forest Service, Rocky Mountain Research Station, Denver, CO.
10
Whitfield, C.J., Watmough, S.A., Aherne, J. and Dillon, P.J., 2006. A comparison of weathering rates for acid-sensitive catchments in Nova Scotia, Canada and their impact on critical load calculations. Geoderma, 136: 899 - 911.

11
The Forest Mapping Group Paul A. Arp Faculty of Forestry & Environmental Management University of New Brunswick 28, Dineen Drive Fredericton, N.B. E3B 6C2 Email: [email protected]
Ian DeMerchant Canadian Forest Service Atlantic Forestry Centre P.O. Box 4000 Fredericton, N.B. E3B 5P7 Email: [email protected]
Eric Miller President and Senior Scientist Ecosystems Research Group, Ltd. Aldrich House, Suite 11, 16 Beaver Meadow Rd. PO Box 1227 Norwich, VT 05055 Tel: 802-649-5550 Fax: 802-649-5551 Email: [email protected]
Rock Ouimet Canadian co-chair Direction de la recherche forestière Ministère des Ressources Naturelles du Québec 2700, rue Einstein Québec (QUÉBEC) G1P 3W8 Tel: 418-643-7994 (6533) Fax: 418-643-2165 Email: [email protected]
Linda Pardo USDA Forest Service Northeastern Research Station P.O. Box 968 Burlington, VT 05402 Tel: 802-951-6771, ext. 1330 Fax: 802-951-6368 Email: [email protected]
Julian Aherne Environmental and Resources Studies Trent University 1600 West Bank Drive Peterborough, ON K9J 7B8 Email: [email protected]
Shaun Watmough Environmental and Resources Studies Trent University 1600 West Bank Drive Peterborough, ON K9J 7B8 Email: [email protected]
Sandy Wilmot (member up to 2004) Vermont Dept. of Forests, Parks & Recreation Vermont Forest Ecosystem Monitoring 111 West Street Essex Jct., VT 05452 Tel: 802-879-5687 Fax: 802-878-5192 Email: [email protected]
Wade Bowers Canadian Forest Service P.O. Box 960 Corner Brook, NF A2H 6J3 Tel 709-637-4920 Fax: 709-637-4910 Email: [email protected]
Scott Payne Forestry Branch Department of Forest Resources and Agrifoods P.O. Box 2006 Fortis Building Corner Brook, NF A2H 6J8 Tel 709-637-2353 Fax: 709-637-2290 Email: [email protected]
Ivan Downton Director Forest Ecosystem Management Forestry Branch Department of Forest Resources and Agrifoods P.O. Box 2006, Fortis Building Corner Brook, NF A2H 6J8 Tel 709-637-2284 Fax: 709-634-4378 Email: [email protected]
12
Joan Carlson U.S. Dept. of Agriculture Forest Service 719 North Main Street Laconia, NH 03246 Tel: (603) 528-8721 Fax: (603) 528-8783 Email: jcarlson/[email protected]
Harry Hirvonen (up to 2005) Science Advisor, Forest Healt Science Branch, Canadian Forest Service Natural Resources Canada 580 Booth St. Ottawa, ON K1A 0E4 Tel: (613) 947-9015 Fax: (613) 947-9090 Email: [email protected]
Guy Fenech (up to 2004) Senior Science Advisor Atmospheric Environment Service Attention: APAC Environment Canada 4905 Dufferin Street Toronto, ON M3H 5T4 Tel: 416-739-4649 Fax: 416-739-4882 Email: [email protected]
Wendy Leger (up to 2003) Water Projects Officer Water Issues Division Atmospheric Environment Branch Environment Canada - Ontario Region 867 Lakeshore Road Burlington, ON L7R 4A6 Tel: 905-336-4949 Fax: 905-336-8901 Email: [email protected]
Jennifer Bofinger NH Division of Forests and Lands 172 Pembroke Road P.O. Box 1856 Concord, NH 03302-1856 Tel: 603-271-7858 Fax: 603-271-2629 Email: [email protected]
Charles Burnham Mass. Dept. of Environment Division of Forest and Parks 100 Cambridge St., 19th floor Boston, MA 02202 Tel: 617-727-3180, ext. 675 Fax: 617-727-9402 Email: [email protected]
David Struble Maine Forest Service State House Station 22 Augusta, ME 04333 Tel: 207-287-4981 Fax: 207-287-8422 Email: [email protected]
Cathy Sparks Division of Forest Environment 1037 Hartford Pike N. Scituate, RI 02857 Tel: 401-646-3367 Fax: 401-647-3590 Email: “Cathy Sparks”[email protected]
Luc Lamontagne Agriculture et Agroalimentaire Canada 2560, boul. Hochelaga Sainte-Foy (Québec) G1V 2J3 Tel: 418-648-7730 Fax: 418-648-5489 Email: [email protected]
copy: Bob Dick * Manager Forest Management Planning NB Dept. of Natural Resources & Energy P.O. Box 6000 Fredericton, NB E3B 5H1 Tel: 506-453-2516 Fax: 506-453-6689 Email: [email protected] * Does not participate in meetings or conference calls
Heather A. Morrison Senior Science Advisor Scientific Assessment and Integration Branch Environment Canada 4905 Dufferin Street, Downsview, ON, M3H 5T4
Silvina Carou Air Quality Science Officer Scientific Assessment and Integration Branch Environment Canada 4905 Dufferin Street, Downsview, ON, M3H 5T4
SECTION II
Climate Change Program
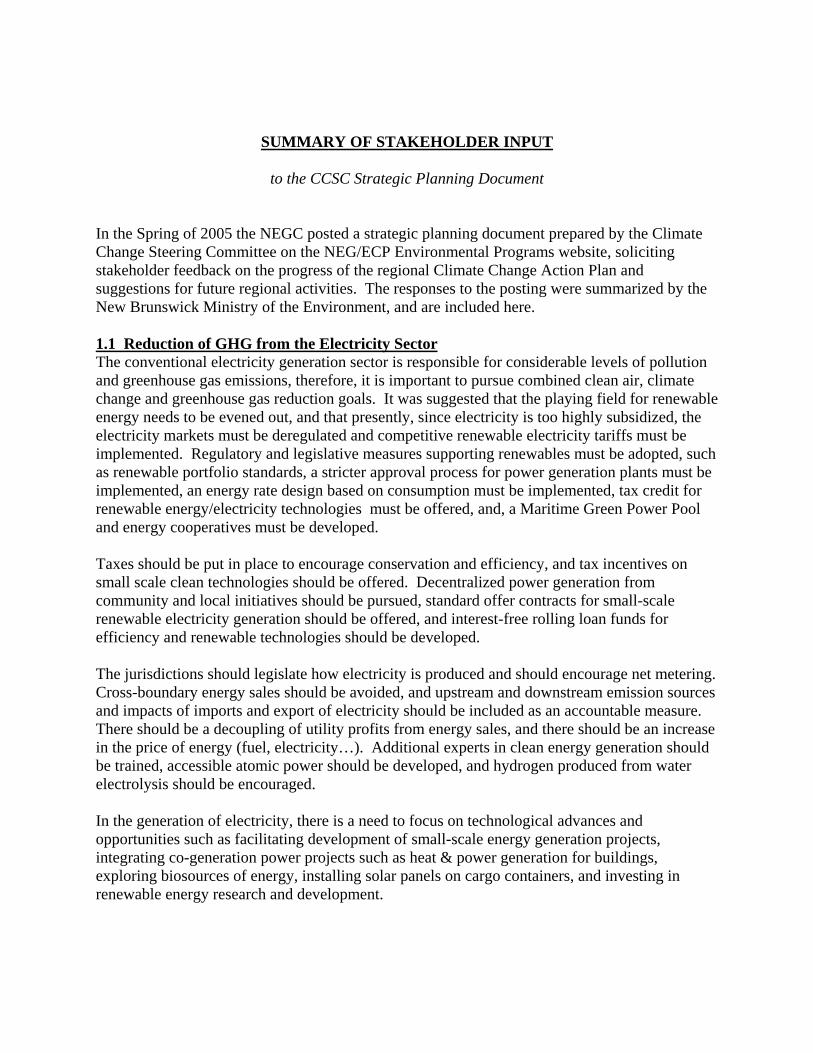
SUMMARY OF STAKEHOLDER INPUT
to the CCSC Strategic Planning Document In the Spring of 2005 the NEGC posted a strategic planning document prepared by the Climate Change Steering Committee on the NEG/ECP Environmental Programs website, soliciting stakeholder feedback on the progress of the regional Climate Change Action Plan and suggestions for future regional activities. The responses to the posting were summarized by the New Brunswick Ministry of the Environment, and are included here. 1.1 Reduction of GHG from the Electricity Sector The conventional electricity generation sector is responsible for considerable levels of pollution and greenhouse gas emissions, therefore, it is important to pursue combined clean air, climate change and greenhouse gas reduction goals. It was suggested that the playing field for renewable energy needs to be evened out, and that presently, since electricity is too highly subsidized, the electricity markets must be deregulated and competitive renewable electricity tariffs must be implemented. Regulatory and legislative measures supporting renewables must be adopted, such as renewable portfolio standards, a stricter approval process for power generation plants must be implemented, an energy rate design based on consumption must be implemented, tax credit for renewable energy/electricity technologies must be offered, and, a Maritime Green Power Pool and energy cooperatives must be developed. Taxes should be put in place to encourage conservation and efficiency, and tax incentives on small scale clean technologies should be offered. Decentralized power generation from community and local initiatives should be pursued, standard offer contracts for small-scale renewable electricity generation should be offered, and interest-free rolling loan funds for efficiency and renewable technologies should be developed. The jurisdictions should legislate how electricity is produced and should encourage net metering. Cross-boundary energy sales should be avoided, and upstream and downstream emission sources and impacts of imports and export of electricity should be included as an accountable measure. There should be a decoupling of utility profits from energy sales, and there should be an increase in the price of energy (fuel, electricity…). Additional experts in clean energy generation should be trained, accessible atomic power should be developed, and hydrogen produced from water electrolysis should be encouraged. In the generation of electricity, there is a need to focus on technological advances and opportunities such as facilitating development of small-scale energy generation projects, integrating co-generation power projects such as heat & power generation for buildings, exploring biosources of energy, installing solar panels on cargo containers, and investing in renewable energy research and development.
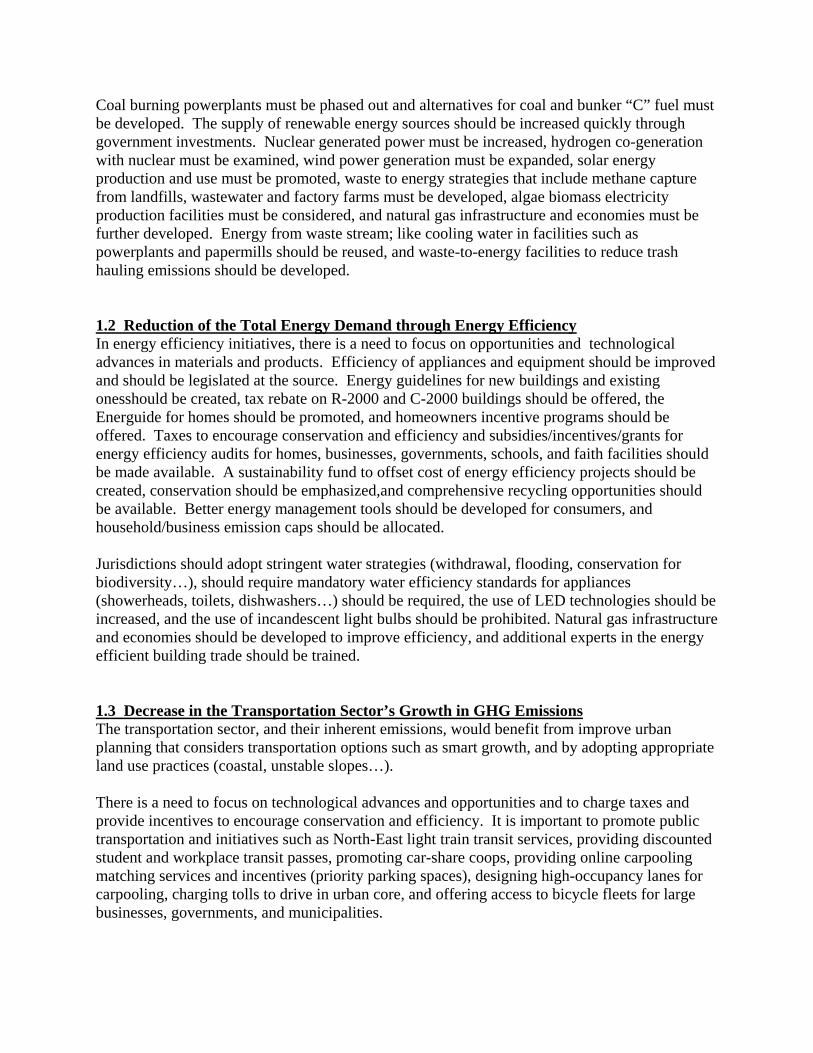
Coal burning powerplants must be phased out and alternatives for coal and bunker “C” fuel must be developed. The supply of renewable energy sources should be increased quickly through government investments. Nuclear generated power must be increased, hydrogen co-generation with nuclear must be examined, wind power generation must be expanded, solar energy production and use must be promoted, waste to energy strategies that include methane capture from landfills, wastewater and factory farms must be developed, algae biomass electricity production facilities must be considered, and natural gas infrastructure and economies must be further developed. Energy from waste stream; like cooling water in facilities such as powerplants and papermills should be reused, and waste-to-energy facilities to reduce trash hauling emissions should be developed. 1.2 Reduction of the Total Energy Demand through Energy Efficiency In energy efficiency initiatives, there is a need to focus on opportunities and technological advances in materials and products. Efficiency of appliances and equipment should be improved and should be legislated at the source. Energy guidelines for new buildings and existing onesshould be created, tax rebate on R-2000 and C-2000 buildings should be offered, the Energuide for homes should be promoted, and homeowners incentive programs should be offered. Taxes to encourage conservation and efficiency and subsidies/incentives/grants for energy efficiency audits for homes, businesses, governments, schools, and faith facilities should be made available. A sustainability fund to offset cost of energy efficiency projects should be created, conservation should be emphasized,and comprehensive recycling opportunities should be available. Better energy management tools should be developed for consumers, and household/business emission caps should be allocated. Jurisdictions should adopt stringent water strategies (withdrawal, flooding, conservation for biodiversity…), should require mandatory water efficiency standards for appliances (showerheads, toilets, dishwashers…) should be required, the use of LED technologies should be increased, and the use of incandescent light bulbs should be prohibited. Natural gas infrastructure and economies should be developed to improve efficiency, and additional experts in the energy efficient building trade should be trained. 1.3 Decrease in the Transportation Sector’s Growth in GHG Emissions The transportation sector, and their inherent emissions, would benefit from improve urban planning that considers transportation options such as smart growth, and by adopting appropriate land use practices (coastal, unstable slopes…). There is a need to focus on technological advances and opportunities and to charge taxes and provide incentives to encourage conservation and efficiency. It is important to promote public transportation and initiatives such as North-East light train transit services, providing discounted student and workplace transit passes, promoting car-share coops, providing online carpooling matching services and incentives (priority parking spaces), designing high-occupancy lanes for carpooling, charging tolls to drive in urban core, and offering access to bicycle fleets for large businesses, governments, and municipalities.
The transportation sector would benefit from improved vehicle efficiency such as adopting California standards, developing an appropriate vehicle-usage policy/regulation or by enforce mandatory hybrid vehicles/efficient transportation standards. Benefits could also be gained by promoting electric, hydrogen and fuel cell-powered transportation options, by developing speed reduction policies for fleet / general public, by enforcing anti-idling practices, by regulating mandatory regular inspection for vehicles, by offering car scrappage programs, and by mandating standards for fuel-efficient tires. Additional considerations should be given to reducing dependency on foreign oil and food exports by developing local food sources and distribution systems, by increasing short-sea shipping projects, by encouraging rail use for freight transport, by providing green certification for efficient transportation fleets, and by considering emissions from trade flows within the region to incorporate into an emission reduction plan. 2.1 Establishment of a Regional Standardized GHG Emissions Inventory It is important to develop a transparent jurisdictional report card. The inventory should be continuously updated and integrated into electricity and fuel procurement systems. An energy sector/LFE emissions report could be published daily like the stock exchange; but in the least, it should appear annually. The report would require that international standards be developed that include a common LFE reporting system. It should include emissions from mobile sources and residential homes. It would also be important to remove the reporting confidentiality clauses to maintain the report’s transparency and to provide better understanding of emission sources. 2.2 Creation of a Regional Emissions Registry and the Exploration of a Trading Mechanism The trading aspect of the emission management system is important and would require flexibility in its use to allow major emitters to potentially purchase credits from their customers. 3 Reduction of and/or Adaptation to Negative Social, Economic and Environmental Impacts of Climate Change To better adapt to the impacts of climate change, it would be important to undertake risk assessment studies for government decisions and increase awareness and understanding of climate change adaptation issues, especially through emphasis on adaptation measures to weather extremes. Other important initiatives would be: increasing research on coastal vulnerabilities, promoting greater community engagement, diversifying agricultural production; promoting crop rotation, protecting watercourses and natural windbreaks, improving public health infrastructure, and improving emergency preparedness and response 4.1 State and Provincial Governments to Lead by Example

For State and provincial governments to promote leading by example, it is important for them to: undertake risk assessment studies for government decisions, to mainstream climate change impacts and adaptation into everyday municipal and State/provincial planning by always consider economic, environmental and social benefits in all decision-making, by integrating climate considerations and sustainability in all decision-making (transportation, energy choices…), by promoting green climate-friendly operations and procurement policies, by increase government procurement of renewable energy, by partnering with the private sector (food distribution, waste management, large employers…) and by assign champions. Charging carbon taxes based on the polluter pays principle and promoting less reliance on carbon-based fuels could be complimented with providing funding and development policies and legislation that promote sustainability. By combining federal & State/provincial funding for municipal GHG reduction strategies and by increasing the supply of renewable energy sources quickly through government investments it would be possible to implement significant renewable energy and efficiency programs. By adopting renewable portfolio standards, by implementing an energy rate design based on consumption, and by developing waste to energy strategies, much efficiency and savings could be gained. 4.2 Promotion of Public Awareness It is important to undertake an open dialogue on the most appropriate course of action and to create a network of multidisciplinary experts on climate change issues. It is necessary to increase awareness and understanding of greenhouse gas emission reduction opportunities, and climate change impacts and adaptation measures where issues hold real meaning to the target groups. Climate change related issues should be taught in school curriculums and grants should be provided to schools and youth groups for audits, retrofits and awareness building. Community engagement and empowerment must be increased through social marketing and behavior change programs that promotes climate-friendly behaviors and discourages wasteful polluting. Involvement of First Nations should be increased which emphasizes the connection to the Earth. Public resource centers should be developed, additional energy efficiency agencies should be established, and technology demonstration sites should be set up (green buildings, alternative energies, green farms, minimum tillage practices…). Targeted messaging should be prepared (youth, teachers, businesses…), regular publications, newsletters, infomercials, articles, and announcements should be publish and distribute, the use of websites and films should be expanded as communication tools, regular climate change conferences should be organized, climate change action should be promoted at major events (National Day, holidays, celebrations…), and a Green Award Program should be implemented. Active lifestyles should be promoted (walking, biking), face to face stakeholder engagements should be encouraged, greater funding for NGO should be provided, Assign champions should be assigned, and taxation should be use to influence public behavior (energy, transportation…).
4.3 Establishment of a Plan for Reducing GHG Emissions and Conserving Energy A political will, a high-level political involvement, and engagement from the public must be created to set jurisdictional targets and to pursue a cap and trade program with timelines for deep emission reductions and targets for energy efficiency, renewable energy, transportation and electricity sector emissions. An open dialogue on appropriate course of action, where policies recognize the true value of the natural, social and economic environments, should focus on real reductions that provide clean air, water, land and climate change benefits. Climate considerations and sustainability should be integrated in all decision-making (transportation, energy choices…) and environmental externalities should be incorporated into costs (of petroleum, energy, appliances, goods…); where the extended producer is responsible for the full life-cycle of products and packaging and where the polluter-pays principle is legislated. Combine Federal & State/provincial funding for municipal GHG reduction strategies should be combined and funding for education. and outreach of climate change impacts, adaptation and GHG reduction should be provided. Champions should be assigned, congressional approvals of the NEG/ECP Climate Change Action Plan and RGGI should be obtained, evaluation of climate change impacts on resource economies should be undertaken, models such as HRM’s Climate Smart model should be adopted, and additional efforts in renewable energy generation should be undertaken.

SECTION III
Mercury Program

SECTION III.a
Mercury Program Progress Report on Dental Amalgam Separators
Page 1 of 9
DENTAL SECTOR SUMMARY Goal: 75% percent of dentists in the Region will install amalgam separators by 2007 and 95% percent of dentists in the Region will install amalgam separators by 2010. In August 2005, at the recommendation of the Mercury Task Force and Coordinating Committee on the Environment the NEGC/ECP adopted as a regional goal that “75 % of dentists in the region install separators by the end of 2007 and 95% of dentists by 2010”. These goals target dentists and dental offices that generate mercury amalgam containing wastewater. Based on data available in early 2007, the regional estimate is that approximately 70% of covered dentists are now using amalgam separators. Since these numbers are preliminary estimates based on incomplete data attributable to different regulatory reporting deadlines and frameworks between the jurisdictions, the MTF believes that it is likely that the region will, overall, achieve the 75% target by the end of 2007. The Task Force will work to refine the numbers over the next year and provide a more accurate evaluation in the next report. Separate tables are included for the New England States and the Eastern Canadian Provinces because the states primarily track the number of licensed dentists that have installed separators while the Provinces track dental offices / practices with installed separators. Jurisdictional approaches include both voluntary and mandatory programs. Installation of amalgam separators is aimed at reducing mercury in wastewater and from sewage sludge incinerators. Detailed accounts of jurisdictional efforts to increase the installation of dental amalgam separators follow.
TABLE 1:NEW ENGLAND STATES
STATE DATE ESTIMATED # OF DENTISTS*
ESTIMATED # OF DENTISTS COMPLYING
% COMPLIANCE
Connecticut 2007 2330 1826 79% Maine 2007 504 504 100% Massachusetts 2007 3,600 3000 83% New Hampshire
2007 815 758 93%
Rhode Island 2007 446** 138 31% Vermont 2007 336*** 175 83%
TOTALS - 8,031 6,406 80% * Who generate mercury-amalgam containing wastewater **Of the 720 licensed dentists in RI, the MTF estimates that approx. 62% will be actively practicing and generating amalgam-containing wastewater (based on the ratio in other states), for a total of 446. The 138 estimate is based on 1.6 dentists per practice for each of the 86 with installed separators.

Page 2 of 9
*** The VT estimated number of dentists is based on the number of dental offices w/installed separators and assumes 1.6 dentists per office.
EASTERN CANADIAN PROVINCES
PROVINCE DATE* ESTIMATED # DENTAL OFFICES
# SEPARATORS INSTALLED
%OFFICES W/SEPARATORS
New Brunswick
2007 279 223 80%
Newfoundland &
Labrador
2005 N/A but very small numbers
100%
Nova Scotia 2005 225 169 75% Prince Edward
Island 2006 34 32 95%
Quebec 2005 1880 850 45% TOTALS 2418 1274 53%
* Because up-to-date data was not available for several provinces, it is very likely that overall compliance rates are considerably higher than those summarized here.
Assuming that, overall, Canadian practices/offices are comprised of 1.6 dentists on average, the aggregated data for the whole region suggest that > 69% of dentists are now using amalgam separators.
DENTAL PROGRAM DETAILS
NEW ENGLAND STATES CONNECTICUT In accordance with the September 8, 2005 Declaratory Ruling on the use of amalgam fillings in dental practices issued by Commissioner McCarthy the department revised its best management practices (BMPs) for dental offices. The BMPs, revised January 11, 2006, address in more detail the installation of amalgam separators, the maintenance of such units and record keeping requirements of dental practices that place or discharge amalgam. Some of the specific modifications include:
• Amalgam separators must be operational at all times when dental procedures are performed;
• Amalgam separators and chair-side traps should be maintained in accordance with manufacturer specifications;
• Amalgam should be recycled whenever possible or, if not recycled, handled by a licensed hazardous waste transporter;

Page 3 of 9
• Non-oxidizing/biodegradable cleaners should be used when cleaning of water pipes and vacuum lines to minimize the dissolution of amalgam; and
• Clarification as to what routine records should be maintained in dental offices regarding the use of amalgam and amalgam separators and that such records must be made available to inspectors when requested.
Another significant change in the BMPs involves the creation and display of a brochure entitled Fillings: The Choices You Have, Mercury Amalgam and Other Filling Materials. The original brochure was created by the Maine Department of Human Services, Bureau of Health. With their permission, the Connecticut DEP adapted the brochure for the State of Connecticut in January 2006. As part of the revised BMPs, all Connecticut dental offices who use amalgam, must prominently display the brochure so dental patients can better understand the advantages and disadvantages to human health and the environment of the use of mercury amalgam fillings and other filling materials used in dental procedures. The brochure is intended to assist dental patients in making choices regarding their dental and total health needs. The department anticipates it will begin a coordinated effort of inspecting dental offices for compliance with the BMPs and familiarizing newly licensed dentists with what is expected of them as it relates the use and handling of mercury amalgam. Inspectors from the department’s Radiation Unit will conduct the initial inspections of dental offices while conducting routine “ionizing radiation” inspections. To assist the Radiation inspectors with the details of an amalgam separation unit, a workshop on amalgam separators was prepared and conducted for their benefit. An inspection checklist which highlights the key components of the dental office BMPs has been developed for the inspection staff and will be used during their inspections. The Department of Public Health is helping with the distribution of the dental office certification and BMP materials. The Department of Public Health will distribute DEP’s “certification package” to all newly licensed dentists. The “certification package” to be distributed by the Department of Public Health includes:
1. a copy of the initial Certification Form and instructions; 2. a copy of the Notification of Change Form; 3. a copy of the BMPs 4. a copy of the “Fillings” brochure; and 5. a copy of the Ionizing Radiation Registration Form and instructions.
MAINE In 2003 Maine passed legislation http://janus.state.me.us/legis/statutes/38/title38sec1667.html requiring installation of amalgam separators by dental offices using amalgam and notification to the department by December 31, 2004. Separator units installed prior to March 20, 2003 were required to achieve a minimum of 95 % removal efficiency, while separators installed on or after that date were required to achieve 98% removal efficiency (as determined by ISO 11143). Maine DEP worked with the Maine Dental Association on outreach and technical issues and provided a list of amalgam separators that met ISO requirements. Dentists are allowed to use brands not included on the list but have the burden of proving they meet ISO 11143 standards.
Page 4 of 9
The Department has determined that 504 dentists are subject to the amalgam separator requirement. However, because many dentists practice in group settings, the number of separators needed to serve the dental offices is significantly less than this. The Department has received written notice from 362 dental offices confirming that a separator has been installed. The Department is not aware of any dental offices that have not met the requirement to install a separator. In addition and prior to this law the Department issued the Environmental Guide to Dentistry. The booklet explains how to safely handle mercury amalgam from the moment it enters the office, including, among other things, the proper handling of waste amalgam, the use of amalgam separators to remove mercury from wastewater flows, and the cleaning and replacement of mercury-laden pipes and plumbing fixtures. The Department is conducting inspections of amalgam separators (spring 2007) in selected dental offices across the state. This will assist both the department and the Maine Dental Association in understanding remaining information needs for appropriate maintenance and use of the amalgam separators. We are in discussions with the Maine Dental Association to assist the department in updating this document. Recent legislative actions now requires suppliers of amalgam to annually report the volume of amalgam supplied to Maine dentists in 2006, 2007 and 2008. In 2006 suppliers reported sales of 207.4 lbs of mercury in amalgam in Maine.
MASSACHUSETTS MA Voluntary Early Compliance Dental Sector Initiative And Regulations. Amalgam waste from dental practices and clinics is a significant source of mercury releases to the environment when it is thrown into the trash or washed down a drain. Amalgam waste from the dental sector contributes significantly to environmental releases of mercury primarily through sludge ruse and incineration (the mercury concentrates into the sludge) with smaller releases occurring through wastewater discharges. The dental sector was identified in the 1998 NEG-ECP MAP and also in the 2000 MA Zero Mercury Strategy as a target for pollution prevention and control efforts. Subsequent studies including one by the University of Massachusetts, of several commercially available amalgam separator technologies confirmed that they effectively remove most mercury from dental wastewater. To address this sector, the Massachusetts Department of Environmental Protection (MassDEP), the Executive Office of Environmental Affairs (EOEA) and the Massachusetts Water Resources Authority (MWRA) have pursued a phased approach. Initial efforts focused on outreach to raise awareness within the dental profession about the negative impacts associated with mercury releases to the environment and to encourage dentists to voluntarily install amalgam separators and use best management practices to reduce mercury releases. This phase was followed by a two-year incentive-driven voluntary early compliance initiative undertaken from 2004- 2006 by MassDEP in collaboration with the Massachusetts Dental Society (MDS) and, finally, the adoption of mandatory regulations in 2006. The 2-year voluntary early compliance initiative was designed to encourage early installation and use of amalgam separators by dentists prior to the adoption of regulations that were then being developed (http://www.mass.gov/dep/service/about08.htm). The major incentives included a waiver of permit fees and regulatory certainty, as units certified under the program were "grandfathered".
Page 5 of 9
Specifically, dental practices participating in this voluntary program before March 1, 2005, were exempted from MassDEP amalgam separation system installation, operation, maintenance and upgrade regulations, and related fees, until February 1, 2010. Dentists who submitted voluntary certifications after February 28, 2005, but before February 1, 2006, were exempted from additional amalgam separator rules and fees until February 1, 2007. This program was very successful. Over the 2-year voluntary compliance program (2004-2005), over 74% of MA dentists (2,660 of 3,600) certified that they were recycling waste mercury and using acceptable amalgam separators, which were required to meet a 95% or greater amalgam removal efficiency based on the ISO 1143 testing procedure, and best management practices. In the spring of 2006, MassDEP issued regulations that require most dental practices and facilities in Massachusetts to install and operate amalgam separator systems; recycle mercury-containing amalgam wastes; implement a suite of best management practices; and periodically certify their compliance with these requirements (http://mass.gov/dep/service/regulations/310cmr73.pdf). These regulations took effect on April 24, 2006 and were developed with assistance from a stakeholder workgroup including individual dentists, MDS representatives, sewerage authorities, and environmental groups. These regulations specifically require dental practices and facilities to certify to MassDEP every five years that they:
• Have installed an amalgam separator system that serves every dental chair in the practice or facility where waste amalgam is generated. The system must be one that has been demonstrated to remove at least 98 percent of the amalgam waste containing mercury using the ISO 11143 test protocol. Facilities that participated in the voluntary program are allowed to continue using their 95 percent efficient amalgam separators, as long as the equipment continues to achieve this removal efficiency and is maintained in accordance with manufacturer instructions. When separators need to be replaced, units that meet the 98 percent removal efficiency standard must be installed. Practices that do not generate or discharge wastewater from amalgam-related processes such as oral and maxillofacial, orthodontic, periodontic, and/or oral medicine practices, are not required to install amalgam separators, but need to file one-time certifications to establish their exempt status.
• Maintain and operate the amalgam separator system according to manufacturer specifications.
• Use only non-corrosive and biodegradable solutions to clean vacuum system lines. • Recycle all amalgam waste containing mercury. • Ensure that facility staff are informed about procedures for handling waste amalgam, and
that at least one employee is familiar with procedures for operating and maintaining the installed amalgam separator system.
• Keep records to document that the program requirements are being met. As of March 2007, based on electronic certification filings and the estimated number of dental facilities covered by the regulations in the state, more than 80% of MA dental offices are now estimated to be in compliance. MassDEP is continuing to provide outreach to the regulated community to facilitate electronic certification filings and anticipates that the actual fraction of dental offices that have installed amalgam separators and are in compliance is actually higher than this estimate.

Page 6 of 9
Monitoring of mercury levels in wastewater sludge indicates that these efforts have been successful. Since the MA dental sector initiatives were begun in 2004, mercury levels in treated wastewater sludge at the state’s largest publicly owned sewage treatment works (POTW) (which services about 42% of MA’s population) have decreased by about 48% (see FIGURE below). As no other new wastewater mercury reduction programs were being implemented during this period it is reasonable to conclude that this reduction was attributable to reduced mercury inputs from the dental sector. Based on the amount of sludge generated and the fact that all of MWRA’s sludge is reused as a soil amendment/fertilizer, this equates to a reduction in environmental releases of mercury of about 136 pounds per year for this POTW alone. Because the number of dental offices serviced by other POTW’s varies, as does the ultimate disposition of treated sludge (which may be incinerated or landfilled), the MWRA estimate cannot be directly extrapolated to the rest of the state. However, this data conservatively suggests that the overall statewide reduction will likely exceed 150 pounds per year, and could range as high as 200 pounds per year. NEW HAMPSHIRE NH House Bill 1251 – Relative to Dental Amalgam (RSA 485-A:4, XVIII), authorized the NH Department of Environmental Services to adopt rules to further regulate the discharge of dental amalgam from dental offices because of its mercury content. Rules to implement the new authority were adopted in June 2005, and established a compliance deadline of October 1, 2005. The rules require the owner of a dental practice where mercury-containing amalgam is applied, altered, maintained, or removed to certify to the Department that an approved amalgam separator with a minimum 95% removal efficiency has been installed and will be operated in accordance with the manufacturer’s specifications. Certain types of dental specialists are exempt; the exemption covers orthodontists, periodontists, oral and maxillofacial surgeons, oral pathologists, and oral and maxillofacial radiologists who do not generate mercury-containing amalgam waste. Activities to Date and Compliance Status
Yearly Average Mercury levels in MWRA Sludge
00.5
11.5
22.5
33.5
44.5
02 03 04 05 06
Year
Part
s pe
r mill
ion
(ppm
) Pre- MA dental Initiative 2004: MA dental initiative started
MA Dental initiative fully implemented in 2006: 48% reduction

Page 7 of 9
With help from the NH Dental Society, the Department’s Pollution Prevention Program conducted an extensive outreach effort prior to the October 1, 2005 deadline for separator installation and has continued the outreach effort throughout calendar year 2006. Significant efforts have been made to refine the list of licensed dentists to eliminate retired dentists, those who do not practice in New Hampshire, and those who do not handle amalgam. Recently, the focus has been on bringing those active dental practices to which the rules apply, but that have not yet certified, into compliance. New Hampshire has 1,345 licensed dentists, of whom 982 are active. Of these 982, 167 are exempt because of the specialties they practice, leaving 815 potentially subject to the amalgam separator requirement. To date the self-certifications indicate 93% of the 815 dentists are in compliance with the separator requirement. We currently are working with the Department of Health and Human Services and the NH Dental Society to reach out to the active dentists still needing to certify in order to bring them into compliance, along with newly licensed dentists. It is likely that many of these dentists are already associated with a practice that has met the separator requirement, but we are working to verify that. RHODE ISLAND RI currently lists about 720 licensed Dentists. Of this number, approximately 86 dental practices under the authority of the state's largest POTW, the Narragansett Bay Commission (NBC), have completed installation of amalgam separators. This number represents 100% of the required practices in NBC service area. However, since more than half the dentists in the state are not part of the NBC service area, they were not included in this mandatory program. In order to address this issue, in 2006, the RI General Assembly, in an attempt to further reduce mercury pollution in our wastewater, has passed legislation requiring the mandatory installation of amalgam separators in all dental facilities that handle dental amalgam, effective July 1, 2008 (http://www.rilin.state.ri.us/Statutes/TITLE23/23-24.9/23-24.9-9.3.HTM). DEM patterned the statewide program after the Narragansett Bay Commission’s (NBC) best management practices for the management of waste dental amalgam (see: http://www.narrabay.com/Documents/PDFs/NewDentalBMP.pdf). The Rhode Island Department of Environmental Management (RIDEM), in conjunction with the RI Dental Association, encouraged all RI dentists to join the program now by installing an amalgam separator. Our goal is to have all RI dentists on board before the mandatory date of July 1, 2008. In support of this activity, the Department held a public workshop for dentists and dental office staff in the spring of 2006 on the new Dental Amalgam Mercury Recycling program.
Working in partnership with the Department, the RI Dental Association has made special arrangements with a local amalgam separator supplier, to provide dental offices with mercury removal and recovery units at a reduced cost for an introductory period. Services offered include assistance with installation the process from start to finish, including plumbing, packaging, labeling, recycling and transportation.

Page 8 of 9
As part of the process, RI dentists are required to fill out an annual report and a brief self-certification survey. These documents can be completed electronically and can be found with other information on Mercury in Dental Amalgam on the RIDEM website at: http://www.dem.ri.gov/topics/mercury.htm. VERMONT In 2005, Vermont passed legislation requiring the installation of amalgam separators (95% or greater removal efficiency) by most dental practices placing or removing amalgam, effective January 1, 2007. Endodontists, periodontists, orthodontists, and oral and maxillofacial surgeons are exempt from the requirement. Vermont law also requires compliance with dental best management practices developed by the Agency for the proper handling and reduction of amalgam releases to the environment. All dental practices are required to file self-certification forms every other year, starting January 2007, indicating compliance status with the BMPs. The self-certification forms also require information on the amalgam separator (if required) and ongoing maintenance (see www.mercvt.org). An approved list of amalgam separators is maintained by the Vermont DEC. In 2002 and 2003, DEC conducted a pilot amalgam separator project with installations of six different commercially available separators. The report was made available to all dental practices to assist in selection of an appropriate amalgam separator. To date, 175 separators have been installed, which represents an approximate 83% compliance rate for those practices required to install separators. The Vermont State Dental Society has actively educated its members on the amalgam separator requirement and the need to follow best management practices for the handling of all amalgam waste. EASTERN CANADIAN PROVINCES QUEBEC No change from 2005 NEW BRUNSWICK A Letter of Understanding between the New Brunswick Department of the Environment and the New Brunswick Dental Society was signed to promote better management of dental amalgam waste. There are a total of 279 dental practices in New Brunswick and as of February 2007, 223 (or 80%) of these dental practices have installed amalgam separators. New Brunswick also participates in the Canada-Wide Standards process through the Canadian Council of Ministers of the Environment (CCME), which includes a standard on mercury for dental amalgam waste.
Page 9 of 9
NEWFOUNDLAND/LABRADOR 100% compliance achieved. NOVA SCOTIA In 1999, The Nova Scotia Dental Association signed a Memorandum of Understanding with the Nova Scotia Department of Environment and Labour (NSEL) to cooperate on implementing the principles of pollution prevention into dental offices. Recent discussions with the Nova Scotia Dental Association indicated that their membership is near the 100% mark for installing compliant dental amalgam separators. Dental suppliers have also been vigorously promoting the use of amalgam separators in the last 2-3 years. To assist it's members, the Nova Scotia Dental Association also maintains a website which includes the following information related to mercury management:
• a link to the Canadian Council of Ministers of the Environment (CCME) Canada- Wide Standard on Mercury,
• a list of providers of ISO11143 certified amalgam separators (including contact information, approximate price and thumbnail specifications)
• A document entitled *Best Management Practices for Hazardous Waste Disposal*. This document, which was developed in consultation with NSEL, includes guidance for the management of mercury containing wastes.
PRINCE EDWARD ISLAND In 2006, there were a total of 64 dentists licensed to practice in P.E.I. and there are a total of 34 dental clinics in P.E.I. that perform mercury amalgam restoration work. P.E.I. is a signatory of the CCME Canada-wide Standard on Mercury for Dental Amalgam Waste, which required dentists to achieve a 95% reduction in mercury releases from dental amalgam discharges to the environment by 2005. To date, 95% of dental clinics in P.E.I. have installed dental amalgam separators and our Department is working with the remaining 5% to ensure compliance is achieved in the near future. Inspections of all dental offices were conducted in the spring of 2006 to confirm the installations of separators and to inquire as to the disposal methods of waste amalgam. These inspections showed that only 11 offices were disposing of waste amalgam in a proper manner. The remaining 23 offices were using various methods, including disposal in sharps containers and regular waste. In July, the P.E.I. Dental Association informed members of the proper manner to dispose of dental amalgam waste.

SECTION III.b
Mercury Program Progress Report on School Cleanouts
SCHOOL CLEAN-OUT SUMMARY Goal: 50% of High Schools in the region cleaned out by the end of 2007
The region has focused considerable effort to get mercury out of schools. Jurisdictions that have not previously completed school mercury clean-outs have been working diligently to make progress in this area, as detailed below. While the Canadian provinces have previously addressed this problem and consider most of their schools “mercury free,” several of the New England states are still working toward this goal. Some states are severely challenged by resource limitations but despite the challenges, progress has continued and states are working diligently to catch up with their Canadian counterparts.
NEW ENGLAND STATES
Connecticut The DEP coordinated a school cleanout pilot program in 2000 which resulted in the removal of 75 pounds of mercury and mercury compounds from six (6) schools. While conducting the pilot cleanout, the DEP established a list of schools that had indicated an interest in having a cleanout. When additional SEP money became available in 2002, an additional 37 school were selected to receive funding for a cleanout. DEP did not turn away any school that expressed an interest in the program and met the participation criteria. As part of the program, it was made clear that the cleanout was for classroom chemicals and not maintenance supplies, used oil, or pool supplies. Participating in the cleanout program committed the school to surrendering all elemental mercury, mercury compounds, and all mercury containing instruments such as barometers and thermometers. The “second” cleanout resulted in an additional 156 pounds of elemental mercury, 75 pounds of mercury compounds, 1 gallon of liquid mercury compounds, 1447 lab thermometers, and other various mercury instruments and toxic chemicals being removed from the schools. In addition to mercury containing products, other hazardous chemicals such as toluene, carbon tetra chloride, sodium metal, magnesium metal and benzene were removed from the schools. Any school participating in the cleanout program also agreed to attend a training session for managing hazardous chemicals and not to purchase any similar mercury or other hazardous chemicals. Although the DEP has not actively promoted any mercury cleanouts for schools since 2002-03, the agency will continue to work with schools on the proper management of lab chemicals, including the purchase and storage of such chemicals. Many schools have heeded the message – remove the dangerous lab chemicals before an expensive lesson is learned.

Massachusetts As of 2006, approximately 244 public high schools, representing approximately 70% of MA public high schools, have completed mercury cleanouts. More than 30 middle and 30 elementary schools in MA have also participated in mercury cleanouts. In total these cleanouts are estimated to have collected over 2,400 pounds of mercury. Massachusetts’ efforts to eliminate unnecessary mercury in schools were significantly enhanced with the adoption in July, 2006 of the Massachusetts Mercury Management Act, which included a prohibition on the purchase of mercury by schools for educational purposes. This provision provides a legal backstop that will prevent the potential repurchase and use of mercury-added educational materials by schools that have undergone mercury cleanouts through ongoing MA programs. In MA, schools have conducted mercury cleanouts through several mechanisms including programs sponsored by the state’s municipal solid waste incinerators (MSWCs), which under MassDEP regulations are required to implement mercury source separation plans (MSSP) in their waste-sheds; through a program managed by NEWMOA that targets communities not eligible for the MSWC MSSPs; and by regional, community and school specific efforts. These programs are summarized below.
MWSC Source Separation Plans. Under MA regulations, the state’s MSWCs are required to implement mercury source separation plans in their service areas. Mercury education and collection programs targeting schools have been included in all of these plans. As of the end of 2006, more than 71 school mercury cleanouts have been conducted through these programs and over 735 pounds of mercury was collected.
MassDEP-NEWMOA Mercury School Cleanout and Education Initiative. Beginning in 2001, the Massachusetts Department of Environmental Protection and the Massachusetts Executive Office of Environmental Affairs have contracted with NEWMOA to conduct school mercury cleanouts and education. As previously summarized through this contract NEWMOA developed mercury outreach and education materials for students, faculty and administrators including a series of individual fact sheets for specific school staff members (e.g., facilities manager, science chairperson, medical personnel) on the items that may contain mercury typically found in their program areas and information for the school administrator (“Getting Mercury Out of Schools: Why it’s a problem. Where it is. What to do.”) A mercury inspection and cleanout protocol and information on alternatives to mercury-added instruments and other educational products commonly found in schools was also developed (“Identification of Mercury Devices in Schools”; “Case Study on Mercury Elimination from Bay

Path Vocational Technical High School, Charlton, Massachusetts”). These materials were used to guide school mercury programs and have been shared with other states. Over fiscal year 2006 NEWMOA worked with 20 schools (12 high schools and 8 middle or K-8 schools) to identify, collect, and recycle elemental mercury and mercury-containing products. The total amount of mercury collected in fiscal year 2006 was 100 pounds. Since the inception of this program in 2001 NEWMOA has completed mercury education and cleanout programs at 85 high schools and over 50 middle and elementary schools. In total, over 1,077 pounds of mercury have been collected through this effort with the typical amount of mercury removed per high school ranged from 9-14 pounds, with some containing much more. The 2006 high school cleanouts netted considerably less mercury, averaging about 5.3 pounds per school, suggesting that school mercury awareness has increased. In addition to the school cleanouts, participating schools also received a limited number of non-mercury replacements for equipment removed. Schools agreed in writing to not purchase mercury added classroom equipment in the future. In addition, hundreds of teachers, schools administrators, nurses and students have been educated about the health and environmental hazards of mercury and the importance of preventing future use of mercury in schools.
Other Efforts. An additional 63 school cleanouts have been completed by the MA regional recycling centers SCRAM and CET, and by individual schools and school districts including Boston. Mercury recovery values were not available for many of these local cleanouts. However, based on a conservative average recovery value estimate of about 10 pounds of mercury per high school, MassDEP estimates these cleanouts collected about 630 pounds of mercury, overall.
Maine
The Maine Department of Education estimates that 125 out of Maine's 207 high schools (58%) have had clean outs of mercury containing products within the last 5 years. The Maine Department of Education continues to work on school cleanouts that include middle and high schools and collects mercury as well as other outdated and unused school chemicals. Maine DEP website information is provided to assist schools and includes a sample chemical hygiene plan and a detailed inventory list. http://www.maine.gov/dep/mercury/school.htm.
New Hampshire NHDES estimates that greater than 50% of NH schools have been cleaned out to date. NH’s Plymouth State University (PSU), through a Supplemental Environmental Project has allocated $90,000 for school clean-outs, including mercury. In 2006 PSU did outreach to a number of schools and found that most of them had already removed mercury from their classrooms. One high school was found to have 25 pounds, which

was removed and recycled. NHDES has obtained funding through a settlement agreement to clean out mercury in schools in the Connecticut River Watershed. There are over 100 middle and high schools in this geographic area, and outreach to these schools will begin later in 2007. In addition, another fifteen schools were cleaned out in 2006, yielding 266 pounds of mercury, bringing the total (including PSU efforts) to 291 pounds of mercury removed from sixteen schools in 2006. New Hampshire prohibited the purchase of mercury or mercury-added compounds by schools beginning July 1, 2001. Rhode Island Seventeen high schools have participated in the Chemical Safe Schools Program. Grants from the Centers for Disease Control and Prevention and the US EPA Region I office funded the removal of unwanted hazardous chemicals from schools. The goals of the program are to ensure that all schools manage their chemicals responsibly and comply with the August 2005 deadline that restricted use of over 400 chemicals in schools. While the total amount of mercury by weight is not available for these cleanouts, mercury and mercury-containing items has been a significant portion of the waste stream that was collected from schools. Schools have also been the target of increased outreach and several workshops directed at science teachers and maintenance facility staff in our schools. Training included session specifically on mercury prohibition and mercury management and requirements for mercury-added items such as lamp disposal. Vermont The Vermont Department of Environmental Conservation sponsored and funded a school science laboratory chemical cleanout project in 1999-2001 for high schools and middle schools. The main objectives of this project were to:
• Dispose of the current chemicals that were outdated, extremely hazardous, or present in excessive quantities.
• Reduce the amount of hazardous chemicals purchased, used, and disposed in school labs.
• Encourage school science labs to remove all mercury compounds and mercury-containing equipment and to discontinue further mercury use.
• Educate science teachers on the proper handling, storage, and disposal of hazardous chemicals.
Schools were assisted with chemical inventorying (of mercury and other laboratory chemicals), chemical disposal (at no cost to the school), and establishing safe chemical storage systems. In addition to one-time lab chemical cleanouts at participating schools, the program involved teacher training workshops on lab chemical management. Lab chemical management plans describing lab chemical purchase, use and disposal procedures were part of the training and were required of all participating schools.

A total of 83 middle and high schools were cleaned out (representing over 50% of the Vermont student population). Removal of 156 pounds of mercury was accomplished as a result of this project. The full project report is available at www.mercvt.org/resources/hgpubs.htm#schools.
EASTERN CANADIAN PROVINCES Prince Edward Island The P.E.I. Department of Education conducted a mercury and hazardous waste clean out of all schools on P.E.I. in 2002. Schools now participate in regular hazardous waste disposal collections with licensed disposal companies. New Brunswick Mercury and its compounds have been banned from schools in New Brunswick since 1991. Between 1991 and 1994, the Department of the Environment assisted the Department of Education in arranging for a province-wide collection of banned chemicals from schools. A telephone survey conducted in January 2007 confirmed that mercury is not being used in New Brunswick schools. The clean out of mercury from schools is considered complete in the Province of New Brunswick. There are 86 high schools in New Brunswick. Nova Scotia Nova Scotia has conducted two province wide unwanted school laboratory chemical clean-out during the past fifteen years. The last was conducted approximately ten years ago. Since that time general clean-outs have occurred in some school boards, however, that has been a board decision. The province wide clean-outs were not done specifically for mercury, however, mercury was recovered. Unfortunately quantitative data is not available. These were done by the Department of Education with assistance from the Department of the Environment. All costs were covered by the Department of Education. The Nova Scotia Department of Education has published a Science Safety Guidelines which clearly states the Department position on mercury and mercury compounds in school laboratories. An electronic copy is available from the office of the Conference of New England Governors. Specifically with respect to mercury the Guidelines state:
• that, unless otherwise approved in the Guidelines, mercury and its compounds are on the list of chemicals that are restricted or prohibited by the Department of Education.
• that any mercury approved to be present in schools is to be permanently sealed and used
for display purposes only.
• that disposal of any of the mercury that is approved to be in schools be through a hazardous waste disposal company .
• that teachers have a responsibility to provide instruction to students on the safe handling of laboratory chemicals including mercury.
• that school boards have a responsibility to provide in-service training so that staff may
increase their chemical safety knowledge in order to provide a safe working and learning environment.
Because of the position of the Department of Education, science experiments using mercury or mercury compounds are not done. The Department of Education and the Department of Environment and Labour have agreed to work jointly on an initiative that will see a province wide clean-out of any mercury and mercury compounds in the near future. In addition educational material on mercury and mercury compounds will be provided to students. Newfoundland & Labrador Since 1998, 113 kg (249 lbs.), of mercury have been collected from schools for proper disposal. Quebec In 2003, the MDDEP consulted the Quebec school commission. The survey was filled out by 36 school commissions from the 73 in Quebec (representing 1515 schools). The principal conclusion was that 86% of the school commissions that have inventoried mercury in their establishments have eliminated it appropriately. This shows that schools were informed about good management of mercury in the past.
SECTION III.c
Mercury Program Summary of Education & Outreach Initiatives
OUTREACH AND EDUCATION SUMMARY
All jurisdictions in the region have very active outreach and education programs related to mercury. The following summarizes jurisdictional programs and highlights one important effort in each state and province. Connecticut Summary: Dental office BMPs for mercury amalgam were revised to include stronger “good housekeeping” practices for dental offices.
In an effort to get the DEP mercury amalgam initiatives distributed to all newly licensed
dentists, DEP is developing a partnership with the Department of Public Health. An information packet, prepared by the DEP, to be distributed to all newly licensed dentists by the Department of Public Health will include:
• a copy of a general information summary page; • a copy of the revised dental amalgam BMPs; • a copy of the “Initial Certification Form” for installation of amalgam
separators and compliance with the BMPs; • a copy of the “Notification of Change Form” for dental offices that move
the practice location or replace an amalgam separator; • a copy of the brochure on dental fillings; and • a copy of X-Ray and Ionizing Radiation Sources Registrations fact sheet.
Website. The Department has undertaken a significant effort to revise and update all its mercury related information on the agency website. Fact sheets, forms, and related links were revised to reflect current information, program requirements, agency policies and website addresses. Information was sorted into user-friendly categories such as manufacturers, individuals/families/consumers, schools, dental offices, hospitals, and the auto recycling industry. Each identified category contains agency specific information (i.e., fact sheets, forms, guidelines, CFL initiatives, etc.) as well as other related mercury links (i.e., Department of Public Health, EPA, ELVS, etc.). CFL Initiatives. The Department is working with various groups to promote the use of CFLs, including mercury content, benefits and proper recycling of spent lamps. A table top display promoting the use of CFLs was developed, in conjunction with NEWMOA, and is currently being used at Earth Day Fairs an other similar activities. Meetings have been held with utility companies in an effort to gain their assistance in the effort to disseminate information on the benefits and proper disposal of CFLs. The agency is also working with municipalities in an effort to expand the number of collection points utilized for the recycling of spent CFLs.

Program Highlight: The revised mercury amalgam BMPs expand the scope of the BMPs to include more than just the installation and maintenance of an amalgam separator and the proper recycling/disposal of used mercury amalgam. For example, dental offices placing mercury amalgam fillings are now required to post a brochure that examines the possible benefits and disadvantages of different types of tooth filling materials. In addition to providing maintenance practices for amalgam separators, the BMPs also provide guidance on the cleaning of wastewater pipes and/or vacuum lines. Protocols are included for cleaning or replacing plumbing parts, particularly when sludge inside the pipes could contain mercury. A more detailed description of proper record keeping, including what records need to be maintained on site, is provide in the revised BMPs. Maine Summary: The Maine Department of Environmental protection provides mercury outreach, information and assistance through website information, facts sheets, videos, reports, posters, brochures and phone.
Maine businesses have been required to appropriately recycle mercury added products since July 2002. The requirement for recycling was extended to homeowners effective January 2005. Outreach and education includes print and website material as well as workshops and training including.
Maine DEP staff continues to conduct 8-10 workshops/year with municipal solid waste and recycling staff on Universal Waste rules. Mercury added products are the majority of Maine's universal waste stream.
The Maine Public Utilities Commission's Efficiency Maine Program works with over 300 lighting retailers in Maine to distribute energy efficient compact fluorescent lamps (CFLs) to consumers in the State. Efficiency Maine contractors train store clerks on the value provided by CFLs as well as the appropriate manner in which to dispose/recycle the lamps. Materials describing appropriate methods are distributed to store personnel and described to them in regular trainings of retail clerks conducted by Program personnel. These materials and their content were collaboratively developed by Efficiency Maine and Maine DEP staff.
With increased awareness on the part of the average consumer on mercury and its hazards the department continues to receive calls from homeowners on appropriate end-of-life management of numerous mercury items. It is interesting to note that in 2005 the Department fielded calls from 6 homeowners with a total of 23.4 lbs of elemental mercury needing appropriate disposal. Continued calls of this nature are expected.
Program Highlight:
Fish advisory information is website available from the Maine Center for Disease Control http://www.maine.gov/dhhs/eohp/fish/documents/MeFFGuide.pdf. The brochure is currently being delivered to all health care providers who deliver babies in the state. It is also being distributed through In Maine, the Women, Infant and Children (WIC) Nutrition Program who provides assistance to approximately 40% of all pregnancies in the state. A major supermarket in the state of Maine (Hannafords) has also agreed to pilot a distribution system within their stores at the fish counter. Evaluation of our efforts is being done through direct surveys to pregnant women and through questions added to the yearly Pregnancy Risk Assessment Monitoring System (PRAMS) an on-going, population-based surveillance system for pregnant women. Massachusetts
Summary: MA DEP has continued outreach and education efforts to the state’s dental sector relative to the regulations adopted in 2006 requiring the use of amalgam separators and best management practices to reduce mercury pollution. These efforts have involved mailings; outreach through the Massachusetts Dental Society; presentations at the Yankee Dental Conference and updated and expanded web-based information. An additional area of MassDEP focus has been to educate stake-holders about the 2006 MA Mercury Products Law. Communications have been targeted to manufactures believed to be selling mercury-added products in MA (1,843 letters); lamp manufacturers/distributors (122 letters); vehicle recyclers (240 letters); public school superintendents (248 letters); public school business officials (325 letters); and private schools (623 letters). In addition, a number of stakeholder meetings have been held and extensive web-based information developed and posted. The State’s municipal solid waste combustors, which are required to implement mercury source separation plans, have also continued outreach about mercury in their service communities. Program Highlight: Of particular note due to its ability to reach large numbers of people, the New England Aquarium, based in Boston, has expanded their mercury education efforts to better educate their 1.3 million annual visitors. The Aquarium has deployed an interactive 4-panel exhibit on mercury, which is on permanent display at the Aquarium’s main building. Additional mercury information has also been developed and made available on the Aquarium’s web site (www.neaq.org/scilearn/mercurystory). Lastly, the Aquarium developed a film short, “Mercury Pollution and Renewable Energy” that is currently being shown as an introduction to their extensive IMAX film showings in the Simons Theater.
New Hampshire Summary: Web Pages, Fact Sheets, Publications NHDES continues to maintain and enhance comprehensive mercury webpages which cover topics from NH’s mercury reduction strategy to products requirements and various sector initiatives including dental, healthcare, motor vehicle /appliance salvage, HVAC, schools and homeowners. Recent updates / additions include mercury reduction efforts in the Connecticut River Valley for farmers & dentists, and information for homeowners. Sector Outreach NH also continues to work with various sectors on mercury reduction including healthcare, dental, motor vehicle / appliance salvage, construction trades, schools & universities, public agencies and homeowners. Specific outreach programs for these sectors are covered in the source reduction, recycling and safe waste management section. Fish Consumption Advisory Outreach Women’s healthcare provider outreach In October of 2006, DES received an EPA Healthy Communities grant to improve the women’s mercury outreach effort. DES currently distributes our fish advisory brochure "Is it Safe to Eat the Fish We Catch?" to newly pregnant women via health care service providers (approximately 500/month). Although State and Federal guidance advises pregnant women to limit their intake of certain saltwater species and freshwater fish due to mercury content, it is important for women continue to eat fish during pregnancy because fish are the major dietary source of the omega-3 fatty acids essential to healthy fetal development. Unfortunately, due to mercury warnings, some pregnant women have decided that it is safer to avoid eating fish. The new brochure, expected to be distributed in September 2007, will be designed to correct the risk perception of mercury and fish consumption and evolve the understanding of the advisory message from “don’t eat fish” into “eat healthy fish”. Commercial fish consumption advisory poster for supermarket fish counters In collaboration with the New England Interstate Water Pollution Control Commission and the Toxic Metals Program at Dartmouth, DES has assessed the communication effectiveness of several posters for display at supermarket fish-counters. Demographically varied focus groups were surveyed and the results are currently being analyzed at Dartmouth. With the cooperation of the New Hampshire Grocers’ Association, we hope to display the poster that is produced at the approximately 750 supermarket fish counters in NH. A prototype poster will be presented to the Grocers’ Association for feedback in the near future. Program Highlight: Mercury in dental amalgam

During the summer of 2006, the DES coordinated with the Attorney General’s Office, the NH Dental Board and the Department of Health and Human Services’ Dental Director to revise the brochure, mandated by state law, which is targeted to dental patients to communicate the risks and benefits of mercury-containing dental amalgams. The dental board distributed a revised brochure in December, 2006 which included a paragraph on environmental impact of mercury in dental amalgam. To supplement the information provided to patients by the dental board, DES has developed a fact sheet that presents a balanced discussion of the risks and benefits, which will be posted on the NHDES website. Rhode Island Summary: During the past two years RI has accomplished several Mercury Outreach and Education activities. We have held 2 school training sessions that have sections focused on mercury removal from schools, 2 workshops on dental amalgam management for the dental sector and one seminar for auto recyclers on auto switch removal and management. We have produced one TV segment on mercury in dental offices for an edition of a weekly RIDEM EarthWatch edition. In coordination with the NEWMOA Lamp Workgroup, we have participated in one workshop and have sent mailings on fluorescent lamp recycling and management to over 300 RI property management companies and approximately 125 RI Tanning salons. In coordination with the RI Department of Health we continue to distribute guidance and informational literature at the approximately 5 public mercury-added product collection events run each year in various RI cities and towns. Additionally, in coordination with RIHealth and Brown University we have completed a study on fish consumption in the local Southeast Asian community and have sponsored 3 outreach and educational opportunities at local Southeast Asian health fairs and religious events, using members of the local community as well as Cambodian, Laotian and Vietnamese language brochures to reach the non-English-speaking population. In another project, in we have recently participated in a conference meant to kick-off a larger RI project dedicated to the Greening of RI Hospitals. Program Highlight: The Greening of Hospitals project is one that was brought to us by the RI United Nurses and Allied Professionals. This group has been very concerned about the many toxic substances that they are exposed to in their daily workplace and they have expressed a need for assistance with education and outreach for their specific needs. In cooperation with Region I USEPA and Hospitals for a Healthy Environment, 2 sessions were recently held for this group at a local hospital to discuss issues including:
• What are some toxins in the health care environment that are of potential concern?
• What can a hospital do to improve worker safety relating to toxins in the work environment?
• What are the benefits to an environmental commitment by hospitals?
• How can you, as a health care worker, get involved with environmental issues in your workplace?
The sessions were very well attended and participants were especially interested in hearing about the latest mercury product phase-outs and how they can limit their own exposure to mercury-added products by changing some of their practices and advocating for green cleaning products. We believe that this is the beginning of a more comprehensive program in our hospitals and look forward to working with this group again. Vermont
Summary: Vermont maintains a web site on mercury programs and initiatives, including publications, videos, reports, fact sheets, and sector-specific mercury reduction information. Two major media campaigns were conducted in 2006 to promote residential and business recycling of spent fluorescent lamps and bulbs. Newspaper and radio ads promoted proper recycling. A direct mailing of a lamp recycling brochure was mailed to over 20,000 Vermont businesses and several electrical utilities provided lamp recycling information through newsletters and customer billings. These efforts were funded through an EPA lamp recycling outreach grant. Through an EPA grant, Vermont has been providing outreach to sensitive populations on mercury in fish. Over 20,000 mercury-in-fish posters and brochures were distributed in 2006 through healthcare providers to educate Vermonters about fish consumption advisories and eating fish low in mercury. A voluntary effort was initiated to encourage grocers to display mercury-in-fish posters at fish counters. Approximately 1100 posters were distributed through the Vermont Grocers’ Association. A two-year survey of parents of newborn babies is being conducted to ascertain whether a mother, during her pregnancy, knew about fish consumption advisories and potential changes fish consumption patterns due to knowledge of the advisories. A final report will be prepared in 2008. Program Highlight: Mission Mercury Video and Game A 20-minute animated mercury video game for eighth grade students was developed in collaboration with Champlain College in Burlington. Teacher materials are being developed and the video (available in VHS and DVD) together with companion video games will be distributed in 2007 to Vermont schools. The video and games will also be available at www.mercvt.org for web-based access. EPA Region 7 is modifying the

video to include a shorter version and a closed-captioned version for the hearing impaired. Funds for the project were provided by EPA.
Newfoundland & Labrador Summary: Development of an Atlantic Canadian School Safety Manual (Lead - Department of Education). Program Highlight: Addressing Mercury and Mercury Containing Chemicals in School Laboratories. New Brunswick Summary: The New Brunswick Department of Natural Resources publishes an annual fishing guide for recreational angling. Included in the fishing guide is a fish consumption advisory regarding mercury contamination of freshwater fish. The New Brunswick Department of Environment maintains a mercury website. This website contains information on New Brunswick’s Mercury Action Plan as well as progress reports on the implementation of the plan. New Brunswick participates in the Canada-Wide Standards process through the Canadian Council of Ministers of the Environment (CCME). The mercury website provides information on New Brunswick’s implementation of the Canada-Wide Standards for mercury. Program Highlight: Progress reports on the implementation of the Mercury Action Plan are provided on New Brunswick’s mercury website. The internet address for this site is: http://www.gnb.ca/0009/0355/0009/0001-e.asp.
Prince Edward Island Summary:
• Island Waste Management Corporation (IWMC) is the provincial Crown Corporation that administers and provides solid waste management services throughout Prince Edward Island.
• Domestic and commercial waste is separated at source into compost, waste or recyclables. Construction and demolition debris is disposed of at sites approved under the Waste Resource Management Regulations and household hazardous waste are accepted at "Drop-off" centers.
• This program serves to make the public aware of proper disposal methods and to ensure that hazardous materials, like mercury containing products are disposed of properly.
Québec Summary: In order for the population to profits from the nutritive contributions of fish from sporting fishing while being protected from the possible toxic effects of the contaminants present in several species, a program to measure mercury in fish from the sites of fishing is done by the MDDEP. The information is available for the population in the Guideline of consumption of fish from sporting fishing out of fresh water available in electronic version since April 2006 on the Web site of the MDDEP. Program Highlight: This new electronic version is more convivial. This new version contains certain data on the mercury contents in fish, which were obtained from Hydro-Quebec reservoirs. This guideline included 849 sites of fishing in Quebec and nearly 40 fish species. It informs about the consumption of fish of sporting fishing according to the species and their size. This new electronic version should be easier to update.

SECTION III.d
Mercury Program Update on Source Reduction Programs
SOURCE REDUCTION, RECYCLING & SAFE WASTE MANAGEMENT
The mercury pollution prevention principles endorsed in 2000 are being
vigorously pursued in the region. The New England states have focused on efforts to adopt and implement legislation and other pollution prevention programs to address mercury-added products and substantial progress has been made. In the Eastern Canadian provinces the principles are being implemented through jurisdictional programs and through the Canada-wide Standards process. In addition, Environment Canada has recently begun work on a Risk Management Strategy for mercury products that is likely to have similar restrictions on products such as: prohibiting products for which mercury-free alternatives exist, prohibiting the introduction of new mercury-containing products and extended producer responsibility.
NEW ENGLAND STATES CONNECTICUT Mercury legislation – 2006 The 2006 Connecticut General Assembly was very active passing new mercury legislation. A summary of the legislative initiatives is as follows:
• Mercury enforcement/penalty provisions passed. The legislation establishes specific penalties for violating the laws governing the sale, distribution, labeling, and collection of mercury and mercury-added products. It authorizes the DEP commissioner to issue, modify, or revoke orders to correct or abate any violations. Anyone who violates any provision of the solid waste management laws or any regulation adopted governing the sale, distribution, labeling and collection of mercury and mercury-added products may be subject to such an order.
Whenever the commissioner believes anyone is engaged in, or about to engage in, any act, practice, or omission that violates, or would violate, the mercury laws or regulations, the commissioner may ask the attorney general to file an action against such person. The bill subjects anyone who violates any law, regulation or order governing mercury to a fine of up to $25,000 a day per offense. Anyone who intentionally makes a false written statement under oath or on a form that states false statements are punishable is guilty of a class A misdemeanor, and subject to a $2,000 fine and up to one year in prison.
• Button cell batteries. Starting July 1, 2011, the new legislation bans the sale and distribution for promotional purposes of button cell batteries containing mercury or any product that contains such batteries. Manufacturers of mercury button cell batteries or products containing such batteries are responsible for advising retailers about the ban and how to legally dispose of their remaining inventory.
• Fluorescent lights and high intensity lamps must have an “Hg” placed on the
lamps. The bill which previously required manufacturers of fluorescent and high intensity discharge lamps to label the packaging that contains the lamp was amended to require the manufacturers of such lamps to place the symbol “Hg” on each lamp.
• Ban on the sale and distribution of high intensity discharge lamps. Current law
bans the sale or distribution of products containing more than 100 milligrams of mercury starting July 1, 2006. The bill exempts high intensity discharge lamps containing between 100 milligrams and 1 gram of mercury, including metal halide, mercury vapor, mercury capillary, mercury-xenon short arc and mercury short-arc lamps through July 1, 2013.
• Universal waste exemption for mercury containing equipment passed. The bill
requires any waste from equipment containing mercury to be disposed of or otherwise handled in accordance with federal regulations until such time the agency adopts its own regulations. The regulations are to govern the disposal and handling of waste from equipment containing mercury.
Automobile Switch Recycling During 2006, the department actively participated in national conference calls involving the roll-out of the National Vehicle Mercury Switch Recovery Program (NVMSRP). Preliminary details of the program indicated that Connecticut auto recyclers would be able to begin participating in the program during the second quarter of 2007 (April – June). During the later half of 2006, DEP staff met with Connecticut auto recycling representatives to discuss the NVMSRP and when it would take effect in Connecticut. The auto recycler representatives expressed a strong desire to initiate the program before April 2007. To this end, DEP staff worked with representatives from the Connecticut auto recyclers and End of Live Vehicle Solutions (ELVS), a not for profit corporation formed by the automobile manufacturers to provide educational materials and collect and recycle mercury-added automotive switches. The results of this collaborative effort is that Connecticut automobile recyclers were able to begin participating in the program as of February 27, 2007. MASSACHUSETTS Mercury-Products Legislation Signed into law in July 2006, an Act Relative to Mercury Management (Chapter 190 of the Acts of 2006, also known as the “Massachusetts Mercury Management Act”) is designed to keep mercury out of trash and wastewater, where it may ultimately be released into the environment. This comprehensive law uses a phased approach, focusing first on the largest and most preventable contributors to mercury pollution attributable to
product use and disposal. The law requires manufacturers of products containing mercury to collect “end of life” products and to recycle the mercury; phase-out the sale of many products containing unnecessary mercury; label mercury-added products; and notify an interstate clearing house about products containing mercury that are being sold. The law also establishes specific requirements for mercury in vehicles and for lamps that contain mercury, and provides manufactures flexibility to implement effective recycling programs to meet performance based recycling targets for these products. The general requirements of this law include the following:
Manufacturers must notify MassDEP of the Mercury Content in Products Sold or Distributed in Massachusetts. Starting in 2006, manufacturers of mercury-added products offered for sale in Massachusetts must identify the components of their products that contain mercury, and the amount of mercury in them. Notifications must be submitted to the Interstate Mercury Education and Reduction Clearinghouse (IMERC), which receives and manages them on behalf of a number of states that have adopted similar provisions.
Manufacturers Must Establish Collection/Recycling Systems for “End of Life”
Products Containing Mercury. Manufacturers of products to which mercury has been intentionally added and that are sold in Massachusetts must establish a system for collecting them at the end of their useful lives, and for recycling their mercury content.
Many measuring devices that contain mercury cannot be sold in Massachusetts after May 1, 2008. These include:
• Thermostats; Barometers; Esophageal dilators, bourgie tubes, and gastrointenstinal tubes; Flow meters; Hydrometers; Hygrometers and psychrometers; Manometers; Pryrometers; Sphygmomanometers; Basal thermometers
Switches and relays that contain mercury cannot be sold in Massachusetts after May 1, 2009.
Limited exemptions to these sales bans are allowed.
• The sales bans do not apply if the use of a product is a federal requirement; or,
• If a specific exemption is obtained from MassDEP. To obtain an exemption, a manufacturer must demonstrate: The product benefits the environment or protects public health or safety; There is no technically feasible alternative to the use of mercury in the product; A “non-mercury” alternative is not available at a reasonable cost; and, There is a system in place to collect the “end of life” mercury product and recycle the mercury content.
Mercury thermometers that are determined to be medically necessary may also continue to be sold in Massachusetts. Please note: Chapter 39 of the Acts

of 2002 banned the sale of mercury fever thermometers in Massachusetts unless specifically prescribed by a physician.
Disposal of Mercury-Containing Products in Trash and Wastewater is
Prohibited. The law bans the disposal of products containing mercury in trash, starting May 1, 2008. The law also establishes that, starting October 26, 2006, mercury from these products cannot be discharged into water or wastewater unless the discharge complies with federal, state and local requirements.
Mercury-Added Products Must be Labeled. Starting on May 1, 2008,
manufacturers of products that contain added mercury must label them, so that users will know that the products need to be recycled at the end of their useful life or disposed of as hazardous waste. This requirement does not apply to refurbished medical equipment or products in which the only mercury component is a removable mercury-added lamp or button cell battery.
Requirements for Mercury Switches and Other Vehicle Components Were
Established. • The sale of cars made after January 1, 2007 with mercury-containing
switches, is prohibited; • Non-mercury switches must be used if replacement is necessary; • Mercury-added components must be removed from vehicles before they are
crushed and/or shredded; • Auto manufacturers must implement plans for collecting and recycling
mercury switches. The law allows vehicle manufacturers to implement “alternative” collection plans that do not include financial incentives for vehicles recyclers, provided that these plans start implementation by January 1, 2007, and capture 50 percent of the mercury switches in “end of life” vehicles in the Commonwealth by December 2007, and 90 percent by December 2008. If the alternative programs fall short of these targets, manufacturers must implement programs that pay $3 for each switch removed by vehicle recyclers.
Manufacturers of lamps that contain mercury must implement a plan for
educating users about recycling “end of life” lamps. The law also establishes recycling targets for mercury-containing lamps.
• If recycling efforts do not meet these targets, the law requires lamp manufacturers to provide up to $1 million per year to MassDEP for grants to municipalities and/or regional authorities to enhance the collection and recycling of mercury-containing lamps. The targets include
1. 30 percent by December 2008, 2. 40 percent by December 2009, 3. 50 percent by December 2010, and 4. 70 percent by December 2011 and each year thereafter.
Schools Cannot Purchase Mercury-Containing Products for Classroom Use. Starting on October 1, 2006, Massachusetts schools cannot purchase mercury-added instructional equipment and materials. The law allows an exemption for measuring devices for which there are no adequate mercury-free alternatives.
Healthcare Facilities May Request Information About Mercury Content in
Products. To help healthcare facilities comply with the law’s ban on discharging mercury in wastewater and disposing of mercury-containing products in trash, the law requires manufacturers of mercury-added formulated products to disclose their products’ mercury content in response to a written request for this information from a health care facility.
Implementation Status MassDEP is informing manufacturers, distributors and retailers of products that contain mercury about the requirements of this law through direct mail, its Web site and by working with trade associations and IMERC. Regulations are being developed and will be finalized over the next several months that will establish requirements and performance standards for the mandatory vehicle switch collection/recycling programs, and for collection/recycling programs for other products containing mercury. Regulations will then be developed to establish the process for obtaining exemptions from the law’s sale bans; to clarify product-labeling requirements; and to implement the ban on the disposal of mercury-containing products in solid waste. MAINE
Maine Department of Environmental Protection’s motor vehicle mercury switch removal program statute was again amended in 2005 to clarify the mercury switch bounty and the requirement of the VIN for receipt of a bounty, a requirement set as a condition in the automobile compliance plan. The MEDEP sent several mailings to inform the yards of the new requirements and to inform them of a legislative resolve to allow yards to turn in switches without reporting a VIN in a 45 day grace period and they would receive a $3 bounty payment. After that 45 day grace period the switches must be logged with the VIN number to receive the bounty payment. Any switch received without a VIN would be recycled however no bounty would be paid. The automobile manufacturers reported they received 17,746 switches totaling 39 pounds of mercury collected in 2006. This is estimated to be a 90% capture rate for the estimated number of switches available for that year in Maine. In addition the heavy duty truck manufacturer’s reported 55 switches turned in for recycling in 2006. Over the three years of the program, the automobile recyclers have collected 27,710 switches or an estimated 61 pounds of mercury.
Mercury Products legislation
Maine has enacted the following mercury product laws:
• Dental amalgam. All dental offices must have amalgam separators by December 31, 2004. If a separator was installed prior to March 20, 2003, it must achieve a minimum of 95 percent removal efficiency, while separators installed on or after that date must have a minimum of 98 percent removal efficiency, with efficiencies to be determined by ISO 11143. The department currently reports 100% compliance with notification of installation of required amalgam separators. Suppliers of amalgam must annually report the volume of amalgam supplied to Maine dentists in 2006, 2007 and 2008.
• Switches, relays and measuring devices, thermostats, manometers and thermometers.
With some exceptions, the sale of mercury switches, relays, and measuring devices was banned as of July 1, 2006. Measuring devices include barometers, flow meters, hydrometers, manometers, sphygmomanometers, and thermometers. The sale of mercury-added thermostats was prohibited effective January 1, 2006. The sale of mercury-added fever thermometers and manometers of the type used in milking machines has been banned in Maine since January 1, 2002.
• Button cell batteries. After June 30, 2011, a person may not sell or offer to sell or
distribute for promotional purposes a mercury-added button cell battery for consumer use or a product for consumer use that contains a mercury-added button cell battery. The DEP must submit an interim report on the availability of mercury-free batteries by January 15, 2009.
• Electronic Devices. Recycling of all waste residential, cathode ray tubes, TV and
computer monitors and flat panel displays greater than four inches has been required to be recycled since January 2006, in part due to the mercury in these products. Manufacturers are required to pay the costs of handling and recycling of household computer monitors and TVs.
• Mercury components in motor vehicles. Maine law: 1) prohibits the sale of a motor
vehicle assembled after January 1, 2003 if it contains a mercury switch; 2) requires mercury switches and mercury headlamps to be removed from end-of-life vehicles before they are flattened or crushed; and 3) requires automobile manufacturers to establish a statewide system to consolidate and recycle the switches. Automakers must pay a $4 for each switch returned to them for recycling.
• Product notification. The sale of a mercury-added product is prohibited in Maine as of
January 1, 2002 unless the manufacturer (or someone else) has notified the Department of Environmental Protection as to the amount and purpose of the mercury.
• Product labeling. Mercury-added products sold in Maine after January 1, 2002 must
have an identifying label.
NEW HAMPSHIRE 2007 Mercury products legislation Two mercury-added products bills were introduced in the 2007 NH legislative session. HB 416 as proposed would institute a disposal ban on all mercury-added products, regardless of mercury content, effective January 1, 2008. HB 416 has passed the NH House and is currently being considered by the Senate. HB 907, which has passed the full legislature, is a NHDES requested bill and will prohibit the sale of certain categories of mercury-added products including various measuring devices, meters, blood pressure cuffs and thermometers effective January 1, 2008. Other products such as switches, relays and thermostats will be prohibited from sale beginning July 1, 2008. Like similar legislation in other states the bill also provides for exemptions where non-mercury alternatives are available and exempts certain products such as those required by federal standards. Fluorescent lamp recycling project In late 2006, NHDES, in partnership with TrueValue Hardware stores, Public Service Company of New Hampshire (NH’s largest electric utility) and the NH Small Business Development Center created the TrueValue Fluorescent Lamp Take Back and Recycling Program. Through this program, which is modeled after a program created by the State of Vermont, homeowners and small businesses may bring up to 6 fluorescent lamps to participating TrueValue hardware stores where the lamps will be collected and transported to the Manchester TrueValue Distribution Center. Complete Recycling Solutions (CRS), an approved recycling facility, collects the lamps and recycles them at their Fall River, MA facility. All these services are provided free of charge, to homeowners and small businesses. Throughout the fall of 2006, NHDES visited 26 participating NH stores to set up recycling boxes and in-store advertising. During this time period, NHDES, TrueValue, PSNH and SBDC all provided outreach and education to promote the program. In January, 2007, CRS collected and recycled the first shipment of NH lamps that totaled 2,144 linear feet of fluorescent lamps and 55 compact fluorescent lamps. During 2007 NHDES will be assessing the feasibility of expanding this program to other retail hardware chains in NH. Automobile mercury switch collection Through 2004 and 2005, a voluntary mercury switch recycling project was created through a partnership between NHDES and the Auto & Truck Recycling Association of New Hampshire. Under this program, participating motor vehicle salvage facilities removed mercury-containing convenience and ABS switches from end of life vehicles, consolidated them, and gave them to NHDES who paid for their proper recycling by the two mercury recycling facilities presently under contract with the State of NH. By
October, 2006, NHDES collected and recycled over 5,700 mercury-containing switches for a total of 12.5 pounds of mercury. In the fall of 2006, NHDES participated in the development of the National Vehicle Mercury Switch Recycling Program (NVMSRP). Under this program, national auto manufacturers agreed to provide a bounty of $1.00 per switch that is collected and recycled under the program. NH joined the national program in late 2006 and auto salvage facilities began participating in January, 2007. Since auto salvage facilities are now shipping switches directly to NVMSRP, the number of switches collected to the program will not be reported to New Hampshire until the end of 2007. Thermostat recycling In 2006, the Thermostat Recycling Corporation (TRC) recycling program continued to provide free thermostat recycling services. NHDES purchased and provided 20 TRC recycling bins to electrical wholesalers and large electrical contractors. Based on TRC’s annual 2005 report (the latest provided), 1053 thermostats, representing 7.87 pounds of mercury, were collected and recycled. This represents an almost 100% increase from the 4.0 pounds collected in 2004. In an effort to provide more convenient collection and recycling services to homeowner, NHDES promoted the collection and recycling of homeowner-generated thermostats through the State’s Household Hazardous Waste (HHW) program. Thanks to those efforts, 30 NH towns are accepting mercury-containing thermostats from homeowners and recycling them under the State’s HHW grant reimbursement program. Measuring devices NHDES has received funding through a settlement to work with farmers to remove mercury containing devices from agricultural operations. The Mercury on the Farm project has focused on collecting mercury devices from dairy operations and maple syrup producers. Dairy farms use a mercury device called a manometer, which is used to measure pressure in milking lines. Outreach efforts have indicated that most dairy operations in New Hampshire have been already been retrofitted with digital, non-mercury devices and previously disposed of / recycled their mercury-containing manometers. This information was obtained from two dairy equipment service providers that handle most of NH’s dairy farms. For the maple sugar producer portion of this project, NHDES is partnering with the NH Maple Producers Association and the NH Department of Agriculture. Many of the large producers already use digital, non-mercury thermometers so this project is focusing on swapping out thermometers from small “backyard” sugar shacks. Dental mercury collection The New Hampshire Department of Environmental Services Pollution Prevention Program coordinated a free mercury recycling program in 2006. Dental offices were
asked to participate in the voluntary dental mercury collection program. Questionnaires were sent to dental offices located in the Connecticut River Valley Watershed. A total of 19.2 pounds of mercury was collected from these facilities. For dental providers in who missed this opportunity, there will be a chance to participate in a second dental mercury recycling program during spring 2007. RHODE ISLAND In 2005 the state amended the Mercury Reduction and Education Act to:
• change the effective date for phase-out of mercury-added fabricated products with a mercury content of one gram or mercury-added formulated products with a mercury content greater than 250 parts per million from July 1, 2005 to January 1, 2006;
• exempt high intensity discharge (HID) lamps, including metal halide, high pressure sodium, and mercury vapor lamps and laboratory chemical standards from phase-out requirements;
• extend the exemption period for mercury-added products from 2 years to no more than 5 years;
• modify the language relating to granting of phase-out exemptions; • extend the deadline for meeting labeling requirements from July 1, 2005 to
January 1, 2006 and grants reciprocity with labeling requirements of another state; • add requirements relating to the collection and recycling of mercury-added
components in motor vehicles (more details are found below). These changes became effective on July 14, 2005. See H-6598Aaa at http://www.rilin.state.ri.us/BillText/BillText05/HouseText05/H6598Aaa.pdf for more details. See S-1162aa at http://www.rilin.state.ri.us/BillText/BillText05/SenateText05/S1162aa.pdf for more details. In 2005 Rhode Island enacted a law that requires manufacturers of motor vehicles sold in Rhode Island to:
• establish and implement a collection program for mercury switches with a goal of attaining a capture rate of not less than 50 percent for calendar year 2006 and not less than 70 percent for calendar year 2007 and subsequent years through 2017;
• implement an approved collection plan by January 1, 2006; • submit quarterly reports on the number of switches collected, the amount of
mercury collected and recycled through the program, and the capture rate beginning in March 31, 2006.
See H-5911Aaa at http://www.rilin.state.ri.us/BillText/BillText05/HouseText05/H5911Aaa.pdf for more details. See S-611Aaa at http://www.rilin.state.ri.us/BillText/BillText05/SenateText05/S0611Aaa.pdf for more details. In 2006, Rhode Island modified the original 2005 mercury auto switch law by:
• eliminating the “voluntary” auto mercury program established by the Rhode Island General Assembly in 2005; and
• requiring the state to adopt a more regulatory program that obligates auto manufacturers to pay auto recyclers a minimum bounty of $5 per mercury switch removed from end-of-life vehicles.
See H-8220aa at http://www.rilin.state.ri.us/Billtext/BillText06/HouseText06/H8220aa.pdf for more details. See S-2668aa at http://www.rilin.state.ri.us/Billtext/BillText06/SenateText06/S2668aa.pdf for more details. Also in 2006, the Rhode Island General Assembly adopted a new electronic waste law, which calls upon Rhode Island Department of Environmental Management to convene a stakeholder process (similar to the recent RI Mercury Commission) to study the establishment of collection, recycling, and reuse programs for electronic waste products. Interim reports are due to the General Assembly in January and May of 2007, with a final report to be produced by December 31, 2007. A ban on the disposal of electronic waste is set for July 1, 2008. See H-7789A at http://www.rilin.state.ri.us/Billtext/BillText06/HouseText06/H7789A.pdf for more details. See S-2509Aaa at http://www.rilin.state.ri.us/Billtext/BillText06/SenateText06/S2509Aaa.pdf for more details. Rhode Island’s current mercury regulations “Rules and Regulations Governing the Administration and Enforcement of the Rhode Island Mercury Education and Reduction Act (December 28, 2005)” can be found at: http://www.dem.ri.gov/pubs/regs/index.htm VERMONT Mercury Legislation In 2005, comprehensive mercury product legislation was passed, including bans on the sale of mercury thermostats, fever thermometers, and dairy manometers, and restricting the sale of numerous measuring devices containing mercury. The law further restricts the sale of mercury in schools; requires that dental best management practices for amalgam wastes be followed, including amalgam separator installation; and requires mercury reduction plans from hospitals. In 2006, further mercury legislation was passed that requires removal of mercury-added auto switches from end-of-life vehicles prior to crushing and shredding. In 2007, legislative bills have been introduced to restrict the use of dental amalgam, restrict thimerosal in vaccines, and to require thermostat manufacturers to implement mercury thermostat collection programs with financial incentives for contractors and homeowners. It is likely that thermostat legislation will be passed into law. In 2007, the Vermont Legislature passed a resolution requesting that the U.S. Congress prohibit the sale of U.S. Government mercury stockpiles, ban the export of mercury, and establish safe storage for government and private sector mercury surpluses.
Mercury Auto Switch Removal at Scrap Yards Vermont’s auto switch removal requirement took effect January 1, 2007. To date there are 63 vehicle recyclers participating in collection through the National Vehicle Mercury Switch Recycling Program that will be receiving $1 per mercury switch collected through the program. Dairy Manometers A project was implemented with the Agency of Agriculture to remove mercury-added manometers on active and inactive farms and replace mercury manometers on active farms with a mercury-free manometer at no cost to the farm. To date there have been 110 mercury manometers removed from farms. The goal is to identify any remaining manometers and remove them by the end of 2007. This project is being funded through a special mercury reduction fund established as part of a hydroelectric dam re-licensing settlement agreement. Fluorescent Lamp Recycling Forty True Value hardware stores completed the first year of a pilot project to serve as collection points for spent fluorescent bulbs from households and small businesses. The program allows up to six mercury bulbs (tubes or compact fluorescents) to be brought per visit to the store by a customer at no cost. At the end of the first year, 24 ACE hardware stores were added to the program. In the first year of the program, over 66,000 lineal feet and over 1150 bulbs of fluorescents were collected. Collection and disposal costs are being paid through a Supplemental Environmental Project that was part of an environmental enforcement settlement. Hardware stores that are participating in the program surveyed customers to determine if they would be willing to pay 50 cents for the same service they are currently receiving at no cost. Approximately 75% of those surveyed stated that they would be willing to pay for the service. About 75% of the program participants were households; the remainder were businesses and municipalities. Vermont has seen an increase in recycling of lineal fluorescent bulbs of 18% and 7% for compact fluorescents since 2004. Button Cell Battery Collection Pilot Project A pilot project to collect mercury-added button cell batteries was initiated in 2006 in nearly 100 pharmacies across the state and more than 20 nursing homes. In 2007, the program will be expanded to audiologists throughout the state. Pharmacies and nursing homes return the batteries for recycling through a mail-back program to a recycler. Funding of the project is through the settlement of an environmental enforcement case.

TABLE 1: Status of Mercury Education & Reduction Legislation in the New England States Prepared by NEWMOA - October 2006
Requirement CT MA ME NH RI VT
Mercury-added Product Notification
Participation in IMERC
Sales Bans: Certain Mercury-Added Products
Sales Bans: Certain Mercury-added Novelties
Bans on Sale of Mercury Fever Thermometers
Bans on Use of Mercury & Certain Mercury-added Products in K -12 Schools
Phase-Outs on Sale of Certain Mercury-added Products with Exemptions
Product Labeling
Disposal Bans: Most Mercury-added Products
Plans for Collecting Mercury-added Products
Disclosure of Incidental Mercury Content in Certain Products for Hospitals
Control on Sale of Elemental Mercury
Public Education and Outreach
Universal Waste Rule * * * *
Requirement CT MA ME NH RI VT
State Procurement *
*
Education on Dental Amalgam *
Dental Amalgam Separators or Recycling Required
*, R *1
Mercury Auto Switch Phase-out & Removal * V
= Provisions that have been passed.; * = Authority exists to implement under existing laws or policies. V = Voluntary program in place; R = Required by regulation; 1 Rhode Island dentists served by the Narragansett Bay Commission are required to install amalgam separators; RI DEM has developed a voluntary program for dentists statewide based on the Narragansett Bay Commission regulations.
EASTERN CANADIAN PROVINCES PRINCE EDWARD ISLAND Municipal solid waste incinerator P.E.I. has one municipal solid waste incinerator, located in Charlottetown. In January of 2005, the facility installed an activated charcoal injection system. Testing conducted in January of 2005, indicated that the facility is emitting 0.0022 mg/m3, within the Canada-wide standard of 0.02 mg/m3. Mercury thermometers In May of 2002, the P.E.I. Pharmaceutical Association initiated a voluntary ban on mercury thermometers on P.E.I.. In September of 2002, a mercury thermometer collection event was held at 40 Island Pharmacies in conjunction with the Island Waste Management Corporation and the P.E.I. Pharmaceutical Association. A total of 1,848 mercury thermometers were collected at 40 pharmacies throughout P.E.I.. Our Department offered participants $5.00 off a digital thermometer and the total cost of the program was approximately $10,000.00. Householders can now return mercury thermometers for disposal at one of the six household hazardous waste depots on P.E.I.. Florescent tubes Florescent tubes are no longer accepted for disposal at P.E.I.’s only landfill. Island Waste Management Corporation now accepts tubes from householders for disposal. Tubes that are generated from commercial and industrial sources are required to be disposed of by a licensed hazardous waste company. Battery collection program There are currently two battery recycling programs operating on P.E.I.. Island Waste Management Corporation, a crown corporation, operates Re-Store your Batteries; a program that accepts non-rechargeable Alkaline and Lithium batteries at 19 grocery stores on P.E.I. The Rechargeable Battery Recycling Corporation of Canada provides prepaid shipping containers at various locations for disposal of rechargeable batteries. These two programs ensure that batteries containing mercury are properly disposed of on NEW BRUNSWICK Fluorescent Lamps: New Brunswick participates in the Canada-Wide Standards process as a member of the Canadian Council of Ministers of the Environment (CCME). There are several Canada-Wide Standards for mercury, which includes a standard for mercury-containing lamps. All of the regional solid waste commissions in New Brunswick provide the public with access to household hazardous waste depots for the disposal of hazardous materials,
including mercury-containing products such as fluorescent lamps. This service is provided to the public free-of-charge. Medical Waste Incineration: New Brunswick has one medical waste incineration facility that handles all of the medical waste in the province. The incinerator is equipped with pollution control equipment, which includes activated carbon injection and fabric filter baghouse for mercury control. Results from annual stack emissions testing indicate that the concentration of mercury in the stack gas is approximately 9 micrograms per cubic metre, which is well below the Canada-Wide Standard of 20 micrograms per cubic metre and well below the NEG/ECP target of 55 micrograms per cubic metre. NOVA SCOTIA Electronic Product Stewardship Regulations On February 23, 2007 Nova Scotia Environment and Labour enacted new Electronic Products Stewardship Regulations. The goal of the regulations is to divert electronic products from landfills through the creation of a province-wide collection and recycling system for electronic waste. The regulations include a disposal ban on electronic waste. The regulations require electronic product brand owners (manufacturers and distributors) to assume the cost and responsibility of handling the waste from their products. When the program begins, consumers of electronic products will be able to take back their waste electronic products to return collection facilities across the Nova Scotia. The collection facilities will accept the products at no charge and will send them to be recycled. It is estimated that more than 4500 tonnes of electronic product waste is generated in Nova Scotia annually. The program will keep much of this waste out of landfill, recycling it into new products. Requirements for end of life collection: By Feb 1, 2008 laptops, desktops, peripherals, printers, monitors, televisions By Feb 1 2009 scanners, cell phones, telephones, fax machines NEWFOUNDLAND & LABRADOR Programs as described in previous reports. QUEBEC
Auto switch collection

At the summer of 2003, the Quebec Sustainable Development, Environment and Parks Ministry (MDDEP), started an environmental programme with the recycling used cars companies to draw an environmental portrait of this sector and to improve the environmental performances of them. This program included three series of inspections by the MDDEP, the first being a visit of diagnosis, the second an inspection of control and the third, a follow up inspection. This initiative had been preceded by the publication of a guideline in 2001 and by a letter signed by the minister to the Association of recyclers of cars and trucks parts and to the Association of metal recyclers of Quebec inviting them to advice their members about the importance of withdrawal and good management of automobile components containing mercury. The members of these associations are able to withdraw each year more than 22 % of the mercury switches representing nearly 45 thousands switches. In the spring of 2006, a project financed by the Canadian program Switch out and coordinated by Recyc-Quebec has recovered 12 thousands switches in fifteen days. Another project, with the objective to recover 40 thousands switches will be held in March 2007 by Recyc-Quebec in collaboration with the Canadian Association of vehicles manufacturers and Mittal Canada Inc.
Fluorescent and compact fluorescent lamps
Recyc-Quebec is supporting a program to collect fluorescents in the government buildings. Hydro-Quebec recovers fluorescents in theirs buildings and also advices their customers on his Web site to deposit old fluorescent tubes in collection centers or to bring them to the domestic hazardous waste depot.
At the end of January 2007, Recyc-Quebec has organized a meeting of some stakeholders in order to discuss collection and recycling of fluorescent and compact fluorescent lamps in Quebec. In the conclusion of this meeting, Recyc-Quebec indicated that they will contact the municipalities and the principal suppliers in order to support the installation of a collection system.
Pollution Prevention
The MDDEP supervised the decontamination of 123 sites of hydrometric stations. These sites were dismantled and closed or replaced by more recent equipment not using mercury. Nearly 150 kg of mercury were recovered and treated. In addition, the soils of several of these sites were contaminated by mercury. A programme of withdrawal of the contaminated soils and their replacement by clean soils, with decontamination of the contaminated soils was also applied to the 123 sites. Thus, between September 2003 and November 2005, 1325 cubic meters of contaminated soils were rehabilitated.
The Sustainable Development Act
In April 2006, the Sustainable Development Act was assented. The measures introduced are intended to better integrate the pursuit of sustainable development into the policies, programs and actions of the Administration. A Green Fund has been established to support measures promoting sustainable development, especially in its environmental aspects. This law gives new functions to the Minister of Sustainable Development, Environment and Park in order to promote sustainable development actions in the Administration. Actions regarding mercury might be included in these.
SECTION III.e
Mercury Program Report on Initiatives of Other Regional Agencies
and Organizations
PARTNER ORGANIZATIONS MERCURY ACTIVITIES UPDATE
The MTF partner organizations continue to actively pursue comprehensive and varied mercury reduction efforts, as detailed below. NEW ENGLAND INTERSTATE WATER POLLUTION CONTROL COMMISSION (NEIWPCC) Mercury-Fish Workgroup Activities NEIWPCC coordinates a regional Mercury-Fish Workgroup that is made up of representatives from the state environmental and public health agencies and EPA Regions 1 and 2. The workgroup meets twice per year to discuss issues related to monitoring mercury in fish and outreach regarding fish consumption advisories. In 2006, the workgroup covered the following topics: supermarket outreach, Vermont’s mercury monitoring strategy, Rhode Island biomonitoring project, New Hampshire’s Women’s Outreach Project, and FishScam. The next meeting (scheduled for April 2007) will address focus group testing for outreach materials, mercury concentrations in marine fish, and regional mercury research efforts. Each meeting also allows the states to share general updates of the important issues in their states regarding mercury in fish and to get feedback from other states and EPA on ongoing projects. Northeast Regional Mercury Science & Policy Conference The Northeast Regional Mercury Science & Policy Conference, which was organized by NEIWPCC and co-sponsored by NEWMOA, NESCAUM, and EPA New England, took place April 26 and 27, 2006 in Newport, Rhode Island. The conference was attended by approximately 100 people, including representatives from state and federal government, not-for-profit organizations, and private industry. Topics covered included regulatory efforts, pollution prevention and waste management, toxicology and health effects, fish advisories and outreach, ecological impacts, and modeling and monitoring mercury in the environment. The conference provided a forum for groups and individuals working on mercury issues in the region to share their progress, challenges, and success stories. The interstates anticipate continuing to hold this conference biennially, with the next conference in 2008. Presentations from the conference are available at www.neiwpcc.org/mercury. NORTHEAST WASTE MANAGEMENT OFFICIAL’S ASSOCIATION (NEWMOA) NEWMOA / IMERC Activities on Source Reduction for Mercury-added Products Starting in 1999 the New England states and other parts of the country actively began to pursue enactment of legislation focused on reducing mercury in products and waste. As a result of the success of the state efforts to enact legislation the Northeast Waste Management Officials' Association (NEWMOA) launched the Interstate Mercury Education and Reduction Clearinghouse (IMERC) in 2001 to provide:
• ongoing technical and programmatic assistance to states that have enacted mercury education and reduction legislation
• a single point of contact for industry and the public for information on mercury-added products and member states' mercury education and reduction programs
Overall IMERC facilitates deliberations that provide advice and assistance to the individual member states for their decision-making. Specifically, IMERC:
• collects and manages data submitted by manufacturers of mercury-added products, as necessary to implement the notification provisions of state mercury reduction legislation;
• facilitates interstate collaboration on the development and implementation of public education and outreach programs on mercury-added products;
• endeavors to make information on mercury-added products available to industry and the public;
• responds to public information requests for information on mercury-added products, the requirements of the member states, and the status of state implementation of their laws; and
• provides technical assistance, facilitate reviews, and make recommendations to the member states concerning (i) manufacturers' applications for exemptions to the phase-out of mercury-added products; (ii) manufacturers' applications for alternative labeling of mercury-added products; and (iii) manufacturers' plans for collection and proper waste management of mercury-containing materials.
IMERC's membership includes NEWMOA and non-NEWMOA member state government agencies. The current IMERC state members include: California, Connecticut, Illinois, Maine, Massachusetts, Minnesota, New Hampshire, New Jersey, New York, North Carolina, Rhode Island, Vermont, and Washington.
To date IMERC has coordinated the Notification process for all of the New England States that require product Notification for two reporting years (calendar years 2001 and 2004) including products manufactured or distributed by more than 470 companies. These Notifications cover more than 3,860 different mercury-added products (not counting individual products reported on by different companies). The data on these products is available via the Mercury-added Products Database on the IMERC Webpage: http://www.newmoa.org/prevention/mercury/imerc/notification/. The database contains information on the amount and purpose of mercury in products submitted by, or on behalf of, product manufacturers beginning in 2001.
IMERC has also supported the state efforts to implement their statutory bans on the sale of certain mercury-added products, such as fever thermometers, thermostats, dairy manometers, barometers and some other measuring devices, vehicle switches, and others by providing a single point for information on these restrictions through IMERC’s WebPages, publication of IMERC Alert, and phone and email contacts with numerous companies. A summary of these state product bans is available at: http://www.newmoa.org/prevention/mercury/imerc/productban.cfm.
IMERC has provided significant support to state efforts to implement their phase-out requirements that provide the opportunity for companies that make certain mercury-added products to apply for an exemption to the restrictions on their sale. IMERC has assisted the states with the development of a single exemption application form that satisfies the requirements of all of the IMERC-member states and provides a single point for submitting these applications on behalf of most of the states with the applicable requirements. To date, IMERC has helped to coordinate the review of more than 35 phase-out applications, including management of a clearinghouse of these applications and the state responses, communications with the applicants, and coordination of conference calls and other communications of the IMERC-member states to share their comments and decisions on the applications. IMERC has provided considerable compliance assistance for the state phase-out requirements through posting and updating the IMERC WebPages, publication of IMERC Alert, and phone and email contacts with numerous companies about these requirements. A summary of the state product phase-out requirements and the exemption application are available at: http://www.newmoa.org/prevention/mercury/imerc/phaseoutinfo.cfm.
Summary of 2006 NEWMOA Efforts on Mercury Reduction in MA Schools The Massachusetts Department of Environmental Protection (MA DEP) funded NEWMOA for a sixth year to conduct mercury removal from public schools. NEWMOA worked with 20 schools (12 high schools and 8 middle or K-8 schools) to identify, collect, and recycle elemental mercury and mercury-containing products, collecting an average of 5.3 pounds of mercury per high school. The total amount of mercury collected in fiscal year 2006 was 100 pounds. NEWMOA has now helped to remove 1,077 pounds of mercury from Massachusetts schools, beginning in fiscal year 2001. Promoting Fluorescent Lamp Recycling NEWMOA has managed a lamp recycling outreach and education project for more than three years. To implement the project, NEWMOA established a Lamp Recycling Workgroup of member-state agency staff. In 2006 the Workgroup’s efforts focused on conducting outreach to tanning salon owners. The Workgroup targeted these businesses because they use a large number of fluorescent lamps and change them out frequently. A single tanning bed uses between 45 and 90 lamps, and each lamp contains an average of 17 milligrams of mercury, according to the National Electrical Manufacturers Association (NEMA). A salon may have from a few to over 10 beds. Lamps are changed two or more times a year to maximize their ultraviolet light tanning potential. The Lamp Recycling Workgroup developed an outreach flyer and mailed it to over 3,100 tanning salons in New Hampshire, New York, New Jersey, Massachusetts, Rhode Island, and Connecticut. The Maine Department of Health mailed several hundred flyers to tanning salon operators in Maine. NEWMOA also produced and published online a briefing paper on the use of mercury in lighting based on its summary of the data in the Interstate Mercury Education and Reduction Clearinghouse (IMERC) Mercury-Added Products Database (see description above). The

briefing paper provides a summary of the types of mercury-added lamps and their uses. NEWMOA receives frequent positive feedback and/or requests for more information on this topic as a result of the paper. For example, the Barnstable County, Massachusetts, Cooperative Extension Program developed laminated mercury lighting cards based on the information in the briefing paper, which it distributes to its town Department of Public Works and transfer stations as well as businesses, schools, and consumers. The briefing paper is available at http://www.newmoa.org/prevention/mercury/imerc/FactSheets/. In 2006 the Lamp Recycling Workgroup also began exploring potential opportunities for collaboration with energy efficiency organizations to facilitate greater outreach to lamp users. The Workgroup believes that incorporating the message about the need to recycle mercury-added lamps into outreach promoting the use of energy efficient lighting is important because energy efficiency organizations reach a wide variety of audiences. Furthermore, with growing awareness about global warming, businesses and consumers are increasingly turning to fluorescent lights, making it ever more important to reach out to consumers to ensure that they manage their spent bulbs responsibly. Several of NEWMOA's Workgroup members collaborated with their energy efficiency organizations in fiscal year 2006. For example, the Maine Department of Environmental Protection (ME DEP) worked with Efficiency Maine to craft language on the need to recycle for some of Efficiency Maine's outreach materials. In fiscal year 2006, NEWMOA staff conducted research on the use of ultraviolet lamps at drinking and wastewater treatment plants in the NEWMOA-member states. The researchers found that a significant number of wastewater treatment facilities in the region (approximately 28 percent) use ultraviolet disinfection systems. A large number of drinking water treatment facilities in the Northeast also reported that they use ultraviolet disinfection. NEWMOA’s Lamp Recycling Workgroup decided to conduct more research on this sector, including the number of lamps used, the frequency of change-out, and current lamp management practices before planning a future outreach and education campaign. NESCAUM UPDATE ON MERCURY ACTIVITIES 2007 NESCAUM has on-going mercury activities in two areas:
1. Mercury emissions inventory and deposition modeling. NESCAUM is completing work on modeling mercury deposition in the Northeast using the Regional Modeling System for Aerosols and Deposition (REMSAD). NESCAUM has performed updated mercury deposition modeling using a 1998 and an updated 2002 mercury air emission inventory. NESCAUM conducted the model runs with two specific goals. The first goal was to determine mercury deposition in the NESCAUM region and apportion the contribution to deposition according to source region and major source category, highlighting differences attributable to emission reductions. The second goal was to provide input (i.e., loading) values to aquatic and ecological models that can inform regulatory and policy decisions. This work has been supported by EPA Region 1 and the Massachusetts Department of Environmental Protection.
2. Testing for mercury in fuel oil. NESCAUM has recently received funding from the New York State Energy Research and Development Authority (NYSERDA) to conduct testing for mercury content in fuels. The project will build upon initial scoping work supported by Massachusetts and Maine and will undertake a bottom-up approach to quantify potential emissions of mercury and other air toxic metals (including vanadium and nickel) from combustion of distillate oil (“#2 fuel oil”) and other fuel oils in New York State and the neighboring New England region. Under this project, heating oil and other fuel types will be tested by an analytical laboratory to determine levels of mercury and other metals, as well as sulfur, in fuel oil samples collected in the region. Testing will also help determine whether there is a predictable and consistent relationship between sulfur content and the content of toxic metals in the fuel oil. This relationship (if it exists) will be evaluated for different seasons, locations, and fuel distributors and refiners. Results for mercury content in heating oil will also aid in verifying fuel oil combustion’s share of regional mercury air emissions in the emission inventories previously developed by NESCAUM, and inform future updates of those inventories.
ENVIRONMENT CANADA Risk Management Strategy for Mercury-containing products In December 2006 Environment Canada published a Risk Management Strategy for Mercury-containing products (RMS) (http://www.ec.gc.ca/MERCURY/EN/wn.cfm#wn-RMS). The RMS provides a framework for the development of control instruments to manage the environmental effects of mercury used in products.
The risk management objective of the RMS is to reduce mercury releases to the environment from consumer products to the lowest possible level by prohibiting, or limiting where appropriate, mercury content in new consumer products, and preventing releases from end-of-life mercury-containing products. The extent of the reduction of mercury in each product category will be based on the technical and economic feasibility of reducing or substituting mercury, the environmental impact of alternative products and current actions addressing mercury in products (e.g. Canada-wide Standards).
According to analyses at this time, the tool deemed most appropriate for managing mercury releases from mercury-containing products, to a level consistent with the risk management objective, is a regulation under section 93 of CEPA 1999 with the following potential components:
• Prohibition of mercury-containing products for which mercury-free alternatives exist. • Prohibition of mercury use in new products, not currently available on the Canadian
market, with possible exemptions. • Mercury content limits in products for which mercury-free alternatives do not exist
(novelty items excluded). • Extended producer responsibility requirements for end-of-life mercury-containing
products.
• Labeling requirements for mercury-containing products.
Potential avenues for managing the ultimate fate of mercury from end-of-life products, including the development of long-term storage considerations, will be explored to help ensure recovered mercury is not released to the environment through other sources. Pollution Prevention Notice for Mercury Switches On December 9, 2006 Environment Canada published a Proposed Notice (http://www.ec.gc.ca/MERCURY/EN/wn.cfm#wn-p2plan2) under Part 4 of the Canadian Environmental Protection Act, 1999 (CEPA 1999) outlining proposed requirements to prepare and implement pollution prevention plans for mercury releases from mercury switches in end-of-life vehicles processed by steel mills. The Notice targets vehicle manufacturers and steel mills. The risk management objective of the Notice is to reduce releases of mercury to the environment through participation by vehicle manufacturers and steel mills in a mercury switch management program in Canada. The persons targeted by the Notice must consider:
• Establishment, participation and funding for a program by each vehicle manufacturer for 15 years after the last model year in which mercury switches were installed by that vehicle manufacturer.
• Establishment, participation and funding for a program by steel mills until December 31, 2017.
• Promotion and communication of the mercury switch management program to vehicle recyclers and the public.
• Develop annual targets of switches to be collected; public reporting of targets, timelines, and results; annual evaluation and reviews
The Final Notice is expected to be published in Canada Gazette Part I in the summer of 2007. Outreach and Education
In March 2005, the document Municipal AAccttiioonnss ttoo RReedduuccee MMeerrccuurryy was published in order to help municipalities manage mercury-containing products and mercury sources found in their community. The document provides guidance on how to develop a Municipal Mercury Elimination Policy and Plan that will appropriately direct efforts to reduce mercury releases.
• Over the past year, Environment Canada has attended several municipal waste association trade shows to promote and distribute the MMuunniicciippaall AAccttiioonnss ttoo RReedduuccee MMeerrccuurryy guidance manual (hhttttpp::////wwwwww..eecc..ggcc..ccaa//MMEERRCCUURRYY//MMMM//EENN//mmmm--cccc..ccffmm??SSEELLEECCTT==MMMM). Many Canadian municipalities have mature hazardous waste collection programs that will accept mercury wastes, and the manual has been well received.
• Some real challenge have been identified such as the access for remote/rural communities
to implement hazardous waste collection programs. While municipalities recognize

mercury impacts (e.g., where tourism includes fishing), there are questions on who should bear the costs of mercury collection/recycling.
US ENVIRONMENTAL PROTECTION AGENCY (US EPA) Source reduction, safe waste management & recycling EPA developed a National Vehicle Mercury Switch Recovery Program in 2006. Currently Massachusetts, New Hampshire, Rhode Island and Vermont participate in the program. This program, which complements existing State mercury switch reduction efforts, will help to reduce up to 75 tons of mercury emissions over the next 15 years. It is the result of a two-year collaboration involving EPA, States, environmental organizations, and several industry sectors. Eliminating mercury use in schools EPA NE has been working on reducing schools’ chemical usage and eliminating mercury. EPA is working with New Hampshire on customizing a web-based tool, Healthy SEAT, which assists schools with an array of environmental issues including mercury.
SECTION III.f
Mercury Program Status of Regional Research & Monitoring Programs
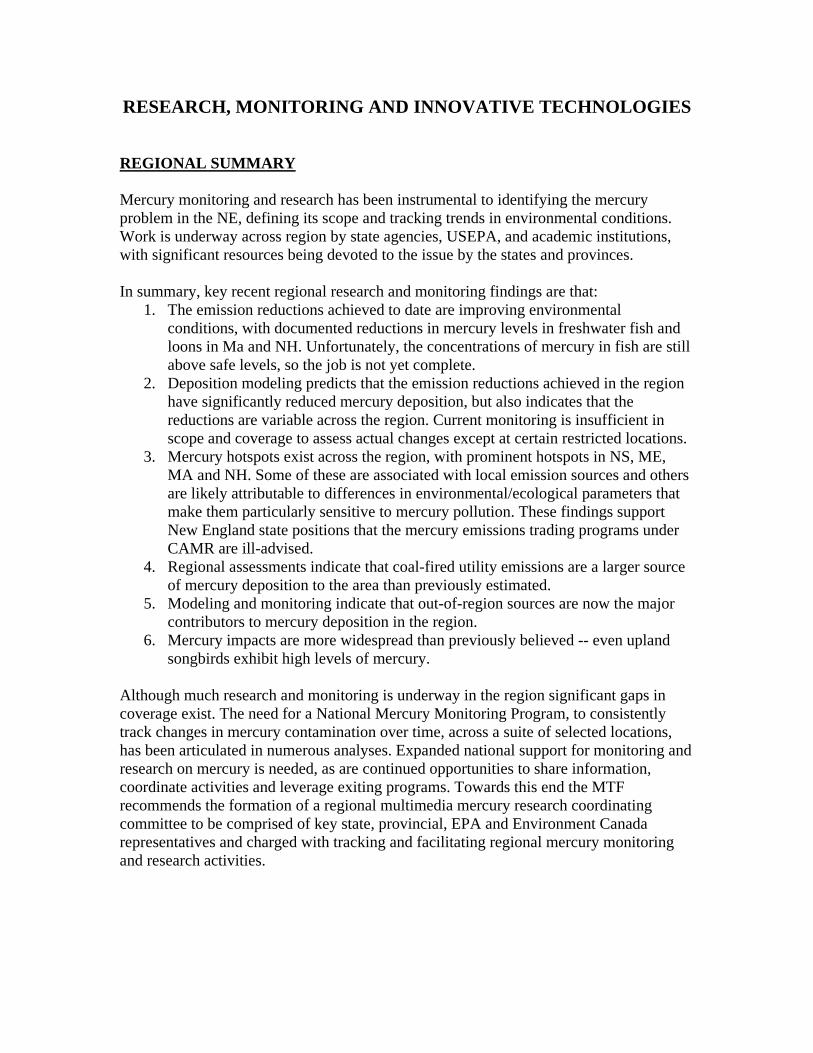
RESEARCH, MONITORING AND INNOVATIVE TECHNOLOGIES REGIONAL SUMMARY Mercury monitoring and research has been instrumental to identifying the mercury problem in the NE, defining its scope and tracking trends in environmental conditions. Work is underway across region by state agencies, USEPA, and academic institutions, with significant resources being devoted to the issue by the states and provinces. In summary, key recent regional research and monitoring findings are that:
1. The emission reductions achieved to date are improving environmental conditions, with documented reductions in mercury levels in freshwater fish and loons in Ma and NH. Unfortunately, the concentrations of mercury in fish are still above safe levels, so the job is not yet complete.
2. Deposition modeling predicts that the emission reductions achieved in the region have significantly reduced mercury deposition, but also indicates that the reductions are variable across the region. Current monitoring is insufficient in scope and coverage to assess actual changes except at certain restricted locations.
3. Mercury hotspots exist across the region, with prominent hotspots in NS, ME, MA and NH. Some of these are associated with local emission sources and others are likely attributable to differences in environmental/ecological parameters that make them particularly sensitive to mercury pollution. These findings support New England state positions that the mercury emissions trading programs under CAMR are ill-advised.
4. Regional assessments indicate that coal-fired utility emissions are a larger source of mercury deposition to the area than previously estimated.
5. Modeling and monitoring indicate that out-of-region sources are now the major contributors to mercury deposition in the region.
6. Mercury impacts are more widespread than previously believed -- even upland songbirds exhibit high levels of mercury.
Although much research and monitoring is underway in the region significant gaps in coverage exist. The need for a National Mercury Monitoring Program, to consistently track changes in mercury contamination over time, across a suite of selected locations, has been articulated in numerous analyses. Expanded national support for monitoring and research on mercury is needed, as are continued opportunities to share information, coordinate activities and leverage exiting programs. Towards this end the MTF recommends the formation of a regional multimedia mercury research coordinating committee to be comprised of key state, provincial, EPA and Environment Canada representatives and charged with tracking and facilitating regional mercury monitoring and research activities.
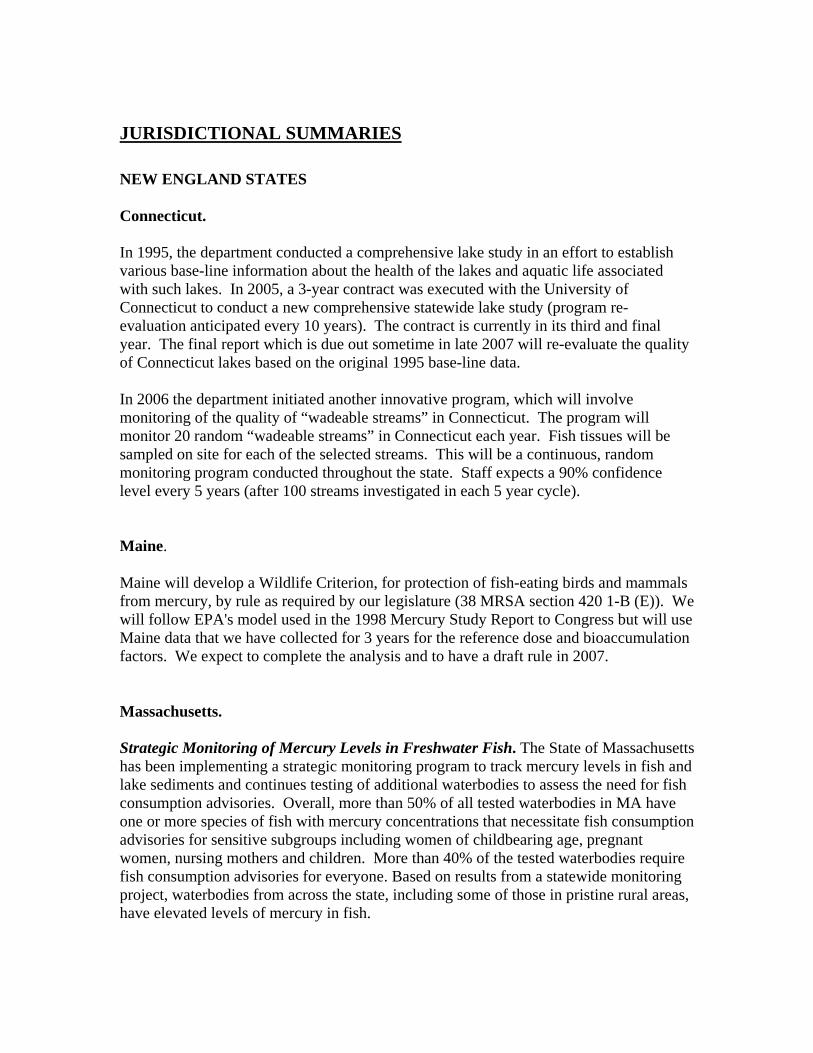
JURISDICTIONAL SUMMARIES NEW ENGLAND STATES Connecticut. In 1995, the department conducted a comprehensive lake study in an effort to establish various base-line information about the health of the lakes and aquatic life associated with such lakes. In 2005, a 3-year contract was executed with the University of Connecticut to conduct a new comprehensive statewide lake study (program re-evaluation anticipated every 10 years). The contract is currently in its third and final year. The final report which is due out sometime in late 2007 will re-evaluate the quality of Connecticut lakes based on the original 1995 base-line data. In 2006 the department initiated another innovative program, which will involve monitoring of the quality of “wadeable streams” in Connecticut. The program will monitor 20 random “wadeable streams” in Connecticut each year. Fish tissues will be sampled on site for each of the selected streams. This will be a continuous, random monitoring program conducted throughout the state. Staff expects a 90% confidence level every 5 years (after 100 streams investigated in each 5 year cycle). Maine. Maine will develop a Wildlife Criterion, for protection of fish-eating birds and mammals from mercury, by rule as required by our legislature (38 MRSA section 420 1-B (E)). We will follow EPA's model used in the 1998 Mercury Study Report to Congress but will use Maine data that we have collected for 3 years for the reference dose and bioaccumulation factors. We expect to complete the analysis and to have a draft rule in 2007. Massachusetts. Strategic Monitoring of Mercury Levels in Freshwater Fish. The State of Massachusetts has been implementing a strategic monitoring program to track mercury levels in fish and lake sediments and continues testing of additional waterbodies to assess the need for fish consumption advisories. Overall, more than 50% of all tested waterbodies in MA have one or more species of fish with mercury concentrations that necessitate fish consumption advisories for sensitive subgroups including women of childbearing age, pregnant women, nursing mothers and children. More than 40% of the tested waterbodies require fish consumption advisories for everyone. Based on results from a statewide monitoring project, waterbodies from across the state, including some of those in pristine rural areas, have elevated levels of mercury in fish.

MA Mercury Hotspots Identified. Testing over the past few years confirmed the existence of a mercury fish tissue hotspot in northeastern MA associated with emissions from local sources that have since been controlled. MassDEP has conducted an integrated assessment of mercury sources and impacts in this area, which was predicted in a 1998 deposition modeling study to have one of the highest rates of mercury deposition in New England. Sediment cores revealed that mercury inputs in the hotspot area were high throughout the 1990s, a finding consistent with the deposition modeling results, with mercury inputs about 8-fold above those prior to industrialization. Additional sediment cores were collected in 2006 and are being analyzed. Results from this work have been submitted to the international scientific journal Water Air and Soil Pollution in an article entitled Freshwater Fish Mercury Concentrations In A Regionally High Mercury Deposition Area, which has been submitted to the Journal Air, Water and Soil Pollution for publication. Fish sampling over the past two years have also revealed significantly elevated mercury levels in freshwater fish from water bodies on Cape Cod. Possible explanations for this finding, which may relate to coastal transport of mercury and/or watershed sensitivity to mercury inputs, are being explored. MA Monitoring Documents Declines in Mercury Levels in Fish. MassDEP’s fish monitoring program has also revealed very encouraging trends. Mercury levels in freshwater fish from MA water bodies declined by about 15-36% between 1999 and 2006, concurrent with the substantial reductions in mercury emissions achieved in the state and regionally over that time-period. These results, which are summarized in more detail in Appendix XX suggest that mercury levels in fish from temperate water bodies can be significantly reduced over a relatively short timeframe if emission sources are effectively controlled. Although reduced, it is important to note that the overall average mercury concentrations in YP and LMB in many of the sampled lakes, in particular those in the northeast part of Massachusetts, still exceed the level deemed as safe for consumption by pregnant women, nursing mothers and children. Mercury Deposition Modeling Shows Improvements. Supported by MassDEP and USEPA, updated mercury deposition modeling was conducted by NESCAUM using an improved mercury transport and deposition model and current emission inventories that reflect the reductions achieved since the 1998 regional report. Results from this work, which were completed 2006, have improved estimates of the amount and sources of mercury deposition in MA and the region. Modeling results indicate that overall mercury deposition in New England is now likely to be lower than in the 1990’s. The predicted decreases are not uniform, with reductions in many areas of less than 20% but ranging to in excess of 80% in others, in particular in the northeast MA “hotspot” area. The data also indicate that out-of-region US sources are now responsible for a larger portion of the overall deposition in the region than local sources, the reverse of the findings reported in 1998. This is due to the steep reduction in emissions from MA and regional sources. The modeling also identifies out-of-region coal-fired utilities as a major source of on-going deposition in MA and New England. Although greatly reduced, emissions from incinerators also remain significant. These predictions are consistent with other findings, previously reported, based on mercury

deposition monitoring, as well as modeling results reported by NERC and Hubbard Brook. Waste Combustion and Utility Emissions: Major Sources of Mercury Deposition in MA MassDEP, NESCAUM and the University of Michigan (UMI) previously monitored the levels of mercury and other elements in wet deposition events (rain and snow) at sites in N. Andover and at Quabbin Reservoir. This data provides insight into mercury deposition differences between a rural site with few local point sources nearby (Quabbin) and a more urban site close to several point sources (N. Andover), which is in the deposition hotspot zone noted previously. Assessments of mercury deposition samples from these sites were to assessed to investigate the relative contributions of mercury from different types of sources.
In summary, results indicate that municipal waste combustion and fossil fuel combustion account for the largest fraction of ongoing wet deposition in MA at both sites monitored. Although, as noted above, initial data suggest a very significant decrease in overall mercury wet deposition at the N. Andover site largely due to new incinerator controls, the fraction of deposition attributable to waste incineration at that site (about 59%) is still about twice that of the more rural Quabbin site (24%). This suggests that additional reductions in mercury deposition in that area could potentially be achieved by further efforts to control MSWC emissions, for example, by reducing mercury-added products in the waste-stream. Fossil fuel combustion sources, which are predominated by coal-fired utilities in this case likely out-of-state sources, accounted for 39% of the wet deposition at the Quabbin site.
The geographic origins of the mercury depositing at the monitoring sites were also traced back to their source areas using trajectory analyses, which rely on weather pattern data to back-track mercury deposition sources. Results indicate that many of the highest deposition events in MA were associated with weather patterns coming from the west and Midwest, suggesting that upwind reductions in mercury emissions, especially from coal-fired utilities, will be needed to address mercury deposition in the NE.
20
Hg Source Contributions: Quabbin (2002-2003)
Fossil Fuels: 39%
Waste incinerators: 24%
Other sources: 38%
19
Hg Source Contributions: N. Andover (2002-2003)
Other: 18%
Waste Incinerators: 59%
Fossil Fuels: 22%
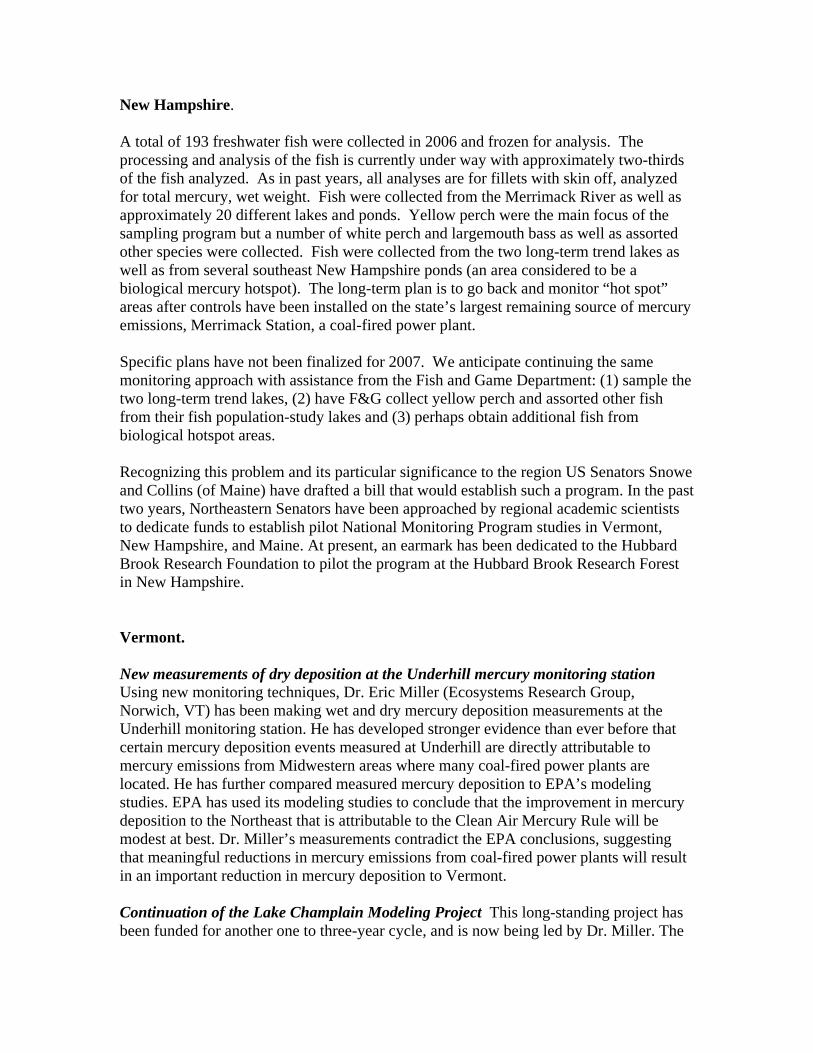
New Hampshire. A total of 193 freshwater fish were collected in 2006 and frozen for analysis. The processing and analysis of the fish is currently under way with approximately two-thirds of the fish analyzed. As in past years, all analyses are for fillets with skin off, analyzed for total mercury, wet weight. Fish were collected from the Merrimack River as well as approximately 20 different lakes and ponds. Yellow perch were the main focus of the sampling program but a number of white perch and largemouth bass as well as assorted other species were collected. Fish were collected from the two long-term trend lakes as well as from several southeast New Hampshire ponds (an area considered to be a biological mercury hotspot). The long-term plan is to go back and monitor “hot spot” areas after controls have been installed on the state’s largest remaining source of mercury emissions, Merrimack Station, a coal-fired power plant. Specific plans have not been finalized for 2007. We anticipate continuing the same monitoring approach with assistance from the Fish and Game Department: (1) sample the two long-term trend lakes, (2) have F&G collect yellow perch and assorted other fish from their fish population-study lakes and (3) perhaps obtain additional fish from biological hotspot areas. Recognizing this problem and its particular significance to the region US Senators Snowe and Collins (of Maine) have drafted a bill that would establish such a program. In the past two years, Northeastern Senators have been approached by regional academic scientists to dedicate funds to establish pilot National Monitoring Program studies in Vermont, New Hampshire, and Maine. At present, an earmark has been dedicated to the Hubbard Brook Research Foundation to pilot the program at the Hubbard Brook Research Forest in New Hampshire. Vermont. New measurements of dry deposition at the Underhill mercury monitoring station Using new monitoring techniques, Dr. Eric Miller (Ecosystems Research Group, Norwich, VT) has been making wet and dry mercury deposition measurements at the Underhill monitoring station. He has developed stronger evidence than ever before that certain mercury deposition events measured at Underhill are directly attributable to mercury emissions from Midwestern areas where many coal-fired power plants are located. He has further compared measured mercury deposition to EPA’s modeling studies. EPA has used its modeling studies to conclude that the improvement in mercury deposition to the Northeast that is attributable to the Clean Air Mercury Rule will be modest at best. Dr. Miller’s measurements contradict the EPA conclusions, suggesting that meaningful reductions in mercury emissions from coal-fired power plants will result in an important reduction in mercury deposition to Vermont. Continuation of the Lake Champlain Modeling Project This long-standing project has been funded for another one to three-year cycle, and is now being led by Dr. Miller. The
project will be substantially augmented during 2007. The project has been redesigned to link measurements of reactive gaseous mercury deposition (measured dry deposition) to mercury in water, then to methylmercury, and in turn to the biota that accumulate methylmercury. In this way, the project team will be able to track deposition events of mercury from known sources into the aquatic food web in Lake Champlain. Continuation of mercury monitoring by USGS During 2006, mercury sampling by the U.S. Geological Survey (USGS) in Lake Champlain tributaries was curtailed in favor of an investigation of so-called “new generation” contaminants. Monitoring continued at a baseline level in the Sleepers River watershed in eastern Vermont. During 2007, USGS plans to monitor mercury loss from a stormwater-impaired urban watershed. Specifically, they are interested in the potential for the simultaneous effects of reduced total mercury discharge but increased methylmercury production, due to the placement of stormwater control ponds in the Englesby Ravine in South Burlington. Also during 2007, USGS will continue to participate in the Lake Champlain Modeling Project. Loon Recovery Project Abandoned loon eggs and feathers from Vermont lakes continue to be analyzed for mercury in conjunction with the Loon Recovery Project, in partnership with the Biodiversity Research Institute in Maine. Vermont Fish Contaminant Monitoring Committee This committee oversees collection and analysis of fish contaminants throughout Vermont. In 2006, the Committee delivered a report to the General Assembly, in response to 10 V.S.A. §7114, outlining elements of a desirable indicator-based mercury monitoring initiative for Vermont. This plan is similar to that implemented by Massachusetts as described above. The plan has seen no action as of this writing. Fish samples collected during 2003-2004 have now been completely analyzed and are available for risk assessment.
CANADIAN PROVINCES
New Brunswick. Since 2004, the New Brunswick Department of Environment (DENV) has been collaborating on a Mercury Survey Project with Environment Canada (EC), looking at total and methyl mercury concentrations in selected surface water bodies located around the province. Environment Canada developed a model to predict the probable total mercury concentrations in surface waters in different areas of the province. This model was based on parameters, such as topography and distribution of wetlands, which affect the retention and cycling of mercury in the environment. In order to obtain data on background total mercury concentrations in NB surface waters and ground-truth the EC model, mercury sampling was conducted in the fall of 2004, 2005 and 2006. In addition to surface water samples, sediment samples were collected from some sites for total mercury analysis. Preliminary results from 2004 and 2005 indicate that total mercury concentrations in the sampled lakes range from 0.4 to 6.3 nanograms per litre (ng/L), which is below the CCME freshwater inorganic mercury water quality guideline of 26
ng/L for the protection of aquatic life. Preliminary methyl mercury data indicate that all surface water samples had concentrations of <1 ng/L. Dr. Karen Kidd of the Canadian Rivers Institute and University of New Brunswick in Saint John is also conducting mercury research in the province. Dr. Kidd has conducted an assessment of mercury levels in selected river systems and ecosystem food webs. From 2001-2004 invertebrates and fish samples were collected and analyzed for total mercury and water parameters. In 2005 and 2006, Dr. Kidd started to examine year-to- year variability in mercury concentrations and look at locations near and far from point sources. Her current research involves developing the use of water striders and Old Man’s Beard (lichens) as indicators of mercury contamination. Mercury monitoring and research is ongoing through the University of New Brunswick and the Collaborative Mercury Research Network (COMERN). Researchers are working on or have completed two projects, one studying the dispersion of mine-tailings derived mercury in the Murray Brook area and another large multi-disciplinary project which is a Coastal Case Study to monitor mercury and its effects in the Bay of Fundy. Researchers have also submitted a proposal for the Phase II of COMERN to study mercury and its effects in the Bay of Chaleur. Continuous measurement of total gaseous mercury in ambient air is conducted by Environment Canada at the DENV air quality monitoring site at the Huntsman Marine Science Centre in St. Andrews, New Brunswick. These measurements have been ongoing since 1995. Newfoundland. Newfoundland continues to monitor mercury wet deposition at Cormack NL through the Mercury Deposition Network (MDN). Prince Edward Island. Fish Tissue Sampling The P.E.I. Department of Environment, Energy and Forestry has been conducting fish tissue sampling for mercury since 1998. For the first time, in April of 2005, it was necessary to issue a mercury fish advisory for P.E.I. These exceedences have been confined to one lake and samples collected in January of 2006 from this lake were also in exceedence of the guideline. Sampling will continue in 2007. Innovative Technology Wind Energy Under the Prince Edward Island Renewable Energy Act, the province’s electrical utilities are required to acquire 15% of their electricity from renewable means by 2010. Through buying from renewable energy generators such as the PEI Energy Corporation, a provincial crown corporation, and other private interests, utilities will meet their renewable portfolio standard obligations under the Act by the end of this year. The PEI Energy Corporation owns and operates two wind
facilities in the province. Its latest development, the East Point Wind Plant, was commissioned in January 2007. Located at Prince Edward Island’s most eastern tip, this 30 Megawatt facility is scheduled to produce 90,000,000 kilowatt-hours of emission-free electricity every year. The ten Vestas V-90 turbines will provide an annual displacement of 70,000 tonnes of greenhouse gases by taking advantage of the excellent wind regime in the area. Additionally, the facility will decrease other harmful air emissions that would otherwise be created by burning fossil fuels, including nitrous oxides, sulphur dioxide and mercury. Prince Edward Island has become a world leader in renewable energy, particularly wind power. The Wind Energy Institute of Canada (WAKEN), formerly the Atlantic Wind Test Site, is located at North Cape. WAKEN is Canada’s premier facility for testing and demonstrating wind technology. The Vestas V-90 turbine, although designed and manufactured in Denmark, has Island origins. Prior to its commercial roll-out at East Point and other wind facilities around the world, the V-90 prototype was tested near the WAKEN operations.
Ambient Air Monitoring PEI has been operating, since October 1, 2001, a Tekran 2537 A, continuous total ambient mercury vapour analyser, with a detection limit of <0.1 ng/m3 (25 ppq by volume). We are sharing the data with Environment Canada, who operate a multi station network (CAMNET - Canadian Atmospheric Mercury Measurement Network) across the country. Although there is some seasonal variation in the recorded mercury levels, they are, overall, fairly constant. Of most interest is the long-term and what effect proposed sulphur dioxide and nitrogen oxides reductions will have on mercury.
Quebec.
The MDDEP proceeds to an annual inventory of the atmospheric sources of emission. It contains data on mercury since 1995. The Ministry takes part in another network, which applies a program to follow-up toxic substances in the aquatic environment. This network counts more than 800 different stations making it possible to know the mercury contents in fish. A guideline for fish consumption from fresh water in Quebec is available. This guideline is on the Web site of the MDDEP and it included data from the Hydro-Quebec reservoirs. Hydro-Quebec follows the mercury content of its hydroelectric reservoirs for many years now. The impoundment of hydroelectric reservoirs leads to the conversion of mercury and it would result an increase of mercury in fish for a period, which can go from 10 to 30 years. Hydro-Quebec (http://www.hydroquebec.com/sustainable-development/environnement/pren_soin_maitriser.html) carries out a vast research program on mercury aiming at determining the effects of this increase on the birds and mammals. Hydro-Quebec carries out also research on selenium addition to the water of the reservoirs in order to reduce the mercury contents in fish.

OTHER PARTNERS BioDiversity Research Institute and the Hubbard Brook Research Foundation. The Hubbard Brook Research Foundation’s ScienceLinks team, including the BioDiversity Research Institute, has completed two important journal articles that stand as statements on the overall footprint of the mercury problem in the Northeast. The first study describes the mechanisms by which mercury moves from emissions source to Northeastern biota. The second study identifies the locations and causes of biological mercury hotspots in the Northeast. Results from these studies and other monitoring and research in the northeast are summarized in an interpretive report “Mercury Matters: Linking Mercury Science with Public Policy in the Northeastern United States”, released in January, 2007 (attached; see also http://www.hubbardbrookfoundation.org/filemanager/filedownload/phpMEyvqf/HBRF%20Mercury%20Matters%20corrected%202-12-07.pdf) Over the past eight years Dr. David Evers, Executive Director of the BioDiversity Research Institute (BRI), based in Maine, has led two major mercury research efforts involving academic and environmental agency scientists from across the Northeast, to gather and synthesize mercury data sets from the northeastern United States and southeastern Canada. The first effort was organized through the Northeast Ecosystem Research Cooperative (NERC) with co-leader Dr. Tom Clair of Environment Canada and was funded by the USDA Forest Service Northeastern State Research Cooperative (NSRC). This project culminated in the publication of special issue of the journal Ecotoxicology featuring twenty-one mercury papers. The project pulled together approximately 7,800 observations of mercury in sediments, water, fish, amphibians, birds and mammals in the region (Ecotoxicology, 2005, 14:1-2, 293 pp). Among some of the most significant results in the Ecotoxicology volume were: elevated mercury in terrestrial songbirds were reported for the first time (Rimmer et al. 2005); fish mercury spatial patterns which gave rise to concerns regarding mercury hotspots in the northeast were identified (Kamman et al. 2005); and extremely high mercury concentrations in mink and otter were reported that were used to corroborate the findings on mercury hotspots (Yates et al. 2005). Dr. Evers then authored a BRI companion report to distill the scientific papers for mainstream audiences entitled, “Mercury Connections: the extent and effects of mercury pollution in northeastern North America” (Evers 2005). This report established mercury impact thresholds for fish and wildlife based on existing published literature, and compared these values to the extensive data-base now available for the region. The result was the first map of biological mercury hotspots in the Northeast based on existing contamination levels in yellow perch, brook trout, common loon, bald eagle, otter and mink. In the second major mercury effort, Dr. Evers worked with co-leader Dr. Charles Driscoll of Syracuse University to further refine the biological mercury hotspot map, submit it to the scientific literature, and evaluate the likely causes of these biological hotspots. This
three-year effort resulted in two papers featured on the cover of the January 2007 issue of the peer-reviewed journal BioScience. In the two BioScience papers the authors locate 5 known and 9 suspected biological mercury hotspots in the northeastern U.S. and southeastern Canada. They further implicate atmospheric emissions and deposition of mercury as the primary source of mercury to these areas and suggest that most of the biological hotspots are formed near areas of high deposition near local emission sources, in sensitive landscapes that receive moderate deposition, and reservoirs with summer draw downs greater than 10 feet that promote the production and transport of methyl mercury. Finally, the authors conducted a detailed case study of a biological mercury hotspot in southern New Hampshire and determined that this hotspot exists within an area of high mercury deposition associated with four nearby coal-fired power plants, of which Merrimack Station in Bow, New Hampshire is by far the largest. Through this analysis, they determined that the U.S. EPA underestimated deposition in this location by at least a factor of four. By analyzing emissions reductions scenarios from the four coal-fired power plants, the authors surmised that they are the largest contributor of mercury to this particular biological mercury hotpot and concluded that emissions trading could perpetuate biological mercury hotspots if local emissions continue unabated. On January 9-10, 2007, Dr. Evers joined a team of scientists in a trip to Washington DC to present the results of these two papers. The other participating scientists were Dr. Charles Driscoll – Syracuse University, Dr. Tom Holsen – Clarkson University, and Dr. Jerry Keeler – University of Michigan. There was strong interest in the results among policymakers. Senator Susan Collins used the release of the papers as an opportunity to announce that she is re-introducing legislation calling for a 90% reduction in mercury emissions from coal-fired power plants, as well as a new bill to establish a national mercury monitoring network. Several staff members suggested that they were concerned that the mercury science and research had not been adequately considered when the Clean Air Mercury Rule was developed.

NEIWPCC. NEIWPCC coordinates a regional Mercury-Fish Workgroup that is made up of representatives from the state environmental and public health agencies and EPA Regions 1 and 2. The workgroup meets twice per year to discuss issues related to monitoring mercury in fish and outreach regarding fish consumption advisories. In 2006, the workgroup covered the following topics: supermarket outreach, Vermont’s mercury monitoring strategy, Rhode Island biomonitoring project, New Hampshire’s Women’s Outreach Project, and FishScam. The next meeting (scheduled for April 2007) will address focus group testing for outreach materials, mercury concentrations in marine fish, and regional mercury research efforts. Each meeting also allows the states to share general updates of the important issues in their states regarding mercury in fish and to get feedback from other states and EPA on ongoing projects. NESCAUM.
Through the NEG-ECP Mercury Action Plan total in-region emissions from municipal waste combustors and medical waste incinerators in the Northeast have been dramatically reduced. More recently, many eastern states including Massachusetts, Connecticut, New Hampshire, New York, New Jersey and Pennsylvania have proposed or adopted regulations to control Hg emissions from coal-fired power plants by up to 95% in the 2012-2015 time frame. With emissions from these major stationary point sources better controlled, non-point source or area sources of mercury emissions, including the combustion of fuel oil in residential and commercial burner,s are a much larger fraction of current regional emissions (see Inventory of Anthropogenic Mercury Emissions in the Northeast. NESCAUM (Boston, MA), available at http://www.nescaum.org/documents/inventory-of-anthropogenic-mercury-emissions-in-the-northeast/rpt051130ne2002mercury_invrpt.pdf/)
Current state emission inventories indicate that residential/commercial heating with distillate oil may account for 57% of Hg emissions from all area sources in the entire Northeast. This amounts to 15% of total Hg emissions in the region. However, the estimates for oil combustion in residential and commercial burners are based on national USEPA emissions factors that are highly uncertain and highly variable across the region and among seasons. For a number of reasons, including a preliminary Canadian assessment of mercury in crude oils refined in Canada, many scientists believe that these estimates are high and that actual regional emissions from these sources are likely to be considerably lower.
In 2006, MA and ME provided initial seed money to NESCUAM to begin to better evaluate mercury emissions from these sources and to assess whether lower sulfur fuels might have lower mercury levels. NESCAUM initially gathered available data on mercury levels in crude oils and distillate fuels and reviewed sampling and analytical methods for obtaining better data. Based in part on this initial work, NESCAUM submitted and was awarded a New York State Energy Research and Development Agency (NYSERDA) grant to complete sampling and analysis of distillate fuels in the

northeast. This data will enable the region to better understand the relative contribution of this source category to overall Hg emissions. It is anticipated that this research project, which will be conducted over the next two years, will result in a lower overall Hg emission estimate for the region.
The proposed project will also determine the levels of S and at least two other metals, Ni and V, in the distillate products used in the region. The goal of the S analysis is twofold: (1) to determine the actual S content (including its range) of fuels in the marketplace and (2) to attempt to determine if a correlation exists between S and Hg (and other trace metal) content in distillates. The metals analysis is intended to better characterize the amount of heavy metals (particularly Hg) being emitted into the atmosphere through the combustion of heating oil and other distillate products. In an attempt to get at the large discrepancy between various emission factors and to evaluate the possible relationship between fuel S and Hg content, the proposed analysis will include sampling heating oil (2,500 ppm S), non-road fuel (500 ppm S) and highway diesel (15 ppm S). Because sulfur and mercury chemically interact, regional state scientists have hypothesized that lower sulfur fuels may also have lower levels of mercury. If correct, use of lower sulfur fuels may provide a mercury reduction benefit in addition to reductions in acid gas sulfur emissions.
USEPA-New England Regional Activities. EPA continues to support mercury monitoring and research. Highlights include: • Connecticut River EPA NE has completed an assessment on the human and
ecological risks of fish collected in eight reaches of the Connecticut River. EPA worked with a number of state agencies in finalizing the report, including; NEIWPCC, USFWS, USGS, CT DEP, CT F&G, MADEP, NHDES, NH F&G, VT DEC, and VT F&G. The report was presented to the public in October 2006.
• EPA NE Regional Environmental Monitoring and Assessment Program (REMAP) is coordinating with the national Lakes and Ponds Study. Fish will be collected and tested for mercury levels from a randomly selected set of lakes and ponds in New England. The data will be used to determine the existing status of mercury contamination in fish tissue and to compare this to mercury levels measured in water samples and zooplankton.
• EPA NE, through a Regional Applied Research Project is modeling biogeochemistry and trophic transfer of mercury within a riparian wetland. This research will provide new data on the rate of biomagnification of methyl mercury with in the terrestrial component of a riparian habitat·
• EPA is supporting research to predict mercury levels in fish-eating birds to estimate potential population impacts to these birds, especially common loons. This information will be incorporated into a larger GIS-based integrated model, MERGANSER that will identify New England watersheds within which fish and fish-eating birds are at risk for mercury contamination.
SECTION IV
Briefing Book for the 2-11-07 Ministerial Forum in Québec City

Energy Efficiency / February 11–12, 2007 1
M I N I S T E R I A L F O R U M O N E N E R G Y & E N V I R O N M E N T
Section I
Energy Efficiency
Briefing BookMinisterial Forum on Energy & Environment
February 11-12, 2007
Chateau Frontenac Québec City, Québec
Conference of New England Governors and Eastern Canadian Premiers

Table of Contents / February 11–12, 20072
M I N I S T E R I A L F O R U M O N E N E R G Y & E N V I R O N M E N T
Table of Contents
Table of Contents / February 11–12, 2007 1
M I N I S T E R I A L F O R U M O N E N E R G Y & E N V I R O N M E N T
Table of Contents
TABLE OF CONTENTS
Summary of Recommendations ...................................................................3
Section I: Energy Efficiency ............................................................................7
Section II: Energy Trade ................................................................................23
Section III: Renewable Energy .....................................................................43
Section IV: Transportation ............................................................................55

Summary of Recommendations / February 11–12, 20072
M I N I S T E R I A L F O R U M O N E N E R G Y & E N V I R O N M E N T
Summary
Summary of Recommendations / February 11–12, 2007 3
M I N I S T E R I A L F O R U M O N E N E R G Y & E N V I R O N M E N T
SummarySUMMARY OF RECOMMENDATIONS
SECTION 1: ENERGY EFFICIENCY
The Governors and Premiers recognize that energy efficiency must be the first and foremost step taken for environmental protection, energy security and economic development. They agree to develop a process to recognize innovative or profound commitments to energy efficiency by residents and companies, and consistently point to the beneficial connection between the efficient actions of individuals and large-scale economic and environmental effects.
1. The Governors and Premiers direct the NEG/ECP Climate Change Steering Committee to evaluate the costs and benefits and recommend best implementation approaches for programs that would include but not be limited to:a. The adoption of appliance and equipment efficiency standards, especially ones
that are proposed to be adopted consistently across many states and provinces, and the Energy Star Standards on a state/provincial and regional level;
b. The establishment of an Energy Performance Standard code for all publicly-funded new construction and major renovations;
c. The use of the latest model building energy codes for increasing energy efficiency in new residential and commercial structures;
d. Additional methods or procedures for enhancing code enforcement to achieve the maximum potential for energy savings.
2. The Governors and Premiers instruct regulators and crown corporations to prioritize energy efficiency through planning and acquisition processes that let efficiency compete with supply and capacity and ensure that cost-effective and practical energy efficiency opportunities that are lower than prices bid for conventional supply or capacity are procured.
3. The Governors and Premiers direct the NEG/ECP Climate Change Steering Committee to propose a framework in order to develop and adopt common measurement and verification protocols for energy efficiency savings.

Summary of Recommendations / February 11–12, 20074
M I N I S T E R I A L F O R U M O N E N E R G Y & E N V I R O N M E N T
Summary SECTION 2: ENERGY TRADE
ELECTRICITY
4. The Governors and Premiers direct the Northeast International Committee on Energy (NICE), in collaboration with representatives from the system operators and market participants (where appropriate), to: a. Evaluate interconnect and seams issues that inhibit the cost-effective transmission
of electricity within the region;• Identify and rework transmission rate structures that inhibit cost-effective
transmission;b. Encourage increased utilization of existing transfer capabilities between Québec/
New Brunswick and New England;c. Explore mechanisms to facilitate and promote the expanded use of long-term
contract structures with the current market design in New England that could support further development of transmission and resource investment, including the creation of long-term contract mechanisms to support renewable resources and infrastructure development;
d. Explore actions to ease integration of intermittent resources (like wind power) across the region to expand the amount of renewable power; • Work with the New Brunswick ISO, Nova Scotia Power Inc., Hydro Québec,
Newfoundland & Labrador Hydro, the ISO-New England, Inc. and other pertinent organizations to evaluate how the ‘balancing’ of intermittent resources may be enhanced and supported.
NATURAL GAS
5. The Governors and Premiers recognize that natural gas has the ability to replace oil-fired generation, and in doing so, greatly reduce greenhouse gas emissions: therefore, the NICE is directed to develop initiatives that will enhance the transmission and distribution of natural gas, including:a. Monitor infrastructure developments and assess the potential for regional
supplies, and coordinating efforts in the regulatory arena to enhance regional economic development, energy security and environmental goals;
b. Share ideas on natural gas efficiency programs to ensure that cost-effective energy savings, emission reductions and investments are assessed and implemented.

Summary of Recommendations / February 11–12, 2007 5
M I N I S T E R I A L F O R U M O N E N E R G Y & E N V I R O N M E N T
SummarySECTION 3: RENEWABLES
6. In order to support renewable power acquisition systems and renewable cross-border trading in which longer-term contracts are possible andto manage risks and control costs (regardless of the state of retail competition), Governors and Premiers direct the Northeast International Committee on Energy (NICE) in conjunction with the NEG/ECP Climate Change Steering Committee to: a. Explore a regional credit transfer and trading mechanism; b. Support application of portfolio management and continuity for utility and
provider of last resort (POLR) service; c. Promote the trade and expansion of new energy technologies and equipment in
the region, where cost-effective and environmentally beneficial; d. Explicitly use government operations as an opportunity for leadership in long-
term sustainable decision-making for investments in energy efficiency and renewable energy.
7. Governors and premiers ask their respective energy departments/agencies to review individual renewable portfolio standards (RPS) criteria relative to renewable sources not included in jurisdictional standards, and promote greater harmonization between state RPS and provincial procurement standards.
Summary of Recommendations / February 11–12, 20076
M I N I S T E R I A L F O R U M O N E N E R G Y & E N V I R O N M E N T
Summary SECTION 4: TRANSPORTATION
8. Governors and premiers shall appoint a regional standing task force of air policy and transportation officials to pursue the implementation of the commitments included in this document, or any other transportation initiatives to reduce air emissions, and to set a regional goal for greenhouse gas reductions from the transportation sector.This standing committee is directed to produce a regional transportation action plan proposal for submission to the 2008 Conference of New England Governors and Eastern Canadian Premiers. The initial priority actions to be considered are:a. Development of biofuels to address CO
2 and other air emissions that use local
feedstocks and technologies; b. Promotion of fuel efficiency in all modes of transportation through incentives
for efficient technologies on the market, research and development initiatives for new and emerging technologies, partnerships with the private sector, and public awareness programs;
c. Expansion of alternative transportation and commuter services and facilities; d. Alignment of infrastructure funding with energy and climate goals by encouraging
energy-efficient development in municipalities and regional entities;e. Use of life-cycle greenhouse gas and carbon emission analyses to set indicators for
policy and project planning, when appropriate; andf. Collaboration with the private sector to seek new opportunities to enhance
regional interconnectivity and efficiency of freight networks in the region.
9. Governors and Premiers will adopt clean car programs including the CO2 and air
quality standards, such as California standards, throughout the entire region.
Energy Efficiency / February 11–12, 2007 7
M I N I S T E R I A L F O R U M O N E N E R G Y & E N V I R O N M E N T
Section I
Energy Efficiency
Section I
Recommendations on
Expanding Regional Energy Efficiency
Initiatives

Energy Efficiency / February 11–12, 20078
M I N I S T E R I A L F O R U M O N E N E R G Y & E N V I R O N M E N T
Section I
Energy Efficiency

Energy Efficiency / February 11–12, 2007 9
M I N I S T E R I A L F O R U M O N E N E R G Y & E N V I R O N M E N T
Section I
Energy Efficiency
Acknowledgements
Section I - Energy Efficiency
This section was initially based on the NEG/ECP White Paper on Renewables and Energy Efficiency adopted by the NEG/ECP in June 2006. This document was drafted principally by the Regulatory Assistance Project (RAP) with further assistance from the National Renewable Energy Laboratory (NREL), the Northeast Energy Efficiency Project (NEEP) and members of the NEG/ECP Climate Change Steering Committee.
The initial set of recommendations in the White Paper were augmented by the outcomes of the NEG/ECP Energy Dialogue on Renewables and Energy Efficiency held in Prince Edward Island in October 2006. The outcomes of this event were redrafted by Environment Northeast (ENE) and NEEP.
As noted in the Section II acknowledgements, ENE’s “Climate Change Roadmap for New
England and Eastern Canada” (12/06) was atimely resource in the development of this section and its recommendations. NEEP’s 2005 study on energy efficiency potential in the northeast was also a major seminal document for this section. NEEP and ENE also provided the introductory materials to this section.

Energy Efficiency / February 11–12, 200710
M I N I S T E R I A L F O R U M O N E N E R G Y & E N V I R O N M E N T
Section I
Energy Efficiency
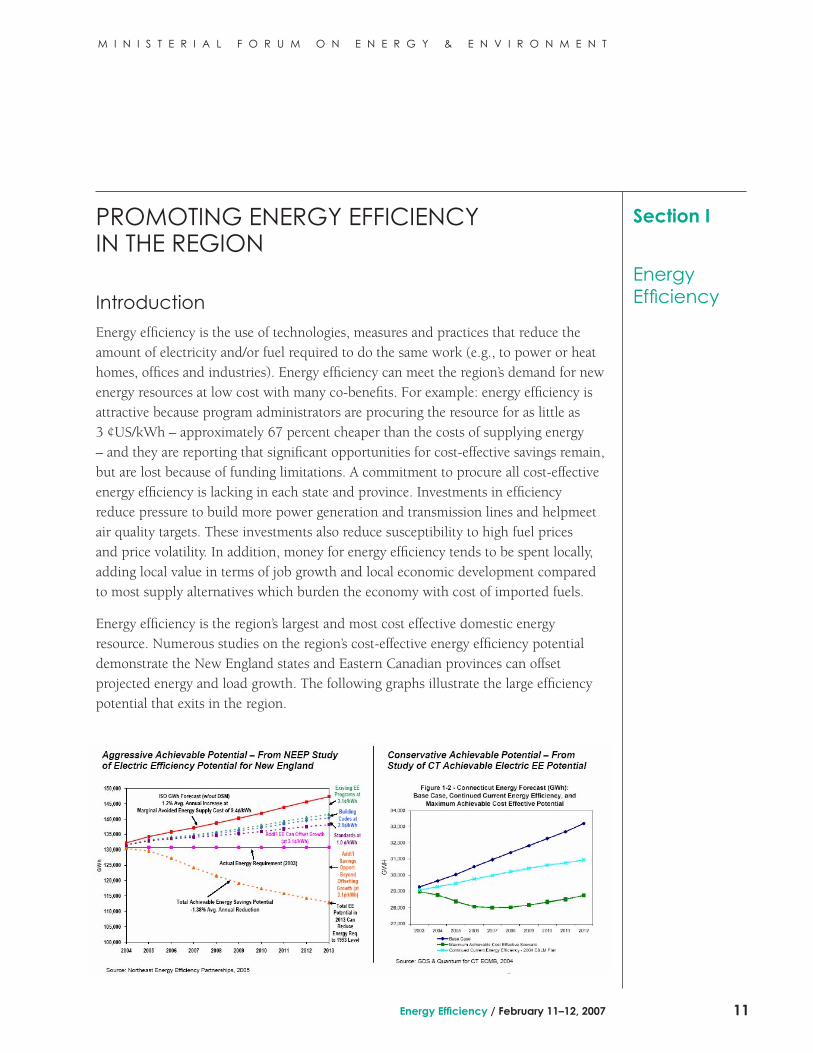
Energy Efficiency / February 11–12, 2007 11
M I N I S T E R I A L F O R U M O N E N E R G Y & E N V I R O N M E N T
Section I
Energy Efficiency
PROMOTING ENERGY EFFICIENCY IN THE REGION
Introduction
Energy efficiency is the use of technologies, measures and practices that reduce the amount of electricity and/or fuel required to do the same work (e.g., to power or heat homes, offices and industries). Energy efficiency can meet the region’s demand for new energy resources at low cost with many co-benefits. For example: energy efficiency is attractive because program administrators are procuring the resource for as little as 3 ¢US/kWh – approximately 67 percent cheaper than the costs of supplying energy – and they are reporting that significant opportunities for cost-effective savings remain, but are lost because of funding limitations. A commitment to procure all cost-effective energy efficiency is lacking in each state and province. Investments in efficiency reduce pressure to build more power generation and transmission lines and helpmeet air quality targets. These investments also reduce susceptibility to high fuel prices and price volatility. In addition, money for energy efficiency tends to be spent locally, adding local value in terms of job growth and local economic development compared to most supply alternatives which burden the economy with cost of imported fuels.
Energy efficiency is the region’s largest and most cost effective domestic energy resource. Numerous studies on the region’s cost-effective energy efficiency potential demonstrate the New England states and Eastern Canadian provinces can offset projected energy and load growth. The following graphs illustrate the large efficiency potential that exits in the region.

Energy Efficiency / February 11–12, 200712
M I N I S T E R I A L F O R U M O N E N E R G Y & E N V I R O N M E N T
Section I
Energy Efficiency
Without a heightened focus on the efficiency with which the region consumes energy and implemented action steps, our electricity demand will likely continue to increase at a pace of approximately 1.2% per year. Importantly, as energy prices rise, so do the cost savings and potential for cost-effective energy efficiency. The following graph depicts the relative cost of energy supply resources versus energy demand efficiency resources.
A determined effort is needed on energy efficiency for the following reasons:
• Policies promoting energy efficiency save taxpayers, consumers and utility ratepayers money and keep dollars in the local economy where they can circulate and be reinvested;
• High and volatile energy prices and an over-dependence on imported energy;• Policy solutions for capturing efficiency resources are well defined with numerous
successful programs operating for more than a decade and a bevy of studies demonstrating the potential and mechanics for implementing such programs;
• Technologies such as advanced lighting (e.g., Super T-8 lighting systems, LED exit signs and traffic lights, compact fluorescent lamps and fixtures), high efficiency air conditioning equipment and motors, and 90% efficient furnaces have matured and are ready for widespread adoption;
• Long-range energy planning frameworks necessitate prudent planning for business, stakeholders, and policymakers which takes advantage of our low-cost, non-pollution, native energy resource – efficiency.
Electric Supply Costs vs. Efficiency Investment Costs
Source: Environment Northeast (ENE), Climate Change Roadmap for New England and Eastern Canada (2006). Data: CEEF (CL&P & UI) 2006 Plan for efficiency, ISO New England 2005 Annual Markets Report for supply.
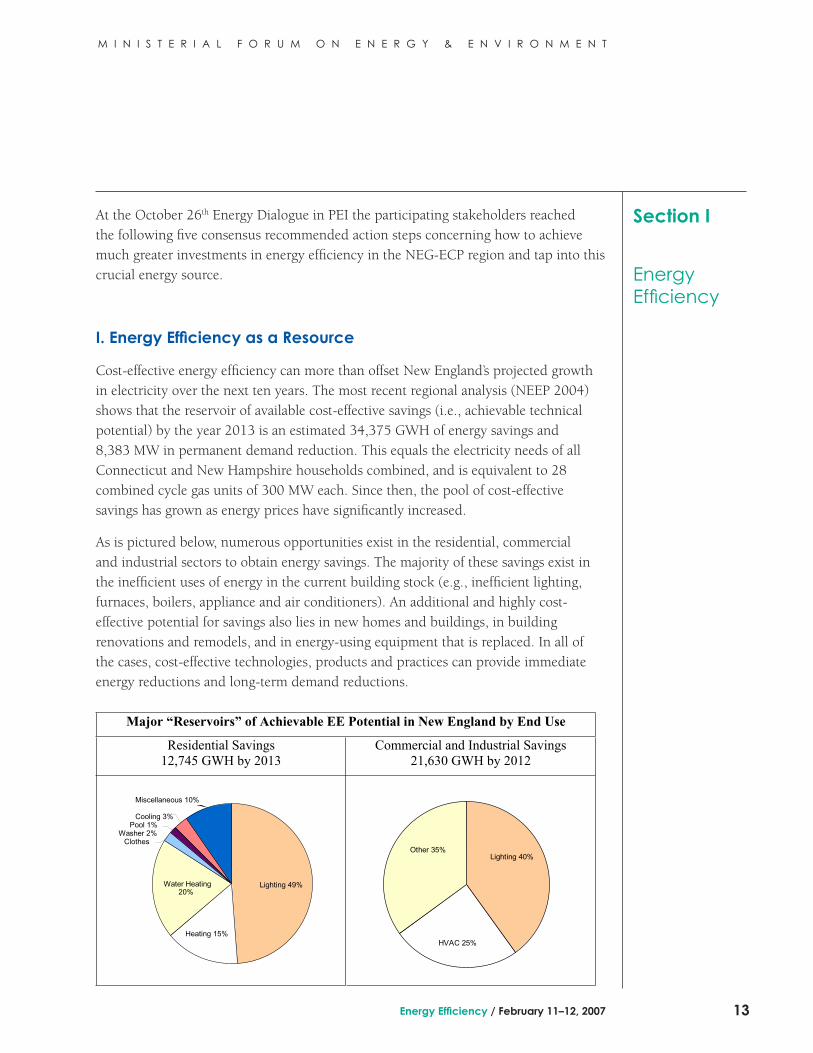
Energy Efficiency / February 11–12, 2007 13
M I N I S T E R I A L F O R U M O N E N E R G Y & E N V I R O N M E N T
Section I
Energy Efficiency
At the October 26th Energy Dialogue in PEI the participating stakeholders reached the following five consensus recommended action steps concerning how to achieve much greater investments in energy efficiency in the NEG-ECP region and tap into this crucial energy source.
I. Energy Efficiency as a Resource
Cost-effective energy efficiency can more than offset New England’s projected growth in electricity over the next ten years. The most recent regional analysis (NEEP 2004) shows that the reservoir of available cost-effective savings (i.e., achievable technical potential) by the year 2013 is an estimated 34,375 GWH of energy savings and 8,383 MW in permanent demand reduction. This equals the electricity needs of all Connecticut and New Hampshire households combined, and is equivalent to 28 combined cycle gas units of 300 MW each. Since then, the pool of cost-effective savings has grown as energy prices have significantly increased.
As is pictured below, numerous opportunities exist in the residential, commercial and industrial sectors to obtain energy savings. The majority of these savings exist in the inefficient uses of energy in the current building stock (e.g., inefficient lighting, furnaces, boilers, appliance and air conditioners). An additional and highly cost-effective potential for savings also lies in new homes and buildings, in building renovations and remodels, and in energy-using equipment that is replaced. In all of the cases, cost-effective technologies, products and practices can provide immediate energy reductions and long-term demand reductions.
Major “Reservoirs” of Achievable EE Potential in New England by End Use
Residential Savings12,745 GWH by 2013
Commercial and Industrial Savings 21,630 GWH by 2012
Pool 1%Cooling 3%
Water Heating 20%
Heating 15%
Lighting 49%
ClothesWasher 2%
Miscellaneous 10%
HVAC 25%
Other 35%Lighting 40%
Energy Efficiency / February 11–12, 200714
M I N I S T E R I A L F O R U M O N E N E R G Y & E N V I R O N M E N T
Section I
Energy Efficiency
One-third of the economically achievable energy savings in the residential sector can be achieved through programs and policies that capture “lost opportunity” savings when customers purchase new or replacement equipment, or homes are built, renovated or remodeled. Retrofit programs arenecessary to capture the remaining two-thirds. For the commercial and industrial sectors, lost opportunity policies and programs can capture 25 percent of the economically achievable energy savings.Commercial and industrial retrofit programs would be needed to capture the remaining 75 percent.
II. Barriers to Realizing the Energy Efficiency Potential
To tap the potential of energy efficiency as a priority resource, policies and programs must overcome market barriers that impede the natural market adoption of energy efficiency measures and practices. These barriers, well documented in a range of studies, include:
1. Lack of information: To make informed decisions regarding energy efficient purchases, consumers need ready access to timely and appropriate information.However, information on cost savings and performance ratings of energy efficient products is not always available. When information is not easily accessible, the time and resources to get the information reduce the likelihood that consumers will choose the energy efficient option.
2.Lack of Product Availability: Even if a consumer decides to purchase and install high efficiency products and is well-informed, product and service options are not as widespread for energy efficiency as they are for standard products. In the case of replacing failed equipment (an appliance, furnace, etc.), a higher priority is functionality as soon as possible versus energy efficiency or long-term operating costs.
3. Misplaced/Split Incentives: “Misplaced” or “split” incentives occur when an entity acting to increase energy efficiency does not receive the economic benefits of doing so. A classic example is the landowner/tenant relationship where the tenant must pay their energy bills and would benefit from the installation of energy efficient products (e.g., efficient heating and cooling equipment). However, the property owner responsible for purchasing and maintaining the equipment has no economic incentive to select more efficient models or to replace existing inefficient equipment as they do not directly benefit from the resulting energy bill savings. “Split incentives” also exist in the relationship between builders and owners. Most architects, engineers and builders minimize upfront costs when deciding what energy-using technologies to install for a property owner.
Energy Efficiency / February 11–12, 2007 15
M I N I S T E R I A L F O R U M O N E N E R G Y & E N V I R O N M E N T
Section I
Energy Efficiency
4. Capital Constraints: While energy efficient technology has become more affordable in recent years, the up-front costs of these “premium” products are typically higher than those of standard products. Consumers do not always have the additional capital to pay the higher incremental cost of efficient products even if these costs are offset by lower energy bills. Businesses, too, often have capital constraints that discourage energy efficiency investments. In some cases, firms have limited capital for equipment purchases, particularly for equipment that is still functional. Many firms focus on short-term profitability and require a quick return on investments. As a result, efficiency investments which could save the firm money over the long-term, are often overlooked because their higher upfront costs and longer payback period conflict with short-term goals. Managers who are rated on short-term earnings often view investments in high efficiency products as risky. This is exacerbated when firms lack personnel to assess potential savings from efficient products.
5. Utility Financial Disincentives: The ratemaking structure of electric and gas distribution companies is a barrier to increased energy efficiency. Distribution company rates are typically established based on the cost of service and forecasted energy sales. As a result, distribution company revenue and profit margin is directly dependent on the amount energy sold. Under this construct, a reduction in sales due to the success of efficiency programs can harm a distribution company’s financial performance.
6. Inaccurate Price Signals: The majority of consumers do not receive accurate price signals about the value of energy efficiency. The cost for electric and gas supplies varies greatly depending on seasonal demand and the time of use. However, the monthly bill for the majority of consumers is averaged and does not reflect the time-differentiated costs of energy use. These consumers, therefore, have little incentive to reduce consumption during peak time periods.
III. Overcoming Barriers to Cost-Effective Energy Efficiency
To overcome the market barriers to energy efficiency, a regionally coordinated multi-pronged, multi-year strategy is needed with the long-term goal of acquiring all cost-
effective energy efficiency. The New England States and Provinces can accomplish this by integrating energy, economic and environmental initiatives for energy efficiency into a cohesive overall plan for economic development and environmental sustainability. Key elements of these initiatives include:
Energy Efficiency / February 11–12, 200716
M I N I S T E R I A L F O R U M O N E N E R G Y & E N V I R O N M E N T
Section I
Energy Efficiency
• Establish and regularly update minimum energy standards for equipment and buildings (e.g., appliance efficiency standards, building energy codes).
• Make government buildings and purchasing practices leading examples for energy efficiency through energy efficiency requirements above minimum energy codes and standards.
• Establish energy efficiency as a first priority for utility procurement to meet customer energy needs through a portfolio of programs structured to leverage resources to overcome market barriers to efficiency in each market segment.
• Align utility company financial performance with increased energy efficiency. • Provide price signals to consumers that reflect the full value of energy efficiency and
demand reduction.• Invest in the capacity and the information needed to plan, measure, verify, track and
report the energy, economic and environmental impacts of these initiatives across the region.
This requires leadership from the top levels of government, a commitment to regional cooperation and exchange, and productive partnerships with public interest organizations, business and industry.
IV. Energy Efficiency Initiatives
ACTION ITEM 1
▲
The Governors and Premiers direct the NEG/ECP Climate Change Steering Committee to evaluate the costs and benefits and recommend best implementation approaches for programs that would include but not be limited to the following.
a. The adoption of appliance and equipment efficiency standards, especially ones that are proposed to be adopted consistently across many states and provinces, and the Energy Star Standards on a state/provincial and regional level;
Appliance and equipment efficiency standards serve to remove from the market products that are more expensive to operate, but that are attractive to consumers because of their low sticker prices despite their higher total lifecycle costs and waste of society’s resources. Such standards have been adopted in a number of states.
Energy Efficiency / February 11–12, 2007 17
M I N I S T E R I A L F O R U M O N E N E R G Y & E N V I R O N M E N T
Section I
Energy Efficiency
“Conventional” investments are more efficient, leaving efficiency programs to address other opportunities. Recent research has developed a package to products for which new or improved standards would be beneficial, and model legislation is under consideration throughout the New England states. In Connecticut the package of standards was passed into law in 2004, whereby policymakers approved a measure that will allow state regulators to update and add to the list of products for which minimum energy efficiency standards are set in order to keep up with technological opportunities for efficiency as they present themselves.
Some have expressed the concern that such standards should be national. History is filled, however, with examples of states taking their own actions to set standards, and the federal government followed in its own time. This suggests that a well-supported standard adopted by many states has been and continues to be a useful strategy to raise the energy quality of products for sale. Regional coordination addresses the concern of a “patchwork” effect.
Section 104 of the U.S. Energy Policy Act of 2005 (EPACT 2005) requires federal agencies to procure ENERGY STAR products or products designated by the U.S. Department of Energy’s (US DOE) Federal Energy Management Program to be among the highest 25% of equivalent products in terms of energy efficiency. Canada’s federal government has a similar requirement. If state and provincial government also adopt this policy, it will save taxpayers millions of dollars in avoided energy costs. In addition, this use of public dollars will help to transform the markets for efficiency products. Products that this policy would apply to include refrigerators, furnaces and boilers, air conditioners, lighting, computers, copiers and other office equipment.1 The purchase of ENERGY STAR products should be mandatory unless the state or province’s purchasing officer demonstrates the qualifying product would not meet performance requirement or would not be cost-effective including energy cost savings of the product’s life.
b. The establishment of an Energy Performance Standard for all publicly-funded new construction and major renovations;
It is important that states and provinces adopt energy performance standards that go beyond minimum model energy code requirement for new construction and major renovations of publicly funded buildings. An Energy Performance Standard (EPS) should initially be at a target of 30% more energy efficient than a reference case until 2010, and then move to 50% better than a reference case in the following years. Options for the reference case include the average energy efficiency for new
1 For a complete list of ENERGY STAR products see http://www.energystar.gov/.
Energy Efficiency / February 11–12, 200718
M I N I S T E R I A L F O R U M O N E N E R G Y & E N V I R O N M E N T
Section I
Energy Efficiency
construction energy in the region or the efficiency level established by the latest model building energy code.
Efficiency Vermont estimates an upfront investment in comprehensive energy design for a new commercial building costs $2-3 per square foot and delivers $.40 to $1 in cost savings each year – meaning high-performance efficiency measures pay for themselves after approximately four years and thereafter accrue cost savings for taxpayers. National experts estimate that you can build at 50% above code for an initial building cost increase of only 0 to 2%.
The US Energy Policy Act of 2005 sect requires new federal buildings to meet a 30% performance standard.
Establishing an EPS for all publicly funded buildings paves the way for voluntary EPS for private sector new construction and major renovations. It is possible to use building permit fee to generate revenue to pay for rebates for meeting target efficiency performance levels and code inspection. Larger rebates could be awarded to private sector buildings that meet higher levels of energy performance, such as 50% or 75% better than the reference case. A national U.S. initiative, Getting to Fifty™ provides information and a growing database of case studies to help building professionals design commercial and institutional buildings with energy performance 50 percent beyond ASHRAE 90.1-2001 and thereby access EPACT 2005 tax benefits.2
By some estimates, the built environment is responsible for nearly half of all energy use, so identifying policies that can reduce the energy use and associated GHG emissions from buildings is essential. Considering that the average lifespan of a new or renovated building is over 50 years leads to the recommendation that our building stock should be constructed in a manner that locks in energy efficiency for that time frame. The International Energy Conservation Code (IECC) model is continuously updated for residential and commercial buildings to maintain a standard for minimum energy efficient design and construction. However, only two of the six New England states have adopted the 2003 model energy codes for residential buildings and only three have adopted them for commercial buildings. The provinces are left with a choice as to whether they want to make federal Canadian model building energy codes mandatory within their boundaries, but none have chosen to do so.
Sizable energy savings can be achieved if the states and provinces commit to formally adopting the latest model building energy codes within six months of their publication. The greatest challenge is to achieve high levels of energy code compliance. Studies in New England and New York suggest compliance levels of 50%
2 For more information about Getting to Fifty™ see www.advancedbuildings.net,

Energy Efficiency / February 11–12, 2007 19
M I N I S T E R I A L F O R U M O N E N E R G Y & E N V I R O N M E N T
Section I
Energy Efficiency
or less in the residential sector. Stronger enforcement requires training and technical support resources for the building and design community. It also requires a mandate to achieve high levels of energy code compliance with resources for stronger and more informed energy code enforcement, and a system to track and report to ministers and commissioners compliance levels and issues.
A helpful next step would be to quantify the energy cost savings and environmental benefits that could be achieved with this model energy code adoption policy and full compliance with the model energy code provisions for new buildings and major renovations. In addition, the states and provinces would benefit from model policies and programs to achieve high levels of compliance from up-to-date building energy codes. A resource to assist this effort is the Northeast Regional Building Energy Codes Project serving a ten-state region with partial funding from U.S. DOE.3
c. The use of the latest model building energy codes for increasing energy efficiency in new residential and commercial structures;
Building Energy Codes also improve the “business as usual” condition of residential and commercial premises. Yet they are not used by most states and provinces, or, where they are adopted they are older versions. Model codes (adapted for the relevant climate) for residential and commercial buildings are maintained and updated regularly by reliable organizations, so states can adopt them and update them with confidence. Enforcement and continued training programs arestumbling blocks in some states, but other states adopt the codes as a standard and challenge the building industry to meet it without worrying about enforcement. State governments can also use the codes for their own building construction and for buildings financed by the states.
d. Additional methods or procedures for enhancing code enforcement to achieve the maximum potential for energy savings.
3 See http://www.neep.org/energycodes/index.html

Energy Efficiency / February 11–12, 200720
M I N I S T E R I A L F O R U M O N E N E R G Y & E N V I R O N M E N T
Section I
Energy Efficiency
ACTION ITEM 2
▲
The Governors and Premiers instruct regulators and crown corporations to prioritize energy efficiency through planning and acquisition processes that let efficiency compete with supply and capacity and ensure that cost-effective and practical energy efficiency opportunities that are lower than prices bid for conventional supply are procured.
Establishing a planning process requiring utilities to procure all cost-effective efficiency resources when they are cheaper than prices bid for conventional supply or capacity should be a top priority for the New England states and Eastern Canadian provinces.This requirement should apply for all utility energy customers (gas and electric) and for customers of providers of last resort (standard offer). Consider that New England electric spot market prices in 2005 averaged $80/MWh in 2005 whereas reductions in energy consumption through efficiency programs in the region typically cost between $10 to $40 per MWh. Creating a planning and acquisition process whereby utilities must procure all cost-effective energy efficiency where it is available at a lower cost than supply resources on behalf of their customers, will ensure lower energy bills. In June 2006, Rhode Island adopted a least-cost procurement requirement for meet the energy needs of Standard Offer Supply customers through the passage of the “Comprehensive Energy Conservation, Efficiency, and Affordability Act of 2006”.
California’s loading order specifies energy efficiency and demand response are the preferred resource for meeting the state’s energy needs. Only after all cost-effective efficiency and demand response are procured will other sources of energy be pursued. To the extend efficiency and demand response cannot satisfy growing energy and capacity needs, then renewables and distributed generation, including combined heat and power applications are to be tapped. After that, clean and efficiency fossil-fired generation is allowed. This policy has been codified in statute by SB 1037 (2005) and is used by the California PUC to direct the state’s large utilities on their choice of resources to meet their customers’ energy needs.
The process of allowing efficiency to compete should not only apply to meeting energy needs but should extend to capacity needs as well. Maine and Connecticut have passed laws permitting demand side measures to compete with supply sources to meet statutory capacity obligations. Maine recently adopted the “Act To Enhance Maine’s Energy Independence and Security,” P.L. 2005, ch. 677 which gives the Maine PUC the authority to include energy efficiency in bidding for standard offer service (Maine PUC has opened a docket on this provision) and the Maine PUC is given authority to include energy efficiency resources in a new state RFP process for generating capacity (Maine PUC opened a docket on this provision as well). These provisions
Energy Efficiency / February 11–12, 2007 21
M I N I S T E R I A L F O R U M O N E N E R G Y & E N V I R O N M E N T
Section I
Energy Efficiency
have the potential to greatly increase efficiency investments in Maine but attention to implementing the emerging rules fairly will be required. In Connecticut, The Energy Conservation Management Board is examining ways to reach the goal of level load growth and funds from new efficiency policies, including the Class III efficiency/DG portfolio standard are included in planning on ways to meet the target.
The stakeholders assembled at PEI recognized it would be helpful to create and distribute legislative language or a model rule that would facilitate the process of procuring all cost effective and empower PUC’s to take action. See below for a discussion of removing caps on efficiency that are a barrier, which need to be accompanied by establishing an “all cost-effective efficiency procurement” mandate similar to what Rhode Island adopted in June.
ACTION ITEM 3
▲
The Governors and Premiers direct the NEG/ECP Climate Change Steering Committee to propose a framework in order to develop and adopt common measurement and verification protocols for energy efficiency savings.
In increasing reliance on energy efficiency as a strategy to meet energy, economic and environmental goals, the states and provinces must ensure that the measurement, verification and reporting of savings from EE investments are:4
• Reasonable and defensible, providing sufficient credibility, accuracy, and certainty;• Transparent, based on documented sources that are readily available; and• Consistent, in terms of reporting requirements so that savings can be tracked and
aggregated on a comparable basis.Currently, the states measure, value and report electric energy efficiency program savings according to measurement and verification (M&V)5 methodologies, economic frameworks, and assumptions approved by their respective regulatory commissions.The methods and frameworks used within each state have, to date, provided reliable energy efficiency savings data for the purposes they were developed: to inform program cost-effectiveness, recovery of lost base revenues, and awarding performance incentives based on achieved goals. The development of M&V protocols is still in
4 These criteria are based on: “Building From First Principles of Good Energy Modeling.” Ken Colburn, Executive Director of Northeast States for Coordinated Air Use Management (NESCAUM). Presented at: Northeast Energy Efficiency Partnerships, Inc. 2004 Conference on “Energy Efficiency: Policy and Applied Policy” on November 17-18 in Waltham, MA. http://bronze.nescaum.org/committees/modeling/Colburn.ppt. Draft paper in progress.5 Measurement and verification is the confirmation that energy efficiency investments produce the claimed energy and demand savings.

Energy Efficiency / February 11–12, 200722
M I N I S T E R I A L F O R U M O N E N E R G Y & E N V I R O N M E N T
Section I
Energy Efficiency
development in the provinces where experience with efficiency as a resource is less rich. However, if energy efficiency is to be increasingly used as a resource to help meet regional needs, then common protocols will be necessary to ensure consistent and appropriate levels of rigor that match the needs of these varied applications. The need for and approaches to regional M&V protocols is detailed in a recent NEEP report. 6
Currently, the states are collaborating to establish common M&V protocols for use by the ISO New England in its Forward Capacity Market solicitations which will include the opportunity for demand-side resources, including energy efficiency, to compete with supply-side resources for capacity payments to meet future power system reliability needs. This initial effort provides the basis for a broader regional collaboration to develop a complete set of energy efficiency M&V protocols to serve the range of policy initiatives that rely on energy efficiency (i.e., to meet energy, economic and environmental goals). Along with consistent regional M&V protocols, the provinces and states should also establish a common reporting and tracking system that will enable impacts to be aggregated and compared at the regional level.This will minimize the potential for double counting of savings achieved through different energy efficiency policy initiatives, and allow states and provinces to assess the progress and impact of energy efficiency policies.
6 The Need for and Approaches to Developing Common Protocols to Measure, Verify and Report Energy Efficiency Savings in the Northeast: Final Report, January 2006.

Energy Trade / February 11–12, 2007 23
M I N I S T E R I A L F O R U M O N E N E R G Y & E N V I R O N M E N T
Section II
Energy Trade
Section II
Recommendations on
Expanding the Trade of Secure, Cost-Effective
and Cleaner Energy in New England and
Eastern Canada

Energy Trade / February 11–12, 200724
M I N I S T E R I A L F O R U M O N E N E R G Y & E N V I R O N M E N T
Section II
Energy Trade
Energy Trade / February 11–12, 2007 25
M I N I S T E R I A L F O R U M O N E N E R G Y & E N V I R O N M E N T
Section II
Energy Trade
Acknowledgements
Section II – Energy Trade
This section’s text, recommendations and graphics were assembled with the contributions and assistance of ISO-New England, Inc., Transenergie, the New Brunswick System Operator, and the Northeast Gas Association.
Also, an Energy Trade workgroup of state/provincial officials and the regional electric system operators helped steer the structural development of this section.

Energy Trade / February 11–12, 200726
M I N I S T E R I A L F O R U M O N E N E R G Y & E N V I R O N M E N T
Section II
Energy Trade
Energy Trade / February 11–12, 2007 27
M I N I S T E R I A L F O R U M O N E N E R G Y & E N V I R O N M E N T
Section II
Energy Trade
EXPANDING THE TRADE OF SECURE, COST-EFFECTIVE AND CLEANER ENERGY BETWEEN NEW ENGLAND & EASTERN CANADA
Introduction
The growth in electricity consumption in New England and Eastern Canada as well as the increasing demand for natural gas over the last two decades has led to significant new requirements for energy resources, infrastructure and transmission capacity in the northeast. Generally, the surplus of existing and potential electric generation capacity in Eastern Canada and the availability of significant offshore oil and gas resources, coupled with rising demand for these resources especially in New England, create significant opportunities for expanded intra-regional energy trade and cooperation.Additionally, the comparatively clean hydro-electric resources of Eastern Canada as well as the development of indigenous wind power in New England and Eastern Canada can contribute to our region’s commitments to reduce greenhouse gases and other air pollutants.
However, expanding energy trade opportunities in our region to create a more diverse, secure, clean and cost-effective energy system will require significant new investments in energy infrastructure: power plants, transmission lines, gas production and transmission facilities, etc. Issues such as siting difficulties, market structures, project financing, and market barriers will have to be resolved to allow this investment to take place. Long-term planning by both government and business will be necessary to support long-term contract and investment decisions. By approaching this planning process on a regional level the governors and premiers will provide the leadership necessary to help meet the region’s growing energy needs.
Regional energy planning and trade also support a number of other goals: a more diverse and environmentally-friendly energy mix, optimization of local energy resource opportunities, expansion of energy efficiency programs to take advantage of economies offered by a regional rather than jurisdictional/local market, and the better use of existing facilities and infrastructure (for example, the potential to expand the transfer capabilities of existing interconnections between New England and Québec). It can help create more cost-effective options for diversifying our energy portfolio by removing obstacles to the production and distribution of renewable energy and expanding the market base for large-scale investments such as new liquefied natural gas (LNG) facilities.
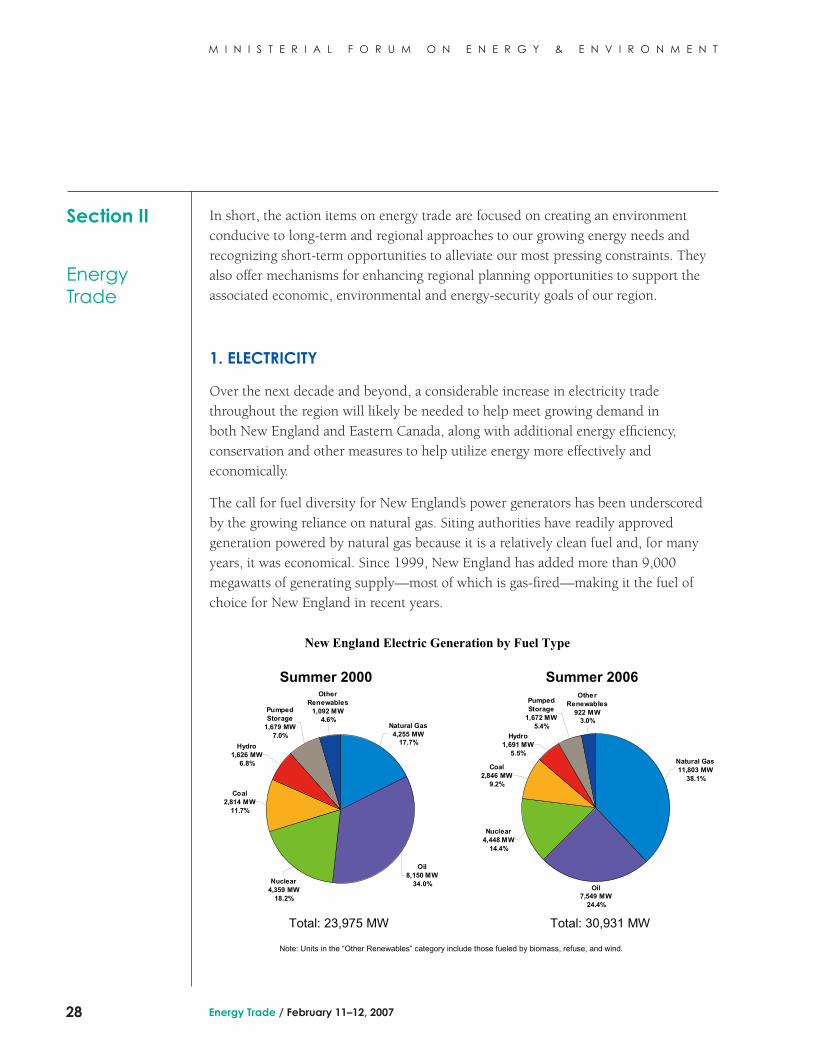
Energy Trade / February 11–12, 200728
M I N I S T E R I A L F O R U M O N E N E R G Y & E N V I R O N M E N T
Section II
Energy Trade
In short, the action items on energy trade are focused on creating an environment conducive to long-term and regional approaches to our growing energy needs and recognizing short-term opportunities to alleviate our most pressing constraints. They also offer mechanisms for enhancing regional planning opportunities to support the associated economic, environmental and energy-security goals of our region.
1. ELECTRICITY
Over the next decade and beyond, a considerable increase in electricity trade throughout the region will likely be needed to help meet growing demand in both New England and Eastern Canada, along with additional energy efficiency, conservation and other measures to help utilize energy more effectively and economically.
The call for fuel diversity for New England’s power generators has been underscored by the growing reliance on natural gas. Siting authorities have readily approved generation powered by natural gas because it is a relatively clean fuel and, for many years, it was economical. Since 1999, New England has added more than 9,000 megawatts of generating supply—most of which is gas-fired—making it the fuel of choice for New England in recent years.
New England Electric Generation by Fuel Type
Today, about 40 percent of the New England’s installed capacity uses natural gas as its
Summer 2000 Summer 2006
Total: 30,931 MWTotal: 23,975 MW
OtherRenewables
1,092 MW4.6%
Pumped Storage
1,679 MW7.0%
Hydro1,626 MW
6.8%
Coal2,814 MW
11.7%
Nuclear4,359 MW
18.2%
Oil8,150 MW
34.0%
Natural Gas4,255 MW
17.7%
Oil7,549 MW
24.4%
Nuclear4,448 MW
14.4%
Coal2,846 MW
9.2%
Hydro1,691 MW
5.5%
Pumped Storage
1,672 MW5.4%
Other Renewables
922 MW3.0%
Natural Gas11,803 MW
38.1%
Note: Units in the “Other Renewables” category include those fueled by biomass, refuse, and wind.
Energy Trade / February 11–12, 2007 29
M I N I S T E R I A L F O R U M O N E N E R G Y & E N V I R O N M E N T
Section II
Energy Trade
Today, about 40 percent of the New England’s installed capacity uses natural gas as its primary fuel, up from 17 percent in 1999. This trend is expected to continue with the commercialization of additional gas-fired generators and the conversion of existing generators to gas. However, the increasing dependence on natural gas has implications for both reliability and cost.
Natural gas and dual-fueled generators fired by oil or natural gas set the “clearing price” in the wholesale electricity market the majority of the time in 2005. As a result, natural gas prices have had a large impact on the cost of wholesale electricity. Although natural gas supplies in the U.S. and Canada have been tightening year-round due to declining production and increasing competition, this issue is especially acute during extreme winter conditions, when gas is also in heavy demand for home heating. Generators that hold firm gas contracts can either use the gas to generate electricity or sell it back into the natural gas market for the purpose of home heating. The January 2004 “Cold Snap,” when regional electricity supplies were strained due in part to such sales, illustrated this. (Since that time, new electricity market rules have been implemented to encourage using gas for electricity during these periods of extreme weather).
Since a quarter of New England’s peak-day natural gas comes from the Gulf of Mexico, Hurricanes Katrina and Rita have also had a significant impact on natural gas prices.The wholesale energy markets have made those impacts more transparent and are guiding decisions about how to respond.
One immediate concern in New England is the possibility of cold winter weather exacerbating gas supply and price issues for generators, resulting in gas-fired generation being insufficient to meet winter peak demand for electricity. ISO New England has taken steps to remedy this situation by promoting energy efficiency and conservation, securing additional dual-fuel capability, improving demand response programs, and readying energy emergency procedures.
In the long term, another strategy is diversification. Dual-fuel power plants using natural gas and a secondary fuel, such as oil, are an important way to provide alternatives, especially in emergencies. But with more than 60 percent of the region’s electricity supply derived from either natural gas or oil, the region must focus on developing greater fuel diversity for its electricity supply for the long term. Going forward, the region also needs to consider diversifying its fuel mix by increasing its use of alternative fuels, such as renewable energy sources. Additionally, New England needs to improve its natural gas supply and transportation infrastructure by adding new liquefied natural gas facilities and developing adequate pipeline capacity. FERC and state regulators are responsible for addressing these issues, and there is hope for progress in 2006.
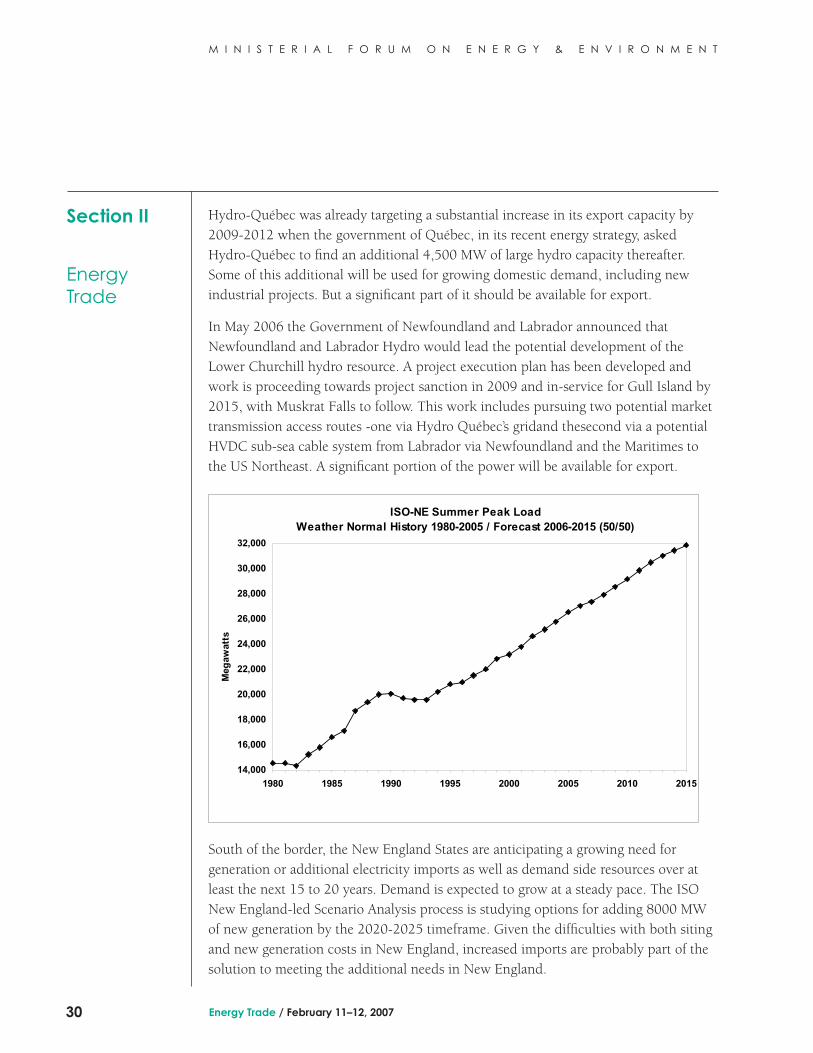
Energy Trade / February 11–12, 200730
M I N I S T E R I A L F O R U M O N E N E R G Y & E N V I R O N M E N T
Section II
Energy Trade
Hydro-Québec was already targeting a substantial increase in its export capacity by 2009-2012 when the government of Québec, in its recent energy strategy, asked Hydro-Québec to find an additional 4,500 MW of large hydro capacity thereafter. Some of this additional will be used for growing domestic demand, including new industrial projects. But a significant part of it should be available for export.
In May 2006 the Government of Newfoundland and Labrador announced that Newfoundland and Labrador Hydro would lead the potential development of the Lower Churchill hydro resource. A project execution plan has been developed and work is proceeding towards project sanction in 2009 and in-service for Gull Island by 2015, with Muskrat Falls to follow. This work includes pursuing two potential market transmission access routes -one via Hydro Québec’s gridand thesecond via a potential HVDC sub-sea cable system from Labrador via Newfoundland and the Maritimes to the US Northeast. A significant portion of the power will be available for export.
South of the border, the New England States are anticipating a growing need for generation or additional electricity imports as well as demand side resources over at least the next 15 to 20 years. Demand is expected to grow at a steady pace. The ISO New England-led Scenario Analysis process is studying options for adding 8000 MW of new generation by the 2020-2025 timeframe. Given the difficulties with both siting and new generation costs in New England, increased imports are probably part of the solution to meeting the additional needs in New England.
ISO-NE Summer Peak LoadWeather Normal History 1980-2005 / Forecast 2006-2015 (50/50)
14,000
16,000
18,000
20,000
22,000
24,000
26,000
28,000
30,000
32,000
1980 1985 1990 1995 2000 2005 2010 2015
Meg
awat
ts
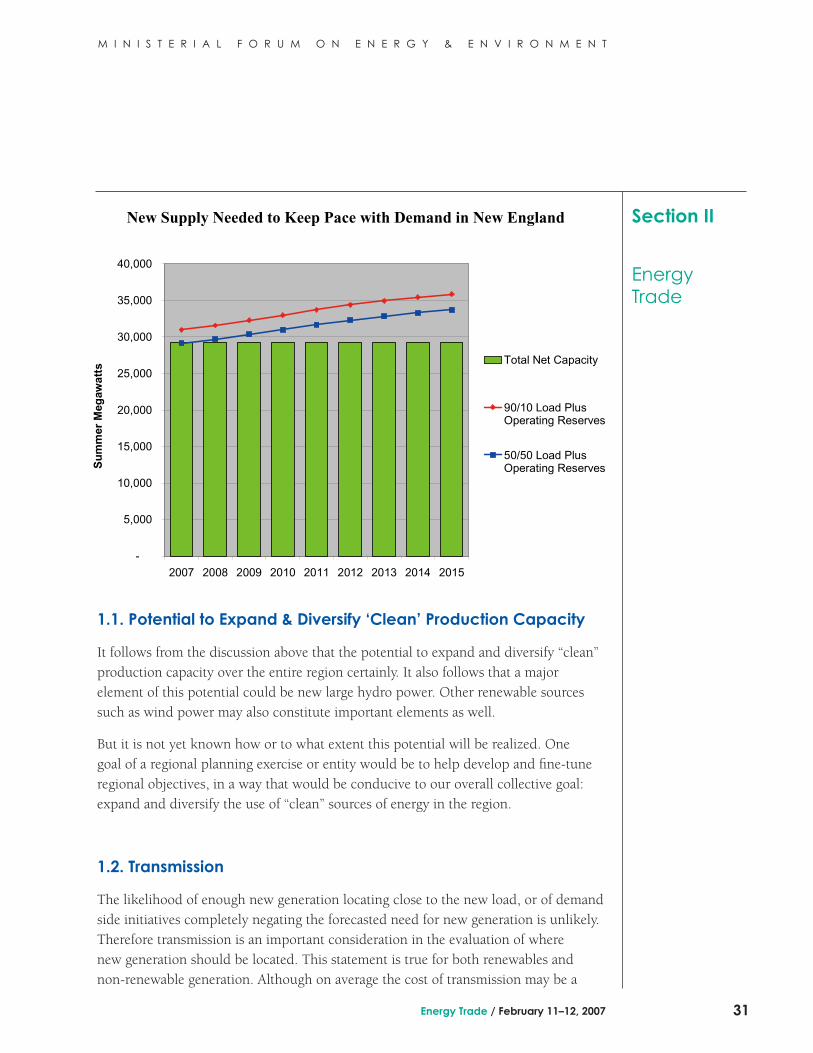
Energy Trade / February 11–12, 2007 31
M I N I S T E R I A L F O R U M O N E N E R G Y & E N V I R O N M E N T
Section II
Energy Trade
1.1. Potential to Expand & Diversify ‘Clean’ Production Capacity
It follows from the discussion above that the potential to expand and diversify “clean” production capacity over the entire region certainly. It also follows that a major element of this potential could be new large hydro power. Other renewable sources such as wind power may also constitute important elements as well.
But it is not yet known how or to what extent this potential will be realized. One goal of a regional planning exercise or entity would be to help develop and fine-tune regional objectives, in a way that would be conducive to our overall collective goal: expand and diversify the use of “clean” sources of energy in the region.
1.2. Transmission
The likelihood of enough new generation locating close to the new load, or of demand side initiatives completely negating the forecasted need for new generation is unlikely.Therefore transmission is an important consideration in the evaluation of where new generation should be located. This statement is true for both renewables and non-renewable generation. Although on average the cost of transmission may be a
New Supply Needed to Keep Pace with Demand in New England
-
5,000
10,000
15,000
20,000
25,000
30,000
35,000
40,000
2007 2008 2009 2010 2011 2012 2013 2014 2015
Su
mm
er M
egaw
atts
Total Net Capacity
90/10 Load PlusOperating Reserves
50/50 Load PlusOperating Reserves

Energy Trade / February 11–12, 200732
M I N I S T E R I A L F O R U M O N E N E R G Y & E N V I R O N M E N T
Section II
Energy Trade
relatively low component of the total cost of delivered power, there is often a trade-off between higher transmission costs and lower production costs associated with many of the lower cost generation projects such as hydro projects in northern Québec and Labrador. An overall optimization is further complicated by additional factors such as reliability, the use of existing transmission facilities, and the economies of scale of having multiple projects share a given transmission system.
New England has historically been a net importer of energy from the eastern Canadian Provinces. The first significant interchange was between New Brunswick and New England over a single 345kV AC tie line running from New Brunswick into Maine.Over time, three more significant HVDC interconnections between Québec and New England were constructed. They are as follows:
• The Highgate HVDC interconnection witha transfer capability of225 MW• The Québec-New England Phase I HVDC interconnection witha transfer capability
of 690 MW• The Québec-New England Phase II HVDC interconnection witha transfer capability
of up to 2,000 MW. (It is important to note that the Phase I and Phase IIinterconnections
cannot be operated simultaneously)
Québec and various utilities in Vermont have established contracts over the Highgate facilities that continue to be delivered.
New England and Québec agreed upon an “Energy Contract” for delivery of various energy products over Phase I, and that was followed by a “Firm Energy Contract” that allowed for the scheduling of 7 TWH of “Firm Energy” each year for a 10 year period over Phase II (Phase I could also be used in the event delivery over the Phase II facilities was not available). The “Firm Energy Contract” deliveries ended in 2001.
Since 2001, the interchange between areas has been primarily driven by market conditions in New England and system conditions in the Canadian provinces.Logically, large amounts of energy have been sold into New England during the higher load, more valuable summer peak months, and less has been delivered to New England during light load Spring and Fall months and during the winter peak months. In fact at times, New England is exporting to New Brunswick and Québec to support them during their winter peak load season, which is longer in duration than in New England.
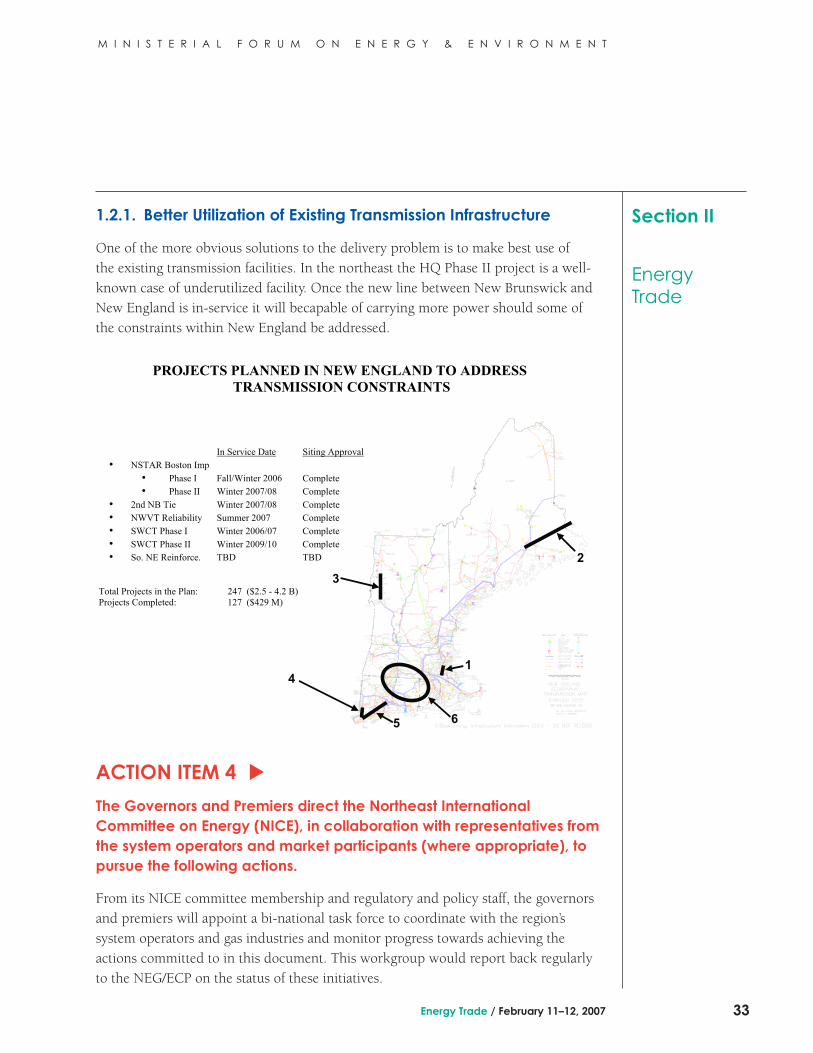
Energy Trade / February 11–12, 2007 33
M I N I S T E R I A L F O R U M O N E N E R G Y & E N V I R O N M E N T
Section II
Energy Trade
1.2.1. Better Utilization of Existing Transmission Infrastructure
One of the more obvious solutions to the delivery problem is to make best use of the existing transmission facilities. In the northeast the HQ Phase II project is a well-known case of underutilized facility. Once the new line between New Brunswick and New England is in-service it will becapable of carrying more power should some of the constraints within New England be addressed.
ACTION ITEM 4
▲
The Governors and Premiers direct the Northeast International Committee on Energy (NICE), in collaboration with representatives from the system operators and market participants (where appropriate), to pursue the following actions.
From its NICE committee membership and regulatory and policy staff, the governors and premiers will appoint a bi-national task force to coordinate with the region’s system operators and gas industries and monitor progress towards achieving the actions committed to in this document. This workgroup would report back regularly to the NEG/ECP on the status of these initiatives.
PROJECTS PLANNED IN NEW ENGLAND TO ADDRESS TRANSMISSION CONSTRAINTS
Total Projects in the Plan: 247 ($2.5 - 4.2 B) Projects Completed: 127 ($429 M)
3
2
4
5 6
1
In Service Date Siting Approval• NSTAR Boston Imp
• Phase I Fall/Winter 2006 Complete • Phase II Winter 2007/08 Complete
• 2nd NB Tie Winter 2007/08 Complete • NWVT Reliability Summer 2007 Complete • SWCT Phase I Winter 2006/07 Complete • SWCT Phase II Winter 2009/10 Complete • So. NE Reinforce. TBD TBD

Energy Trade / February 11–12, 200734
M I N I S T E R I A L F O R U M O N E N E R G Y & E N V I R O N M E N T
Section II
Energy Trade
a. Evaluate interconnect and seams issues that inhibit the cost-effective transmission of electricity within the region;
• Identify and rework transmission rate structures that inhibit cost-effective transmission;
The Québec-New England Phase I and Phase II interconnections are not part of the pool supported transmission facilities that are funded through the Regional Network Service (RNS) rate in New England. When these facilities were constructed, NEPOOL Participants had the option to share in the project or not. As such, ownership shares of Phase I and Phase II do not conform to historic load percentage share ownership, the method used for allocation of RNS costs. Given distinct ownership of the “rights” to transfer capability over Phase I and Phase II, parties wishing to move power from Québec to New England must reserve interconnection “rights” and also pay any applicable tariff charges for that reservation to the individual “rights” holders. If the Phase I and Phase II facilities were included in the New England RNS rate, scheduling and reservations across the interface would both be handled at ISO-NE, without the intermediate step of arranging for transfer capability from the rights holders. At that point, Québec and New England could also consider entering into a reciprocity agreement to eliminate any “through or out service” charges for transactions across this interface.
With the completion of the NRI/IPL transmission line project between New Brunswick and New England the transfer capability for North to South flows is expected to increase from 700 MW to 1000 MW. Subsequent transmission enhancements, principally in Maine, could increase this capability from 1000 MW to 1400 MW. These subsequent enhancements within New England would increase the transfer capabilities between points in Maine and Southern New England and thereby relieve the bottleneck that restricts the flow of electricity from New Brunswick and Maine to the rest of New England. Generation projects that align with regional goals would have improved access to markets.
b. Encourage increased utilization of existing transfer capabilities between Québec/New Brunswick and New England;
The existing HVDC interconnection between Québec and New England, known as Phase I and Phase II, consists of five separate terminals located in Québec at Radisson, Nicolet and Des Cantons, and in New England at Comerford and Sandy Pond. The facilities can be operated in two basic formats. Operating as Phase I, the facilities represent a 690 MW interconnection between Des Cantons and Comerford (located in northern New Hampshire). This was the original configuration of the interconnection
Energy Trade / February 11–12, 2007 35
M I N I S T E R I A L F O R U M O N E N E R G Y & E N V I R O N M E N T
Section II
Energy Trade
between Québec and New England and Phase I routinely operated from 1986 until completion of the Phase II interconnection in 1990. Operating as Phase II, a multi-terminal configuration between Radisson – Nicolet – Sandy Pond (located in central Massachusetts), the facilities represent an interconnection with a transfer capability of up to 2,000 MW. Due to system considerations in NY, PJM and at times New England, the interface is typically limited to an operations level of between 1,200 – 1,400 MW.
Due to the design of the Phase I and Phase II interconnections, operations can only take place in one configuration or the other, they can not operate simultaneously. If it is determined that operating both interconnections is feasible, it will require AC and DC system upgrades in New England, and most likely in Québec as well. In New England, Phase I was loosely interconnected to the New England system and significant upgrades would be needed to the AC system to bring the power south from the Comerford terminal.
c. Explore mechanisms to facilitate and promote the expanded use of long-term contract structures with the current market design in New England that could support further development of transmission and resource investment, including the creation of long-term contract mechanisms to support renewable resources and infrastructure development;
Most proposed grid-scale renewable energy projects cannot get the financing they need unless they can secure a guaranteed revenue source for a sufficiently extended period of time. In the restructured markets of New England, this has been a serious barrier to renewable energy development since neither utilities nor load serving entities have been in a position to enter contracts longer than three years.
Provinces such as Québec have been able to avoid this barrier by issuing tenders for 20 year supplies of wind power. States with restructured markets, such as Maine and Connecticut, have recently adopted legislation to give their utility commissions authority to direct longer-term contracts with renewable resources, although it remains to be seen how effective these new laws are. Vermont, remains integrated, but its utilities report new market accounting limitations to longer-term contracts.
States and provinces should make greater use of their regulatory authority over energy resources procured or generated by utilities and providers of last resort to increase the amount of clean, indigenous renewables through long-term contracts. In these situations, renewables should be procured through competitive solicitations for long-term contracts (not less than 10 years) for energy or attributes (renewable energy certificates or REC). Regulators should weigh the benefits of various contract types to

Energy Trade / February 11–12, 200736
M I N I S T E R I A L F O R U M O N E N E R G Y & E N V I R O N M E N T
Section II
Energy Trade
ensure the ratepayers receive a fair price and the benefit of a price hedge during the life of the contract in the event that competing energy prices rise. New solicitations should be made regularly and with appropriate frequency for the incremental additional supply required by the RPS. Tracking should continue to be accomplished using the existing power attribute tracking and trading systems.
d. Explore actions to ease integration of intermittent resources (like wind power) across the region to expand the amount of renewable power;
• Work with the New Brunswick ISO, Nova Scotia Power Inc., Hydro Québec, Newfoundland & Labrador Hydro, the ISO-New England, Inc. and other pertinent organizations to evaluate how the ‘balancing’ of intermittent resources may be enhanced and supported.
Wind at installed capacity levels well above current amounts increasingly adds a source of variability to grid resources. In addition, most rotating machine generators had the ability to provide reactive supply or voltage control. Some intermittent resources will lack the ability to provide reactive supply or voltage control at levels comparable to those provided by the generation that they will displace. System operations will need to account for these differences, potentially with additional investments to provide these services separately.
Certain aspects of the operation of the regional system may not be optimized for such a scenario. Given the responsibility of system operators to maintain the reliability of the system and to operate efficiently, it is incumbent upon the system operators to re-examine how the system operates and consider possible remedies that would allow intermittent resources to be accommodated more efficiently.
Many forms of renewable energy operate intermittently. Their output of energy varies as seasons and weather conditions change. Grid operators need to plan around the availability of intermittent resources, and to have alternative resources ready on short notice for those occasions when an intermittent resource unexpectedly is unable to deliver power to the grid. One such alternative is power that is imported from neighboring grids. Thus, for example, the grid in New England can import power from neighboring grids in New Brunswick, Québec, or New York, so long as there is adequate transmission capacity to move the power where and when it is needed.
The process can also work in reverse. When seasonal or weather changes cause a surplus of energy to become available from renewable resources on one grid, sufficient access to other grids, and their markets, provides an export opportunity.
Energy Trade / February 11–12, 2007 37
M I N I S T E R I A L F O R U M O N E N E R G Y & E N V I R O N M E N T
Section II
Energy Trade
In order to promote the development of renewable energy and enhance grid reliability throughout the region, New England states and Eastern Canadian provinces should work together to study ways that the region’s system of grids can best be managed to accommodate increased deployment of intermittent resources. (See also, Recommendations H and I, below, from the NEG-ECP White Paper, for more discussion of grid).
Exploration of the potential for improvement is required in how (i) supply variability and (ii) reactive supply and voltage control are managed between areas. Sharing the variability burden across multiple jurisdictions is more efficient in two ways. For one, the combined areas have a greater range of resources to bring to bear. Also, to the extent that the variabilities of the two areas are not perfectly correlated, the variability of the combined areas will be less than the sum of the variabilities of the individual areas. With respect to reactive supply and voltage control the issues are localized. Therefore there may be resources in one jurisdiction that would be the most efficient solution to an adjacent jurisdiction’s problem due to its proximity to the problem.
Specific avenues to be explored include:
1) Intra-hour schedule changes between Balancing Areas 2) Dynamic Scheduling between Balancing Areas 3) Creation of larger Balancing Areas 4) Increased controllability of generation and of loads 5) Inter-area coordination of reactive supply and voltage support
2. NATURAL GAS
New England and Eastern Canada have traditionally lagged their national averages in terms of natural gas usage, reflecting distance from supply fields and relatively limited infrastructure. This began to change in the 1980s and 1990s with the addition of new pipelines into the region and the increased availability of supplies from the U.S. Gulf Coast and western Canada to the Northeast market. While supplies have grown, so too has demand , particularly in New England. Annual consumption in 1990 was 417 billion cubic feet (Bcf); in 2005 it was 750 Bcf. The leading growth sector has been power generation. New England’s overall consumption is estimated to grow to about 1 trillion cubic feet within the next fifteen years.
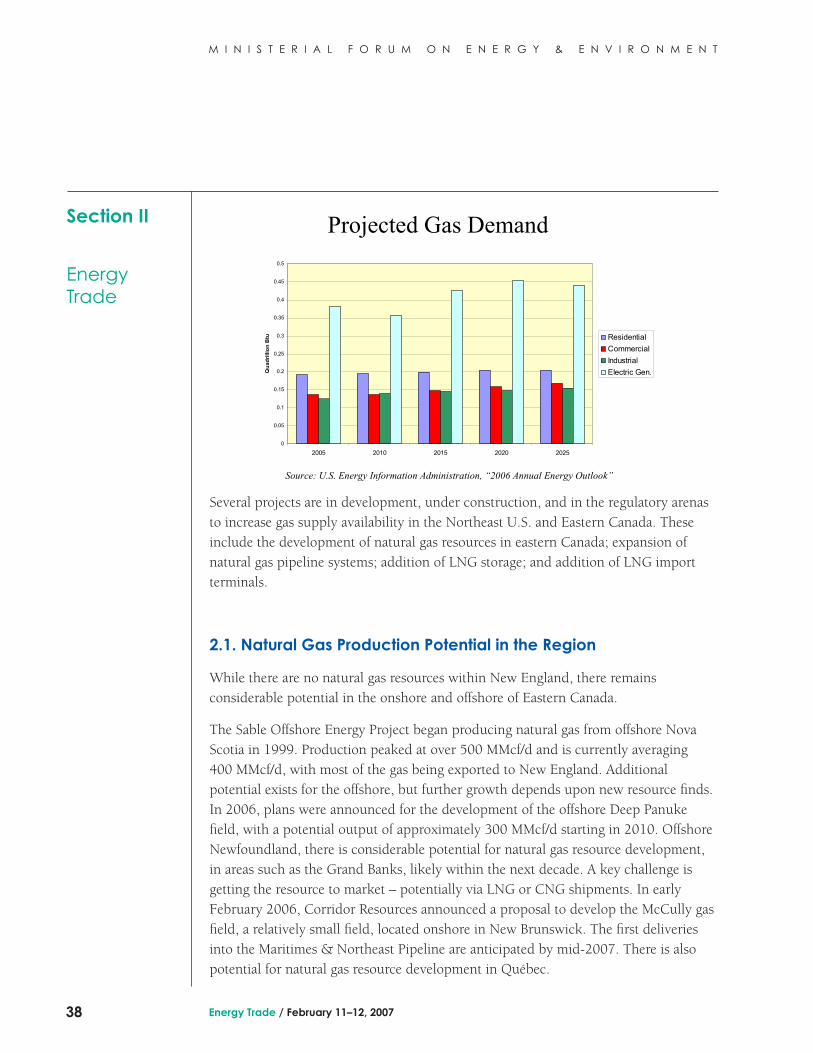
Energy Trade / February 11–12, 200738
M I N I S T E R I A L F O R U M O N E N E R G Y & E N V I R O N M E N T
Section II
Energy Trade
Several projects are in development, under construction, and in the regulatory arenas to increase gas supply availability in the Northeast U.S. and Eastern Canada. These include the development of natural gas resources in eastern Canada; expansion of natural gas pipeline systems; addition of LNG storage; and addition of LNG import terminals.
2.1. Natural Gas Production Potential in the Region
While there are no natural gas resources within New England, there remains considerable potential in the onshore and offshore of Eastern Canada.
The Sable Offshore Energy Project began producing natural gas from offshore Nova Scotia in 1999. Production peaked at over 500 MMcf/d and is currently averaging 400 MMcf/d, with most of the gas being exported to New England. Additional potential exists for the offshore, but further growth depends upon new resource finds.In 2006, plans were announced for the development of the offshore Deep Panuke field, with a potential output of approximately 300 MMcf/d starting in 2010. Offshore Newfoundland, there is considerable potential for natural gas resource development, in areas such as the Grand Banks, likely within the next decade. A key challenge is getting the resource to market – potentially via LNG or CNG shipments. In early February 2006, Corridor Resources announced a proposal to develop the McCully gas field, a relatively small field, located onshore in New Brunswick. The first deliveries into the Maritimes & Northeast Pipeline are anticipated by mid-2007. There is also potential for natural gas resource development in Québec.
Source: U.S. Energy Information Administration, “2006 Annual Energy Outlook”
Projected Gas Demand
0
0.05
0.1
0.15
0.2
0.25
0.3
0.35
0.4
0.45
0.5
2005 2010 2015 2020 2025
Qu
adri
llio
n B
tu Residential
Commercial
Industrial
Electric Gen.
Source: U.S. Energy Information Administration, “2006 Annual Energy Outlook”
Projected Gas Demand
0
0.05
0.1
0.15
0.2
0.25
0.3
0.35
0.4
0.45
0.5
2005 2010 2015 2020 2025
Qu
adri
llio
n B
tu Residential
Commercial
Industrial
Electric Gen.

Energy Trade / February 11–12, 2007 39
M I N I S T E R I A L F O R U M O N E N E R G Y & E N V I R O N M E N T
Section II
Energy Trade
An illustration of existing and potential resources is provided below.
2.2. Gas Transmission & Infrastructure Capability
Pipelines
Additional new pipeline/natural gas transmission infrastructure projects are planned for the region for the 2007 – 2010 timeframe. The projects involve enhancements to existing systems to increase access multiple supply basins, from the Gulf Coast, other U.S. points, Canada, and LNG.
Offshore Nova ScotiaCurrent Production
SOEP producing since 1999;
About 500 MMcf/d
QuebecPotential exploration in the St. Lawrence
regionOffshore Newfoundland
Potential developmentwithin next decade
Of offshore natural gas
Offshore Nova ScotiaDeep Panuke Field
Estimated likely resource of 390 to 890 Bcf;
est. sales of 300 MMcf/d;Projected in-service date
of 2010
New BrunswickMcCully natural gas
field; first deliveries into pipeline expected spring
2007
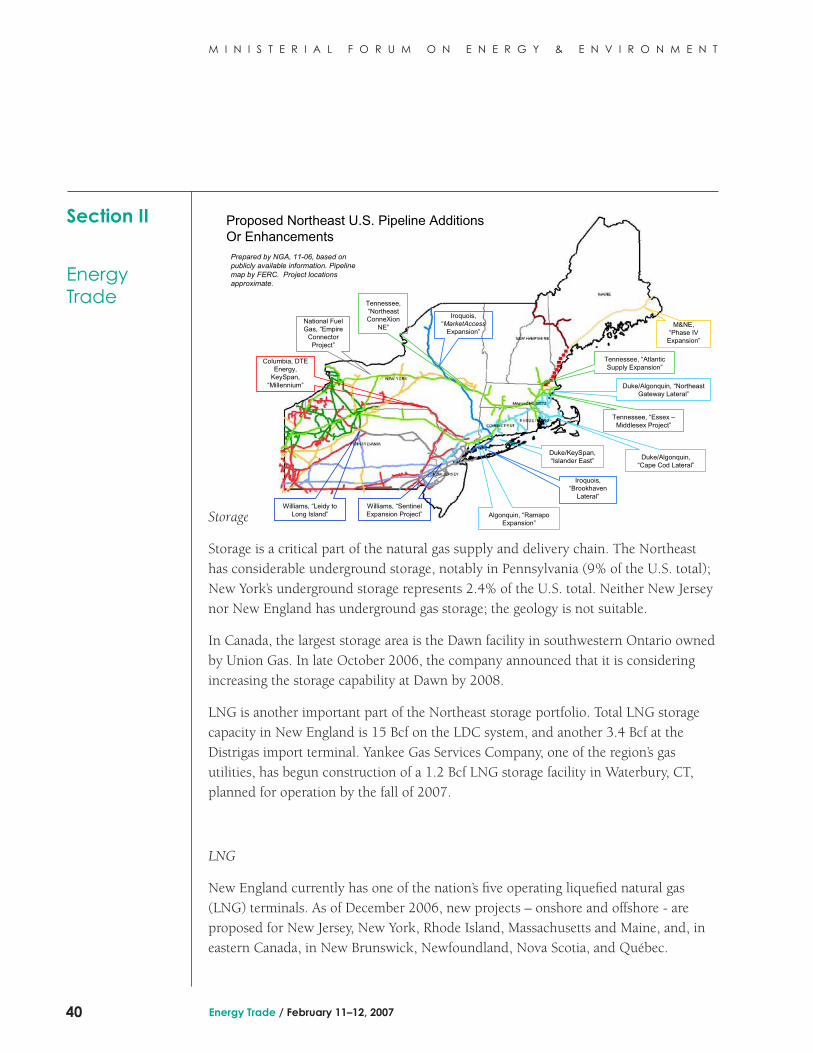
Energy Trade / February 11–12, 200740
M I N I S T E R I A L F O R U M O N E N E R G Y & E N V I R O N M E N T
Section II
Energy Trade
Storage
Storage is a critical part of the natural gas supply and delivery chain. The Northeast has considerable underground storage, notably in Pennsylvania (9% of the U.S. total); New York’s underground storage represents 2.4% of the U.S. total. Neither New Jersey nor New England has underground gas storage; the geology is not suitable.
In Canada, the largest storage area is the Dawn facility in southwestern Ontario owned by Union Gas. In late October 2006, the company announced that it is considering increasing the storage capability at Dawn by 2008.
LNG is another important part of the Northeast storage portfolio. Total LNG storage capacity in New England is 15 Bcf on the LDC system, and another 3.4 Bcf at the Distrigas import terminal. Yankee Gas Services Company, one of the region’s gas utilities, has begun construction of a 1.2 Bcf LNG storage facility in Waterbury, CT, planned for operation by the fall of 2007.
LNG
New England currently has one of the nation’s five operating liquefied natural gas (LNG) terminals. As of December 2006, new projects – onshore and offshore - are proposed for New Jersey, New York, Rhode Island, Massachusetts and Maine, and, in eastern Canada, in New Brunswick, Newfoundland, Nova Scotia, and Québec.
Prepared by NGA, 11-06, based on publicly available information. Pipeline map by FERC. Project locations approximate.
Williams, “Sentinel Expansion Project”
M&NE, “Phase IV
Expansion”
Duke/KeySpan, “Islander East”
Tennessee, “Atlantic Supply Expansion”
Columbia, DTE Energy,
KeySpan, “Millennium”
National Fuel Gas, “Empire
Connector Project”
Tennessee, “Northeast ConneXion
NE”
Iroquois, “MarketAccess
Expansion”
Tennessee, “Essex –Middlesex Project”
VERMONT
Williams, “Leidy toLong Island” Algonquin, “Ramapo
Expansion”
Iroquois, “Brookhaven
Lateral”
Duke/Algonquin, “Cape Cod Lateral”
Duke/Algonquin, “Northeast Gateway Lateral”
Proposed Northeast U.S. Pipeline AdditionsOr Enhancements
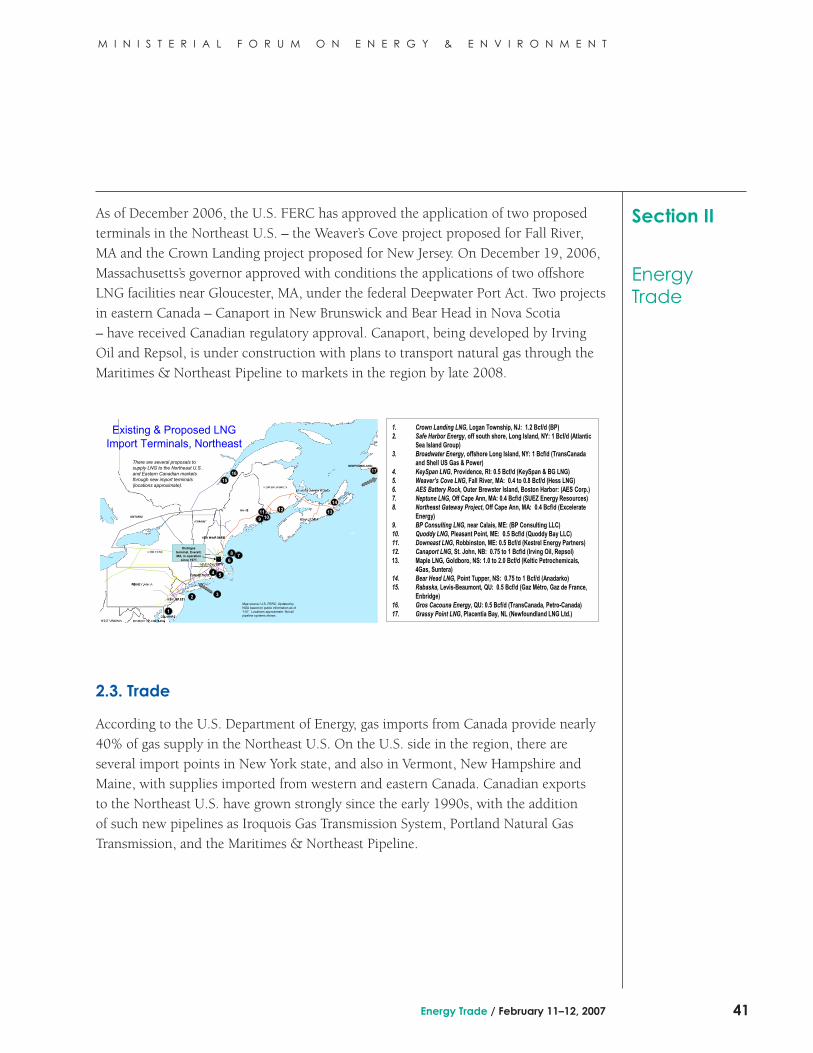
Energy Trade / February 11–12, 2007 41
M I N I S T E R I A L F O R U M O N E N E R G Y & E N V I R O N M E N T
Section II
Energy Trade
As of December 2006, the U.S. FERC has approved the application of two proposed terminals in the Northeast U.S. – the Weaver’s Cove project proposed for Fall River, MA and the Crown Landing project proposed for New Jersey. On December 19, 2006, Massachusetts’s governor approved with conditions the applications of two offshore LNG facilities near Gloucester, MA, under the federal Deepwater Port Act. Two projects in eastern Canada – Canaport in New Brunswick and Bear Head in Nova Scotia – have received Canadian regulatory approval. Canaport, being developed by Irving Oil and Repsol, is under construction with plans to transport natural gas through the Maritimes & Northeast Pipeline to markets in the region by late 2008.
2.3. Trade
According to the U.S. Department of Energy, gas imports from Canada provide nearly 40% of gas supply in the Northeast U.S. On the U.S. side in the region, there are several import points in New York state, and also in Vermont, New Hampshire and Maine, with supplies imported from western and eastern Canada. Canadian exports to the Northeast U.S. have grown strongly since the early 1990s, with the addition of such new pipelines as Iroquois Gas Transmission System, Portland Natural Gas Transmission, and the Maritimes & Northeast Pipeline.
1. Crown Landing LNG, Logan Township, NJ: 1.2 Bcf/d (BP)2. Safe Harbor Energy, off south shore, Long Island, NY: 1 Bcf/d (Atlantic
Sea Island Group)3. Broadwater Energy, offshore Long Island, NY: 1 Bcf/d (TransCanada
and Shell US Gas & Power)4. KeySpan LNG, Providence, RI: 0.5 Bcf/d (KeySpan & BG LNG)5. Weaver’s Cove LNG, Fall River, MA: 0.4 to 0.8 Bcf/d (Hess LNG)6. AES Battery Rock, Outer Brewster Island, Boston Harbor: (AES Corp.)7. Neptune LNG, Off Cape Ann, MA: 0.4 Bcf/d (SUEZ Energy Resources)8. Northeast Gateway Project, Off Cape Ann, MA: 0.4 Bcf/d (Excelerate
Energy)9. BP Consulting LNG, near Calais, ME: (BP Consulting LLC)10. Quoddy LNG, Pleasant Point, ME: 0.5 Bcf/d (Quoddy Bay LLC)11. Downeast LNG, Robbinston, ME: 0.5 Bcf/d (Kestrel Energy Partners)12. Canaport LNG, St. John, NB: 0.75 to 1 Bcf/d (Irving Oil, Repsol)13. Maple LNG, Goldboro, NS: 1.0 to 2.0 Bcf/d (Keltic Petrochemicals,
4Gas, Suntera)14. Bear Head LNG, Point Tupper, NS: 0.75 to 1 Bcf/d (Anadarko)15. Rabaska, Levis-Beaumont, QU: 0.5 Bcf/d (Gaz Métro, Gaz de France,
Enbridge)16. Gros Cacouna Energy, QU: 0.5 Bcf/d (TransCanada, Petro-Canada)17. Grassy Point LNG, Placentia Bay, NL (Newfoundland LNG Ltd.)
12 13
9
16
8
54
1
Existing & Proposed LNG Import Terminals, Northeast
NEWFOUNDLAND
QUEBEC
Map source: U.S. FERC; Updated by NGA based on public information as of 1-07. Locations approximate. Not all pipeline systems shown.
MARYLAND
There are several proposals to supply LNG to the Northeast U.S. and Eastern Canadian markets through new import terminals (locations approximate).
14
15
3
7
1110
6
2
ONTARIO
Distrigasterminal, Everett, MA, in operation
since 1971
17

Energy Trade / February 11–12, 200742
M I N I S T E R I A L F O R U M O N E N E R G Y & E N V I R O N M E N T
Section II
Energy Trade
ACTION ITEM 5
▲
The Governors and Premiers recognize that natural gas has the ability to replace oil-fired generation, and in doing so, greatly reduce greenhouse gas emissions: therefore, the NICE is directed to develop initiatives that will enhance the transmission and distribution of natural gas, including the following actions.
a. Monitoring infrastructure developments and assessing the potential for regional supplies, and coordinating efforts in the regulatory arena to enhance regional economic development, energy security and environmental goals;
b. Sharing ideas on natural gas efficiency programs to ensure that cost-effective energy savings, emission reductions and investments are assessed and implemented.
1990 1991 1992 1993 1994 1995 1996 1997 1998 1999 2000 2001 2002 2003 2004 2005
Canadian Exports to Northeast U.S., 1990 - 2005
Source: National Energy Board, Canada
Tcf
1.2
1.0
0.8
0.6
0.4
0.2
0
Renewable Energy / February 11–12, 2007 43
M I N I S T E R I A L F O R U M O N E N E R G Y & E N V I R O N M E N T
Section III
Renewable Energy
Section III
Recommendations on
Promoting Renewable Power Regionally

Renewable Energy / February 11–12, 200744
M I N I S T E R I A L F O R U M O N E N E R G Y & E N V I R O N M E N T
Section III
Renewable Energy
Renewable Energy / February 11–12, 2007 45
M I N I S T E R I A L F O R U M O N E N E R G Y & E N V I R O N M E N T
Section III
Renewable Energy
Acknowledgements
Section III - Renewable Energy
This section was initially based on the NEG/ECP White Paper on Renewables and Energy Efficiency adopted by the NEG/ECP in June 2006. This document was drafted principally by the Regulatory Assistance Project (RAP) with further assistance from the National Renewable Energy Laboratory (NREL), the Northeast Energy Efficiency Project (NEEP) and members of the NEG/ECP Climate Change Steering Committee.
The initial set of recommendations in the White Paper were augmented by the outcomes of the NEG/ECP Energy Dialogue on Renewables and Energy Efficiency held in Prince Edward Island in October 2006. The outcomes of this event were redrafted by Environment Northeast (ENE); and ENE’s “Climate Change Roadmap for New
England and Eastern Canada” (12/06) was a timely resource in the development of this section and its recommendations. ENE also provided the introductory materials to this section, and the Regulatory Assistance Project (RAP) also provided comments and editorial assistance.

Renewable Energy / February 11–12, 200746
M I N I S T E R I A L F O R U M O N E N E R G Y & E N V I R O N M E N T
Section III
Renewable Energy

Renewable Energy / February 11–12, 2007 47
M I N I S T E R I A L F O R U M O N E N E R G Y & E N V I R O N M E N T
Section III
Renewable Energy
PROMOTING RENEWABLE POWER DEVELOPMENT
Introduction
Renewable energy is attractive because it originates within the borders of the region (or nearby), and because most of its forms have little or no air pollution or GHGs. Some renewable generation reduces emissions and may ease compliance with local air quality standards. Like energy efficiency, indigenous renewable energy can produce additional local jobs to manufacture, install and maintain the equipment and to manage or procure fuel. The region already has a significant commitment to renewable energy. Historically, the Eastern Canadian provinces and the Northern New England states have made use of vast hydroelectric resources, led by Québec, and including storage and run-of-river projects large and small. The wood products industry has also made a practice of turning waste into energy.
As costs for fossil fuel commodities and construction (i.e., for new fossil power plants) have climbed precipitously in recent years, the cost for the energy these fossil-based plants generate has not only risen proportionately, but has also been subject to large, volatile price swings. At the same time, new renewable resources have come down in price, and the region has learned more about where such resources can best be sited (both from an economical and environmental perspective).
Figure 1: Comparison of Levelized Energy Costs for Electric Generation Technologies
Figure 1: Comparison of Levelized Energy Costs for Electric Generation Technologies
0 50 100
150
200
250
300
350
400
450
500
Current Energy Costs (US$/MWh)
Pulverized Coal
Pulverized Coal w/ Carbon Capture & Storage
Coal Integrated Gassification & Combined Cycle (IGCC)
Coal IGCC w/ Carbon Capture & Storage
Natural Gas Combined Cycle
Natural Gas CC w/ Carbon Capture & Storage
Nuclear
Biomass Electricity
Wind Electricty
Solar PV Electricity
Solar Thermal Electricity
Large Hydro
Small Hydro
Geothermal Electricity
Marine - Tidal or Wave
Source: Environment Northeast, Climate Change Roadmap for New England and Eastern Canada (2006);Data sources: Coal & Natural Gas: IPCC, 2005, Special Report on Carbon Dioxide Capture and Storage , Tables 8.1 and 8.3a; Nuclear: NEA, IEA, & OECD, 2005, Projected Costs of Generating Electricity - 2005 Update; Renewables: UNDP & WEC, 2004, World Energy Assessment Update , Table 7.
Conventional / Fossil Generation
RenewableGeneration
PV Max = 1,600
Renewable Energy / February 11–12, 200748
M I N I S T E R I A L F O R U M O N E N E R G Y & E N V I R O N M E N T
Section III
Renewable Energy
In recent years, the Eastern Canadian provinces have pursued significant additions of renewable energy capacity. Looking at new wind capacity additions, there have been 41 MWs added in Nova Scotia, 14 MWs in Prince Edward Island and 212 MWs in Québec. Québec has estimated it has 4,000 MW of economical wind and set a goal of developing this amount by 2015. In addition to the existing 212 MW, 1,000 MW has already been contracted for and another 1,000 MW has been put out to bid (tender). Québec has announced intentions to add another 4,500 MW of large-scale hydro electric capacity, and large projects are also in progress, or under consideration, in Labrador. On a much smaller scale, novel applications of in-stream tidal power are being studied and pursued in Nova Scotia and New Brunswick. These various initiatives help to advance the renewable energy targets laid out by individual provinces (e.g., New Brunswick, 10% by 2015; Nova Scotia, 5% by 2010; PEI, 15% by 2010).
In New England, electric industry restructuring has led to some significant developments that appear to have accelerated investments in renewable energy, building on the region’s existing substantial base of hydro-electric and biomass resources. In New England, three states, Connecticut, Massachusetts, and Rhode Island have renewable portfolio standards that will, during the first decade of this century, produce a demand for around 1000 MW of new renewable capacity. In all six New England states, customers can choose at least one retail electric service option which is heavily or fully supplied by renewable energy.
Several New England states have also created renewable energy development funds, turning the job of developing and commercializing promising renewable energy systems into a public-private effort. These funds have fostered improvements in technology and design, leading to growth in generation from landfill gas and improved prospects for wind, solar, farm methane, and other promising ideas. These funds also provide some impetus for a state to develop or deploy renewable technologies particularly well-suited to local conditions, or which are being developed by local firms. States should maintain their attention to monitor the performance of and to regularly refine the focus of these funds to make sure money is invested most effectively, for energy, economic and environmental benefits.
There are a number of policies to improve the deployment of renewable energy resources in Eastern Canada and New England, and some observers believe these policies could have greater impact if they were made more uniform across the region. The definition of renewable energy in each jurisdiction is distinct, each reflecting the priorities and concerns of lawmakers as they enacted the laws. As a result, the legal criteria that determine which renewable energy resources are eligible to satisfy

Renewable Energy / February 11–12, 2007 49
M I N I S T E R I A L F O R U M O N E N E R G Y & E N V I R O N M E N T
Section III
Renewable Energy
various state mandates (such as the Renewable Portfolio Standard) or to receive public incentives (e.g., tax benefits, subsidies) are not consistent across the region.
I. Issues Related to Intermittent Power
One important way to diversify “clean” sources is to rely more heavily on windpower, but only to the extent that it can be integrated to the power grid, given its intermittent nature.
In Québec, Hydro-Québec anticipates that it can continue to integrate windpower up till a ratio of about one to ten in terms of capacity, with respect to hydropower with reservoir and water head margins. Indeed, the use of water head or reservoir margins is probably the best way to rapidly offset variations in windpower.
In New England, four States (Connecticut, Massachusetts, Maine and Rhode Island) have chosen to target an increase in windpower, among other renewable sources by adopting Renewable Portfolio Standards laws (RPS). These require that a certain percentage of electricity consumed be sourced from renewable resources in order to displace less desirable fuels.
However, with respect to windpower, each of these four States has limited sources of offsetting margins. It therefore seems logical for all New England States to coordinate their windpower developments and to pool their offsetting resources. That is in fact going to be the case, given that ISO-NE is going to do the balancing.
However, that same logic applies to all balancing authorities in the region that are synchronized, namely NBSO and ISO-NE. Over that greater area, there is a better chance that variations in one wind farm can offset opposite variations elsewhere. There can therefore be more windpower in total for the same reserve margins.
In order to further integrate windpower into the existing grid, one must increase balancing resources within the region (like maintaining sufficient water head reserves at small hydro plants). But it would defeat the objectives of the RPS programs to increase those margins by relying more on conventional thermal plants within the region. It would make far more sense to increase the steady supply of hydroelectric power from Québec and Labrador. The feasibility of reserving a margin on the interconnections between the two regions could also be examined.
In short, any increase in intermittent supplies in order to meet RPS objectives should be accompanied by:
1. increased margins for balancing requirements within the synchronized region, and2. increased supply of clean energy from outside that region.
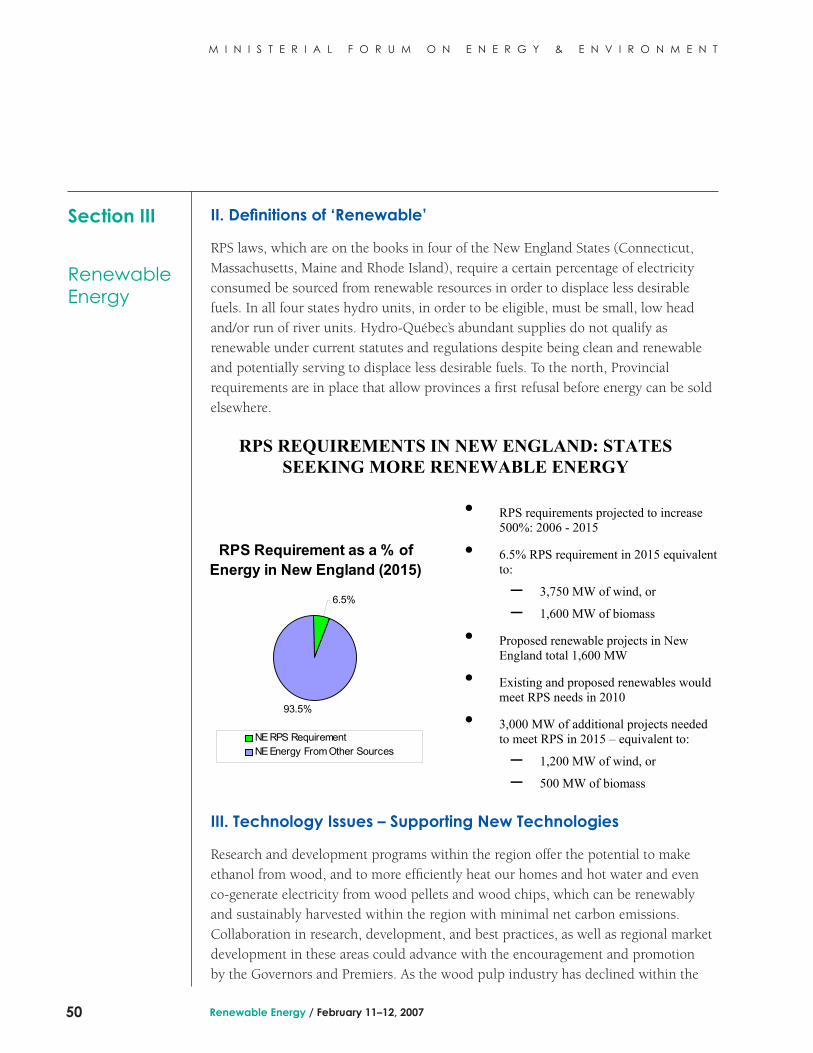
Renewable Energy / February 11–12, 200750
M I N I S T E R I A L F O R U M O N E N E R G Y & E N V I R O N M E N T
Section III
Renewable Energy
II. Definitions of ‘Renewable’
RPS laws, which are on the books in four of the New England States (Connecticut, Massachusetts, Maine and Rhode Island), require a certain percentage of electricity consumed be sourced from renewable resources in order to displace less desirable fuels. In all four states hydro units, in order to be eligible, must be small, low head and/or run of river units. Hydro-Québec’s abundant supplies do not qualify as renewable under current statutes and regulations despite being clean and renewable and potentially serving to displace less desirable fuels. To the north, Provincial requirements are in place that allow provinces a first refusal before energy can be sold elsewhere.
III. Technology Issues – Supporting New Technologies
Research and development programs within the region offer the potential to make ethanol from wood, and to more efficiently heat our homes and hot water and even co-generate electricity from wood pellets and wood chips, which can be renewably and sustainably harvested within the region with minimal net carbon emissions. Collaboration in research, development, and best practices, as well as regional market development in these areas could advance with the encouragement and promotion by the Governors and Premiers. As the wood pulp industry has declined within the
RPS REQUIREMENTS IN NEW ENGLAND: STATES SEEKING MORE RENEWABLE ENERGY
• RPS requirements projected to increase 500%: 2006 - 2015
• 6.5% RPS requirement in 2015 equivalent to:
– 3,750 MW of wind, or
– 1,600 MW of biomass
• Proposed renewable projects in New England total 1,600 MW
• Existing and proposed renewables would meet RPS needs in 2010
• 3,000 MW of additional projects needed to meet RPS in 2015 – equivalent to:
– 1,200 MW of wind, or
– 500 MW of biomass
RPS Requirement as a % of Energy in New England (2015)
93.5%
6.5%
NE RPS RequirementNE Energy From Other Sources

Renewable Energy / February 11–12, 2007 51
M I N I S T E R I A L F O R U M O N E N E R G Y & E N V I R O N M E N T
Section III
Renewable Energy
region, biomass as a renewable and sustainable energy source is emerging as a growing market opportunity. For example the demand for wood pellets has grown faster than regional manufactures have been able to keep up. New energy efficiency and demand response technologies and practices, such as promoting off-peak cooling (OPC) for air conditioning load through cool thermal energy storage (TES, such as with chilled water or ice), can help the region reduce its carbon emissions and meet peak electric demands in a cost effective manner.
IV. Actions to Promote Renewables
ACTION ITEM 6
▲
In order to support renewable power acquisition systems and renewable cross-border trading in which longer-term contracts are possible and encouraged to manage risks and control costs (regardless of the state of retail competition), Governors and Premiers direct the Northeast International Committee on Energy (NICE) in conjunction with the NEG/ECP Climate Change Steering Committee to pursue the following actions.
While some wind facilities are today virtually cost-competitive with more conventional generation technologies, renewable generation today is for the most part more expensive than the standard alternatives. This cost “premium” is, of course, offset by the reduced price volatility risk (from the lack of correlation to fossil fuel prices) and environmental benefits that the renewables offer, but even so their higher costs can make the financing of projects more difficult. In addition, a high proportion of their life cycle costs are up front, adding financial risk to their business model which is best addressed by longer term (ten years or more) commitments. The long term business risk of a renewable generator can be mitigated by long term contracts. Lower costs to consumers can result if financiers see less risk. Policies that promote the establishment of long-term contracts for renewables and renewable cross-border trading – e.g., renewable portfolio standards and integrated resource planning – could address this.
a. Explore a regional credit transfer and trading mechanism;
There has been a need for a credible, transparent system of tracking the origins and attributes (generation type, vintage, location) of power generation so consumers can
Renewable Energy / February 11–12, 200752
M I N I S T E R I A L F O R U M O N E N E R G Y & E N V I R O N M E N T
Section III
Renewable Energy
compare product options and have assurance that their purchasing dollars are in fact supporting development of new renewables. For example, in New England states having an RPS, a load serving entity’s compliance requires a demonstration that the required quantity of renewable energy credits has been purchased. In most cases, this is achieved by purchase of renewable energy credits (RECs) tracked and recorded by the NEPOOL Generation Information System (GIS). Purchasing a sufficient number of RECs, separate from the associated electric energy, is adequate for RPS compliance. The same is true for purposes of demonstrating the amount of renewable “content” (e.g., 50% wind) offered in the products of competitive green power marketers. The system ensures that renewable credits are not double counted, preserving the integrity of the system and the value of the REC’s.
The GIS system is not a trading market. It is designed as a transparent, verifiable repository of information about all participating generating units. If Canadian generation units, particularly merchant plants, will be seeking recognition of their renewable generation attributes, whether for compliance in mandates like RPS or for green markets, they may benefit from development of a tracking system that is consistent with the GIS system now in use in New England (and also in the U.S. West).
b. Support application of portfolio management and continuity for utility and provider of last resort (POLR) service;
States and Provinces with vertically integrated utilities are well-situated to implement this policy and to foster electricity renewable cross-border trading. Existing integrated resource planning and acquisition practices can be adapted to focus on this concern. In the context of retail competition, the challenge is more complex, but still solvable. The provider of last resort (POLR) may have a short (one to five years) horizon of responsibility, and may be unwilling to enter power supply contracts for a longer period. One solution is to require that these contracts be assumed by the successor to the POLR responsibility. In this way, the POLR will not be discouraged to find the lowest cost way to acquire renewable power by a lack of long term focus. Another solution is a statewide buyer of renewable power – load servers would have the obligation of taking their share of this power. It would be important that a competitive acquisition be used to assure that the process is fair to consumers and suppliers.
More generally, studies of risk management of electric power supplies indicate that POLR consumers are disadvantaged if longer term contracts are discouraged, as their inherent qualities to stabilize prices would be absent. This practice, which more generally seeks to factor in all important risks to consumers in electric resource acquisition, is generally referred to as electric resource portfolio management.
Renewable Energy / February 11–12, 2007 53
M I N I S T E R I A L F O R U M O N E N E R G Y & E N V I R O N M E N T
Section III
Renewable Energy
c. Promote the trade and expansion of new energy technologies and equipment in the region, where cost-effective and environmentally beneficial;
Promote the trade and expansion of new energy technologies and equipment in the region, such as ‘cool-thermal’ energy storage, high efficiency boilers, biomass, combined heat and power (CHP), etc., and the regional sharing of information and market opportunities related to nascent/renewable/alternative energy industries (such as tidal/pulp/pellet/wood alcohol, etc.) and ‘best-practices’.
d. Explicitly use government operations as an opportunity for leadership in long-term sustainable decision-making for investments in energy efficiency and renewable energy;
States and provinces can utilizevalue energy efficiency and renewable energy in their government operations. Governors and Premiers also manage large complexes of organizations and buildings. Operating choices they and their appointees make can make a significant difference on their own, and, perhaps more importantly stand as an example to business owners, managers and citizens to influence their energy decisions.
ACTION ITEM 7
▲
Governors and premiers ask their respective energy departments/agencies to review individual renewable portfolio standards (RPS) criteria relative to renewable sources not included in jurisdictional standards, and promote greater harmonization between state RPS and provincial procurement standards
Individual jurisdictions within the region have pursued different approaches to promoting development of renewable energy. Among these approaches is the Renewable Portfolio Standard (RPS), which establishes a mandatory minimum percentage of renewable energy “content” that must make up the total supply of electricity delivered for a given load serving entity (such as a competitive energy supplier or a provider of last resort).
Another approach to promoting renewable power generation has been to foster “green” power purchases for customers in competitive markets, for customers serviced by a provider of last resort (e.g., standard offer), or for utility ratepayers (i.e., “green pricing programs).

Renewable Energy / February 11–12, 200754
M I N I S T E R I A L F O R U M O N E N E R G Y & E N V I R O N M E N T
Section III
Renewable Energy
There have been public interests that are served by some of the limits placed on renewable energy policies. Most notably, states and provinces offering tax incentives have limited eligibility to projects that are located within their borders. Jurisdictions following the path of an RPS have added restrictions such as:
a) The size of the RPS itself, which is intended to avoid undue effects on the cost of electricity, and on any overall environmental impacts of renewable development due to the RPS;
b) NOx emissions limits or sustainable harvest requirements on biomass;c) size limits (in the case of hydro), above which it is presumed the resource does not
need policy assistance to become commercially viable;d) vintage limits, whereby units commissioned prior to a certain time are presumed
not to need policy assistance to become commercially viable; e) location, whereby renewable energy from eligible units must be located within the
relevant power pool, or at least must deliver their energy to the relevant power pool.
To the extent jurisdictions in the region employ unique and/or different criteria to determine what renewable resources are eligible for policies designed to promote those resources, the effect of the policy will be limited. As noted above, if particular types or vintages or locations of resource are not eligible, this will limit the market’s access to the lowest cost resources, but it may be a valid means to promote policy objectives that are a priority for a specific state or province.
It would be useful for the states and provinces of the region to review the various RPS policies. One task of such a review should be to identify opportunities to increase the uniformity of rules and criteria used to implement RPSs while still meeting the shared objectives of participating jurisdictions. A second task would be to consider setting a regional target for the year 2020, to be satisfied using uniform criteria and resources located anywhere in the region.

Transportation / February 11–12, 2007 55
M I N I S T E R I A L F O R U M O N E N E R G Y & E N V I R O N M E N T
Section IV
Transportation
Section IV
Recommendations on
Transportation Options for Achieving
Regional Air Policy Goals

Transportation / February 11–12, 200756
M I N I S T E R I A L F O R U M O N E N E R G Y & E N V I R O N M E N T
Section IV
Transportation

Transportation / February 11–12, 2007 57
M I N I S T E R I A L F O R U M O N E N E R G Y & E N V I R O N M E N T
Section IV
Transportation
Acknowledgements
Section IV - Transportation
The recommendations in this section were initially drafted by the state and provincial representatives of the NEG/ECP CCSC’s Transportation Workgroup. This effort was led by Sonia Hamel, formerly at the MA OCA with additional assistance from Coralee Cooper of Northeast States for Coordinated Air Use Management (NESCAUM) and Walter Poor of the VT DPS. NESCAUM, the Center for Clean Air Policy, and Environment Northeast (ENE) contributed programmatic recommendations and introductory text and graphics.
The NEG/ECP Forum “Transportation Solutions to Climate Change”, held December 15, 2006 in Portland, Maine, provided additional input to the recommendations and background material.
ENE’s “Climate Change Roadmap for New England and Eastern Canada” (12/06) was a significant and timely resource in the development of this section as well.

Transportation / February 11–12, 200758
M I N I S T E R I A L F O R U M O N E N E R G Y & E N V I R O N M E N T
Section IV
Transportation
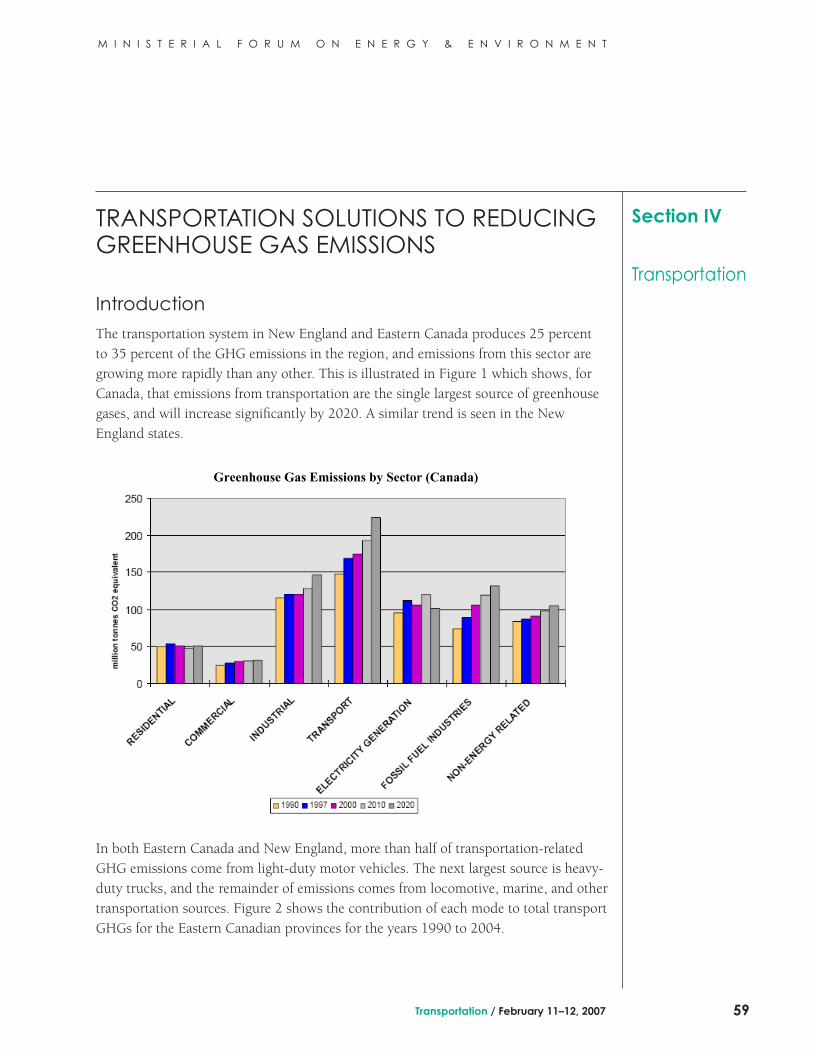
Transportation / February 11–12, 2007 59
M I N I S T E R I A L F O R U M O N E N E R G Y & E N V I R O N M E N T
Section IV
Transportation
TRANSPORTATION SOLUTIONS TO REDUCING GREENHOUSE GAS EMISSIONS
Introduction
The transportation system in New England and Eastern Canada produces 25 percent to 35 percent of the GHG emissions in the region, and emissions from this sector are growing more rapidly than any other. This is illustrated in Figure 1 which shows, for Canada, that emissions from transportation are the single largest source of greenhouse gases, and will increase significantly by 2020. A similar trend is seen in the New England states.
In both Eastern Canada and New England, more than half of transportation-related GHG emissions come from light-duty motor vehicles. The next largest source is heavy-duty trucks, and the remainder of emissions comes from locomotive, marine, and other transportation sources. Figure 2 shows the contribution of each mode to total transport GHGs for the Eastern Canadian provinces for the years 1990 to 2004.
Greenhouse Gas Emissions by Sector (Canada)
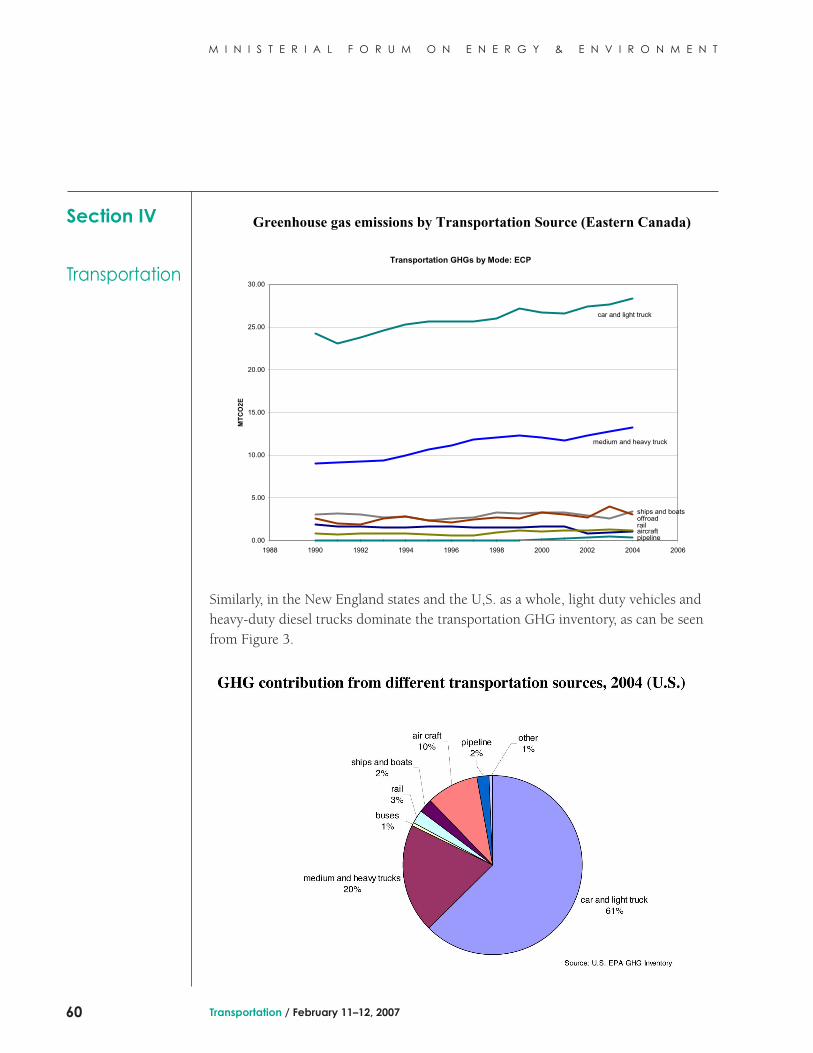
Transportation / February 11–12, 200760
M I N I S T E R I A L F O R U M O N E N E R G Y & E N V I R O N M E N T
Section IV
Transportation
Similarly, in the New England states and the U,S. as a whole, light duty vehicles and heavy-duty diesel trucks dominate the transportation GHG inventory, as can be seen from Figure 3.
Greenhouse gas emissions by Transportation Source (Eastern Canada)
Transportation GHGs by Mode: ECP
aircraft
ships and boats
pipeline
car and light truck
medium and heavy truck
railoffroad
0.00
5.00
10.00
15.00
20.00
25.00
30.00
1988 1990 1992 1994 1996 1998 2000 2002 2004 2006
MT
CO
2E

Transportation / February 11–12, 2007 61
M I N I S T E R I A L F O R U M O N E N E R G Y & E N V I R O N M E N T
Section IV
Transportation
Most vehicles emit greenhouse gas in the form of CO2 as they combust gasoline
(petrol) or diesel fuel. One contributing factor to the region’s total consumption of these GHG emitting fuels is that the distance consumers are traveling continues to grow. Between 2000 and 2003, vehicle miles traveled (VMT) increased in the Eastern Canadian provinces and New England region by nearly 2 percent. If miles traveled continue to grow at this rate, VMT for the region would increase from 177,000 to 400,000 million by 2050. The resulting level of fuel consumption has financial implications for the economies of the region. It is worth noting that in 2005, expenditures for fuel – which mostly benefit entities outside of the region – amounted to approximately $20 billion for gasoline and diesel combined. The rate of increase in expenditures on fuel has grown sharply in the past two years – as can be seen from the graph in Figure 4 which illustrates U.S. fuel expenditures over time.
In order to reduce emissions from the transportation sector and make our economies more competitive, it will be necessary to find cleaner alternatives to conventional motor fuels and ways to increase efficiency of fuel consumption. A combination of strategies will be needed.
Fortunately, a host of strategies are available to reduce greenhouse gas emissions from transportation sources. These include using lower carbon content fuels, reducing emissions from vehicles through improved technologies, improving public transit, improving the efficiency of the vehicle fleet through feebates, establishing
Trend in fuel expenditures in the U.S. 1995-2005
0
2,000,000,000
4,000,000,000
6,000,000,000
8,000,000,000
10,000,000,000
12,000,000,000
14,000,000,000
16,000,000,000
1995 1996 1997 1998 1999 2000 2001 2002 2003 2004 2005
Gas
olin
e C
om
mo
dit
y C
ost
s (U
S$)
Eastern Canada
New England

Transportation / February 11–12, 200762
M I N I S T E R I A L F O R U M O N E N E R G Y & E N V I R O N M E N T
Section IV
Transportation
communities with reduced reliance on automobiles, and increasing the efficiency of intermodal freight. This section outlines a suite of options that, when implemented, will move the region towards a significant reduction in greenhouse gas emissions and a more fuel-efficient transportation system.
I. Alternative Fuels with Lower Carbon Content
The transportation sector contributes 124 of the 346 MMTCO2 generated annually in the NE-EC region, or approximately 35% of total GHG emissions. This is because nearly 100% of on-road and non-road vehicles currently operate on gasoline or diesel fuel made from petroleum. This situation is not sustainable from several economic, energy and environmental perspectives.
Recently, the region’s growing appetite for both gasoline and diesel fuel, coupled with increased global competition from developing countries, has increased expenditures for these commodities. While the higher expenditures have affected the region’s economy, the higher prices have also enabled development and implementation of technologies and measures that can both improve fuel efficiency and decrease the region’s overall dependence upon imported fuels. One of the first steps is the development of low-carbon and non-carbon based fuel resources in order to meet the regional climate targets in the mobile sector. These are often referred to as biofuels, since many of the alternative fuels are being developed from agricultural and/or renewable feedstocks. While the industry is still in its infancy, the NEG/ECP has an opportunity to be a world leader in development of these new fuel sources and in doing so, ensure an adequate fuel supply for generations.
II. Vehicle Efficiency and Technology
Significant GHG emissions reductions can be achieved in passenger cars, sport utility vehicles, and pick-up trucks through the application of currently available technologies. A recent study by the Northeast States Center for a Clean Air Future (NESCCAF, 2004) found that technologies such as cylinder deactivation and 6-speed automatic transmissions can reduce GHG emissions from new light-duty vehicles by 25%. Using technologies that are more advanced such as gasoline or diesel hybrid electric vehicles can reduce GHGs by 54%. The California Air Resources Board estimates that the somewhat higher initial purchase price of lower emitting vehicles is offset by lower monthly operating costs.
Transportation / February 11–12, 2007 63
M I N I S T E R I A L F O R U M O N E N E R G Y & E N V I R O N M E N T
Section IV
Transportation
Similarly large reductions in vehicle GHG emissions can be achieved from heavy-duty vehicles such as long haul trucks, buses, and delivery vans. A recent study by the American Council for an Energy Efficient Economy (ACEEE) found that fuel economy for new tractor trailers could be improved by 29% in 2008, and 58% in 2015, using existing and emerging technologies. The same study found that hybridization of short-haul trucks could improve fuel economy by up to 100% in city driving. An optimal combination of advanced technologies for tractor-trailers and hybridization of short-haul trucks could reduce overall heavy-duty vehicle fuel consumption by 32% by 2015. In addition, idle reduction technology and practices can significantly reduce emissions during the movement of goods.
A number of policies could be implemented to ensure that these technologies are introduced into the new vehicle fleet in the near term. These include: 1) adoption of California’s GHG standards for light-duty vehicles; 2) introduction of fuel economy standards or incentives for heavy-duty vehicles; 3) preferential parking or road access for high-efficiency vehicles; 4) feebate programs; and 5) government fleet purchase and contract specifications.
III. Reduce Vehicle Miles Traveled Through A More Efficient Transportation System
Vehicle-miles traveled (VMT) - the number of miles that residential vehicles are driven – is a critical measure of driver behavior. Ever-increasing automobile use, as measured by VMT presents a significant challenge to reducing GHG emissions from passenger cars, SUVs, and pick-up trucks. While improved technologies hold the promise to substantially reduce per-mile GHG pollution, continuing growth in VMT threatens to erode any gains made from the use of new technologies. To illustrate this point, figure 1 shows projected VMT, CO2 emissions, and business-as-usual fuel economy for the US light-duty fleet. The anticipated 75% increase in VMT from 2000 to 2025 suggests that even if the full potential of the technologies described above were realized and average vehicle GHG emissions dropped by 50% in this time period, total GHG emissions from transportation would still increase by 25% as a result of increased automobile use. Clearly, in order to reduce transportation GHG emissions, efforts must be undertaken to stabilize and reduce VMT. Even small gains in reducing VMT will help.
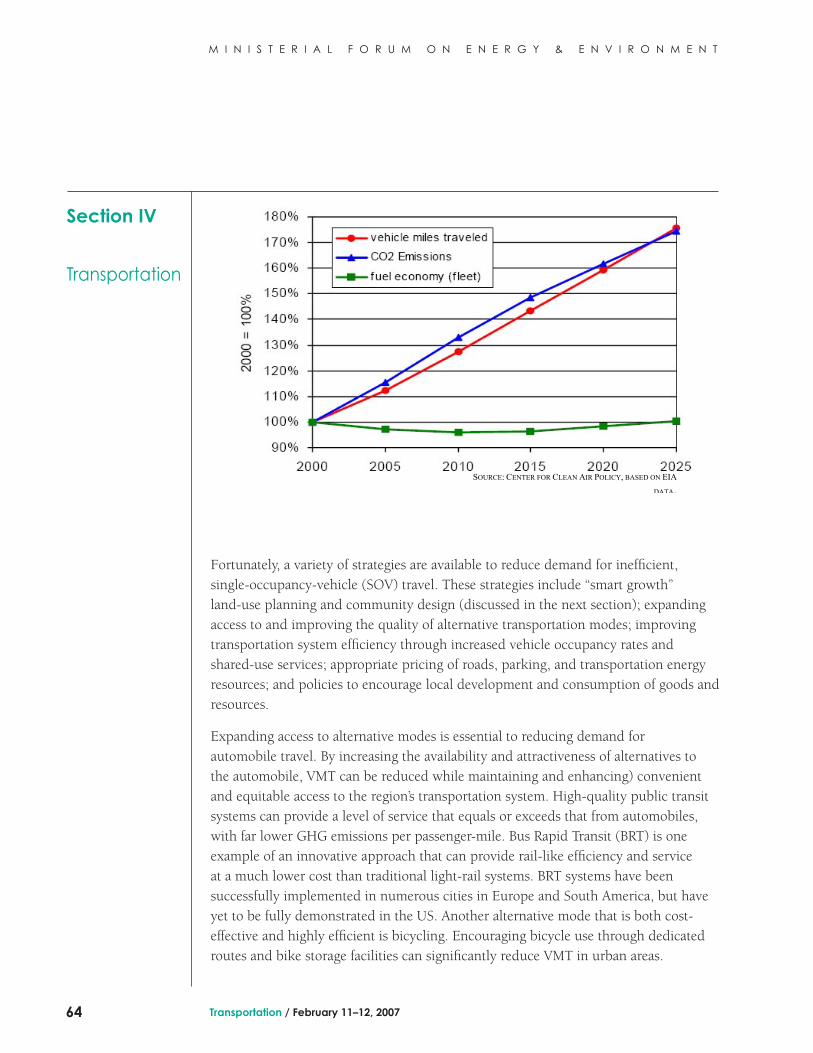
Transportation / February 11–12, 200764
M I N I S T E R I A L F O R U M O N E N E R G Y & E N V I R O N M E N T
Section IV
Transportation
Fortunately, a variety of strategies are available to reduce demand for inefficient, single-occupancy-vehicle (SOV) travel. These strategies include “smart growth” land-use planning and community design (discussed in the next section); expanding access to and improving the quality of alternative transportation modes; improving transportation system efficiency through increased vehicle occupancy rates and shared-use services; appropriate pricing of roads, parking, and transportation energy resources; and policies to encourage local development and consumption of goods and resources.
Expanding access to alternative modes is essential to reducing demand for automobile travel. By increasing the availability and attractiveness of alternatives to the automobile, VMT can be reduced while maintaining and enhancing) convenient and equitable access to the region’s transportation system. High-quality public transit systems can provide a level of service that equals or exceeds that from automobiles, with far lower GHG emissions per passenger-mile. Bus Rapid Transit (BRT) is one example of an innovative approach that can provide rail-like efficiency and service at a much lower cost than traditional light-rail systems. BRT systems have been successfully implemented in numerous cities in Europe and South America, but have yet to be fully demonstrated in the US. Another alternative mode that is both cost-effective and highly efficient is bicycling. Encouraging bicycle use through dedicated routes and bike storage facilities can significantly reduce VMT in urban areas.
SOURCE: CENTER FOR CLEAN AIR POLICY, BASED ON EIADATA.
Transportation / February 11–12, 2007 65
M I N I S T E R I A L F O R U M O N E N E R G Y & E N V I R O N M E N T
Section IV
Transportation
Existing automobile infrastructure can be made more efficient by increasing vehicle occupancy rates through the use of HOV lanes and ridesharing programs. Shared-use strategies such as car sharing and station cars have been shown to reduce VMT and may also be used to promote market penetration of advanced vehicle technologies.
Finally, expansion of alternatives can be complemented by pricing mechanisms to encourage the efficient use of transportation resources. Programs to ensure appropriate pricing of fuels, road access, and parking can increase the effectiveness of the efficiency measures discussed above.
IV. Sustainable Transportation and Land Use Planning
Reducing VMT and promoting alternative modes of travel is contingent on future land use patterns. Dispersed land use or “sprawl” is dependent on the automobile and thus subject to traffic congestion that often demands large state and provincial investments to rectify. Walking and bicycling are difficult and public transit is inefficient. These modes are more viable in compact, mixed use “smart growth” areas where jobs and residential, commercial, and other uses are in close proximity.
The region’s urban centers, small cities and towns, even village areas, have the existing density to be conducive to walking and biking and bus and light rail services. These historic areas, and new development- planned and designed to include mixed uses with interconnecting pedestrian and biking facilities and access to public transit services - should be supported by state and provincial governments. This support includes infrastructure funding priority, planning assistance, and public outreach.
In addition transportation systems, modal, and project planning at the state, provincial and regional levels should consider the green house gas emissions and carbon and climate goals associated with the plans and projects.
V. Expanded Intermodal Freight Transportation
Trucks carry most of the freight in the NEG-ECP region, and as a result are the second largest user of energy in the transport sector (behind passenger vehicles). Opportunities may exist in the region to shift freight movement from trucks to rail or maritime modes, which can be up to three times more efficient. Improved integration and more judicious use of the modes and systems of transporting goods in the NEG-ECP region could result in better fuel efficiency and reduce GHG emissions, while reducing traffic congestion and roadway wear and tear.
Transportation / February 11–12, 200766
M I N I S T E R I A L F O R U M O N E N E R G Y & E N V I R O N M E N T
Section IV
Transportation
The majority of the freight moved in the NEG-ECP region is short-haul, and intended for use by private industry in wholesale and retail distribution systems (called Just-in-Time delivery systems). A smaller share of freight (generally heavier commodities such as petroleum products) is carried port-to-port and then broken down for distribution at large-scale transfer facilities. Private industry controls most of the region’s rail networks and port facilities, and private companies’ mode decisions are based on cost and timing. In addition, any new development of intermodal transfer facilities must be coordinated with the private sector in order to ensure that short-haul, light load traffic in the region immediately surrounding the facilities does not increase.
Government cannot act alone in enhancing freight infrastructure. Engaging the private sector in a public/private partnership to study and develop the long-term interconnectivity of freight networks and facilities could reduce the emissions impact of freight movement, along with lowering the costs associated with the shipment of goods and addressing concerns of competitiveness, security, and continued development.
VI. Transportation Policy Actions to Reduce the Emissions of Greenhouse Gases and Other Air Pollutants
ACTION ITEM 8
▲
Governors and premiers shall appoint a regional standing task force of air policy and transportation officials to pursue the implementation of the commitments included in this document, or any other transportation initiatives to reduce air emissions, and to set a regional goal for greenhouse gas reductions from the transportation sector. This standing committee is directed to produce a regional transportation action plan proposal for submission to the 2008 Conference of New England Governors and Eastern Canadian Premiers. The initial priority actions to be considered are below.
a. Development of biofuels to address CO2 and other air emissions that use local feedstocks and technologies;
Along with reducing GHG emissions, developing locally produced biofuels can enhance the reliability, security, and affordability of transportation fuels while encouraging economic development. In order to further Action Item 23, Governors

Transportation / February 11–12, 2007 67
M I N I S T E R I A L F O R U M O N E N E R G Y & E N V I R O N M E N T
Section IV
Transportation
and Premiers will support the creation of a collaborative to research and develop production capacity of biodiesel in the region and develop a set of metrics for determining the net GHG contributions of different biofuels based on feedstock, processing, etc. As local production and reasonable costs allow, Governors and Premiers will also commit to setting a minimum percentage target for 2010 in the region for the use of biofuels that can demonstrate a net GHG benefit. This commitment will assure developers of demand for their product, encouraging growth in production.
Further, Governors and Premiers will collaborate to lead an effort for research and development of cellulosic ethanol production in the region based on domestic feedstocks. This will include studying the available feedstocks in the region, and as production and reasonable costs allow committing resources to develop a pilot facility and using cellulosic ethanol at a minimum percentage volume.
b. Promotion of fuel efficiency in all modes of transportation through incentives for efficient technologies on the market, research and development initiatives for new and emerging technologies, partnerships with the private sector, and public awareness programs;
Governors and Premiers will implement in partnership with the private sector a regional network of electrified truck stops to reduce the idling of trucks overnight throughout the region. These stations are safer and more comfortable for the drivers, reduce emissions and save fuel. Implemening idling restrictions for heavy duty vehicles and promoting enabling technologies could include: cabin heaters, engine heaters, and advanced alternative power units (APUs). In addition, a number of commercially available technologies that can significantly improve efficiency in heavy duty vehicles are under-utilized. These include improved aerodynamics, low rolling resistance tires, engine/drive train lubricants, and others. Incentives or low-interest loan programs (which can be provided at little net cost to jurisdictions) can be effective mechanisms to mature the markets for these technologies, reducing fuel consumption and emissions.
Research and empirical data indicate that when consumers are provided with unbiased information that shows how their behavior causes impacts, many do respond and adjust their behavior to reduce these identified impacts. The success with which the public responded to basic information linking cancer with tobacco smoking is one prime example. Similar responses are now being seen in the transportation sector, where hybrid electric cars provide real-time gasoline consumption information.
Transportation / February 11–12, 200768
M I N I S T E R I A L F O R U M O N E N E R G Y & E N V I R O N M E N T
Section IV
Transportation
Many drivers have adjusted their behavior to maximize fuel efficiency through techniques such as smooth acceleration, holding a consistent speed and watching the road ahead to avoid the need for sudden braking. Several groups have started on-line competitions through various driver clubs so that drivers can post their fuel consumption information.
The New England and Eastern Canada Region has a demonstrated knowledge about environmental issues that are more advanced than many other regions in our respective countries. Consumers are better informed on their purchases and support environmental commitments. These consumers also understand the link between environmental protection and economics, and are more willing to base a purchase on the expected lifecycle costs of the product. The region should take advantage of this knowledge and encourage manufacturers to provide even more efficient products for sale. Economies of scale can be further improved by engaging with states and provinces in other areas, such as New York, California and British Columbia. Each of this have demographics, economies and government leadership that is similar to those in the NEG/ECP, and collaboration would in effect represent more than 1/3 the total population in both countries.
c. Expansion of alternative transportation and commuter services and facilities;
Successful implementation of this action will enhance access to goods and services while limiting miles traveled in single occupancy vehicles. Governors and Premiers agree to continue developing mass transit systems including urban, and inter-city bus and rail systems, as well asincreasing public transit in suburban and rural areas, and bicycle and pedestrian facilities throughout the region.
Successful pilots or ongoing programs in one jurisdiction will be highlighted at subsequent NEG/ECP meetings. Examples include: addressing the demand for Park and Ride facilities by developing larger and more commuter lots or creating tax incentives to private companies to offer parking vouchers to employees redeemable for either a parking spot or cash payment if employees carpool or use alternative transportation in their daily commute.
The regional standing task force of air policy and transportation officials will study and consider the development of programs in partnership with auto insurance providers to offer “Pay-as-you-drive” insurance, where drivers pay insurance based on mileage and driving habits. This insurance has proven in other parts of the country to reduce individual vehicle miles traveled.
Transportation / February 11–12, 2007 69
M I N I S T E R I A L F O R U M O N E N E R G Y & E N V I R O N M E N T
Section IV
Transportation
d. Alignment of infrastructure funding with energy and climate goals by encouraging energy-efficient development in municipalities and regional entities;
Mechanisms to achieve this action include:
• Redevelop city, small, town and village areas, including brownfields, already served by basic infrastructure. Consider these areas and new compact, mixed use growth centers before supporting new wastewater, transportation, and other state-supported facilities in the undeveloped countryside.
• Encourage compact, mixed use development, such as transit oriented design, by working with towns and cities to revise their planning and zoning requirements to encourage traditional village centers that rely less on automobiles access and encourage pedestrian, bike and transit travel options.
• Provide technical assistance and other resources to municipalities to assist in the preparation of municipal level energy and climate change action plans. These plans set municipal carbon reduction targets and include strategies such as the use of alternative fuels in municipal fleets, local and neighborhood sponsored, car share and rideshare programs and park and ride facilities.
e. Use of life-cycle greenhouse gas and carbon emission analyses to set indicators for policy and project planning, when appropriate;
f. Collaboration with the private sector to seek new opportunities to enhance regional interconnectivity and efficiency of freight networks in the region.
A workgroup appointed by the NEG/ECP will engage private industry and collaborate with transportation agencies in each jurisdiction to create a complete study on freight traffic, truck, maritime, and rail, to clearly identify existing networks and freight flows and quantify the connection between these flows and development opportunities. The study will also recommend initial locations for the upgrade or development of intermodal facilities that will enhance the interconnectivity and efficiency of freight networks. The workgroup will present the results of the study and its recommendations to the NEG/ECP at its 2008 conference.

Transportation / February 11–12, 200770
M I N I S T E R I A L F O R U M O N E N E R G Y & E N V I R O N M E N T
Section IV
Transportation
ACTION ITEM 9
▲
Governors and Premiers will adopt clean car programs including the CO2 and air quality standards, such as California standards, throughout the entire region.
The region has an opportunity to join the growing number of jurisdictions that have adopted emission and fuel economy standards which have proved to be an effective measure in reducing the amount of carbon being released into the environment. The addition of states and provinces to the existing California Low Emission Vehicle standard will generate the most important reduction of greenhouse gas and conventional air pollutants in the transportation sector in the region between 2009 and 2015. With adoption of the standards by the entire region, 30% of the total vehicles sold in North America would fall under the most stringent emissions standards on the continent. It will drive the market for cleaner and more efficient light-duty vehicles for the benefit of both consumers and the environment.