CONEY ISLAND BROOKLYN - New York City generations, Coney Island is home to one of New York City’s...
20
COMMERCIAL DISTRICT NEEDS ASSESSMENT The Alliance for Coney Island in partnership with Commercial District Needs Assessment CONEY ISLAND BROOKLYN Bill de Blasio Mayor Gregg Bishop Commissioner
-
Upload
truongnhan -
Category
Documents
-
view
216 -
download
0
Transcript of CONEY ISLAND BROOKLYN - New York City generations, Coney Island is home to one of New York City’s...
COMMERCIAL DISTRICT NEEDS ASSESSMENT
The Alliance for Coney Islandin
partnershipwith
Commercial District Needs Assessment
CONEY ISLANDBROOKLYN
Bill de Blasio Mayor
Gregg BishopCommissioner
Background
Coney Island is a world-renowned neighborhood and seaside destination located on the westernmost tip of the Southern Brooklyn peninsula. Known as “The People’s Playground” for generations, Coney Island is home to one of New York City’s best-known beaches, an amusement district, and a 2.5-mile long boardwalk that connects to neighboring Brighton Beach.
During the early 20th century, Coney Island was the largest amusement attraction in the United States, bringing thrill-seekers, performers, and tourists from around the world. Designated historic landmarks (including Deno’s Wonder Wheel, the Parachute Jump, and the Cyclone Roller Coaster), the nonprofit arts organization Coney Island USA, performances, parades, and other events celebrate Coney Island’s unique history and capture the eccentric spirit of the neighborhood. Coney Island is also anchored by many cultural and recreational institutions, including the New York Aquarium, MCU Park (home to the Brooklyn Cyclones and the New York Cosmos), the Ford Amphitheater, and the YMCA.
While these attractions offer plenty for visitors to do during the summer months, Coney Island has three distinctive commercial corridors that serve the everyday needs of residents. Mermaid Avenue is the neighborhood’s primary commercial corridor with a mix of retail and community-serving storefront businesses. Low-rise mixed-use buildings, attached one- and two-family homes, and one-story commercial buildings are prevalent on Mermaid Avenue. Running parallel to the north, Neptune Avenue is home to a cluster of automotive businesses (auto repair shops, garages, lots), and low-rise mixed-use buildings. To the south, the amusement district is concentrated around Surf Avenue, Stillwell Avenue, and the Riegelmann Boardwalk. The western part of Surf Avenue is home to high-rise residential buildings and facilities for senior citizens. Residents and visitors can connect to each of these corridors through the subway and bus terminal located on Stillwell Avenue.
In 2012, the Coney Island community was hit by Hurricane Sandy, which was one of the most difficult challenges it has ever faced. Most businesses were devastated, yet merchants rallied together to survive and rebuild. Many businesses were able to reopen and continue to operate today because of loyal customers and local recovery efforts.
Neighborhood Demographics
Coney Island has a rich history of diverse immigrant communities spanning across Eastern Europe, the Caribbean, Latin America, Asia, and South Asia. Of the 32,000 residents, 37% are White, 27% are African American, 23% are Hispanic or Latino, and 11% are Asian. It is common to hear many languages spoken among local residents, including Russian, Mandarin, Spanish, and Arabic. Coney Island is also home to a high concentration of housing and facilities for senior citizens. As a result, the neighborhood population over 65 years old (20%) is almost twice that of both Brooklyn (12%) and New York City (12%). Despite the economic challenges of this aging population, as well as relatively high unemployment and low median household income compared to Brooklyn overall, Coney Island has a strong base of community organizations working to invest in the future of the neighborhood.
Future Opportunities
Historic gems, iconic anchors, and a steady population of residents are the backbone of Coney Island’s vitality. Members of the community sustain local businesses, and more than 5 million annual visitors help boost the local economy. Several major new mixed-use developments are currently underway throughout the district, which will expand available commercial and residential space. New and planned entertainment destinations include the Ford Amphitheater and the New York Aquarium’s 50,000 square foot Ocean Wonders: Sharks! exhibit. Despite local challenges, more than $400 million in public and private investments will help the Coney Island commercial district continue to grow in the years ahead.
ABOUT CONEY ISLAND
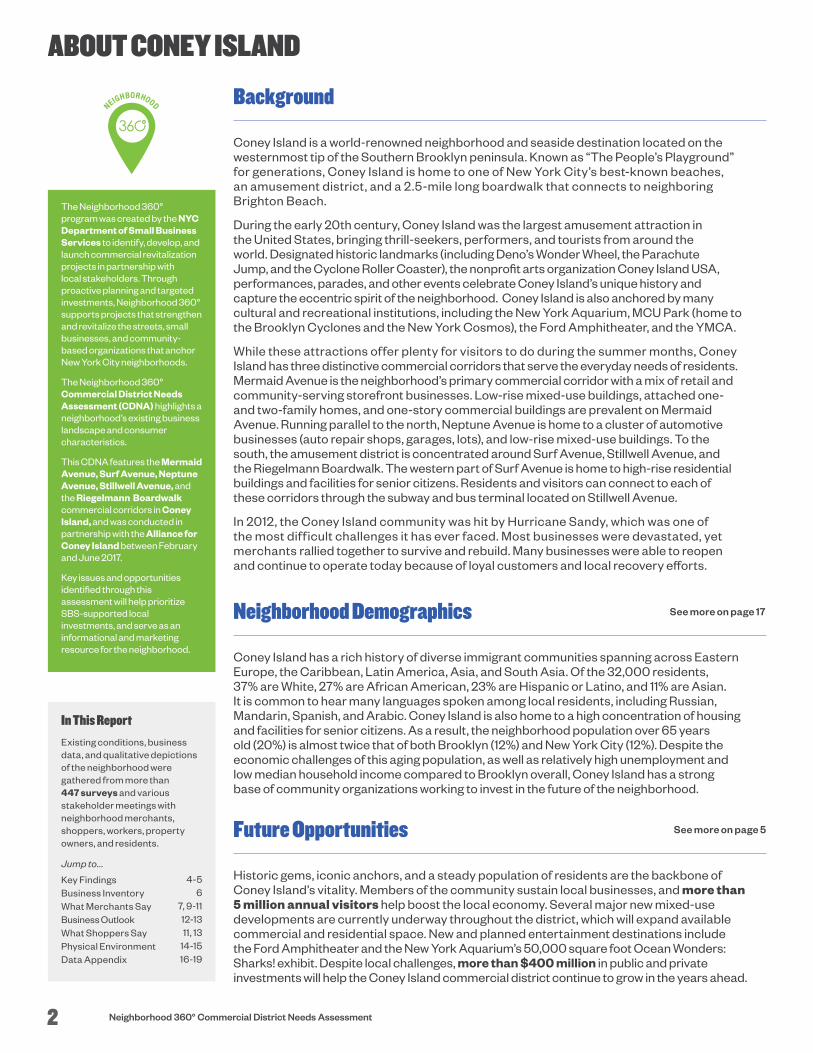
The Neighborhood 360° program was created by the NYC Department of Small Business Services to identify, develop, and launch commercial revitalization projects in partnership with local stakeholders. Through proactive planning and targeted investments, Neighborhood 360° supports projects that strengthen and revitalize the streets, small businesses, and community-based organizations that anchor New York City neighborhoods.
The Neighborhood 360° Commercial District Needs Assessment (CDNA) highlights a neighborhood’s existing business landscape and consumer characteristics.
This CDNA features the Mermaid Avenue, Surf Avenue, Neptune Avenue, Stillwell Avenue, and the Riegelmann Boardwalk commercial corridors in Coney Island, and was conducted in partnership with the Alliance for Coney Island between February and June 2017.
Key issues and opportunities identified through this assessment will help prioritize SBS-supported local investments, and serve as an informational and marketing resource for the neighborhood.
In This Report
Existing conditions, business data, and qualitative depictions of the neighborhood were gathered from more than 447 surveys and various stakeholder meetings with neighborhood merchants, shoppers, workers, property owners, and residents.
Jump to...
Key FindingsBusiness InventoryWhat Merchants SayBusiness OutlookWhat Shoppers SayPhysical EnvironmentData Appendix
4-56
7, 9-1112-1311, 13
14-1516-19
See more on page 17
See more on page 5
2 Neighborhood 360° Commercial District Needs Assessment
3
2
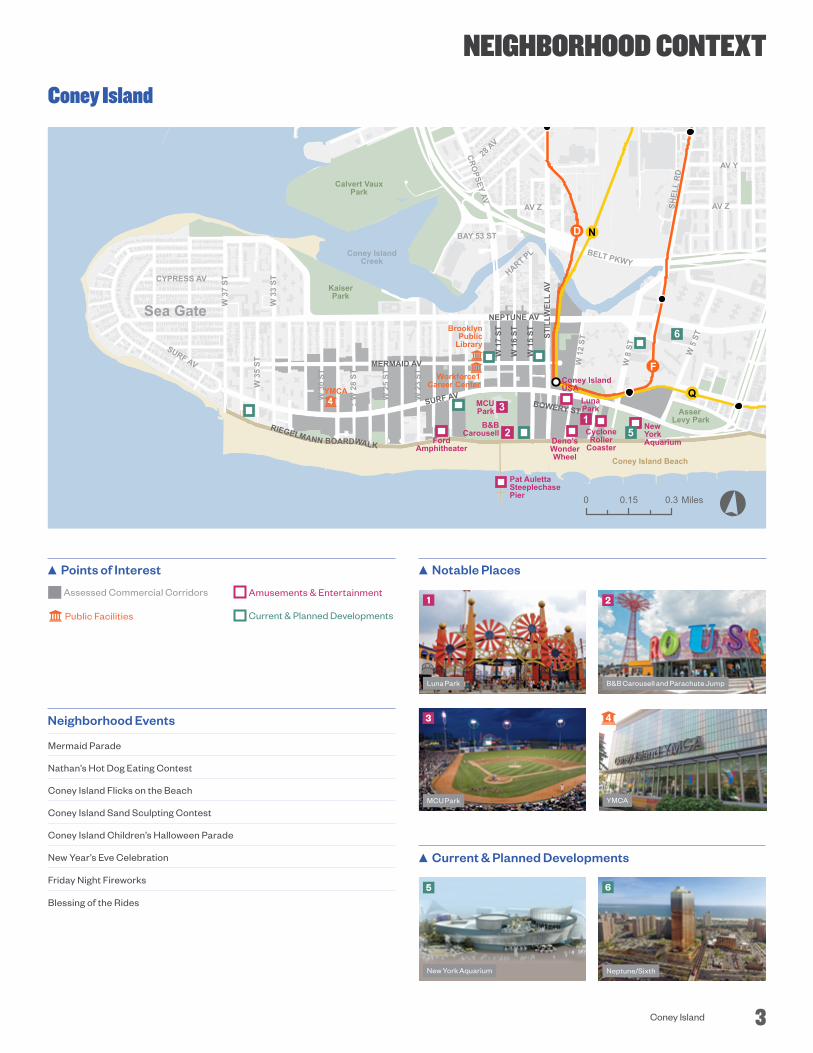
NEIGHBORHOOD CONTEXT
SURF AV
NEPTUNE AV
W 1
5 ST
W 3
3 ST
W 1
6 ST
W 3
7 ST
W 5
ST
AV ZSHEL
L R
D
AV Y
W 2
3 ST
W 2
5 ST
W 2
8 ST
W 1
2 ST
W 3
5 ST
STIL
LWEL
L AV
W 8
ST
W 3
0 ST
28 AV
W 1
7 ST
BOWERY ST
CYPRESS AV HART PL
BAY 53 ST
SURF AV
BELT PKWY
AV Z
CROPSEY AV
MERMAID AV
KaiserPark
Calvert VauxPark
Asser Levy Park
Coney IslandCreek
RIEGELMANN BOARDWALK
Sea Gate
D
F
Q
N
BrooklynPublic
Library
YMCA
Workforce1Career Center
4
Coney Island Beach
MCUPark
FordAmphitheater
NewYorkAquarium
CycloneRoller
Coaster
LunaPark
Deno’sWonderWheel
Pat AulettaSteeplechasePier
Coney IslandUSA
B&BCarousell
12
3
5
6
°0 0.15 Miles0.3
Mermaid Parade
Nathan’s Hot Dog Eating Contest
Coney Island Flicks on the Beach
Coney Island Sand Sculpting Contest
Coney Island Children’s Halloween Parade
New Year’s Eve Celebration
Friday Night Fireworks
Blessing of the Rides
Neighborhood Events
Coney Island
Points of Interest Notable Places
1
Luna Park B&B Carousell and Parachute Jump
YMCAMCU Park
4
Neptune/SixthNew York Aquarium
Current & Planned Developments
Public Facilities
Assessed Commercial Corridors Amusements & Entertainment
Current & Planned Developments
5 6
3Coney Island
Challenges Perceptions of safety are poor, especially at night
Coney Island remains a primarily seasonal attraction, so the number of visitors to the district fluctuates, making it difficult for businesses to reach their sales goals during the winter months
There is a strong need for more shopping and healthy food options, which causes residents to shop outside of the neighborhood
Public spaces, though abundant and easily accessible, are underutilized by both residents and visitors
Vacant lots, vacant storefronts, and non-commercial uses visibly disrupt the continuity of retail corridors
High proportion of storefronts are in need of physical improvements
Many seasonal visitors do not patronize businesses outside of the amusement district
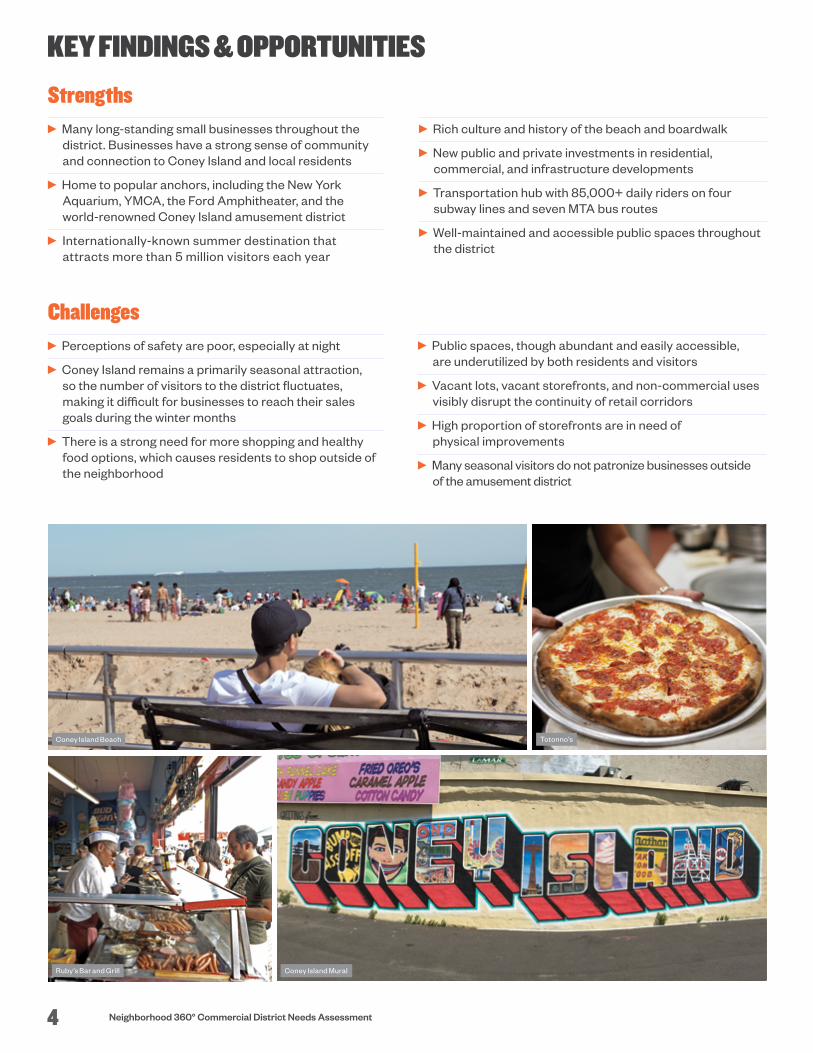
Coney Island Beach
Ruby’s Bar and Grill Coney Island Mural
Totonno’s
KEY FINDINGS & OPPORTUNITIES
Rich culture and history of the beach and boardwalk
New public and private investments in residential, commercial, and infrastructure developments
Transportation hub with 85,000+ daily riders on four subway lines and seven MTA bus routes
Well-maintained and accessible public spaces throughout the district
Strengths Many long-standing small businesses throughout the
district. Businesses have a strong sense of community and connection to Coney Island and local residents
Home to popular anchors, including the New York Aquarium, YMCA, the Ford Amphitheater, and the world-renowned Coney Island amusement district
Internationally-known summer destination that attracts more than 5 million visitors each year
4 Neighborhood 360° Commercial District Needs Assessment
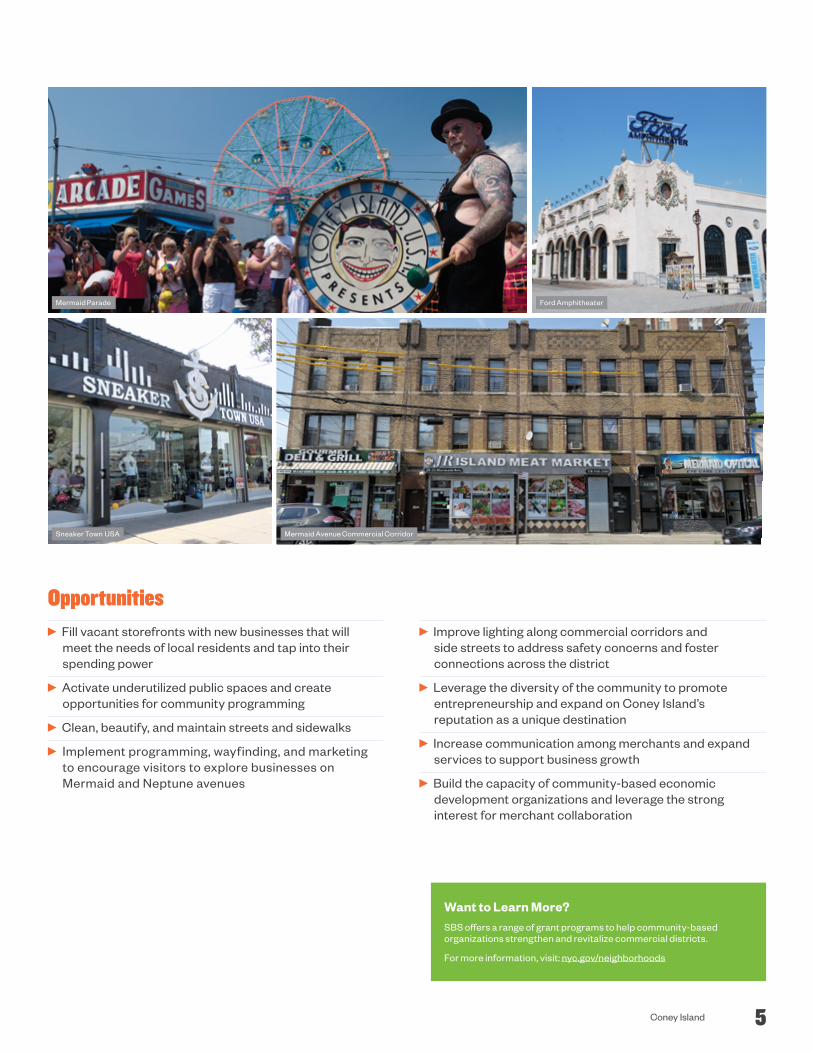
Ford AmphitheaterMermaid Parade
Sneaker Town USA Mermaid Avenue Commercial Corridor
Coney Island
Improve lighting along commercial corridors and side streets to address safety concerns and foster connections across the district
Leverage the diversity of the community to promote entrepreneurship and expand on Coney Island’s reputation as a unique destination
Increase communication among merchants and expand services to support business growth
Build the capacity of community-based economic development organizations and leverage the strong interest for merchant collaboration
Opportunities Fill vacant storefronts with new businesses that will
meet the needs of local residents and tap into their spending power
Activate underutilized public spaces and create opportunities for community programming
Clean, beautify, and maintain streets and sidewalks
Implement programming, wayfinding, and marketing to encourage visitors to explore businesses on Mermaid and Neptune avenues
Want to Learn More?SBS offers a range of grant programs to help community-based organizations strengthen and revitalize commercial districts.
For more information, visit: nyc.gov/neighborhoods
5
Pawn Shop, Cash Advance, & Money Transfer Services
Hardware & Home Goods Stores
Banks, Credit Unions, & Bank ATMs
Liquor Stores
Electronics & Cell Phone Stores
Dry Cleaning & Laundry Services
Professional Services
Construction, Manufacturing, & Wholesale Businesses
Clothing, Shoe Stores, & Gift Shops
Amusements & Entertainment
General Merchandise Stores & Miscellaneous Retail Stores
Pharmacies & Health Stores
Supermarkets & Food Stores
Medical Services & Nursing Homes
Automotive Businesses & Gas Stations
Beauty / Nail Salons & Barbershops
Full Service Restaurants & Bars
Delis / Bodegas
Public Administration, Nonprofits, & Houses of Worship
Vacant
Limited Service Restaurants
27
38
33
26
18
17
16
13
1311
11
10
10
10
7
6
5
5
4
4
3
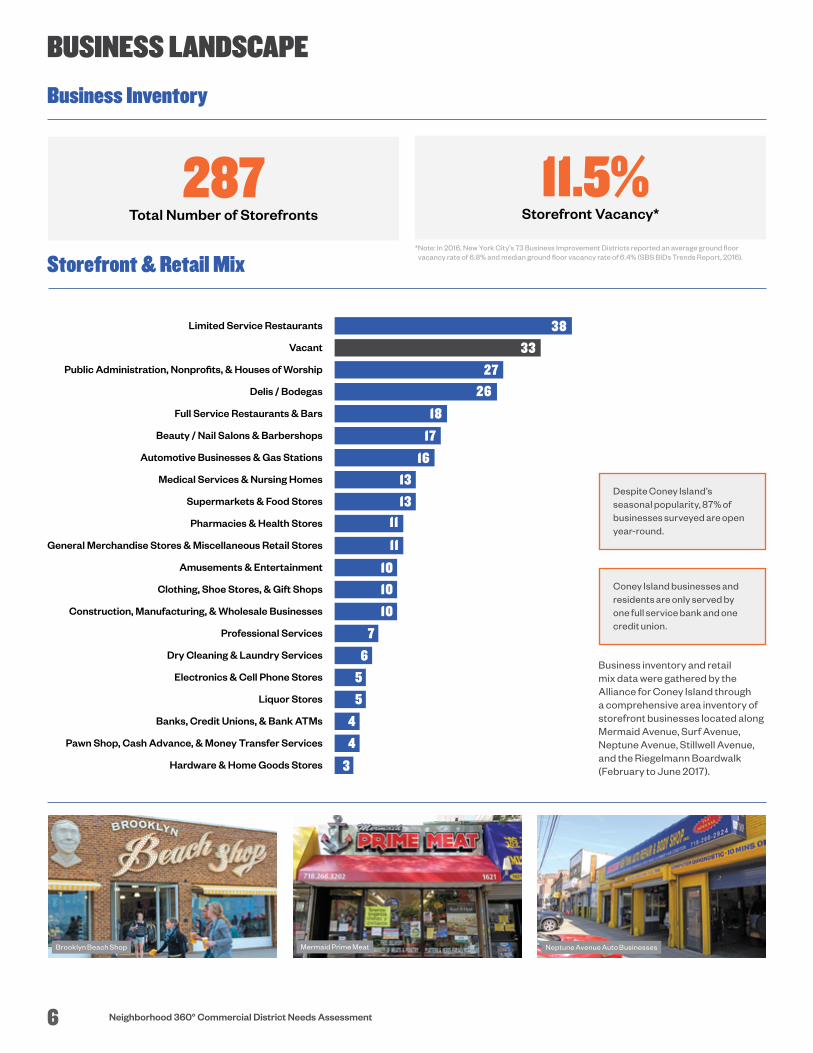
BUSINESS LANDSCAPE
287Total Number of Storefronts
11.5%Storefront Vacancy*
Business Inventory
Storefront & Retail Mix* Note: In 2016, New York City’s 73 Business Improvement Districts reported an average ground floor
vacancy rate of 6.8% and median ground floor vacancy rate of 6.4% (SBS BIDs Trends Report, 2016).
Mermaid Prime Meat Neptune Avenue Auto BusinessesBrooklyn Beach Shop
Business inventory and retail mix data were gathered by the Alliance for Coney Island through a comprehensive area inventory of storefront businesses located along Mermaid Avenue, Surf Avenue, Neptune Avenue, Stillwell Avenue, and the Riegelmann Boardwalk (February to June 2017).
Coney Island businesses and residents are only served by one full service bank and one credit union.
Despite Coney Island’s seasonal popularity, 87% of businesses surveyed are open year-round.
6 Neighborhood 360° Commercial District Needs Assessment
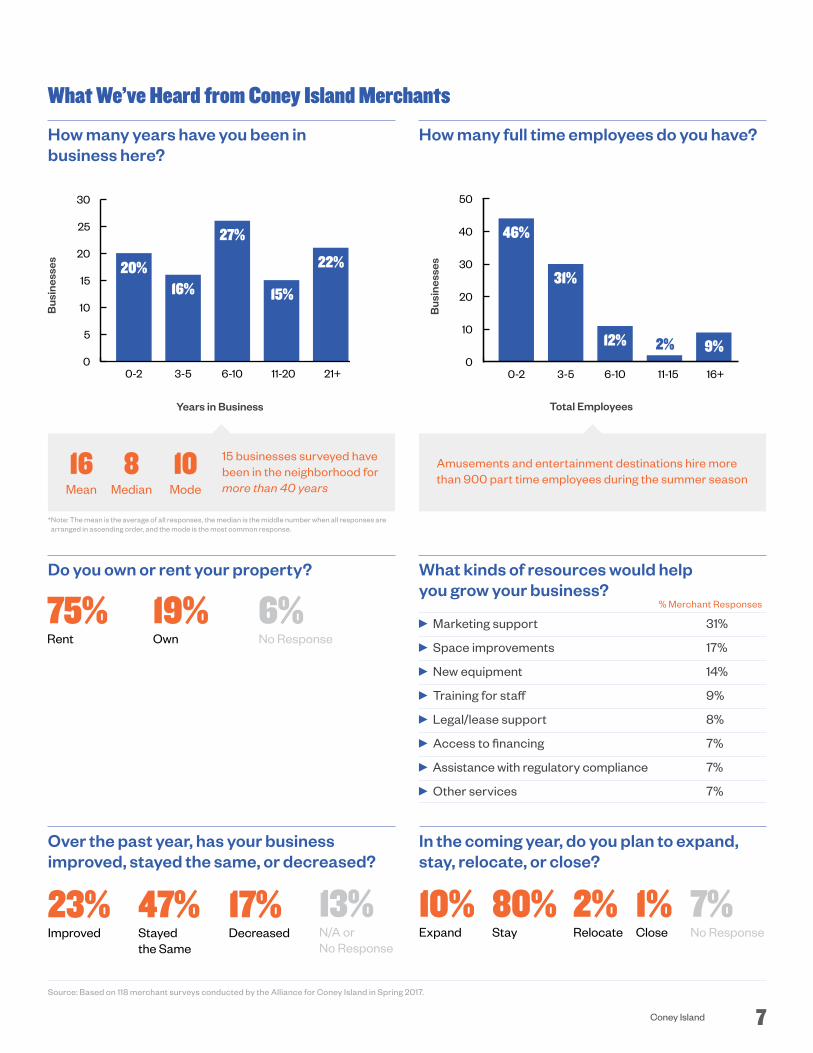
Source: Based on 118 merchant surveys conducted by the Alliance for Coney Island in Spring 2017.
What We’ve Heard from Coney Island Merchants
How many years have you been in business here?
Do you own or rent your property?
75%Rent
19%Own
6%No Response
Over the past year, has your business improved, stayed the same, or decreased?
23%Improved
47%Stayed the Same
17%Decreased
13%N/A or No Response
Years in Business
Bus
ines
ses
0
5
10
15
20
25
30
20%16% 15%
22%
27%
21+11-206-103-50-2
How many full time employees do you have?
Total Employees
Bus
ines
ses
16+11-156-103-50-20
10
20
30
40
50
46%
31%
2% 9%12%
What kinds of resources would help you grow your business?
Marketing support 31%
Space improvements 17%
New equipment 14%
Training for staff 9%
Legal/lease support 8%
Access to financing 7%
Assistance with regulatory compliance 7%
Other services 7%
% Merchant Responses
16Mean
8Median
15 businesses surveyed have been in the neighborhood for more than 40 years
10Mode
16Mean
8Median
Amusements and entertainment destinations hire more than 900 part time employees during the summer season
In the coming year, do you plan to expand, stay, relocate, or close?
10%Expand
80%Stay
2%Relocate
1%Close
7%No Response
* Note: The mean is the average of all responses, the median is the middle number when all responses are arranged in ascending order, and the mode is the most common response.
7Coney Island
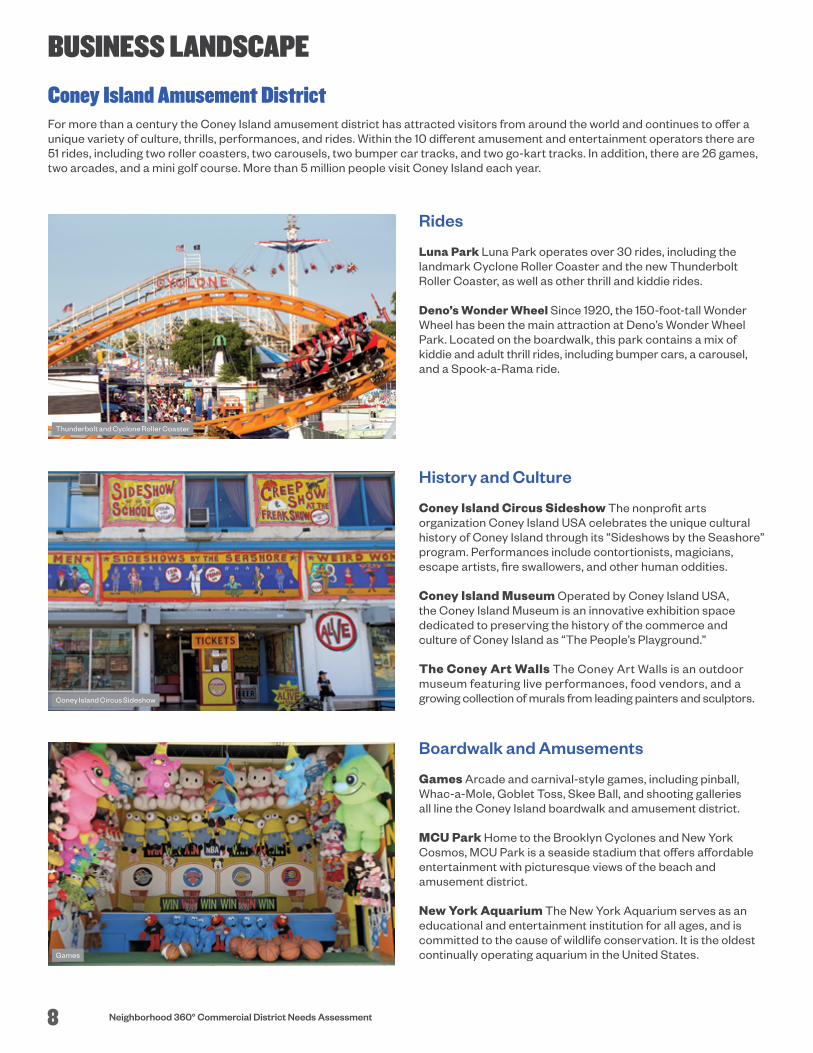
Rides
Luna Park Luna Park operates over 30 rides, including the landmark Cyclone Roller Coaster and the new Thunderbolt Roller Coaster, as well as other thrill and kiddie rides.
Deno’s Wonder Wheel Since 1920, the 150-foot-tall Wonder Wheel has been the main attraction at Deno’s Wonder Wheel Park. Located on the boardwalk, this park contains a mix of kiddie and adult thrill rides, including bumper cars, a carousel, and a Spook-a-Rama ride.
Boardwalk and Amusements
Games Arcade and carnival-style games, including pinball, Whac-a-Mole, Goblet Toss, Skee Ball, and shooting galleries all line the Coney Island boardwalk and amusement district.
MCU Park Home to the Brooklyn Cyclones and New York Cosmos, MCU Park is a seaside stadium that offers affordable entertainment with picturesque views of the beach and amusement district.
New York Aquarium The New York Aquarium serves as an educational and entertainment institution for all ages, and is committed to the cause of wildlife conservation. It is the oldest continually operating aquarium in the United States.
History and Culture
Coney Island Circus Sideshow The nonprofit arts organization Coney Island USA celebrates the unique cultural history of Coney Island through its “Sideshows by the Seashore” program. Performances include contortionists, magicians, escape artists, fire swallowers, and other human oddities.
Coney Island Museum Operated by Coney Island USA, the Coney Island Museum is an innovative exhibition space dedicated to preserving the history of the commerce and culture of Coney Island as “The People’s Playground.”
The Coney Art Walls The Coney Art Walls is an outdoor museum featuring live performances, food vendors, and a growing collection of murals from leading painters and sculptors.
BUSINESS LANDSCAPE
Coney Island Amusement District
Coney Island Circus Sideshow
Games
Thunderbolt and Cyclone Roller Coaster
For more than a century the Coney Island amusement district has attracted visitors from around the world and continues to offer a unique variety of culture, thrills, performances, and rides. Within the 10 different amusement and entertainment operators there are 51 rides, including two roller coasters, two carousels, two bumper car tracks, and two go-kart tracks. In addition, there are 26 games, two arcades, and a mini golf course. More than 5 million people visit Coney Island each year.
8 Neighborhood 360° Commercial District Needs Assessment
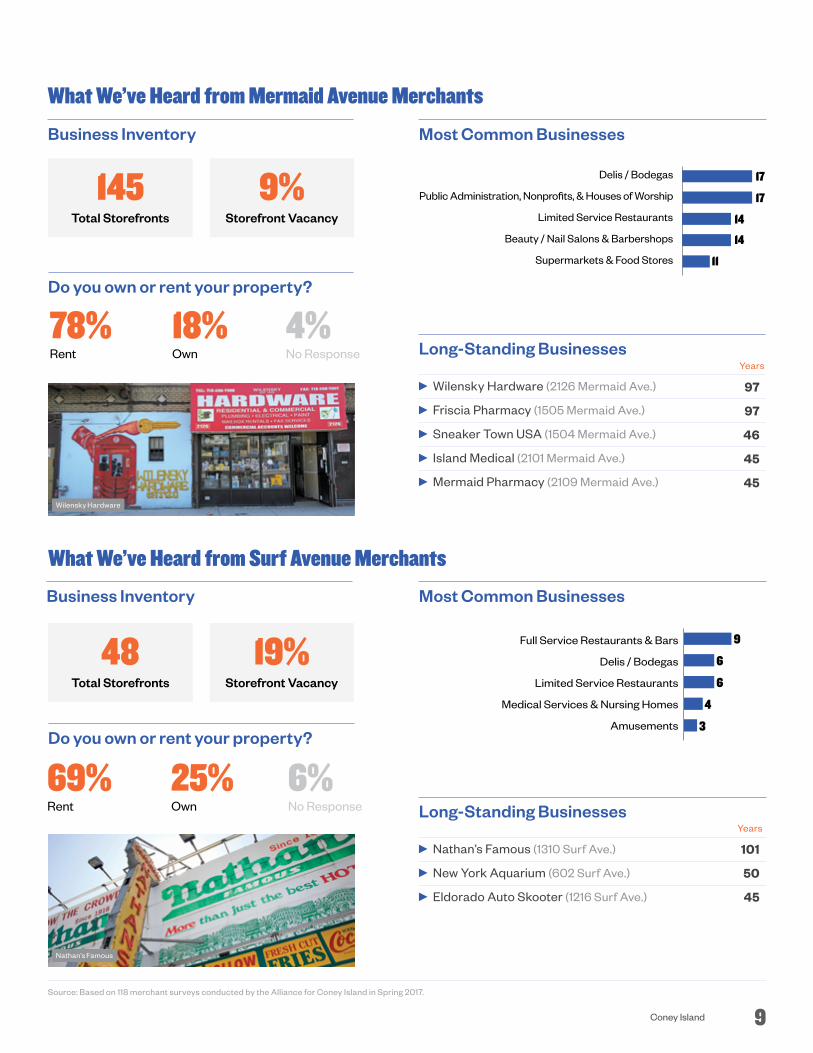
Source: Based on 118 merchant surveys conducted by the Alliance for Coney Island in Spring 2017.
9Coney Island
Most Common Businesses
17
17
14
14
11Supermarkets & Food Stores
Beauty / Nail Salons & Barbershops
Limited Service Restaurants
Public Administration, Nonprofits, & Houses of Worship
Delis / Bodegas
Choice 1: Most Common Business Types
Long-Standing Businesses
Wilensky Hardware (2126 Mermaid Ave.)
Friscia Pharmacy (1505 Mermaid Ave.)
Sneaker Town USA (1504 Mermaid Ave.)
Island Medical (2101 Mermaid Ave.)
Mermaid Pharmacy (2109 Mermaid Ave.)
Years
97
97
46
45
45
Most Common Businesses
9
4
3Amusements
Medical Services & Nursing Homes
Delis / Bodegas
Limited Service Restaurants
Full Service Restaurants & Bars
6
6
Long-Standing Businesses
Nathan’s Famous (1310 Surf Ave.)
New York Aquarium (602 Surf Ave.)
Eldorado Auto Skooter (1216 Surf Ave.)
Years
101
50
45
What We’ve Heard from Mermaid Avenue Merchants
What We’ve Heard from Surf Avenue Merchants
Business Inventory
Do you own or rent your property?
69%Rent
25%Own
6%No Response
48Total Storefronts
19%Storefront Vacancy
Wilensky Hardware
Business Inventory
145Total Storefronts
9%Storefront Vacancy
Nathan’s Famous
Do you own or rent your property?
78%Rent
18%Own
4%No Response
BUSINESS LANDSCAPE
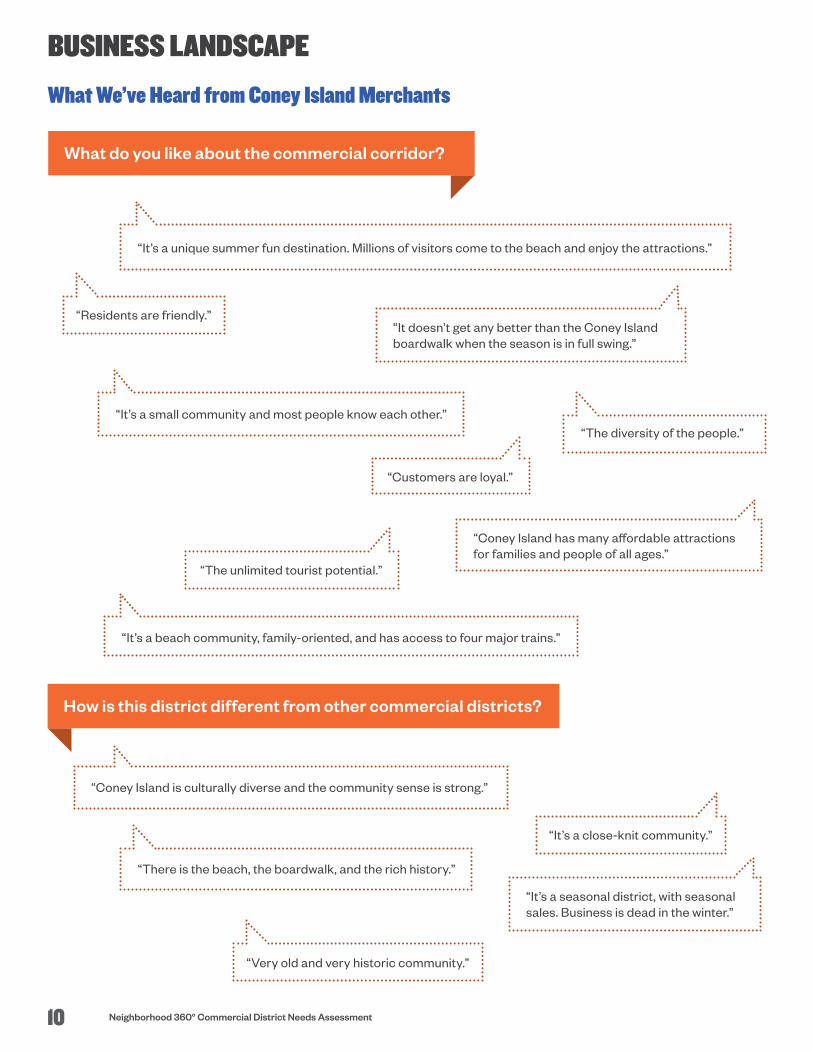
How is this district different from other commercial districts?
“Residents are friendly.”
“Very old and very historic community.”
“The diversity of the people.”
“There is the beach, the boardwalk, and the rich history.”
“Coney Island has many affordable attractions for families and people of all ages.”
“It’s a seasonal district, with seasonal sales. Business is dead in the winter.”
“It doesn’t get any better than the Coney Island boardwalk when the season is in full swing.”
“Coney Island is culturally diverse and the community sense is strong.”
“It’s a small community and most people know each other.”
“It’s a beach community, family-oriented, and has access to four major trains.”
“It’s a unique summer fun destination. Millions of visitors come to the beach and enjoy the attractions.”
“Customers are loyal.”
“The unlimited tourist potential.”
“It’s a close-knit community.”
What We’ve Heard from Coney Island Merchants
What do you like about the commercial corridor?
10 Neighborhood 360° Commercial District Needs Assessment
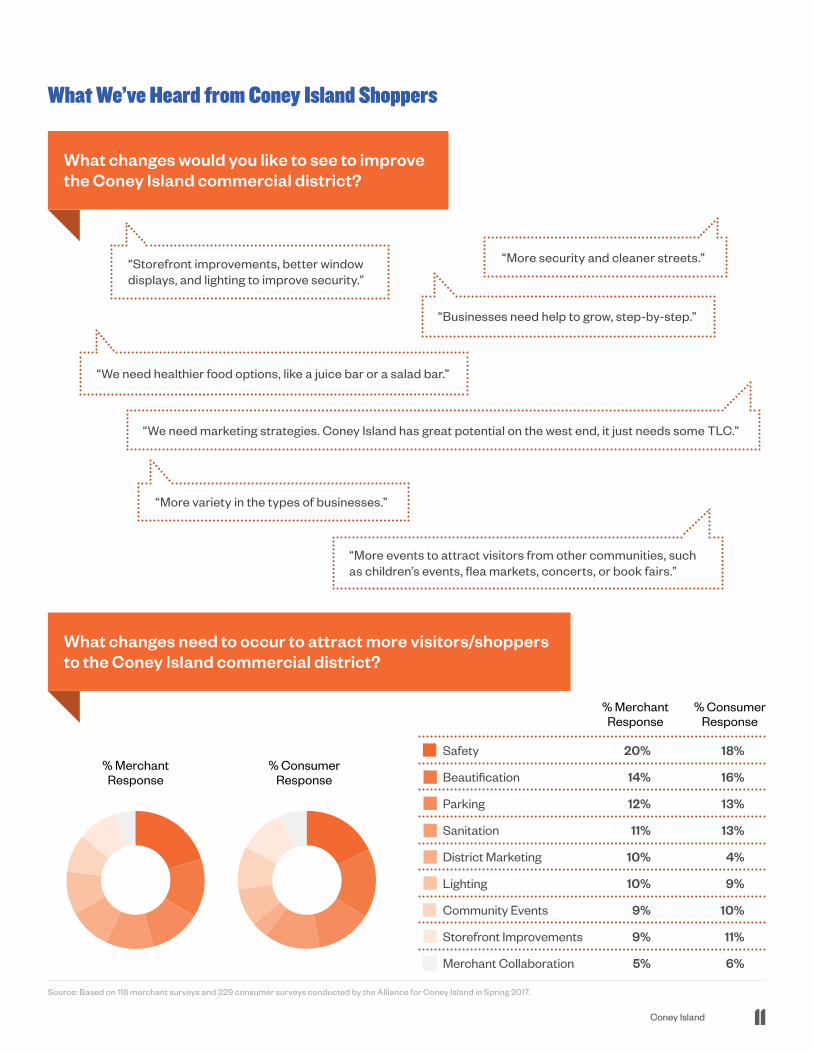
“More variety in the types of businesses.”
“Businesses need help to grow, step-by-step.”
“We need healthier food options, like a juice bar or a salad bar.”
“Storefront improvements, better window displays, and lighting to improve security.”
“More security and cleaner streets.”
What We’ve Heard from Coney Island Shoppers
What changes would you like to see to improve the Coney Island commercial district?
“More events to attract visitors from other communities, such as children’s events, flea markets, concerts, or book fairs.”
“We need marketing strategies. Coney Island has great potential on the west end, it just needs some TLC.”
What changes need to occur to attract more visitors/shoppers to the Coney Island commercial district?
Safety
Beautification
Parking
Sanitation
District Marketing
Lighting
Community Events
Storefront Improvements
Merchant Collaboration
20%
14%
12%
11%
10%
10%
9%
9%
5%
18%
16%
13%
13%
4%
9%
10%
11%
6%
% Merchant Response
% Consumer Response
% Merchant Response
% Consumer Response
Source: Based on 118 merchant surveys and 329 consumer surveys conducted by the Alliance for Coney Island in Spring 2017.
11Coney Island
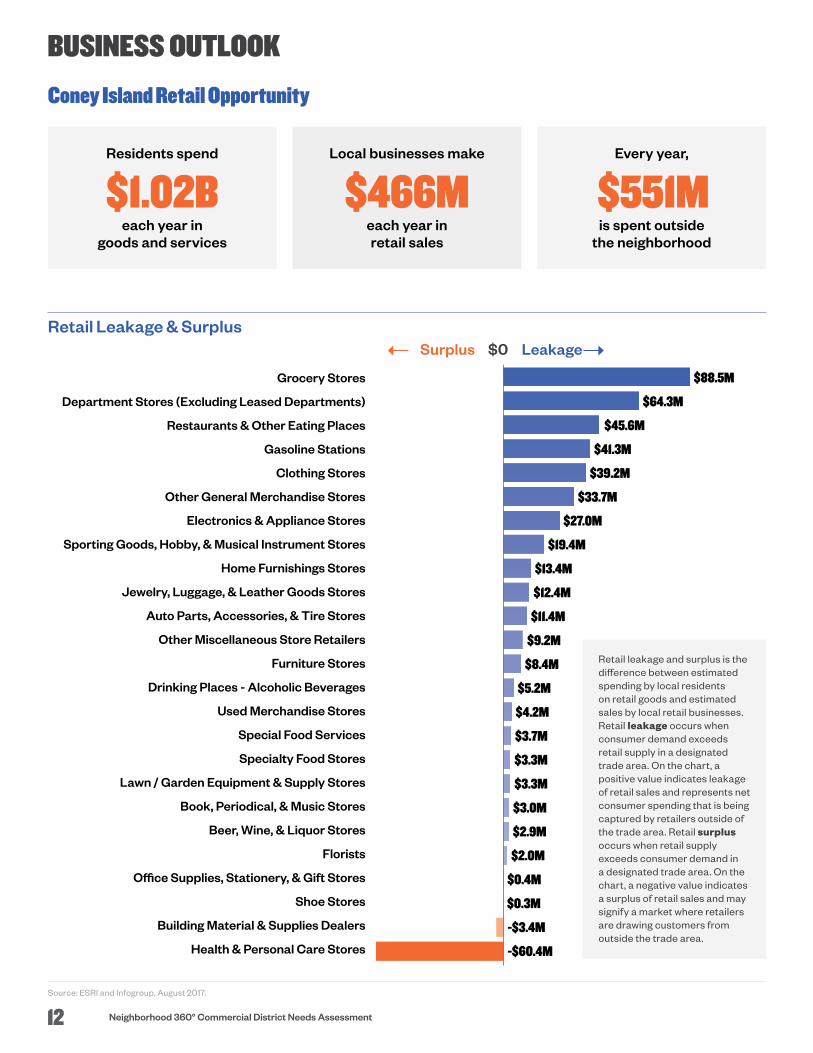
BUSINESS OUTLOOK
Retail Leakage & Surplus
Local businesses make
$466Meach year in retail sales
Every year,
$551Mis spent outside
the neighborhood
Residents spend
$1.02B each year in
goods and services
Grocery Stores $88.5M
Department Stores (Excluding Leased Departments) $64.3M
Restaurants & Other Eating Places $45.6M
Gasoline Stations $41.3M
Clothing Stores $39.2M
Other General Merchandise Stores $33.7M
Electronics & Appliance Stores $27.0M
Sporting Goods, Hobby, & Musical Instrument Stores $19.4M
Home Furnishings Stores $13.4M
Jewelry, Luggage, & Leather Goods Stores $12.4M
Auto Parts, Accessories, & Tire Stores $11.4M
Other Miscellaneous Store Retailers $9.2M
Furniture Stores $8.4M
Drinking Places - Alcoholic Beverages $5.2M
Used Merchandise Stores $4.2M
Special Food Services $3.7M
Specialty Food Stores $3.3M
Lawn / Garden Equipment & Supply Stores $3.3M
Book, Periodical, & Music Stores $3.0M
Beer, Wine, & Liquor Stores $2.9M
Florists $2.0M
Office Supplies, Stationery, & Gift Stores $0.4M
Shoe Stores $0.3M
Building Material & Supplies Dealers -$3.4M
Health & Personal Care Stores -$60.4M
LeakageSurplus $0
Coney Island Retail Opportunity
Source: ESRI and Infogroup, August 2017.
Retail leakage and surplus is the difference between estimated spending by local residents on retail goods and estimated sales by local retail businesses. Retail leakage occurs when consumer demand exceeds retail supply in a designated trade area. On the chart, a positive value indicates leakage of retail sales and represents net consumer spending that is being captured by retailers outside of the trade area. Retail surplus occurs when retail supply exceeds consumer demand in a designated trade area. On the chart, a negative value indicates a surplus of retail sales and may signify a market where retailers are drawing customers from outside the trade area.
12 Neighborhood 360° Commercial District Needs Assessment
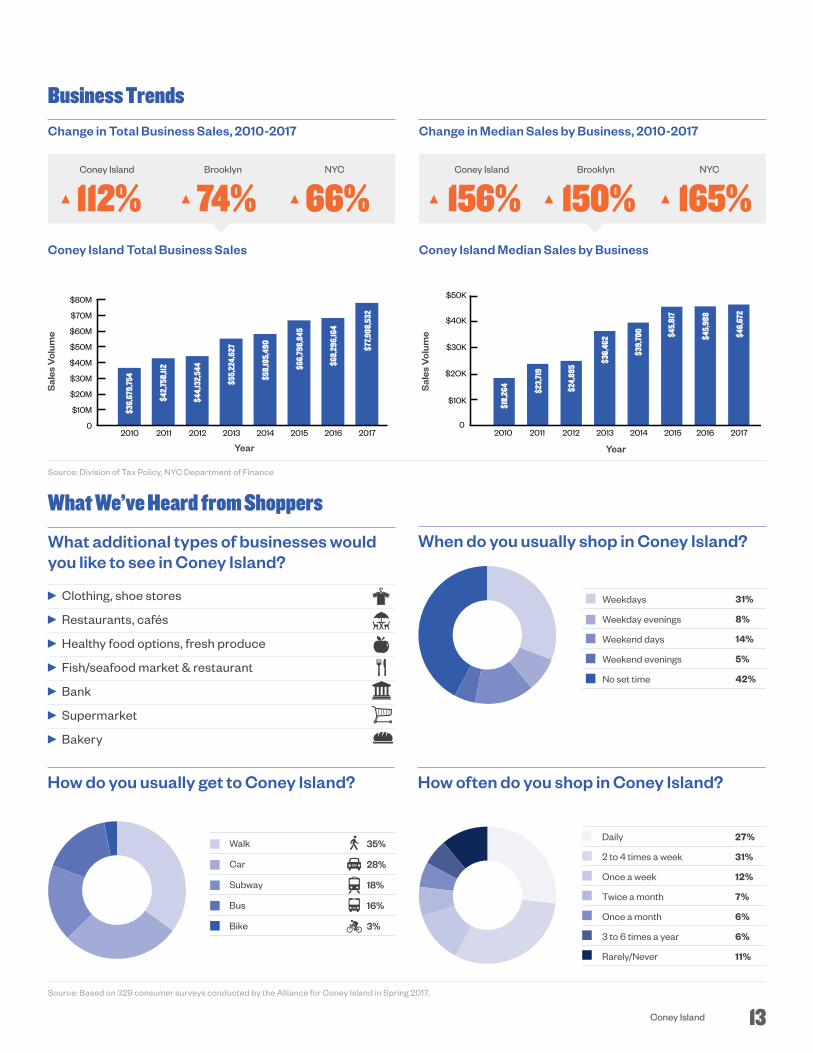
Coney Island Brooklyn NYC
112% 74% 66% Coney Island Brooklyn NYC
156% 150% 165%
Business Trends
Source: Based on 329 consumer surveys conducted by the Alliance for Coney Island in Spring 2017.
Source: Division of Tax Policy, NYC Department of Finance
Change in Total Business Sales, 2010-2017 Change in Median Sales by Business, 2010-2017
Coney Island Median Sales by BusinessConey Island Total Business Sales
Year
0
$10K
$2OK
$30K
$40K
$50K
2011 2012 2013 2014 2015 2016 20172010
$18,
264
$23,
719
$24,
885
$36,
462
$39,
700 $4
5,81
7
$46,
672
$45,
988
Sal
es V
olum
e2011 2012 2013 2014 2015 2016 20172010
0
$10M
$20M
$30M
$40M
$50M
$60M
$70M
$80M
$36,
679,
754
$42,
758,
112
$44,
132,
544
$55,
224,
627
$58,
185,
490
$66,
798,
845
$77,9
08,5
32
$68,
296,
164
Year
Sal
es V
olum
e
Weekdays
Weekday evenings
Weekend days
Weekend evenings
No set time
31%
8%
14%
5%
42%
When do you usually shop in Coney Island?
What We’ve Heard from Shoppers
How often do you shop in Coney Island?
Shopping frequency
Adjusted graphs (these do not include live data)
Daily
2 to 4 times a week
Once a week
Twice a month
Once a month
3 to 6 times a year
Rarely/Never
27%
31%
12%
7%
6%
6%
11%
How do you usually get to Coney Island?
Walk
Car
Subway
Bus
Bike
35%
28%
18%
16%
3%
What additional types of businesses would you like to see in Coney Island?
Clothing, shoe stores
Restaurants, cafés
Healthy food options, fresh produce
Fish/seafood market & restaurant
Bank
Supermarket
Bakery
13Coney Island
Storefront Conditions
NEPTUNE AV
RIEGELMANN BOARDWALK
MERMAID AV
W 3
3 ST
W 2
4 ST
W 2
1 ST
W 2
8 ST
W 1
2 ST
STIL
LWEL
L AV
W 3
0 ST
W 1
7 ST
BOWERY ST
W 6
ST
BAY VIEW
AV
HART PL
W 1
0 ST
CR
OPSEY AV
BELT PKWY
W 8
ST
SURF AV
°Miles0 0.1 0.2
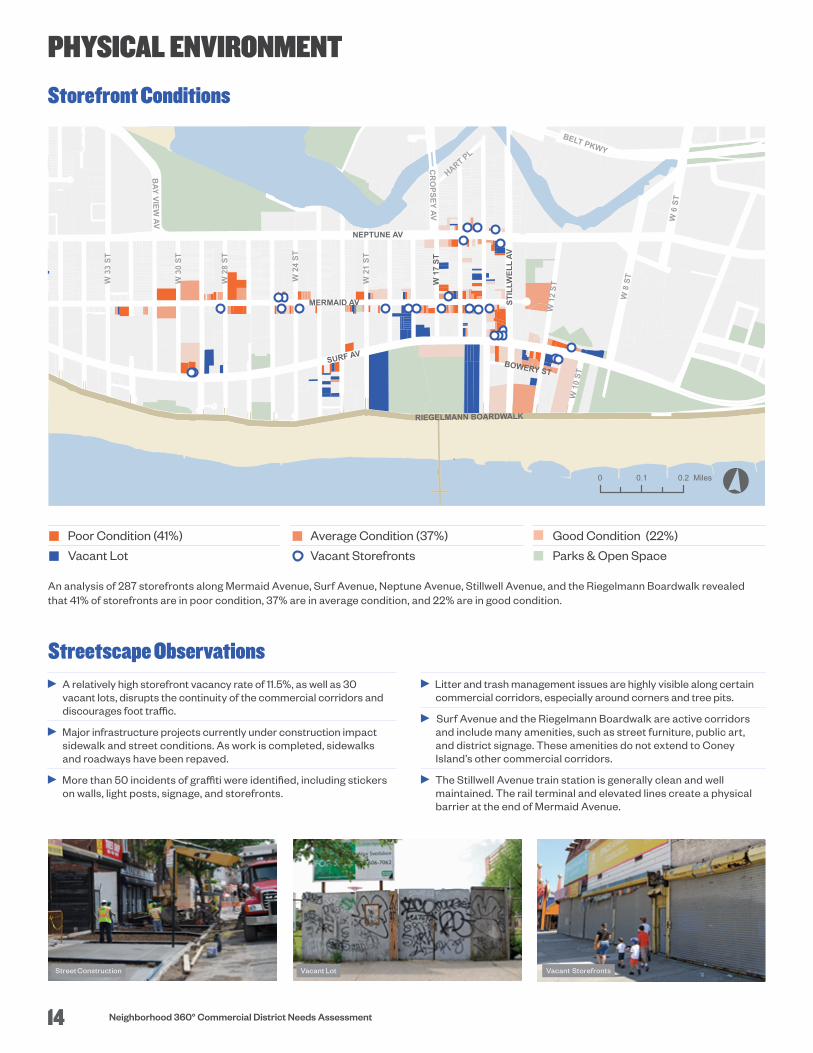
An analysis of 287 storefronts along Mermaid Avenue, Surf Avenue, Neptune Avenue, Stillwell Avenue, and the Riegelmann Boardwalk revealed that 41% of storefronts are in poor condition, 37% are in average condition, and 22% are in good condition.
PHYSICAL ENVIRONMENT
Streetscape Observations A relatively high storefront vacancy rate of 11.5%, as well as 30
vacant lots, disrupts the continuity of the commercial corridors and discourages foot traffic.
Major infrastructure projects currently under construction impact sidewalk and street conditions. As work is completed, sidewalks and roadways have been repaved.
More than 50 incidents of graffiti were identified, including stickers on walls, light posts, signage, and storefronts.
Poor Condition (41%)
Vacant Lot
Average Condition (37%)
Vacant Storefronts
Good Condition (22%)
Parks & Open Space
Litter and trash management issues are highly visible along certain commercial corridors, especially around corners and tree pits.
Surf Avenue and the Riegelmann Boardwalk are active corridors and include many amenities, such as street furniture, public art, and district signage. These amenities do not extend to Coney Island’s other commercial corridors.
The Stillwell Avenue train station is generally clean and well maintained. The rail terminal and elevated lines create a physical barrier at the end of Mermaid Avenue.
Street Construction Vacant Lot Vacant Storefronts
14 Neighborhood 360° Commercial District Needs Assessment
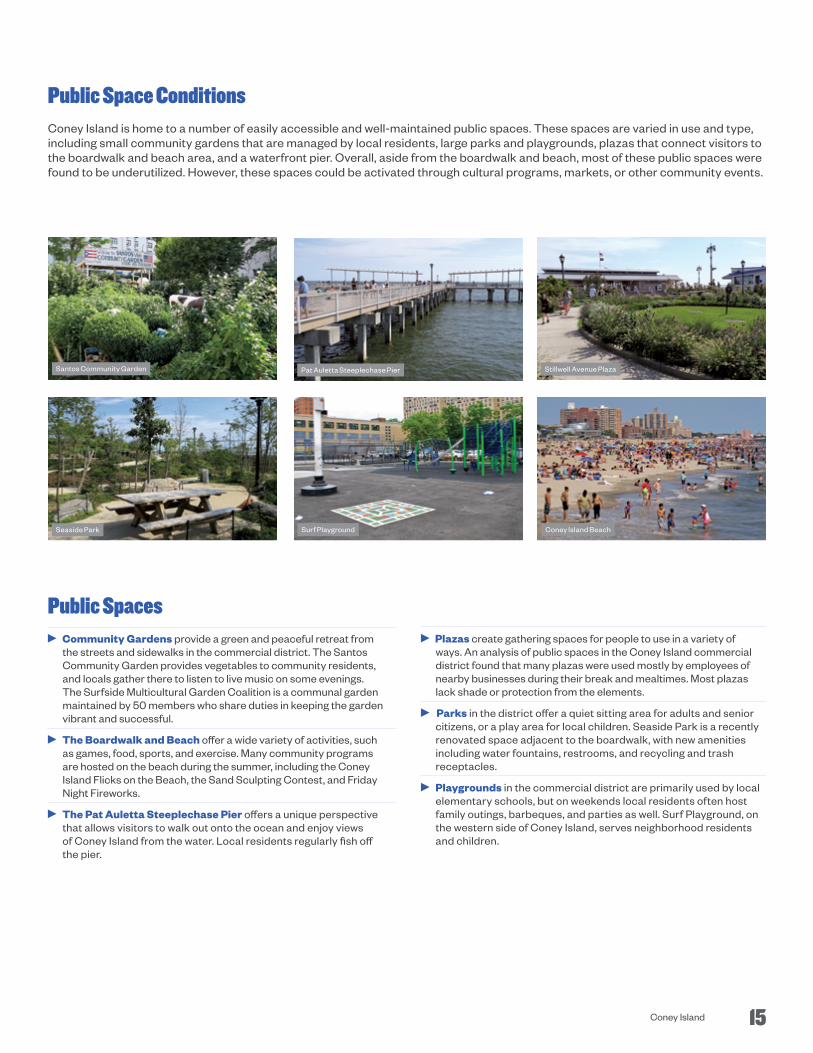
Coney Island is home to a number of easily accessible and well-maintained public spaces. These spaces are varied in use and type, including small community gardens that are managed by local residents, large parks and playgrounds, plazas that connect visitors to the boardwalk and beach area, and a waterfront pier. Overall, aside from the boardwalk and beach, most of these public spaces were found to be underutilized. However, these spaces could be activated through cultural programs, markets, or other community events.
Public Space Conditions
Community Gardens provide a green and peaceful retreat from the streets and sidewalks in the commercial district. The Santos Community Garden provides vegetables to community residents, and locals gather there to listen to live music on some evenings. The Surfside Multicultural Garden Coalition is a communal garden maintained by 50 members who share duties in keeping the garden vibrant and successful.
The Boardwalk and Beach offer a wide variety of activities, such as games, food, sports, and exercise. Many community programs are hosted on the beach during the summer, including the Coney Island Flicks on the Beach, the Sand Sculpting Contest, and Friday Night Fireworks.
The Pat Auletta Steeplechase Pier offers a unique perspective that allows visitors to walk out onto the ocean and enjoy views of Coney Island from the water. Local residents regularly fish off the pier.
Plazas create gathering spaces for people to use in a variety of ways. An analysis of public spaces in the Coney Island commercial district found that many plazas were used mostly by employees of nearby businesses during their break and mealtimes. Most plazas lack shade or protection from the elements.
Parks in the district offer a quiet sitting area for adults and senior citizens, or a play area for local children. Seaside Park is a recently renovated space adjacent to the boardwalk, with new amenities including water fountains, restrooms, and recycling and trash receptacles.
Playgrounds in the commercial district are primarily used by local elementary schools, but on weekends local residents often host family outings, barbeques, and parties as well. Surf Playground, on the western side of Coney Island, serves neighborhood residents and children.
Public Spaces
Seaside Park
Santos Community Garden Pat Auletta Steeplechase Pier Stillwell Avenue Plaza
Surf Playground Coney Island Beach
15Coney Island
AV Z
BELT PKWY
SURF AV
AV W
NEPTUNE AV OCE
AN P
KWY
RIEGELMANN BOARDWALK
W 3
3 STW 3
7 ST
SHEL
L R
D
W 1
2 ST
STIL
LWEL
L AV
W 8
ST
W 1
7 ST
CROPSEY AV
MERMAID AV
SeaGate Coney
IslandBrighton
Beach
Gravesend
SheepsheadBay
0.3 0.60 Miles °
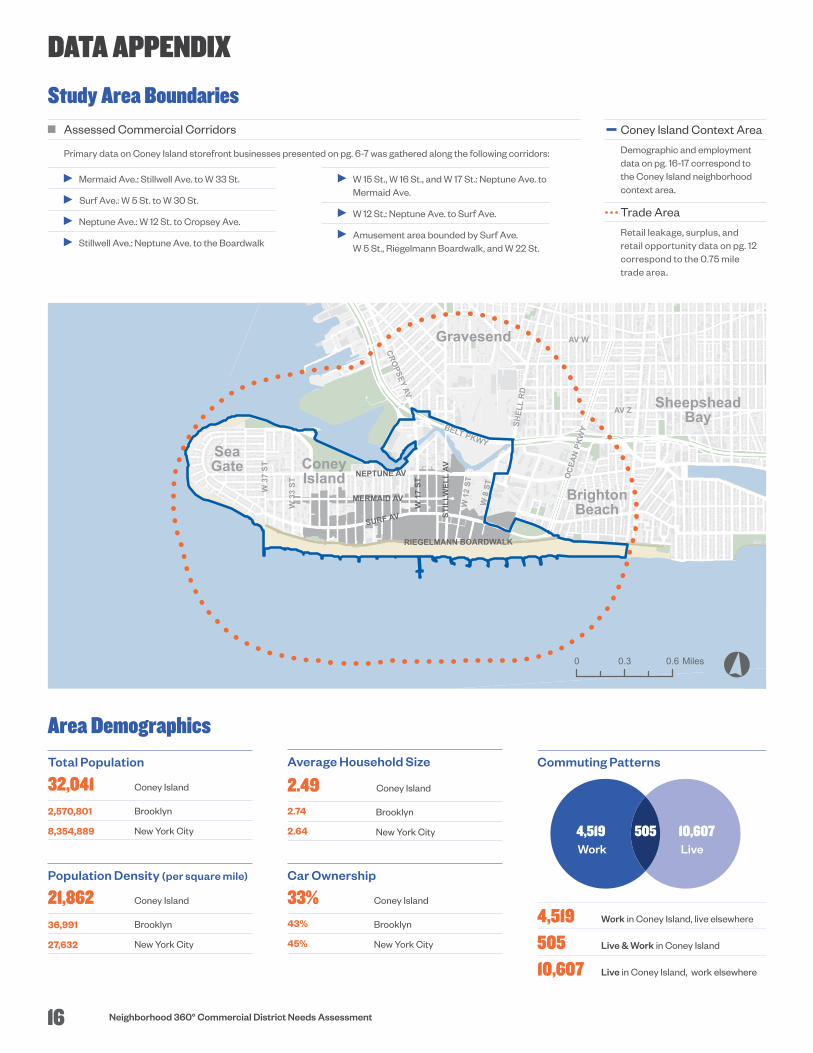
Study Area Boundaries
DATA APPENDIX
Coney Island Context Area
Demographic and employment data on pg. 16-17 correspond to the Coney Island neighborhood context area.
Trade Area
Retail leakage, surplus, and retail opportunity data on pg. 12 correspond to the 0.75 mile trade area.
Area Demographics
Population Density (per square mile)
21,862 Coney Island
Brooklyn
New York City
36,991
27,632
Total Population
32,041 Coney Island
Brooklyn
New York City
2,570,801
8,354,889
Average Household Size
2.49 Coney Island
Brooklyn
New York City
2.74
2.64
Car Ownership
33% Coney Island
Brooklyn
New York City
43%
45%
Commuting Patterns
4,519 Work in Coney Island, live elsewhere
505 Live & Work in Coney Island
10,607 Live in Coney Island, work elsewhere
4,519 10,607505Work Live
Assessed Commercial Corridors
Primary data on Coney Island storefront businesses presented on pg. 6-7 was gathered along the following corridors:
Mermaid Ave.: Stillwell Ave. to W 33 St.
Surf Ave.: W 5 St. to W 30 St.
Neptune Ave.: W 12 St. to Cropsey Ave.
Stillwell Ave.: Neptune Ave. to the Boardwalk
W 15 St., W 16 St., and W 17 St.: Neptune Ave. to Mermaid Ave.
W 12 St.: Neptune Ave. to Surf Ave.
Amusement area bounded by Surf Ave. W 5 St., Riegelmann Boardwalk, and W 22 St.
16 Neighborhood 360° Commercial District Needs Assessment
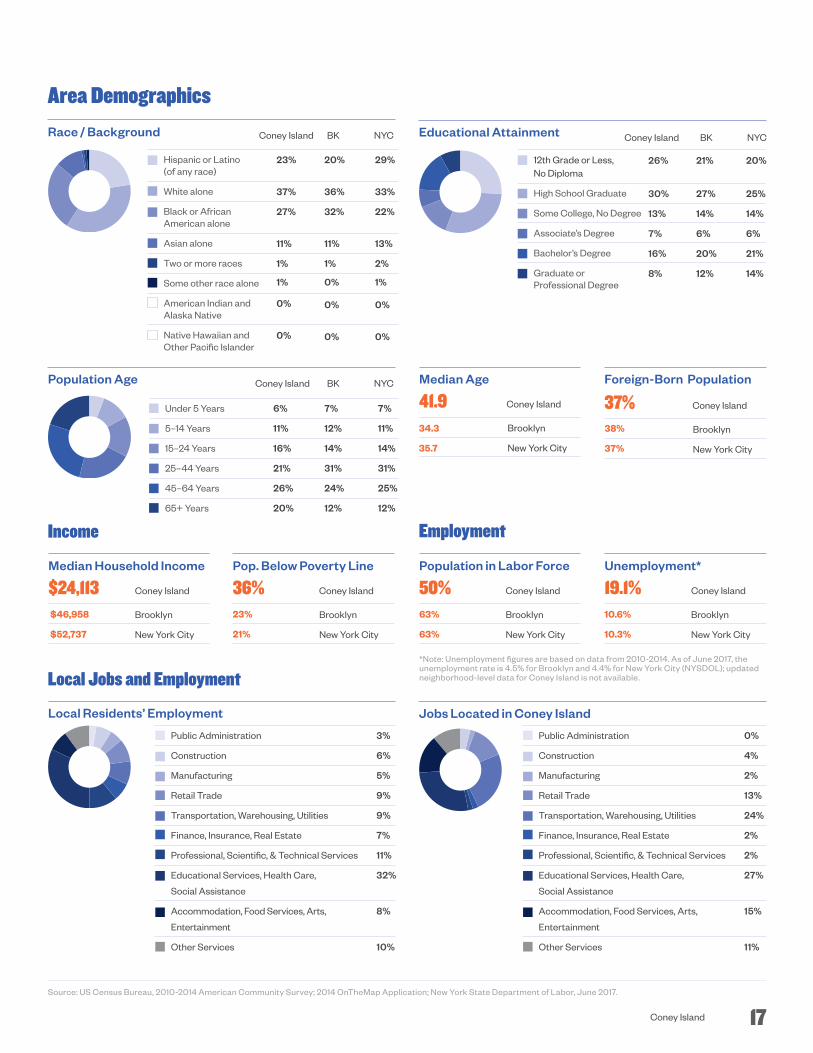
Local Residents’ Employment Jobs Located in Coney Island
Foreign-Born Population
37% Coney Island
Brooklyn
New York City
38%
37%
Median Age
41.9 Coney Island
Brooklyn
New York City
34.3
35.7
Race / Background Coney Island BK NYC
Under 5 Years
5–14 Years
15–24 Years
25–44 Years
45–64 Years
65+ Years
Population Age Coney Island BK NYC
6%
11%
16%
21%
26%
20%
7%
12%
14%
31%
24%
12%
7%
11%
14%
31%
25%
12%
Educational Attainment Coney Island BK NYC
Income
Median Household Income
$24,113 Coney Island
Brooklyn
New York City
$46,958
$52,737
Pop. Below Poverty Line
36% Coney Island
Brooklyn
New York City
23%
21%
Employment
Unemployment*
19.1% Coney Island
Brooklyn
New York City
10.6%
10.3%
Population in Labor Force
50% Coney Island
Brooklyn
New York City
63%
63%
Local Jobs and Employment
Source: US Census Bureau, 2010-2014 American Community Survey; 2014 OnTheMap Application; New York State Department of Labor, June 2017.
Area Demographics
*Note: Unemployment figures are based on data from 2010-2014. As of June 2017, the unemployment rate is 4.5% for Brooklyn and 4.4% for New York City (NYSDOL); updated neighborhood-level data for Coney Island is not available.
Hispanic or Latino (of any race)
White alone
Black or African American alone
Asian alone
Two or more races
Some other race alone
American Indian and Alaska Native
Native Hawaiian and Other Pacific Islander
23%
37%
27%
11%
1%
1%
0%
0%
20%
36%
32%
11%
1%
0%
0%
0%
29%
33%
22%
13%
2%
1%
0%
0%
12th Grade or Less, No Diploma
High School Graduate
Some College, No Degree
Associate’s Degree
Bachelor’s Degree
Graduate or Professional Degree
26%
30%
13%
7%
16%
8%
21%
27%
14%
6%
20%
12%
20%
25%
14%
6%
21%
14%
17Coney Island
Public Administration
Construction
Manufacturing
Retail Trade
Transportation, Warehousing, Utilities
Finance, Insurance, Real Estate
Professional, Scientific, & Technical Services
Educational Services, Health Care,
Social Assistance
Accommodation, Food Services, Arts,
Entertainment
Other Services
3%
6%
5%
9%
9%
7%
11%
32%
8%
10%
Public Administration
Construction
Manufacturing
Retail Trade
Transportation, Warehousing, Utilities
Finance, Insurance, Real Estate
Professional, Scientific, & Technical Services
Educational Services, Health Care,
Social Assistance
Accommodation, Food Services, Arts,
Entertainment
Other Services
0%
4%
2%
13%
24%
2%
2%
27%
15%
11%
SURF AV
NEPTUNE AV
W 3
3 ST
W 3
7 ST
W 5
ST
AV ZSHEL
L R
D
AV Y
W 2
3 ST
W 2
5 ST
W 2
8 ST
W 1
2 ST
W 3
5 ST
STIL
LWEL
L AV
W 8
ST
W 3
0 ST
28 AV
W 1
7 ST
BOWERY ST
CYPRESS AV HART PL
BAY 53 ST
SURF AV
BELT PKWY
AV Z
CROPSEY AV
MERMAID AV
KaiserPark
Calvert VauxPark
Asser Levy Park
Coney IslandCreek
RIEGELMANN BOARDWALK
36
74
X28 X
3836
36
68
68
4
8282
64
1
68648274
36 74
X28X38
D
F
Q
N
Coney Island Beach
°0 0.15 Miles0.3
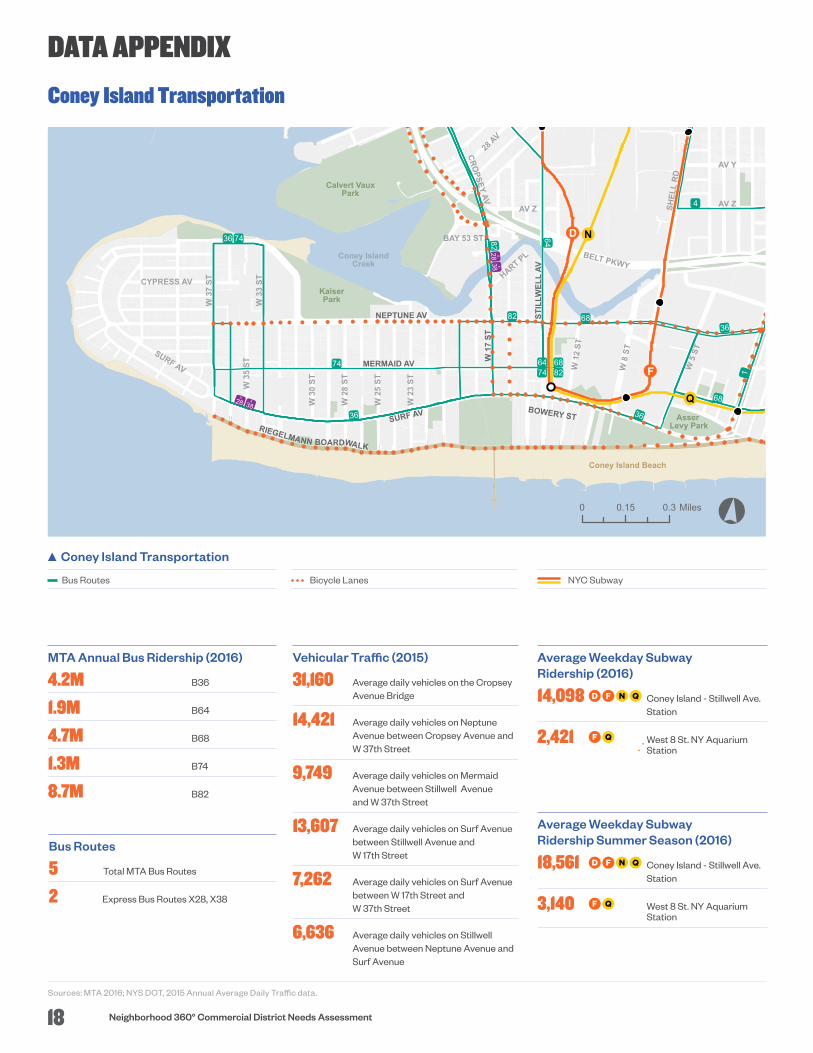
Coney Island Transportation
Coney Island Transportation
Bus Routes Bicycle Lanes NYC Subway
DATA APPENDIX
Sources: MTA 2016; NYS DOT, 2015 Annual Average Daily Traffic data.
Average Weekday Subway Ridership (2016)
14,098 Coney Island - Stillwell Ave. Station
2,421 West 8 St. NY Aquarium Station
MTA Annual Bus Ridership (2016)
4.2M B36
1.9M B64
4.7M B68
1.3M B74
8.7M B82
Bus Routes
5 Total MTA Bus Routes
2 Express Bus Routes X28, X38
D NF Q
F Q
Vehicular Traffic (2015)
31,160 Average daily vehicles on the Cropsey Avenue Bridge
14,421 Average daily vehicles on Neptune Avenue between Cropsey Avenue and W 37th Street
9,749 Average daily vehicles on Mermaid Avenue between Stillwell Avenue and W 37th Street
13,607 Average daily vehicles on Surf Avenue between Stillwell Avenue and W 17th Street
7,262 Average daily vehicles on Surf Avenue between W 17th Street and W 37th Street
6,636 Average daily vehicles on Stillwell Avenue between Neptune Avenue and Surf Avenue
Average Weekday Subway Ridership Summer Season (2016)
18,561 Coney Island - Stillwell Ave. Station
3,140 West 8 St. NY Aquarium Station
D NF Q
F Q
18 Neighborhood 360° Commercial District Needs Assessment
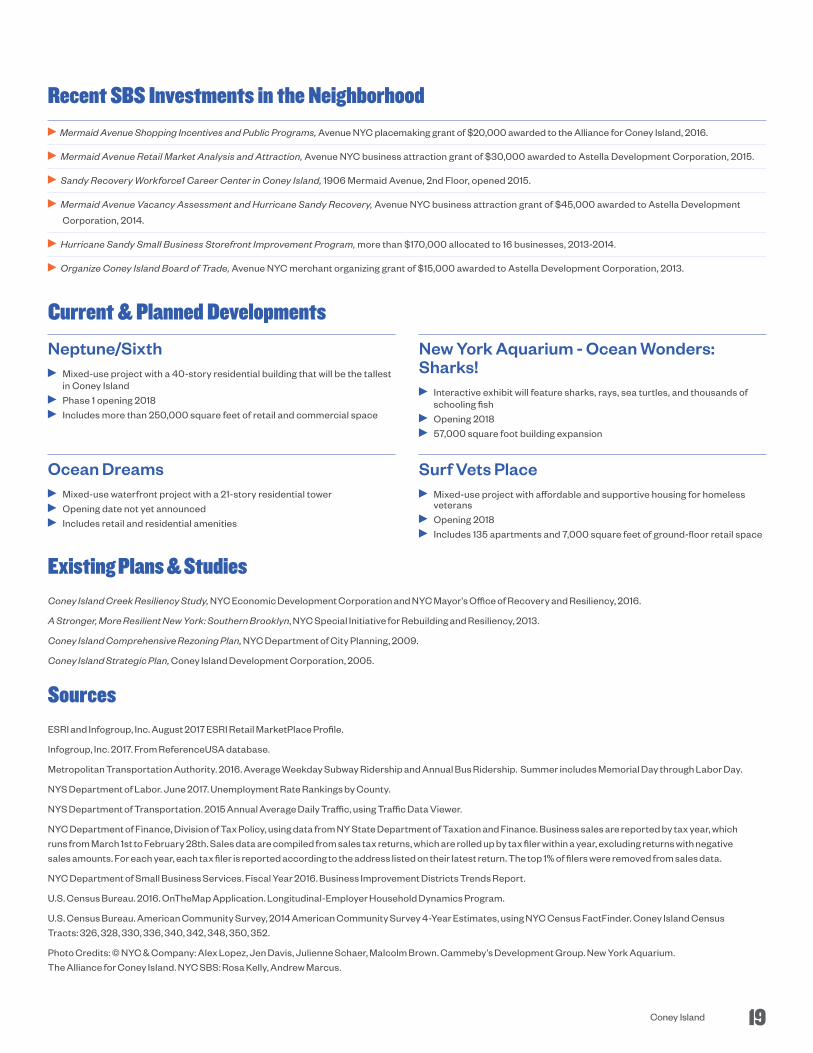
Mermaid Avenue Shopping Incentives and Public Programs, Avenue NYC placemaking grant of $20,000 awarded to the Alliance for Coney Island, 2016.
Mermaid Avenue Retail Market Analysis and Attraction, Avenue NYC business attraction grant of $30,000 awarded to Astella Development Corporation, 2015.
Sandy Recovery Workforce1 Career Center in Coney Island, 1906 Mermaid Avenue, 2nd Floor, opened 2015.
Mermaid Avenue Vacancy Assessment and Hurricane Sandy Recovery, Avenue NYC business attraction grant of $45,000 awarded to Astella Development
Corporation, 2014.
Hurricane Sandy Small Business Storefront Improvement Program, more than $170,000 allocated to 16 businesses, 2013-2014.
Organize Coney Island Board of Trade, Avenue NYC merchant organizing grant of $15,000 awarded to Astella Development Corporation, 2013.
Recent SBS Investments in the Neighborhood
SourcesESRI and Infogroup, Inc. August 2017 ESRI Retail MarketPlace Profile.
Infogroup, Inc. 2017. From ReferenceUSA database.
Metropolitan Transportation Authority. 2016. Average Weekday Subway Ridership and Annual Bus Ridership. Summer includes Memorial Day through Labor Day.
NYS Department of Labor. June 2017. Unemployment Rate Rankings by County.
NYS Department of Transportation. 2015 Annual Average Daily Traffic, using Traffic Data Viewer.
NYC Department of Finance, Division of Tax Policy, using data from NY State Department of Taxation and Finance. Business sales are reported by tax year, which runs from March 1st to February 28th. Sales data are compiled from sales tax returns, which are rolled up by tax filer within a year, excluding returns with negative sales amounts. For each year, each tax filer is reported according to the address listed on their latest return. The top 1% of filers were removed from sales data.
NYC Department of Small Business Services. Fiscal Year 2016. Business Improvement Districts Trends Report.
U.S. Census Bureau. 2016. OnTheMap Application. Longitudinal-Employer Household Dynamics Program.
U.S. Census Bureau. American Community Survey, 2014 American Community Survey 4-Year Estimates, using NYC Census FactFinder. Coney Island Census Tracts: 326, 328, 330, 336, 340, 342, 348, 350, 352.
Photo Credits: © NYC & Company: Alex Lopez, Jen Davis, Julienne Schaer, Malcolm Brown. Cammeby’s Development Group. New York Aquarium. The Alliance for Coney Island. NYC SBS: Rosa Kelly, Andrew Marcus.
Existing Plans & StudiesConey Island Creek Resiliency Study, NYC Economic Development Corporation and NYC Mayor’s Office of Recovery and Resiliency, 2016.
A Stronger, More Resilient New York: Southern Brooklyn, NYC Special Initiative for Rebuilding and Resiliency, 2013.
Coney Island Comprehensive Rezoning Plan, NYC Department of City Planning, 2009.
Coney Island Strategic Plan, Coney Island Development Corporation, 2005.
Neptune/Sixth Mixed-use project with a 40-story residential building that will be the tallest
in Coney Island Phase 1 opening 2018 Includes more than 250,000 square feet of retail and commercial space
New York Aquarium - Ocean Wonders: Sharks!
Interactive exhibit will feature sharks, rays, sea turtles, and thousands of schooling fish
Opening 2018 57,000 square foot building expansion
Ocean Dreams Mixed-use waterfront project with a 21-story residential tower Opening date not yet announced Includes retail and residential amenities
Surf Vets Place Mixed-use project with affordable and supportive housing for homeless
veterans Opening 2018 Includes 135 apartments and 7,000 square feet of ground-floor retail space
Current & Planned Developments
19Coney Island

We would like to recognize and thank the following individuals and organizations for their contributions to the development of the Coney Island Commercial District Needs Assessment:
Brooklyn Borough President Eric AdamsNYC Council Member Mark TreygerBrooklyn Community Board 13Alliance for Coney IslandConey Island MerchantsConey Island Shoppers and Residents
The NYC Department of Small Business Services helps unlock economic potential and create economic security for all New Yorkers by connecting New Yorkers to good jobs, creating stronger businesses, and building a fairer economy in neighborhoods across the five boroughs.
ACKNOWLEDGMENTS
ABOUT SBS
nyc.gov/neighborhood360